Embed Size (px)
Citation preview
1
Financial Analysts’ Briefing 18th April 2014
First Quarter Results 2014
Nestlé Malaysia Bhd

2
Agenda
Introduction & overview
Financials
Questions & answers

3
This presentation contains forward looking statements
which reflect Management’s current views and
estimates. The forward looking statements involve
certain risks and uncertainties that could cause actual
results to differ materially from those contained in the
forward looking statements. Potential risks and
uncertainties include such factors as general
economic conditions, foreign exchange fluctuations,
competitive product and pricing pressures and
regulatory developments.
Disclaimer
4
FINANCIALS
5
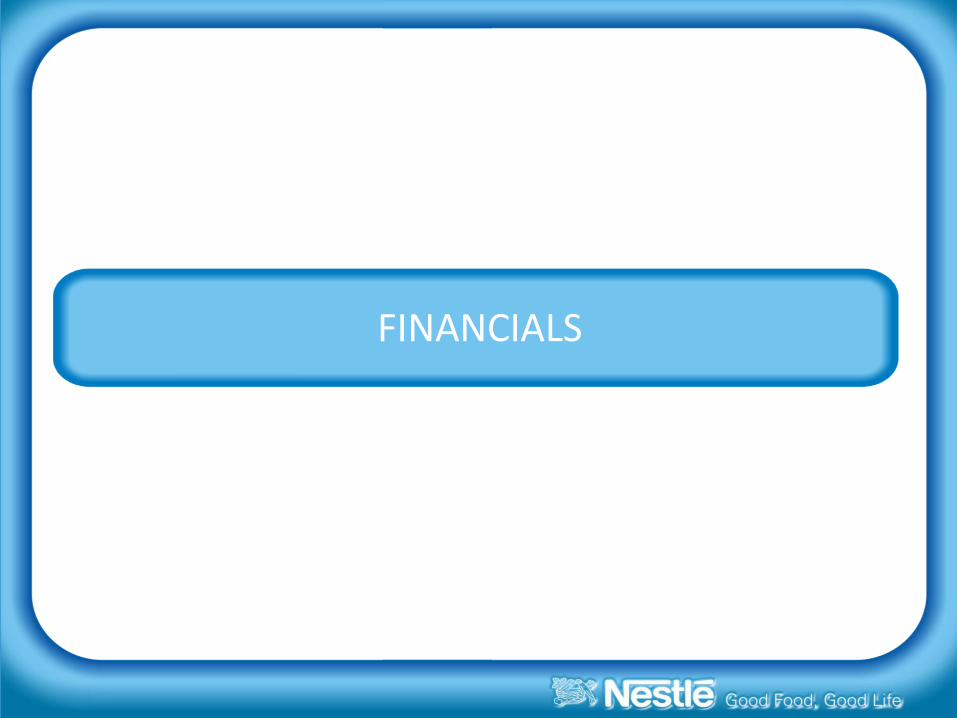
Financial
Operational
Strategic
Focus on 7 value drivers
VALUE DRIVERS
1. SALES GROWTH
2. PROFIT MARGIN
3. WORKING CAPITAL INTENSITY
4. FIXED CAPITAL INTENSITY
5. INCOME TAX RATE
6. COST OF CAPITAL
7. VALUE GROWTH DURATION

6
SALES GROWTH

7
0.92 1.01
0.31 0.26
0
2
Q1 2013 Q1 2014
Export sales
Domestic sales
Domestic Sales +9.2%
Export Sales -12.8% +3.7%
RM1.23 Bio RM1.27 Bio
Sales Evolution Q1 2014 vs Q1 2013
8
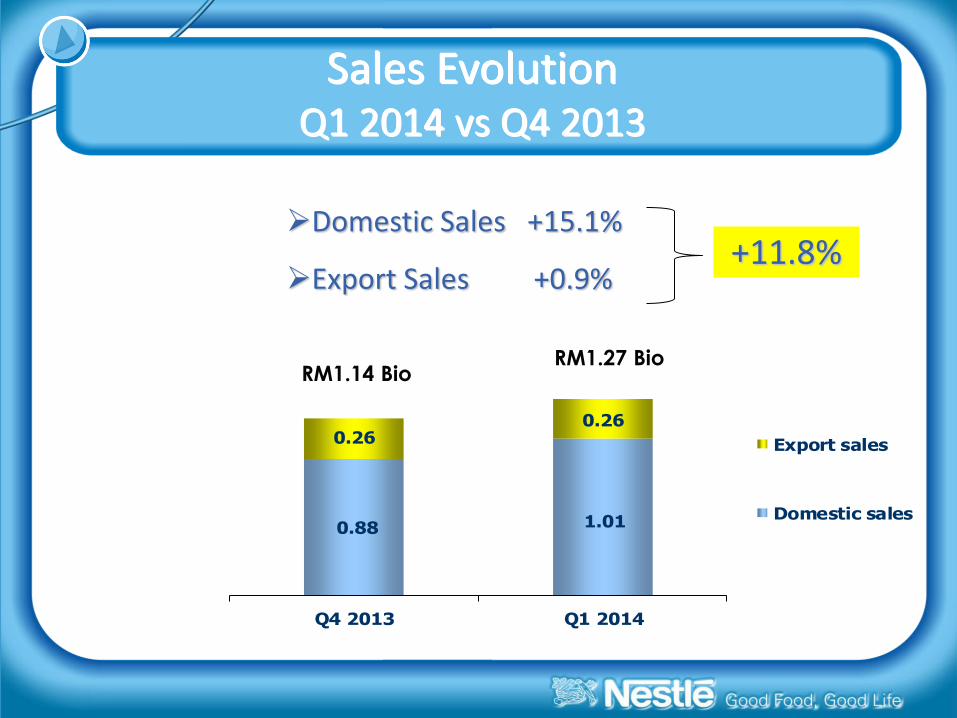
0.88 1.01
0.260.26
0
2
Q4 2013 Q1 2014
Export sales
Domestic sales
Domestic Sales +15.1%
Export Sales +0.9% +11.8%
RM1.14 Bio RM1.27 Bio
Sales Evolution Q1 2014 vs Q4 2013

9
0.92 1.01
0.31 0.26
20%
40%
60%
80%
100%
Q1 2013 Q1 2014
Exp Dom
24.9%
75.1%
20.9%
79.1%
RM1.23 Bio RM1.27 Bio
Channel Sales
10
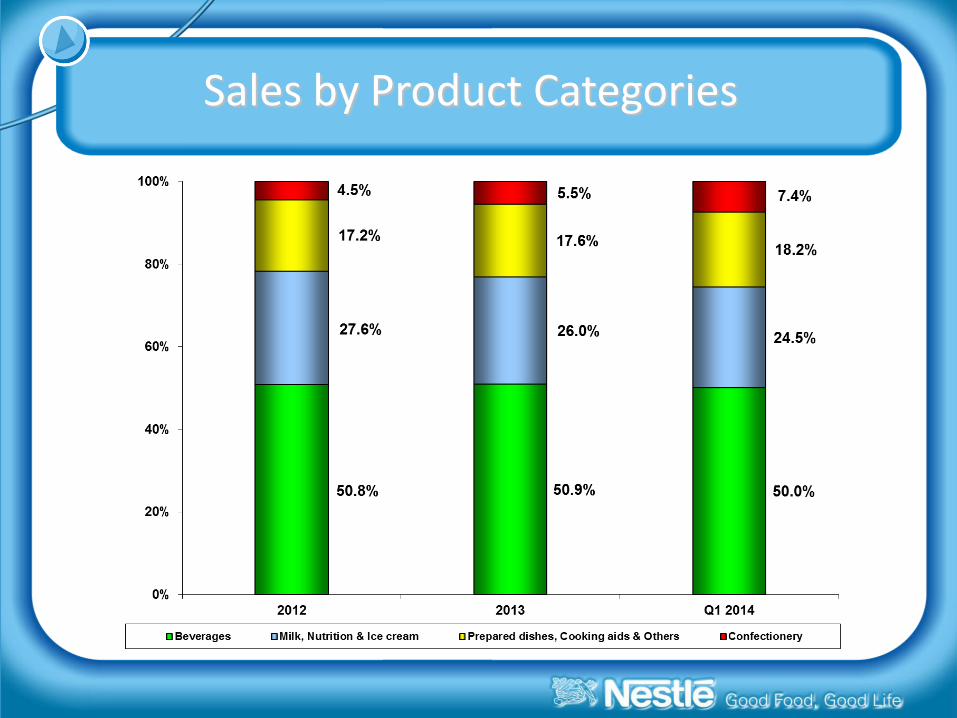
Sales by Product Categories

11
List of New Products
Q1'14
Products
Ice Cream Goreng Chocolate Jan'14
Ice Cream Goreng Vanilla Jan'14
MAT KOOL Popz Jan'14
Nestle Dolce Gusto Espresso Intenso Jan'14
Nestle Dolce Gusto Milo Mar'14

12
EBITDA MARGIN

13
22.3% 21.3%
20.1% 19.1%
0.0%
3.0%
6.0%
9.0%
12.0%
15.0%
18.0%
21.0%
24.0%
27.0%
0
50
100
150
200
250
300
350
400
450
500
Q1 2013 Q1 2014
EBITDA EBITDA as % of Sales EBIT as % of Sales
Evolution of EBITDA
RM274 Mio RM271 Mio

14
52%
12%
36%
RM
PM
S&IM
Breakdown of Material & Services Consumed
Jan ‘14 – Mar‘14
Total = RM 0.69 Bio.

15
COMMODITY UPDATES

16
Cocoa Bean
17
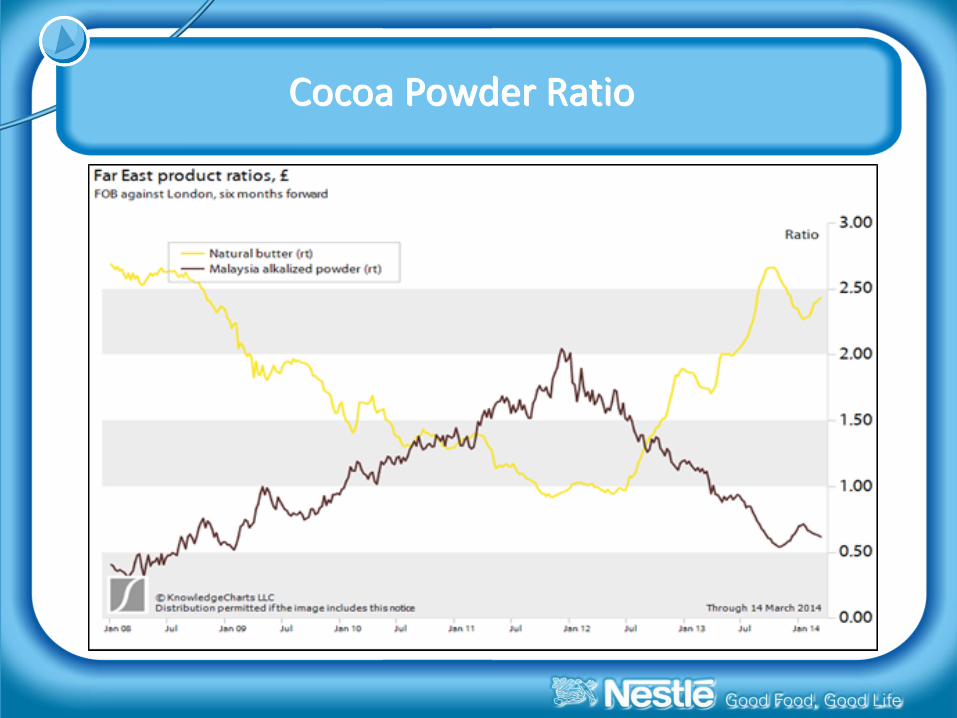
Cocoa Powder Ratio

18
Coffee bean

19
Milk Solids

20
Crude Palm Oil
BMD CPO Price
21
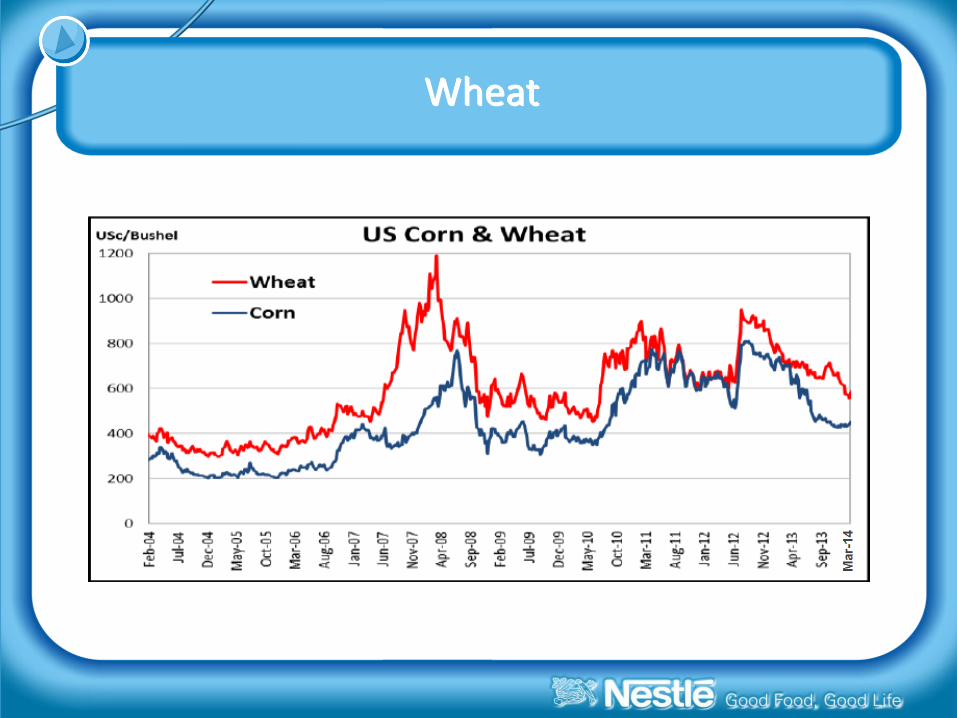
Wheat
22
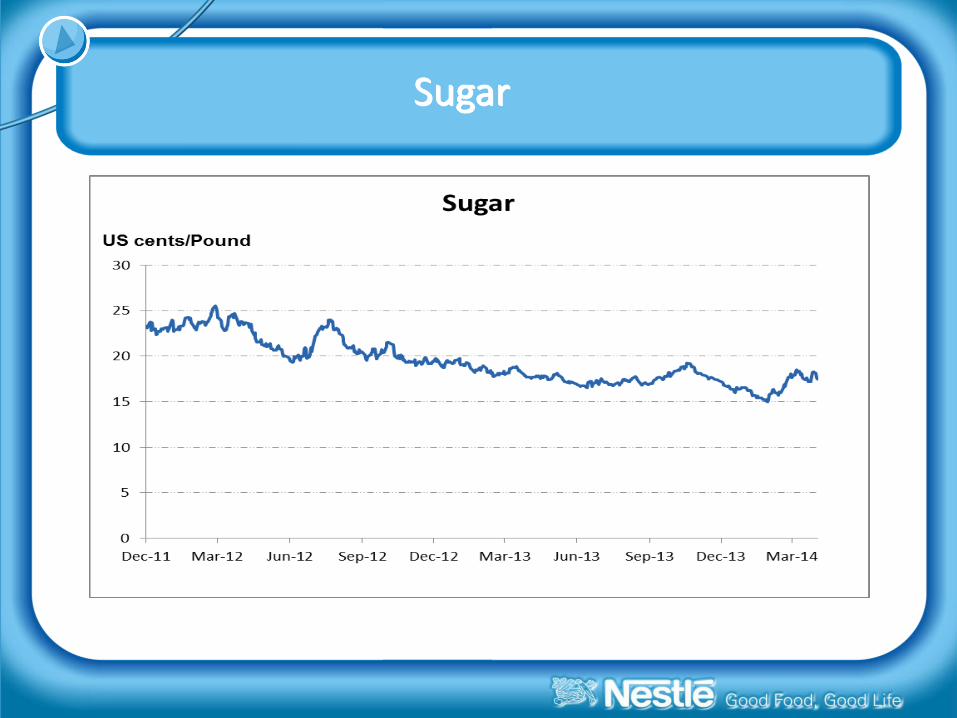
Sugar

23
Crude Oil

24
NET PROFIT MARGIN

25
Net Profit Evolution
15.0% 14.4%
0%
2%
4%
6%
8%
10%
12%
14%
16%
0
50
100
150
200
250
300
Q1 2013 Q1 2014
% of Sales
RM184 Mio RM184 Mio

26
NESTLÉ MALAYSIA BERHAD
KEY FIGURES
Amounts in RM mio Q1 2014 Q1 2013 % Change
Sales 1,273 1,227 3.7
Domestic 1,006 922 9.2
Export 266 306 (12.8)
Operating Profit/(Loss) 243 247 (1.5)
% of Sales 19.1 20.1
Net Profit 184 184 (0.5)
% of Sales 14.4 15.0
Operating Expenses 230 201 14.7
Current Assets 1,112 1,028 8.2
Inventories 394 384 2.8
Inv (Days) 14 14
Trade Receivable 239 216 10.8
TR (Days) 15 13
Capital Expenditure 28 9 195.1
27
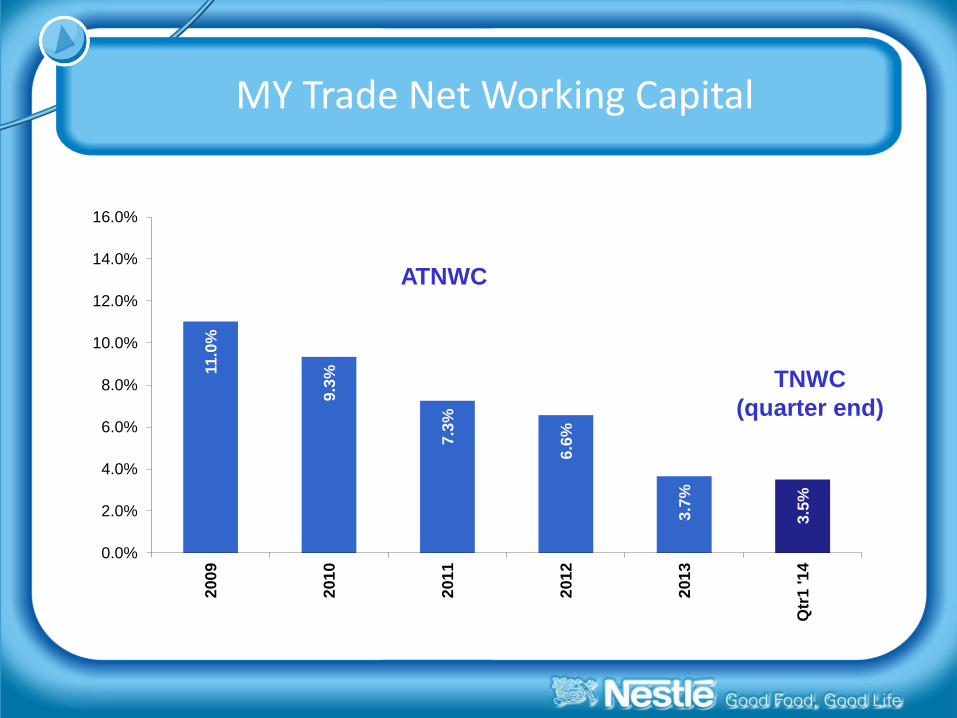
MY Trade Net Working Capital
11
.0%
9.3
%
7.3
%
6.6
%
3.7
%
3.5
%
0.0%
2.0%
4.0%
6.0%
8.0%
10.0%
12.0%
14.0%
16.0%2
00
9
201
0
201
1
201
2
201
3
Qtr
1 '1
4
ATNWC
TNWC
(quarter end)

28
Cash Flow Q1 2014
RM (Mio)
Q1 2014 Q1 2013
Profit Before Tax adjusted for
depreciation & interest
(Increase) / Decrease in working capital (104) (81)
Income tax & others (37) (35)
Net cash from operating activities
Capital Investments (28) (9)
Others 2 1
Cash Flow after Investing activities 104 150
271 274
130 158

29
Thank You


![Contest Rules and Regulations - Nestlé Malaysia · The PERADUAN BERTENAGA DENGAN MILO EKSKLUSIF DI KEDAI MESRA PETRONAS [“Contest”] is organised by Nestlé Products Sdn. Bhd](https://img.pdfslide.net/doc/110x75/5ebf67f5754b137d7b23e49e/contest-rules-and-regulations-nestl-malaysia-the-peraduan-bertenaga-dengan-milo.jpg)

![Pusat Penebusan Serta-Merta - Home | Nestlé Malaysia · Penganjur, Kelayakan & Tempoh: 1. PROGRAM PENEBUSAN BEG MILO BUDDY [“Program”] ini dianjurkan oleh Nestlé Products Sdn](https://img.pdfslide.net/doc/110x75/5c68838309d3f290788b99d8/pusat-penebusan-serta-merta-home-nestle-penganjur-kelayakan-tempoh.jpg)