Embed Size (px)
Citation preview
First StepUK Music Industry Greenhouse Gas Emissions for 2007“The UK music industry is a pivotal cultural andcreative industry, nationally and internationally; ittherefore has the power – and the responsibility –to be a proactive leader in taking and drivingclimate change action”
REPORT
Conducted by
Board: Jazz Summers (Chair), Ayesha Hazarika, Ben Challis, David Joseph, Diana Liverman, Emma Pike, Jeremy Lascelles, Jon Webster, Martin Talbot, Melvin Benn, Neil Johnston, Tony Wadsworth.
Working Group: Ben Lambert, Bryan Raven, Conor McNicholas, Dan Constanda, David Bryant, Kim Bayley, Kim Chappell, John Northcote, Justin Morris, Melvin Benn, Paul Latham, Richard Russell, Rob Hallett, Rod MacSween, Roly Oliver, Simon Robson, Steve Porter, Susanna Eastburn.
The Board of Julie’s Bicycle would like to thank the following:
Catherine Bottrill for her herculean determination to complete a thoroughly challenging piece ofresearch so well, Geoff Lye for continuing wisdom, expertise and generosity, and Diana Liverman forfaith and finality.
Also thanks to Max Boycoff (ECI), Will Moore (Sustainable Touring), Malcolm Carruthers, Andrew Haworth (Live Nation), Gavin Starks, Helen Heathfield and Julia Haltrecht (Julie’s Bicycle).
Key
1000 g = 1 kg
1,000 kg = 1 metric tonne
t = tonne
~ = approximately
GHG = greenhouse gas
CO2e = carbon dioxide equivalent
CO2 = carbon dioxide
CH4 = methane
N20 = nitrous oxide
authors: Catherine BottrillGeoff Lye Dr. Max Boykoff Professor Diana LivermanOxford University Environmental Change Institute
ISBN: 1 874370 45
REPORT
First Step UK Music Industry Greenhouse Gas Emissions for 2007
Table of Contents
Forewords – Jazz Summers and Diana Liverman. . . . 2
Executive Summary . . . . . . . . . . . . . . . . . . . . . . . . . 4
Section 1: Climate Change & Energy Use . . . . 9
1.1 Overview . . . . . . . . . . . . . . . . . . . . . . . . . . . . . . . . . . . . . . 9
1.2 GHG Emissions and Energy Use in the UK . . . . . . . . . . 12
Section 2: Context – The UK Music Industry . 17
2.1 Overview . . . . . . . . . . . . . . . . . . . . . . . . . . . . . . . . . . . . . 17
2.2 Industry Transformation . . . . . . . . . . . . . . . . . . . . . . . . . 17
2.3 Sector Trends and Issues . . . . . . . . . . . . . . . . . . . . . . . . 17
2.4 Summary . . . . . . . . . . . . . . . . . . . . . . . . . . . . . . . . . . . . . 20
Section 3: Research Approach and Methodology . . . . . . . . . . . . . . . . . . . . . . . . . . . . . . . 21
3.1 Overview . . . . . . . . . . . . . . . . . . . . . . . . . . . . . . . . . . . . . 21
3.2 GHG Protocol . . . . . . . . . . . . . . . . . . . . . . . . . . . . . . . . . 21
3.3 Setting the Study Boundaries . . . . . . . . . . . . . . . . . . . . . 22
3.4 Data Sources . . . . . . . . . . . . . . . . . . . . . . . . . . . . . . . . . . 25
3.5 Data Assumptions and Quality . . . . . . . . . . . . . . . . . . . . 26
3.6 Summary . . . . . . . . . . . . . . . . . . . . . . . . . . . . . . . . . . . . . 27
Section 4: Emissions from Music Recording and Publishing for the UK Market . . . . . . . . . . . 29
4.1 Overview . . . . . . . . . . . . . . . . . . . . . . . . . . . . . . . . . . . . . 29
4.2 CD Packaging . . . . . . . . . . . . . . . . . . . . . . . . . . . . . . . . . . 29
4.3 Studio Recording . . . . . . . . . . . . . . . . . . . . . . . . . . . . . . . 33
4.4 CD Manufacturing . . . . . . . . . . . . . . . . . . . . . . . . . . . . . . 33
4.5 CD Distribution. . . . . . . . . . . . . . . . . . . . . . . . . . . . . . . . 34
4.6 Music Retailers . . . . . . . . . . . . . . . . . . . . . . . . . . . . . . . . 34
4.7 Hidden GHG Emissions in the CD Supply Chain . . . . . 35
4.8 Digital Music Downloads. . . . . . . . . . . . . . . . . . . . . . . . . 36
4.9 Record Companies & Labels . . . . . . . . . . . . . . . . . . . . . . 37
4.10 Music Publishing . . . . . . . . . . . . . . . . . . . . . . . . . . . . . . . 39
4.11 Summary . . . . . . . . . . . . . . . . . . . . . . . . . . . . . . . . . . . . 39
T
Section 5: Emissions from Live Music Performance for the UK Market . . . . . . . . . . . . . 41
5.1 Overview . . . . . . . . . . . . . . . . . . . . . . . . . . . . . . . . . . . . . 41
5.2 Music Venues . . . . . . . . . . . . . . . . . . . . . . . . . . . . . . . . . . 43
5.3 Audience Travel. . . . . . . . . . . . . . . . . . . . . . . . . . . . . . . . 44
5.4 Tour Logistics . . . . . . . . . . . . . . . . . . . . . . . . . . . . . . . . . 46
5.5 Music Festivals . . . . . . . . . . . . . . . . . . . . . . . . . . . . . . . . . 48
5.6 Management of Live Music Performance . . . . . . . . . . . . 52
5.7 Summary . . . . . . . . . . . . . . . . . . . . . . . . . . . . . . . . . . . . . 53
Section 6: Emissions from International Touring and Industry Air Travel . . . . . . . . . . . . . 55
6.1 Overview . . . . . . . . . . . . . . . . . . . . . . . . . . . . . . . . . . . . . 55
6.2 International Touring by UK Artists . . . . . . . . . . . . . . . . 55
6.3 Air Travel of Record Companies & Labels. . . . . . . . . . . 58
6.4 Air Travel of Management, Agency and Promotion Companies . . . . . . . . . . . . . . . . . . . . . . . . . . . . . . 58
6.5 Summary . . . . . . . . . . . . . . . . . . . . . . . . . . . . . . . . . . . . . 59
Section 7: Issues, Observations &Recommendations . . . . . . . . . . . . . . . . . . . . . . . . . 61
7.1 GHG Emissions of the UK Music Industry . . . . . . . . . . . 61
7.2 GHG Emissions of the UK Music Industry in Context . 62
7.3 Key Issues and Constraints . . . . . . . . . . . . . . . . . . . . . . . 62
7.4 Concluding Observations . . . . . . . . . . . . . . . . . . . . . . . . 64
7.5 Recommendations . . . . . . . . . . . . . . . . . . . . . . . . . . . . . . 64
7.6 Taking the Research Forward . . . . . . . . . . . . . . . . . . . . . 65
Section 8: References . . . . . . . . . . . . . . . . . . . . . . 67
Contributors . . . . . . . . . . . . . . . . . . . . . . . . . . . . . . . 70
Acknowledgements. . . . . . . . . . . . . . . . . . . . . . . . . 71
Appendix . . . . . . . . . . . . . . . . . . . . . . . . . . . . . . . . . . 72
GHG Emissions Conversion Factors . . . . . . . . . . . . . . . . . . . 72
List of Figures, Tables and Information Boxes . . . . . . . . . . . . 721
Since Al Gore’s masterpiece of docudrama, An Inconvenient Truth, people have woken up to the implications of climate change.Al Gore did a superb job explaining the science in a way that is entertainingly terrible. Shortly afterwards, Alison Tickell came tome with an ambitious vision to get the music industry moving on climate change, and the rush of energy and urgency that I felthad a focus: we pulled together a board of like-minded people from across the industry and established Julie’s Bicycle.
This report is the first step in the journey that Julie’s Bicycle has embarked on: to find a path for the music industry to reduce itsown carbon emissions and thus make a contribution to solving what is the most serious issue of the time.
The research has given us an insight into the constraints and the opportunities that are inherent in tackling climate change. We have encountered the difficulties presented in finding rigorous and useful information on energy use in all the activities of ourhighly complex industry. As you will see in this report many of these issues are contrary and uncertain. But nevertheless thesubject requires us to act in good faith and optimism.
The music industry is often viewed from the outside as disjointed and fiercely competitive, but on this issue we have cometogether. Julie’s Bicycle has discovered that consensual and cooperative leadership within the industry is alive and well. JB (asJulie’s Bicycle is often known) has brought together, in our Board and our Working Group, a motivated and authoritative groupof almost 30 senior leaders from across the industry who are committed to finding solutions – even when it means puttingcompetitive edge to one side.
On the basis of this report we are developing practical and effective carbon reduction programmes.
Commitment from the music industry is high and together we are:
• reaching agreements on emission reduction targets, working with artists, managers, agents, promoters, record companies,publishers, collection societies, trade bodies, manufacturers, not-for-profits and community organisations and educators – infact the whole supply chain from the creative idea to the final product;
• providing the music industry with evidence-based knowledge of, and solutions to, energy reduction and climate change;
• providing environmental audits;
• developing a grants scheme.
We are learning all the time. We don’t claim to have all the answers but we do want to make a difference, and be part of anindustry that is prepared to change itself and leave a legacy of positive action for future generations as music has, so often,prompted in the past.
Jazz SummersChair, Julie’s Bicycle
Board: Jazz Summers (Chair), Ayesha Hazarika, Ben Challis, David Joseph, Diana Liverman, Emma Pike, Jeremy Lascelles, Jon Webster, Martin Talbot, Melvin Benn, Neil Johnston, Tony Wadsworth.
ForewordJazz Summers
2
The scientific community has identified an urgent need to reduce greenhouse gas concentrations in the atmosphere if we are toreduce the risks of dangerous climate change. The UK has taken a lead in both public and private sector commitments toreducing greenhouse gas emissions and it is clear that this will require innovation based on careful analysis across all sectors ofthe economy. Oxford’s Environmental Change Institute has made the study of climate change, climate policy and lower carbonenergy futures a major focus of our current research. We think it is important that the scientific community partners with keystakeholders, such as we have established with the music industry, to undertake research and help shape responses to climatechange.
From our perspective, the UK music industry excels in inspiration, creativity and communication. It has been a pleasure tocollaborate with them to exchange our technical expertise for their insights and environmental commitment within such aculturally influential industrial sector.
The opportunity to partner with the music industry on this report ‘ First Step’ gave ECI an unprecedented opportunity tounderstand an influential sector of the UK economy with a global reach, high profile, and a commitment to analyzing andreducing its carbon emissions. Julie’s Bicycle, led by Jazz Summers and Alison Tickell, took the initiative to commission and raisefunds for the study. They worked closely with us, along with the Board of Julie’s Bicycle, to frame the research questions, provideaccess to data and informants, and to ensure that we communicated our results in ways that are useful to the music industrywhile maintaining high scientific standards.
It is important to emphasise that this study is the first analysis of the carbon emissions of the UK music industry; much of thedata needed for a detailed analysis across the value chain had not been collected and aggregated before. We need to be awarethat the results are indicative and will inevitably require revision over time. We welcome any comments as to how we couldimprove the technical analysis and expand our database and boundaries for the study.
One of the most rewarding aspects was the enthusiasm shown by music industry representatives and their willingness to act onsome of the recommendations to reduce their energy use even in advance of publication. For example, the Julie’s BicycleWorking Group has created a space for cross-industry joint action on climate change. This study has created a strongpartnership between researchers and the music industry that opens up avenues for future collaboration on climate change.Oxford’s Environmental Change Institute is part of several national initiatives that are potential partners for the industry,including the UK Climate Impacts Programme, the UK Energy Research Centre, the Tyndall Centre for Climate Change, theJames Martin 21st Century School and the Smith School for Enterprise and Environment.
The authors are grateful to those who provided data to the study and to those from the Tyndall Centre and the EnvironmentalChange Institute who were willing to undertake peer review of the report. I want to personally acknowledge the outstandingwork of Catherine Bottrill who took on the role of lead researcher for ECI, going far beyond the call of duty (and the hours wehad originally planned for the study). Geoff Lye’s experience in understanding the business case for sustainability was invaluable,and Max Boykoff helped to frame and edit the report with great insight. I am also grateful to the Julie’s Bicycle energy team inworking with us to collect data and engage with music companies on this foundational study.
We hope that our academic colleagues will find this as fascinating a case study of carbon emissions in an industrial sector as wehave, and that it will contribute to the wider understanding of patterns of emissions and paths to lower carbon futures in the UKand elsewhere.
Professor Diana Liverman, Director, Environmental Change Institute, Oxford University
ForewordProfessor Diana Liverman
3
1. Background and Introduction
1.1 Climate change is the defining environmental issuefor the 21st Century. It will require a radicaltransformation of society’s relationship to energy use andresource consumption. The best estimates of actionneeded to prevent catastrophic climate change requirethat CO2 emissions – the principle greenhouse gas(GHG) – must be reduced by 60–80%1 by 2050; theseemissions are mainly generated by the combustion offossil fuels.
1.2 The United Kingdom has committed in its ClimateChange Bill to reduce greenhouse gas emissions by atleast 60% from 1990 levels by 20502. Transforming to alow carbon emissions society will involve:
• Energy conservation and efficiency;
• Switching to renewable and alternative energy sources;
• Embracing innovative, low carbon technologies;
• Regulatory and market instruments to promote behaviour change.
1.3 Emerging international, national and regionallegislation is clearly signalling a global policy commitmentto shift energy use so that citizens from all countriesunderstand the environmental and social costs of GHGemissions. This in itself, however, is unlikely to be radicalor fast enough to deliver the scale of emissionsreductions needed. Progressive companies are alreadyacknowledging this by taking climate mitigation actionsunilaterally and voluntarily.
1.4 The UK music industry is a pivotal cultural andcreative industry, nationally and internationally; ittherefore has the power – and the responsibility – to bea proactive leader in taking and driving climate changeaction. If the industry commits to becoming a climateleader, it needs to ensure, as a first step, that its owncommitments are aligned with emissions reductiontargets. Julie’s Bicycle is developing as an industrycollaboration which aims to catalyse a sector-widestrategic response, starting with an understanding – andprogressive management of – its own carbon footprint.
Executive Summary
1 As recommended by the Intergovernmental Panel on Climate Change and Stern reviews(IPPC 2007a; Stern 2006).2 The UK Government on 18th February 2008 announced a statutory review of the 2050CO2 emission reduction target to strengthen the Bill to set an 80% emissions reductiontarget (Defra 2008).
First Step UK Music Industry Greenhouse Gas Emissions for 2007
4
2. Research Aims and Methodology
2.1 In July 2007, Julie’s Bicycle commissioned a scopingstudy by Oxford University’s Environmental Change Institute to:
• Develop indicative estimates of the annual GHGemissions of the UK industry across its core sectors and activities;
• Identify the key blockages and opportunities forreducing GHG emissions;
• Make initial recommendations for specific actions andpriorities for the medium term.
2.2 The study’s primary focus was on the GHGemissions produced from the demand for music productsand live performances by UK consumers, including artistmanagement, agency & promotion; live performance;recording; publishing; distribution; retail; and collectionsocieties (including trade bodies). The UK music industryis, however, a global industry with over £6 billion in consumer spending per annum3. An initialimpression of the scale of emissions from internationaltouring was therefore included within the brief.
2.3 Activities linked to the music industry, but beyondthe scope of this first phase of research were: musiclistening devices; merchandising; music instruments andequipment; music education; and music media.
2.4 The boundary set for this first research phase was toestimate GHG emissions resulting from building energyuse, CD manufacturing and transportation. The study:
• Collected and analysed data from over 100 industrysources;
• included 100 case studies of energy use by businessactivities across the recording and live musicperformance supply chain;
• gathered data from a cross-section of large and smallbusinesses across the industry in order to develop arepresentative picture of the industry in its currentform;
• interviewed over thirty chief executives and keyinformants to gather qualitative data on what musiccompanies are currently doing to address climatechange and what they perceive as possible in the shortto medium-term.
3. Key Findings
3.1 The industry is categorised as a service sector withsome manufacturing and is not therefore characterised asenergy or carbon intensive. The main GHG emissionssources of the industry are from using fossil-based energyand materials for the heating, lighting and powering ofbuildings (offices and music venues); for the manufactureof CDs; for trucking music products and touringequipment; for international air travel of artists and staff;and for audience travel to live performances.
3.2 The study finds that the sale of music products andlive music performances to UK consumers is currentlycreating at least approximately 540,000 t CO2 equivalent4
a year. To put this in perspective, annual emissions at thislevel are roughly equal to the average annual emissions ofa town of 54,000 inhabitants or the annual emissionsfrom 180,000 cars5.
3.3 For the UK music industry to reduce emissions fromthe consumption of music products and services to UKconsumers by at least 60% means annual emissionsshould be no higher than ~200,000 t CO2e. An 80%reduction would require emissions to be cut to just~100,000 t CO2e per year.
3.4 The breakdown between the key emission sourcesby activity are approximately as shown below:
UK MUSIC MARKET GHG EMISSIONS IN BRIEF – 2007:
- Recorded Music – 134 million albums were sold in theUK, approximately 90% of which were sold in the CDformat. The average GHG emissions per CD album fromrecording through to retail are approximately 1 Kg CO2e
- Live Performance – In the order of 75 million ticketsare sold annually, 90% are venue-based and 8% are musicfestivals. There are ~2,200 venues in the UK regularlyplaying live music and almost 500 festivals annually. Amusic venue with a capacity of 2,000 people is likely toproduce over 400 t CO2e per year. A large music festival(more than 40,000 people) including audience transportwill produce in the order of 2,000 t CO2e.
- Live music performance sectors together with audiencetravel account for three-quarters (~75%) of the UKmusic industry’s GHG emissions. Recorded music sectorsaccount for a quarter (~25%) of GHG emissions.
3 Creative & Cultural Skills and DCMS
4 CO2 equivalence measures all GHGs and converts them to their equivalent global warming potential
5 The UK annual average per capita emissions are ~10t CO2 (CDIAC, 2007). The UK annual average mileage of
all cars is 8,770, which result is 3t CO2 per car if assuming it is an average petrol car (DfT. 2007). 5
INTERNATIONAL TRAVEL AND TOURING GHGEMISSIONS:
- There is limited data available on international touring. An initial estimate for USA and European Rock and Poptouring by UK artists, inclusive of audience travel, putsthese emissions at, at least 400,000 t CO2e per annum.
- Air travel is conservatively estimated to be at least16,000 t CO2e per annum generated from the travel ofindustry employees.
3.5 The most significant components of the industry’scarbon footprint – which should be priority areas for theindustry to address – are:
• CD packaging
• Venue energy use
• Audience travel (This is an indirect emission sourceand part of the value chain so not the exclusiveresponsibility of the music industry)
4. Key Issues and Constraints
4.1 The indicative estimates of GHG emissions comewith a health warning.
The estimates are based on the data currently availablefrom music companies. Many companies were willing toinput information to this study, but in many cases theydid not have sufficiently accurate energy data available toquantify GHG emissions6. The music industry is at thebeginning of the learning process in energy and carbonmanagement. Indeed, most companies are not yetsystematically collecting and analysing the informationneeded to accurately quantify and monitor – let alonemanage – the GHG emissions produced from theirbusiness activities.
4.2 The fragmented nature of the industry presentsproblems in data collection and coordination of anindustry wide response.
At one end of the business spectrum the industry ishighly consolidated (recording, publishing, promotion andagency). As a consequence across the recording and liveperformance sectors the majority of products andservices are sub-contracted, such as CD manufacturingand trucking logistics. At the other end the industry ischaracterised by thousands of small-to-mediumenterprises (SMEs) and sole traders. Individually, thesecompanies have small emissions profiles, but collectivelytheir emissions become significant. This sets particularchallenges for industry prioritisation and collaboration onclimate but initial industry soundings elicited enormousenthusiasm for coordinated action. A collaborative and shared knowledge base response willreduce the risk of any one company or sector, andensure a more effective and rigorous action plan. Theindustry needs to work together in its response toclimate change to have the greatest concentrated impactand ensure the mainstreaming of positive efforts.
4.3 The emissions boundaries set for this study do
not include the industry’s full global impacts.
The industry is global in its business activities and so areits emissions. For example, the majority of CD andmusical instrument manufacturing is done in continentalEurope and Asia respectively and international touring isprecisely that – international. This research set theboundaries by including emissions which result fromdecisions made in the UK. It will be important over time to understand the fullglobal emissions which result from the UK musicindustry’s activities.
6 It should be noted that this study does not represent a formal audit of the industry’s carbon footprint.
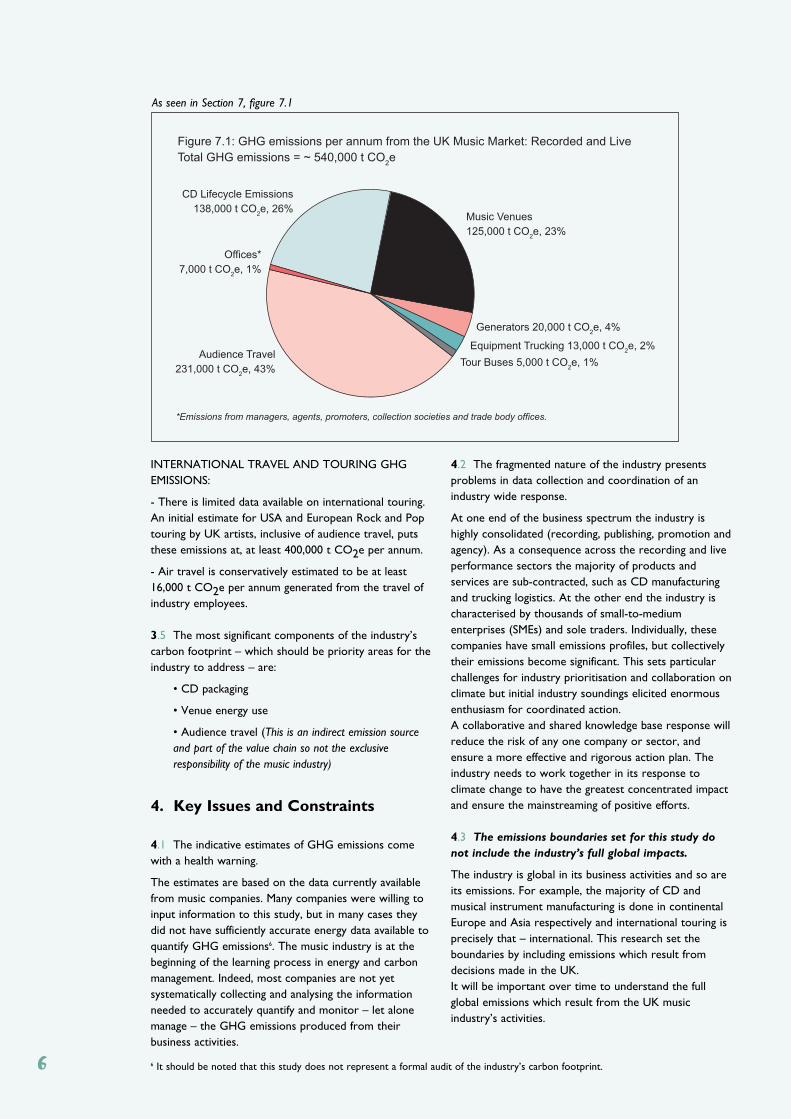
Figure 7.1: GHG emissions per annum from the UK Music Market: Recorded and Live
Total GHG emissions = ~ 540,000 t CO2e
CD Lifecycle Emissions
138,000 t CO2e, 26%
Music Venues
125,000 t CO2e, 23%
Generators 20,000 t CO2e, 4%
Equipment Trucking 13,000 t CO2e, 2%
Tour Buses 5,000 t CO2e, 1%
Audience Travel
231,000 t CO2e, 43%
Offices*
7,000 t CO2e, 1%
*Emissions from managers, agents, promoters, collection societies and trade body offices.
6
As seen in Section 7, figure 7.1
4.4 The shift to digital will significantly alter the
industry’s lifecycle GHG emissions profile over the
coming years.
These changes will result in the greater proportion ofGHG emissions coming from indirect sources; forexample, the energy used by servers hosting digital music;the embodied carbon in the materials of music listeningdevices; and audience travel to and from live musicperformances. An industry-wide climate positive strategyneeds to recognise and anticipate the changing shape ofits emission profile. The industry will need to work withother industries (e.g. manufacturers of music listeningdevices) and consumers to ensure its products andservices are measured, and result in minimal GHGemissions. Work needs to be done that takes intoaccount consumers’ patterns, notably in musicdownloading and music on demand.
4.5 The music industry is exposed to a high level of
media scrutiny, which can discourage public
statements on climate change action.
The issue of climate change is complex and scientific andtechnological responses are constantly evolving. Theindustry needs reliable, up-to-the-minute andauthoritative advice on measures to tackle change so itdoes not fall behind latest best practice and risk beingpilloried for choices which are seen in hindsight to havebeen flawed.
4.6 There are already a number of exemplary and
innovative practices taking place within the industry,
but these are generally small in scale and at the
single company level.
These include: auditing energy use and carbon emissions;carbon disclosure; purchasing renewable electricity;photovoltaic powered recording studios; biodegradablepackaging; green festival awards scheme; combined coachand festival tickets; biodiesel power generators; LEDvenue and stage lighting; staff green teams; hybrid/lowemission car and taxi use; rationalised travel (includingflights) and energy efficient venues and office buildings.
5. Concluding Observations
5.1 The UK music industry is not carbon intensivebut still will find reducing GHG emissions by 60-80% a challenge. It is currently not well prepared todeliver this level of climate responsibility. There is agrowing understanding in the industry that it faces bothcommercial and moral imperatives to act on climatechange.
5.2 The business case for action is rooted in theinevitability of costs which will attach to GHGemissions as carbon regulation, taxes and tradingprogressively penalise carbon emissions; equally there willbe positive savings and intangible benefits to businesseswhich reduce their carbon footprint. Furthermore,climate responsible companies find competitive advantagewith their stakeholders (especially consumers andincreasingly their own staff).
5.3 The moral case reflects the power thisparticular industry has to influence society moregenerally through its cultural leadership and rolemodelling. With this power comes the opportunity – andarguably the responsibility – to set an example bymitigating its own emissions and encouraging climateresponsibility among its global audiences.
5.4 The industry is made up of many smallcompanies and sectors. The sum total creates alatent mass of interconnected power. There areseveral factors which inhibit the exercising of that powerto tackle climate change, the most significant being thatno single company or sector can afford to over exposeitself to financial or branding risks. If the industry actstogether within and across sectors the risk will beminimised and the effect will be greater. In additionstrong industry support needs to be given to industrychampions so that they are not acting in isolation.
5.5 Energy management is the first step towardscarbon disclosure, whereby companies produce anannual statement of their carbon emissions with forward-looking reduction targets and strategies. This is becomingstandard practice for corporate accountability. The musicindustry could take a lead by being prepared and willingto participate, pre-regulation, in this transparencyprocess.
7
6 Recommendations
6.1 On the basis of this study, it is clear that there iswidespread support for coordinated industryactions on climate. As first steps towards climateleadership, it is recommended that the industry agreeboth short and medium term goals.
6.2 In the short term, it is proposed that reducing theindustry’s own carbon footprint should be theclear priority. This should include:
• Undertaking regular greenhouse gas emissions auditsof business activities.
• Committing to joint action, whereby the industry isable to take collective decisions, recognising that thesum is greater than its parts, and that new climatecommitments are inhibited by a perception of individualcompany risk.
• Managing building energy use, especially of musicvenues, offices and retail stores to target energysavings and low carbon technology investments bydeveloping GHG/energy accounting systems similar tofinancial accounting systems.
• Switching to a green (i.e. low carbon emissions)electricity tariff or, better still, 100% renewable energy sourcing.
• Improving the availability and quality of data,especially in the area of live music performance (in theUK and internationally).
• Creating a variety of travel schemes, and workingwith local authorities, travel companies and eventsorganisers to reduce audience transport emissions.
• Moving to low emissions CD packaging.
• Identifying and investing in low carbon businessopportunities.
• Organising regular training, knowledge sharing andadvice on environmentally responsible choices (best practice, procurement, innovative businessmodels) between companies, artists and staff acrossthe industry.
• Engaging suppliers in GHG emission reductionprogrammes, including as a first step requestinginformation on their own carbon footprints.
• Developing strategic partnerships for joint action –e.g. Greater London Authority Climate Change ActionPlan.
6.3 Within these programmes, it is recommended that‘beacon’ commitments should be made todemonstrate real commitment and achievablequick wins. Initial proposals include:
1) Switching to green (i.e. low carbon emissions)electricity tariff or, better still, a 100% renewableenergy sourcing.
2) Exploring an industry-wide initiative on low carbonCD packaging.
3) Installing low carbon lighting (eg LED) in live musicvenues.
4) Identifying, and highlighting all options for beacontravel plans for event goers, especially those alreadyoperating, as well as transferring music companies’ taxicontracts to ‘green’ suppliers.
6.4 In the medium term, the industry should identifyits ‘levers of influence’ and use these to effect policyinterventions and public education on climate. It will beessential to establish credibility for moving in thisdirection by delivering a serious and visible set ofprogrammes to reduce its own carbon footprint.Leadership through practical demonstration of actions toreduce GHG emissions will be more lasting andmeaningful than only artist led campaigns.
6.5 The music industry is centrally influential in lifestylechoices and therefore has an opportunity to be animportant leader in the transformation to a lowcarbon economy, as emissions are closely tied todecisions on lifestyle. As a service industry, it could andshould be an exemplar in the UK and internationally fordemonstrating how business works in partnership with itssub-contractors and customers to transform its productsand services; to minimise the emissions generated; and tobring an amplified voice for changes in the energyinfrastructure and for a drive towards a low carboneconomy. The mobilisation of the industry’s critical masswill be key to its becoming a climate leader.
8
1.1 OverviewClimate change is the defining issue of the 21st century. Most scientists agree that heavy reliance on carbon-basedsources for energy over the past century and a half has produced a warmer climate: if we do not reduce our emissionsof greenhouse gases (GHGs) the climate will continue to warm, accompanied by rises in sea levels, damage toecosystems and, eventually, critical shortages of resources such as water and food (see Box 1a). Avoiding dangerousclimate change requires major re-organisation of the energy system and the economy – innovations in infrastructure,markets, technology and behaviour (see Box 1b).
All the solutions – whether imposed by government or emerging from the private sector – need to be ambitious. If we are to prevent dangerous climate change, we may need to reduce greenhouse gas emissions (usually termedmitigation) by 60–80% from present levels by the middle of this century. The Stern Review, commissioned by theBritish government and published in 2006, estimated that with prompt action the costs of dealing with climate changecould be limited to approximately 1% of the current global Gross Domestic Product (GDP) each year and could avoiddamages that might be as much as 20% of global GDP (see Box 1c).
Industry has a vital role not just in reducing its own emissions, but as a catalyst for change. Businesses havetremendous potential to influence suppliers, retailers and consumers. By taking the initiative industry can influencegovernment policy, gain consumer confidence, and learn how to operate successfully in a lower carbon world. The UKmusic industry is poised to seize this opportunity and – importantly – make its voice heard in discussions aboutlegislation to deal with climate change that will inevitably have an impact on the music business.
In this report, we identify opportunities for reducing greenhouse gas emissions in the music sector based on the firstcomprehensive attempt to estimate the industry’s energy and emissions profile. The emphasis here is on real andlasting commitments within the music industry, from which inspiration and enthusiasm will emanate to other segmentsof society.
Box 1a What is Human Induced Climate Change?
The climate on planet Earth is moderated by the input of energy from the sun and the loss of this energy backinto space. GHGs prevent the loss of some energy and warm the atmosphere. These gases include CarbonDioxide (CO2), Methane (CH4), Nitrous Oxide (N2O), tropospheric ozone (O3), halocarbons (CFCs, HFCs,HCFCs) and water vapour (H2Ov).
Gases have varying abilities to trap outgoing energy and to linger in the atmosphere. Each gas can be denoted withan atmospheric ‘warming potential’, which is greater for a molecule of methane than carbon dioxide for example.Many of the GHGs emitted into the atmosphere stay there from around a century on average (for CO2) to amillennium (for CFCs). CO2 emissions from the Model T Ford in 1911 are still contributing to climate changestoday.
Over the course of the 4.6 billion year record of planet Earth, the earth has been warmed by ‘natural’ emissionsof greenhouse gases from vegetation and other geochemical cycles. Without the natural greenhouse effect theEarth would on average be much cooler and the planet would be covered with ice. With this natural greenhouseeffect, humans and other species have been able to enjoy a liveable climate, freshwater, and food resources.
Human activities have contributed to the ‘enhanced greenhouse effect’. Emissions of GHGs have increaseddramatically since the industrial revolution and are mainly associated with the combustion of fossil fuels – coal, oil,natural gas – as well as land use changes, especially deforestation. Scientists have reconstructed past GHGconcentrations using evidence from air trapped in ice cores and the chemistry of sediments to show that therecent increase in atmospheric GHGs exceeds the bounds of natural variability experienced during the preceding650,000 years. Global GHG emissions due to human activities have increased by 70% between 1970 and 2004(IPCC, 2007). Scientists are now convinced that these increases are associated with a detectable change in climateincluding warmer temperatures and the melting of glaciers and icecaps.
The United States accounts for approximately 25% of global CO2 emissions. Largely due to heavy coalconsumption, China follows second. However, some recent assessments have calculated that China is now
Section 1: Climate Change & Energy Use
9
surpassing the US as the top GHG-emitting nation. The UK is the seventh largest emitter producing 2.5% ofglobal emissions. The US also leads the planet in per capita emissions, but China ranks much lower using thismetric: the individual emissions of a typical citizen in China are less than 1/8th that of the US (NEAA, 2007). Theemissions of a UK citizen are on average approximately 10 t CO2 per annum, which is about one-half that of a UScitizen (Marland, 2007).
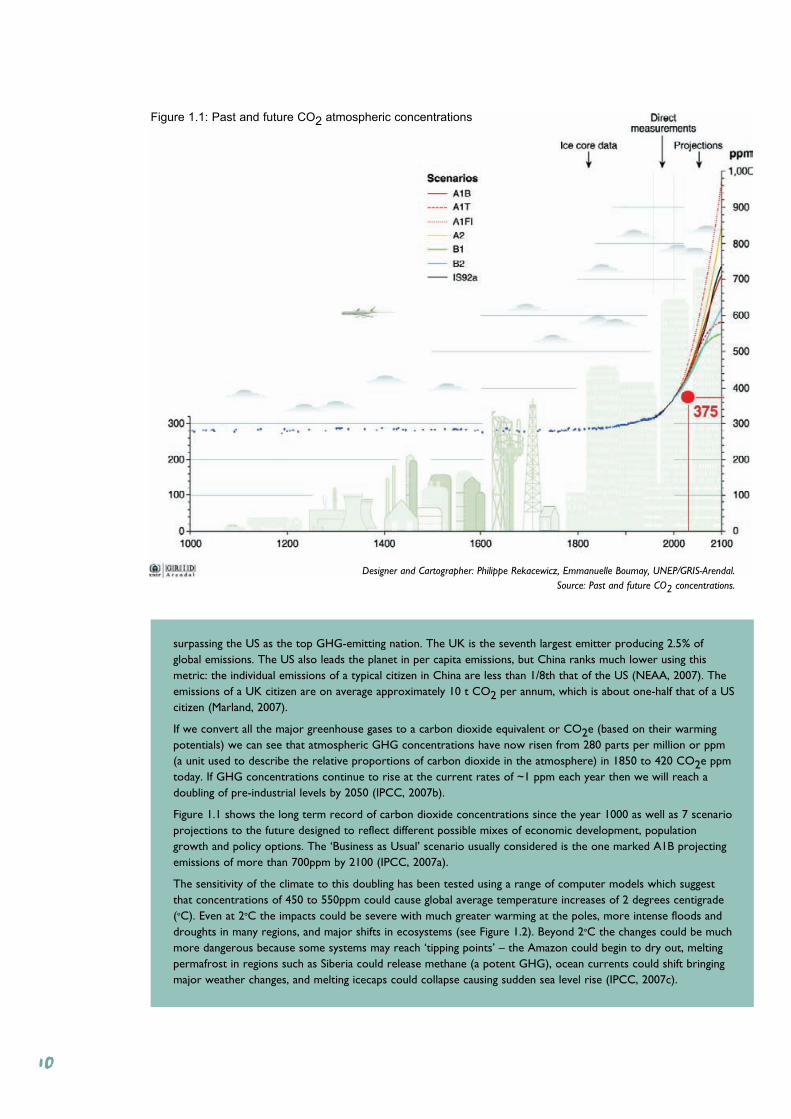
If we convert all the major greenhouse gases to a carbon dioxide equivalent or CO2e (based on their warmingpotentials) we can see that atmospheric GHG concentrations have now risen from 280 parts per million or ppm(a unit used to describe the relative proportions of carbon dioxide in the atmosphere) in 1850 to 420 CO2e ppmtoday. If GHG concentrations continue to rise at the current rates of ~1 ppm each year then we will reach adoubling of pre-industrial levels by 2050 (IPCC, 2007b).
Figure 1.1 shows the long term record of carbon dioxide concentrations since the year 1000 as well as 7 scenarioprojections to the future designed to reflect different possible mixes of economic development, populationgrowth and policy options. The ‘Business as Usual’ scenario usually considered is the one marked A1B projectingemissions of more than 700ppm by 2100 (IPCC, 2007a).
The sensitivity of the climate to this doubling has been tested using a range of computer models which suggestthat concentrations of 450 to 550ppm could cause global average temperature increases of 2 degrees centigrade(oC). Even at 2oC the impacts could be severe with much greater warming at the poles, more intense floods anddroughts in many regions, and major shifts in ecosystems (see Figure 1.2). Beyond 2oC the changes could be muchmore dangerous because some systems may reach ‘tipping points’ – the Amazon could begin to dry out, meltingpermafrost in regions such as Siberia could release methane (a potent GHG), ocean currents could shift bringingmajor weather changes, and melting icecaps could collapse causing sudden sea level rise (IPCC, 2007c).
Figure 1.1: Past and future CO2 atmospheric concentrations
Designer and Cartographer: Philippe Rekacewicz, Emmanuelle Boumay, UNEP/GRIS-Arendal. Source: Past and future CO2 concentrations.
10
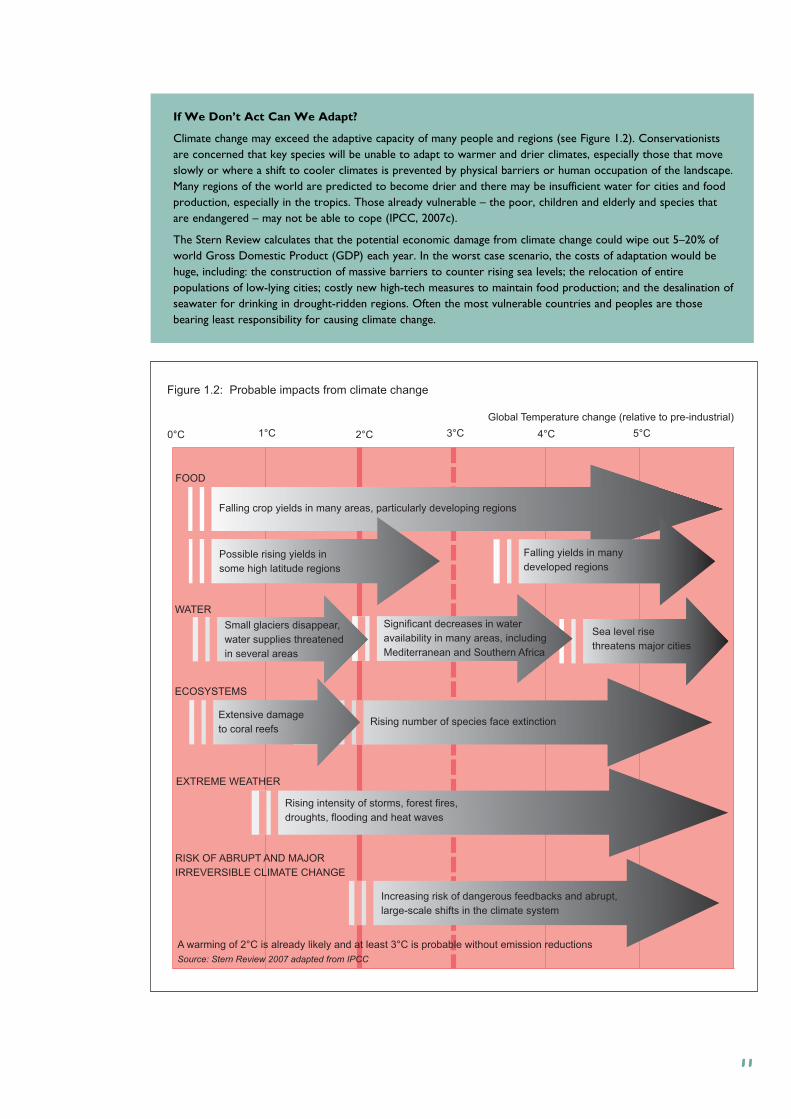
If We Don’t Act Can We Adapt?
Climate change may exceed the adaptive capacity of many people and regions (see Figure 1.2). Conservationistsare concerned that key species will be unable to adapt to warmer and drier climates, especially those that moveslowly or where a shift to cooler climates is prevented by physical barriers or human occupation of the landscape.Many regions of the world are predicted to become drier and there may be insufficient water for cities and foodproduction, especially in the tropics. Those already vulnerable – the poor, children and elderly and species thatare endangered – may not be able to cope (IPCC, 2007c).
The Stern Review calculates that the potential economic damage from climate change could wipe out 5–20% ofworld Gross Domestic Product (GDP) each year. In the worst case scenario, the costs of adaptation would behuge, including: the construction of massive barriers to counter rising sea levels; the relocation of entirepopulations of low-lying cities; costly new high-tech measures to maintain food production; and the desalination ofseawater for drinking in drought-ridden regions. Often the most vulnerable countries and peoples are thosebearing least responsibility for causing climate change.
0°C 1°C 2°C 3°C 4°C 5°C
Figure 1.2: Probable impacts from climate change
Global Temperature change (relative to pre-industrial)
Falling crop yields in many areas, particularly developing regions
Possible rising yields in
some high latitude regions
Falling yields in many
developed regions
Rising number of species face extinction
Sea level rise
threatens major cities
Significant decreases in water
availability in many areas, including
Mediterranean and Southern Africa
Rising intensity of storms, forest fires,
droughts, flooding and heat waves
Increasing risk of dangerous feedbacks and abrupt,
large-scale shifts in the climate system
Rising number of species face extinction
RISK OF ABRUPT AND MAJOR
IRREVERSIBLE CLIMATE CHANGE
EXTREME WEATHER
WATER
FOOD
ECOSYSTEMS
A warming of 2°C is already likely and at least 3°C is probable without emission reductions
Source: Stern Review 2007 adapted from IPCC
Small glaciers disappear,
water supplies threatened
in several areas
Extensive damage
to coral reefs
11
Box 1b Reducing Greenhouse Gas ConcentrationsIt is still possible to prevent the worst case scenarios for climate change. The Stern Review identified manymeasures to reduce emissions at relatively low cost, including efforts to increase energy efficiency and reduceenergy demand. Some of these measures would save money for firms and consumers that would otherwise bespent on energy. Mitigation may also require new or large scale technologies for burning fossil fuels moreefficiently, including capturing carbon (such as geological carbon sequestration), non petroleum transport andwidespread investment in renewable energy. Many of these solutions are costly, not yet fully proven, or facepublic opposition.
Stern and other economists argue that it is time to include the costs of damages from climate change in the costsof doing business (making external costs internal) and thus to create incentives to reduce emissions. A range ofoptions can encourage mitigation including:
- A tax on emissions of carbon dioxide and other GHGs;
- Regulations and quotas that require companies to reduce emissions to certain levels;
- Systems of credits for buying and selling emission reductions (carbon markets);
- Public and investor pressure to operate greener practices.
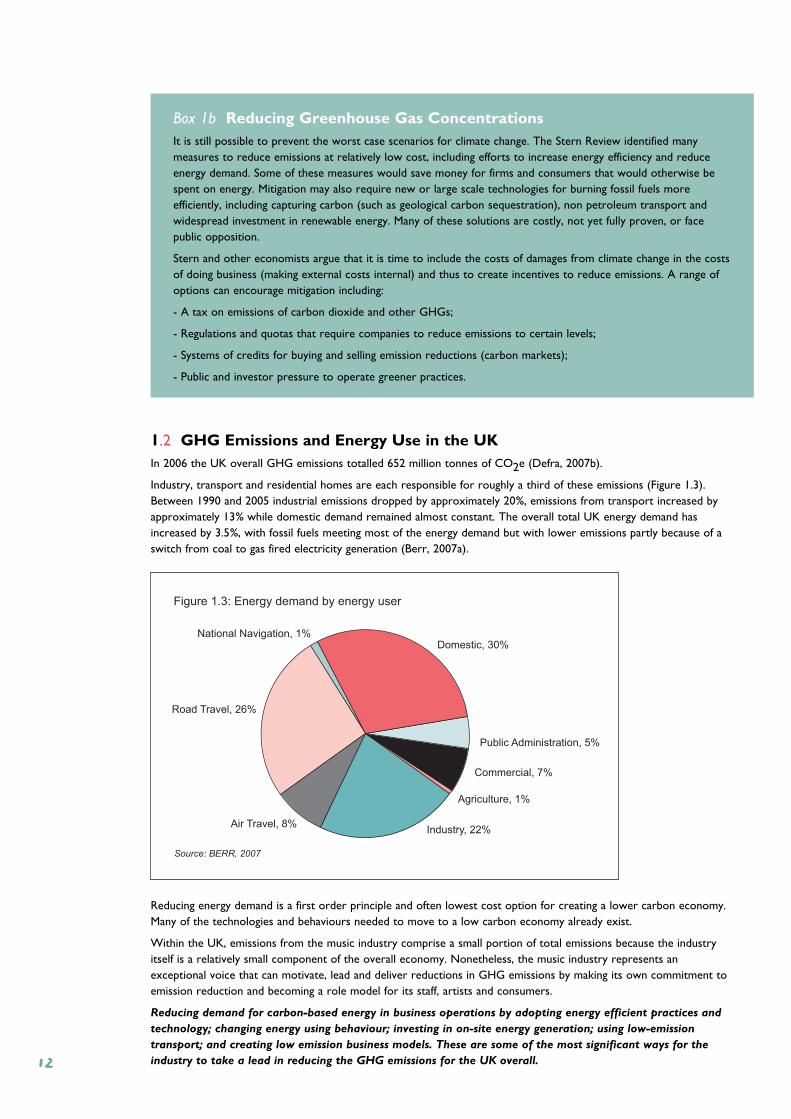
1.2 GHG Emissions and Energy Use in the UKIn 2006 the UK overall GHG emissions totalled 652 million tonnes of CO2e (Defra, 2007b).
Industry, transport and residential homes are each responsible for roughly a third of these emissions (Figure 1.3).Between 1990 and 2005 industrial emissions dropped by approximately 20%, emissions from transport increased byapproximately 13% while domestic demand remained almost constant. The overall total UK energy demand hasincreased by 3.5%, with fossil fuels meeting most of the energy demand but with lower emissions partly because of aswitch from coal to gas fired electricity generation (Berr, 2007a).
Reducing energy demand is a first order principle and often lowest cost option for creating a lower carbon economy.Many of the technologies and behaviours needed to move to a low carbon economy already exist.
Within the UK, emissions from the music industry comprise a small portion of total emissions because the industryitself is a relatively small component of the overall economy. Nonetheless, the music industry represents anexceptional voice that can motivate, lead and deliver reductions in GHG emissions by making its own commitment toemission reduction and becoming a role model for its staff, artists and consumers.
Reducing demand for carbon-based energy in business operations by adopting energy efficient practices and
technology; changing energy using behaviour; investing in on-site energy generation; using low-emission
transport; and creating low emission business models. These are some of the most significant ways for the
industry to take a lead in reducing the GHG emissions for the UK overall.
National Navigation, 1%
Figure 1.3: Energy demand by energy user
Road Travel, 26%
Air Travel, 8%Industry, 22%
Agriculture, 1%
Commercial, 7%
Public Administration, 5%
Domestic, 30%
Source: BERR, 2007
12
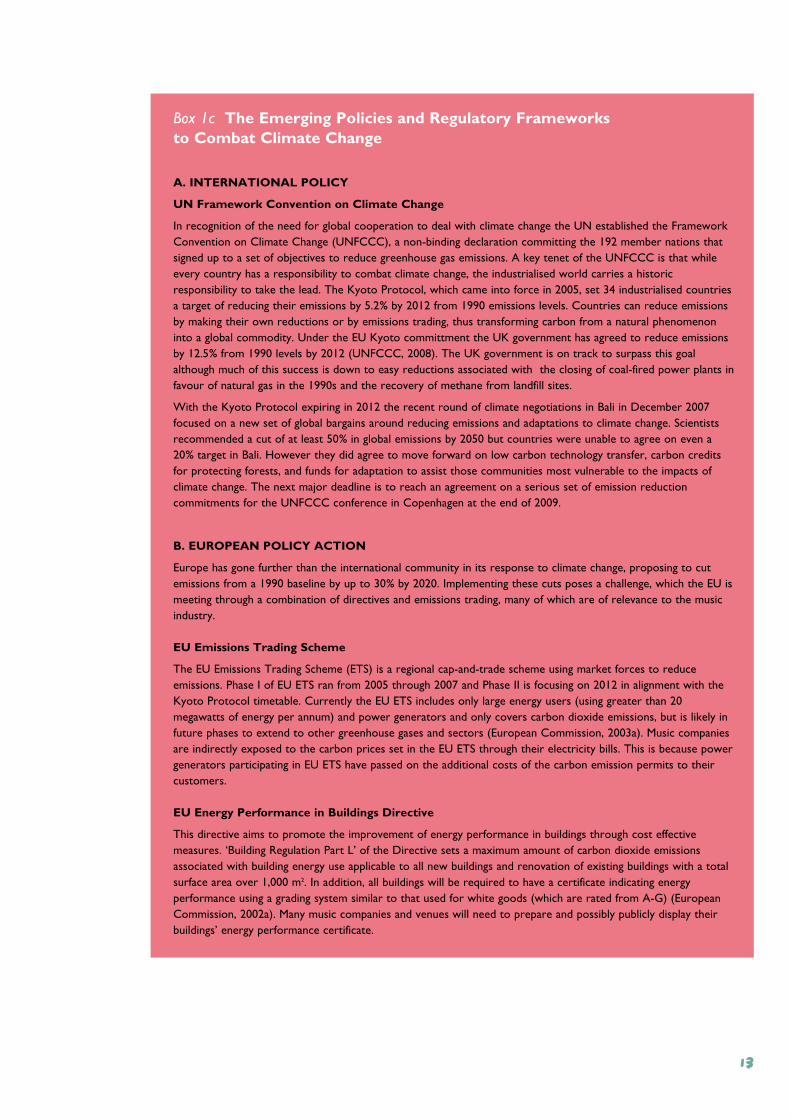
Box 1c The Emerging Policies and Regulatory Frameworks to Combat Climate Change
A. INTERNATIONAL POLICY
UN Framework Convention on Climate Change
In recognition of the need for global cooperation to deal with climate change the UN established the FrameworkConvention on Climate Change (UNFCCC), a non-binding declaration committing the 192 member nations thatsigned up to a set of objectives to reduce greenhouse gas emissions. A key tenet of the UNFCCC is that whileevery country has a responsibility to combat climate change, the industrialised world carries a historicresponsibility to take the lead. The Kyoto Protocol, which came into force in 2005, set 34 industrialised countriesa target of reducing their emissions by 5.2% by 2012 from 1990 emissions levels. Countries can reduce emissionsby making their own reductions or by emissions trading, thus transforming carbon from a natural phenomenoninto a global commodity. Under the EU Kyoto committment the UK government has agreed to reduce emissionsby 12.5% from 1990 levels by 2012 (UNFCCC, 2008). The UK government is on track to surpass this goalalthough much of this success is down to easy reductions associated with the closing of coal-fired power plants infavour of natural gas in the 1990s and the recovery of methane from landfill sites.
With the Kyoto Protocol expiring in 2012 the recent round of climate negotiations in Bali in December 2007focused on a new set of global bargains around reducing emissions and adaptations to climate change. Scientistsrecommended a cut of at least 50% in global emissions by 2050 but countries were unable to agree on even a20% target in Bali. However they did agree to move forward on low carbon technology transfer, carbon creditsfor protecting forests, and funds for adaptation to assist those communities most vulnerable to the impacts ofclimate change. The next major deadline is to reach an agreement on a serious set of emission reductioncommitments for the UNFCCC conference in Copenhagen at the end of 2009.
B. EUROPEAN POLICY ACTION
Europe has gone further than the international community in its response to climate change, proposing to cutemissions from a 1990 baseline by up to 30% by 2020. Implementing these cuts poses a challenge, which the EU ismeeting through a combination of directives and emissions trading, many of which are of relevance to the musicindustry.
EU Emissions Trading Scheme
The EU Emissions Trading Scheme (ETS) is a regional cap-and-trade scheme using market forces to reduceemissions. Phase I of EU ETS ran from 2005 through 2007 and Phase II is focusing on 2012 in alignment with theKyoto Protocol timetable. Currently the EU ETS includes only large energy users (using greater than 20megawatts of energy per annum) and power generators and only covers carbon dioxide emissions, but is likely infuture phases to extend to other greenhouse gases and sectors (European Commission, 2003a). Music companiesare indirectly exposed to the carbon prices set in the EU ETS through their electricity bills. This is because powergenerators participating in EU ETS have passed on the additional costs of the carbon emission permits to theircustomers.
EU Energy Performance in Buildings Directive
This directive aims to promote the improvement of energy performance in buildings through cost effectivemeasures. ‘Building Regulation Part L’ of the Directive sets a maximum amount of carbon dioxide emissionsassociated with building energy use applicable to all new buildings and renovation of existing buildings with a totalsurface area over 1,000 m2. In addition, all buildings will be required to have a certificate indicating energyperformance using a grading system similar to that used for white goods (which are rated from A-G) (EuropeanCommission, 2002a). Many music companies and venues will need to prepare and possibly publicly display theirbuildings’ energy performance certificate.
13
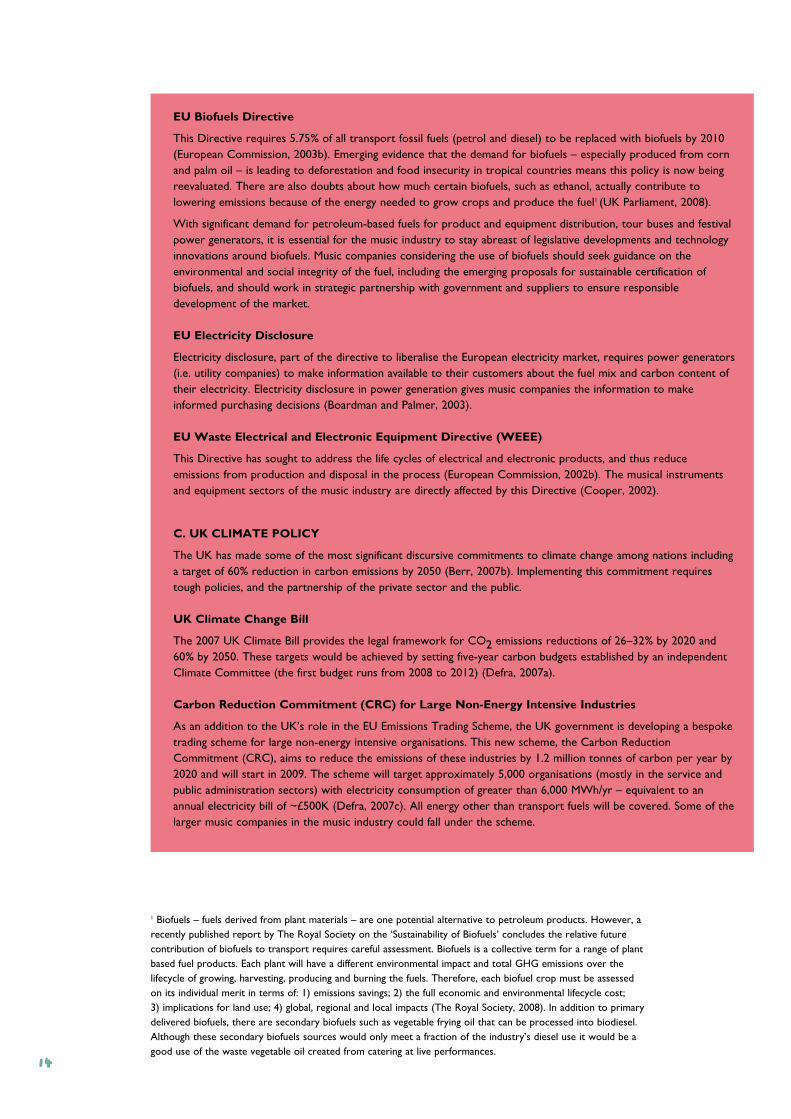
EU Biofuels Directive
This Directive requires 5.75% of all transport fossil fuels (petrol and diesel) to be replaced with biofuels by 2010(European Commission, 2003b). Emerging evidence that the demand for biofuels – especially produced from cornand palm oil – is leading to deforestation and food insecurity in tropical countries means this policy is now beingreevaluated. There are also doubts about how much certain biofuels, such as ethanol, actually contribute tolowering emissions because of the energy needed to grow crops and produce the fuel1 (UK Parliament, 2008).
With significant demand for petroleum-based fuels for product and equipment distribution, tour buses and festivalpower generators, it is essential for the music industry to stay abreast of legislative developments and technologyinnovations around biofuels. Music companies considering the use of biofuels should seek guidance on theenvironmental and social integrity of the fuel, including the emerging proposals for sustainable certification ofbiofuels, and should work in strategic partnership with government and suppliers to ensure responsibledevelopment of the market.
EU Electricity Disclosure
Electricity disclosure, part of the directive to liberalise the European electricity market, requires power generators(i.e. utility companies) to make information available to their customers about the fuel mix and carbon content oftheir electricity. Electricity disclosure in power generation gives music companies the information to makeinformed purchasing decisions (Boardman and Palmer, 2003).
EU Waste Electrical and Electronic Equipment Directive (WEEE)
This Directive has sought to address the life cycles of electrical and electronic products, and thus reduceemissions from production and disposal in the process (European Commission, 2002b). The musical instrumentsand equipment sectors of the music industry are directly affected by this Directive (Cooper, 2002).
C. UK CLIMATE POLICY
The UK has made some of the most significant discursive commitments to climate change among nations includinga target of 60% reduction in carbon emissions by 2050 (Berr, 2007b). Implementing this commitment requirestough policies, and the partnership of the private sector and the public.
UK Climate Change Bill
The 2007 UK Climate Bill provides the legal framework for CO2 emissions reductions of 26–32% by 2020 and60% by 2050. These targets would be achieved by setting five-year carbon budgets established by an independentClimate Committee (the first budget runs from 2008 to 2012) (Defra, 2007a).
Carbon Reduction Commitment (CRC) for Large Non-Energy Intensive Industries
As an addition to the UK’s role in the EU Emissions Trading Scheme, the UK government is developing a bespoketrading scheme for large non-energy intensive organisations. This new scheme, the Carbon ReductionCommitment (CRC), aims to reduce the emissions of these industries by 1.2 million tonnes of carbon per year by2020 and will start in 2009. The scheme will target approximately 5,000 organisations (mostly in the service andpublic administration sectors) with electricity consumption of greater than 6,000 MWh/yr – equivalent to anannual electricity bill of ~£500K (Defra, 2007c). All energy other than transport fuels will be covered. Some of thelarger music companies in the music industry could fall under the scheme.
1 Biofuels – fuels derived from plant materials – are one potential alternative to petroleum products. However, arecently published report by The Royal Society on the ‘Sustainability of Biofuels’ concludes the relative futurecontribution of biofuels to transport requires careful assessment. Biofuels is a collective term for a range of plantbased fuel products. Each plant will have a different environmental impact and total GHG emissions over thelifecycle of growing, harvesting, producing and burning the fuels. Therefore, each biofuel crop must be assessedon its individual merit in terms of: 1) emissions savings; 2) the full economic and environmental lifecycle cost; 3) implications for land use; 4) global, regional and local impacts (The Royal Society, 2008). In addition to primarydelivered biofuels, there are secondary biofuels such as vegetable frying oil that can be processed into biodiesel.Although these secondary biofuels sources would only meet a fraction of the industry’s diesel use it would be agood use of the waste vegetable oil created from catering at live performances.
14
D. CARBON OFFSETS
At the international scale Kyoto created flexible mechanisms for meeting emission reductions by which anindustrialised country, rather than reduce emissions domestically, could purchase emission reduction credits fromprojects that reduce emissions in the developing world (through the so-called Clean Development Mechanism).The logic behind these ‘carbon offsets’ is that because the atmosphere is global and mixed uniformly it does notmatter where emission reductions occur so long as they lead to a reduction in overall concentrations of GHGs.The economic logic of carbon offsets is that carbon reductions are often cheaper and easier in the developingworld and so the atmosphere can benefit from trading investment in expensive domestic reductions forinvestment in offsets. In some cases carbon reduction projects may have additional side benefits for developingcountries including jobs, protection of forests, low carbon electricity, and reduced energy costs and air pollution.
In parallel to the Kyoto driven international market in carbon offsets, a voluntary offset market has emerged,which provides carbon credits to individuals and firms who wish to offset their emissions. The carbon offsetcompanies develop or purchase credits from emission reduction projects that include renewable energy, efficientwoodstoves, methane capture from waste, or reforestation. These credits are then sold to consumers who wishto offset their emissions from flying or driving, offices and homes with the emissions estimated using carboncalculators that convert, for example, distance flown to kilograms of carbon. Carbon offsetting has become animportant strategy for companies seeking ‘carbon neutrality’ and may range from investment in a local wind farmto carbon credits from a project in Africa.
Criticisms of carbon offsetting include questions about the ethics of paying others to compensate for youremissions, the technical challenges of accurate monitoring, the need for assurance that carbon reduction projectsprovide clear additional reductions in emissions, and the real sustainable development value of offsets. In responseto criticisms the voluntary offset companies are working to establish high quality standards and certification foroffsets and the UK government has issued some guidelines.
Offsetting provides the music industry with an option to compensate for its emissions, especially from transport,once it has made every effort to reduce energy use and emissions in its operations and value chain. Decisionsabout offsetting will need to balance issues of environmental impact, cost, development benefits, ethics and publicattitudes, and take account of the emergence of standards and high quality projects in both the formal andvoluntary offset market.
15

16
2.1 OverviewThe UK music industry is a key driver of the creative economy and for those unfamiliar with the industry this sectionprovides a brief description of the structure and current dynamics of the industry as a context for understanding itsgreenhouse gas (GHG) emissions. It identifies some key trends and issues in each sector which help to understand thedrivers determining the industry’s current emissions and some of the factors that may influence future emissions.
Business activities in the music industry centre on recording and live performance and figure 2.1 provides anillustration of the main players and activities. In both areas there are a handful of large international companies and alarge number of smaller independent companies. Ninety-seven per cent of businesses, almost 18,000, in the industryare micros and SMEs (Creative & Cultural Skills, 2007a).
UK music industry activities account for over 10% of global music sales; they have the third largest market share ofglobal sales after the United States and Japan (BPI, 2007). The UK has the highest per capita music sales withapproximately 134 million album and 86 million legally downloaded tracks were sold in 2006. In recent years live musicperformance has had a renaissance with increasing demand by consumers for experience culture: in 2006 direct ticketsales generated £743 million (Mintel, 2007).
2.2 Industry TransformationDynamism best describes the contemporary UK music industry, and such dynamism will certainly affect future GHGemissions profiles and carbon management. The traditional boundaries between industry players whose business lies inconnecting the artist to the fan – be they managers, publishers, live promoters, or record labels – are shifting.
Moreover, digital technology is changing every aspect of how the music business operates from how talent isdiscovered and which industry actors have become involved (e.g. Apple, Amazon) to how music is produced,recorded, promoted and retailed. Further, there are approximately 100,000 people officially employed in the musicindustry and 30,000 people employed in music education (Creative & Cultural Skills, 2007b). These official estimatesstill do not capture well the temporary or part-time work generated by the industry.
2.3 Sector Trends and Issues
2.3.1 Artist management
Most professional artists employ managers to negotiate the best business opportunities on their behalf. Managers will receive a percentage of artist’s income typically in the region of 20%.
2.3.2 Music promotion
Music promoters book acts, market and stage live music events and are typically hired on contract by venues based onan agreed-to fee or a royalty. There are a handful of large companies as well as many independent promoters thoughcurrently the trend for acquisitions is leading to a more consolidated industry.
2.3.3 Agencies
Agents broker performance contracts between managers and promoters and are often regionally focused representinga number of artists.
2.3.4 Record companies
Record companies generally organise the production, manufacturing, distribution and marketing of recorded musicproducts. The sector comprises four large international companies (the “majors”) and a very large number of smallerindependent companies. In 2007 the majors accounted for 78% of the total album units sold in the UK while theindependent sector accounts for 22% (BPI 2007). In recent years, consolidation in the recording sector has intensifiedwith a number of mergers and acquisitions.
Section 2: Context – The UK Music Industry
17
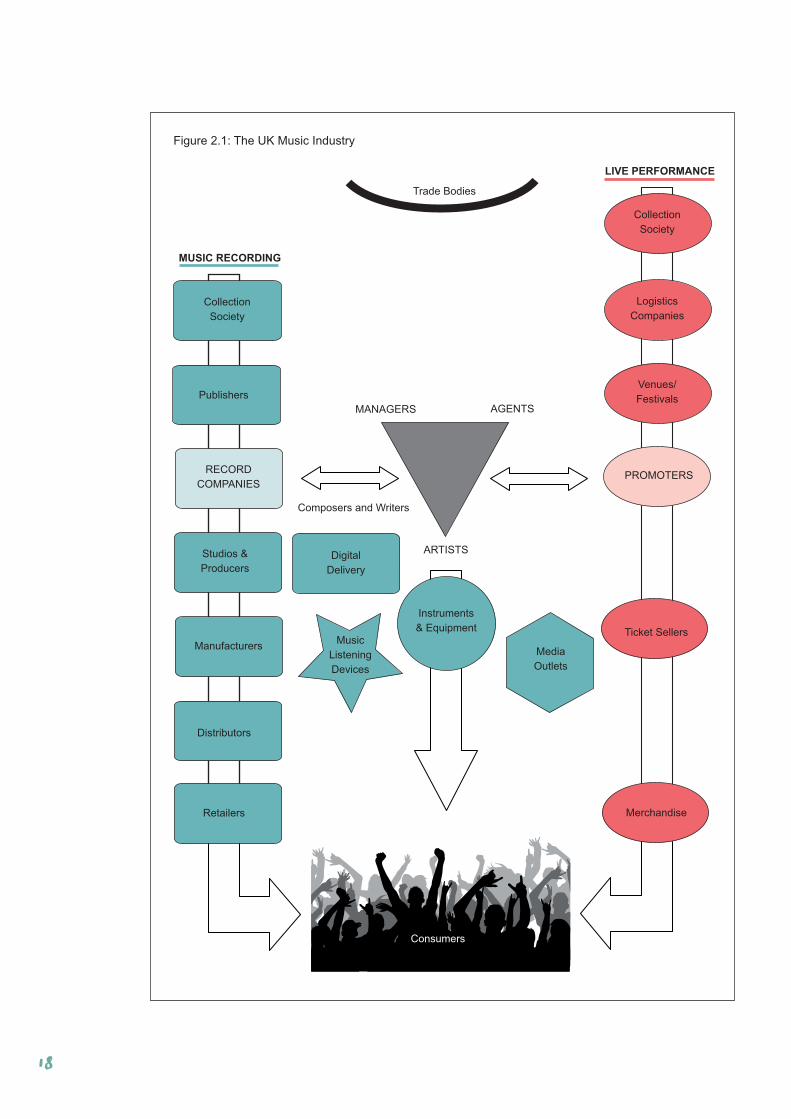
Figure 2.1: The UK Music Industry
Media
Outlets
Trade Bodies
Composers and Writers
MUSIC RECORDING
LIVE PERFORMANCE
Collection
Society
Logistics
Companies
Venues/
Festivals
PROMOTERS
Ticket Sellers
Merchandise
Collection
Society
Publishers
RECORD
COMPANIES
Studios &
Producers
Manufacturers
Distributors
Retailers
Digital
Delivery
MANAGERS AGENTS
ARTISTS
Music
Listening
Devices
Consumers
Instruments
& Equipment
18
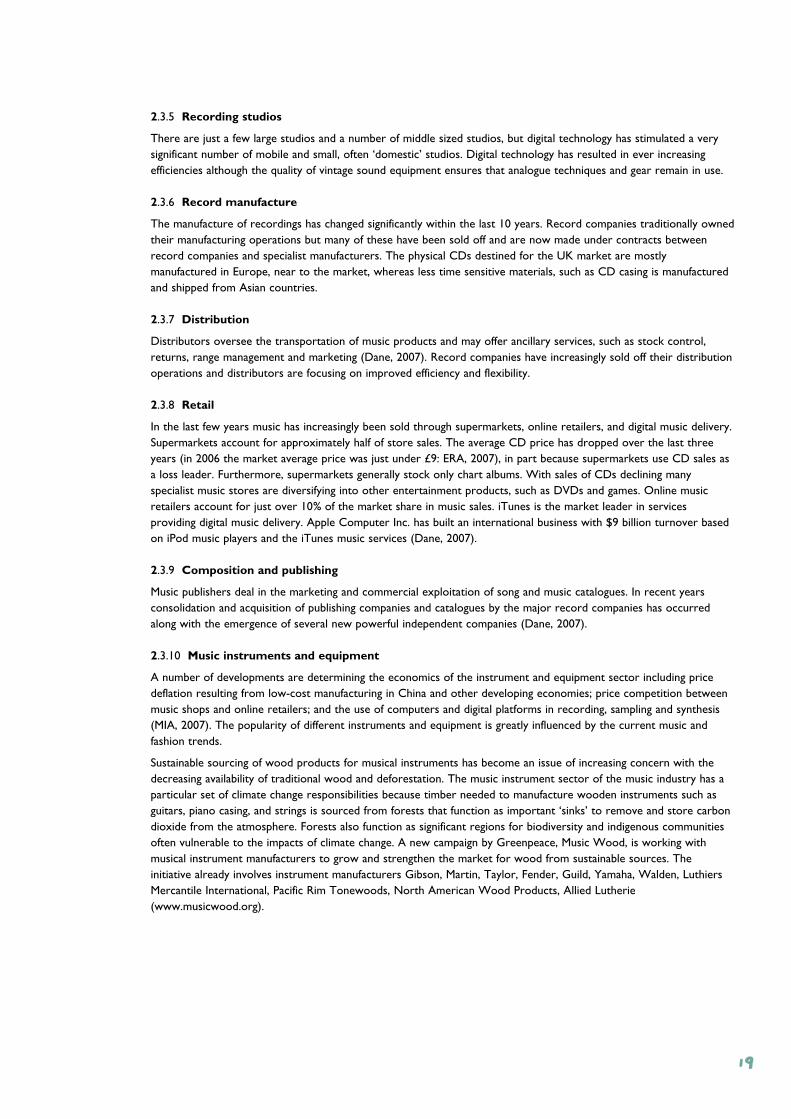
2.3.5 Recording studios
There are just a few large studios and a number of middle sized studios, but digital technology has stimulated a verysignificant number of mobile and small, often ‘domestic’ studios. Digital technology has resulted in ever increasingefficiencies although the quality of vintage sound equipment ensures that analogue techniques and gear remain in use.
2.3.6 Record manufacture
The manufacture of recordings has changed significantly within the last 10 years. Record companies traditionally ownedtheir manufacturing operations but many of these have been sold off and are now made under contracts betweenrecord companies and specialist manufacturers. The physical CDs destined for the UK market are mostlymanufactured in Europe, near to the market, whereas less time sensitive materials, such as CD casing is manufacturedand shipped from Asian countries.
2.3.7 Distribution
Distributors oversee the transportation of music products and may offer ancillary services, such as stock control,returns, range management and marketing (Dane, 2007). Record companies have increasingly sold off their distributionoperations and distributors are focusing on improved efficiency and flexibility.
2.3.8 Retail
In the last few years music has increasingly been sold through supermarkets, online retailers, and digital music delivery.Supermarkets account for approximately half of store sales. The average CD price has dropped over the last threeyears (in 2006 the market average price was just under £9: ERA, 2007), in part because supermarkets use CD sales asa loss leader. Furthermore, supermarkets generally stock only chart albums. With sales of CDs declining manyspecialist music stores are diversifying into other entertainment products, such as DVDs and games. Online musicretailers account for just over 10% of the market share in music sales. iTunes is the market leader in servicesproviding digital music delivery. Apple Computer Inc. has built an international business with $9 billion turnover basedon iPod music players and the iTunes music services (Dane, 2007).
2.3.9 Composition and publishing
Music publishers deal in the marketing and commercial exploitation of song and music catalogues. In recent yearsconsolidation and acquisition of publishing companies and catalogues by the major record companies has occurredalong with the emergence of several new powerful independent companies (Dane, 2007).
2.3.10 Music instruments and equipment
A number of developments are determining the economics of the instrument and equipment sector including pricedeflation resulting from low-cost manufacturing in China and other developing economies; price competition betweenmusic shops and online retailers; and the use of computers and digital platforms in recording, sampling and synthesis(MIA, 2007). The popularity of different instruments and equipment is greatly influenced by the current music andfashion trends.
Sustainable sourcing of wood products for musical instruments has become an issue of increasing concern with thedecreasing availability of traditional wood and deforestation. The music instrument sector of the music industry has aparticular set of climate change responsibilities because timber needed to manufacture wooden instruments such asguitars, piano casing, and strings is sourced from forests that function as important ‘sinks’ to remove and store carbondioxide from the atmosphere. Forests also function as significant regions for biodiversity and indigenous communitiesoften vulnerable to the impacts of climate change. A new campaign by Greenpeace, Music Wood, is working withmusical instrument manufacturers to grow and strengthen the market for wood from sustainable sources. Theinitiative already involves instrument manufacturers Gibson, Martin, Taylor, Fender, Guild, Yamaha, Walden, LuthiersMercantile International, Pacific Rim Tonewoods, North American Wood Products, Allied Lutherie(www.musicwood.org).
19
2.3.11 Music listening devices
The market to innovate in new listening devices has been exceptionally buoyant over the last decade, and shows littlesign of declining. MP3 players, computers and mobile phones have transformed the listening habits of the public. In theUK, music player (MP3) ownership was almost 14 million in 2006 up from 7.8 million in 2005. The retail value of theMP3 market was approximately £770m in 2006 (Dane, 2007).
The implications of GHG emissions related to this sector have not been studied in depth in this report, but theubiquitous and dynamic nature of the product and its capacity to convey messages mean that understanding theemissions profile and building mitigation strategies should be a priority next step.
2.3.12 Music media
There are a dozen or so popular hard-copy music magazines for consumers and several industry publications. There isa trend towards music media developing online products and services for its readership.
2.4 SummaryIn this section we have provided the context for the estimation of carbon emissions from the music industry and toidentify opportunities for reducing those emissions.
The UK music industry is going through a period of significant transition in the delivery of recorded and live musicthrough digital technology. There are associated changes in recording, manufacturing, distribution, retailing, and liveperformance.
Competing forces – such as consolidation in various sectors mixed with internationalization of supply chains and sub-contracts – present the industry with particular commercial forces that need to be examined in the context of climatechange. For instance, the materials used for producing CDs, music devices, instruments, and staging equipment areincreasingly sourced and even manufactured outside of the UK. These changes are presenting unprecedentedchallenges and opportunities for novel interventions to reduce GHG emissions in the UK music industry.
The industry’s artistic reach and business activities are global and UK artists have entertained and influenced globalculture for the past 50 years. While it is difficult to measure the emissions of the international dimensions of the musicindustry, the global reach dramatically extends the industry’s capacity to contribute positively to reducing emissionsand tackling climate change.
20
3.1 OverviewThis research for the UK music industry has three primary objectives:
1) Scope quantitatively the greenhouse gas (GHG) emissions resulting from activities associated with the UK musicindustry.
2) Identify blockages and opportunities for the music industry to draw up proactive and effective plans for their role inpreventing dangerous climate change.
3) Make initial recommendations for specific actions and priorities for the medium term.
This section explains the methods used to conservatively quantify the direct GHG emissions of the UK music industry.Data was gathered through 1) energy surveys of music companies and business activities; 2) interviews with ChiefExecutives and key informants; and 3) attitudinal surveys on climate change action. In addition to this primary data,company carbon audits and relevant literature was used when available. Case study company energy surveys and GHGemission audits were used to estimate the GHG emissions of each activity segment and for the industry as a whole. Atechnical note has been prepared explaining in more detail how information sources have been used to estimate thegreenhouse gas emissions of the UK music industry.2
This study does not provide a full carbon audit of the UK music industry. It is intended as a first and limitedassessment based on estimates, case studies and data provided by a subset of the music industry. A completeassessment would require a great deal of primary research into energy use and management within individualcompanies and across the industry. We hope that this study will provide the basis for further analysis even as italready identifies important areas for emission reductions across the industry.
3.2 GHG ProtocolAs its frame of reference, our study uses the Greenhouse Gas (GHG) Protocol, an internationally recognised standardfor accounting company emissions3 (WRI and WBCSD, 2004). The Protocol is designed to guide companies inidentifying, quantifying, and reducing GHG emissions from business operations. It focuses on the direct and indirectsources of GHG emissions from business operations. Direct sources are defined as fuel use and indirect sources asemissions associated with electricity, employee travel, third party suppliers, outsourced activities and waste.
In the case of a record company, for example, the GHG Protocol would recommend quantifying the annual emissionsfrom office energy use, employee work travel, company owned vehicles, business operations in which the company hasan equity share, and third party suppliers. However, the GHG Protocol is not designed for quantifying the emissionsthrough the value chain of a product or service and therefore does not provide guidance on how to quantify the GHGemissions associated with the materials and use of a product or service. So, using the example of a record company,the GHG Protocol does not include quantifying the emissions from CD materials the company produces or thoseassociated with the consumer listening to the CD or the disposal of that CD.
Our study of the music industry sought to be comprehensive and to look at emissions in value chains as well ascompanies themselves so it has gone beyond the GHG protocol. The research estimates both the primary emissionsof the industry’s business operations as well as the secondary emissions in the value chain, especially those thatdecision makers in the industry can influence. We identify audience travel to live performances as one of the mostimportant secondary emissions sources.
Section 3: Research Approach and Methodology
2 This is available online at Julie’s Bicycle or Environmental Change Institute websites.
3 The key procedural steps recommended by the Protocol are: - Establishment of the GHG scoping boundaries (including the selection of: greenhouse gases, organisational and projectboundaries as well as operational boundaries).- Collection of companies’ data.- Calculation of emissions using appropriate conversion factors.- Analysis of results.- Determination of suitable recommendations based on the findings.
21
Box 3a Greenhouse Gas AuditsA GHG audit is a process by which the total amount of greenhouse gas emissions released into the atmospherefrom a particular or set of activities for a defined period of time, usually one year, are inventoried. A GHG auditis not based on direct measurement of GHG emissions, but on direct measurement or estimates of the amount offuel combusted, waste produced or chemical processed. Key considerations when undertaking a GHG audit are:1) what are the relevant greenhouse gases for the business activities in question; 2) what are the organisationaland operational emissions boundaries to be used; and 3) what time period the GHG audit reflects. Putting in placea regular auditing process will enable the company to implement and monitor strategies to reduce emissions. A GHG audit can include all six greenhouse gases covered by the Kyoto Protocol (see Chapter 1).
3.3 Setting the Study Boundaries
3.3.1 Greenhouse Gases Emission Boundaries – what gases do we include?
The music industry is an energy user rather than an energy producer and the most relevant GHGs to include arecarbon dioxide (CO2), methane (CH4) and nitrous oxide (N2O), rather than others associated with energyproduction and particular forms of manufacturing.
These gases are emitted as the result of combusting fossil fuels for heating, electricity and travel. Carbon dioxide willbe the most dominant gas released by the music industry with CH4 and N2O at much lower levels4.
3.3.2 UK Music Industry Boundaries
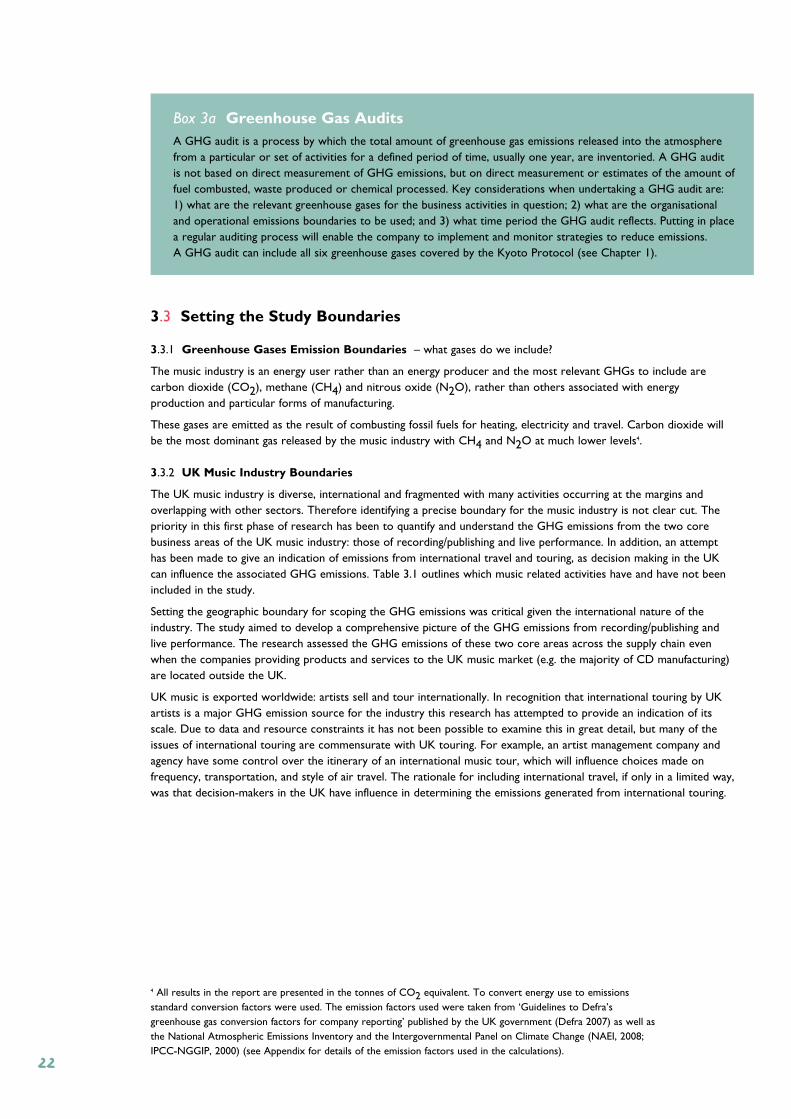
The UK music industry is diverse, international and fragmented with many activities occurring at the margins andoverlapping with other sectors. Therefore identifying a precise boundary for the music industry is not clear cut. Thepriority in this first phase of research has been to quantify and understand the GHG emissions from the two corebusiness areas of the UK music industry: those of recording/publishing and live performance. In addition, an attempthas been made to give an indication of emissions from international travel and touring, as decision making in the UKcan influence the associated GHG emissions. Table 3.1 outlines which music related activities have and have not beenincluded in the study.
Setting the geographic boundary for scoping the GHG emissions was critical given the international nature of theindustry. The study aimed to develop a comprehensive picture of the GHG emissions from recording/publishing andlive performance. The research assessed the GHG emissions of these two core areas across the supply chain evenwhen the companies providing products and services to the UK music market (e.g. the majority of CD manufacturing)are located outside the UK.
UK music is exported worldwide: artists sell and tour internationally. In recognition that international touring by UKartists is a major GHG emission source for the industry this research has attempted to provide an indication of itsscale. Due to data and resource constraints it has not been possible to examine this in great detail, but many of theissues of international touring are commensurate with UK touring. For example, an artist management company andagency have some control over the itinerary of an international music tour, which will influence choices made onfrequency, transportation, and style of air travel. The rationale for including international travel, if only in a limited way,was that decision-makers in the UK have influence in determining the emissions generated from international touring.
4 All results in the report are presented in the tonnes of CO2 equivalent. To convert energy use to emissionsstandard conversion factors were used. The emission factors used were taken from ‘Guidelines to Defra’sgreenhouse gas conversion factors for company reporting’ published by the UK government (Defra 2007) as well asthe National Atmospheric Emissions Inventory and the Intergovernmental Panel on Climate Change (NAEI, 2008;IPCC-NGGIP, 2000) (see Appendix for details of the emission factors used in the calculations).
22
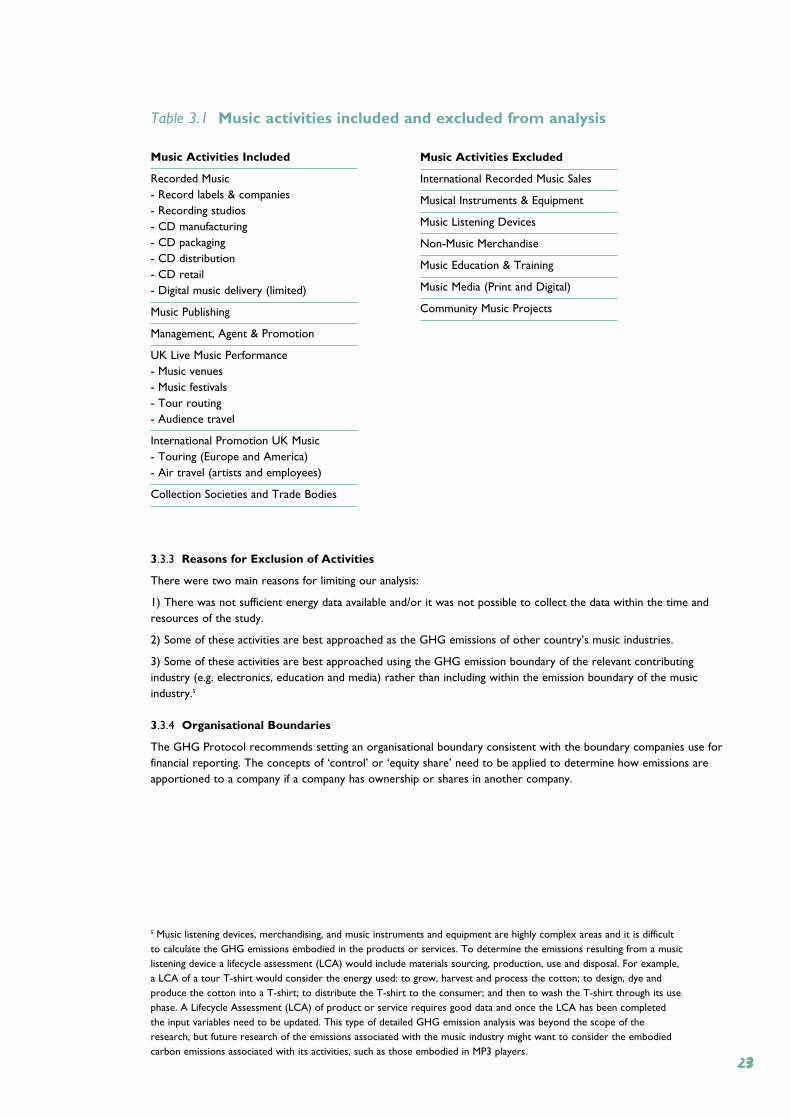
Table 3.1 Music activities included and excluded from analysis
Music Activities Included
Recorded Music- Record labels & companies- Recording studios- CD manufacturing- CD packaging- CD distribution- CD retail- Digital music delivery (limited)
Music Publishing
Management, Agent & Promotion
UK Live Music Performance- Music venues- Music festivals- Tour routing- Audience travel
International Promotion UK Music- Touring (Europe and America)- Air travel (artists and employees)
Collection Societies and Trade Bodies
3.3.3 Reasons for Exclusion of Activities
There were two main reasons for limiting our analysis:
1) There was not sufficient energy data available and/or it was not possible to collect the data within the time andresources of the study.
2) Some of these activities are best approached as the GHG emissions of other country’s music industries.
3) Some of these activities are best approached using the GHG emission boundary of the relevant contributingindustry (e.g. electronics, education and media) rather than including within the emission boundary of the musicindustry.5
3.3.4 Organisational Boundaries
The GHG Protocol recommends setting an organisational boundary consistent with the boundary companies use forfinancial reporting. The concepts of ‘control’ or ‘equity share’ need to be applied to determine how emissions areapportioned to a company if a company has ownership or shares in another company.
5 Music listening devices, merchandising, and music instruments and equipment are highly complex areas and it is difficultto calculate the GHG emissions embodied in the products or services. To determine the emissions resulting from a musiclistening device a lifecycle assessment (LCA) would include materials sourcing, production, use and disposal. For example,a LCA of a tour T-shirt would consider the energy used: to grow, harvest and process the cotton; to design, dye andproduce the cotton into a T-shirt; to distribute the T-shirt to the consumer; and then to wash the T-shirt through its usephase. A Lifecycle Assessment (LCA) of product or service requires good data and once the LCA has been completedthe input variables need to be updated. This type of detailed GHG emission analysis was beyond the scope of theresearch, but future research of the emissions associated with the music industry might want to consider the embodiedcarbon emissions associated with its activities, such as those embodied in MP3 players.
23
Music Activities Excluded
International Recorded Music Sales
Musical Instruments & Equipment
Music Listening Devices
Non-Music Merchandise
Music Education & Training
Music Media (Print and Digital)
Community Music Projects
3.3.5 Music Project Boundaries
Some of the Industry’s business activities are best described not within an organisational boundary, but instead within aproject boundary. The most obvious example is live music performance and artist touring because variousorganisations, facilities, infrastructure and people come together for the duration of the festival or tour. Some keyorganisations such as promotion companies are mainly concerned with putting together such music “projects”.
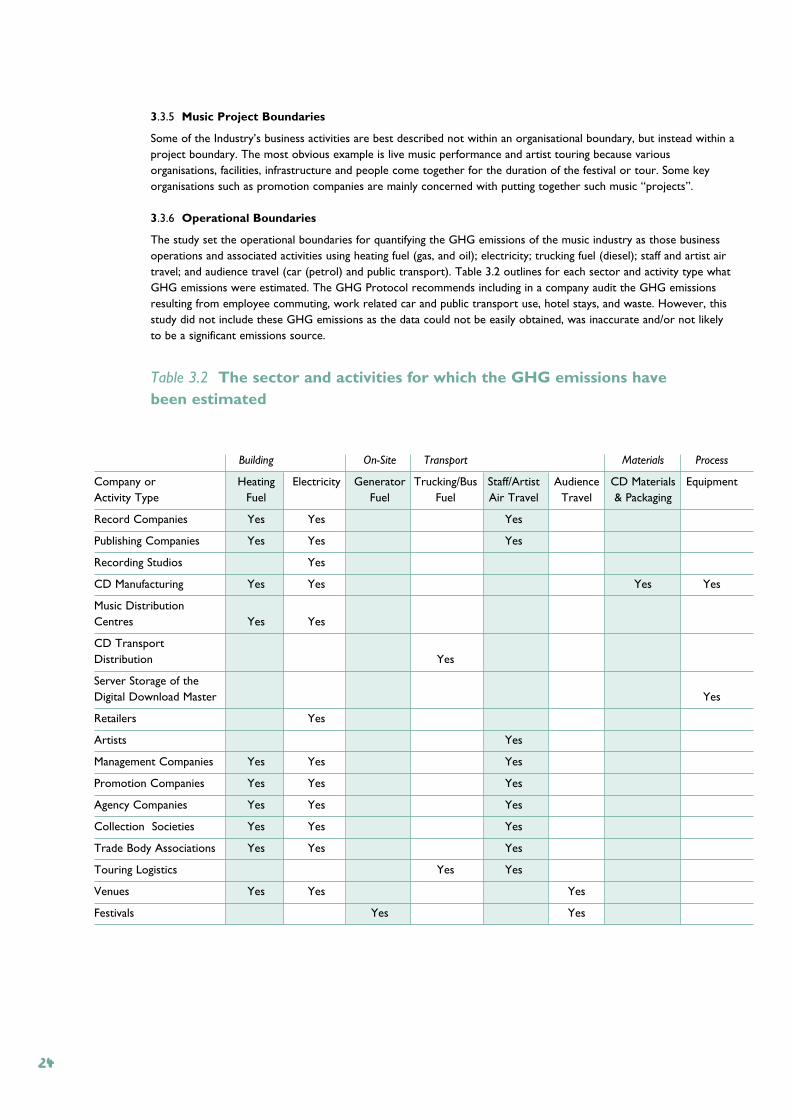
3.3.6 Operational Boundaries
The study set the operational boundaries for quantifying the GHG emissions of the music industry as those businessoperations and associated activities using heating fuel (gas, and oil); electricity; trucking fuel (diesel); staff and artist airtravel; and audience travel (car (petrol) and public transport). Table 3.2 outlines for each sector and activity type whatGHG emissions were estimated. The GHG Protocol recommends including in a company audit the GHG emissionsresulting from employee commuting, work related car and public transport use, hotel stays, and waste. However, thisstudy did not include these GHG emissions as the data could not be easily obtained, was inaccurate and/or not likelyto be a significant emissions source.
Table 3.2 The sector and activities for which the GHG emissions have been estimated
Building On-Site Transport Materials Process
Company or Heating Electricity Generator Trucking/Bus Staff/Artist Audience CD Materials EquipmentActivity Type Fuel Fuel Fuel Air Travel Travel & Packaging
Record Companies Yes Yes Yes
Publishing Companies Yes Yes Yes
Recording Studios Yes
CD Manufacturing Yes Yes Yes Yes
Music Distribution Centres Yes Yes
CD Transport Distribution Yes
Server Storage of the Digital Download Master Yes
Retailers Yes
Artists Yes
Management Companies Yes Yes Yes
Promotion Companies Yes Yes Yes
Agency Companies Yes Yes Yes
Collection Societies Yes Yes Yes
Trade Body Associations Yes Yes Yes
Touring Logistics Yes Yes
Venues Yes Yes Yes
Festivals Yes Yes
24
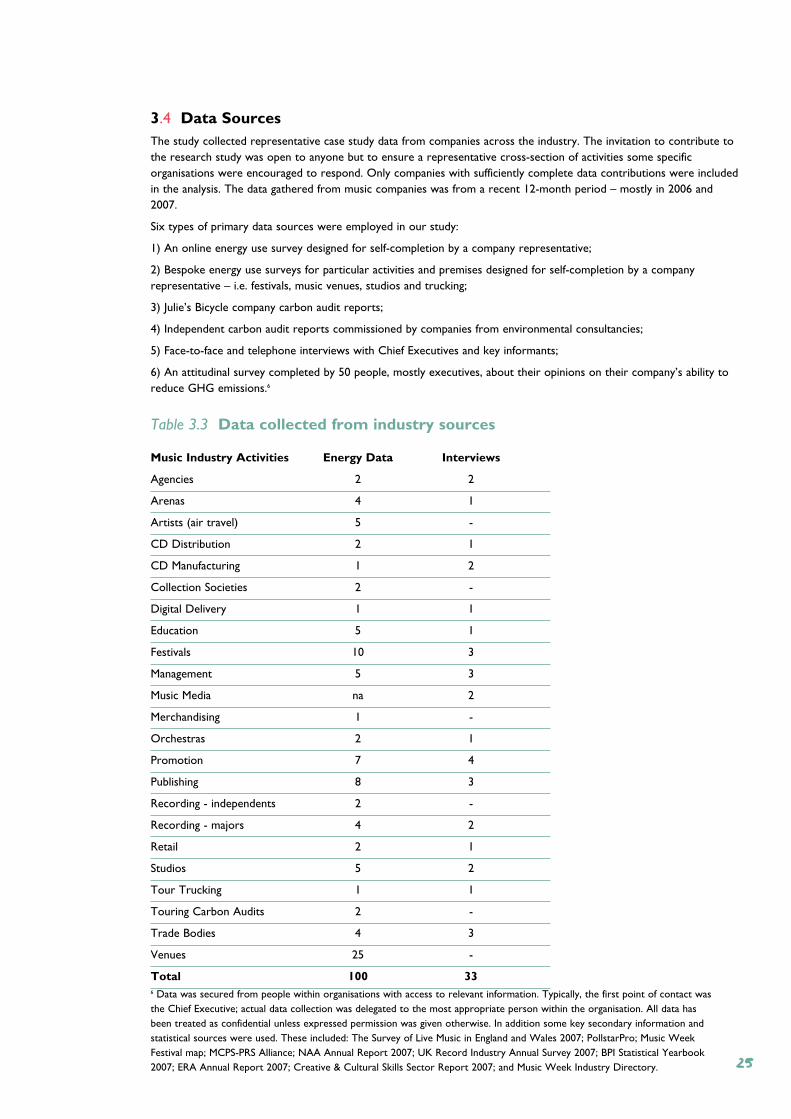
3.4 Data SourcesThe study collected representative case study data from companies across the industry. The invitation to contribute tothe research study was open to anyone but to ensure a representative cross-section of activities some specificorganisations were encouraged to respond. Only companies with sufficiently complete data contributions were includedin the analysis. The data gathered from music companies was from a recent 12-month period – mostly in 2006 and2007.
Six types of primary data sources were employed in our study:
1) An online energy use survey designed for self-completion by a company representative;
2) Bespoke energy use surveys for particular activities and premises designed for self-completion by a companyrepresentative – i.e. festivals, music venues, studios and trucking;
3) Julie’s Bicycle company carbon audit reports;
4) Independent carbon audit reports commissioned by companies from environmental consultancies;
5) Face-to-face and telephone interviews with Chief Executives and key informants;
6) An attitudinal survey completed by 50 people, mostly executives, about their opinions on their company’s ability toreduce GHG emissions.6
Table 3.3 Data collected from industry sources
Music Industry Activities Energy Data Interviews
Agencies 2 2
Arenas 4 1
Artists (air travel) 5 -
CD Distribution 2 1
CD Manufacturing 1 2
Collection Societies 2 -
Digital Delivery 1 1
Education 5 1
Festivals 10 3
Management 5 3
Music Media na 2
Merchandising 1 -
Orchestras 2 1
Promotion 7 4
Publishing 8 3
Recording - independents 2 -
Recording - majors 4 2
Retail 2 1
Studios 5 2
Tour Trucking 1 1
Touring Carbon Audits 2 -
Trade Bodies 4 3
Venues 25 -
Total 100 336 Data was secured from people within organisations with access to relevant information. Typically, the first point of contact wasthe Chief Executive; actual data collection was delegated to the most appropriate person within the organisation. All data hasbeen treated as confidential unless expressed permission was given otherwise. In addition some key secondary information andstatistical sources were used. These included: The Survey of Live Music in England and Wales 2007; PollstarPro; Music WeekFestival map; MCPS-PRS Alliance; NAA Annual Report 2007; UK Record Industry Annual Survey 2007; BPI Statistical Yearbook2007; ERA Annual Report 2007; Creative & Cultural Skills Sector Report 2007; and Music Week Industry Directory. 25
3.5 Data Assumptions and QualityThis is the first time the majority of companies have been asked to provide this sort of data on UK music industryGHG emissions. Many organisations had difficulty providing accurate data (such as kilowatt hours of building energyuse and itineraries for business travel) because currently this information is not being systematically saved or filed. Ourresearch team assisted companies as much as possible to help improve the quality of data contributed to the study andmade suggestions for continued self-monitoring.
3.5.1 CD Manufacturing and Distribution
We collected case study data on record companies, recording studios, distribution centres and retail to build up apicture of the GHG emissions of CD production. In addition, we used two earlier studies on CD production done inthe late 1990s. The first study was an assessment of the environmental impact of different CD materials and thesecond was a full lifecycle assessment of a CD from recording through distribution.
3.5.2 Building Energy Use
As much as possible the study sought information on the energy use of buildings occupied by the industry, but usedproxies where this information was not available. The two main proxies for energy use were:
1) Typical practice energy benchmarks for buildings based on building type (Chartered Institute of Building ServiceEngineers Guidance) and floor area (CIBSE, 2004).
2) Average price per kilowatt hour of electricity and gas divided by annual energy expenditure.
In a number of cases music business activities will not be the sole occupier or user of the building. In these instances aproportion of the buildings’ energy use was attributed to the industry. For example, 56% of the estimated annualenergy used by arenas was attributed to the music industry because 56% of events at arenas are music events (NAA,2007). This approach of apportioning a percentage of building energy use to the music industry was taken for othertypes of music venues as well as retail outlets.
Significant assumptions needed to be made about building energy use for music retail. We estimated the floor arearetail space based on the type of store together with information from the ERA and BPI on number of retail outlets bytype. The CIBSE building type energy benchmark used was a catalogue store, as this was the closest approximation fora music retail outlet (CIBSE, 2004). Many CDs are sold by supermarkets but a supermarket would not be an accuratebenchmark because of the large energy demand for electricity for refrigeration, which CD displays clearly do notrequire.
3.5.3 Music Venues
There are two basic classifications of music venues – primary and secondary venues. Primary venues are those forwhich hosting live music is an important business activity. Secondary venues are those for which music is an ancillaryrevenue stream – for example, student unions, leisure centres, community and church halls, cafes, clubs, restaurantsand hotels.
Information on music venues is highly fragmented in terms of the types of venues, audience capacity, and regularity ofhosting music events. Because venues vary in the extent they are used for live music performance we developed acategorisation system for determining the percentage of venue emissions that should be attributed to the musicindustry. These venue numbers and types helped inform the estimation of audience numbers.
3.5.4 Music Festivals
Music festivals vary quite significantly in character from, for example, a 3-day music event on a Greenfield site (i.e. inthe countryside) to a music series of live performances hosted in venues throughout a town or city. A music festivalmight also be a series of events hosted in particular outdoor spaces through the summer months, such as those at TheEden Project, Hampton Court Palace or English Heritage estates.
This diversity makes it very difficult to then analyse these events in terms of GHG emissions. The data on festivals isalso fragmented and not easily obtainable. We used the Music Week Festival map together with 10 festival case studiesconducted for this project to make estimates for the total number of festivals and their GHG emissions.
3.5.5 Audience Travel
Audience travel is influenced by the frequency of artist performances, the type and size of event (e.g. arena concert,music festival, local music venue) and the location of the music venue, especially in relation to public transport links.This study made a number of assumptions, informed by the case study data and industry sources, in order to provide
26
an indication of the GHG emissions arising from audience travel to live performances including:
- Number of artist tours per year;
- Audience size for each tour;
- Type of venue;
- Proportions of audience travel by major transport modes;
- Average distance travelled by mode;
- Vehicle fuel efficiency.
More detailed information would allow us to refine and increase the accuracy of the GHG emissions associated withaudience travel.
3.5.6 Business Travel
There remains substantial scientific uncertainty on how to weight the emission impact of air travel. The approachtaken for this study was to calculate business travel based on standard categories that include UK domestic flights(average <300 miles one-way), short haul (average 600 miles one-way), or long haul (> 4,000 miles one-way). We didnot include the radiative forcing effects of air travel in terms of climate impact, as there is not yet scientific consensuson this issue. We do consider a scenario for weighting the GHG emissions of business as opposed to economy airtravel (see Box 6.3). An argument can be made that business class passengers have a greater climate impact thaneconomy passengers because they are allowed a heavier baggage limit, have larger seats and are provided additionalservices. These all add weight to the plane as well as reduce the overall occupancy capacity of the plane and mighttherefore generate higher per capita emissions.
3.6 SummaryThe methodological approach taken by the study has been to:
- Examine the supply chain of the two core areas of the industry: music recording and live performance. Theemphasis has been on estimating the emissions associated with the UK market, as this is the initial priority forindustry climate change action;
- Use company case data from over 100 industry sources and interviews with over 30 Chief Executives and keyinformants in order to indicatively estimate the GHG emissions of the industry;
- Use the GHG Protocol as guidance for accounting the GHG emissions of music companies and activities;
- Go beyond the corporate boundary set in the GHG Protocol to include audience travel as these GHGemissions are significant, related to the industry and the industry has the ability to influence them;
- Include international touring as decision-makers in the UK can influence the GHG emissions.
The study has estimated the GHG emissions of the music industry from building energy use (offices, studios, venues,shops, warehouses); CD materials, manufacturing and distribution; servers storing the digital download master; staffand artists’ international travel; tour trucks and buses; and audience travel.
At this first stage of research the study has not attempted to estimated the GHG emissions from: internationalrecorded music sales; musical instruments & equipment; music listening devices; non-music merchandise; musiceducation & training; music media (print and digital) or community music projects.
27

28
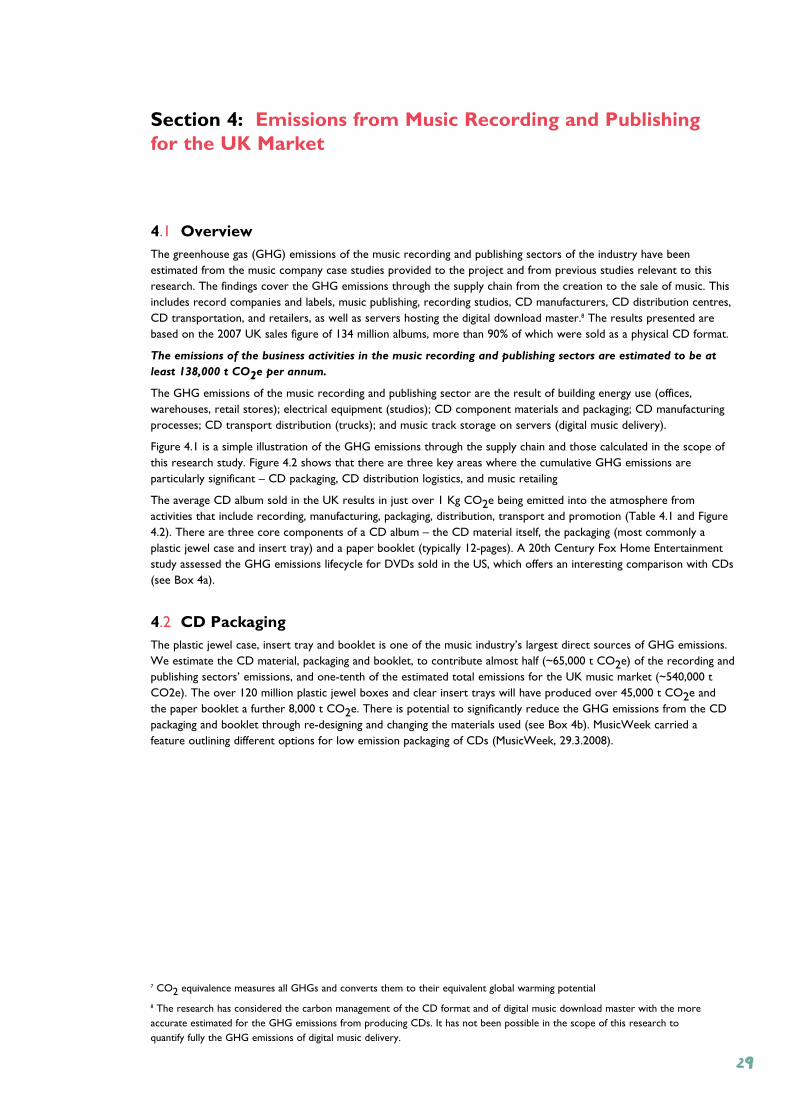
4.1 OverviewThe greenhouse gas (GHG) emissions of the music recording and publishing sectors of the industry have beenestimated from the music company case studies provided to the project and from previous studies relevant to thisresearch. The findings cover the GHG emissions through the supply chain from the creation to the sale of music. Thisincludes record companies and labels, music publishing, recording studios, CD manufacturers, CD distribution centres,CD transportation, and retailers, as well as servers hosting the digital download master.8 The results presented arebased on the 2007 UK sales figure of 134 million albums, more than 90% of which were sold as a physical CD format.
The emissions of the business activities in the music recording and publishing sectors are estimated to be at
least 138,000 t CO2e per annum.
The GHG emissions of the music recording and publishing sector are the result of building energy use (offices,warehouses, retail stores); electrical equipment (studios); CD component materials and packaging; CD manufacturingprocesses; CD transport distribution (trucks); and music track storage on servers (digital music delivery).
Figure 4.1 is a simple illustration of the GHG emissions through the supply chain and those calculated in the scope ofthis research study. Figure 4.2 shows that there are three key areas where the cumulative GHG emissions areparticularly significant – CD packaging, CD distribution logistics, and music retailing
The average CD album sold in the UK results in just over 1 Kg CO2e being emitted into the atmosphere fromactivities that include recording, manufacturing, packaging, distribution, transport and promotion (Table 4.1 and Figure4.2). There are three core components of a CD album – the CD material itself, the packaging (most commonly aplastic jewel case and insert tray) and a paper booklet (typically 12-pages). A 20th Century Fox Home Entertainmentstudy assessed the GHG emissions lifecycle for DVDs sold in the US, which offers an interesting comparison with CDs(see Box 4a).
4.2 CD PackagingThe plastic jewel case, insert tray and booklet is one of the music industry’s largest direct sources of GHG emissions.We estimate the CD material, packaging and booklet, to contribute almost half (~65,000 t CO2e) of the recording andpublishing sectors’ emissions, and one-tenth of the estimated total emissions for the UK music market (~540,000 tCO2e). The over 120 million plastic jewel boxes and clear insert trays will have produced over 45,000 t CO2e andthe paper booklet a further 8,000 t CO2e. There is potential to significantly reduce the GHG emissions from the CDpackaging and booklet through re-designing and changing the materials used (see Box 4b). MusicWeek carried afeature outlining different options for low emission packaging of CDs (MusicWeek, 29.3.2008).
Section 4: Emissions from Music Recording and Publishingfor the UK Market
7 CO2 equivalence measures all GHGs and converts them to their equivalent global warming potential
8 The research has considered the carbon management of the CD format and of digital music download master with the moreaccurate estimated for the GHG emissions from producing CDs. It has not been possible in the scope of this research toquantify fully the GHG emissions of digital music delivery.
29
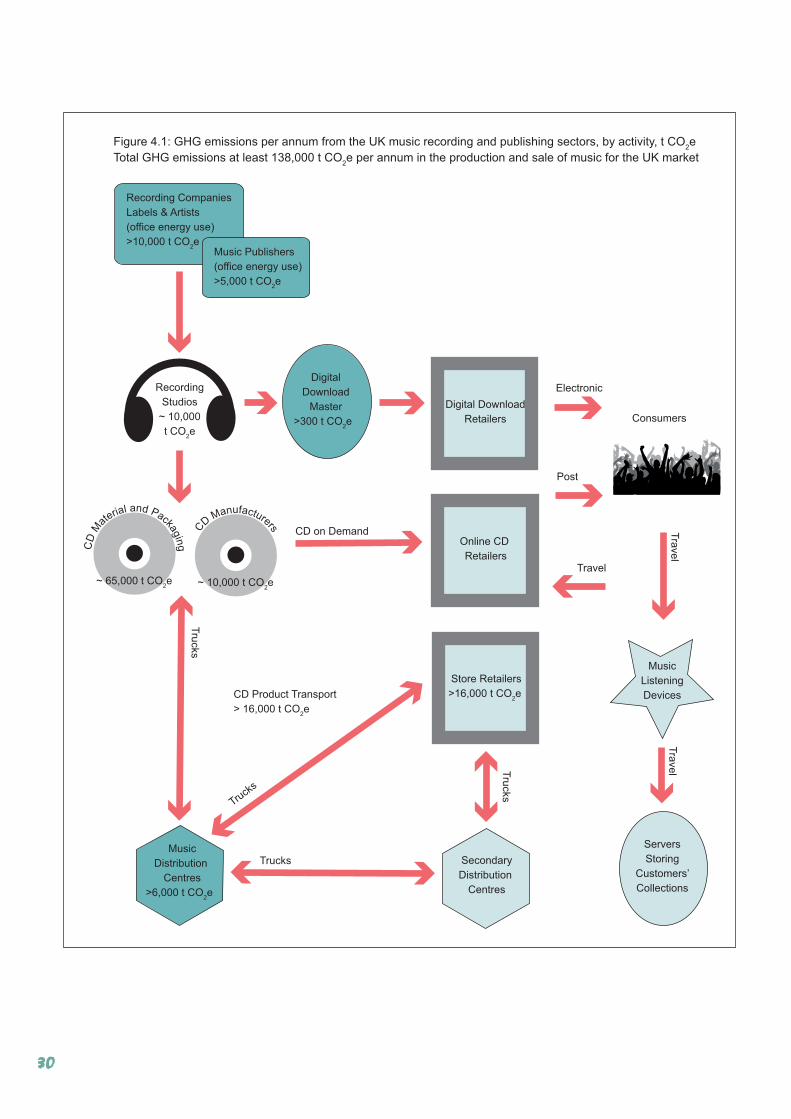
Figure 4.1: GHG emissions per annum from the UK music recording and publishing sectors, by activity, t CO2e
Total GHG emissions at least 138,000 t CO2e per annum in the production and sale of music for the UK market
CD
M
aterial and Packag
ing
~ 65,000 t CO2e
C
D Manufacturers
~ 10,000 t CO2e
Online CD
Retailers
Recording
Studios
~ 10,000
t CO2e
Music
Distribution
Centres
>6,000 t CO2e
Secondary
Distribution
Centres
Music
Listening
Devices
Digital
Download
Master
>300 t CO2e
Servers
Storing
Customers’
Collections
CD Product Transport
> 16,000 t CO2e
Electronic
Post
Travel
Tra
ve
lT
rave
l
Trucks
Truck
s
Digital Download
Retailers
Store Retailers
>16,000 t CO2e
CD on Demand
Tru
cks
Tru
cks
Recording Companies
Labels & Artists
(office energy use)
>10,000 t CO2e
Music Publishers
(office energy use)
>5,000 t CO2e
Consumers
30
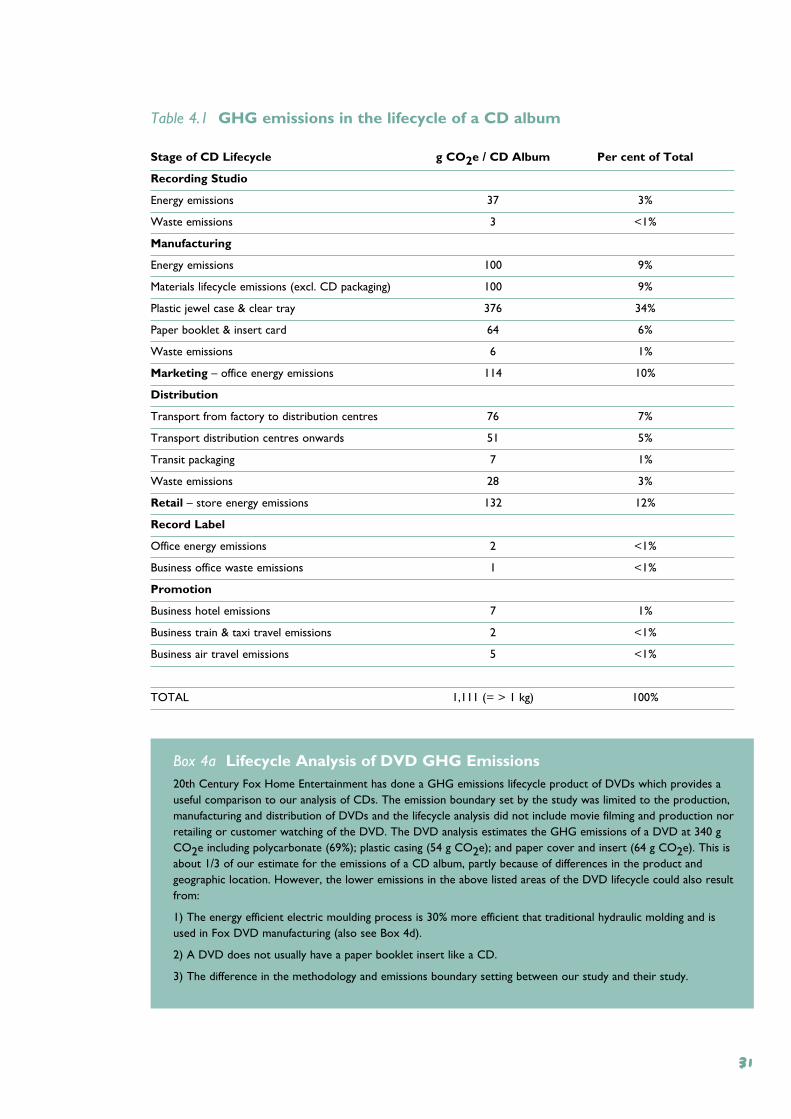
Table 4.1 GHG emissions in the lifecycle of a CD album
Stage of CD Lifecycle g CO2e / CD Album Per cent of Total
Recording Studio
Energy emissions 37 3%
Waste emissions 3 <1%
Manufacturing
Energy emissions 100 9%
Materials lifecycle emissions (excl. CD packaging) 100 9%
Plastic jewel case & clear tray 376 34%
Paper booklet & insert card 64 6%
Waste emissions 6 1%
Marketing – office energy emissions 114 10%
Distribution
Transport from factory to distribution centres 76 7%
Transport distribution centres onwards 51 5%
Transit packaging 7 1%
Waste emissions 28 3%
Retail – store energy emissions 132 12%
Record Label
Office energy emissions 2 <1%
Business office waste emissions 1 <1%
Promotion
Business hotel emissions 7 1%
Business train & taxi travel emissions 2 <1%
Business air travel emissions 5 <1%
TOTAL 1,111 (= > 1 kg) 100%
Box 4a Lifecycle Analysis of DVD GHG Emissions 20th Century Fox Home Entertainment has done a GHG emissions lifecycle product of DVDs which provides auseful comparison to our analysis of CDs. The emission boundary set by the study was limited to the production,manufacturing and distribution of DVDs and the lifecycle analysis did not include movie filming and production norretailing or customer watching of the DVD. The DVD analysis estimates the GHG emissions of a DVD at 340 gCO2e including polycarbonate (69%); plastic casing (54 g CO2e); and paper cover and insert (64 g CO2e). This isabout 1/3 of our estimate for the emissions of a CD album, partly because of differences in the product andgeographic location. However, the lower emissions in the above listed areas of the DVD lifecycle could also resultfrom:
1) The energy efficient electric moulding process is 30% more efficient that traditional hydraulic molding and isused in Fox DVD manufacturing (also see Box 4d).
2) A DVD does not usually have a paper booklet insert like a CD.
3) The difference in the methodology and emissions boundary setting between our study and their study.
31
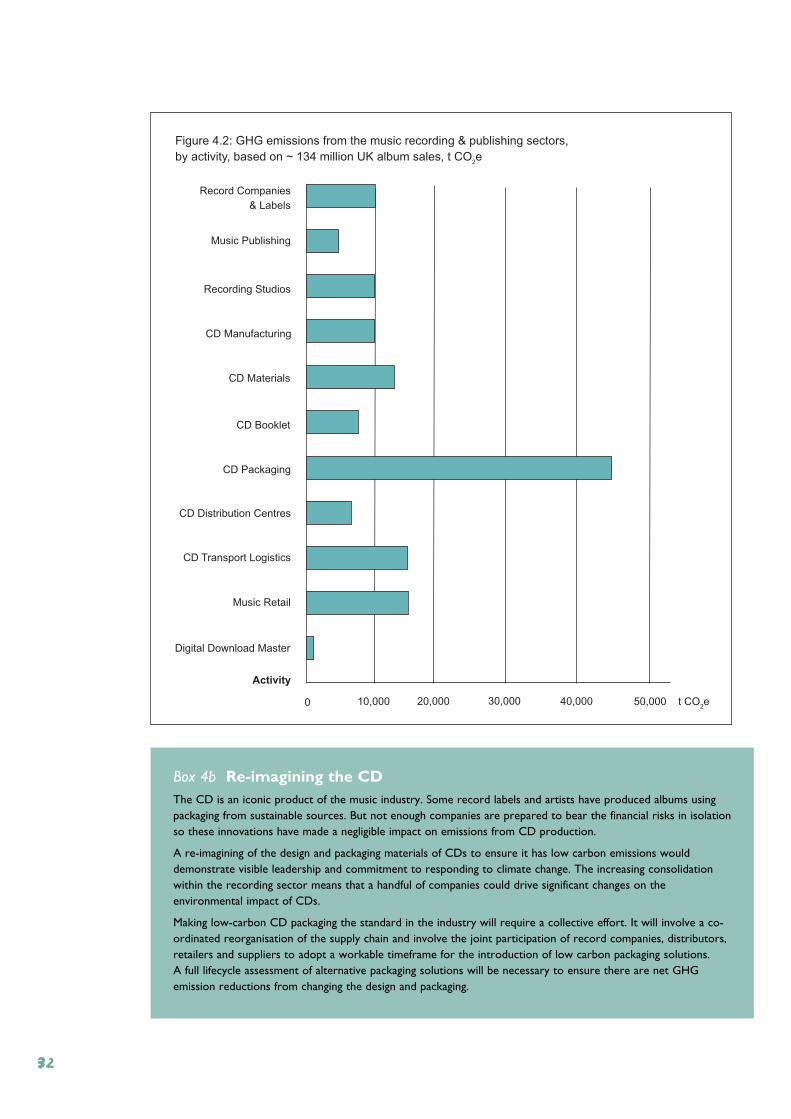
Box 4b Re-imagining the CDThe CD is an iconic product of the music industry. Some record labels and artists have produced albums usingpackaging from sustainable sources. But not enough companies are prepared to bear the financial risks in isolationso these innovations have made a negligible impact on emissions from CD production.
A re-imagining of the design and packaging materials of CDs to ensure it has low carbon emissions woulddemonstrate visible leadership and commitment to responding to climate change. The increasing consolidationwithin the recording sector means that a handful of companies could drive significant changes on theenvironmental impact of CDs.
Making low-carbon CD packaging the standard in the industry will require a collective effort. It will involve a co-ordinated reorganisation of the supply chain and involve the joint participation of record companies, distributors,retailers and suppliers to adopt a workable timeframe for the introduction of low carbon packaging solutions. A full lifecycle assessment of alternative packaging solutions will be necessary to ensure there are net GHGemission reductions from changing the design and packaging.
Figure 4.2: GHG emissions from the music recording & publishing sectors,
by activity, based on ~ 134 million UK album sales, t CO2e
CD Transport Logistics
CD Distribution Centres
CD Packaging
CD Booklet
CD Materials
CD Manufacturing
Recording Studios
Music Publishing
Record Companies
& Labels
0 10,000 20,000 30,000 40,000 50,000 t CO2e
Digital Download Master
Music Retail
Activity
32
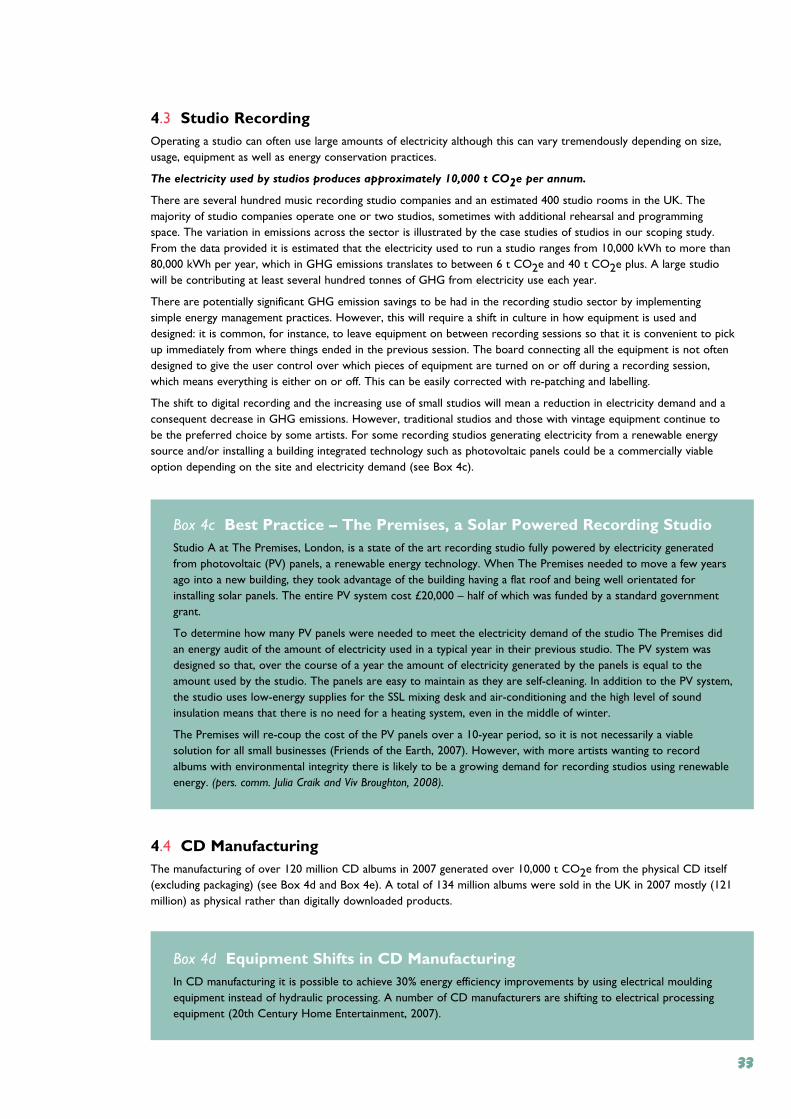
4.3 Studio RecordingOperating a studio can often use large amounts of electricity although this can vary tremendously depending on size,usage, equipment as well as energy conservation practices.
The electricity used by studios produces approximately 10,000 t CO2e per annum.
There are several hundred music recording studio companies and an estimated 400 studio rooms in the UK. Themajority of studio companies operate one or two studios, sometimes with additional rehearsal and programmingspace. The variation in emissions across the sector is illustrated by the case studies of studios in our scoping study.From the data provided it is estimated that the electricity used to run a studio ranges from 10,000 kWh to more than80,000 kWh per year, which in GHG emissions translates to between 6 t CO2e and 40 t CO2e plus. A large studiowill be contributing at least several hundred tonnes of GHG from electricity use each year.
There are potentially significant GHG emission savings to be had in the recording studio sector by implementingsimple energy management practices. However, this will require a shift in culture in how equipment is used anddesigned: it is common, for instance, to leave equipment on between recording sessions so that it is convenient to pickup immediately from where things ended in the previous session. The board connecting all the equipment is not oftendesigned to give the user control over which pieces of equipment are turned on or off during a recording session,which means everything is either on or off. This can be easily corrected with re-patching and labelling.
The shift to digital recording and the increasing use of small studios will mean a reduction in electricity demand and aconsequent decrease in GHG emissions. However, traditional studios and those with vintage equipment continue tobe the preferred choice by some artists. For some recording studios generating electricity from a renewable energysource and/or installing a building integrated technology such as photovoltaic panels could be a commercially viableoption depending on the site and electricity demand (see Box 4c).
Box 4c Best Practice – The Premises, a Solar Powered Recording StudioStudio A at The Premises, London, is a state of the art recording studio fully powered by electricity generatedfrom photovoltaic (PV) panels, a renewable energy technology. When The Premises needed to move a few yearsago into a new building, they took advantage of the building having a flat roof and being well orientated forinstalling solar panels. The entire PV system cost £20,000 – half of which was funded by a standard governmentgrant.
To determine how many PV panels were needed to meet the electricity demand of the studio The Premises didan energy audit of the amount of electricity used in a typical year in their previous studio. The PV system wasdesigned so that, over the course of a year the amount of electricity generated by the panels is equal to theamount used by the studio. The panels are easy to maintain as they are self-cleaning. In addition to the PV system,the studio uses low-energy supplies for the SSL mixing desk and air-conditioning and the high level of soundinsulation means that there is no need for a heating system, even in the middle of winter.
The Premises will re-coup the cost of the PV panels over a 10-year period, so it is not necessarily a viablesolution for all small businesses (Friends of the Earth, 2007). However, with more artists wanting to recordalbums with environmental integrity there is likely to be a growing demand for recording studios using renewableenergy. (pers. comm. Julia Craik and Viv Broughton, 2008).
4.4 CD ManufacturingThe manufacturing of over 120 million CD albums in 2007 generated over 10,000 t CO2e from the physical CD itself(excluding packaging) (see Box 4d and Box 4e). A total of 134 million albums were sold in the UK in 2007 mostly (121million) as physical rather than digitally downloaded products.
Box 4d Equipment Shifts in CD ManufacturingIn CD manufacturing it is possible to achieve 30% energy efficiency improvements by using electrical mouldingequipment instead of hydraulic processing. A number of CD manufacturers are shifting to electrical processingequipment (20th Century Home Entertainment, 2007).
33
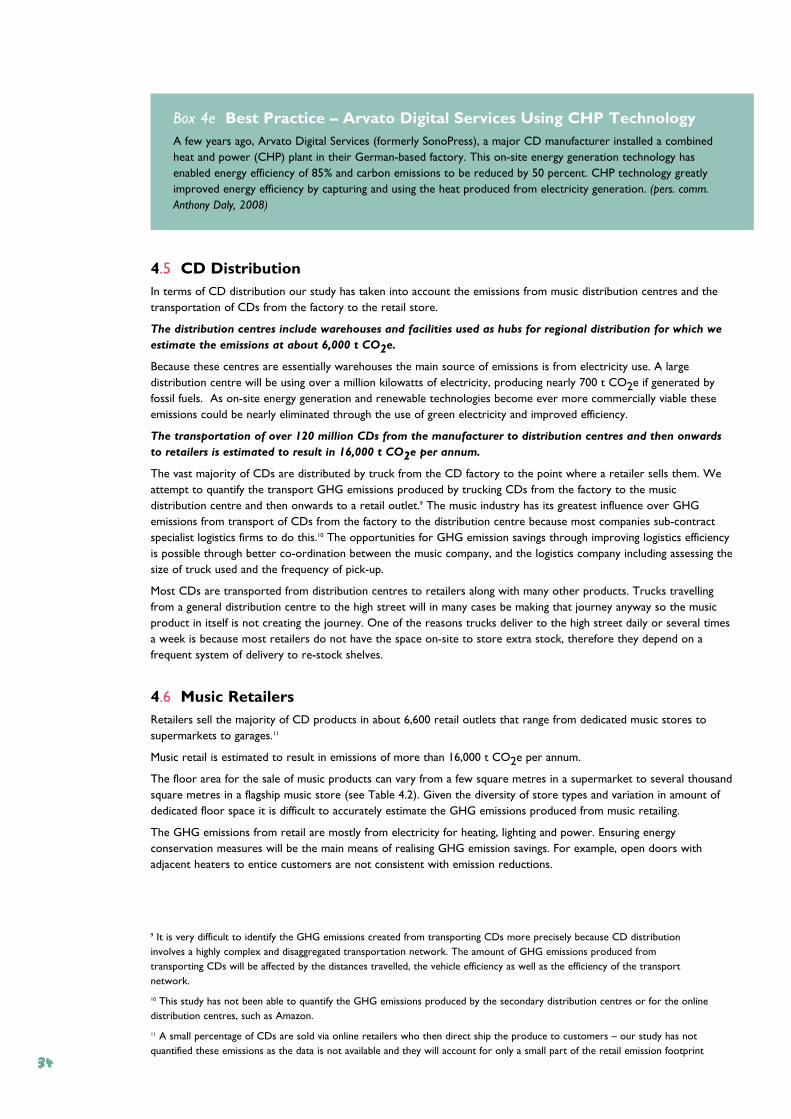
Box 4e Best Practice – Arvato Digital Services Using CHP TechnologyA few years ago, Arvato Digital Services (formerly SonoPress), a major CD manufacturer installed a combinedheat and power (CHP) plant in their German-based factory. This on-site energy generation technology hasenabled energy efficiency of 85% and carbon emissions to be reduced by 50 percent. CHP technology greatlyimproved energy efficiency by capturing and using the heat produced from electricity generation. (pers. comm.Anthony Daly, 2008)
4.5 CD DistributionIn terms of CD distribution our study has taken into account the emissions from music distribution centres and thetransportation of CDs from the factory to the retail store.
The distribution centres include warehouses and facilities used as hubs for regional distribution for which we
estimate the emissions at about 6,000 t CO2e.
Because these centres are essentially warehouses the main source of emissions is from electricity use. A largedistribution centre will be using over a million kilowatts of electricity, producing nearly 700 t CO2e if generated byfossil fuels. As on-site energy generation and renewable technologies become ever more commercially viable theseemissions could be nearly eliminated through the use of green electricity and improved efficiency.
The transportation of over 120 million CDs from the manufacturer to distribution centres and then onwards
to retailers is estimated to result in 16,000 t CO2e per annum.
The vast majority of CDs are distributed by truck from the CD factory to the point where a retailer sells them. Weattempt to quantify the transport GHG emissions produced by trucking CDs from the factory to the musicdistribution centre and then onwards to a retail outlet.9 The music industry has its greatest influence over GHGemissions from transport of CDs from the factory to the distribution centre because most companies sub-contractspecialist logistics firms to do this.10 The opportunities for GHG emission savings through improving logistics efficiencyis possible through better co-ordination between the music company, and the logistics company including assessing thesize of truck used and the frequency of pick-up.
Most CDs are transported from distribution centres to retailers along with many other products. Trucks travellingfrom a general distribution centre to the high street will in many cases be making that journey anyway so the musicproduct in itself is not creating the journey. One of the reasons trucks deliver to the high street daily or several timesa week is because most retailers do not have the space on-site to store extra stock, therefore they depend on afrequent system of delivery to re-stock shelves.
4.6 Music RetailersRetailers sell the majority of CD products in about 6,600 retail outlets that range from dedicated music stores tosupermarkets to garages.11
Music retail is estimated to result in emissions of more than 16,000 t CO2e per annum.
The floor area for the sale of music products can vary from a few square metres in a supermarket to several thousandsquare metres in a flagship music store (see Table 4.2). Given the diversity of store types and variation in amount ofdedicated floor space it is difficult to accurately estimate the GHG emissions produced from music retailing.
The GHG emissions from retail are mostly from electricity for heating, lighting and power. Ensuring energyconservation measures will be the main means of realising GHG emission savings. For example, open doors withadjacent heaters to entice customers are not consistent with emission reductions.
9 It is very difficult to identify the GHG emissions created from transporting CDs more precisely because CD distributioninvolves a highly complex and disaggregated transportation network. The amount of GHG emissions produced fromtransporting CDs will be affected by the distances travelled, the vehicle efficiency as well as the efficiency of the transportnetwork.
10 This study has not been able to quantify the GHG emissions produced by the secondary distribution centres or for the onlinedistribution centres, such as Amazon.
11 A small percentage of CDs are sold via online retailers who then direct ship the produce to customers – our study has notquantified these emissions as the data is not available and they will account for only a small part of the retail emission footprint
34
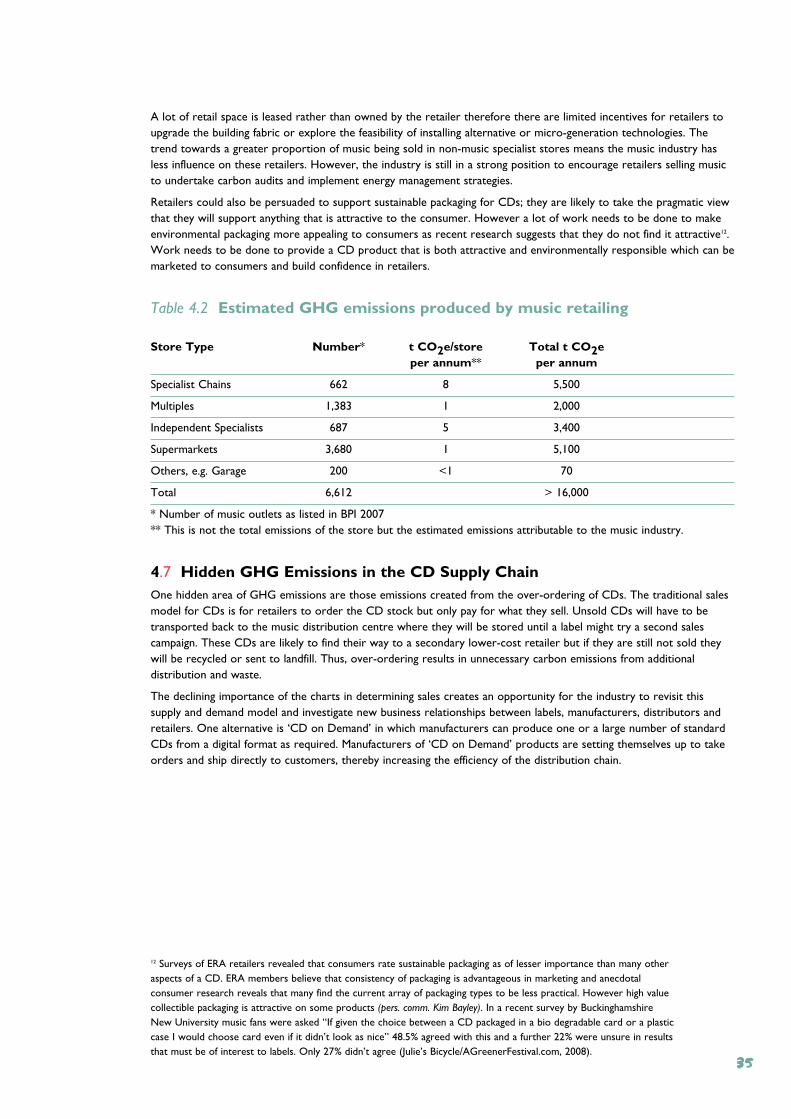
A lot of retail space is leased rather than owned by the retailer therefore there are limited incentives for retailers toupgrade the building fabric or explore the feasibility of installing alternative or micro-generation technologies. Thetrend towards a greater proportion of music being sold in non-music specialist stores means the music industry hasless influence on these retailers. However, the industry is still in a strong position to encourage retailers selling musicto undertake carbon audits and implement energy management strategies.
Retailers could also be persuaded to support sustainable packaging for CDs; they are likely to take the pragmatic viewthat they will support anything that is attractive to the consumer. However a lot of work needs to be done to makeenvironmental packaging more appealing to consumers as recent research suggests that they do not find it attractive12.Work needs to be done to provide a CD product that is both attractive and environmentally responsible which can bemarketed to consumers and build confidence in retailers.
Table 4.2 Estimated GHG emissions produced by music retailing
Store Type Number* t CO2e/store Total t CO2e per annum** per annum
Specialist Chains 662 8 5,500
Multiples 1,383 1 2,000
Independent Specialists 687 5 3,400
Supermarkets 3,680 1 5,100
Others, e.g. Garage 200 <1 70
Total 6,612 > 16,000
* Number of music outlets as listed in BPI 2007 ** This is not the total emissions of the store but the estimated emissions attributable to the music industry.
4.7 Hidden GHG Emissions in the CD Supply ChainOne hidden area of GHG emissions are those emissions created from the over-ordering of CDs. The traditional salesmodel for CDs is for retailers to order the CD stock but only pay for what they sell. Unsold CDs will have to betransported back to the music distribution centre where they will be stored until a label might try a second salescampaign. These CDs are likely to find their way to a secondary lower-cost retailer but if they are still not sold theywill be recycled or sent to landfill. Thus, over-ordering results in unnecessary carbon emissions from additionaldistribution and waste.
The declining importance of the charts in determining sales creates an opportunity for the industry to revisit thissupply and demand model and investigate new business relationships between labels, manufacturers, distributors andretailers. One alternative is ‘CD on Demand’ in which manufacturers can produce one or a large number of standardCDs from a digital format as required. Manufacturers of ‘CD on Demand’ products are setting themselves up to takeorders and ship directly to customers, thereby increasing the efficiency of the distribution chain.
12 Surveys of ERA retailers revealed that consumers rate sustainable packaging as of lesser importance than many otheraspects of a CD. ERA members believe that consistency of packaging is advantageous in marketing and anecdotalconsumer research reveals that many find the current array of packaging types to be less practical. However high valuecollectible packaging is attractive on some products (pers. comm. Kim Bayley). In a recent survey by BuckinghamshireNew University music fans were asked “If given the choice between a CD packaged in a bio degradable card or a plasticcase I would choose card even if it didn’t look as nice” 48.5% agreed with this and a further 22% were unsure in resultsthat must be of interest to labels. Only 27% didn’t agree (Julie’s Bicycle/AGreenerFestival.com, 2008).
35
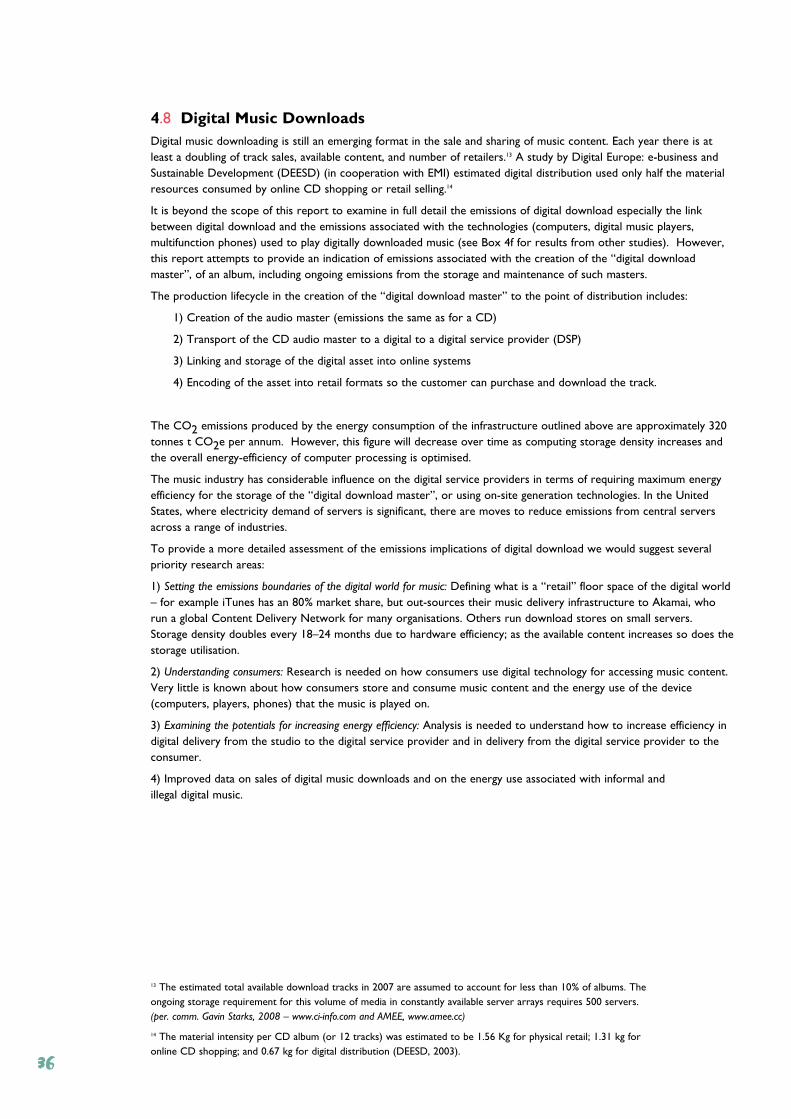
4.8 Digital Music DownloadsDigital music downloading is still an emerging format in the sale and sharing of music content. Each year there is atleast a doubling of track sales, available content, and number of retailers.13 A study by Digital Europe: e-business andSustainable Development (DEESD) (in cooperation with EMI) estimated digital distribution used only half the materialresources consumed by online CD shopping or retail selling.14
It is beyond the scope of this report to examine in full detail the emissions of digital download especially the linkbetween digital download and the emissions associated with the technologies (computers, digital music players,multifunction phones) used to play digitally downloaded music (see Box 4f for results from other studies). However,this report attempts to provide an indication of emissions associated with the creation of the “digital downloadmaster”, of an album, including ongoing emissions from the storage and maintenance of such masters.
The production lifecycle in the creation of the “digital download master” to the point of distribution includes:
1) Creation of the audio master (emissions the same as for a CD)
2) Transport of the CD audio master to a digital to a digital service provider (DSP)
3) Linking and storage of the digital asset into online systems
4) Encoding of the asset into retail formats so the customer can purchase and download the track.
The CO2 emissions produced by the energy consumption of the infrastructure outlined above are approximately 320tonnes t CO2e per annum. However, this figure will decrease over time as computing storage density increases andthe overall energy-efficiency of computer processing is optimised.
The music industry has considerable influence on the digital service providers in terms of requiring maximum energyefficiency for the storage of the “digital download master”, or using on-site generation technologies. In the UnitedStates, where electricity demand of servers is significant, there are moves to reduce emissions from central serversacross a range of industries.
To provide a more detailed assessment of the emissions implications of digital download we would suggest severalpriority research areas:
1) Setting the emissions boundaries of the digital world for music: Defining what is a “retail” floor space of the digital world– for example iTunes has an 80% market share, but out-sources their music delivery infrastructure to Akamai, whorun a global Content Delivery Network for many organisations. Others run download stores on small servers.Storage density doubles every 18–24 months due to hardware efficiency; as the available content increases so does thestorage utilisation.
2) Understanding consumers: Research is needed on how consumers use digital technology for accessing music content.Very little is known about how consumers store and consume music content and the energy use of the device(computers, players, phones) that the music is played on.
3) Examining the potentials for increasing energy efficiency: Analysis is needed to understand how to increase efficiency indigital delivery from the studio to the digital service provider and in delivery from the digital service provider to theconsumer.
4) Improved data on sales of digital music downloads and on the energy use associated with informal and illegal digital music.
13 The estimated total available download tracks in 2007 are assumed to account for less than 10% of albums. Theongoing storage requirement for this volume of media in constantly available server arrays requires 500 servers.(per. comm. Gavin Starks, 2008 – www.ci-info.com and AMEE, www.amee.cc)
14 The material intensity per CD album (or 12 tracks) was estimated to be 1.56 Kg for physical retail; 1.31 kg foronline CD shopping; and 0.67 kg for digital distribution (DEESD, 2003).
36
BOX 4f Digital Media and DematerialisationDigital music delivery shifts the economic value of music content from a physical object (i.e. a CD) to a virtualobject (i.e. a downloaded track). However, the shift to a digital economy does not necessary lead to a reductionin materials use or emissions because digital music requires materials and physical infrastructure of its ownespecially in terms of music devices and IT infrastructure (Berkhout and Hertin, 2004).
Recent research has considered the potential for dematerialisation, in music delivery. This work examines twoscenarios for digital music delivery: 1) a music only audio device (i.e. MP3 player) and 2) a multifunctional portabledevice (i.e. a mobile and MP3 player). Because of fast changes in the development of digital music delivery anddevices it is difficult to predict accurately which business model will result in the greatest dematerialisation. Amultifunctional device has the potential to provide dematerialisation benefits however the process ofminiaturisation and the rapid turnover and replacement rate can counteract these benefits. In addition, it isdifficult to know whether it is the developments in digital music content or the music devices themselves drivingmarket demand, but there is an inter-relationship between the two affecting material consumption (Hogg andJackson, in press).
This research highlights several important issues for the music industry to consider in the development of digitalbusiness models that are environmentally and climate responsible. New business models for digital music contentand devices need to explicitly address and minimise the environmental impacts associated with their services andproducts. This will require corporate partnerships between the music and electronics industry. Furthermore,these industries must work together to influence consumer preferences and behaviour to achieve demateriali-sation and thus reduced GHG emissions.
4.9 Record Companies & LabelsThe emissions from record companies & labels are mainly associated with energy use in offices.
The office energy use for the business operations of record company and labels is at least 10,000
t CO2e per annum.
There are two major groups of record companies: the four record majors, EMI, Sony BMG, Universal and Warner,and more than 800 independent record labels. The four majors are spread across at least twenty buildings and usuallyoccupy whole buildings, usually on long-term leases. In total the energy use in these office buildings will reult inapprox. 6,000 t CO2e per annum. The data provided by the majors indicates that the energy use of their offices isabove typical benchmarks for energy performance and thus closer attention to energy management and energyefficiency investments would bring these offices in line with best practice benchmarks (see Box 4g, Box 4h and Box 4i).
Most of the independent record labels are run from small office operations, sometimes even from home. Anindependent record label will typically be employing a handful of people and may even be a sole trader who might notwork full-time. The GHG emissions produced by these companies will probably range from a few t CO2e to 20 tCO2e per annum. If we assume the average independent label is using about 5 t CO2e per annum then in total theselabels are responsible for about 4,000 t CO2e per annum. The GHG emissions saving opportunities for these smallercompanies are mainly simple measures to conserve energy in the office and engaging these companies in an industry-wide climate strategy could greatly affect GHG emissions as the collective contribution is significant.
Record companies and labels could all consider using green lease rental agreements for their office space tenancy (seeBox 4i). A green lease ensures the property owner invests in the building fabric and energy management of thebuilding to realise energy savings. The implementation of the EU Energy Performance Buildings Directive (EPBD)requiring buildings to be rated for their energy performance will provide a regulatory driver for property owners andoccupiers to reduce energy use.
Box 4g Best Practice – The Green Team at Universal Music UKUniversal Music has set up a ‘Green Team’ of staff across its business activities to strategically integratesustainability into business activities. The team meets regularly to develop actions on a wide-range of sustainabilitytopics, including: operations energy management, green product procurement, a hybrid low emissions taxischeme, recycling, and staff engagement and awareness. (pers. comm. Adrian Lee, 2007).
37
Box 4h Best Practice – NME, IPC Media and the Blue Fin BuildingThe offices of NME (New Musical Express) magazine are located in the Blue Fin Building, London, a high energyperformance building purpose built by IPC Media to house many of its publications. The building has a number offeatures to minimise energy consumption:
• localised metering and monitoring of electricity use;
• a system to automatically turn off lights when light levels rise above 450 lux;
• presence detectors and computer controlled light management;
• external lights five times more efficient than standard external lighting;
• decorative lighting restricted to special occasions so that it accounts for less than 1% of overall light capacity ofthe building;
• walls are all painted white to maximise natural light;
• energy management software is used to regulate and control the heating boilers, hot water and chiller pumps.
IPC Media committed to the building as its new home before its construction and therefore was able to closelyobserve the development from the outset. For example, the company was able to oversee the demolition processto ensure it was energy efficient, that materials did not travel long distances and that waste was certifiedappropriately. During the construction phase close attention was paid to the types of building materials and wastemanagement. The design of the building includes fins to shade the building and a naturally ventilated atrium. Inaddition, the fit-out continued the ‘green’ theme with all consultants being obliged to use natural materials fromsustainable sources, resulting in the use of a significant amount of wood from sustainable sources in thefurniture/fittings but little chrome, and the walls being painted white to maximise natural light.
IPC Media is conducting assessments to ensure that the building is performing to the design standard, as well ascontinuing to look at ways to further improve the environmental performance of the building (pers. comm. JennyNoon 2008).
Box 4i Green LeasesThe short-term nature of tenancy agreements and the fact that energy costs are usually less than 5% of abuilding’s operating costs means there is little incentive for tenants to invest capital in more energy efficientequipment. Furthermore, in multi-tenant buildings the landlord will typically have a service contract for provisionof shared services. There is limited financial incentive for the landlord and tenant to reduce energy consumption.This is a common situation for music companies.
Because the built environment is a significant source of UK carbon emissions there is a real need to address thebarriers for good energy management practices in buildings.
A green lease is one solution that promotes buildings being used and operated in an environmentally efficient way,especially in areas of energy use, water management and waste disposal. The green lease concept has beensuccessfully developed and implemented in Australia. There is great potential for transferring this concept to theUK commercial buildings market.
There are three main ways in which a green lease can be designed to improve the environmental performance ofa building:
1) Attaching a charter of voluntary commitments by the tenant and landlord;
2) Attaching a schedule of contractually binding measures and timetables for environmental improvements forboth landlord and tenant. (The Australian approach);
3) Incorporating measures and timetables into the appropriate covenants of the lease.
Companies in the music industry could demonstrate leadership and good practice by proactively implementinggreen lease agreements in advance of probable government policy in this area.
A green lease model for the UK has been part of the Building Market Transformation programme research at ECI(see www.eci.ox.ac.uk) (pers. comm. Mark Hinnells, 2008).
38
4.10 Music PublishingThe music publishing sector produces GHG emissions mainly from building energy use.
Publishing generates approximately 5,000 t CO2e per annum.
Music publishing is mostly desk-based, and therefore most of the energy use is from the heating, cooling, lighting, andelectrical equipment used in running office buildings. There are approx. 25 medium to large publishing companies. Alarge publishing company is likely to be producing in the scale of 150 t CO2e per annum to run the office. Our datasuggests that a medium publishing company, such as a strong independent publisher, will produce approximately halfthe emissions of a large company. Therefore in total the large and medium companies will create approx. 2,000 tCO2e per annum from office energy use.
In the publishing sector there are hundreds of small publishing companies or sole trader publishers, for whichpublishing will be only one of their income sources. Many of these publishers may be working from home or bemobile. Based on estimates of over 3,000 active publishers and assuming that, on average, the business activities ofthese publishers results in 1 t CO2e each then this category is responsible for approximately 3,000 t CO2e perannum. There are potentially significant benefits in engaging small publishers in energy management strategies (see Box4i).
4.11 SummaryOur research suggests four priority areas for the music recording and publishing sectors to begin to reduce GHGemissions:
1) CD packaging
Creatively re-imagining the CD is an opportunity both to cut emissions and to communicate a clear message aboutclimate responsibility to consumers.
2) CD distribution logistics
There is a sophisticated international trucking network for distributing CDs to customers. There are few viablealternatives in the short-term to diesel trucking for the shipment of goods. Therefore, the industry needs to assess thesupply chain to ensure it is functioning as efficiently as possible.
3) Building energy management
Energy use in buildings – whether they are offices, studios, retail stores or warehouses – is a significant proportion ofthe industry’s GHG emissions. Our research found only a limited number of companies are undertaking buildingenergy management. Starting to learn about the energy use of their buildings is an important first step for musicbusinesses to combat climate change.
4) Digital music delivery and distribution
The industry needs to understand further the environmental implications of digital music and the technology devicesthat are tied to it.
39

40
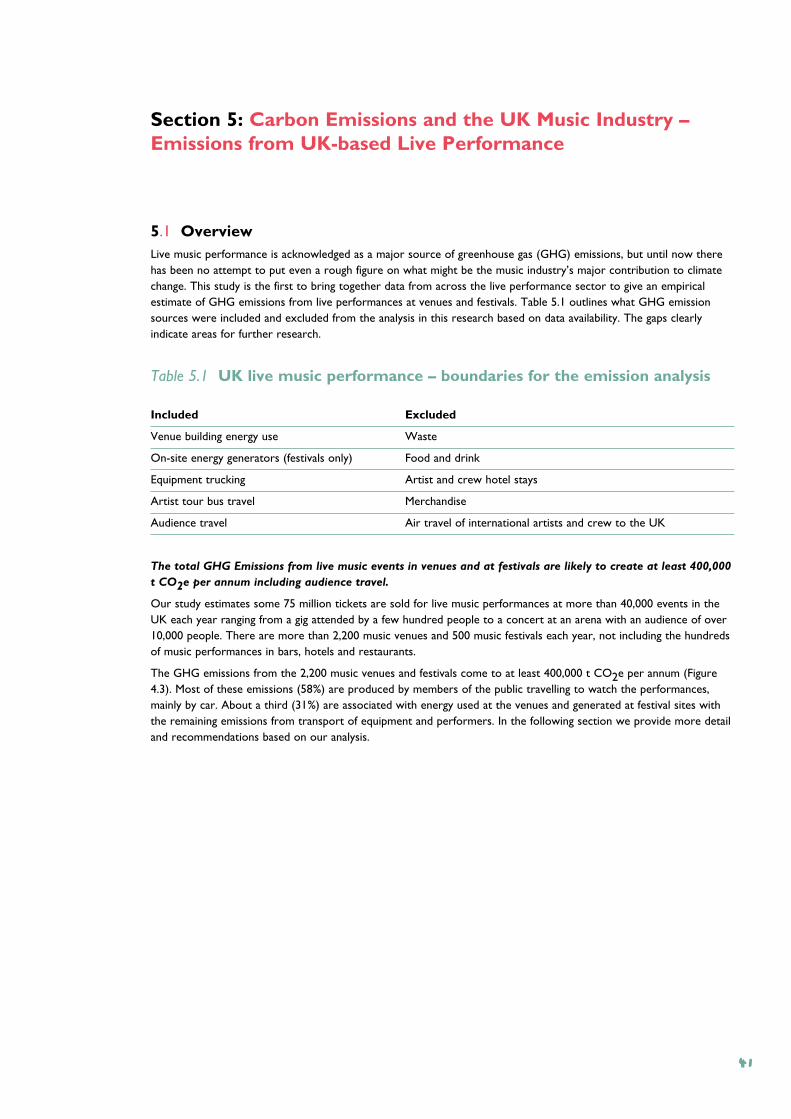
5.1 OverviewLive music performance is acknowledged as a major source of greenhouse gas (GHG) emissions, but until now therehas been no attempt to put even a rough figure on what might be the music industry’s major contribution to climatechange. This study is the first to bring together data from across the live performance sector to give an empiricalestimate of GHG emissions from live performances at venues and festivals. Table 5.1 outlines what GHG emissionsources were included and excluded from the analysis in this research based on data availability. The gaps clearlyindicate areas for further research.
Table 5.1 UK live music performance – boundaries for the emission analysis
Included Excluded
Venue building energy use Waste
On-site energy generators (festivals only) Food and drink
Equipment trucking Artist and crew hotel stays
Artist tour bus travel Merchandise
Audience travel Air travel of international artists and crew to the UK
The total GHG Emissions from live music events in venues and at festivals are likely to create at least 400,000
t CO2e per annum including audience travel.
Our study estimates some 75 million tickets are sold for live music performances at more than 40,000 events in theUK each year ranging from a gig attended by a few hundred people to a concert at an arena with an audience of over10,000 people. There are more than 2,200 music venues and 500 music festivals each year, not including the hundredsof music performances in bars, hotels and restaurants.
The GHG emissions from the 2,200 music venues and festivals come to at least 400,000 t CO2e per annum (Figure4.3). Most of these emissions (58%) are produced by members of the public travelling to watch the performances,mainly by car. About a third (31%) are associated with energy used at the venues and generated at festival sites withthe remaining emissions from transport of equipment and performers. In the following section we provide more detailand recommendations based on our analysis.
Section 5: Carbon Emissions and the UK Music Industry –Emissions from UK-based Live Performance
41
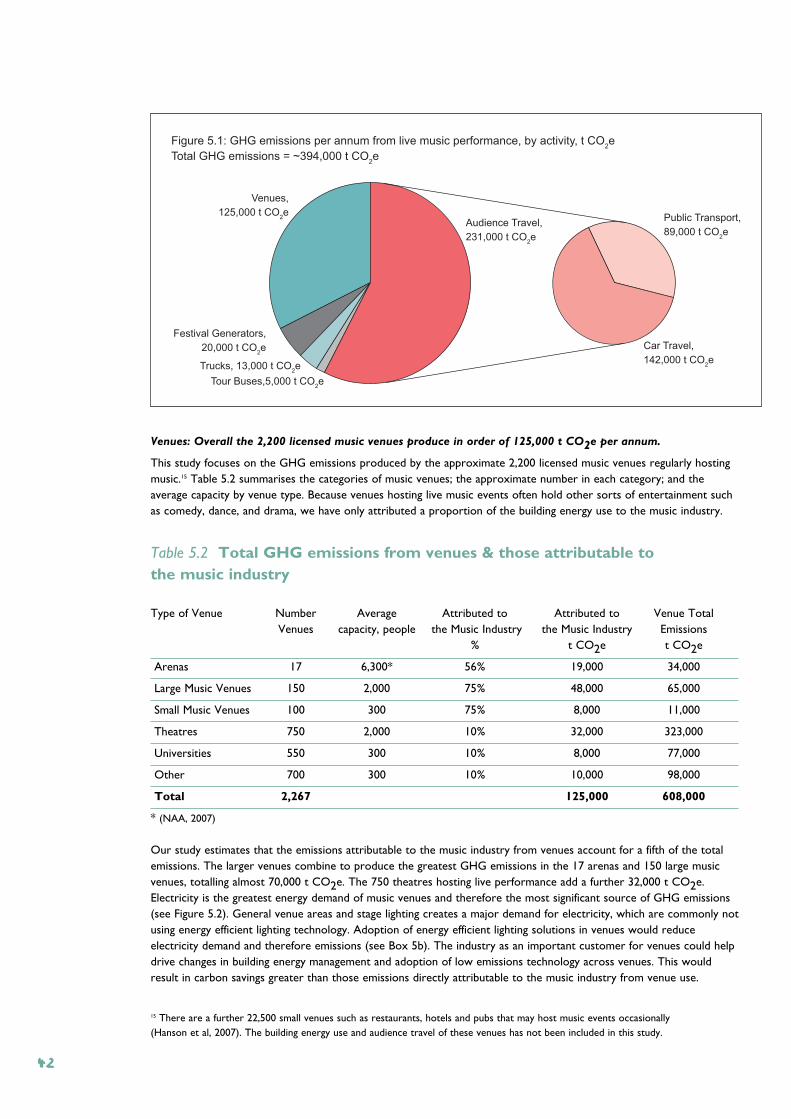
Venues: Overall the 2,200 licensed music venues produce in order of 125,000 t CO2e per annum.
This study focuses on the GHG emissions produced by the approximate 2,200 licensed music venues regularly hostingmusic.15 Table 5.2 summarises the categories of music venues; the approximate number in each category; and theaverage capacity by venue type. Because venues hosting live music events often hold other sorts of entertainment suchas comedy, dance, and drama, we have only attributed a proportion of the building energy use to the music industry.
Table 5.2 Total GHG emissions from venues & those attributable to the music industry
Type of Venue Number Average Attributed to Attributed to Venue TotalVenues capacity, people the Music Industry the Music Industry Emissions
% t CO2e t CO2e
Arenas 17 6,300* 56% 19,000 34,000
Large Music Venues 150 2,000 75% 48,000 65,000
Small Music Venues 100 300 75% 8,000 11,000
Theatres 750 2,000 10% 32,000 323,000
Universities 550 300 10% 8,000 77,000
Other 700 300 10% 10,000 98,000
Total 2,267 125,000 608,000
* (NAA, 2007)
Our study estimates that the emissions attributable to the music industry from venues account for a fifth of the totalemissions. The larger venues combine to produce the greatest GHG emissions in the 17 arenas and 150 large musicvenues, totalling almost 70,000 t CO2e. The 750 theatres hosting live performance add a further 32,000 t CO2e.Electricity is the greatest energy demand of music venues and therefore the most significant source of GHG emissions(see Figure 5.2). General venue areas and stage lighting creates a major demand for electricity, which are commonly notusing energy efficient lighting technology. Adoption of energy efficient lighting solutions in venues would reduceelectricity demand and therefore emissions (see Box 5b). The industry as an important customer for venues could helpdrive changes in building energy management and adoption of low emissions technology across venues. This wouldresult in carbon savings greater than those emissions directly attributable to the music industry from venue use.
Audience Travel,
231,000 t CO2e
Tour Buses,5,000 t CO2e
Trucks, 13,000 t CO2e
Venues,
125,000 t CO2e
Festival Generators,
20,000 t CO2e Car Travel,
142,000 t CO2e
Public Transport,
89,000 t CO2e
Figure 5.1: GHG emissions per annum from live music performance, by activity, t CO2e
Total GHG emissions = ~394,000 t CO2e
15 There are a further 22,500 small venues such as restaurants, hotels and pubs that may host music events occasionally(Hanson et al, 2007). The building energy use and audience travel of these venues has not been included in this study.
42
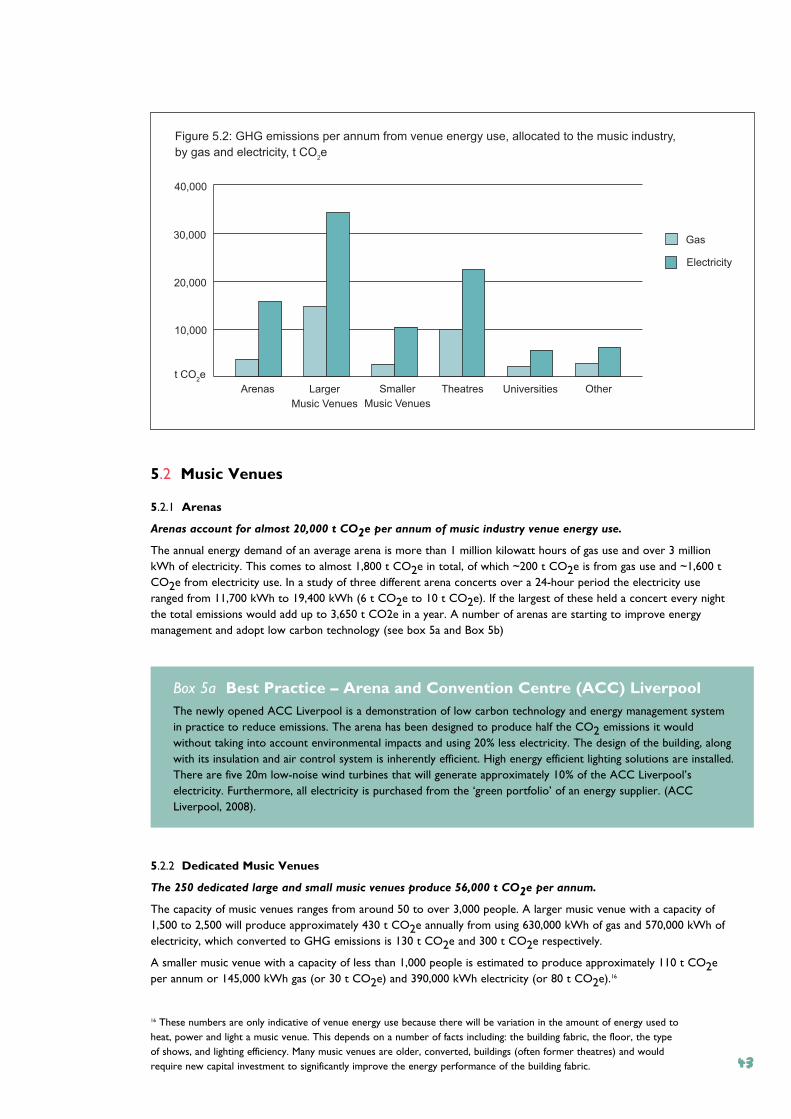
5.2 Music Venues
5.2.1 Arenas
Arenas account for almost 20,000 t CO2e per annum of music industry venue energy use.
The annual energy demand of an average arena is more than 1 million kilowatt hours of gas use and over 3 millionkWh of electricity. This comes to almost 1,800 t CO2e in total, of which ~200 t CO2e is from gas use and ~1,600 tCO2e from electricity use. In a study of three different arena concerts over a 24-hour period the electricity useranged from 11,700 kWh to 19,400 kWh (6 t CO2e to 10 t CO2e). If the largest of these held a concert every nightthe total emissions would add up to 3,650 t CO2e in a year. A number of arenas are starting to improve energymanagement and adopt low carbon technology (see box 5a and Box 5b)
Box 5a Best Practice – Arena and Convention Centre (ACC) Liverpool The newly opened ACC Liverpool is a demonstration of low carbon technology and energy management systemin practice to reduce emissions. The arena has been designed to produce half the CO2 emissions it wouldwithout taking into account environmental impacts and using 20% less electricity. The design of the building, alongwith its insulation and air control system is inherently efficient. High energy efficient lighting solutions are installed.There are five 20m low-noise wind turbines that will generate approximately 10% of the ACC Liverpool’selectricity. Furthermore, all electricity is purchased from the ‘green portfolio’ of an energy supplier. (ACCLiverpool, 2008).
5.2.2 Dedicated Music Venues
The 250 dedicated large and small music venues produce 56,000 t CO2e per annum.
The capacity of music venues ranges from around 50 to over 3,000 people. A larger music venue with a capacity of1,500 to 2,500 will produce approximately 430 t CO2e annually from using 630,000 kWh of gas and 570,000 kWh ofelectricity, which converted to GHG emissions is 130 t CO2e and 300 t CO2e respectively.
A smaller music venue with a capacity of less than 1,000 people is estimated to produce approximately 110 t CO2eper annum or 145,000 kWh gas (or 30 t CO2e) and 390,000 kWh electricity (or 80 t CO2e).16
Larger
Music Venues
Theatres
Figure 5.2: GHG emissions per annum from venue energy use, allocated to the music industry,
by gas and electricity, t CO2e
Smaller
Music Venues
Universities OtherArenas
t CO2e
10,000
20,000
30,000
40,000
Gas
Electricity
16 These numbers are only indicative of venue energy use because there will be variation in the amount of energy used toheat, power and light a music venue. This depends on a number of facts including: the building fabric, the floor, the typeof shows, and lighting efficiency. Many music venues are older, converted, buildings (often former theatres) and wouldrequire new capital investment to significantly improve the energy performance of the building fabric. 43
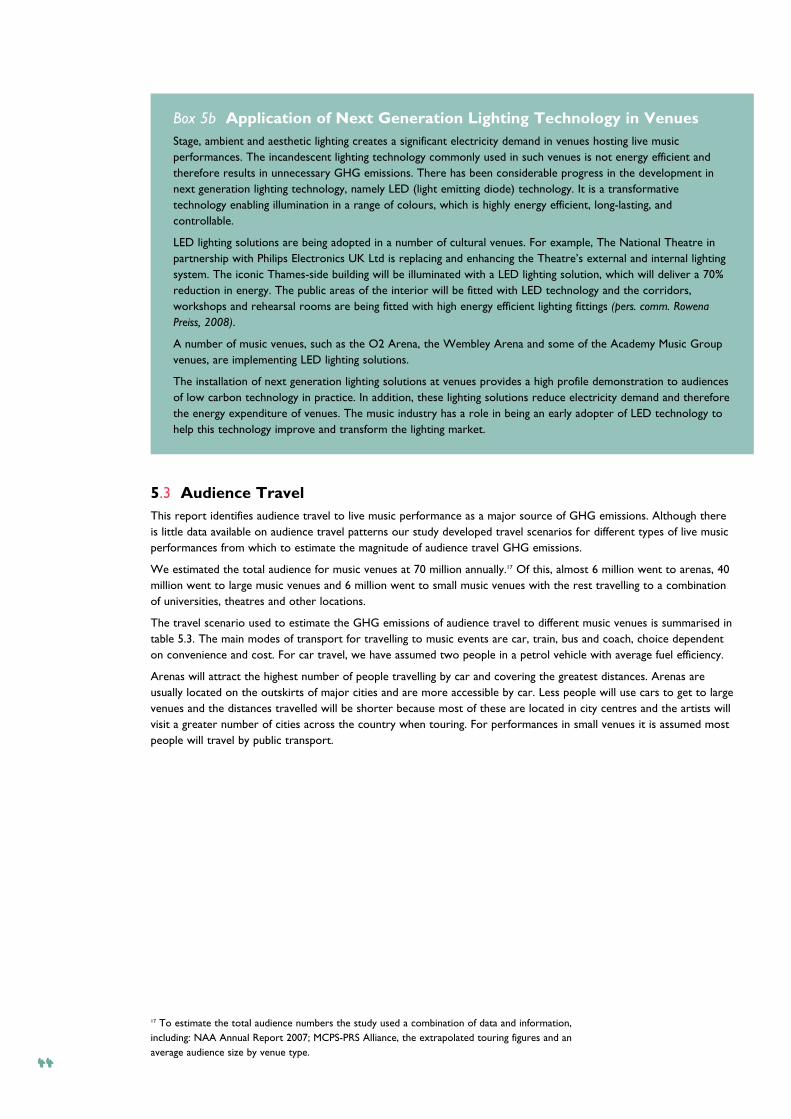
Box 5b Application of Next Generation Lighting Technology in VenuesStage, ambient and aesthetic lighting creates a significant electricity demand in venues hosting live musicperformances. The incandescent lighting technology commonly used in such venues is not energy efficient andtherefore results in unnecessary GHG emissions. There has been considerable progress in the development innext generation lighting technology, namely LED (light emitting diode) technology. It is a transformativetechnology enabling illumination in a range of colours, which is highly energy efficient, long-lasting, andcontrollable.
LED lighting solutions are being adopted in a number of cultural venues. For example, The National Theatre inpartnership with Philips Electronics UK Ltd is replacing and enhancing the Theatre’s external and internal lightingsystem. The iconic Thames-side building will be illuminated with a LED lighting solution, which will deliver a 70%reduction in energy. The public areas of the interior will be fitted with LED technology and the corridors,workshops and rehearsal rooms are being fitted with high energy efficient lighting fittings (pers. comm. RowenaPreiss, 2008).
A number of music venues, such as the O2 Arena, the Wembley Arena and some of the Academy Music Groupvenues, are implementing LED lighting solutions.
The installation of next generation lighting solutions at venues provides a high profile demonstration to audiencesof low carbon technology in practice. In addition, these lighting solutions reduce electricity demand and thereforethe energy expenditure of venues. The music industry has a role in being an early adopter of LED technology tohelp this technology improve and transform the lighting market.
5.3 Audience TravelThis report identifies audience travel to live music performance as a major source of GHG emissions. Although thereis little data available on audience travel patterns our study developed travel scenarios for different types of live musicperformances from which to estimate the magnitude of audience travel GHG emissions.
We estimated the total audience for music venues at 70 million annually.17 Of this, almost 6 million went to arenas, 40million went to large music venues and 6 million went to small music venues with the rest travelling to a combinationof universities, theatres and other locations.
The travel scenario used to estimate the GHG emissions of audience travel to different music venues is summarised intable 5.3. The main modes of transport for travelling to music events are car, train, bus and coach, choice dependenton convenience and cost. For car travel, we have assumed two people in a petrol vehicle with average fuel efficiency.
Arenas will attract the highest number of people travelling by car and covering the greatest distances. Arenas areusually located on the outskirts of major cities and are more accessible by car. Less people will use cars to get to largevenues and the distances travelled will be shorter because most of these are located in city centres and the artists willvisit a greater number of cities across the country when touring. For performances in small venues it is assumed mostpeople will travel by public transport.
17 To estimate the total audience numbers the study used a combination of data and information,including: NAA Annual Report 2007; MCPS-PRS Alliance, the extrapolated touring figures and anaverage audience size by venue type.
44
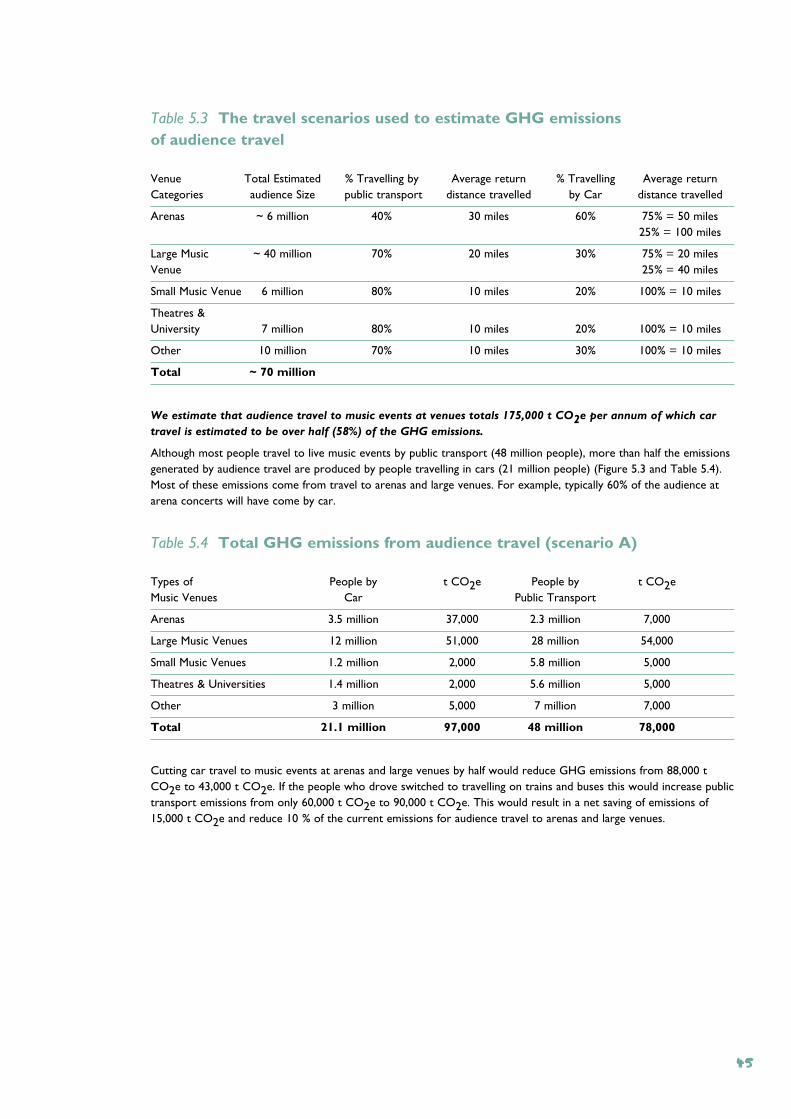
Table 5.3 The travel scenarios used to estimate GHG emissions of audience travel
Venue Total Estimated % Travelling by Average return % Travelling Average returnCategories audience Size public transport distance travelled by Car distance travelled
Arenas ~ 6 million 40% 30 miles 60% 75% = 50 miles25% = 100 miles
Large Music ~ 40 million 70% 20 miles 30% 75% = 20 milesVenue 25% = 40 miles
Small Music Venue 6 million 80% 10 miles 20% 100% = 10 miles
Theatres & University 7 million 80% 10 miles 20% 100% = 10 miles
Other 10 million 70% 10 miles 30% 100% = 10 miles
Total ~ 70 million
We estimate that audience travel to music events at venues totals 175,000 t CO2e per annum of which car
travel is estimated to be over half (58%) of the GHG emissions.
Although most people travel to live music events by public transport (48 million people), more than half the emissionsgenerated by audience travel are produced by people travelling in cars (21 million people) (Figure 5.3 and Table 5.4).Most of these emissions come from travel to arenas and large venues. For example, typically 60% of the audience atarena concerts will have come by car.
Table 5.4 Total GHG emissions from audience travel (scenario A)
Types of People by t CO2e People by t CO2eMusic Venues Car Public Transport
Arenas 3.5 million 37,000 2.3 million 7,000
Large Music Venues 12 million 51,000 28 million 54,000
Small Music Venues 1.2 million 2,000 5.8 million 5,000
Theatres & Universities 1.4 million 2,000 5.6 million 5,000
Other 3 million 5,000 7 million 7,000
Total 21.1 million 97,000 48 million 78,000
Cutting car travel to music events at arenas and large venues by half would reduce GHG emissions from 88,000 tCO2e to 43,000 t CO2e. If the people who drove switched to travelling on trains and buses this would increase publictransport emissions from only 60,000 t CO2e to 90,000 t CO2e. This would result in a net saving of emissions of15,000 t CO2e and reduce 10 % of the current emissions for audience travel to arenas and large venues.
45
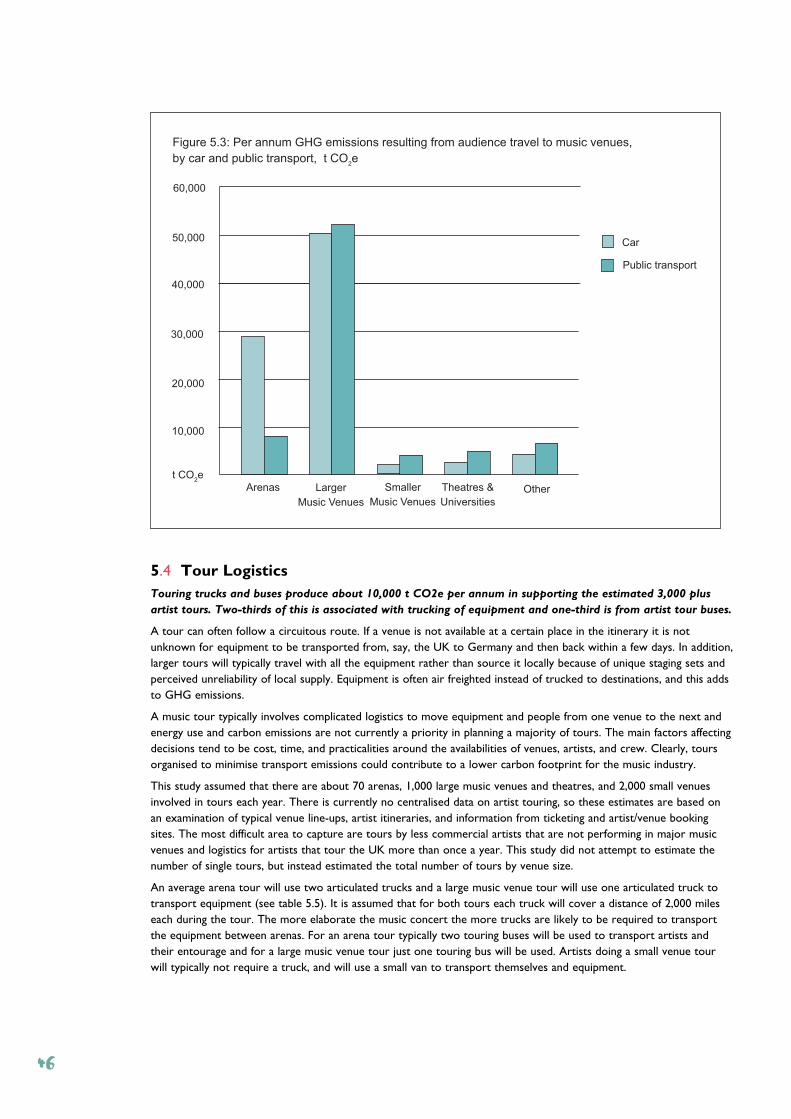
5.4 Tour LogisticsTouring trucks and buses produce about 10,000 t CO2e per annum in supporting the estimated 3,000 plus
artist tours. Two-thirds of this is associated with trucking of equipment and one-third is from artist tour buses.
A tour can often follow a circuitous route. If a venue is not available at a certain place in the itinerary it is notunknown for equipment to be transported from, say, the UK to Germany and then back within a few days. In addition,larger tours will typically travel with all the equipment rather than source it locally because of unique staging sets andperceived unreliability of local supply. Equipment is often air freighted instead of trucked to destinations, and this addsto GHG emissions.
A music tour typically involves complicated logistics to move equipment and people from one venue to the next andenergy use and carbon emissions are not currently a priority in planning a majority of tours. The main factors affectingdecisions tend to be cost, time, and practicalities around the availabilities of venues, artists, and crew. Clearly, toursorganised to minimise transport emissions could contribute to a lower carbon footprint for the music industry.
This study assumed that there are about 70 arenas, 1,000 large music venues and theatres, and 2,000 small venuesinvolved in tours each year. There is currently no centralised data on artist touring, so these estimates are based onan examination of typical venue line-ups, artist itineraries, and information from ticketing and artist/venue bookingsites. The most difficult area to capture are tours by less commercial artists that are not performing in major musicvenues and logistics for artists that tour the UK more than once a year. This study did not attempt to estimate thenumber of single tours, but instead estimated the total number of tours by venue size.
An average arena tour will use two articulated trucks and a large music venue tour will use one articulated truck totransport equipment (see table 5.5). It is assumed that for both tours each truck will cover a distance of 2,000 mileseach during the tour. The more elaborate the music concert the more trucks are likely to be required to transportthe equipment between arenas. For an arena tour typically two touring buses will be used to transport artists andtheir entourage and for a large music venue tour just one touring bus will be used. Artists doing a small venue tourwill typically not require a truck, and will use a small van to transport themselves and equipment.
Larger
Music Venues
Theatres &
Universities
Figure 5.3: Per annum GHG emissions resulting from audience travel to music venues,
by car and public transport, t CO2e
Smaller
Music Venues
OtherArenas
t CO2e
10,000
20,000
30,000
40,000
Car
Public transport
50,000
60,000
46
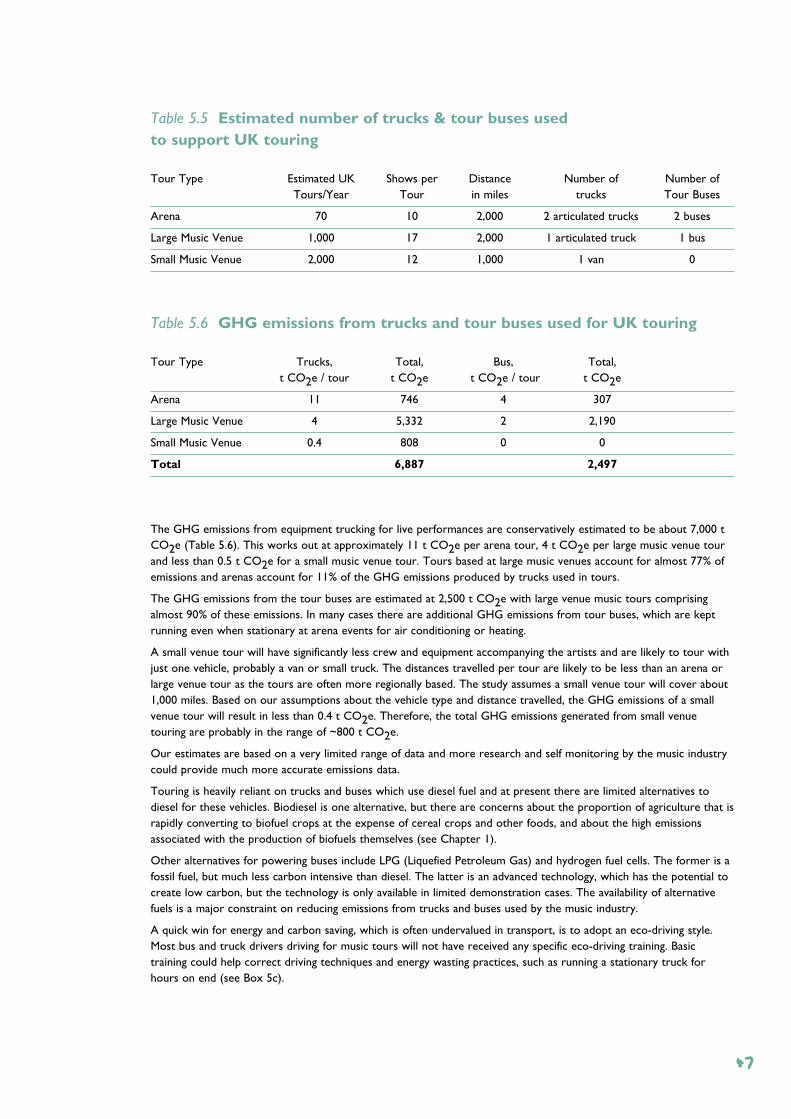
Table 5.5 Estimated number of trucks & tour buses used to support UK touring
Tour Type Estimated UK Shows per Distance Number of Number of Tours/Year Tour in miles trucks Tour Buses
Arena 70 10 2,000 2 articulated trucks 2 buses
Large Music Venue 1,000 17 2,000 1 articulated truck 1 bus
Small Music Venue 2,000 12 1,000 1 van 0
Table 5.6 GHG emissions from trucks and tour buses used for UK touring
Tour Type Trucks, Total, Bus, Total,t CO2e / tour t CO2e t CO2e / tour t CO2e
Arena 11 746 4 307
Large Music Venue 4 5,332 2 2,190
Small Music Venue 0.4 808 0 0
Total 6,887 2,497
The GHG emissions from equipment trucking for live performances are conservatively estimated to be about 7,000 tCO2e (Table 5.6). This works out at approximately 11 t CO2e per arena tour, 4 t CO2e per large music venue tourand less than 0.5 t CO2e for a small music venue tour. Tours based at large music venues account for almost 77% ofemissions and arenas account for 11% of the GHG emissions produced by trucks used in tours.
The GHG emissions from the tour buses are estimated at 2,500 t CO2e with large venue music tours comprisingalmost 90% of these emissions. In many cases there are additional GHG emissions from tour buses, which are keptrunning even when stationary at arena events for air conditioning or heating.
A small venue tour will have significantly less crew and equipment accompanying the artists and are likely to tour withjust one vehicle, probably a van or small truck. The distances travelled per tour are likely to be less than an arena orlarge venue tour as the tours are often more regionally based. The study assumes a small venue tour will cover about1,000 miles. Based on our assumptions about the vehicle type and distance travelled, the GHG emissions of a smallvenue tour will result in less than 0.4 t CO2e. Therefore, the total GHG emissions generated from small venuetouring are probably in the range of ~800 t CO2e.
Our estimates are based on a very limited range of data and more research and self monitoring by the music industrycould provide much more accurate emissions data.
Touring is heavily reliant on trucks and buses which use diesel fuel and at present there are limited alternatives todiesel for these vehicles. Biodiesel is one alternative, but there are concerns about the proportion of agriculture that israpidly converting to biofuel crops at the expense of cereal crops and other foods, and about the high emissionsassociated with the production of biofuels themselves (see Chapter 1).
Other alternatives for powering buses include LPG (Liquefied Petroleum Gas) and hydrogen fuel cells. The former is afossil fuel, but much less carbon intensive than diesel. The latter is an advanced technology, which has the potential tocreate low carbon, but the technology is only available in limited demonstration cases. The availability of alternativefuels is a major constraint on reducing emissions from trucks and buses used by the music industry.
A quick win for energy and carbon saving, which is often undervalued in transport, is to adopt an eco-driving style.Most bus and truck drivers driving for music tours will not have received any specific eco-driving training. Basictraining could help correct driving techniques and energy wasting practices, such as running a stationary truck forhours on end (see Box 5c).
47
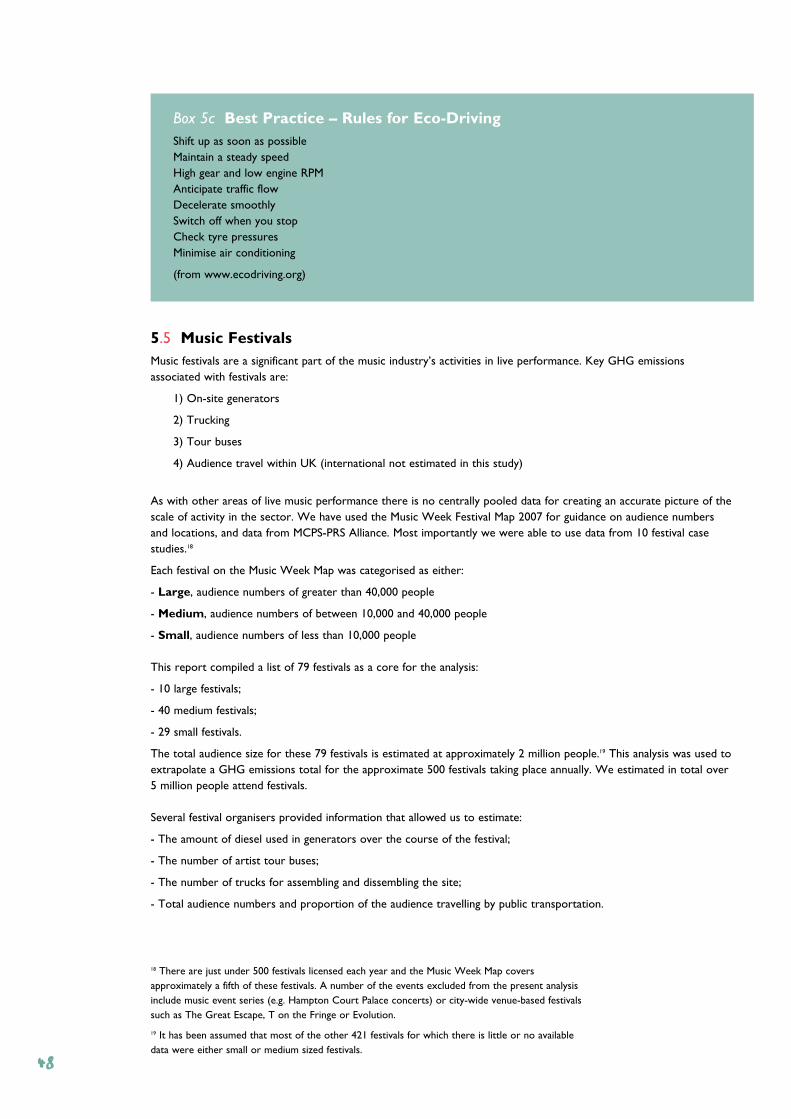
Box 5c Best Practice – Rules for Eco-DrivingShift up as soon as possibleMaintain a steady speedHigh gear and low engine RPMAnticipate traffic flowDecelerate smoothlySwitch off when you stopCheck tyre pressuresMinimise air conditioning
(from www.ecodriving.org)
5.5 Music FestivalsMusic festivals are a significant part of the music industry’s activities in live performance. Key GHG emissionsassociated with festivals are:
1) On-site generators
2) Trucking
3) Tour buses
4) Audience travel within UK (international not estimated in this study)
As with other areas of live music performance there is no centrally pooled data for creating an accurate picture of thescale of activity in the sector. We have used the Music Week Festival Map 2007 for guidance on audience numbersand locations, and data from MCPS-PRS Alliance. Most importantly we were able to use data from 10 festival casestudies.18
Each festival on the Music Week Map was categorised as either:
- Large, audience numbers of greater than 40,000 people
- Medium, audience numbers of between 10,000 and 40,000 people
- Small, audience numbers of less than 10,000 people
This report compiled a list of 79 festivals as a core for the analysis:
- 10 large festivals;
- 40 medium festivals;
- 29 small festivals.
The total audience size for these 79 festivals is estimated at approximately 2 million people.19 This analysis was used toextrapolate a GHG emissions total for the approximate 500 festivals taking place annually. We estimated in total over5 million people attend festivals.
Several festival organisers provided information that allowed us to estimate:
- The amount of diesel used in generators over the course of the festival;
- The number of artist tour buses;
- The number of trucks for assembling and dissembling the site;
- Total audience numbers and proportion of the audience travelling by public transportation.
18 There are just under 500 festivals licensed each year and the Music Week Map coversapproximately a fifth of these festivals. A number of the events excluded from the present analysisinclude music event series (e.g. Hampton Court Palace concerts) or city-wide venue-based festivalssuch as The Great Escape, T on the Fringe or Evolution.
19 It has been assumed that most of the other 421 festivals for which there is little or no availabledata were either small or medium sized festivals.
48
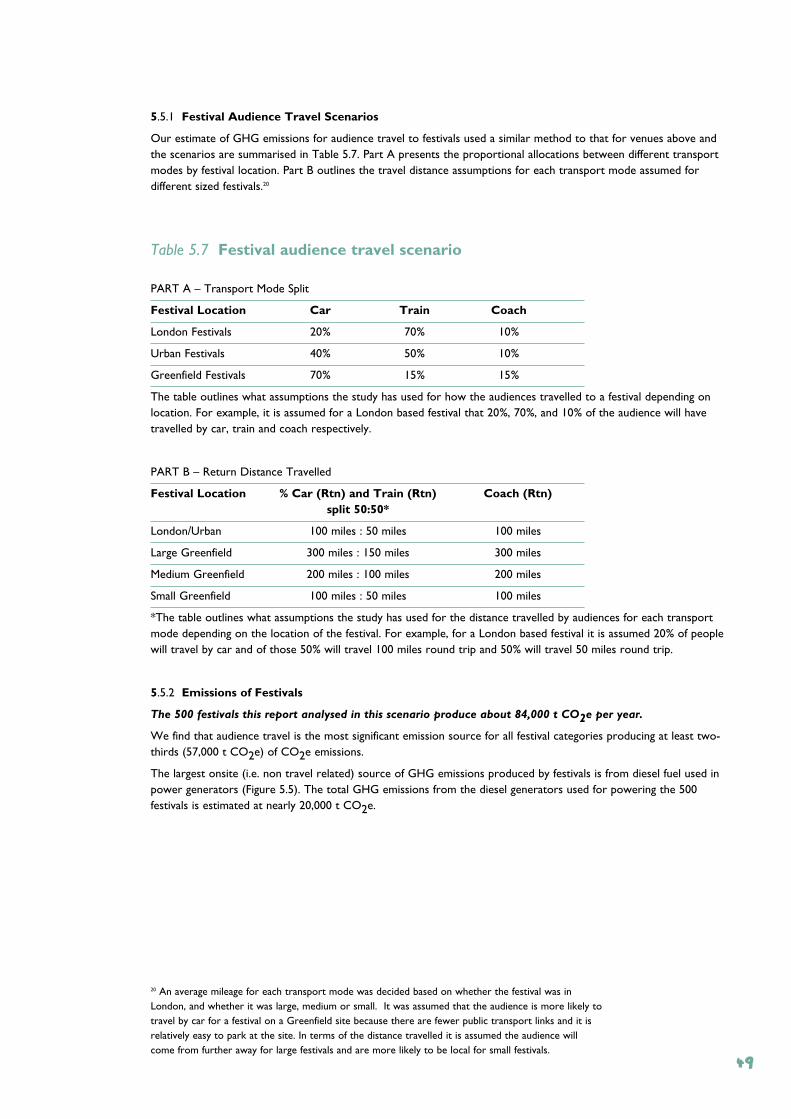
5.5.1 Festival Audience Travel Scenarios
Our estimate of GHG emissions for audience travel to festivals used a similar method to that for venues above andthe scenarios are summarised in Table 5.7. Part A presents the proportional allocations between different transportmodes by festival location. Part B outlines the travel distance assumptions for each transport mode assumed fordifferent sized festivals.20
Table 5.7 Festival audience travel scenario
PART A – Transport Mode Split
Festival Location Car Train Coach
London Festivals 20% 70% 10%
Urban Festivals 40% 50% 10%
Greenfield Festivals 70% 15% 15%
The table outlines what assumptions the study has used for how the audiences travelled to a festival depending onlocation. For example, it is assumed for a London based festival that 20%, 70%, and 10% of the audience will havetravelled by car, train and coach respectively.
PART B – Return Distance Travelled
Festival Location % Car (Rtn) and Train (Rtn) Coach (Rtn)split 50:50*
London/Urban 100 miles : 50 miles 100 miles
Large Greenfield 300 miles : 150 miles 300 miles
Medium Greenfield 200 miles : 100 miles 200 miles
Small Greenfield 100 miles : 50 miles 100 miles
*The table outlines what assumptions the study has used for the distance travelled by audiences for each transportmode depending on the location of the festival. For example, for a London based festival it is assumed 20% of peoplewill travel by car and of those 50% will travel 100 miles round trip and 50% will travel 50 miles round trip.
5.5.2 Emissions of Festivals
The 500 festivals this report analysed in this scenario produce about 84,000 t CO2e per year.
We find that audience travel is the most significant emission source for all festival categories producing at least two-thirds (57,000 t CO2e) of CO2e emissions.
The largest onsite (i.e. non travel related) source of GHG emissions produced by festivals is from diesel fuel used inpower generators (Figure 5.5). The total GHG emissions from the diesel generators used for powering the 500festivals is estimated at nearly 20,000 t CO2e.
20 An average mileage for each transport mode was decided based on whether the festival was inLondon, and whether it was large, medium or small. It was assumed that the audience is more likely totravel by car for a festival on a Greenfield site because there are fewer public transport links and it isrelatively easy to park at the site. In terms of the distance travelled it is assumed the audience willcome from further away for large festivals and are more likely to be local for small festivals.
49
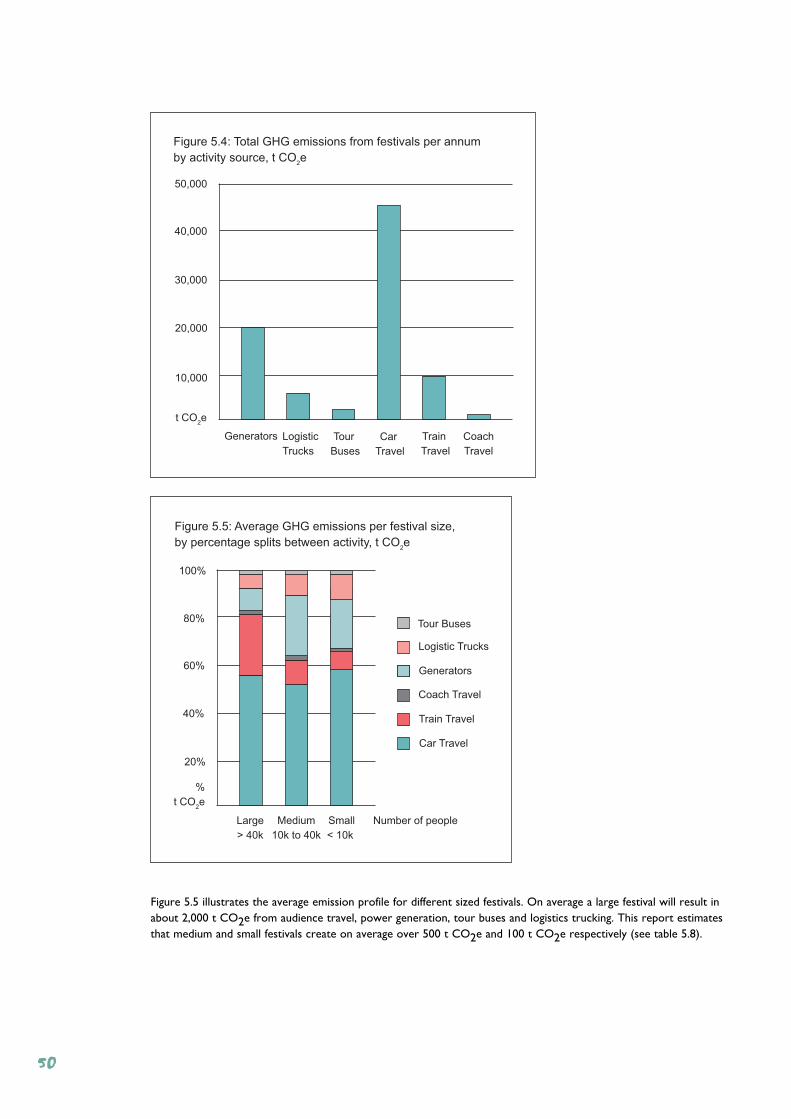
Figure 5.5 illustrates the average emission profile for different sized festivals. On average a large festival will result inabout 2,000 t CO2e from audience travel, power generation, tour buses and logistics trucking. This report estimatesthat medium and small festivals create on average over 500 t CO2e and 100 t CO2e respectively (see table 5.8).
10,000
20,000
40,000
50,000
Generators Logistic
Trucks
Tour
Buses
Car
Travel
Train
Travel
Coach
Travel
Figure 5.4: Total GHG emissions from festivals per annum
by activity source, t CO2e
30,000
t CO2e
20%
40%
80%
100%
Large
> 40k
Figure 5.5: Average GHG emissions per festival size,
by percentage splits between activity, t CO2e
60%
%
t CO2e
Medium
10k to 40k
Small
< 10k
Tour Buses
Logistic Trucks
Generators
Coach Travel
Train Travel
Car Travel
Number of people
50
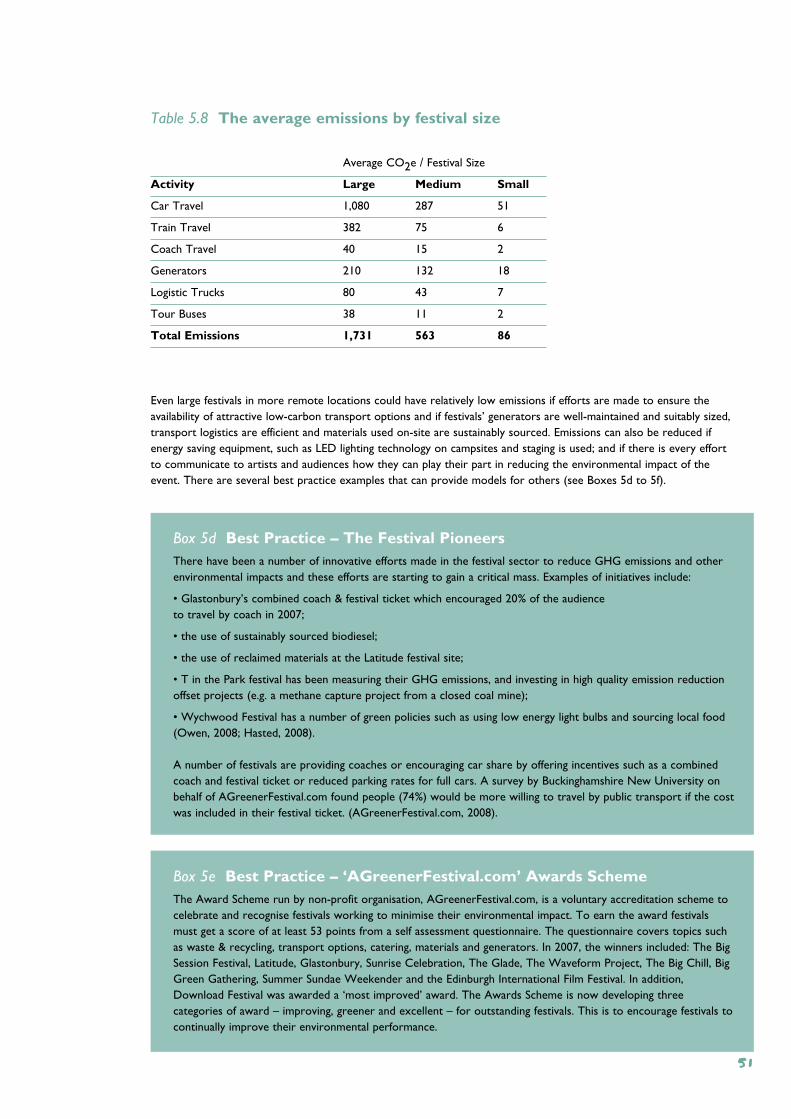
Table 5.8 The average emissions by festival size
Average CO2e / Festival Size
Activity Large Medium Small
Car Travel 1,080 287 51
Train Travel 382 75 6
Coach Travel 40 15 2
Generators 210 132 18
Logistic Trucks 80 43 7
Tour Buses 38 11 2
Total Emissions 1,731 563 86
Even large festivals in more remote locations could have relatively low emissions if efforts are made to ensure theavailability of attractive low-carbon transport options and if festivals’ generators are well-maintained and suitably sized,transport logistics are efficient and materials used on-site are sustainably sourced. Emissions can also be reduced ifenergy saving equipment, such as LED lighting technology on campsites and staging is used; and if there is every effortto communicate to artists and audiences how they can play their part in reducing the environmental impact of theevent. There are several best practice examples that can provide models for others (see Boxes 5d to 5f).
Box 5d Best Practice – The Festival Pioneers There have been a number of innovative efforts made in the festival sector to reduce GHG emissions and otherenvironmental impacts and these efforts are starting to gain a critical mass. Examples of initiatives include:
• Glastonbury’s combined coach & festival ticket which encouraged 20% of the audience to travel by coach in 2007;
• the use of sustainably sourced biodiesel;
• the use of reclaimed materials at the Latitude festival site;
• T in the Park festival has been measuring their GHG emissions, and investing in high quality emission reductionoffset projects (e.g. a methane capture project from a closed coal mine);
• Wychwood Festival has a number of green policies such as using low energy light bulbs and sourcing local food(Owen, 2008; Hasted, 2008).
A number of festivals are providing coaches or encouraging car share by offering incentives such as a combinedcoach and festival ticket or reduced parking rates for full cars. A survey by Buckinghamshire New University onbehalf of AGreenerFestival.com found people (74%) would be more willing to travel by public transport if the costwas included in their festival ticket. (AGreenerFestival.com, 2008).
Box 5e Best Practice – ‘AGreenerFestival.com’ Awards SchemeThe Award Scheme run by non-profit organisation, AGreenerFestival.com, is a voluntary accreditation scheme tocelebrate and recognise festivals working to minimise their environmental impact. To earn the award festivalsmust get a score of at least 53 points from a self assessment questionnaire. The questionnaire covers topics suchas waste & recycling, transport options, catering, materials and generators. In 2007, the winners included: The BigSession Festival, Latitude, Glastonbury, Sunrise Celebration, The Glade, The Waveform Project, The Big Chill, BigGreen Gathering, Summer Sundae Weekender and the Edinburgh International Film Festival. In addition,Download Festival was awarded a ‘most improved’ award. The Awards Scheme is now developing threecategories of award – improving, greener and excellent – for outstanding festivals. This is to encourage festivals tocontinually improve their environmental performance.
51
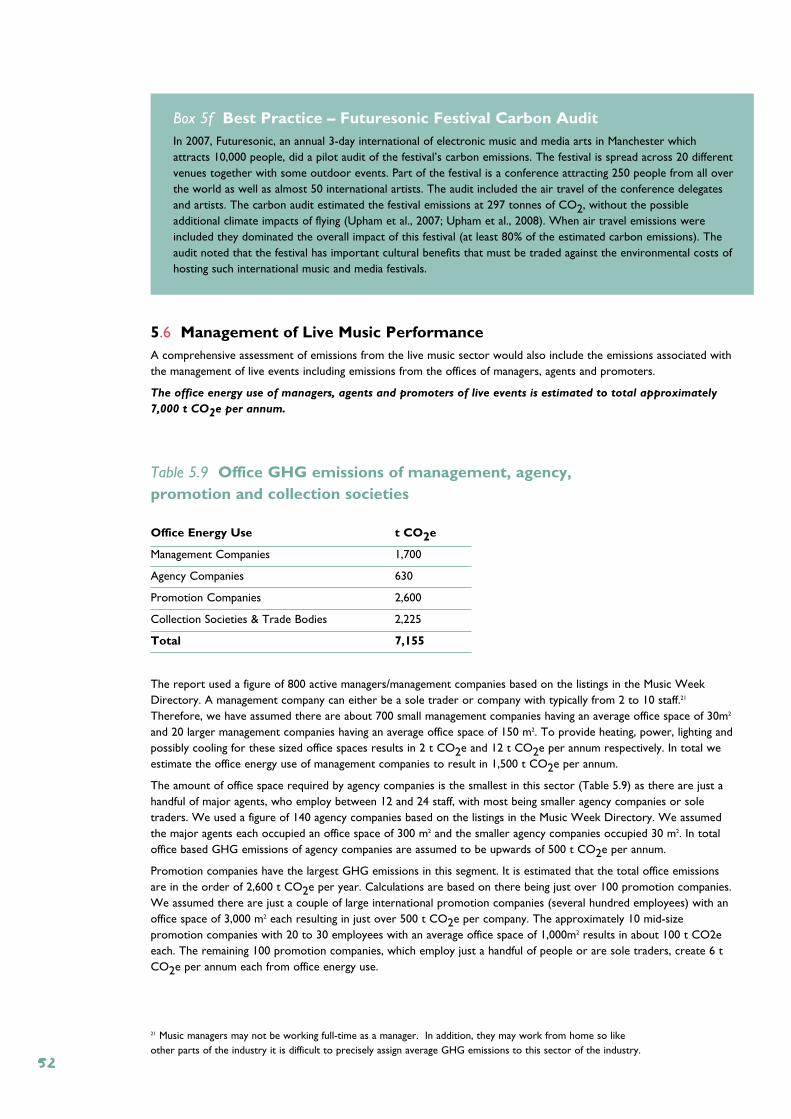
Box 5f Best Practice – Futuresonic Festival Carbon Audit In 2007, Futuresonic, an annual 3-day international of electronic music and media arts in Manchester whichattracts 10,000 people, did a pilot audit of the festival’s carbon emissions. The festival is spread across 20 differentvenues together with some outdoor events. Part of the festival is a conference attracting 250 people from all overthe world as well as almost 50 international artists. The audit included the air travel of the conference delegatesand artists. The carbon audit estimated the festival emissions at 297 tonnes of CO2, without the possibleadditional climate impacts of flying (Upham et al., 2007; Upham et al., 2008). When air travel emissions wereincluded they dominated the overall impact of this festival (at least 80% of the estimated carbon emissions). Theaudit noted that the festival has important cultural benefits that must be traded against the environmental costs ofhosting such international music and media festivals.
5.6 Management of Live Music PerformanceA comprehensive assessment of emissions from the live music sector would also include the emissions associated withthe management of live events including emissions from the offices of managers, agents and promoters.
The office energy use of managers, agents and promoters of live events is estimated to total approximately
7,000 t CO2e per annum.
Table 5.9 Office GHG emissions of management, agency, promotion and collection societies
Office Energy Use t CO2e
Management Companies 1,700
Agency Companies 630
Promotion Companies 2,600
Collection Societies & Trade Bodies 2,225
Total 7,155
The report used a figure of 800 active managers/management companies based on the listings in the Music WeekDirectory. A management company can either be a sole trader or company with typically from 2 to 10 staff.21
Therefore, we have assumed there are about 700 small management companies having an average office space of 30m2
and 20 larger management companies having an average office space of 150 m2. To provide heating, power, lighting andpossibly cooling for these sized office spaces results in 2 t CO2e and 12 t CO2e per annum respectively. In total weestimate the office energy use of management companies to result in 1,500 t CO2e per annum.
The amount of office space required by agency companies is the smallest in this sector (Table 5.9) as there are just ahandful of major agents, who employ between 12 and 24 staff, with most being smaller agency companies or soletraders. We used a figure of 140 agency companies based on the listings in the Music Week Directory. We assumedthe major agents each occupied an office space of 300 m2 and the smaller agency companies occupied 30 m2. In totaloffice based GHG emissions of agency companies are assumed to be upwards of 500 t CO2e per annum.
Promotion companies have the largest GHG emissions in this segment. It is estimated that the total office emissionsare in the order of 2,600 t CO2e per year. Calculations are based on there being just over 100 promotion companies.We assumed there are just a couple of large international promotion companies (several hundred employees) with anoffice space of 3,000 m2 each resulting in just over 500 t CO2e per company. The approximately 10 mid-sizepromotion companies with 20 to 30 employees with an average office space of 1,000m2 results in about 100 t CO2eeach. The remaining 100 promotion companies, which employ just a handful of people or are sole traders, create 6 tCO2e per annum each from office energy use.
21 Music managers may not be working full-time as a manager. In addition, they may work from home so likeother parts of the industry it is difficult to precisely assign average GHG emissions to this sector of the industry.
52
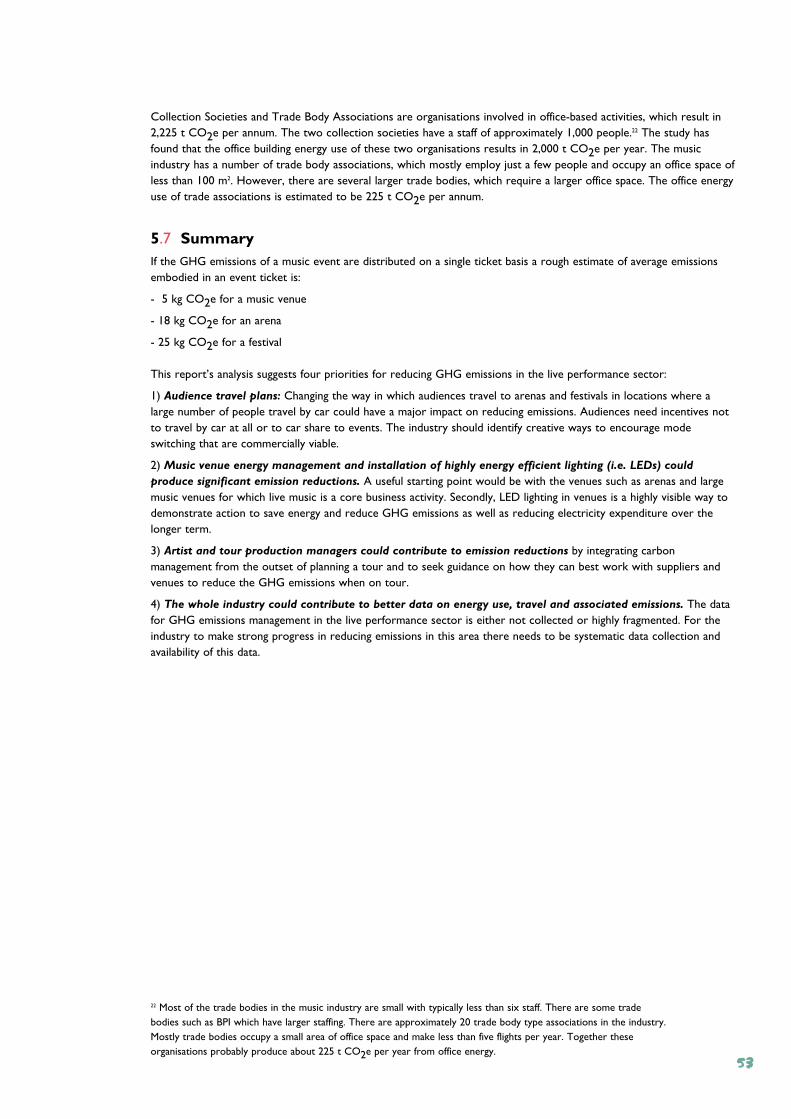
Collection Societies and Trade Body Associations are organisations involved in office-based activities, which result in2,225 t CO2e per annum. The two collection societies have a staff of approximately 1,000 people.22 The study hasfound that the office building energy use of these two organisations results in 2,000 t CO2e per year. The musicindustry has a number of trade body associations, which mostly employ just a few people and occupy an office space ofless than 100 m2. However, there are several larger trade bodies, which require a larger office space. The office energyuse of trade associations is estimated to be 225 t CO2e per annum.
5.7 SummaryIf the GHG emissions of a music event are distributed on a single ticket basis a rough estimate of average emissionsembodied in an event ticket is:
- 5 kg CO2e for a music venue
- 18 kg CO2e for an arena
- 25 kg CO2e for a festival
This report’s analysis suggests four priorities for reducing GHG emissions in the live performance sector:
1) Audience travel plans: Changing the way in which audiences travel to arenas and festivals in locations where alarge number of people travel by car could have a major impact on reducing emissions. Audiences need incentives notto travel by car at all or to car share to events. The industry should identify creative ways to encourage modeswitching that are commercially viable.
2) Music venue energy management and installation of highly energy efficient lighting (i.e. LEDs) could
produce significant emission reductions. A useful starting point would be with the venues such as arenas and largemusic venues for which live music is a core business activity. Secondly, LED lighting in venues is a highly visible way todemonstrate action to save energy and reduce GHG emissions as well as reducing electricity expenditure over thelonger term.
3) Artist and tour production managers could contribute to emission reductions by integrating carbonmanagement from the outset of planning a tour and to seek guidance on how they can best work with suppliers andvenues to reduce the GHG emissions when on tour.
4) The whole industry could contribute to better data on energy use, travel and associated emissions. The datafor GHG emissions management in the live performance sector is either not collected or highly fragmented. For theindustry to make strong progress in reducing emissions in this area there needs to be systematic data collection andavailability of this data.
22 Most of the trade bodies in the music industry are small with typically less than six staff. There are some tradebodies such as BPI which have larger staffing. There are approximately 20 trade body type associations in the industry.Mostly trade bodies occupy a small area of office space and make less than five flights per year. Together theseorganisations probably produce about 225 t CO2e per year from office energy.
53

54
6.1 OverviewThis study indicates that the grenhouse gas (GHG) emissions of the UK music industry from international
touring and industry travel are at least 416,000 t CO2e.
International travel is a major part of the UK music industry’s business activities. As a result, it has been a focus ofattention regarding the environmental sustainability of the music industry. Many UK artists have significant music salesoverseas and therefore frequently tour internationally. However, data from which to estimate emissions from the UKmusic industry’s international activities are limited. Nonetheless, we have undertaken preliminary analyses of the GHGemissions of various international travel and touring activities. This section provides results on emissions associatedwith:
1) International Touring a. Arena/Amphitheatresb. Large Music Venues
2) Air Travela. The staff of record companies & labelsb. Managers and agentsc. Artistsd. Orchestras
All GHG emission results for air travel are presented assuming an equal allocation of GHG emissions per passenger.23
6.2 International Touring by UK ArtistsInternational touring is an important part of the music business and therefore a major activity of the UK musicindustry. Europe, the USA, Australia and Japan comprise the principle markets for UK music promotion. Some artistswill be touring heavily in these regions, doing more than 100 live performances a year. Typically, a tour leg for a regionwill be between 15 to 35 performances. Figure 6.1 outlines some examples of how many live performances somepopular artists are doing in a year. There were 79 UK artists receiving BPI album sales awards in 2007. Two-thirds ofthese artists toured internationally with almost 50 touring the US, 29 touring Europe and 23 touring Australia.
The study conservatively estimates the GHG emissions from UK artists international touring to Europe and
the United States to be at least 400,000 t CO2e per annum based on an estimated 240 tours.
Most international touring done by UK artists will be theatre and/or club tours. A relatively small number of artists doarena and stadium-sized tours.
There is very little data on GHG emissions associated with touring and only a small number of artists have auditedtheir tours. At this time, our study has only focused on UK artist tours in Europe and the United States.
Section 6 Carbon Emissions and the UK Music Industry –Emissions from International Travel and Touring
23 A significant proportion of air travellers in the music industry fly business or premier travelclasses as well as use private and corporate jets. These classes of travel result in more service,more transport weight and therefore more fuel use and GHG emissions.
55
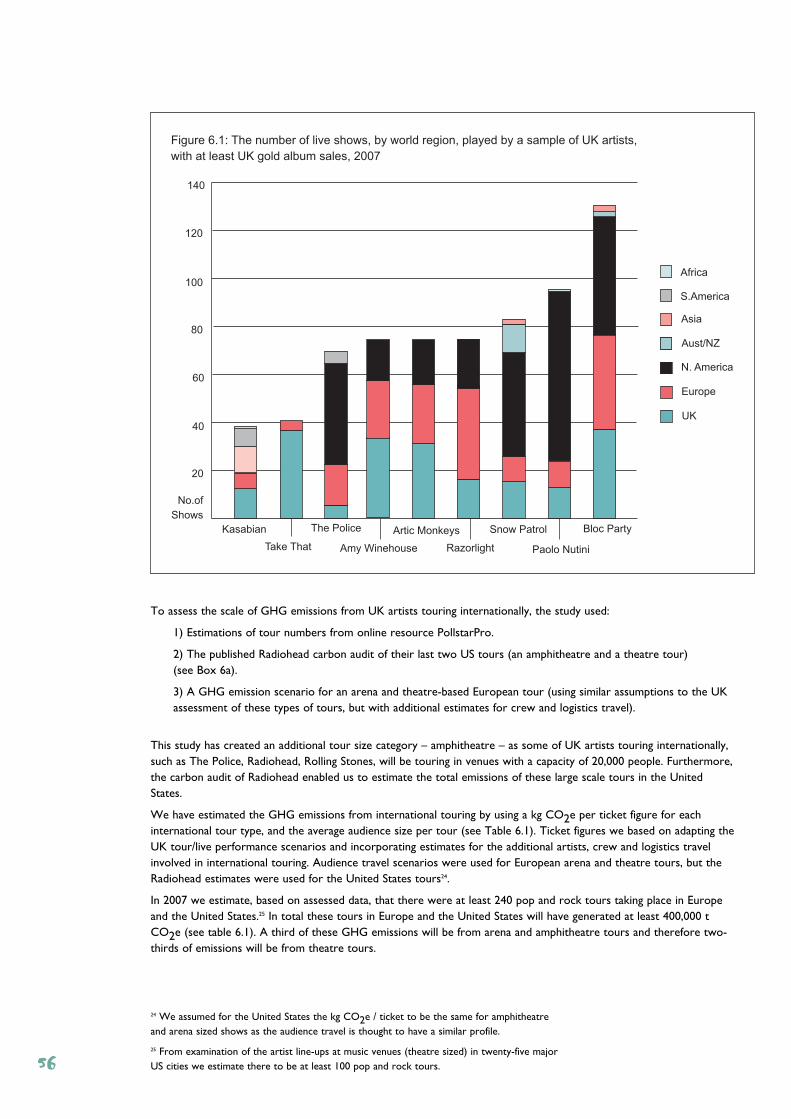
To assess the scale of GHG emissions from UK artists touring internationally, the study used:
1) Estimations of tour numbers from online resource PollstarPro.
2) The published Radiohead carbon audit of their last two US tours (an amphitheatre and a theatre tour) (see Box 6a).
3) A GHG emission scenario for an arena and theatre-based European tour (using similar assumptions to the UKassessment of these types of tours, but with additional estimates for crew and logistics travel).
This study has created an additional tour size category – amphitheatre – as some of UK artists touring internationally,such as The Police, Radiohead, Rolling Stones, will be touring in venues with a capacity of 20,000 people. Furthermore,the carbon audit of Radiohead enabled us to estimate the total emissions of these large scale tours in the UnitedStates.
We have estimated the GHG emissions from international touring by using a kg CO2e per ticket figure for eachinternational tour type, and the average audience size per tour (see Table 6.1). Ticket figures we based on adapting theUK tour/live performance scenarios and incorporating estimates for the additional artists, crew and logistics travelinvolved in international touring. Audience travel scenarios were used for European arena and theatre tours, but theRadiohead estimates were used for the United States tours24.
In 2007 we estimate, based on assessed data, that there were at least 240 pop and rock tours taking place in Europeand the United States.25 In total these tours in Europe and the United States will have generated at least 400,000 tCO2e (see table 6.1). A third of these GHG emissions will be from arena and amphitheatre tours and therefore two-thirds of emissions will be from theatre tours.
20
40
80
100
Kasabian
Figure 6.1: The number of live shows, by world region, played by a sample of UK artists,
with at least UK gold album sales, 2007
60
No.of
Shows
Take That
The Police
Amy Winehouse
S.America
Asia
Aust/NZ
N. America
Europe
UK
Africa
120
140
Artic Monkeys
Razorlight
Snow Patrol
Paolo Nutini
Bloc Party
24 We assumed for the United States the kg CO2e / ticket to be the same for amphitheatreand arena sized shows as the audience travel is thought to have a similar profile.
25 From examination of the artist line-ups at music venues (theatre sized) in twenty-five majorUS cities we estimate there to be at least 100 pop and rock tours.56
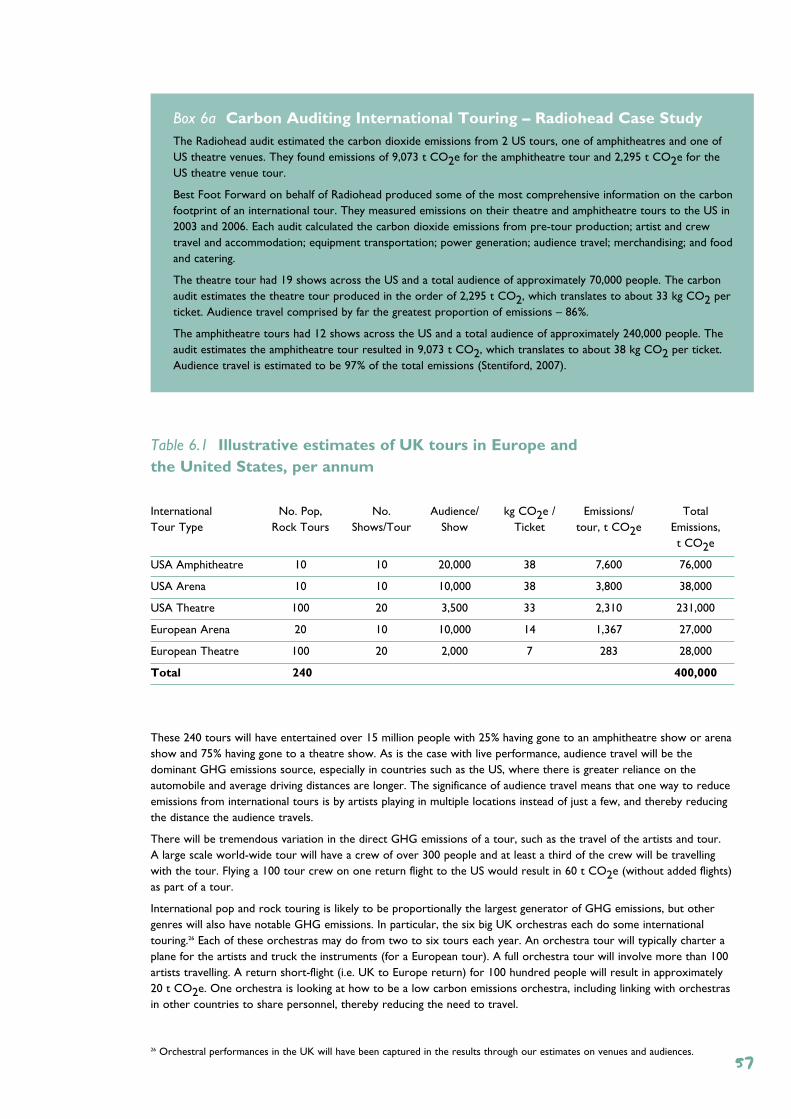
Box 6a Carbon Auditing International Touring – Radiohead Case StudyThe Radiohead audit estimated the carbon dioxide emissions from 2 US tours, one of amphitheatres and one ofUS theatre venues. They found emissions of 9,073 t CO2e for the amphitheatre tour and 2,295 t CO2e for theUS theatre venue tour.
Best Foot Forward on behalf of Radiohead produced some of the most comprehensive information on the carbonfootprint of an international tour. They measured emissions on their theatre and amphitheatre tours to the US in2003 and 2006. Each audit calculated the carbon dioxide emissions from pre-tour production; artist and crewtravel and accommodation; equipment transportation; power generation; audience travel; merchandising; and foodand catering.
The theatre tour had 19 shows across the US and a total audience of approximately 70,000 people. The carbonaudit estimates the theatre tour produced in the order of 2,295 t CO2, which translates to about 33 kg CO2 perticket. Audience travel comprised by far the greatest proportion of emissions – 86%.
The amphitheatre tours had 12 shows across the US and a total audience of approximately 240,000 people. Theaudit estimates the amphitheatre tour resulted in 9,073 t CO2, which translates to about 38 kg CO2 per ticket.Audience travel is estimated to be 97% of the total emissions (Stentiford, 2007).
Table 6.1 Illustrative estimates of UK tours in Europe and the United States, per annum
International No. Pop, No. Audience/ kg CO2e / Emissions/ TotalTour Type Rock Tours Shows/Tour Show Ticket tour, t CO2e Emissions,
t CO2e
USA Amphitheatre 10 10 20,000 38 7,600 76,000
USA Arena 10 10 10,000 38 3,800 38,000
USA Theatre 100 20 3,500 33 2,310 231,000
European Arena 20 10 10,000 14 1,367 27,000
European Theatre 100 20 2,000 7 283 28,000
Total 240 400,000
These 240 tours will have entertained over 15 million people with 25% having gone to an amphitheatre show or arenashow and 75% having gone to a theatre show. As is the case with live performance, audience travel will be thedominant GHG emissions source, especially in countries such as the US, where there is greater reliance on theautomobile and average driving distances are longer. The significance of audience travel means that one way to reduceemissions from international tours is by artists playing in multiple locations instead of just a few, and thereby reducingthe distance the audience travels.
There will be tremendous variation in the direct GHG emissions of a tour, such as the travel of the artists and tour. A large scale world-wide tour will have a crew of over 300 people and at least a third of the crew will be travellingwith the tour. Flying a 100 tour crew on one return flight to the US would result in 60 t CO2e (without added flights)as part of a tour.
International pop and rock touring is likely to be proportionally the largest generator of GHG emissions, but othergenres will also have notable GHG emissions. In particular, the six big UK orchestras each do some internationaltouring.26 Each of these orchestras may do from two to six tours each year. An orchestra tour will typically charter aplane for the artists and truck the instruments (for a European tour). A full orchestra tour will involve more than 100artists travelling. A return short-flight (i.e. UK to Europe return) for 100 hundred people will result in approximately20 t CO2e. One orchestra is looking at how to be a low carbon emissions orchestra, including linking with orchestrasin other countries to share personnel, thereby reducing the need to travel.
26 Orchestral performances in the UK will have been captured in the results through our estimates on venues and audiences.57
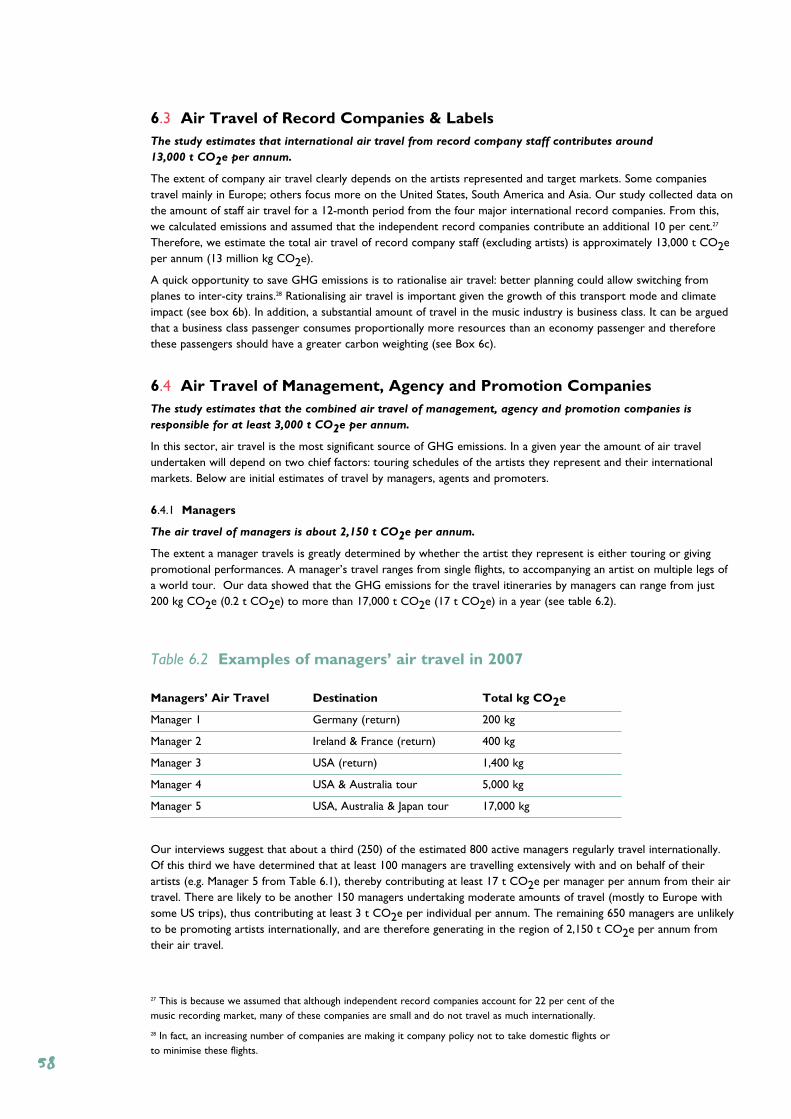
6.3 Air Travel of Record Companies & LabelsThe study estimates that international air travel from record company staff contributes around
13,000 t CO2e per annum.
The extent of company air travel clearly depends on the artists represented and target markets. Some companiestravel mainly in Europe; others focus more on the United States, South America and Asia. Our study collected data onthe amount of staff air travel for a 12-month period from the four major international record companies. From this,we calculated emissions and assumed that the independent record companies contribute an additional 10 per cent.27
Therefore, we estimate the total air travel of record company staff (excluding artists) is approximately 13,000 t CO2eper annum (13 million kg CO2e).
A quick opportunity to save GHG emissions is to rationalise air travel: better planning could allow switching fromplanes to inter-city trains.28 Rationalising air travel is important given the growth of this transport mode and climateimpact (see box 6b). In addition, a substantial amount of travel in the music industry is business class. It can be arguedthat a business class passenger consumes proportionally more resources than an economy passenger and thereforethese passengers should have a greater carbon weighting (see Box 6c).
6.4 Air Travel of Management, Agency and Promotion CompaniesThe study estimates that the combined air travel of management, agency and promotion companies is
responsible for at least 3,000 t CO2e per annum.
In this sector, air travel is the most significant source of GHG emissions. In a given year the amount of air travelundertaken will depend on two chief factors: touring schedules of the artists they represent and their internationalmarkets. Below are initial estimates of travel by managers, agents and promoters.
6.4.1 Managers
The air travel of managers is about 2,150 t CO2e per annum.
The extent a manager travels is greatly determined by whether the artist they represent is either touring or givingpromotional performances. A manager’s travel ranges from single flights, to accompanying an artist on multiple legs ofa world tour. Our data showed that the GHG emissions for the travel itineraries by managers can range from just200 kg CO2e (0.2 t CO2e) to more than 17,000 t CO2e (17 t CO2e) in a year (see table 6.2).
Table 6.2 Examples of managers’ air travel in 2007
Managers’ Air Travel Destination Total kg CO2e
Manager 1 Germany (return) 200 kg
Manager 2 Ireland & France (return) 400 kg
Manager 3 USA (return) 1,400 kg
Manager 4 USA & Australia tour 5,000 kg
Manager 5 USA, Australia & Japan tour 17,000 kg
Our interviews suggest that about a third (250) of the estimated 800 active managers regularly travel internationally.Of this third we have determined that at least 100 managers are travelling extensively with and on behalf of theirartists (e.g. Manager 5 from Table 6.1), thereby contributing at least 17 t CO2e per manager per annum from their airtravel. There are likely to be another 150 managers undertaking moderate amounts of travel (mostly to Europe withsome US trips), thus contributing at least 3 t CO2e per individual per annum. The remaining 650 managers are unlikelyto be promoting artists internationally, and are therefore generating in the region of 2,150 t CO2e per annum fromtheir air travel.
27 This is because we assumed that although independent record companies account for 22 per cent of themusic recording market, many of these companies are small and do not travel as much internationally.
28 In fact, an increasing number of companies are making it company policy not to take domestic flights orto minimise these flights.
58
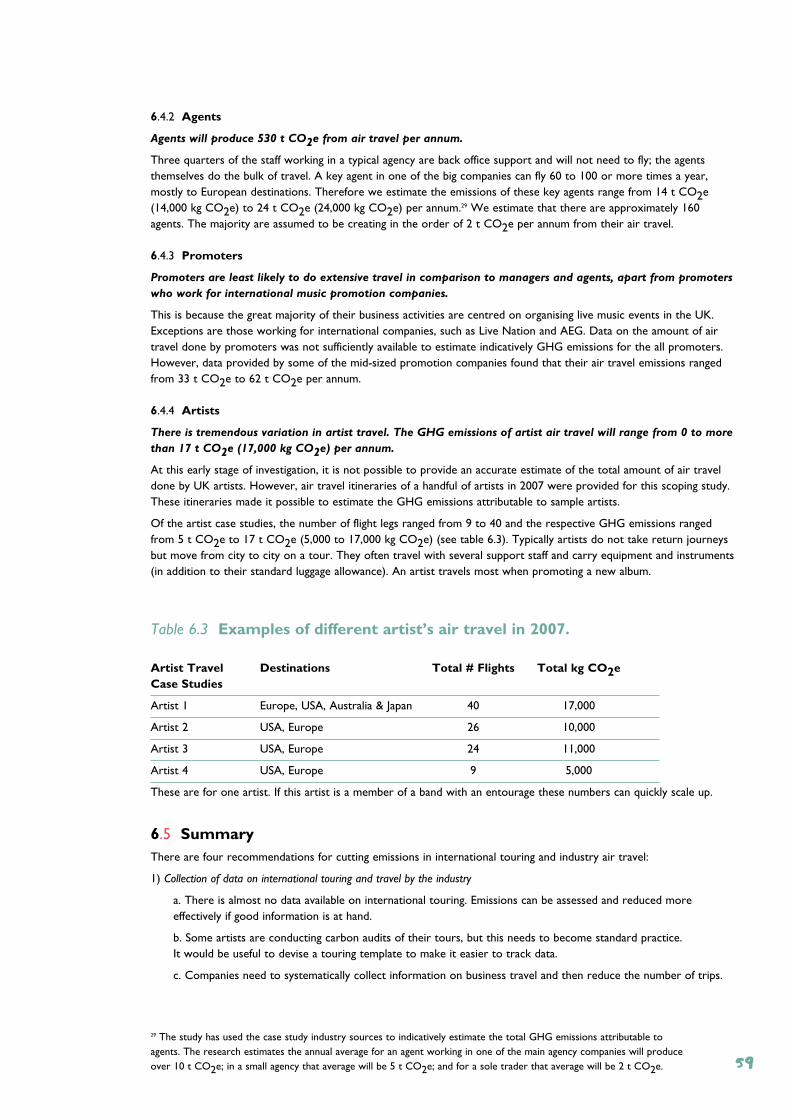
6.4.2 Agents
Agents will produce 530 t CO2e from air travel per annum.
Three quarters of the staff working in a typical agency are back office support and will not need to fly; the agentsthemselves do the bulk of travel. A key agent in one of the big companies can fly 60 to 100 or more times a year,mostly to European destinations. Therefore we estimate the emissions of these key agents range from 14 t CO2e(14,000 kg CO2e) to 24 t CO2e (24,000 kg CO2e) per annum.29 We estimate that there are approximately 160agents. The majority are assumed to be creating in the order of 2 t CO2e per annum from their air travel.
6.4.3 Promoters
Promoters are least likely to do extensive travel in comparison to managers and agents, apart from promoters
who work for international music promotion companies.
This is because the great majority of their business activities are centred on organising live music events in the UK.Exceptions are those working for international companies, such as Live Nation and AEG. Data on the amount of airtravel done by promoters was not sufficiently available to estimate indicatively GHG emissions for the all promoters.However, data provided by some of the mid-sized promotion companies found that their air travel emissions rangedfrom 33 t CO2e to 62 t CO2e per annum.
6.4.4 Artists
There is tremendous variation in artist travel. The GHG emissions of artist air travel will range from 0 to more
than 17 t CO2e (17,000 kg CO2e) per annum.
At this early stage of investigation, it is not possible to provide an accurate estimate of the total amount of air traveldone by UK artists. However, air travel itineraries of a handful of artists in 2007 were provided for this scoping study.These itineraries made it possible to estimate the GHG emissions attributable to sample artists.
Of the artist case studies, the number of flight legs ranged from 9 to 40 and the respective GHG emissions rangedfrom 5 t CO2e to 17 t CO2e (5,000 to 17,000 kg CO2e) (see table 6.3). Typically artists do not take return journeysbut move from city to city on a tour. They often travel with several support staff and carry equipment and instruments(in addition to their standard luggage allowance). An artist travels most when promoting a new album.
Table 6.3 Examples of different artist’s air travel in 2007.
Artist Travel Destinations Total # Flights Total kg CO2eCase Studies
Artist 1 Europe, USA, Australia & Japan 40 17,000
Artist 2 USA, Europe 26 10,000
Artist 3 USA, Europe 24 11,000
Artist 4 USA, Europe 9 5,000
These are for one artist. If this artist is a member of a band with an entourage these numbers can quickly scale up.
6.5 SummaryThere are four recommendations for cutting emissions in international touring and industry air travel:
1) Collection of data on international touring and travel by the industry
a. There is almost no data available on international touring. Emissions can be assessed and reduced moreeffectively if good information is at hand.
b. Some artists are conducting carbon audits of their tours, but this needs to become standard practice. It would be useful to devise a touring template to make it easier to track data.
c. Companies need to systematically collect information on business travel and then reduce the number of trips.
29 The study has used the case study industry sources to indicatively estimate the total GHG emissions attributable toagents. The research estimates the annual average for an agent working in one of the main agency companies will produceover 10 t CO2e; in a small agency that average will be 5 t CO2e; and for a sole trader that average will be 2 t CO2e. 59
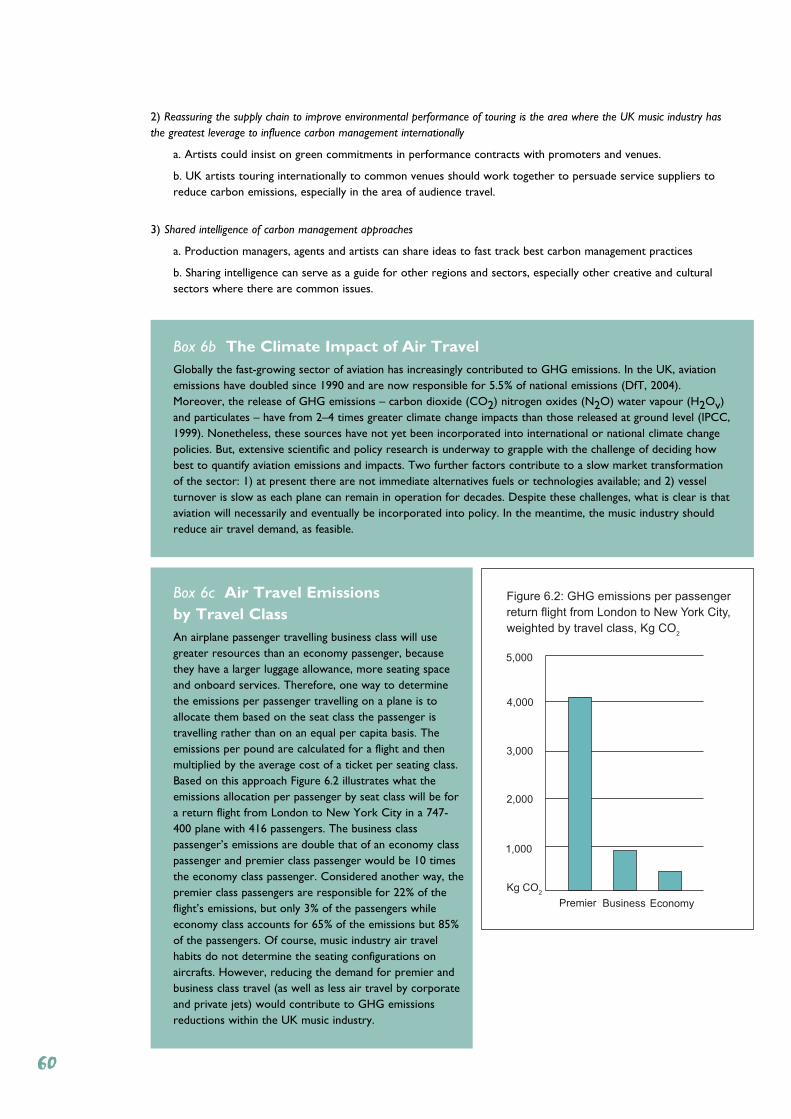
2) Reassuring the supply chain to improve environmental performance of touring is the area where the UK music industry hasthe greatest leverage to influence carbon management internationally
a. Artists could insist on green commitments in performance contracts with promoters and venues.
b. UK artists touring internationally to common venues should work together to persuade service suppliers toreduce carbon emissions, especially in the area of audience travel.
3) Shared intelligence of carbon management approaches
a. Production managers, agents and artists can share ideas to fast track best carbon management practices
b. Sharing intelligence can serve as a guide for other regions and sectors, especially other creative and culturalsectors where there are common issues.
Box 6b The Climate Impact of Air TravelGlobally the fast-growing sector of aviation has increasingly contributed to GHG emissions. In the UK, aviationemissions have doubled since 1990 and are now responsible for 5.5% of national emissions (DfT, 2004).Moreover, the release of GHG emissions – carbon dioxide (CO2) nitrogen oxides (N2O) water vapour (H2Ov)and particulates – have from 2–4 times greater climate change impacts than those released at ground level (IPCC,1999). Nonetheless, these sources have not yet been incorporated into international or national climate changepolicies. But, extensive scientific and policy research is underway to grapple with the challenge of deciding howbest to quantify aviation emissions and impacts. Two further factors contribute to a slow market transformationof the sector: 1) at present there are not immediate alternatives fuels or technologies available; and 2) vesselturnover is slow as each plane can remain in operation for decades. Despite these challenges, what is clear is thataviation will necessarily and eventually be incorporated into policy. In the meantime, the music industry shouldreduce air travel demand, as feasible.
Box 6c Air Travel Emissions by Travel ClassAn airplane passenger travelling business class will usegreater resources than an economy passenger, becausethey have a larger luggage allowance, more seating spaceand onboard services. Therefore, one way to determinethe emissions per passenger travelling on a plane is toallocate them based on the seat class the passenger istravelling rather than on an equal per capita basis. Theemissions per pound are calculated for a flight and thenmultiplied by the average cost of a ticket per seating class.Based on this approach Figure 6.2 illustrates what theemissions allocation per passenger by seat class will be fora return flight from London to New York City in a 747-400 plane with 416 passengers. The business classpassenger’s emissions are double that of an economy classpassenger and premier class passenger would be 10 timesthe economy class passenger. Considered another way, thepremier class passengers are responsible for 22% of theflight’s emissions, but only 3% of the passengers whileeconomy class accounts for 65% of the emissions but 85%of the passengers. Of course, music industry air travelhabits do not determine the seating configurations onaircrafts. However, reducing the demand for premier andbusiness class travel (as well as less air travel by corporateand private jets) would contribute to GHG emissionsreductions within the UK music industry.
1,000
2,000
4,000
5,000
Premier Business Economy
Figure 6.2: GHG emissions per passenger
return flight from London to New York City,
weighted by travel class, Kg CO2
3,000
Kg CO2
60
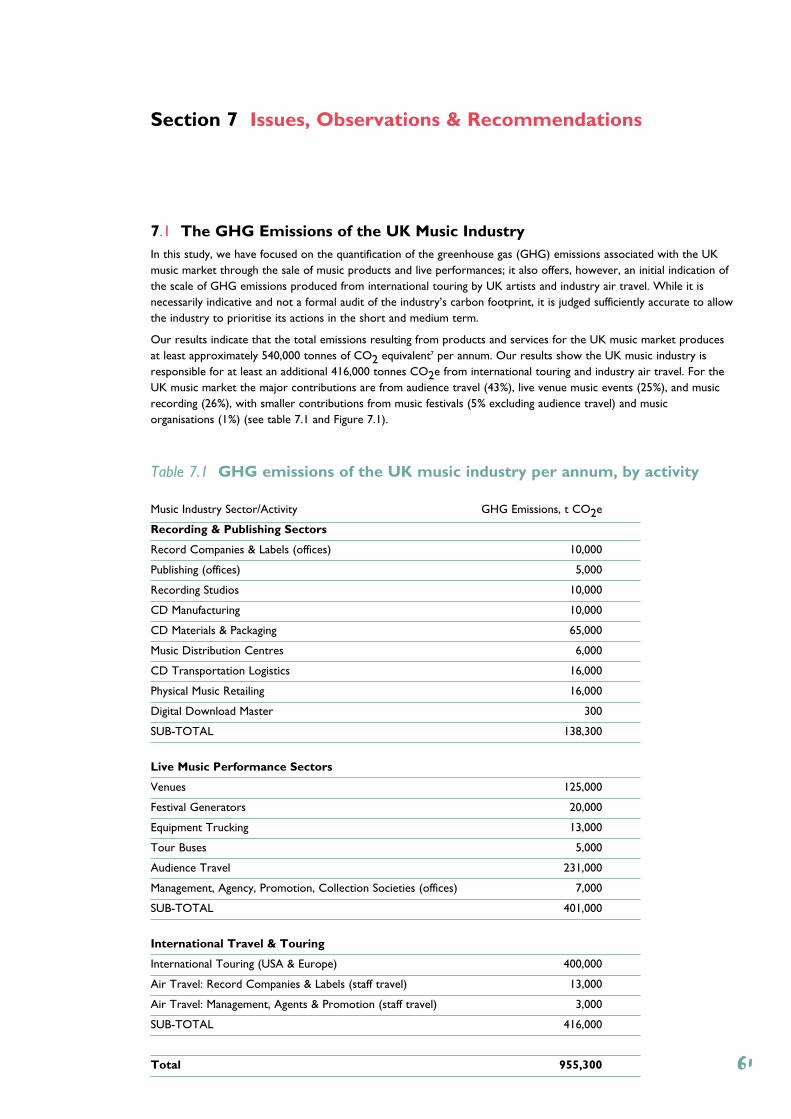
7.1 The GHG Emissions of the UK Music IndustryIn this study, we have focused on the quantification of the greenhouse gas (GHG) emissions associated with the UKmusic market through the sale of music products and live performances; it also offers, however, an initial indication ofthe scale of GHG emissions produced from international touring by UK artists and industry air travel. While it isnecessarily indicative and not a formal audit of the industry’s carbon footprint, it is judged sufficiently accurate to allowthe industry to prioritise its actions in the short and medium term.
Our results indicate that the total emissions resulting from products and services for the UK music market producesat least approximately 540,000 tonnes of CO2 equivalent7 per annum. Our results show the UK music industry isresponsible for at least an additional 416,000 tonnes CO2e from international touring and industry air travel. For theUK music market the major contributions are from audience travel (43%), live venue music events (25%), and musicrecording (26%), with smaller contributions from music festivals (5% excluding audience travel) and musicorganisations (1%) (see table 7.1 and Figure 7.1).
Table 7.1 GHG emissions of the UK music industry per annum, by activity
Music Industry Sector/Activity GHG Emissions, t CO2e
Recording & Publishing Sectors
Record Companies & Labels (offices) 10,000
Publishing (offices) 5,000
Recording Studios 10,000
CD Manufacturing 10,000
CD Materials & Packaging 65,000
Music Distribution Centres 6,000
CD Transportation Logistics 16,000
Physical Music Retailing 16,000
Digital Download Master 300
SUB-TOTAL 138,300
Live Music Performance Sectors
Venues 125,000
Festival Generators 20,000
Equipment Trucking 13,000
Tour Buses 5,000
Audience Travel 231,000
Management, Agency, Promotion, Collection Societies (offices) 7,000
SUB-TOTAL 401,000
International Travel & Touring
International Touring (USA & Europe) 400,000
Air Travel: Record Companies & Labels (staff travel) 13,000
Air Travel: Management, Agents & Promotion (staff travel) 3,000
SUB-TOTAL 416,000
Total 955,300
Section 7 Issues, Observations & Recommendations
61
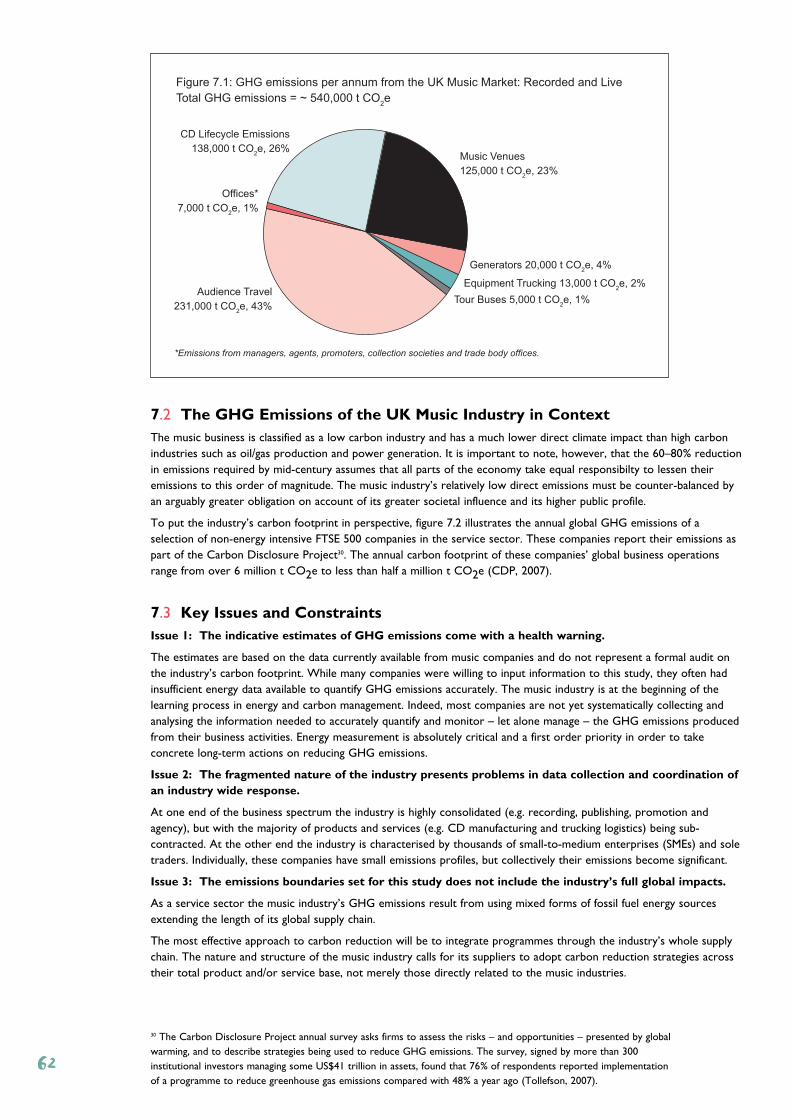
7.2 The GHG Emissions of the UK Music Industry in ContextThe music business is classified as a low carbon industry and has a much lower direct climate impact than high carbonindustries such as oil/gas production and power generation. It is important to note, however, that the 60–80% reductionin emissions required by mid-century assumes that all parts of the economy take equal responsibilty to lessen theiremissions to this order of magnitude. The music industry’s relatively low direct emissions must be counter-balanced byan arguably greater obligation on account of its greater societal influence and its higher public profile.
To put the industry’s carbon footprint in perspective, figure 7.2 illustrates the annual global GHG emissions of aselection of non-energy intensive FTSE 500 companies in the service sector. These companies report their emissions aspart of the Carbon Disclosure Project30. The annual carbon footprint of these companies’ global business operationsrange from over 6 million t CO2e to less than half a million t CO2e (CDP, 2007).
7.3 Key Issues and ConstraintsIssue 1: The indicative estimates of GHG emissions come with a health warning.
The estimates are based on the data currently available from music companies and do not represent a formal audit onthe industry’s carbon footprint. While many companies were willing to input information to this study, they often hadinsufficient energy data available to quantify GHG emissions accurately. The music industry is at the beginning of thelearning process in energy and carbon management. Indeed, most companies are not yet systematically collecting andanalysing the information needed to accurately quantify and monitor – let alone manage – the GHG emissions producedfrom their business activities. Energy measurement is absolutely critical and a first order priority in order to takeconcrete long-term actions on reducing GHG emissions.
Issue 2: The fragmented nature of the industry presents problems in data collection and coordination ofan industry wide response.
At one end of the business spectrum the industry is highly consolidated (e.g. recording, publishing, promotion andagency), but with the majority of products and services (e.g. CD manufacturing and trucking logistics) being sub-contracted. At the other end the industry is characterised by thousands of small-to-medium enterprises (SMEs) and soletraders. Individually, these companies have small emissions profiles, but collectively their emissions become significant.
Issue 3: The emissions boundaries set for this study does not include the industry’s full global impacts.
As a service sector the music industry’s GHG emissions result from using mixed forms of fossil fuel energy sourcesextending the length of its global supply chain.
The most effective approach to carbon reduction will be to integrate programmes through the industry’s whole supplychain. The nature and structure of the music industry calls for its suppliers to adopt carbon reduction strategies acrosstheir total product and/or service base, not merely those directly related to the music industries.
Figure 7.1: GHG emissions per annum from the UK Music Market: Recorded and Live
Total GHG emissions = ~ 540,000 t CO2e
CD Lifecycle Emissions
138,000 t CO2e, 26%
Music Venues
125,000 t CO2e, 23%
Generators 20,000 t CO2e, 4%
Equipment Trucking 13,000 t CO2e, 2%
Tour Buses 5,000 t CO2e, 1%
Audience Travel
231,000 t CO2e, 43%
Offices*
7,000 t CO2e, 1%
*Emissions from managers, agents, promoters, collection societies and trade body offices.
30 The Carbon Disclosure Project annual survey asks firms to assess the risks – and opportunities – presented by globalwarming, and to describe strategies being used to reduce GHG emissions. The survey, signed by more than 300institutional investors managing some US$41 trillion in assets, found that 76% of respondents reported implementationof a programme to reduce greenhouse gas emissions compared with 48% a year ago (Tollefson, 2007).
62
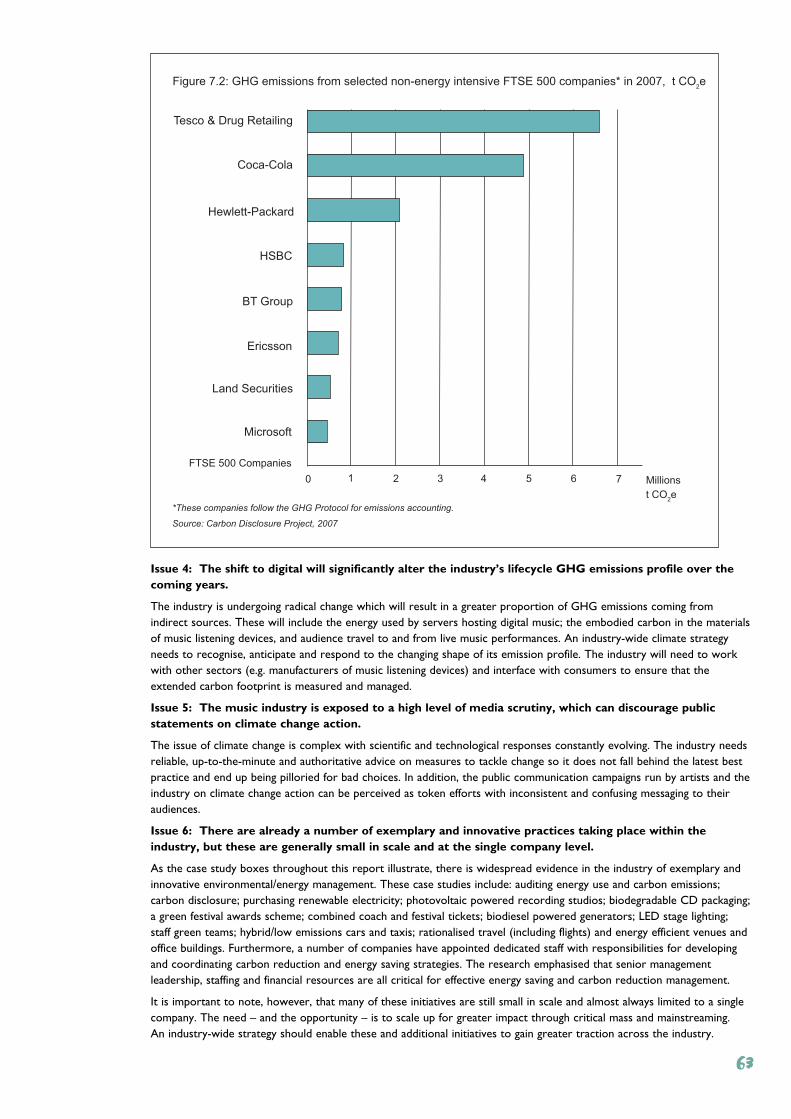
Issue 4: The shift to digital will significantly alter the industry’s lifecycle GHG emissions profile over thecoming years.
The industry is undergoing radical change which will result in a greater proportion of GHG emissions coming fromindirect sources. These will include the energy used by servers hosting digital music; the embodied carbon in the materialsof music listening devices, and audience travel to and from live music performances. An industry-wide climate strategyneeds to recognise, anticipate and respond to the changing shape of its emission profile. The industry will need to workwith other sectors (e.g. manufacturers of music listening devices) and interface with consumers to ensure that theextended carbon footprint is measured and managed.
Issue 5: The music industry is exposed to a high level of media scrutiny, which can discourage publicstatements on climate change action.
The issue of climate change is complex with scientific and technological responses constantly evolving. The industry needsreliable, up-to-the-minute and authoritative advice on measures to tackle change so it does not fall behind the latest bestpractice and end up being pilloried for bad choices. In addition, the public communication campaigns run by artists and theindustry on climate change action can be perceived as token efforts with inconsistent and confusing messaging to theiraudiences.
Issue 6: There are already a number of exemplary and innovative practices taking place within theindustry, but these are generally small in scale and at the single company level.
As the case study boxes throughout this report illustrate, there is widespread evidence in the industry of exemplary andinnovative environmental/energy management. These case studies include: auditing energy use and carbon emissions;carbon disclosure; purchasing renewable electricity; photovoltaic powered recording studios; biodegradable CD packaging;a green festival awards scheme; combined coach and festival tickets; biodiesel powered generators; LED stage lighting;staff green teams; hybrid/low emissions cars and taxis; rationalised travel (including flights) and energy efficient venues andoffice buildings. Furthermore, a number of companies have appointed dedicated staff with responsibilities for developingand coordinating carbon reduction and energy saving strategies. The research emphasised that senior managementleadership, staffing and financial resources are all critical for effective energy saving and carbon reduction management.
It is important to note, however, that many of these initiatives are still small in scale and almost always limited to a singlecompany. The need – and the opportunity – is to scale up for greater impact through critical mass and mainstreaming. An industry-wide strategy should enable these and additional initiatives to gain greater traction across the industry.
Figure 7.2: GHG emissions from selected non-energy intensive FTSE 500 companies* in 2007, t CO2e
Microsoft
Land Securities
Ericsson
BT Group
HSBC
Hewlett-Packard
Coca-Cola
Tesco & Drug Retailing
0 1 2 3 4 5 6 7 Millions
t CO2e
FTSE 500 Companies
*These companies follow the GHG Protocol for emissions accounting.
Source: Carbon Disclosure Project, 2007
63
7.4 Concluding ObservationsWhile much of the report directly concerns the analysis of actual energy data from the industry, complimenting thiswere in depth interviews and an attitudinal survey which captured attitudes, motivations and ideas for company andindustry responses to climate change. The research study concludes with the following observations.
Observation 1: The UK music industry is not carbon intensive but still will find reducing GHGemissions by 60–80% a challenge. It is not well prepared to deliver this level of climate responsibility. There is agrowing understanding in the industry that it faces both commercial and moral imperatives to act on climate change.
Observation 2: The business case for action is rooted in the inevitability of costs which will attach toGHG emissions as carbon regulation, taxes and trading progressively penalise carbon emissions; equally there will bepositive savings and intangible benefits to businesses which reduce their carbon footprint. Furthermore, climateresponsible companies find competitive advantage with their stakeholders (especially consumers and their own staff).
Observation 3: The moral case reflects the power this particular industry has to influence society moregenerally through its cultural leadership and role modelling. With this power comes the opportunity – and arguablythe responsibility – to set an example by mitigating its own emissions and encouraging climate responsibility among itsglobal audiences.
Observation 4: The industry is made up of many small companies and sectors. The sum total creates alatent mass of interconnected power. There are several factors which inhibit the exercising of that power totackle climate change, the most significant being that no single company or sector can afford to over expose itself tofinancial or branding risks. If the industry acts together within and across sectors the risk will be minimised and theeffect will be greater. In addition support needs to be given to industry champions so they are not acting in isolation.
Observation 5: Energy management is the first step towards carbon disclosure, whereby companiesproduce an annual statement of their carbon emissions with forward-looking reduction targets. Few music companiesare currently reporting carbon emissions across their supply chain. However, this is becoming standard practice forcorporate accountability. The music industry could take a lead by being prepared and willing to participate, pre-regulation, in this transparency process.
7.5 RecommendationsRecommendation 1: On the basis of this study, it is clear that there is widespread support forcoordinated industry actions on climate.
As a first step towards climate leadership, it is recommended that the industry agrees and adopts both short andmedium term goals.
Recommendation 2: In the short term, it is proposed that reducing the industry’s own carbon footprint should be the clear priority.
This should include:
• Undertaking regular GHG emissions audits of business activities.
• Managing building energy use, especially of music venues and offices to target energy savings and low carbontechnology investments by developing GHG/energy accounting systems similar to financial accounting systems.
• Switching to green (i.e. low carbon emissions) electricity tariff, or better still a 100% renewable energy source. (see Box 7a)
• Improving the availability and quality of data, especially in the area of live music performance (in the UK andinternationally).
• Creating a variety of travel schemes, and working with local authorities and events organisers to reduce audiencetransport emissions.
• Moving to low emissions CD packaging.
• Identifying and investing in low carbon business opportunities.
• Organising regular training, knowledge sharing and advice on environmentally responsible choices (best practice,procurement, innovative business models) between companies, artists and staff across the industry.
• Requesting information on environmental performance from suppliers.
• Developing strategic partnerships for joint action – e.g. Greater London Authority Climate Change Action Plan.64
Recommendation 3: Within these programmes it is recommended that ‘beacon’ commitments shouldbe made to demonstrate real commitment and achievable quick wins.
Initial proposals include:
1) Switching to green (i.e. low carbon emissions) electricity tariff, or better still, a 100% renewable energy sourcing.
2) Exploring an industry-wide initiative on low emission CD packaging.
3) Installing low carbon lighting (e.g. LED) in live music venues.
4) Identifying, and highlighting all options for beacon travel plans for event goers, especially those already operating,and transferring taxi contracts to ‘green’ suppliers.
Recommendation 4: In the medium term, the industry should identify its ‘levers of influence’ and usethese to affect policy interventions and public education on climate.
It will be essential for the music industry to establish credibility by delivering a serious and visible set of programmesto reduce its own carbon footprint. Leadership through practical demonstration of actions to reduce GHG emissionswill be more lasting and meaningful than just artist led campaigns.
Recommendation 5: The music industry is centrally influential in lifestyle choices, and therefore has anopportunity to be an important leader in the transformation to a low carbon economy, as emissionsare closely tied to decisions on lifestyle.
The UK music industry could and should be an exemplar in demonstrating how business works in partnership with itssub-contractors and customers to transform its products and services; in minimising the emissions generated; and inbringing an amplified voice to changes in energy infrastructure and in the drive towards a low carbon economy.
Recommendation 6: It is important that the industry is conscious of how celebrity actions andmessages are positioned and construed in response to climate change. Celebrities have influenceddiscussions and actions on climate change in recent years more than ever, shaping how the public understands andengages with climate science and policies. Their audiences can perceive celebrities as ‘experts’ or ‘authorised’ speakers.The celebrity’s motivations, understanding and role on this issue all have a bearing on encouraging climate action.31
7.6 Taking the Research ForwardThis scoping study is the first phase of research to assist the industry to understand and manage its GHG emissions.There are a number of areas where it would be beneficial to undertake further research as the industry develops itsclimate strategy. It is recommended that the industry prioritise research in the following areas:
7.6.1 Audience Travel to Live Music Performances
There is limited knowledge on audience travel, yet this is a significant source of GHG emissions. A travel survey andanalysis is needed of audience travel to festivals, arenas and large music venues. This would provide a more accuratequantification of the GHG emissions. It should examine the potential for changing audience travel modes; incentiveoptions for motivating this change; and the cost for improving public transport schemes to live music performances.
7.6.2 Low Emissions CD packaging
The mainstreaming of a low emissions CD packaging solution would demonstrate leadership on climate change. It has,however, been over ten years since a major record company assessed the environmental impact of different packagingmaterials. That assessment needs to be updated to ensure that any new CD packaging solution chosen by the musicindustry is scientifically proven to be environmentally beneficial – especially in terms of GHG emissions savings.
7.6.3 International Touring
There is very little information on international touring by UK artists. The GHG emissions resulting from this are not,of course, produced by UK music consumers and could be considered the responsibility of other music markets. Ifthe UK music industry is committed to be a leader on climate change, however, it needs to take appropriateresponsibility for its global GHG emissions. This will require a better understanding of the GHG emissions producedthrough international touring and the identification of what UK artists should be doing to reduce these emissions.
31 For example, celebrities taking up the issue as the “heroic individual” seeking “conspicuous redemption”may place greater emphasis on climate change action through the individual rather than a requisite collective(Boykoff and Goodman, 2008). 65
7.6.4 Digital Music Delivery
Digital music delivery is progressively accounting for a greater proportion of music access and listening. The industry’sclimate strategy needs to understand and plan for the changing emissions profile this will cause. The GHG emissions ofdigital music delivery are completely different to those associated with a physical music product.
7.6.5 Carbon Financing for the UK Music Industry
A strong commercial case can already be made for the industry to reduce its GHG emissions. There are somesolutions, especially related to low carbon infrastructure and technology solutions, however, which will requireadditional financing to justify investments. The music industry would benefit from investigating the options for creatinga music industry carbon fund that could support research, development and demonstration of innovative low carboninvestments relevant to the UK music industry.
7.6.6 Communicating Climate Responsibility
The music industry collectively – and artists individually – are frequently used as a vehicle to communicate social,environmental and political issues to mobilise individuals and governments. These communication efforts have hadvarying degrees of success. There is a growing body of research examining the effectiveness of climate changecommunication campaigns. The music industry and artists should be aware of the learning gained from thesecampaigns. The industry should rigorously assess their own communication on climate change to ensure they arewielding their influence successfully.
Box 7a Green ElectricityIn the UK liberalised energy market there are many green electricity products available to consumers. However,these products vary significantly in their green credentials; indeed, the current UK renewable policy landscapeallows electricity suppliers to claim the product they offer is green when this may not be the case. Furthermore,there is not a Code of Practice or an Accreditation Scheme for green electricity, which would ensure consumersare given transparent information on which product to choose.
The three key policies that issue certificates alongside the generated electricity are: Renewables Obligation (RO),the Climate Change Levy (CCL), and Renewable Energy Guarantees of Origin (REGOs). However, each policy hasdifferent definitions of what counts as green electricity. REGOs determine the source of electricity, but manygreen electricity products are sold based on other environmental features, such as green funds or retiringrenewable obligation certificates. A green fund will set aside money into a fund, which is then used to install newgenerating capacity, fund R&D or other environmental projects. Some electricity suppliers also retire ROcertificates, which have the effect of using consumer demand for green electricity to adjust government renewableelectricity targets upwards (Boardman et al., 2006).
Given the difficulty of discerning a green electricity product, a good way for a music company to determine theenvironmental credibility of their energy supplier is by looking at their carbon disclosure information. Eachelectricity supplier has to make available information to consumers about the fuel mix and carbon content of theelectricity they generate. Despite some of the challenges for consumers in purchasing green electricity, it is still apositive step for consumers to drive market demand for low carbon energy sources.
66
20th Century Fox Home Entertainment (July 2007).Methodology and Results of a DVD Product GreenhouseGas Analysis. United States
ACC Liverpool (2007). Media Pack about ACC Liverpool
AGreenerFestival.com (February 2008). A Survey of WhatMusic Fans Think of Green Issues at Live Music Events.Research by Buckinghamshire New University for A GreenerFestival, London
http://www.agreenerfestival.com/newsletters/Music%20Fans%20Want%20Green%20Events.pdf Date Last Accessed: 1 April 2008
Barlow, T, Hickman A. & Boulter P. (2001) Exhaust EmissionFactors 2001: Database and Emission Factors, TRL ReportPR/SE/230/00. Crowthorne, TRL.
Berkhout, F. and Hertin, F. (October 2004). De-materialisingand re-materialising: digital technologies and theenvironment. Futures. Volume 36, Issue 8, pp 903–920
BERR (2007a). Digest of United Kingdom Energy Statistics.Department for Business Enterprise & Regulatory Reform,London
BERR (2007b). Meeting the Challenge: A White Paper onEnergy, May 2007, Cm7124, Department for BusinessEnterprise and Regulatory Reform, London
http://www.berr.gov.uk/files/file39387.pdf Date Last Accessed: 1 April 2008
Boykoff, M. and Goodman, M. (in press). ConspicuousRedemption? Promises and Perils of Celebrity Involvement inClimate Change. Geoforum
Boardman, B., Jardine, C., Lipp, J., (2006). Green ElectricityCode of Practice. Environmental Change Institute, OxfordUniversity, Oxford
Boardman, B. and Palmer, J. (2003). 4CE Final Report –Consumer Choice and Carbon Consciousness: ElectricityDisclosure in Europe. Environmental Change Institute,Oxford University
http://www.eci.ox.ac.uk/research/energy/4ce.php Date Last Accessed: 6 April 2008
BPI (2007). BPI Statistical Handbook 2007. BPI, London
BPI (January 2008). BPI Certified Awards 2007. Market Information, Issue No. 303. BPI, London
CDP (2007). Carbon Disclosure Project Report 2007: GlobalFT500. Written by Innovest on behalf of CDP.
http://www.cdproject.net/cdp5reports.asp Date Last Accessed: 1 April 2008
CIBSE (2004). CIBSE Guide F: Energy Efficiency in Buildings.The Chartered Institution of Building Services Engineers,Page Bros, Norwich
Cooper, Gary. (October 2007). Metal Fatigue: WEEERegulations. MTN Magazine. pp 40-41
Creative and Cultural Skills (2007a). The Creative Blueprint:The Sector Skills Agreement for the Creative and CulturalIndustries – Understanding Supply. Creative and CulturalSkills, London
Creative and Cultural Skills (2007b). The Creative Blueprint:The Sector Skills Agreement for the Creative and CulturalIndustries – The Skills Needs Assessment. Creative andCultural Skills, London
Dane, Cliff (2007). The UK Record Industry Survey 2007.Media Research Publishing Group, Weston-Super-Mare
Defra (February 2008). Government Proposals forStrengthening the Climate Change Bill.
Department for Environment, Food and Rural Affairs,London
http://www.defra.gov.uk/environment/climatechange/uk/legislation/pdf/govt-amendment-package.pdf Date Last Accessed: 1 April 2008
Defra (2007a). Taking Forward the UK Climate Change Bill:The Government Response to Pre-Legislative Scrutiny andPublic Consultation. The Stationery Office, London
Defra (2007b). UK Emissions of Greenhouse Gases, e-Digest: Climate Change. Department for Environment,Food, and Rural Affairs, London
http://www.defra.gov.uk/environment/statistics/globatmos/gagccukem.htm Date Last Accessed: 1 April 2008
Defra (2007c). Action in the UK: The Carbon ReductionCommitment for Large Non-Energy Intensive Industries.Department for Environment, Food and Rural Affairs,London
http://www.defra.gov.uk/environment/climatechange/uk/business/crc/index.htm Date Last Accessed: 1 April 2008
Defra (2007d). Guidelines to Defra’s GHG ConversionFactors for Company Reporting: Annexes Updated June2007. Department for Environment, Food and Rural Affairs,London
http://www.defra.gov.uk/environment/business/envrp/pdf/conversion-factors.pdfDate Last Accessed: 1 April 2008
Section 8 References
67
DfT (2004). “The Future of Transport”, White PaperCM6234. Department for Transport, London
DfT (2006). Transport Statistics Bulletin – National TravelSurvey 2006. Department for Transportation, London
Dokken, D., Griggs, D., Lister, D., McFarland, M and Penner,J. (1999) Aviation and the Global Atmosphere.Intergovernmental Panel on Climate Change, Geneva,Switzerland
http://www.grida.no/climate/ipcc/aviation/ Date LastAccessed: 1 April 2008
Digital Europe (2003). Report for Digital Europe: eBusinessand Sustainable Development (DEESD) Project, IST-2000-28606. A Case Study with EMI: The Environmental and SocialImpact of Digital Music. European Commission, Brussels
EEA (2000). COPERT III: Computer Programme to CalculateEmissions from Road Transport Methodology and EmissionFactors (Version 2.1), Technical report No 49. Copenhagen,European Topic Centre on Air and Climate Change,European Environment Agency (EEA).
eFestivals (2008). Listings of Festivals in 2007.
http://www.efestivals.com/ Date Accessed: 1 April 2008
ERA (2007). ERA Yearbook 2007. Entertainment RetailersAssociation, Bournemouth
European Commission (2002). EU Energy Performance ofBuildings Directive. Directive Implementation AdvisoryGroup, Brussels
http://www.diag.org.uk/media/18832/epd_final.pdf Date LastAccessed: 1 April 2008
European Commission (2002). Com 2002/96/EC: Directiveon Waste Electrical and Electronic Equipment (WEEE).European Commission, Brussels
http://eur-lex.europa.eu/LexUriServ/LexUriServ.do?uri=OJ:L:2003:037:0024:0038:EN:PDF DateLast Accessed: 6 April 2008
European Commission (2003a). Directive 2003/87/EC:Directive establishing a scheme for greenhouse gas emissionallowance trading within the Community and amendingCouncil Directive 96/61/EC. European Commission, Brussels
http://eurlex.europa.eu/LexUriServ/site/en/oj/2003/l_275/l_27520031025en00320046.pdf
Date Last Accessed: 6 April 2008European Commission (2003b). COM 2003/30/EC: Directiveon the promotion of the use of biofuels or other renewablefuels for transport. European Commission, Brussels
http://ec.europa.eu/energy/res/legislation/biofuels_en.htmDate Last Accessed: 6 April 2008
Gibson, Owen (February 2008). Promoters pledge to turnfestivals green. The Guardian, London
http://www.guardian.co.uk/uk/2008/feb/04/musicnews.musicDate Last Accessed: 1 April 2008
GLA (2007). Action Today to Protect Tomorrow – TheMayor’s Climate Change Action Plan: Executive Summary.Greater London Authority, City Hall, London
http://www.london.gov.uk/mayor/environment/climate-change/ccap/index.jsp Date Last Accessed: 1 April 2008
Hanson, T., Hayward, B., and Phelps, A. (December 2007). ASurvey of Live Music in England and Wales in 2007: A Reportfor Department for Culture, Media and Sport. BMRB SocialResearch, London
http://www.culture.gov.uk/NR/rdonlyres/740EAC37-D664-41C0-AF22-86F785004606/0/surveyoflivemusicdec2007.pdfDate Last Accessed: 1 April 2008
Hasted, N. (March 2008). Going Green on the FestivalScene. The Independent London
http://www.independent.co.uk/arts-entertainment/music/features/going-green-on-the-festival-scene-792582.html Date Last Accessed: 1 April 2008
Hogg, N and T Jackson (in press). Dematerialisation andDigital Media. Journal of Industrial Ecology. MIT press,Cambridge
Friends of the Earth (2007). Climate Campaign: case study ofa solar studio. London
http://www.foe.co.uk/campaigns/climate/case_studies/solar_studio.html Date Last Accessed: 7 April 2008
IPCC (2007a). Intergovernmental Panel on Climate Change4th Assessment Report – Climate Change 2007: SynthesisReport – Summary for Policymakers. Cambridge UniversityPress, Cambridge
http://www.ipcc.ch/pdf/assessmentreport/ar4/syr/ar4_syr_spm.pdf Date Last Accessed: 1 April 2008
IPCC (2007b). Intergovernmental Panel on Climate Change4th Assessment Report – Climate Change 2007: The PhysicalScience Basis, Summary for Policymakers. CambridgeUniversity Press, Cambridge
http://www.ipcc.ch/ipccreports/ar4-wg1.htm Date LastAccessed: 1 April 2008
IPCC (2007c). Intergovernmental Panel on Climate Change4th Assessment Report - Climate Change 2007: Impacts,Adaptation and Vulnerability, Summary for Policymakers.Cambridge University Press, Cambridge
http://www.ipcc.ch/ipccreports/ar4-wg2.htm Date LastAccessed: 6 April 2008
IPCC-NGGIP (2000). Good Practice Guidance andUncertainty Management in National Greenhouse GasInventories. Intergovernmental Panel on Climate Change-National Greenhouse Gas Inventories Programme.Cambridge University Press, Cambridge
http://www.ipccnggip.iges.or.jp/public/gp/english/2_Energy.pdf Date Last Accessed: 1 April 2008
68

Maryland, G., Boden, T., Andres, B. (August 2007). UnitedKingdom CO2 Emissions from Fossil-Fuel Burning, CementManufacture, and Gas Flaring: 1751–2004. Carbon DioxideInformation Analysis Center (CDIAC) Database. Oak RidgeNational Laboratory, Oak Ridge,
http://cdiac.ornl.gov/climate/variables.html Date Lastaccessed: 5 April 2008
Mintel (2007). Live Entertainment – UK Market Report.Mintel International Group Ltd, London
Music Industries Association (July 2007). Signposts
Music Week (2007a). Music Week Festivals Map 2007.United Business Media, London
Music Week (2007b). Music Week Directory 2007. UnitedBusiness Media, London
Music Week (2008). Sustainable CD Packaging. UnitedBusiness Media, London
NAA (March 2007). Music and Event Research 2006: Reportfor National Arenas Association. SEC Ltd.
NEAA (2007). “China now no.1 in CO2 emissions; USA insecond position”. Netherlands Environment AssessmentAgency, Bilthoven
http://www.mnp.nl/en/dossiers/Climatechange/moreinfo/Chinanowno1inCO2emissionsUSAinsecondposition.html DateLast Accessed: April 2008
Netcen (2003). National Atmospheric Emissions Inventory(NAEI). Harwell, NETCEN for the Department for theEnvironment, Food and Rural Affairs.
Pollstar Pro (2008) Listings of Artist Touring and Venues in2007
http://www.pollstarpro.com/ Date Last Accessed: February 2008
Past and future CO2 concentrations. (5th April 2005). InUNEP/GRID-Arendal Maps and Graphics Library.http://maps.grida.no/go/graphic/past_and_future_co2_concentrations. Date retrieved: 5 April 2008
Stentiford, C. (July 2007). “Ecological Footprint and CarbonAudit of Radiohead’s North American Tours 2003 and2006”. Best Foot Forward Ltd, Oxford. Commissioned byCourtyard Management.
http://www.radiohead.com/deadairspace/index.php?a=310Date Last Accessed: 1 April 2008
Stern, N., Peters, S., Bakhshi, V., Bowen, A., Cameron, C.,Catovsky, S., Crane, D., Cruickshank, S. Dietz, S., andEdmonson, N. (2006). Stern Review: The Economics ofClimate Change. London. HM Treasury.
http://www.hmtreasury.gov.uk/independent_reviews/stern_review_economics_climate_change/sternreview_summary.cfm Date Last Accessed: 1 April 2008
The Royal Society (January 2008). Sustainable Biofuels:Prospects and Challenges. The Royal Society, London
http://royalsociety.org/displaypagedoc.asp?id=28914 Date Last Accessed: 1 April 2008
T in the Park (2007). Press Release
Tollefson, J. (Sept 2007). “Pressure for EnvironmentalDisclosure Increases”. Nature. Vol. 449. pp. 383
http://www.nature.com/nature/journal/v449/n7161/full/449383a.html Date Last Accessed: 6 April 2008
UK Parliament (January 2008). Environmental AuditCommittee calls for Moratorium on Biofuels
http://www.parliament.uk/parliamentary_committees/environmental_audit_committee/eac_210108.cfm Date Last Accessed: 1 April 2008
UN FCCC (2008). - http://unfccc.int/2860.php Date Last Accessed: 6 April 2008
Upham, P., Boucher, P., Connor, S., Hemment, D., andWaterman, H. (April 2007). Climate Change and theNorthwest’s Cultural Sector. A Pilot Project by FutureEverything, Tyndall Centre Manchester, Imagination @Lancaster and Creative Concern. Tyndall CentreManchester.
http://www.futuresonic.com/07/eco2.html Date Last Accessed: 6 April 2008
Upham, P., Boucher, P. and Hemment, D. (2008) “Piloting acarbon emissions audit for an international arts festival undertight resource constraints: methods, issues and results”. InGössling, S., Hall, C.M., and Weaver, D. (eds.) (2008).Sustainable Tourism Futures: Perspectives on Systems,Restructuring and Innovations. Routledge
WBCSD and WRI (2004). Greenhouse Gas Protocol: ACorporate Accounting and Reporting Standard – RevisedEdition. World Business Council for SustainableDevelopment, Geneva and World Resources Institute,Washington
http://www.ghgprotocol.org Date Last Accessed: 1 April 2008
Personal communications
Bayley, K. (2008). Entertainment Retailers Association (ERA)– re: consumer attitudes survey to CD packaging.
Craik, C. and Broughton, V. (2008). The Premises Studio –re: photo-voltaic panels.
Daly, A. (2008). Arvato Digital Services – re: CHPtechnology at CD manufacturing facility.
Hinnells, M. (2008). Environmental Change Institute – re:Green Leases.
Lee, A. (2007). Universal Music UK – re: Green Teams.
Noon, J. (2008). IPC Media – re: The Blue Fin Building.
Preiss, R. (2008). Royal Philips Electronics – re: LED lightingsolutions.
69
Contributors
19 Entertainment
1st Column Management
2000 Trees Festival
Academy Music Group
AGreenerFestival.com
AIM
APRS
Arena Convention Centre Liverpool
Arts Council England
Arts Council London
Arvato Digital Services
ATC Management
Bash Creations
Beggars Group UK
Big Life Management
Bigga Fish
BPI
Britannia Row Productions
British Academy ofComposers andSongwriters
British Music Rights
bSkyb
Buckinghamshire NewUniversity
Bucks Music Group
Bug Music
Bulldozer Media
Cherry Red Records
Chrysalis Music
Cinram
City of BirminghamSymphony Orchestra
Consolidated Independent
Continental Drifts
Creative Artists Agency UK
Deep Studios
DfConcerts
Deep Studios
Eden Project
Edwin Shirley Staging
Embargo Management
EMI Music UK & Ireland
EMI Group
ERA
Faber Music
Festival Republic
Film London
Firebrand
Generator
Glastonbury Festival
Glastonbury TV
Greater London Authority
Greenbelt Festival
ITB
In-X-ive
IPC Media
IQ Magazine
JB Pro
June Emerson Wind Music
Just Music
Latitude Festival
Leeds Festival
Live Nation
London PhilharmonicOrchestra
London DevelopmentAgency
Mama Group
Manning Camerata
Material MC
MCPS-PRS Alliance
Metropolis
Miloco Studios
Modo Production
Motif Media
Music from Another Room
Music IndustriesAssociation
Music PublishersAssociation
Music Week
Musicians’ Union
Nettwerk One Music
NME
Odyssey Arena
PDT
Philips Electronics
Pollstar
PPL VPL
PSA
PyrotechnicRadio.com
Queens ParkNeighbourhood Forum
Raw Material
Raymond Records
RCA Label Group UK
Reading Festival
Red Grape Records
Rising Tide
Rough Trade
Royalties Rescues
SJM Concerts
Sincere Management
Sony BMG Music UK
Sound Connections
Stage Three
Stowe Centre
Strong Room
Subject to Negotiation
Sustainable Touring
T in the Park
The Agency Group
The Premises Studios
Universal Music UK
Urban Development
Virgin Retail
Warner Music Group
Westbury Music
Wychwood Festival
Yankim
Adam Driscoll, MamaGroup
Adrian Lee, UniversalMusic UK
Alan McElroy, Cinram
Anthony Daly, ArvatoDigital Services
Brian Message, ATCManagement
Conor McNicholas, NME
Emma Banks, CAA
Feargal Sharkey, Live Music Forum
Gavin Starks, dGen
Graham Crawshaw
Greg Parmley, IQ Magazine
Harry Ross, ManningCamerata
Henry Levalles, Modo
Jeff Burke, Edwin ShirleyStaging
Jim Mawdsley, Generator
Jody Hardy, Embargo
Julia Craik, The Premises
Justine Simons, GreaterLondon Authority
Kate Dunning
Kathryn Knight, FaberMusic
Paul McManus, MIA
Paul Latham, Live Nation
Peter Tudor, Live NationWembley Arena
Richard King, Faber Music
Richard Mollett, BPI
Rob Hallett, AEG
Robin Millar
Rod MacSween, ITB
Russell Braterman,Transport for London
Steve Forster, Mama Group
Stuart Galbraith,Kilimanjaro
Tim Bevan, ModoProductions
Tim Brown, Raw Material
Special thanks to the individual contributors:
70
and to the following companies:

The Environmental Change Institute would like to thank the following for their invaluable contribution to this research:Catherine Bottrill, Geoff Lye, Max Boycoff, Diana Liverman, Russell Layberry, Deborah Strickland, Will Moore,Malcolm Carruthers, Phil Underwood, Andrew Haworth, Julia Haltrecht, Helen Heathfield, Denise Stanley, CatherineLangabeer, Alison Tickell and the board of Julie’s Bicycle.
Also thanks to Tim Jackson and Geoff Cooper, University of Surrey.
The Environmental Change Institute would like to thank the academic reviewers for their helpful comments andfeedback on the report:
Dr. Christian Jardine, Oxford University’s Environmental Change InstituteDr. Paul Upham, Tyndall Centre for Climate Change Research Manchester
71
And thanks to Julie’s Bicycle research sponsors:
The Cultural Leadership Programme
The Brit Trust
Acknowledgements
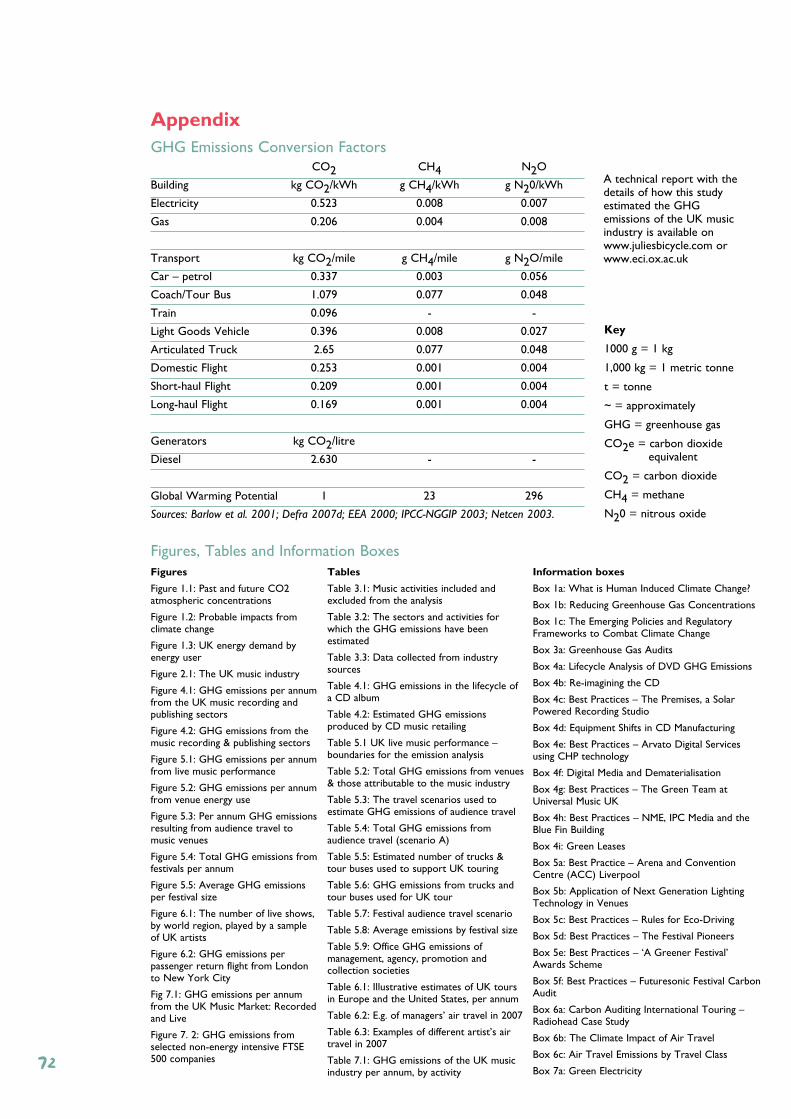
AppendixGHG Emissions Conversion Factors
CO2 CH4 N2O
Building kg CO2/kWh g CH4/kWh g N20/kWh
Electricity 0.523 0.008 0.007
Gas 0.206 0.004 0.008
Transport kg CO2/mile g CH4/mile g N2O/mile
Car – petrol 0.337 0.003 0.056
Coach/Tour Bus 1.079 0.077 0.048
Train 0.096 - -
Light Goods Vehicle 0.396 0.008 0.027
Articulated Truck 2.65 0.077 0.048
Domestic Flight 0.253 0.001 0.004
Short-haul Flight 0.209 0.001 0.004
Long-haul Flight 0.169 0.001 0.004
Generators kg CO2/litre
Diesel 2.630 - -
Global Warming Potential 1 23 296
Sources: Barlow et al. 2001; Defra 2007d; EEA 2000; IPCC-NGGIP 2003; Netcen 2003.
Key
1000 g = 1 kg
1,000 kg = 1 metric tonne
t = tonne
~ = approximately
GHG = greenhouse gas
CO2e = carbon dioxide equivalent
CO2 = carbon dioxide
CH4 = methane
N20 = nitrous oxide
Figures, Tables and Information BoxesFigures
Figure 1.1: Past and future CO2atmospheric concentrations
Figure 1.2: Probable impacts fromclimate change
Figure 1.3: UK energy demand byenergy user
Figure 2.1: The UK music industry
Figure 4.1: GHG emissions per annumfrom the UK music recording andpublishing sectors
Figure 4.2: GHG emissions from themusic recording & publishing sectors
Figure 5.1: GHG emissions per annumfrom live music performance
Figure 5.2: GHG emissions per annumfrom venue energy use
Figure 5.3: Per annum GHG emissionsresulting from audience travel tomusic venues
Figure 5.4: Total GHG emissions fromfestivals per annum
Figure 5.5: Average GHG emissionsper festival size
Figure 6.1: The number of live shows,by world region, played by a sampleof UK artists
Figure 6.2: GHG emissions perpassenger return flight from Londonto New York City
Fig 7.1: GHG emissions per annumfrom the UK Music Market: Recordedand Live
Figure 7. 2: GHG emissions fromselected non-energy intensive FTSE500 companies
Tables
Table 3.1: Music activities included andexcluded from the analysis
Table 3.2: The sectors and activities forwhich the GHG emissions have beenestimated
Table 3.3: Data collected from industrysources
Table 4.1: GHG emissions in the lifecycle ofa CD album
Table 4.2: Estimated GHG emissionsproduced by CD music retailing
Table 5.1 UK live music performance –boundaries for the emission analysis
Table 5.2: Total GHG emissions from venues& those attributable to the music industry
Table 5.3: The travel scenarios used toestimate GHG emissions of audience travel
Table 5.4: Total GHG emissions fromaudience travel (scenario A)
Table 5.5: Estimated number of trucks &tour buses used to support UK touring
Table 5.6: GHG emissions from trucks andtour buses used for UK tour
Table 5.7: Festival audience travel scenario
Table 5.8: Average emissions by festival size
Table 5.9: Office GHG emissions ofmanagement, agency, promotion andcollection societies
Table 6.1: Illustrative estimates of UK toursin Europe and the United States, per annum
Table 6.2: E.g. of managers’ air travel in 2007
Table 6.3: Examples of different artist’s airtravel in 2007
Table 7.1: GHG emissions of the UK musicindustry per annum, by activity
Information boxes
Box 1a: What is Human Induced Climate Change?
Box 1b: Reducing Greenhouse Gas Concentrations
Box 1c: The Emerging Policies and RegulatoryFrameworks to Combat Climate Change
Box 3a: Greenhouse Gas Audits
Box 4a: Lifecycle Analysis of DVD GHG Emissions
Box 4b: Re-imagining the CD
Box 4c: Best Practices – The Premises, a SolarPowered Recording Studio
Box 4d: Equipment Shifts in CD Manufacturing
Box 4e: Best Practices – Arvato Digital Servicesusing CHP technology
Box 4f: Digital Media and Dematerialisation
Box 4g: Best Practices – The Green Team atUniversal Music UK
Box 4h: Best Practices – NME, IPC Media and theBlue Fin Building
Box 4i: Green Leases
Box 5a: Best Practice – Arena and ConventionCentre (ACC) Liverpool
Box 5b: Application of Next Generation LightingTechnology in Venues
Box 5c: Best Practices – Rules for Eco-Driving
Box 5d: Best Practices – The Festival Pioneers
Box 5e: Best Practices – ‘A Greener Festival’Awards Scheme
Box 5f: Best Practices – Futuresonic Festival CarbonAudit
Box 6a: Carbon Auditing International Touring –Radiohead Case Study
Box 6b: The Climate Impact of Air Travel
Box 6c: Air Travel Emissions by Travel Class
Box 7a: Green Electricity72
A technical report with thedetails of how this studyestimated the GHGemissions of the UK musicindustry is available onwww.juliesbicycle.com orwww.eci.ox.ac.uk


28 Berners Street London W1T 3ABp: 020 7436 6112 e: [email protected]
www.juliesbicycle.com
design & print: Positive Design Works, illustrations: Made Up Design, graphs & charts: Deborah Strickland
Printed on paper certified as meeting the requirements of FSC chain of custody, PEFC chain of custody, SGS chain of custody.