Embed Size (px)
Citation preview

1
© 2021 Walgreens Boots Alliance, Inc. All rights reserved.
Fiscal 2021
July 1, 2021
Third Quarter Results
2© 2021 Walgreens Boots Alliance, Inc. All rights reserved. Refer to safe harbor and non-GAAP on page 2 and endnotes on page 22
Safe harbor and non-GAAPCautionary Note Regarding Forward-Looking Statements: All statements in these materials and the related presentation that are not historical including, without limitation, estimates of and goals for future operating, financial and tax performance and results, including our fiscal year 2021 guidance and related assumptions and drivers, as well as forward-looking statements concerning the expected execution and effect of our business strategies, the potential impacts on our business of the spread and impacts of the COVID-19 pandemic, including the estimated impacts herein, our cost-savings and growth initiatives, pilot programs, strategic investments, partnerships and initiatives and restructuring activities and the amounts and timing of their expected impact, including statements relating to our expected cost savings under our Transformational Cost Management and store optimization programs, are forward-looking statements made pursuant to the safe harbor provisions of the Private Securities Litigation Reform Act of 1995. All statements in the future tense and all statements accompanied by words such as “expect,” “likely,” “outlook,” “forecast,” “preliminary,” “pilot,” “would,” “could,” “should,” “can,” “will,” “project,” “intend,” “plan,” “goal,” “guidance,” “target,” “aim,” continue,” “sustain,” “synergy,” “transform,” “accelerate,” “model,” “longterm,” “on track,” “on schedule,” “headwind,” “tailwind,” “believe,” “seek,” “estimate,” “anticipate,” "upcoming," "to come," “may,” “possible,” “assume,” and variations of such words and similar expressions are intended to identify such forward-looking statements. These forward-looking statements are not guarantees of future performance and are subject to risks, uncertainties and assumptions, known or unknown, that could cause actual results to vary materially from those indicated or anticipated.
These risks, assumptions and uncertainties include those described Item 1A (Risk Factors) of our Form 10-K for the fiscal year ended August 31, 2020 and in other documents that we file or furnish with the Securities and Exchange Commission. If one or more of these risks or uncertainties materializes, or if underlying assumptions prove incorrect, actual results may vary materially from those indicated or anticipated by such forward-looking statements. All forward-looking statements we make or that are made on our behalf are qualified by these cautionary statements. You should not place undue reliance on forward-looking statements, which speak only as of the date they are made.
We do not undertake, and expressly disclaim, any duty or obligation to update publicly any forward-looking statement after the date of this presentation, whether as a result of new information, future events, changes in assumptions or otherwise.
Non-GAAP Financial Measures: Today’s presentation includes certain non-GAAP financial measures, including all measures whose label includes the words “adjusted”, “constant currency”, or “free cash flow” or variations of such words and similar expressions, and we refer you to the endnotes on page 22 and the Appendix to the presentation materials available on our investor relations website for reconciliations to the most directly comparable U.S. GAAP financial measures and related information.
These presentation materials, the appendix hereto and the related management presentation are integrally related and are intended to be presented, considered and understood together.
© 2021 Walgreens Boots Alliance, Inc. All rights reserved. 3Refer to safe harbor and non-GAAP on page 2 and endnotes on page 22
Introduction
• Delivered a very strong quarter
• Alliance Healthcare divestiture is complete
• Strong execution in the administration of COVID-19 vaccines in the U.S.
• Continued investments to innovate for the future

4© 2021 Walgreens Boots Alliance, Inc. All rights reserved. Refer to safe harbor and non-GAAP on page 2 and endnotes on page 22
Playing a key role in pandemic recovery
>25m vaccinations administered to date
95% of Walgreens locations administering vaccines
>1,100 off-site clinics in medically underserved communitiesVaccinations
Testing solutions
>9m tests since pandemic onset
Trained pharmacy staff; expanded testing capabilities to ~6k locations
Solidified role in testing, diagnostics and vaccinations

© 2021 Walgreens Boots Alliance, Inc. All rights reserved. 5
WBA FinancialPerformance

© 2021 Walgreens Boots Alliance, Inc. All rights reserved. 6Refer to safe harbor and non-GAAP on page 2 and endnotes on page 22
• Total adjusted EPS $1.51; exceeded expectations ⎯ +81.4% above prior year in constant Fx
• Continuing operations adjusted EPS $1.38⎯ +93.6% above prior year in constant Fx⎯ Includes benefit from COVID-19
• Strong cash generation year-to-date⎯ Operating cash flow $4.3bn ⎯ Free cash flow $3.3bn, +35.8% vs. prior year
• Raising continuing adjusted EPS guidance to ~10% growth at constant Fx
3Q financial highlights

7© 2021 Walgreens Boots Alliance, Inc. All rights reserved. Refer to safe harbor and non-GAAP on page 2 and endnotes on page 22
3Q21 Reported FxB/(W) vs. 3Q20
Constant FxB/(W) vs. 3Q20
Results$ in millions (except EPS)
Sales (continuing) $34,030 + 12.1% + 10.4%
Operating income(continuing)
$1,134GAAP + $2,817$1,459 + 82.9%Adjusted + 82.4%
EPS - total $1.38GAAP + $3.33$1.51 + 83.4%Adjusted + 81.4%
EPS - discontinued $0.11GAAP + 8.8%$0.14 + 14.1%Adjusted + 9.3%
EPS - continuing $1.27GAAP + $3.32$1.38 + 95.1%Adjusted + 93.6%
3Q financial highlights

8© 2021 Walgreens Boots Alliance, Inc. All rights reserved. Refer to safe harbor and non-GAAP on page 2 and endnotes on page 22
YTD21 Reported FxB/(W) vs. YTD20
Constant FxB/(W) vs. YTD20
Results$ in millions (except EPS)
Sales (continuing) $98,247 + 7.2% + 6.1%
Operating income (continuing)
$1,432GAAP + $1,058$3,881 + 4.2%Adjusted + 3.9%
EPS - total $2.21GAAP + $2.12$4.13 + 11.2%Adjusted + 10.3%
EPS - discontinued $0.32GAAP + 18.7%$0.39 + 15.5%Adjusted + 14.1%
EPS - continuing $1.89GAAP + $2.07$3.74 + 10.7%Adjusted + 9.9%
Year-to-date FY21 financial highlights

9© 2021 Walgreens Boots Alliance, Inc. All rights reserved. Refer to safe harbor and non-GAAP on page 2 and endnotes on page 22
United States – financials
1) U.S. segment adj. operating margin excludes impact of adj. ABC equity earnings
3Q21
Sales
B/(W) vs. 3Q20
$28,743 + 5.1%
Adj. gross profit $6,149 + 14.5%
Adj. SG&A % of sales 16.8% - 0.2%p
Adj. operating income $1,471 + 50.3%
YTD21 B/(W) vs. YTD20
$83,250 + 3.1%
$17,525 + 2.9%
17.0% 0.0%p
$3,789 + 2.3%
Continuing operations$ in millions
Adj. operating margin1 4.6% + 1.5%p 4.1% - 0.1%p

10© 2021 Walgreens Boots Alliance, Inc. All rights reserved. Refer to safe harbor and non-GAAP on page 2 and endnotes on page 22
United States – pharmacy
3Q21 vs. 3Q20
3QTotal
+ 8.4%+ 6.3%
+ 9.8%+ 8.7%
Pharmacy sales
Prescriptions
3QComparable
YTDTotal
YTDComparable
+ 6.0%+ 5.1%
+ 3.8%+ 2.3%
• 3Q Rx script comp. grew +9.8% boosted by COVID-19 immunizations ~+6%⎯ COVID-19 vaccinations 17 million in the quarter
• Pharmacy margin increased due to favorable mix from vaccinations
*Total prescription growth negatively impacted by store optimization program 50bps

11© 2021 Walgreens Boots Alliance, Inc. All rights reserved. Refer to safe harbor and non-GAAP on page 2 and endnotes on page 22
United States – retail
3Q21 vs. 3Q203Q
+ 1.4%
+ 1.7%
Total retail sales
Comparable retail sales
YTD
- 2.6%
- 0.5%
• 3Q comp. retail sales +1.7%; excluding tobacco & e-cig. +2.6%, improving sequentially ⎯ Weak cough, cold and flu ebbs and mass personalization boosts results
⎯ Store traffic accelerated as key markets continued to reopen, lapping last year stock-up; transactions +6.5%, basket size -4.5%
⎯ Strength in Photo +54%, Beauty +14.9%, Health & Wellness +7.1% ex. cough, cold, flu
• Margin expanded ~+100bps vs. prior year driven by improved mix
• Digitally initiated retail sales increased +95% in 3Q*Total retail growth negatively impacted by store optimization program 50bps

12© 2021 Walgreens Boots Alliance, Inc. All rights reserved. Refer to safe harbor and non-GAAP on page 2 and endnotes on page 22
International – financials
3Q21
Sales
Constant FxB/(W) vs. 3Q20
$5,288 + 58.7%
Adj. gross profit $1,060 + 38.6%
Adj. SG&A % of sales 18.3% + 9.2%p
Adj. operating income $94 + $222
Adj. operating margin 1.8% + 6.3%p
YTD21
$14,998 + 28.3%
$3,129 + 0.0%
18.7% + 6.7%p
$326 + $152
2.2% + 0.8%p
• Less severe UK restrictions & focused execution led to significant rebound from prior year loss; UK market tracking below prior expectation
• Germany wholesale JV provided +46.6% sales lift, dilutive to adj. operating margin by ~-200bps
Continuing operations$ in millions
Constant FxB/(W) vs. YTD20

13© 2021 Walgreens Boots Alliance, Inc. All rights reserved. Refer to safe harbor and non-GAAP on page 2 and endnotes on page 22
Boots UK – financials
3Q21 vs. 3Q20 (constant Fx)
Pharmacy comp. sales
Retail comp. sales
• Pharmacy comp. sales +3.7%; demand for additional services and favorable NHS funding phasing more than offset lower prescription volume
• Phased reopening of UK high street led to rebound in retail sales, lapped severe COVID-19 restrictions in prior year⎯ High street retail sales improved significantly in April/May
⎯ Discretionary categories showing strong rebound; Beauty +85% vs. prior year
⎯ Boots.com sales +42%, slightly pulling back in May as customers return to stores
⎯ Store transactions remain below pre-COVID level due to slower pace of market recovery
3Q
+ 3.7%
+ 38.7%
YTD
+ 3.1%
- 3.2%

© 2021 Walgreens Boots Alliance, Inc. All rights reserved. 14Refer to safe harbor and non-GAAP on page 2 and endnotes on page 22
Cash flow
Operating cash flow
$ in millions
Cash capital expenditure
Free cash flow
YTD21 B/(W)
vs. YTD20
$4,310 $912
$1,001 ($39)
$3,309 $873
• Strong free cash flow generation up +36% vs. prior year₋ Reflects strong operating profit performance and continued focus on working capital, led
by payment terms and U.S. pharmacy inventory
₋ YTD21 cash flow includes some favorable phasing and one-time items

© 2021 Walgreens Boots Alliance, Inc. All rights reserved. 15Refer to safe harbor and non-GAAP on page 2 and endnotes on page 22
Fiscal year 2021 guidance• Completed the divestiture of Alliance Healthcare
• Maintaining TCMP goal of delivering in excess of $2bn in annual cost savings by FY22
• 3Q especially strong⎯ Year-ago quarter exceptionally weak due to the peak of pandemic and “stay-at-home” restrictions⎯ Retail recovery through improved footfall in the U.S. and less severe COVID-19 restrictions in UK⎯ Peak quarter for COVID-19 vaccine; 17 million vaccines completed
• 4Q continuing adj. EPS YoY growth rate expected to slow sequentially⎯ 4Q20 COVID-19 impact less severe than 3Q20⎯ Lower level of COVID-19 vaccinations in 4Q21 compared to 3Q21⎯ Significant investments as we accelerate digital & healthcare plans

16© 2021 Walgreens Boots Alliance, Inc. All rights reserved. Refer to safe harbor and non-GAAP on page 2 and endnotes on page 22
• Raising guidance from mid-to-high single digit to ~10% adj. EPS growth
• Key swing factors:
₋ Vaccinations: now expecting 28 million driven by strong execution
₋ COVID-19 recovery and lapping prior year PPE
₋ Increase in investments
Constant currency continuing operations adj. EPS growth: ~10%
Fiscal year 2021 guidance

© 2021 Walgreens Boots Alliance, Inc. All rights reserved. 17
Strategic Initiatives

© 2020 Walgreens Boots Alliance, Inc. All rights reserved. Confidential and Proprietary information. For internal use only. 1818Refer to safe harbor and non-GAAP on page 2 and endnotes on page 22© 2021 Walgreens Boots Alliance, Inc. All rights reserved.
• Redefining operations with iA Rx automation⎯ Automated micro-fulfillment centers operating in Phoenix & Dallas
will soon ramp to serve ~1,000 locations ⎯ Best in class efficiency while unlocking the pharmacist time⎯ Next nine markets identified for deployment by end of CY22
• Accelerating Village Medical at Walgreens rollout, enhancing pharmacy role in coordinated care models⎯ Completed prior announced 46 locations, next 35 locations to be
completed by end of CY21, bringing total co-locations to >80 ⎯ Formed integrated virtual collaboration in 9 Phoenix & Houston
Walgreens locations to provide patients coordinated care offerings without VMD onsite
• Providing further convenience for testing & diagnostics
U.S. Pharmacy initiatives

© 2020 Walgreens Boots Alliance, Inc. All rights reserved. Confidential and Proprietary information. For internal use only. 1919Refer to safe harbor and non-GAAP on page 2 and endnotes on page 22© 2021 Walgreens Boots Alliance, Inc. All rights reserved.
• Customer Engagement Platform learnings enhancing personalized offerings⎯ myWalgreens membership +34% vs. prior quarter to ~75m members to date⎯ Mass personalization boosted 3Q retail sales comps by ~100bps
• Omni-channel offerings resonating & building momentum⎯ Curbside & drive thru pick-up contributing to strong digital growth
~6m orders completed to date⎯ Expanded national last mile delivery capabilities
• Alternative profit streams materializing ⎯ Walgreens Advertising Group expanded 3rd party CPG offerings ⎯ Financial services Debit & Credit Card offerings launch in early fall
• National deployment of Retail SAP S/4HANA completed⎯ Unlocks omni-channel retail, operating efficiencies, and working capital
U.S. Retail initiatives

© 2020 Walgreens Boots Alliance, Inc. All rights reserved. Confidential and Proprietary information. For internal use only. 2020Refer to safe harbor and non-GAAP on page 2 and endnotes on page 22© 2021 Walgreens Boots Alliance, Inc. All rights reserved.
• Launching innovative digital healthcare services⎯ Boots Health Hub providing a marketplace for Boots and
third-party online healthcare services⎯ Boots ONLINE DOCTOR launched; delivering a market
leading proposition for >40 conditions with more to come
• Strong market share gains particularly in Beauty⎯ >500 Beauty brands now available with 34 new brands
launched this fiscal year⎯ Boots major marketing campaign underway, capitalizing on
easing UK restrictions
• Playing a key role in supporting UK COVID-19 response⎯ >3m tests since pandemic onset, majority in partnership
with NHS; >200 stores offering private testing⎯ Operating 51 vaccination centers
• GuoDa pharmacy store expansion continues to ~8,300 stores, +2,500 locations vs. prior year
International initiatives

© 2020 Walgreens Boots Alliance, Inc. All rights reserved. Confidential and Proprietary information. For internal use only. 21© 2021 Walgreens Boots Alliance, Inc. All rights reserved. Refer to safe harbor and non-GAAP on page 2 and endnotes on page 22 21
©2021WalgreensBootsAlliance,Inc.Allrightsreserved.
Endnotes
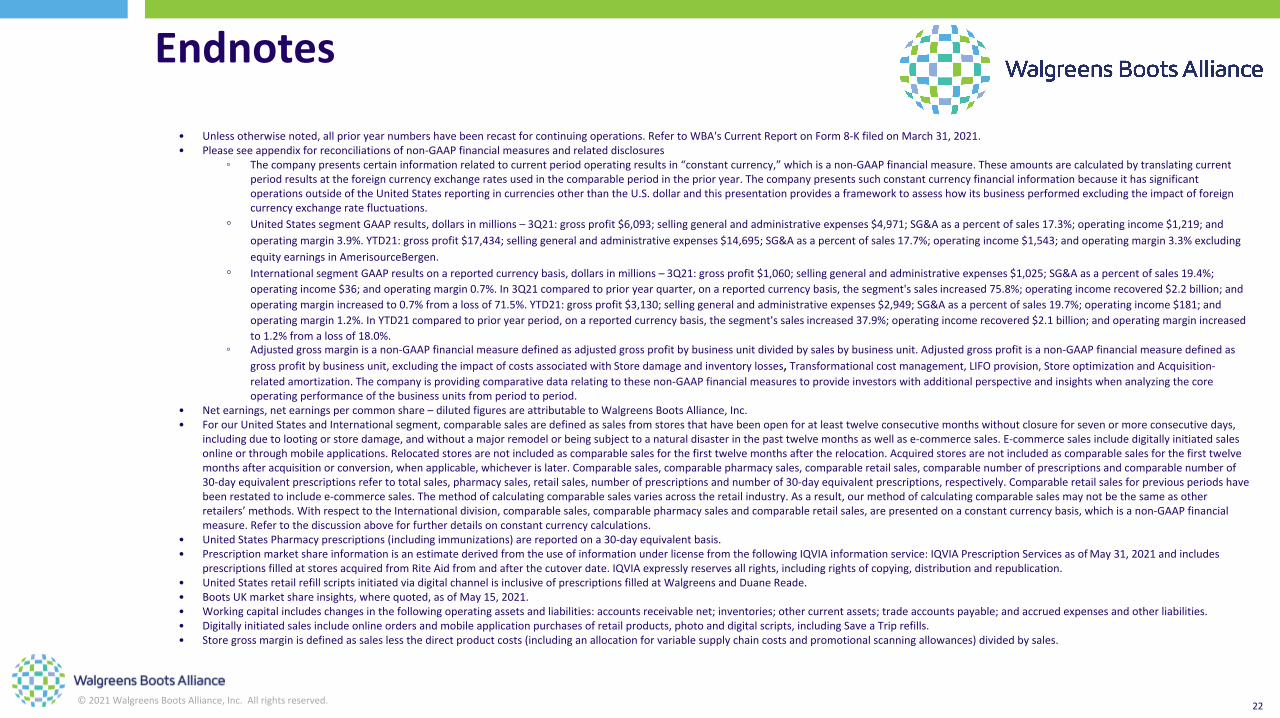
• Unlessotherwisenoted,allprioryearnumbershavebeenrecastforcontinuingoperations.RefertoWBA'sCurrentReportonForm8-KfiledonMarch31,2021.• Pleaseseeappendixforreconciliationsofnon-GAAPfinancialmeasuresandrelateddisclosures
◦ Thecompanypresentscertaininformationrelatedtocurrentperiodoperatingresultsin“constantcurrency,”whichisanon-GAAPfinancialmeasure.Theseamountsarecalculatedbytranslatingcurrentperiodresultsattheforeigncurrencyexchangeratesusedinthecomparableperiodintheprioryear.ThecompanypresentssuchconstantcurrencyfinancialinformationbecauseithassignificantoperationsoutsideoftheUnitedStatesreportingincurrenciesotherthantheU.S.dollarandthispresentationprovidesaframeworktoassesshowitsbusinessperformedexcludingtheimpactofforeigncurrencyexchangeratefluctuations.
◦ UnitedStatessegmentGAAPresults,dollarsinmillions–3Q21:grossprofit$6,093;sellinggeneralandadministrativeexpenses$4,971;SG&Aasapercentofsales17.3%;operatingincome$1,219;andoperatingmargin3.9%.YTD21:grossprofit$17,434;sellinggeneralandadministrativeexpenses$14,695;SG&Aasapercentofsales17.7%;operatingincome$1,543;andoperatingmargin3.3%excludingequityearningsinAmerisourceBergen.
◦ InternationalsegmentGAAPresultsonareportedcurrencybasis,dollarsinmillions–3Q21:grossprofit$1,060;sellinggeneralandadministrativeexpenses$1,025;SG&Aasapercentofsales19.4%;operatingincome$36;andoperatingmargin0.7%.In3Q21comparedtoprioryearquarter,onareportedcurrencybasis,thesegment'ssalesincreased75.8%;operatingincomerecovered$2.2billion;andoperatingmarginincreasedto0.7%fromalossof71.5%.YTD21:grossprofit$3,130;sellinggeneralandadministrativeexpenses$2,949;SG&Aasapercentofsales19.7%;operatingincome$181;andoperatingmargin1.2%.InYTD21comparedtoprioryearperiod,onareportedcurrencybasis,thesegment'ssalesincreased37.9%;operatingincomerecovered$2.1billion;andoperatingmarginincreasedto1.2%fromalossof18.0%.
◦ Adjustedgrossmarginisanon-GAAPfinancialmeasuredefinedasadjustedgrossprofitbybusinessunitdividedbysalesbybusinessunit.Adjustedgrossprofitisanon-GAAPfinancialmeasuredefinedasgrossprofitbybusinessunit,excludingtheimpactofcostsassociatedwithStoredamageandinventorylosses,Transformationalcostmanagement,LIFOprovision,StoreoptimizationandAcquisition-relatedamortization.Thecompanyisprovidingcomparativedatarelatingtothesenon-GAAPfinancialmeasurestoprovideinvestorswithadditionalperspectiveandinsightswhenanalyzingthecoreoperatingperformanceofthebusinessunitsfromperiodtoperiod.
• Netearnings,netearningspercommonshare–dilutedfiguresareattributabletoWalgreensBootsAlliance,Inc.• ForourUnitedStatesandInternationalsegment,comparablesalesaredefinedassalesfromstoresthathavebeenopenforatleasttwelveconsecutivemonthswithoutclosureforsevenormoreconsecutivedays,
includingduetolootingorstoredamage,andwithoutamajorremodelorbeingsubjecttoanaturaldisasterinthepasttwelvemonthsaswellase-commercesales.E-commercesalesincludedigitallyinitiatedsalesonlineorthroughmobileapplications.Relocatedstoresarenotincludedascomparablesalesforthefirsttwelvemonthsaftertherelocation.Acquiredstoresarenotincludedascomparablesalesforthefirsttwelvemonthsafteracquisitionorconversion,whenapplicable,whicheverislater.Comparablesales,comparablepharmacysales,comparableretailsales,comparablenumberofprescriptionsandcomparablenumberof30-dayequivalentprescriptionsrefertototalsales,pharmacysales,retailsales,numberofprescriptionsandnumberof30-dayequivalentprescriptions,respectively.Comparableretailsalesforpreviousperiodshavebeenrestatedtoincludee-commercesales.Themethodofcalculatingcomparablesalesvariesacrosstheretailindustry.Asaresult,ourmethodofcalculatingcomparablesalesmaynotbethesameasotherretailers’methods.WithrespecttotheInternationaldivision,comparablesales,comparablepharmacysalesandcomparableretailsales,arepresentedonaconstantcurrencybasis,whichisanon-GAAPfinancialmeasure.Refertothediscussionaboveforfurtherdetailsonconstantcurrencycalculations.
• UnitedStatesPharmacyprescriptions(includingimmunizations)arereportedona30-dayequivalentbasis.• PrescriptionmarketshareinformationisanestimatederivedfromtheuseofinformationunderlicensefromthefollowingIQVIAinformationservice:IQVIAPrescriptionServicesasofMay31,2021andincludes
prescriptionsfilledatstoresacquiredfromRiteAidfromandafterthecutoverdate.IQVIAexpresslyreservesallrights,includingrightsofcopying,distributionandrepublication.• UnitedStatesretailrefillscriptsinitiatedviadigitalchannelisinclusiveofprescriptionsfilledatWalgreensandDuaneReade.• BootsUKmarketshareinsights,wherequoted,asofMay15,2021.• Workingcapitalincludeschangesinthefollowingoperatingassetsandliabilities:accountsreceivablenet;inventories;othercurrentassets;tradeaccountspayable;andaccruedexpensesandotherliabilities.• Digitallyinitiatedsalesincludeonlineordersandmobileapplicationpurchasesofretailproducts,photoanddigitalscripts,includingSaveaTriprefills.• Storegrossmarginisdefinedassaleslessthedirectproductcosts(includinganallocationforvariablesupplychaincostsandpromotionalscanningallowances)dividedbysales.
22

©2021WalgreensBootsAlliance,Inc.Allrightsreserved.
Appendix
23
Theinformationonthefollowingpagesprovidesreconciliationsofthesupplementalnon-GAAPfinancialmeasures,asdefinedunderSECrules,presentedinthispresentationanddiscussedontherelatedconferencecalltothemostdirectlycomparablefinancialmeasurescalculatedandpresentedinaccordancewithgenerallyacceptedaccountingprinciplesintheUnitedStates(GAAP).Thecompanyhasprovidedthenon-GAAPfinancialmeasuresinthepresentation,whicharenotcalculatedorpresentedinaccordancewithGAAP,assupplementalinformationandinadditiontothefinancialmeasuresthatarecalculatedandpresentedinaccordancewithGAAP.Pleaserefertothenotestothe“NetEarningsandDilutedNetEarnings(Loss)PerShare”reconciliationtableonslide28fordefinitionsofnon-GAAPfinancialmeasuresandrelatedadjustmentspresentedinthispresentation.Thesesupplementalnon-GAAPfinancialmeasuresarepresentedbecausemanagementhasevaluatedthecompany’sfinancialresultsbothincludingandexcludingtheadjusteditemsortheeffectsofforeigncurrencytranslation,asapplicable,andbelievethatthesupplementalnon-GAAPfinancialmeasurespresentedprovideadditionalperspectiveandinsightswhenanalyzingthecoreoperatingperformanceofthecompany’sbusinessfromperiodtoperiodandtrendsinthecompany’shistoricaloperatingresults.Thesesupplementalnon-GAAPfinancialmeasuresshouldnotbeconsideredsuperiorto,asasubstitutefororasanalternativeto,andshouldbeconsideredinconjunctionwith,theGAAPfinancialmeasurespresentedinthepresentation.Thecompanydoesnotprovideareconciliationfornon-GAAPestimatesonaforward-lookingbasis(includingtheinformationrelatedtofiscalyear2021guidance)whereitisunabletoprovideameaningfuloraccuratecalculationorestimationofreconcilingitemsandtheinformationisnotavailablewithoutunreasonableeffort.Thisisduetotheinherentdifficultyofforecastingthetimingoramountofvariousitemsthathavenotyetoccurred,areoutofthecompany’scontroland/orcannotbereasonablypredicted,andthatwouldimpactdilutednetearningspershare,themostdirectlycomparableforward-lookingGAAPfinancialmeasure.Forthesamereasons,thecompanyisunabletoaddresstheprobablesignificanceoftheunavailableinformation.Forward-lookingnon-GAAPfinancialmeasuresprovidedwithoutthemostdirectlycomparableGAAPfinancialmeasuresmayvarymateriallyfromthecorrespondingGAAPfinancialmeasures.
Thecompanyconsiderscertainmetrics,includingallcomparablemetrics,numberofprescriptions,numberof30-dayequivalentprescriptionsandnumberoflocationsatperiodend,tobekeyperformanceindicatorsbecausethecompany'smanagementhasevaluateditsresultsofoperationsusingthesemetricsandbelievesthatthesekeyperformanceindicatorspresentedprovideadditionalperspectiveandinsightswhenanalyzingthecoreoperatingperformanceofthecompanyfromperiodtoperiodandtrendsinitshistoricaloperatingresults.Thesekeyperformanceindicatorsshouldnotbeconsideredsuperiorto,asasubstitutefororasanalternativeto,andshouldbeconsideredinconjunctionwith,theGAAPfinancialmeasurespresentedherein.Thesemeasuresmaynotbecomparabletosimilarly-titledperformanceindicatorsusedbyothercompanies.
Amountsmaynotaddduetorounding.AllpercentageshavebeencalculatedusingunroundedamountsforthethreeandninemonthsendedMay31,2021.
CertainassumptionsandsupplementalinformationUnlessotherwiseindicatedorthecontextotherwiserequires:
• Thispresentationassumesconstantcurrencyexchangeratesafterthedatehereofbasedoncurrentrates;and• Allfinancialestimatesandgoalsassumeconstantcurrencyexchangeratesafterthedatehereofbasedoncurrentratesandnomajormergers,acquisitions,divestituresor
strategictransactions.
Referencesinthispresentationtothe“company,”“we,”“us”or“our”refertoWalgreensBootsAlliance,Inc.anditssubsidiaries,anddonotincludeunconsolidatedpartially-ownedentities,exceptasotherwiseindicatedorthecontextotherwiserequires.OurfiscalyearendsonAugust31,andreferenceshereinto“fiscal2021”refertoourfiscalyearendedAugust31,2021.
©2021WalgreensBootsAlliance,Inc.Allrightsreserved. 24
ReconciliationofNon-GAAPfinancialmeasuresWalgreensBootsAlliance,Inc.andSubsidiaries
SupplementalInformation(unaudited)(inmillions)
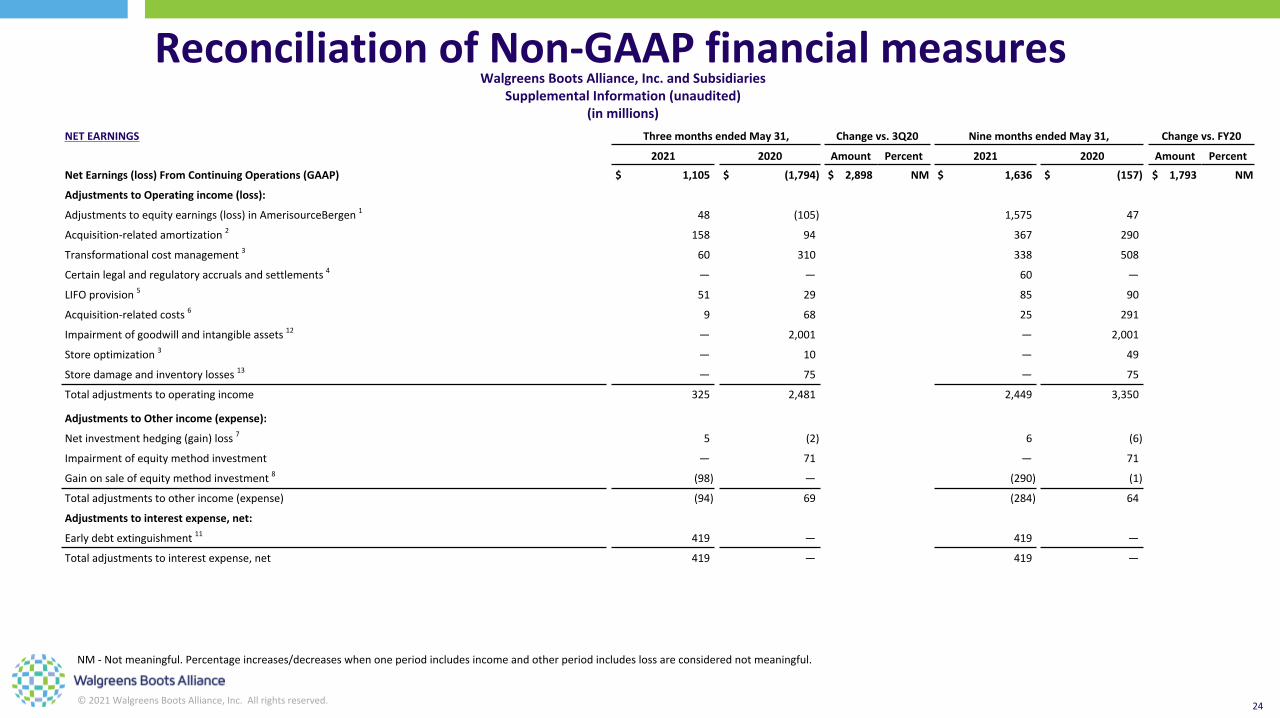
NETEARNINGS ThreemonthsendedMay31, Changevs.3Q20 NinemonthsendedMay31, Changevs.FY20
2021 2020 Amount Percent 2021 2020 Amount Percent
NetEarnings(loss)FromContinuingOperations(GAAP) $ 1,105 $ (1,794) $ 2,898 NM $ 1,636 $ (157) $ 1,793 NM
AdjustmentstoOperatingincome(loss):
Adjustmentstoequityearnings(loss)inAmerisourceBergen1 48 (105) 1,575 47
Acquisition-relatedamortization2 158 94 367 290
Transformationalcostmanagement3 60 310 338 508
Certainlegalandregulatoryaccrualsandsettlements4 — — 60 —
LIFOprovision5 51 29 85 90
Acquisition-relatedcosts6 9 68 25 291
Impairmentofgoodwillandintangibleassets12 — 2,001 — 2,001
Storeoptimization3 — 10 — 49
Storedamageandinventorylosses13 — 75 — 75
Totaladjustmentstooperatingincome 325 2,481 2,449 3,350
AdjustmentstoOtherincome(expense):
Netinvestmenthedging(gain)loss7 5 (2) 6 (6)
Impairmentofequitymethodinvestment — 71 — 71
Gainonsaleofequitymethodinvestment8 (98) — (290) (1)
Totaladjustmentstootherincome(expense) (94) 69 (284) 64
Adjustmentstointerestexpense,net:
Earlydebtextinguishment11 419 — 419 —
Totaladjustmentstointerestexpense,net 419 — 419 —
NM-Notmeaningful.Percentageincreases/decreaseswhenoneperiodincludesincomeandotherperiodincludeslossareconsiderednotmeaningful.

©2021WalgreensBootsAlliance,Inc.Allrightsreserved. 25
ReconciliationofNon-GAAPfinancialmeasuresWalgreensBootsAlliance,Inc.andSubsidiaries
SupplementalInformation(unaudited)(inmillions)
NETEARNINGS ThreemonthsendedMay31, Changevs.3Q20 NinemonthsendedMay31, Changevs.FY20
2021 2020 Amount Percent 2021 2020 Amount Percent
Adjustmentstoincometaxprovision(benefit):
U.S.taxlawchanges9 — — — (6)
Taximpactofadjustments9 10 (180) (104) (350)
Equitymethodnon-cashtax9 17 53 (309) 52
Totaladjustmentstoincometaxprovision(benefit) 27 (127) (412) (303)
Adjustmentstoposttaxequityearningsfromotherequitymethodinvestments:
Adjustmentstoequityearningsinotherequitymethodinvestments10 (557) 3 (520) 47
Totaladjustmentstoposttaxequityearningsfromotherequitymethodinvestments (557) 3 (520) 47
Adjustmentstonet(loss)attributabletononcontrollinginterests:
Transformationalcostmanagement3 — — 2 —
Impairmentofgoodwillandintangibleassets12 — (14) — (14)
LIFOprovision5 (1) — (7) —
Acquisition-relatedamortization2 (30) — (46) —
Totaladjustmentstonet(loss)attributabletononcontrollinginterests (30) (14) (50) (14)
AdjustednetearningsattributabletoContinuingOperations(Non-GAAPmeasure)$ 1,194 $ 618 $ 576 93.1% $ 3,237 $ 2,985 $ 251 8.4%

©2021WalgreensBootsAlliance,Inc.Allrightsreserved. 26
ReconciliationofNon-GAAPfinancialmeasuresWalgreensBootsAlliance,Inc.andSubsidiaries
SupplementalInformation(unaudited)(inmillions)
NETEARNINGS ThreemonthsendedMay31, Changevs.3Q20 NinemonthsendedMay31, Changevs.FY20
2021 2020 Amount Percent 2021 2020 Amount Percent
NetearningsattributabletoWalgreensBootsAlliance,Inc.–discontinuedoperations(GAAP) $ 92 $ 86 $ 7 7.8% $ 279 $ 241 $ 39 16.2%
Acquisition-relatedamortization2 — 19 28 57
Acquisition-relatedcosts6 39 — 49 —
Transformationalcostmanagement3 (8) 4 1 15
Taximpactofadjustments9 (5) (4) (15) (11)
TotaladjustmentstonetearningsattributabletoWalgreensBootsAlliance,Inc.–discontinuedoperations $ 26 $ 19 $ 62 $ 61
AdjustednetearningsattributabletoWalgreensBootsAlliance,Inc.–discontinuedoperations(Non-GAAPmeasure) $ 119 $ 105 $ 14 13.0% $ 342 $ 303 $ 39 13.0%
AdjustednetearningsattributabletoWalgreensBootsAlliance,Inc.-(Non-GAAPmeasure) $ 1,313 $ 723 $ 589 81.5% $ 3,579 $ 3,288 $ 291 8.8%

©2021WalgreensBootsAlliance,Inc.Allrightsreserved.
ReconciliationofNon-GAAPfinancialmeasures
DILUTEDNETEARNINGS(LOSS)PERSHARE ThreemonthsendedMay31, Changevs.3Q20 NinemonthsendedMay31, Changevs.FY20
2021 2020 Amount Percent 2021 2020 Amount Percent
Dilutednetearningspercommonshare-continuingoperations(GAAP)14 $ 1.27 $ (2.05) $ 3.32 NM $ 1.89 $ (0.18) $ 2.07 NM
Adjustmentstooperatingincome 0.38 2.83 2.83 3.79
Adjustmentstootherincome(expense) (0.11) 0.08 (0.33) 0.07
Adjustmentstointerestexpense,net 0.48 — 0.48 —
Adjustmentstoincometaxprovision(benefit) 0.03 (0.14) (0.48) (0.34)
Adjustmentstoearningsfromotherequitymethodinvestments10 (0.64) — (0.60) 0.05
Adjustmentstonetearnings(loss)attributabletononcontrollinginterests (0.03) (0.02) (0.06) (0.02)
Adjusteddilutednetearningspercommonshare-continuingoperations(Non-GAAPmeasure) $ 1.38 $ 0.71 $ 0.67 95.1% $ 3.74 $ 3.37 $ 0.36 10.7%
Dilutednetearningspercommonshare-discontinuedoperations(GAAP) 0.11 0.10 $ 0.01 8.9% 0.32 0.27 $ 0.05 18.7%
Totaladjustmentstonetearnings(loss)attributabletoWalgreensBootsAlliance,Inc.–discontinuedoperations 0.03 0.02 0.07 0.07
Adjusteddilutednetearningspercommonshare-discontinuedoperations(Non-GAAPmeasure) 0.14 0.12 $ 0.02 14.1% $ 0.39 $ 0.34 $ 0.05 15.5%
Adjusteddilutednetearningspercommonshare(Non-GAAPmeasure) $ 1.51 $ 0.83 $ 0.69 83.4% $ 4.13 $ 3.72 $ 0.42 11.2%
Weightedaveragecommonsharesoutstanding,diluted(inmillions)15 867.0 876.1 866.2 884.7
27
WalgreensBootsAlliance,Inc.andSubsidiariesSupplementalInformation(unaudited)
NM-Notmeaningful.Percentageincreases/decreaseswhenoneperiodincludesincomeandotherperiodincludeslossareconsiderednotmeaningful.

©2021WalgreensBootsAlliance,Inc.Allrightsreserved.
ReconciliationofNon-GAAPfinancialmeasures
28
1 Adjustmentstoequityearnings(loss)inAmerisourceBergenconsistoftheCompany’sproportionateshareofnon-GAAPadjustmentsreportedbyAmerisourceBergenconsistentwiththeCompany’snon-GAAPmeasures.TheCompanyrecognizedequitylossesinAmerisourceBergenof$1,373millionduringthethreemonthsendedNovember30,2020.TheseequitylossesareprimarilyduetoAmerisourceBergenrecognitionof$5.6billion,netoftax,chargesrelatedtoitsongoingopioidlitigationinitsfinancialstatementsforthethreemonthsperiodendedSeptember30,2020.
2 Acquisition-relatedamortizationincludesamortizationofacquisition-relatedintangibleassetsandinventoryvaluationadjustments.Amortizationofacquisition-relatedintangibleassetsincludesamortizationofintangiblesassetssuchascustomerrelationships,tradenames,trademarksandcontractintangibles.Intangibleassetamortizationexcludedfromtherelatednon-GAAPmeasurerepresentstheentireamountrecordedwithinthecompany’sGAAPfinancialstatements.Therevenuegeneratedbytheassociatedintangibleassetshasnotbeenexcludedfromtherelatednon-GAAPmeasures.Amortizationexpense,unliketherelatedrevenue,isnotaffectedbyoperationsofanyparticularperiodunlessanintangibleassetbecomesimpairedortheestimatedusefullifeofanintangibleassetisrevised.Thesechargesareprimarilyrecordedwithinselling,generalandadministrativeexpenses.Businesscombinationaccountingprinciplesrequireustomeasureacquiredinventoryatfairvalue.Thefairvalueoftheinventoryreflectscostofacquiredinventoryandaportionoftheexpectedprofitmargin.Theacquisition-relatedinventoryvaluationadjustmentsexcludestheexpectedprofitmargincomponentfromcostofsalesrecordedunderthebusinesscombinationaccountingprinciples.
3 TransformationalCostManagementProgramandStoreOptimizationProgramchargesarecostsassociatedwithaformalrestructuringplan.Thesechargesareprimarilyrecordedwithinselling,generalandadministrativeexpenses.Thesecostsdonotreflectcurrentoperatingperformanceandareimpactedbythetimingofrestructuringactivity.
4 Certainlegalandregulatoryaccrualsandsettlementsrelatetosignificantchargesassociatedwithcertainlegalproceedings.TheCompanyexcludesthesechargeswhenevaluatingoperatingperformancebecauseitdoesnotincursuchchargesonapredictablebasisandexclusionofsuchchargesenablesmoreconsistentevaluationoftheCompany’soperatingperformance.Thesechargesarerecordedwithinselling,generalandadministrativeexpenses.
5 Thecompany’sUnitedStatessegmentinventoryisaccountedforusingthelast-in-first-out(“LIFO”)method.ThisadjustmentrepresentstheimpactoncostofsalesasiftheUnitedStatessegmentinventoryisaccountedforusingfirst-infirst-out(“FIFO”)method.TheLIFOprovisionisaffectedbychangesininventoryquantities,productmix,andmanufacturerpricingpractices,whichmaybeimpactedbymarketandotherexternalinfluences.Therefore,thecompanycannotcontroltheamountsrecognizedortimingoftheseitems.
6 Acquisition-relatedcostsaretransactionandintegrationcostsassociatedwithcertainmerger,acquisitionanddivestituresrelatedactivities.Thesecostsincludeallchargesincurredoncertainmergers,acquisitionanddivestituresrelatedactivities,forexample,includingcostsrelatedtointegrationeffortsforsuccessfulmerger,acquisitionanddivestituresactivities.Thesechargesareprimarilyrecordedwithinselling,generalandadministrativeexpenses.Thesecostsaresignificantlyimpactedbythetimingandcomplexityoftheunderlyingmerger,acquisitionanddivestituresrelatedactivitiesanddonotreflecttheCompany’scurrentoperatingperformance.
7 Gainorlossoncertainderivativeinstrumentsusedaseconomichedgesofthecompany’snetinvestmentsinforeignsubsidiaries.Thesechargesarerecordedwithinotherincome(expense).Wedonotbelievethisvolatilityrelatedtomark-to-marketadjustmentontheunderlyingderivativeinstrumentsreflectsthecompany’soperationalperformance.
8 Includessignificantgainonsaleofequitymethodinvestment.DuringthethreeandninemonthsendedMay31,2021,theCompanyrecordedagainof$98millionand$290millionrespectively,inOtherincomeduetoapartialsaleofownershipinterestsinOptionCareHealthbytheCompany'sequitymethodinvesteeHCGroupHoldings.
9 AdjustmentstoincometaxprovisionincludeadjustmentstotheGAAPbasistaxprovisioncommensuratewithnon-GAAPadjustmentsandcertaindiscretetaxitemsincludingU.S.taxlawchangesandequitymethodnon-cashtax.Thesechargesarerecordedwithinincometaxprovision(benefit).
10 Adjustmentstoposttaxequityearningsfromotherequitymethodinvestmentsconsistoftheproportionateshareofcertainequitymethodinvestees’non-cashitemsorunusualorinfrequentitemsconsistentwiththeCompany’snon-GAAPadjustments.Thesechargesarerecordedwithinposttaxearnings(loss)fromotherequitymethodinvestments.AlthoughtheCompanymayhaveshareholderrightsandboardrepresentationcommensuratewithitsownershipinterestsintheseequitymethodinvestees,adjustmentsrelatingtoequitymethodinvestmentsarenotintendedtoimplythattheCompanyhasdirectcontrolovertheiroperationsandresultingrevenueandexpenses.Moreover,thesenon-GAAPfinancialmeasureshavelimitationsinthattheydonotreflectallrevenueandexpensesoftheseequitymethodinvestees.InthethreemonthsendedMay31,2021duetopartialsalesofownershipinterestsinOptionCareHealth,ourequitymethodinvesteeHCGroupHoldingslosttheabilitytocontrolOptionCareHealthand,therefore,deconsolidatedOptionCareHealthinitsfinancialstatements.Asaresultofthisdeconsolidation,HCGroupHoldingsrecognizedagainof$1.2billionandtheCompanyrecordeditsshareofequityearningsinHCGroupHoldingsof$576millionduringthethreemonthsendedMay31,2021.
11 LossonearlyextinguishmentofdebtrelatedtotheCompany'scashtenderofferstopartiallypurchaseandretire$3.3billionoflongtermU.S.denominatednotes.TheCompanyexcludesthesechargestoenableamoreconsistentevaluationoftheCompany'sfinancialperformance.
12 GoodwillandintangibleassetsarisingfromacquisitionrelatedactivitiesarerecordedbytheCompanyfollowingtheanalysistodeterminethefairvalueofconsiderationpaidandtheassignmentoffairvaluestoalltangibleandintangibleassetsacquired.ImpairmentofgoodwillandintangibleassetsdonotrelatetotheordinarycourseoftheCompany’sbusiness.TheCompanyexcludesthesechargeswhenevaluatingoperatingperformancebecauseitdoesnotincursuchchargesonapredictablebasisandexclusionofsuchchargesenablesmoreconsistentevaluationoftheCompany’soperatingperformance.Thesechargesarerecordedwithinselling,generalandadministrativeexpenses.
13 StoredamageandinventorylossesasaresultoflootingintheU.S.,netofinsurancerecoveries.
14 Duetotheanti-dilutiveeffectresultingfromthereportednetloss,theimpactofpotentiallydilutivesecuritiesonthepershareamountshasbeenomittedfromthequarterlycalculationofweighted-averagecommonsharesoutstandingfordilutedEPSforthethreeandninemonthsendedMay31,2020.
15 Includesimpactofpotentiallydilutivesecuritiesinthequarterlycalculationofweighted-averagecommonshares,dilutedforadjusteddilutednetearningspercommonsharecalculationpurposesforthethreeandninemonthsendedMay31,2020.
WalgreensBootsAlliance,Inc.andSubsidiariesSupplementalInformation(unaudited)
©2021WalgreensBootsAlliance,Inc.Allrightsreserved.
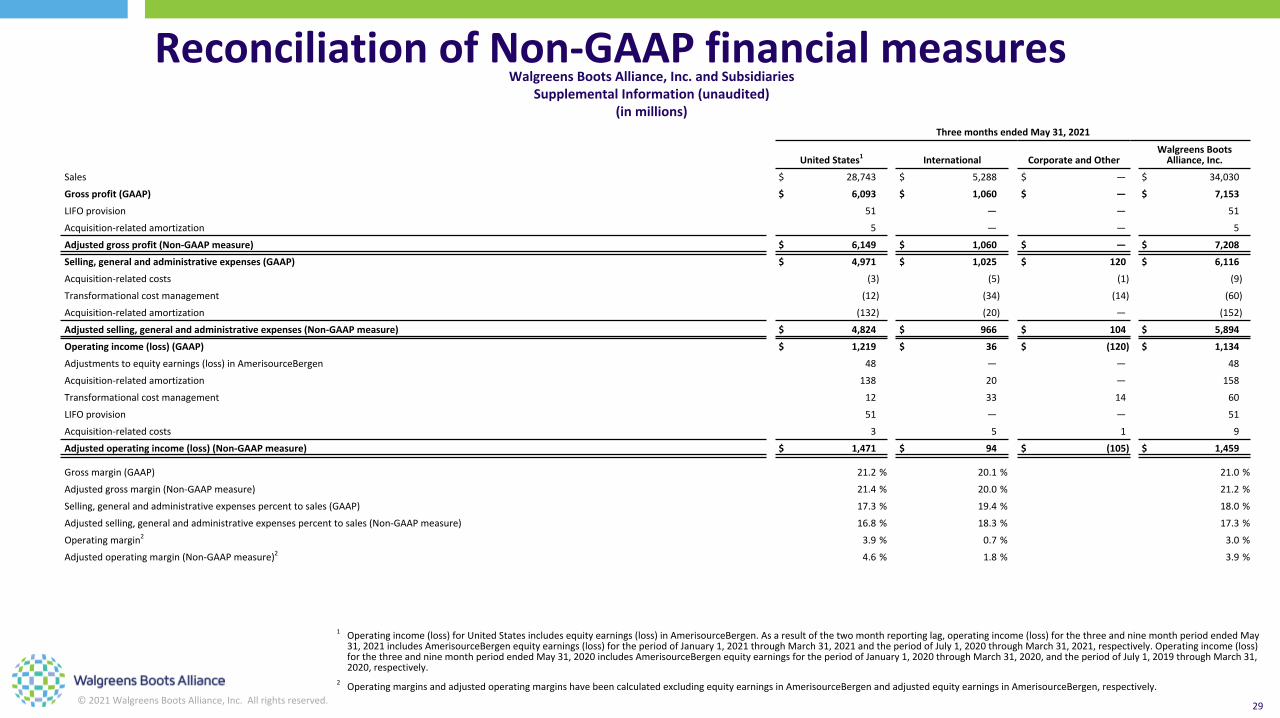
ThreemonthsendedMay31,2021
UnitedStates1 International CorporateandOtherWalgreensBootsAlliance,Inc.
Sales $ 28,743 $ 5,288 $ — $ 34,030
Grossprofit(GAAP) $ 6,093 $ 1,060 $ — $ 7,153
LIFOprovision 51 — — 51
Acquisition-relatedamortization 5 — — 5
Adjustedgrossprofit(Non-GAAPmeasure) $ 6,149 $ 1,060 $ — $ 7,208
Selling,generalandadministrativeexpenses(GAAP) $ 4,971 $ 1,025 $ 120 $ 6,116
Acquisition-relatedcosts (3) (5) (1) (9)
Transformationalcostmanagement (12) (34) (14) (60)
Acquisition-relatedamortization (132) (20) — (152)
Adjustedselling,generalandadministrativeexpenses(Non-GAAPmeasure) $ 4,824 $ 966 $ 104 $ 5,894
Operatingincome(loss)(GAAP) $ 1,219 $ 36 $ (120) $ 1,134
Adjustmentstoequityearnings(loss)inAmerisourceBergen 48 — — 48
Acquisition-relatedamortization 138 20 — 158
Transformationalcostmanagement 12 33 14 60
LIFOprovision 51 — — 51
Acquisition-relatedcosts 3 5 1 9
Adjustedoperatingincome(loss)(Non-GAAPmeasure) $ 1,471 $ 94 $ (105) $ 1,459
Grossmargin(GAAP) 21.2% 20.1% 21.0%
Adjustedgrossmargin(Non-GAAPmeasure) 21.4% 20.0% 21.2%
Selling,generalandadministrativeexpensespercenttosales(GAAP) 17.3% 19.4% 18.0%
Adjustedselling,generalandadministrativeexpensespercenttosales(Non-GAAPmeasure) 16.8% 18.3% 17.3%
Operatingmargin2 3.9% 0.7% 3.0%
Adjustedoperatingmargin(Non-GAAPmeasure)2 4.6% 1.8% 3.9%
ReconciliationofNon-GAAPfinancialmeasuresWalgreensBootsAlliance,Inc.andSubsidiaries
SupplementalInformation(unaudited)(inmillions)
1 Operatingincome(loss)forUnitedStatesincludesequityearnings(loss)inAmerisourceBergen.Asaresultofthetwomonthreportinglag,operatingincome(loss)forthethreeandninemonthperiodendedMay31,2021includesAmerisourceBergenequityearnings(loss)fortheperiodofJanuary1,2021throughMarch31,2021andtheperiodofJuly1,2020throughMarch31,2021,respectively.Operatingincome(loss)forthethreeandninemonthperiodendedMay31,2020includesAmerisourceBergenequityearningsfortheperiodofJanuary1,2020throughMarch31,2020,andtheperiodofJuly1,2019throughMarch31,2020,respectively.
2 OperatingmarginsandadjustedoperatingmarginshavebeencalculatedexcludingequityearningsinAmerisourceBergenandadjustedequityearningsinAmerisourceBergen,respectively.
29

©2021WalgreensBootsAlliance,Inc.Allrightsreserved.
ThreemonthsendedMay31,2020
UnitedStates1 International CorporateandOtherWalgreensBootsAlliance,Inc.
Sales $ 27,357 $ 3,008 $ — $ 30,364
Grossprofit(GAAP) $ 5,275 $ 684 $ — $ 5,959
Transformationalcostmanagement — 1 — 1
LIFOprovision 29 — — 29
Acquisition-relatedcosts 7 — — 7
Storedamageandinventorylosses 60 — — 60
Adjustedgrossprofit(Non-GAAPmeasure) $ 5,372 $ 685 $ — $ 6,056
Selling,generalandadministrativeexpenses(GAAP) $ 4,990 $ 2,835 $ 60 $ 7,884
Acquisition-relatedcosts (57) (1) (3) (61)Transformationalcostmanagement (269) (29) (11) (309)Acquisition-relatedamortization (77) (16) — (94)
Impairmentofgoodwillandintangibleassets (32) (1,969) — (2,001)
Storeoptimization (10) — — (10)
Storedamageandinventorylosses (15) — — (15)
Adjustedselling,generalandadministrativeexpenses(Non-GAAPmeasure) $ 4,531 $ 820 $ 46 $ 5,396
Operatingincome(loss)(GAAP) $ 528 $ (2,151) $ (60) $ (1,683)
Adjustmentstoequityearnings(loss)inAmerisourceBergen (105) — — (105)
Acquisition-relatedamortization 77 16 — 94
Transformationalcostmanagement 269 30 11 310LIFOprovision 29 — — 29
Acquisition-relatedcosts 64 1 3 68
Impairmentofgoodwillandintangibleassets 32 1,969 — 2,001Storeoptimization 10 — — 10Storedamageandinventorylosses 75 — — 75
Adjustedoperatingincome(loss)(Non-GAAPmeasure) $ 979 $ (135) $ (46) $ 798
Grossmargin(GAAP) 19.3% 22.7% 19.6%
Adjustedgrossmargin(Non-GAAPmeasure) 19.6% 22.8% 19.9%
Selling,generalandadministrativeexpensespercenttosales(GAAP) 18.2% 94.3% 26.0%
Adjustedselling,generalandadministrativeexpensespercenttosales(Non-GAAPmeasure) 16.6% 27.2% 17.8%
Operatingmargin2 1.0% (71.5)% (6.3)%
Adjustedoperatingmargin(Non-GAAPmeasure)2 3.1% (4.5)% 2.2%
ReconciliationofNon-GAAPfinancialmeasuresWalgreensBootsAlliance,Inc.andSubsidiaries
SupplementalInformation(unaudited)(inmillions)
30
1 Operatingincome(loss)forUnitedStatesincludesequityearnings(loss)inAmerisourceBergen.Asaresultofthetwomonthreportinglag,operatingincome(loss)forthethreeandninemonthperiodendedMay31,2021includesAmerisourceBergenequityearnings(loss)fortheperiodofJanuary1,2021throughMarch31,2021andtheperiodofJuly1,2020throughMarch31,2021,respectively.Operatingincome(loss)forthethreeandninemonthperiodendedMay31,2020includesAmerisourceBergenequityearningsfortheperiodofJanuary1,2020throughMarch31,2020,andtheperiodofJuly1,2019throughMarch31,2020,respectively.
2 OperatingmarginsandadjustedoperatingmarginshavebeencalculatedexcludingequityearningsinAmerisourceBergenandadjustedequityearningsinAmerisourceBergen,respectively.

©2021WalgreensBootsAlliance,Inc.Allrightsreserved.
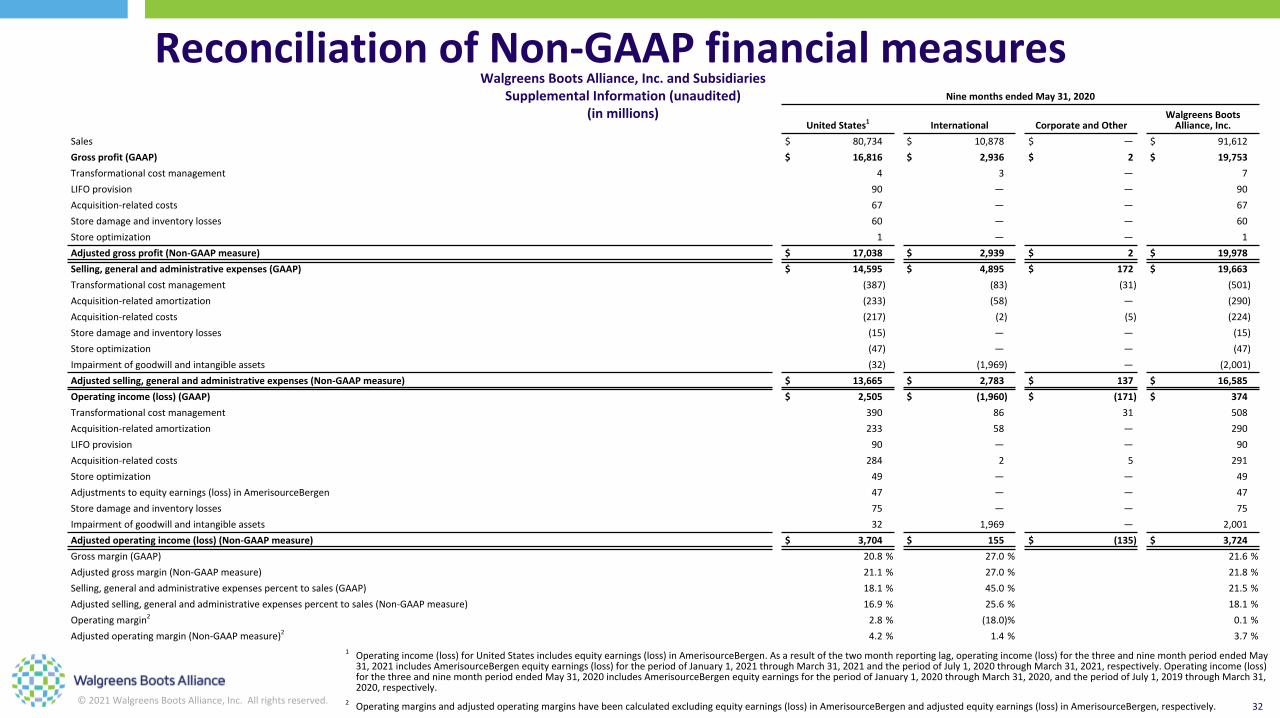
NinemonthsendedMay31,2021
UnitedStates1 International CorporateandOtherWalgreensBootsAlliance,Inc.
Sales $ 83,250 $ 14,998 $ — $ 98,247
Grossprofit(GAAP) $ 17,434 $ 3,130 $ — $ 20,564
Transformationalcostmanagement — (1) — (1)
LIFOprovision 85 — — 85
Acquisition-relatedamortization 5 — — 5
Adjustedgrossprofit(Non-GAAPmeasure) $ 17,525 $ 3,129 $ — $ 20,654
Selling,generalandadministrativeexpenses(GAAP) $ 14,695 $ 2,949 $ 292 $ 17,936
Acquisition-relatedcosts (2) (8) (14) (25)
Certainlegalandregulatoryaccrualsandsettlements (60) — — (60)
Transformationalcostmanagement (213) (81) (44) (338)
Acquisition-relatedamortization (305) (56) — (361)
Adjustedselling,generalandadministrativeexpenses(Non-GAAPmeasure) $ 14,115 $ 2,803 $ 234 $ 17,151
Operatingincome(loss)(GAAP) $ 1,543 $ 181 $ (292) $ 1,432
Adjustmentstoequityearnings(loss)inAmerisourceBergen 1,575 — — 1,575
Acquisition-relatedamortization 311 56 — 367
Transformationalcostmanagement 213 80 44 338
LIFOprovision 85 — — 85
Certainlegalandregulatoryaccrualsandsettlements 60 — — 60
Acquisition-relatedcosts 2 8 14 25
Adjustedoperatingincome(loss)(Non-GAAPmeasure) $ 3,789 $ 326 $ (233) $ 3,881
Grossmargin(GAAP) 20.9% 20.9% 20.9%
Adjustedgrossmargin(Non-GAAPmeasure) 21.1% 20.9% 21.0%
Selling,generalandadministrativeexpensespercenttosales(GAAP) 17.7% 19.7% 18.3%
Adjustedselling,generalandadministrativeexpensespercenttosales(Non-GAAPmeasure) 17.0% 18.7% 17.5%
Operatingmargin2 3.3% 1.2% 2.7%
Adjustedoperatingmargin(Non-GAAPmeasure)2 4.1% 2.2% 3.6%
ReconciliationofNon-GAAPfinancialmeasures
31
WalgreensBootsAlliance,Inc.andSubsidiariesSupplementalInformation(unaudited)
(inmillions)
1 Operatingincome(loss)forUnitedStatesincludesequityearnings(loss)inAmerisourceBergen.Asaresultofthetwomonthreportinglag,operatingincome(loss)forthethreeandninemonthperiodendedMay31,2021includesAmerisourceBergenequityearnings(loss)fortheperiodofJanuary1,2021throughMarch31,2021andtheperiodofJuly1,2020throughMarch31,2021,respectively.Operatingincome(loss)forthethreeandninemonthperiodendedMay31,2020includesAmerisourceBergenequityearningsfortheperiodofJanuary1,2020throughMarch31,2020,andtheperiodofJuly1,2019throughMarch31,2020,respectively.
2 OperatingmarginsandadjustedoperatingmarginshavebeencalculatedexcludingequityearningsinAmerisourceBergenandadjustedequityearningsinAmerisourceBergen,respectively.
©2021WalgreensBootsAlliance,Inc.Allrightsreserved.
NinemonthsendedMay31,2020
UnitedStates1 International CorporateandOtherWalgreensBootsAlliance,Inc.
Sales $ 80,734 $ 10,878 $ — $ 91,612
Grossprofit(GAAP) $ 16,816 $ 2,936 $ 2 $ 19,753
Transformationalcostmanagement 4 3 — 7
LIFOprovision 90 — — 90
Acquisition-relatedcosts 67 — — 67
Storedamageandinventorylosses 60 — — 60
Storeoptimization 1 — — 1
Adjustedgrossprofit(Non-GAAPmeasure) $ 17,038 $ 2,939 $ 2 $ 19,978
Selling,generalandadministrativeexpenses(GAAP) $ 14,595 $ 4,895 $ 172 $ 19,663
Transformationalcostmanagement (387) (83) (31) (501)
Acquisition-relatedamortization (233) (58) — (290)
Acquisition-relatedcosts (217) (2) (5) (224)
Storedamageandinventorylosses (15) — — (15)
Storeoptimization (47) — — (47)
Impairmentofgoodwillandintangibleassets (32) (1,969) — (2,001)
Adjustedselling,generalandadministrativeexpenses(Non-GAAPmeasure) $ 13,665 $ 2,783 $ 137 $ 16,585
Operatingincome(loss)(GAAP) $ 2,505 $ (1,960) $ (171) $ 374
Transformationalcostmanagement 390 86 31 508
Acquisition-relatedamortization 233 58 — 290
LIFOprovision 90 — — 90
Acquisition-relatedcosts 284 2 5 291
Storeoptimization 49 — — 49
Adjustmentstoequityearnings(loss)inAmerisourceBergen 47 — — 47
Storedamageandinventorylosses 75 — — 75
Impairmentofgoodwillandintangibleassets 32 1,969 — 2,001
Adjustedoperatingincome(loss)(Non-GAAPmeasure) $ 3,704 $ 155 $ (135) $ 3,724
Grossmargin(GAAP) 20.8% 27.0% 21.6%
Adjustedgrossmargin(Non-GAAPmeasure) 21.1% 27.0% 21.8%
Selling,generalandadministrativeexpensespercenttosales(GAAP) 18.1% 45.0% 21.5%
Adjustedselling,generalandadministrativeexpensespercenttosales(Non-GAAPmeasure) 16.9% 25.6% 18.1%
Operatingmargin2 2.8% (18.0)% 0.1%
Adjustedoperatingmargin(Non-GAAPmeasure)2 4.2% 1.4% 3.7%
ReconciliationofNon-GAAPfinancialmeasures
32
WalgreensBootsAlliance,Inc.andSubsidiariesSupplementalInformation(unaudited)
(inmillions)
1 Operatingincome(loss)forUnitedStatesincludesequityearnings(loss)inAmerisourceBergen.Asaresultofthetwomonthreportinglag,operatingincome(loss)forthethreeandninemonthperiodendedMay31,2021includesAmerisourceBergenequityearnings(loss)fortheperiodofJanuary1,2021throughMarch31,2021andtheperiodofJuly1,2020throughMarch31,2021,respectively.Operatingincome(loss)forthethreeandninemonthperiodendedMay31,2020includesAmerisourceBergenequityearningsfortheperiodofJanuary1,2020throughMarch31,2020,andtheperiodofJuly1,2019throughMarch31,2020,respectively.
2 Operatingmarginsandadjustedoperatingmarginshavebeencalculatedexcludingequityearnings(loss)inAmerisourceBergenandadjustedequityearnings(loss)inAmerisourceBergen,respectively.
©2021WalgreensBootsAlliance,Inc.Allrightsreserved.
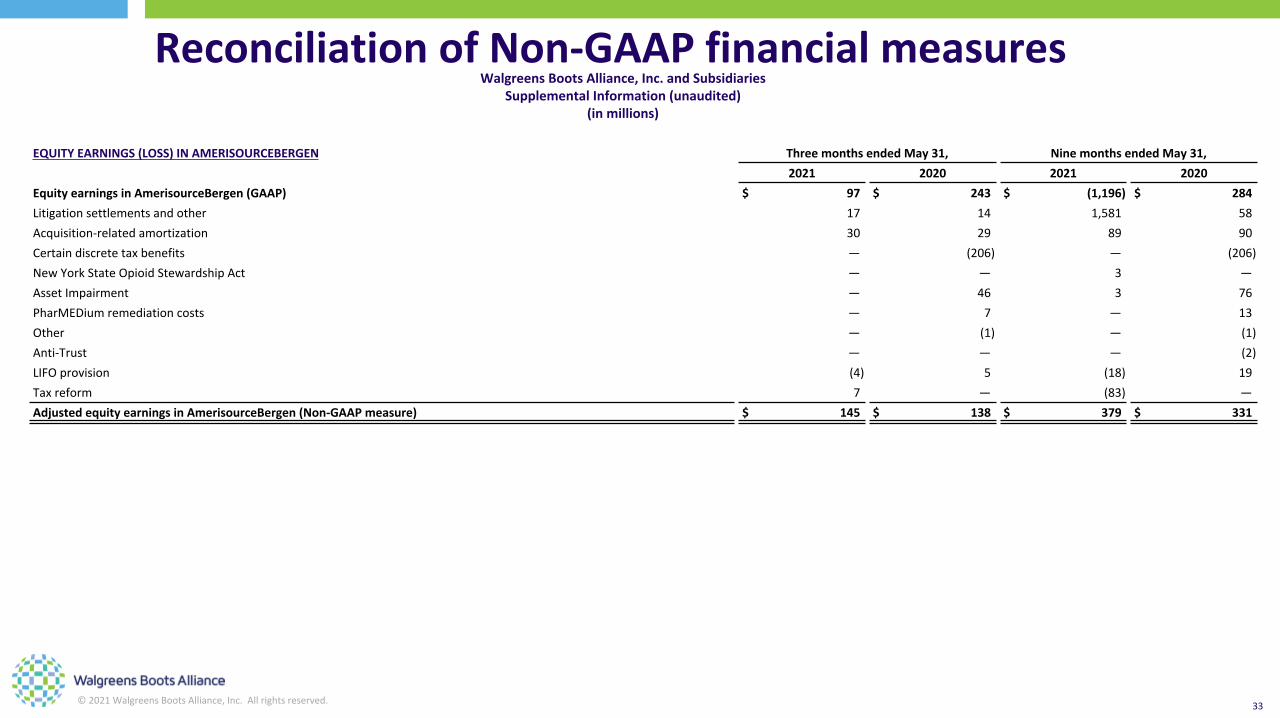
ReconciliationofNon-GAAPfinancialmeasures
EQUITYEARNINGS(LOSS)INAMERISOURCEBERGEN ThreemonthsendedMay31, NinemonthsendedMay31,
2021 2020 2021 2020
EquityearningsinAmerisourceBergen(GAAP) $ 97 $ 243 $ (1,196) $ 284
Litigationsettlementsandother 17 14 1,581 58
Acquisition-relatedamortization 30 29 89 90
Certaindiscretetaxbenefits — (206) — (206)
NewYorkStateOpioidStewardshipAct — — 3 —
AssetImpairment — 46 3 76
PharMEDiumremediationcosts — 7 — 13
Other — (1) — (1)
Anti-Trust — — — (2)
LIFOprovision (4) 5 (18) 19
Taxreform 7 — (83) —
AdjustedequityearningsinAmerisourceBergen(Non-GAAPmeasure) $ 145 $ 138 $ 379 $ 331
33
WalgreensBootsAlliance,Inc.andSubsidiariesSupplementalInformation(unaudited)
(inmillions)
©2021WalgreensBootsAlliance,Inc.Allrightsreserved.
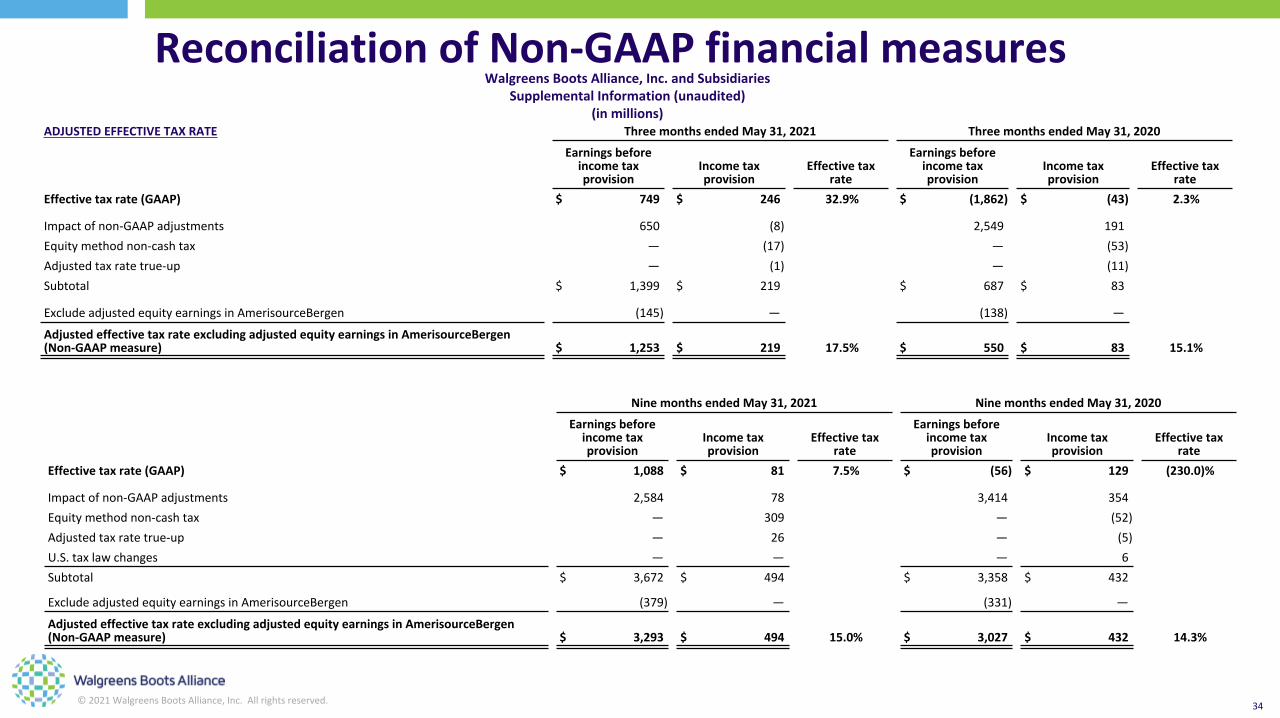
ReconciliationofNon-GAAPfinancialmeasuresWalgreensBootsAlliance,Inc.andSubsidiaries
SupplementalInformation(unaudited)(inmillions)
ADJUSTEDEFFECTIVETAXRATE ThreemonthsendedMay31,2021 ThreemonthsendedMay31,2020
Earningsbeforeincometaxprovision
Incometaxprovision
Effectivetaxrate
Earningsbeforeincometaxprovision
Incometaxprovision
Effectivetaxrate
Effectivetaxrate(GAAP) $ 749 $ 246 32.9% $ (1,862) $ (43) 2.3%
Impactofnon-GAAPadjustments 650 (8) 2,549 191
Equitymethodnon-cashtax — (17) — (53)
Adjustedtaxratetrue-up — (1) — (11)
Subtotal $ 1,399 $ 219 $ 687 $ 83
ExcludeadjustedequityearningsinAmerisourceBergen (145) — (138) —
AdjustedeffectivetaxrateexcludingadjustedequityearningsinAmerisourceBergen(Non-GAAPmeasure) $ 1,253 $ 219 17.5% $ 550 $ 83 15.1%
34
NinemonthsendedMay31,2021 NinemonthsendedMay31,2020
Earningsbeforeincometaxprovision
Incometaxprovision
Effectivetaxrate
Earningsbeforeincometaxprovision
Incometaxprovision
Effectivetaxrate
Effectivetaxrate(GAAP) $ 1,088 $ 81 7.5% $ (56) $ 129 (230.0)%
Impactofnon-GAAPadjustments 2,584 78 3,414 354
Equitymethodnon-cashtax — 309 — (52)
Adjustedtaxratetrue-up — 26 — (5)
U.S.taxlawchanges — — — 6
Subtotal $ 3,672 $ 494 $ 3,358 $ 432
ExcludeadjustedequityearningsinAmerisourceBergen (379) — (331) —
AdjustedeffectivetaxrateexcludingadjustedequityearningsinAmerisourceBergen(Non-GAAPmeasure) $ 3,293 $ 494 15.0% $ 3,027 $ 432 14.3%

©2021WalgreensBootsAlliance,Inc.Allrightsreserved.
ReconciliationofNon-GAAPfinancialmeasures
1 Freecashflowisdefinedasnetcashprovidedbyoperatingactivitiesinaperiodlessadditionstoproperty,plantandequipment(capitalexpenditures)madeinthatperiod.Thismeasuredoesnotrepresentresidualcashflowsavailablefordiscretionaryexpendituresasthemeasuredoesnotdeductthepaymentsrequiredfordebtserviceandothercontractualobligationsorpaymentsforfuturebusinessacquisitions.Therefore,webelieveitisimportanttoviewfreecashflowasameasurethatprovidessupplementalinformationtoourentirestatementsofcashflows.
FREECASHFLOW
ThreemonthsendedMay31, NinemonthsendedMay31,
2021 2020 2021 2020
Netcashprovidedbyoperatingactivities(GAAP)1 $ 1,754 $ 914 $ 4,310 $ 3,398
Less:Additionstoproperty,plantandequipment-asreported (309) (257) (1,001) (962)
Freecashflow-(Non-GAAPmeasure)1 $ 1,445 $ 657 $ 3,309 $ 2,436
35
WalgreensBootsAlliance,Inc.andSubsidiariesSupplementalInformation(unaudited)
(inmillions)


![Welcome [s1.q4cdn.com]s1.q4cdn.com/238390398/files/events/2015/Investor-Day...Welcome ... 2015](https://img.pdfslide.net/doc/110x75/606d74afdb056960d75bcfbe/welcome-s1q4cdncoms1q4cdncom238390398filesevents2015investor-day-welcome.jpg)


![Welcome [s1.q4cdn.com]](https://img.pdfslide.net/doc/110x75/6266786cb6aa8f5b1d57ea8a/welcome-s1q4cdncom.jpg)