Embed Size (px)
Citation preview
FISCAL ACCOUNTABILITY REPORT
FISCAL YEARS 2020 – 2024
A REPORT TO THE APPROPRIATIONS COMMITTEE AND
THE FINANCE, REVENUE AND BONDING COMMITTEE PURSUANT TO SECTION 2-36B OF THE CONNECTICUT GENERAL STATUTES
MELISSA McCAW, SECRETARY OFFICE OF POLICY AND MANAGEMENT
NOVEMBER 20, 2019


OFFICE OF POLICY AND MANAGEMENT
FISCAL ACCOUNTABILITY REPORT NOVEMBER 2019
TABLE OF CONTENTS Page
Overview .................................................................................................................................................... 1
Current Year Outlook ................................................................................................................................. 3
Outlook for FY 2021 Through FY 2024 ....................................................................................................... 6
General Fund ................................................................................................................................. 6
Special Transportation Fund ....................................................................................................... 13
Connecticut’s Economy ............................................................................................................... 16
Special Topics .............................................................................................................................. 19
Long-Term Liabilities ................................................................................................................... 20
State Employees Retirement System ............................................................................. 21
Teachers’ Retirement System ........................................................................................ 22
Other Post-Employment Benefits .................................................................................. 25
Debt Service ................................................................................................................... 27
Medicaid ..................................................................................................................................... 27
Municipal Aid .............................................................................................................................. 30
State Workforce .......................................................................................................................... 31
Federal Funds .............................................................................................................................. 32
Bonding .................................................................................................................................................... 34
Budget Reserve Fund ............................................................................................................................... 37
Projected Tax Credits ............................................................................................................................... 39

1
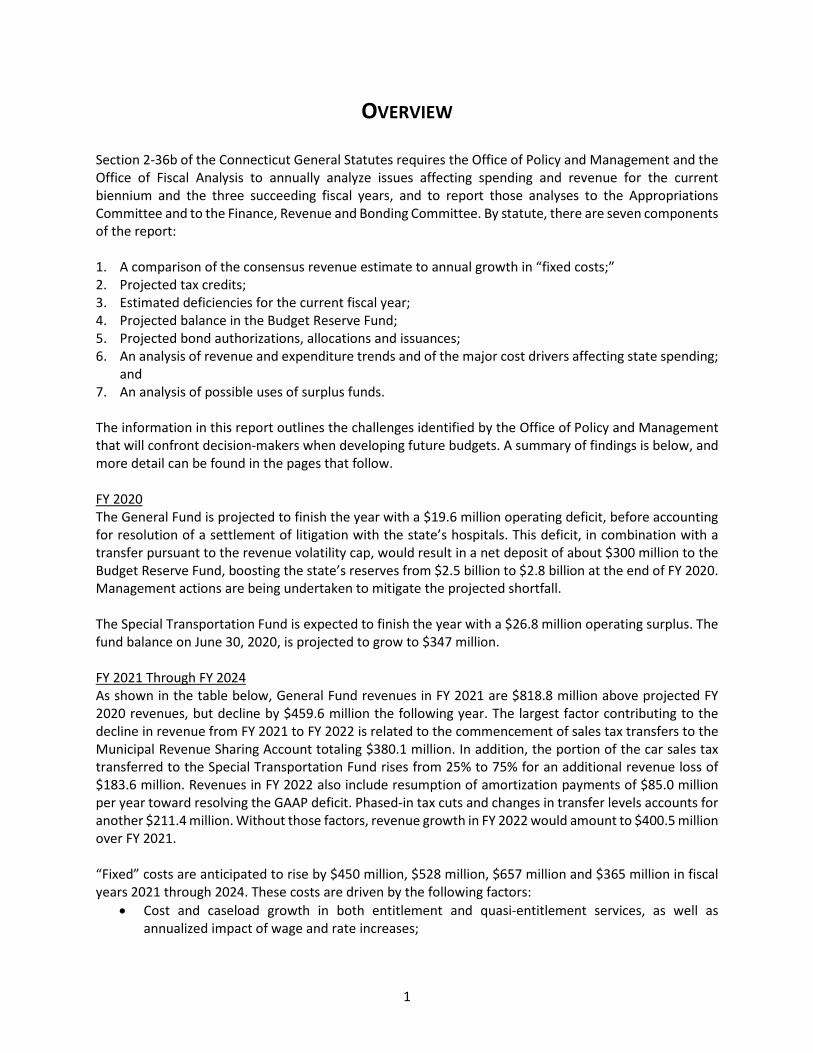
OVERVIEW Section 2-36b of the Connecticut General Statutes requires the Office of Policy and Management and the Office of Fiscal Analysis to annually analyze issues affecting spending and revenue for the current biennium and the three succeeding fiscal years, and to report those analyses to the Appropriations Committee and to the Finance, Revenue and Bonding Committee. By statute, there are seven components of the report: 1. A comparison of the consensus revenue estimate to annual growth in “fixed costs;” 2. Projected tax credits; 3. Estimated deficiencies for the current fiscal year; 4. Projected balance in the Budget Reserve Fund; 5. Projected bond authorizations, allocations and issuances; 6. An analysis of revenue and expenditure trends and of the major cost drivers affecting state spending;
and 7. An analysis of possible uses of surplus funds. The information in this report outlines the challenges identified by the Office of Policy and Management that will confront decision-makers when developing future budgets. A summary of findings is below, and more detail can be found in the pages that follow. FY 2020 The General Fund is projected to finish the year with a $19.6 million operating deficit, before accounting for resolution of a settlement of litigation with the state’s hospitals. This deficit, in combination with a transfer pursuant to the revenue volatility cap, would result in a net deposit of about $300 million to the Budget Reserve Fund, boosting the state’s reserves from $2.5 billion to $2.8 billion at the end of FY 2020. Management actions are being undertaken to mitigate the projected shortfall. The Special Transportation Fund is expected to finish the year with a $26.8 million operating surplus. The fund balance on June 30, 2020, is projected to grow to $347 million. FY 2021 Through FY 2024 As shown in the table below, General Fund revenues in FY 2021 are $818.8 million above projected FY 2020 revenues, but decline by $459.6 million the following year. The largest factor contributing to the decline in revenue from FY 2021 to FY 2022 is related to the commencement of sales tax transfers to the Municipal Revenue Sharing Account totaling $380.1 million. In addition, the portion of the car sales tax transferred to the Special Transportation Fund rises from 25% to 75% for an additional revenue loss of $183.6 million. Revenues in FY 2022 also include resumption of amortization payments of $85.0 million per year toward resolving the GAAP deficit. Phased-in tax cuts and changes in transfer levels accounts for another $211.4 million. Without those factors, revenue growth in FY 2022 would amount to $400.5 million over FY 2021. “Fixed” costs are anticipated to rise by $450 million, $528 million, $657 million and $365 million in fiscal years 2021 through 2024. These costs are driven by the following factors:
• Cost and caseload growth in both entitlement and quasi-entitlement services, as well as annualized impact of wage and rate increases;

2
• The phase-down in federal support for the expansion population under the Medicaid program from 93% to 90%, and in the Children’s Health Insurance Program from 88% to 65%, the impact of which is fully annualized in FY 2021 and FY 2022, respectively;
• The continued phase-in from level percent of payroll to level dollar amortization of unfunded SERS liabilities (this transition will be complete, and SERS expenditure growth is anticipated to level-off, after FY 2023);
• Continued increases in the Teachers’ Retirement System (TRS) due to the phase-in to level dollar amortization through FY 2026, after which funding requirements will level off;
• Rising debt service projections; and • Projected growth in retired state employee healthcare requirements.
FY 2021 vs. FY 2020
FY 2022 vs. FY 2021
FY 2023 vs. FY 2022
FY 2024 vs. FY 2023
Revenue Growth 818.8$ (459.6)$ 336.5$ 534.8$
Fixed Cost Growth Debt Service 90.1 147.8 246.9 63.8 State Employee Pensions 96.6 114.6 112.2 14.0 Teacher Pensions 41.1 101.9 120.9 122.2 State and Teachers OPEB 30.6 31.1 33.0 (9.8) Medicaid 158.2 100.9 119.8 147.2 Other Entitlements 33.1 31.3 24.4 28.1 Total Fixed Cost Growth 449.6 527.7 657.2 365.4 Difference 369.2$ (987.3)$ (320.8)$ 169.4$
FY 2021 vs. FY 2020
FY 2022 vs. FY 2021
FY 2023 vs. FY 2022
FY 2024 vs. FY 2023
Revenue Growth 145.2$ 128.7$ 110.7$ 26.7$
Fixed Cost Growth Debt Service 80.9 38.3 48.5 48.6 State Employee Pensions and OPEB 8.4 13.6 13.3 (1.5) Total Fixed Cost Growth 89.2 51.9 61.8 47.1 Difference 56.0$ 76.8$ 48.9$ (20.4)$
SPECIAL TRANSPORTATION FUND
GENERAL FUND
FINANCIAL SUMMARYYEAR-OVER-YEAR REVENUE GROWTH vs. FIXED COST GROWTH
(in millions)
3
CURRENT FISCAL YEAR OUTLOOK FY 2020 - GENERAL FUND
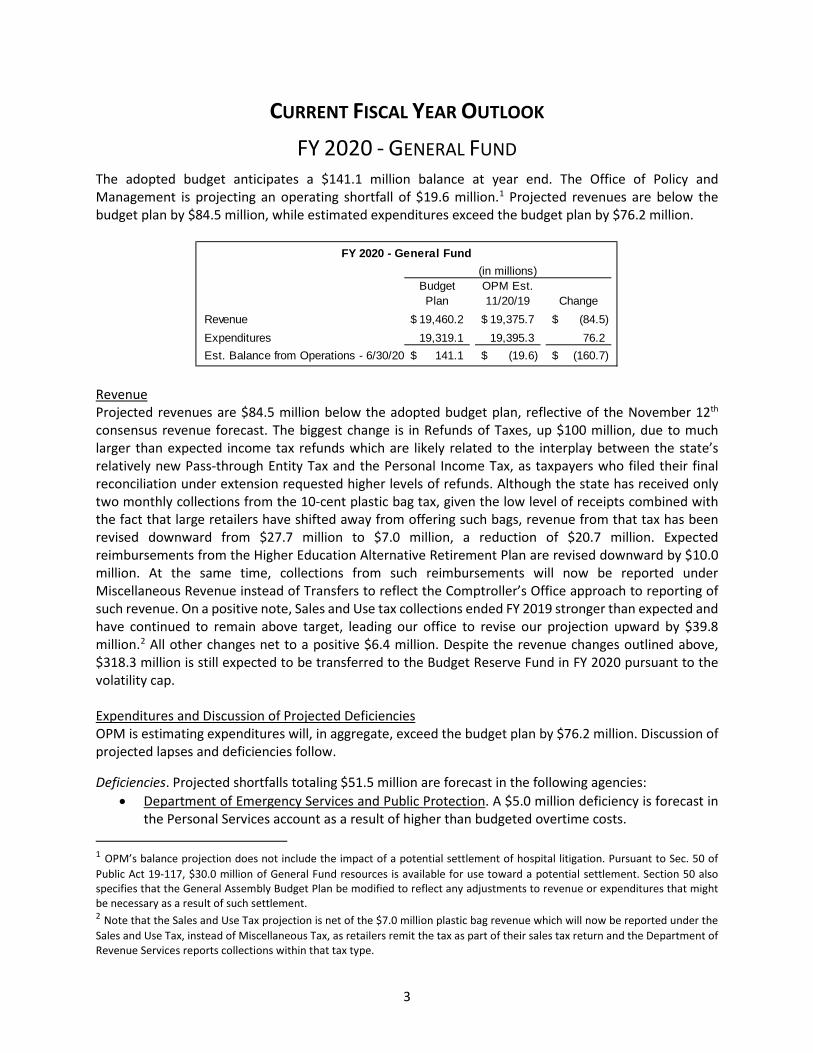
The adopted budget anticipates a $141.1 million balance at year end. The Office of Policy and Management is projecting an operating shortfall of $19.6 million.1 Projected revenues are below the budget plan by $84.5 million, while estimated expenditures exceed the budget plan by $76.2 million.
Revenue Projected revenues are $84.5 million below the adopted budget plan, reflective of the November 12th consensus revenue forecast. The biggest change is in Refunds of Taxes, up $100 million, due to much larger than expected income tax refunds which are likely related to the interplay between the state’s relatively new Pass-through Entity Tax and the Personal Income Tax, as taxpayers who filed their final reconciliation under extension requested higher levels of refunds. Although the state has received only two monthly collections from the 10-cent plastic bag tax, given the low level of receipts combined with the fact that large retailers have shifted away from offering such bags, revenue from that tax has been revised downward from $27.7 million to $7.0 million, a reduction of $20.7 million. Expected reimbursements from the Higher Education Alternative Retirement Plan are revised downward by $10.0 million. At the same time, collections from such reimbursements will now be reported under Miscellaneous Revenue instead of Transfers to reflect the Comptroller’s Office approach to reporting of such revenue. On a positive note, Sales and Use tax collections ended FY 2019 stronger than expected and have continued to remain above target, leading our office to revise our projection upward by $39.8 million.2 All other changes net to a positive $6.4 million. Despite the revenue changes outlined above, $318.3 million is still expected to be transferred to the Budget Reserve Fund in FY 2020 pursuant to the volatility cap. Expenditures and Discussion of Projected Deficiencies OPM is estimating expenditures will, in aggregate, exceed the budget plan by $76.2 million. Discussion of projected lapses and deficiencies follow. Deficiencies. Projected shortfalls totaling $51.5 million are forecast in the following agencies:
• Department of Emergency Services and Public Protection. A $5.0 million deficiency is forecast in the Personal Services account as a result of higher than budgeted overtime costs.
1 OPM’s balance projection does not include the impact of a potential settlement of hospital litigation. Pursuant to Sec. 50 of Public Act 19-117, $30.0 million of General Fund resources is available for use toward a potential settlement. Section 50 also specifies that the General Assembly Budget Plan be modified to reflect any adjustments to revenue or expenditures that might be necessary as a result of such settlement. 2 Note that the Sales and Use Tax projection is net of the $7.0 million plastic bag revenue which will now be reported under the Sales and Use Tax, instead of Miscellaneous Tax, as retailers remit the tax as part of their sales tax return and the Department of Revenue Services reports collections within that tax type.
Budget OPM Est.Plan 11/20/19 Change
Revenue 19,460.2$ 19,375.7$ (84.5)$ Expenditures 19,319.1 19,395.3 76.2Est. Balance from Operations - 6/30/20 141.1$ (19.6)$ (160.7)$
(in millions)FY 2020 - General Fund
4
• Department of Social Services. A net shortfall, after transfers from lapsing accounts, of $19.2 million is forecast in the Medicaid account due to current cost trends.
• Office of Early Childhood. A $1.8 million shortfall is anticipated in the Birth to Three account due to increased referrals to and enrollment in the program.
• Department of Correction. A total shortfall of $13.0 million is projected. Other Expenses spending is projected to be comparable to FY 2019 levels, resulting in a shortfall of $3.0 million. A $10.0 million shortfall is projected in Inmate Medical Services largely due to pharmaceutical costs trending higher than compared to the same timeframe a year ago. While the agency is in the process of transitioning its pharmacy provider, our estimate assumes no resulting budgetary impact. Additionally, overtime costs for medical staff are up compared to last fiscal year as the agency works to achieve appropriate staffing levels.
• OSC – Fringe Benefits. A net shortfall of $12.0 million is forecast based on current cost trends, including projected shortfalls of $25.0 million in the State Employees’ Health Service Cost account to reflect higher than expected claims experience and premium costs, $1.5 million in the Employers’ Social Security Tax account and $1.0 million in the SERS Defined Contribution Match account. Partially offsetting these shortfalls are a projected lapse of $2.5 million in the Unemployment Compensation account and a $13.0 million lapse in the Higher Education Alternate Retirement Program (ARP), which is attributable to 1,600 employees shifting from ARP to SERS as an outcome of a grievance award, as well as a one-time accounting transaction related to the July 1, 2019, change in how these costs are budgeted.
• DAS – Workers’ Compensation Claims. A $0.5 million shortfall is projected based on current claim trends.
OPM’s forecast includes $30.0 million in unappropriated expenditures for Adjudicated Claims. Of this amount, $6.5 million is for a settlement that was delayed from FY 2019 into FY 2020, and the remainder is for payment of other claims. Existing law identifies the resources of the General Fund as the source for payments. Lapses. OPM’s projections reflect the amounts currently withheld from agencies to achieve budgeted lapse targets. Additionally, the following sums totaling $5.3 million are estimated to remain unspent this fiscal year:
• Personal Services. We are projecting total of $1.9 million in lapsing Personal Services appropriations across several agencies, including $300,000 in the Auditors of Public Accounts, $800,000 in the Department of Revenue Services, $200,000 in the Department of Administrative Services, $200,000 in the Department of Veterans Affairs, and $400,000 in the Department of Consumer Protection.
• Department of Housing. A $1.2 million lapse is forecast in the Housing / Homeless account as a result of delays in placements.
• Teachers’ Retirement Board. A $0.8 million lapse is projected in the Retirees Health Service Cost account due to lower than budgeted premiums that take effect January 1, 2020, resulting from reduced pharmacy trends.
• Department of Children and Families. A net lapse of $1.4 million is projected in the Board and Care for Children – Short-term and Residential account as a result of recent caseload reductions.

5
FY 2020 - SPECIAL TRANSPORTATION FUND The adopted budget anticipates a $38.8 million balance from operations. Projected revenues have been revised downward by $16.4 million in aggregate compared to the budget plan, reflective of the November 12th consensus revenue estimate. The largest change is in the Oil Companies Tax, down $13.9 million due to lower than expected motor fuel prices. Estimated Refunds of Taxes have been revised upward by $10.0 million due to one-time factors that have contributed to larger refunds. All other revenue changes net to a positive $7.5 million. Partially offsetting the reduction in forecast revenue is a $4.2 million reduction in anticipated spending. The most significant changes in our expenditure forecast are a $10 million reduction in Debt Service requirements as a result of a delay in the date of the fall bond sale and a projected $5 million deficit in the Department of Transportation’s Rail Operations account. We project that the Transportation Fund balance on June 30, 2020, will be $347.0 million.
FY 2020 - BUDGET RESERVE FUND Based on projections through November 20, 2019, OPM estimates the Budget Reserve Fund balance at year end, after transfers pursuant to the statutory volatility cap and net of the estimated FY 2020 operating deficit, is depicted below. The estimated rainy day fund balance at the start of FY 2020 is $2.5 billion, or 13.0% of net General Fund appropriations, and is expected to reach about $2.8 billion by the beginning of FY 2021, or 14.0% of net General Fund appropriations for that year. (See page 20 for more information about the revenue volatility cap.)
(in millions)Estimated BRF Ending Balance - FY 2019 (OSC Est. 9/30/19) 2,505.5$
Projected Operating Deficit - FY 2020 (OPM 11/20/19 Est.) (19.6)$ Volatility Cap Deposit - FY 2020 (OPM 11/20/19 Est.) 318.3 Estimated BRF Ending Balance - FY 2020 2,804.2$
Budget Reserve Fund
6
OUTLOOK FOR FISCAL YEAR 2021 THROUGH FISCAL YEAR 2024 BACKGROUND AND METHODOLOGY
Section 2-36b of the Connecticut General Statutes requires the Office of Policy and Management and the Office of Fiscal Analysis to annually analyze the state’s expenditure and revenue situation for the current biennium and the three succeeding fiscal years, and to report those analyses to the Appropriations Committee and to the Finance, Revenue and Bonding Committee. By statute, there are seven components of the report: 1. The level of spending changes from current year spending allowed by consensus revenue estimates
in each fund, any changes to current year spending necessary because of “fixed cost drivers,” and the total change to current year spending required to accommodate fixed cost drivers without exceeding current revenue estimates. The law specifies that “fixed cost drivers” may include debt service, pension contributions, retiree health care, entitlement programs, and federal mandate costs;
2. Projected tax credits to be used in the current biennium and the next ensuing three fiscal years, and the assumptions on which such projections are based;
3. A summary of any estimated deficiencies in the current fiscal year, the reasons for such deficiencies, and the assumptions upon which such estimates are based;
4. Projected balance in the Budget Reserve Fund at the end of each uncompleted fiscal year of the current biennium and the next ensuing three fiscal years;
5. Projected bond authorizations, allocations and issuances in each of the next ensuing five fiscal years and their impact on the debt service of the major funds of the state;
6. An analysis of revenue and expenditure trends and of the major cost drivers affecting state spending, including identification of any areas of concern and efforts undertaken to address such areas, including, but not limited to, efforts to obtain federal funds; and
7. An analysis of possible uses of surplus funds, including, but not limited to, the Budget Reserve Fund, debt retirement and funding of pension liabilities.
Each of the topic areas identified in statute is addressed in the pages that follow.
FY 2021 TO FY 2024 - GENERAL FUND OUTLOOK Pursuant to Section 2-36b of the Connecticut General Statutes, this report compares year-over-year revenue growth to growth in fixed costs. Revenues are derived from the November 12, 2019, consensus forecast, and are explained later in this document. OPM’s approach for estimating “fixed costs” is explained in more detail below. Assumptions Used to Develop Growth Estimates for Fixed Costs The FY 2021 column in the table that follows represents the anticipated increase in spending over the FY 2020 estimated level. The FY 2022, FY 2023 and FY 2024 columns reflect the estimated increases over FY 2021, FY 2022, and FY 2023 respectively. DEPARTMENT OF MENTAL HEALTH AND ADDICTION SERVICES
• General Assistance Managed Care - Reflects leap year costs in FY 2024 and anticipated caseload growth.
• Medicaid Adult Rehabilitation Option - Reflects leap year costs in FY 2024.
7
DEPARTMENT OF SOCIAL SERVICES
• HUSKY B Program, Medicaid, Old Age Assistance, Aid to the Blind, Aid to the Disabled, Temporary Family Assistance, Connecticut Home Care Program, Protective Services for the Elderly, State Administered General Assistance, and Community Residential Services - Reflect anticipated cost and caseload changes based on current trends, as well as annualization of adjustments.
OFFICE OF EARLY CHILDHOOD
• Birth to Three and Care4Kids-TANF/CCDF – Reflect the impact of increased referrals, evaluations and services.
TEACHERS' RETIREMENT BOARD
• Retirement Contributions - Reflects the estimated actuarially determined employer contributions as calculated by the pension plan actuary.
• Retirees Health Service Cost - Reflects medical inflation. DEPARTMENT OF CHILDREN AND FAMILIES
• Board and Care for Children - Foster & Adoption - Reflects anticipated growth in the number of children in subsidized adoptive, guardianship and foster care, and additional post-secondary costs for children adopted after January 1, 2005.
• Board and Care for Children - Adoption, Foster Care, and Short-Term and Residential – Reflect adjustments in FY 2024 for the cost of an additional per diem payment due to leap year.
STATE TREASURER - DEBT SERVICE
• Debt Service – Reflects the debt service requirements for FY 2020 through FY 2024. Note that beginning in FY 2022 all net new bond premium will be used to pay for project costs and cannot be used to offset debt service.
• Pension Obligations Bonds – TRB – Reflects the schedule of required debt service payments. STATE COMPTROLLER - FRINGE BENEFITS
• Higher Education Alternate Retirement System - Reflects wage inflation. • Judges and Compensation Commissioners Retirement - Reflects the estimated actuarially
determined employer contribution. • Retired Employee Health Service Costs - Reflects medical inflation. • Other Post-Employment Benefits - Employees hired prior to July 1, 2017, contribute to OPEB for
10 years. The matching state contributions decrease as the number of employees reaching the end of the 10-year period for such payments increases.
• SERS Defined Contribution Match - Reflects the pension actuary’s estimates of salary increases of new employees in Tier 4 and anticipated volume of new employees.
• State Employees Retirement Contributions - Normal Cost - Reflects the estimated normal cost portions of the actuarially determined employer contributions (ADEC) from the pension plan actuary.
• State Employees Retirement Contributions - Unfunded Actuarial Liabilities (UAL) - Reflects the UAL portions of the actuarially determined employer contributions as estimated by the pension plan actuary.

8
PROJECTED GROWTH IN EXPENDITURES FIXED COST DRIVERS
(Amounts Represent Year Over Year Change)
GENERAL FUNDFY 2021 Increase
over FY 2020FY 2022 Increase
over FY 2021FY 2023 Increase
over FY 2022FY 2024 Increase
over FY 2023DMHAS - General Assistance Managed Care 344,645$ 814,441$ 830,730$ 915,406$ DMHAS - Medicaid Adult Rehabilitation Option - - - 11,464 DSS - HUSKY B Program 6,060,000 2,180,000 880,000 740,000 DSS - Medicaid 158,214,000 100,915,340 119,830,000 147,160,000 DSS - Old Age Assistance 50,000 2,057,800 1,115,300 1,260,000 DSS - Aid To The Blind (25,200) (17,600) (4,100) (3,100) DSS - Aid To The Disabled (830,000) 204,300 127,400 330,400 DSS - Temporary Family Assistance (1,260,000) (619,700) (446,500) (440,800) DSS - Connecticut Home Care Program 790,000 2,300,000 2,500,000 3,150,000 DSS - Community Residential Services 18,022,475 18,614,775 14,700,000 16,545,889 DSS - Protective Services for the Elderly - 482,500 9,700 9,800 DSS - State Administered General Assistance (340,000) (38,500) - - OEC - Birth to Three 1,758,672 792,139 815,903 840,381 OEC - Care4Kids TANF/CCDF 4,900,000 - - - TRB - Retirement Contributions 41,052,000 101,865,000 120,900,000 122,200,000 TRB - Retirees Health Service Cost 926,060 1,045,094 1,086,898 1,130,374 TRB - Municipal Retiree Health Insurance Costs 3,520 - - - DCF - No Nexus Special Education 943,222 - - - DCF - Board and Care for Children - Adoption 2,400,651 2,939,509 2,490,721 2,774,621 DCF - Board and Care for Children - Foster 177,712 1,618,596 1,410,481 1,826,770 DCF - Board and Care for Children - Short-term and Residential 216,260 - - 109,243 DCF - Individualized Family Supports (141,197) - - - OTT - Debt Service 70,308,025 51,107,737 135,107,997 56,628,080 OTT - UConn 2000 - Debt Service 9,181,450 13,670,307 8,728,200 1,063,388 OTT - CHEFA Day Care Security - - - - OTT - Pension Obligation Bonds - TRB - 84,680,000 103,600,000 8,991,400 OTT - Municipal Restructuring 10,648,004 (1,636,919) (579,661) (2,846,343) OSC - Higher Education Alternative Retirement System 16,000,000 350,868 359,639 368,630 OSC - Pensions and Retirements - Other Statutory 55,131 - - - OSC - Judges and Compensation Commissioners Retirement 1,511,122 974,564 1,327,350 1,387,081 OSC - Retired State Employees Health Service Cost 41,788,000 32,148,360 33,434,294 34,771,666 OSC - Other Post Employment Benefits (12,115,646) (2,048,639) (1,500,000) (45,700,000) OSC - SERS Defined Contribution Match 107,097 1,148,284 1,078,620 1,232,373 OSC - State Employees Retirement Contributions - Normal Cost (19,285,234) (3,097,603) (3,025,565) (4,610,386) OSC - State Employees Retirement Contributions - UAL 98,183,344 115,244,163 112,451,257 15,581,481 TOTAL - GENERAL FUND 449,644,113$ 527,694,816$ 657,228,664$ 365,427,818$

9
General Fund Revenue The November 12, 2019, consensus revenue estimate shows General Fund revenues at $19.4 billion in FY 2020 and $20.2 billion in FY 2021. The table below portrays detailed revenue estimates for each year covered by the consensus forecast.
Taxes FY 2020 FY 2021 FY 2022 FY 2023 FY 2024Personal Income - Withholding 6,910.5$ 7,168.5$ 7,333.4$ 7,555.0$ 7,783.8$ Personal Income - Estimates & Finals 2,762.5 2,836.9 2,966.3 3,065.5 3,168.1 Sales & Use Tax 4,490.9 4,639.4 4,190.5 4,208.8 4,322.1 Corporation Tax 1,099.8 1,059.2 1,065.9 1,063.4 1,098.8 Pass-through Entity Tax 850.0 850.0 850.0 850.0 850.0 Public Service Tax 237.7 244.7 250.2 256.8 263.7 Inheritance & Estate Tax 165.8 146.3 138.4 133.5 132.5 Insurance Companies Tax 203.3 205.8 208.3 211.2 214.0 Cigarettes Tax 344.7 326.9 310.9 295.4 280.6 Real Estate Conveyance Tax 217.4 230.6 239.0 246.4 254.1 Alcoholic Beverages Tax 68.9 69.7 70.1 70.4 70.7 Admissions & Dues Tax 41.9 41.5 41.8 42.1 42.4 Health Provider Tax 1,050.1 1,051.6 1,053.0 1,063.5 1,074.2 Miscellaneous Tax 20.7 21.5 22.0 22.5 23.0 Total Taxes 18,464.2$ 18,892.6$ 18,739.8$ 19,084.5$ 19,578.0$ Less Refunds of Tax (1,409.3) (1,378.9) (1,551.4) (1,605.7) (1,662.2) Less Earned Income Tax Credit (97.3) (100.6) (104.0) (107.0) (110.1) Less R&D Credit Exchange (7.1) (7.2) (7.7) (7.9) (8.1) Total - Taxes Less Refunds 16,950.5$ 17,405.9$ 17,076.7$ 17,363.9$ 17,797.6$
Other RevenueTransfers-Special Revenue 368.0$ 376.6$ 384.3$ 391.0$ 397.9$ Indian Gaming Payments 226.0 225.4 221.4 217.5 213.6 Licenses, Permits, Fees 341.2 384.3 410.1 386.0 421.2 Sales of Commodities 30.2 31.0 31.8 32.6 33.5 Rents, Fines, Escheats 163.5 165.9 168.3 170.7 173.2 Investment Income 57.6 57.9 58.2 58.9 59.6 Miscellaneous 203.1 204.5 218.8 222.5 226.3 Less Refunds of Payments (66.4) (67.7) (69.0) (70.3) (71.7) Total - Other Revenue 1,323.2$ 1,377.9$ 1,423.9$ 1,408.9$ 1,453.6$
Other SourcesFederal Grants 1,524.4$ 1,530.8$ 1,540.5$ 1,572.0$ 1,604.4$ Transfer From Tobacco Settlement 136.0 114.5 113.1 112.2 111.5 Transfers From (To) Other Funds (240.1) 42.0 (131.6) (126.5) (131.6) Transfers to BRF - Volatil ity Adjustment (318.3) (276.6) (287.7) (259.2) (229.4) Total - Other Sources 1,102.0$ 1,410.7$ 1,234.3$ 1,298.5$ 1,354.9$
Total - General Fund Revenues 19,375.7$ 20,194.5$ 19,734.9$ 20,071.3$ 20,606.1$
PROJECTED REVENUESConsensus Revenue Forecast - November 12, 2019
(In Mill ions)
General Fund
10
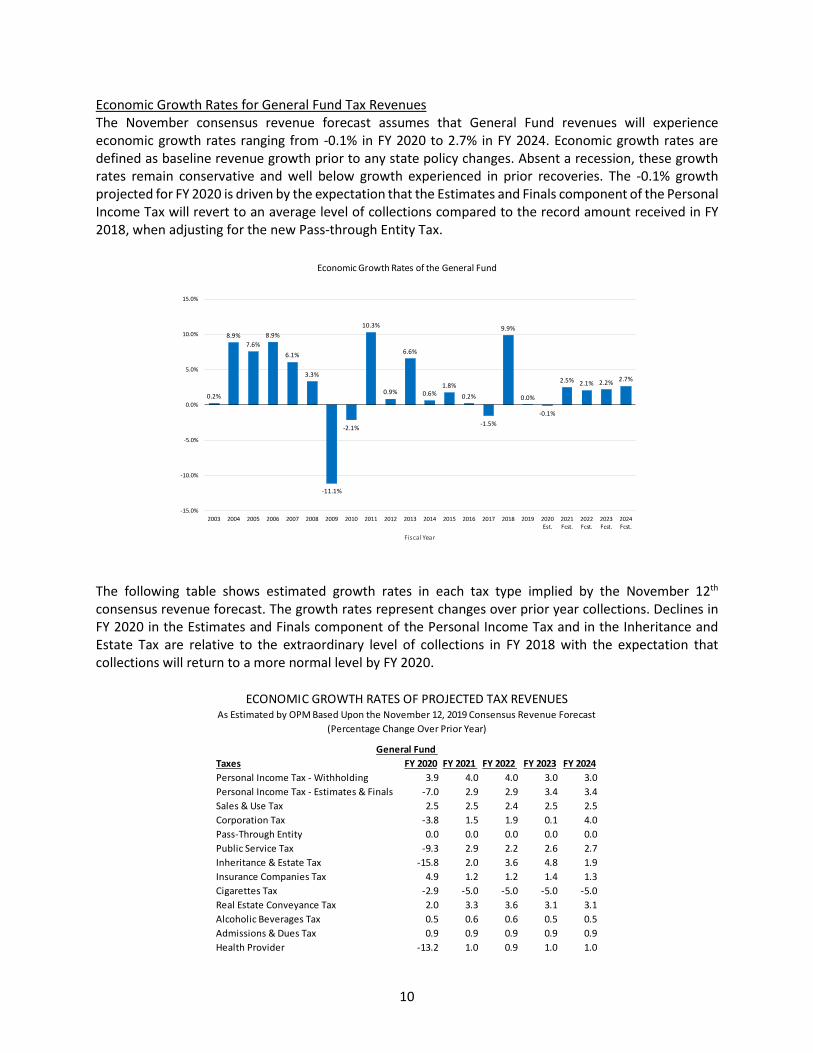
Economic Growth Rates for General Fund Tax Revenues The November consensus revenue forecast assumes that General Fund revenues will experience economic growth rates ranging from -0.1% in FY 2020 to 2.7% in FY 2024. Economic growth rates are defined as baseline revenue growth prior to any state policy changes. Absent a recession, these growth rates remain conservative and well below growth experienced in prior recoveries. The -0.1% growth projected for FY 2020 is driven by the expectation that the Estimates and Finals component of the Personal Income Tax will revert to an average level of collections compared to the record amount received in FY 2018, when adjusting for the new Pass-through Entity Tax.
The following table shows estimated growth rates in each tax type implied by the November 12th consensus revenue forecast. The growth rates represent changes over prior year collections. Declines in FY 2020 in the Estimates and Finals component of the Personal Income Tax and in the Inheritance and Estate Tax are relative to the extraordinary level of collections in FY 2018 with the expectation that collections will return to a more normal level by FY 2020.
0.2%
8.9%7.6%
8.9%
6.1%
3.3%
-11.1%
-2.1%
10.3%
0.9%
6.6%
0.6%1.8%
0.2%
-1.5%
9.9%
0.0%
-0.1%
2.5% 2.1% 2.2% 2.7%
-15.0%
-10.0%
-5.0%
0.0%
5.0%
10.0%
15.0%
2003 2004 2005 2006 2007 2008 2009 2010 2011 2012 2013 2014 2015 2016 2017 2018 2019 2020Est.
2021Fcst.
2022Fcst.
2023Fcst.
2024Fcst.
Fiscal Year
Economic Growth Rates of the General Fund
Taxes FY 2020 FY 2021 FY 2022 FY 2023 FY 2024Personal Income Tax - Withholding 3.9 4.0 4.0 3.0 3.0Personal Income Tax - Estimates & Finals -7.0 2.9 2.9 3.4 3.4Sales & Use Tax 2.5 2.5 2.4 2.5 2.5Corporation Tax -3.8 1.5 1.9 0.1 4.0Pass-Through Entity 0.0 0.0 0.0 0.0 0.0Public Service Tax -9.3 2.9 2.2 2.6 2.7Inheritance & Estate Tax -15.8 2.0 3.6 4.8 1.9Insurance Companies Tax 4.9 1.2 1.2 1.4 1.3Cigarettes Tax -2.9 -5.0 -5.0 -5.0 -5.0Real Estate Conveyance Tax 2.0 3.3 3.6 3.1 3.1Alcoholic Beverages Tax 0.5 0.6 0.6 0.5 0.5Admissions & Dues Tax 0.9 0.9 0.9 0.9 0.9Health Provider -13.2 1.0 0.9 1.0 1.0
General Fund
ECONOMIC GROWTH RATES OF PROJECTED TAX REVENUESAs Estimated by OPM Based Upon the November 12, 2019 Consensus Revenue Forecast
(Percentage Change Over Prior Year)

11
Personal Income Tax – Withholding Personal Income Tax collections from paycheck withholding tends to be relatively stable in non-recessionary periods, reflecting changes in revenue as wages rise. Modest wage growth is projected during the upcoming biennium, and revenues are, in turn, expected to increase.
Personal Income Tax – Estimates and Finals Collections The volatile estimates and finals component of the Personal Income Tax typically represents one-third of total income tax collections. Receipts from this revenue source are highly correlated with capital gains and, as a result, collections experience wide fluctuations year-to-year in response to market conditions and changes in tax policy. The graph below depicts this correlation.
9.5%
8.7%
-1.5%-1.8%
6.0%
7.8%7.1%
7.8%
4.5%
-3.7%
0.8%
5.2%
3.6%3.1%
3.9%
3.1%2.8%
1.3%
5.6%5.3%
3.9% 4.0% 4.0%
3.0% 3.0%
-5%
0%
5%
10%
'00 '01 '02 '03 '04 '05 '06 '07 '08 '09 '10 '11 '12 '13 '14 '15 '16 '17 '18 '19 '20Est.
'21Fcst.
'22Fcst.
'23Fcst.
'24Fcst.
% G
row
th
Fiscal Year
ECONOMIC GROWTH RATES FOR PERSONAL INCOME TAX -Withholding
19.0%
-23.5%
-14.7%
21.9%
22.8%
19.4%
13.0%
17.9%
-27.3%
-21.3%
27.7%
0.3%
21.9%
-6.6%
9.9%
-7.6%
-7.8%
46.1%
-17.2%
-7.0%
2.9% 2.9% 3.4% 3.4%23.4%
-42.0%
-39.2%
39.5%
48.4%
29.5%
14.7%
33.1%
-60.1%
-38.3%
92.6%
-9.9%
46.4%
-8.9%
31.7%
-6.8%
-23.3%
-70.0%
-40.0%
-10.0%
20.0%
50.0%
80.0%
-35%
-25%
-15%
-5%
5%
15%
25%
35%
45%
'01 '02 '03 '04 '05 '06 '07 '08 '09 '10 '11 '12 '13 '14 '15 '16 '17 '18 '19 '20Est.
'21Est.
'22Est.
'23Est.
'24Est.
Capi
tal G
ains
Gro
wth
Rat
e*
E &
F E
cono
mic
Gro
wth
Rat
e
Fiscal Year
ECONOMIC GROWTH RATES FOR PERSONAL INCOME TAX -Estimates & Finals
Estimates & Final
CT Capital Gains
*Note: Capital Gains are for the immediately preceding calendar year.
12
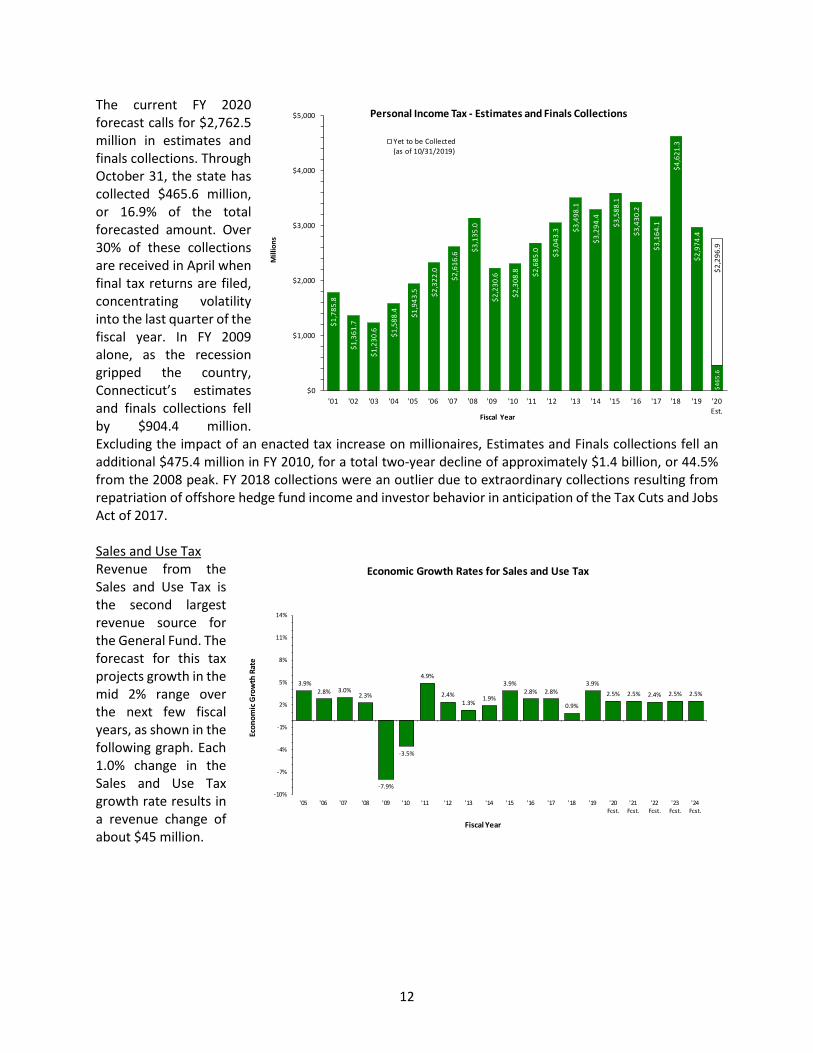
The current FY 2020 forecast calls for $2,762.5 million in estimates and finals collections. Through October 31, the state has collected $465.6 million, or 16.9% of the total forecasted amount. Over 30% of these collections are received in April when final tax returns are filed, concentrating volatility into the last quarter of the fiscal year. In FY 2009 alone, as the recession gripped the country, Connecticut’s estimates and finals collections fell by $904.4 million. Excluding the impact of an enacted tax increase on millionaires, Estimates and Finals collections fell an additional $475.4 million in FY 2010, for a total two-year decline of approximately $1.4 billion, or 44.5% from the 2008 peak. FY 2018 collections were an outlier due to extraordinary collections resulting from repatriation of offshore hedge fund income and investor behavior in anticipation of the Tax Cuts and Jobs Act of 2017. Sales and Use Tax Revenue from the Sales and Use Tax is the second largest revenue source for the General Fund. The forecast for this tax projects growth in the mid 2% range over the next few fiscal years, as shown in the following graph. Each 1.0% change in the Sales and Use Tax growth rate results in a revenue change of about $45 million.
$1,7
85.8
$1,3
61.7
$1,2
30.6 $1
,588
.4 $1,9
43.5 $2
,322
.0
$2,6
16.6
$3,1
35.0
$2,2
30.6
$2,3
08.8 $2
,685
.0 $3,0
43.3 $3
,498
.1
$3,2
94.4
$3,5
88.1
$3,4
30.2
$3,1
64.1
$4,6
21.3
$2,9
74.4
$465
.6$2
,296
.9
$0
$1,000
$2,000
$3,000
$4,000
$5,000
'01 '02 '03 '04 '05 '06 '07 '08 '09 '10 '11 '12 '13 '14 '15 '16 '17 '18 '19 '20Est.
Mill
ions
Fiscal Year
Personal Income Tax - Estimates and Finals Collections
Yet to be Collected(as of 10/31/2019)
Economic Growth Rates for Sales and Use Tax
3.9%2.8% 3.0%
2.3%
-7.9%
-3.5%
4.9%
2.4%1.3%
1.9%
3.9%2.8% 2.8%
0.9%
3.9%2.5% 2.5% 2.4% 2.5% 2.5%
-10%
-7%
-4%
-1%
2%
5%
8%
11%
14%
'05 '06 '07 '08 '09 '10 '11 '12 '13 '14 '15 '16 '17 '18 '19 '20Fcst.
'21Fcst.
'22Fcst.
'23Fcst.
'24Fcst.
Econ
omic
Gro
wth
Rat
e
Fiscal Year

13
FY 2021 TO FY 2024 - SPECIAL TRANSPORTATION FUND OUTLOOK OPM’s estimates of “fixed cost drivers” in the Special Transportation Fund are as follows:
Assumptions Used to Develop Growth Estimates for Fixed Costs The FY 2021 column in the table above represents the anticipated increase in spending over the FY 2020 estimated level. The FY 2022, FY 2023 and FY 2024 columns reflect the estimated increases over FY 2021, FY 2022, and FY 2023 respectively. Revenue The November consensus forecast projects Special Transportation Fund revenues at $1.7 billion in FY 2020 and $1.9 billion in FY 2021. The table below shows the detailed revenue estimates.
Economic Growth Rates for Special Transportation Fund Tax Revenues Modest growth is anticipated over the next few years in the key taxes that support the Special Transportation Fund. The table below portrays estimated growth rates for the fund’s major tax sources.
SPECIAL TRANSPORTATION FUNDFY 2021 Increase
over FY 2020FY 2022 Increase
over FY 2021FY 2023 Increase
over FY 2022FY 2024 Increase
over FY 2023OTT - Debt Service 80,857,998$ 38,261,769$ 48,500,000$ 48,600,000$ OSC - Other Post Employment Benefits (863,500) (135,623) (100,000) (2,900,000) OSC - SERS Defined Contribution Match 118,121 125,105 117,516 134,267 OSC - State Employees Retirement Contributions - Normal Cost (2,519,324) (396,775) (387,547) (590,548) OSC - State Employees Retirement Contributions - UAL 11,639,324 14,038,964 13,698,733 1,898,125 TOTAL - SPECIAL TRANSPORTATION FUND 89,232,619$ 51,893,440$ 61,828,702$ 47,141,844$
Taxes FY 2020 FY 2021 FY 2022 FY 2023 FY 2024Motor Fuels Tax 510.8$ 510.2$ 506.6$ 504.0$ 501.6$ Oil Companies Tax 309.0 316.5 327.5 335.7 344.3 Sales & Use Tax 417.4 459.0 651.6 754.0 765.3 Sales Tax - DMV 86.5 86.9 87.6 88.3 88.9 Total Taxes 1,323.7$ 1,372.6$ 1,573.3$ 1,682.0$ 1,700.1$ Less Refunds of Taxes (24.3) (15.0) (15.6) (16.2) (16.8) Total - Taxes Less Refunds 1,299.4$ 1,357.6$ 1,557.7$ 1,665.8$ 1,683.3$
Other SourcesMotor Vehicle Receipts 280.1$ 305.9$ 263.5$ 265.6$ 274.4$ Licenses, Permits, Fees 145.5 146.6 147.6 148.2 148.8 Interest Income 36.1 36.7 37.3 38.1 38.8 Federal Grants 12.1 11.8 11.0 10.1 9.2 Transfers From (To) Other Funds (35.5) 24.5 (5.5) (5.5) (5.5) Less Refunds of Payments (5.0) (5.2) (5.0) (5.0) (5.0) Total - Other Sources 433.3$ 520.3$ 448.9$ 451.5$ 460.7$
Total - STF Revenues 1,732.7$ 1,877.9$ 2,006.6$ 2,117.3$ 2,144.0$
PROJECTED REVENUESConsensus Revenue Forecast - November 12, 2019
(In Mill ions)
Special Transportation Fund
14
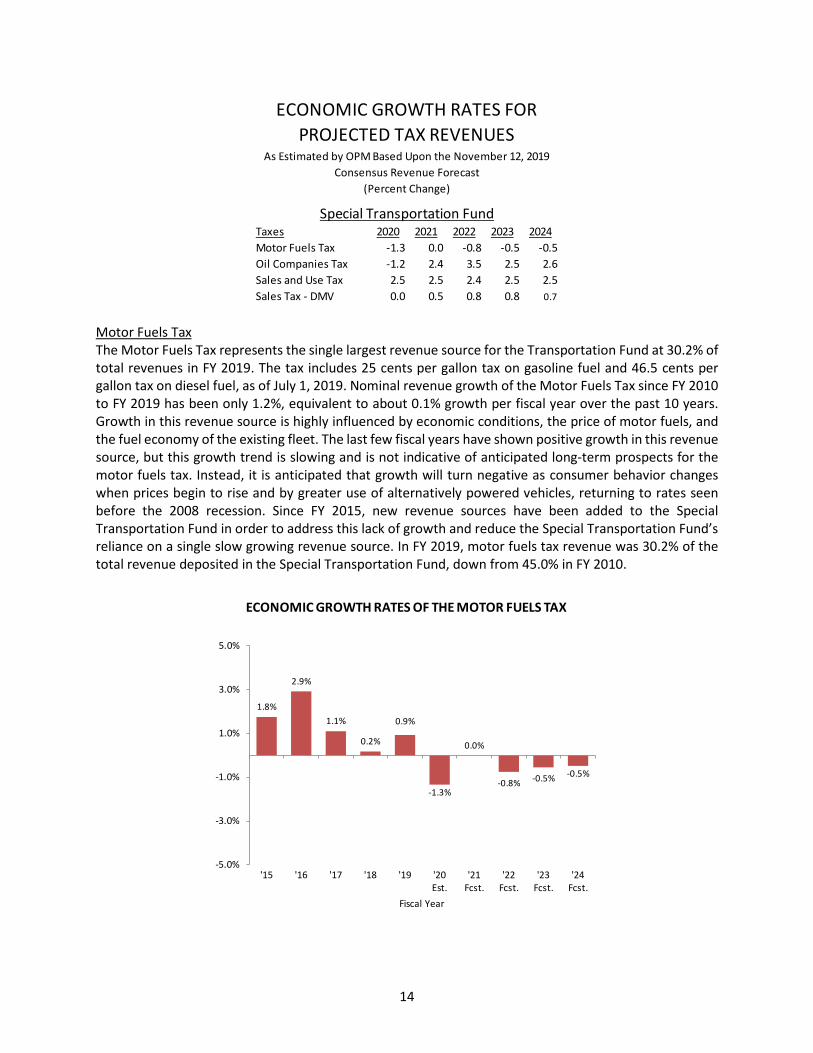
Motor Fuels Tax The Motor Fuels Tax represents the single largest revenue source for the Transportation Fund at 30.2% of total revenues in FY 2019. The tax includes 25 cents per gallon tax on gasoline fuel and 46.5 cents per gallon tax on diesel fuel, as of July 1, 2019. Nominal revenue growth of the Motor Fuels Tax since FY 2010 to FY 2019 has been only 1.2%, equivalent to about 0.1% growth per fiscal year over the past 10 years. Growth in this revenue source is highly influenced by economic conditions, the price of motor fuels, and the fuel economy of the existing fleet. The last few fiscal years have shown positive growth in this revenue source, but this growth trend is slowing and is not indicative of anticipated long-term prospects for the motor fuels tax. Instead, it is anticipated that growth will turn negative as consumer behavior changes when prices begin to rise and by greater use of alternatively powered vehicles, returning to rates seen before the 2008 recession. Since FY 2015, new revenue sources have been added to the Special Transportation Fund in order to address this lack of growth and reduce the Special Transportation Fund’s reliance on a single slow growing revenue source. In FY 2019, motor fuels tax revenue was 30.2% of the total revenue deposited in the Special Transportation Fund, down from 45.0% in FY 2010.
Taxes 2020 2021 2022 2023 2024Motor Fuels Tax -1.3 0.0 -0.8 -0.5 -0.5Oil Companies Tax -1.2 2.4 3.5 2.5 2.6Sales and Use Tax 2.5 2.5 2.4 2.5 2.5Sales Tax - DMV 0.0 0.5 0.8 0.8 0.7
ECONOMIC GROWTH RATES FOR PROJECTED TAX REVENUES
As Estimated by OPM Based Upon the November 12, 2019 Consensus Revenue Forecast
(Percent Change)
Special Transportation Fund
1.8%
2.9%
1.1%
0.2%
0.9%
-1.3%
0.0%
-0.8% -0.5% -0.5%
-5.0%
-3.0%
-1.0%
1.0%
3.0%
5.0%
'15 '16 '17 '18 '19 '20Est.
'21Fcst.
'22Fcst.
'23Fcst.
'24Fcst.
Fiscal Year
ECONOMIC GROWTH RATES OF THE MOTOR FUELS TAX
15
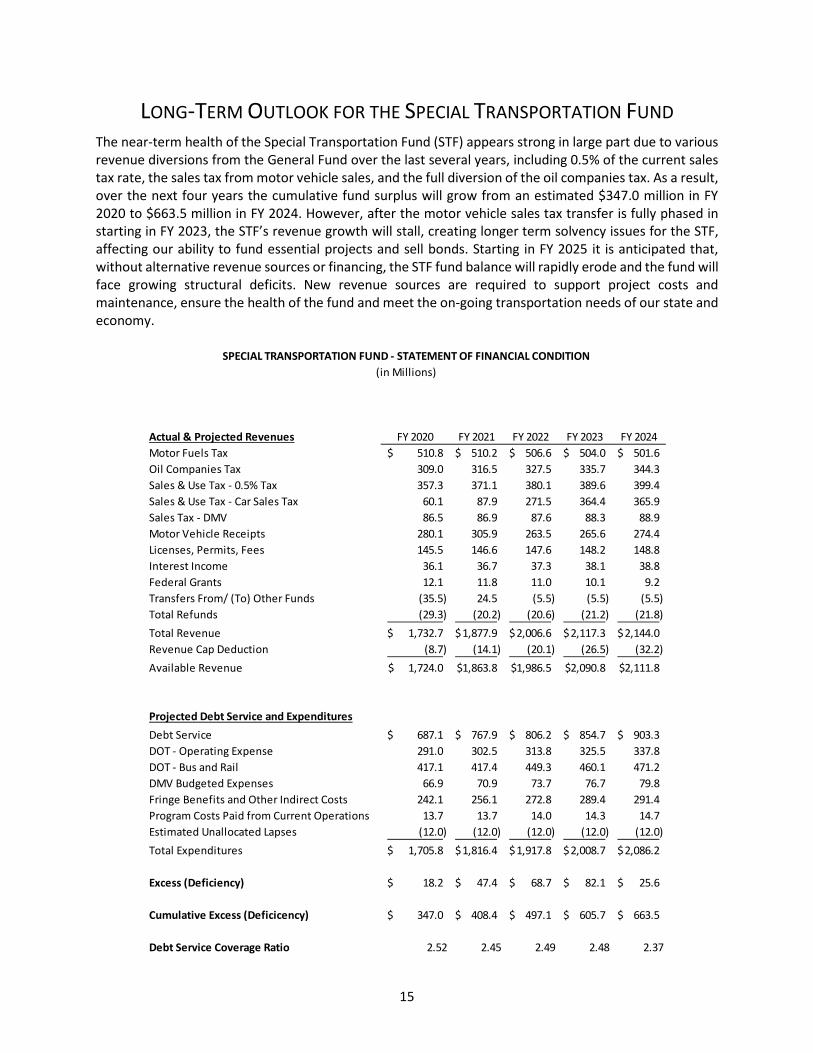
LONG-TERM OUTLOOK FOR THE SPECIAL TRANSPORTATION FUND The near-term health of the Special Transportation Fund (STF) appears strong in large part due to various revenue diversions from the General Fund over the last several years, including 0.5% of the current sales tax rate, the sales tax from motor vehicle sales, and the full diversion of the oil companies tax. As a result, over the next four years the cumulative fund surplus will grow from an estimated $347.0 million in FY 2020 to $663.5 million in FY 2024. However, after the motor vehicle sales tax transfer is fully phased in starting in FY 2023, the STF’s revenue growth will stall, creating longer term solvency issues for the STF, affecting our ability to fund essential projects and sell bonds. Starting in FY 2025 it is anticipated that, without alternative revenue sources or financing, the STF fund balance will rapidly erode and the fund will face growing structural deficits. New revenue sources are required to support project costs and maintenance, ensure the health of the fund and meet the on-going transportation needs of our state and economy.
SPECIAL TRANSPORTATION FUND - STATEMENT OF FINANCIAL CONDITION(in Millions)
Actual & Projected Revenues FY 2020 FY 2021 FY 2022 FY 2023 FY 2024Motor Fuels Tax 510.8$ 510.2$ 506.6$ 504.0$ 501.6$ Oil Companies Tax 309.0 316.5 327.5 335.7 344.3 Sales & Use Tax - 0.5% Tax 357.3 371.1 380.1 389.6 399.4 Sales & Use Tax - Car Sales Tax 60.1 87.9 271.5 364.4 365.9 Sales Tax - DMV 86.5 86.9 87.6 88.3 88.9 Motor Vehicle Receipts 280.1 305.9 263.5 265.6 274.4 Licenses, Permits, Fees 145.5 146.6 147.6 148.2 148.8 Interest Income 36.1 36.7 37.3 38.1 38.8 Federal Grants 12.1 11.8 11.0 10.1 9.2 Transfers From/ (To) Other Funds (35.5) 24.5 (5.5) (5.5) (5.5) Total Refunds (29.3) (20.2) (20.6) (21.2) (21.8) Total Revenue 1,732.7$ 1,877.9$ 2,006.6$ 2,117.3$ 2,144.0$ Revenue Cap Deduction (8.7) (14.1) (20.1) (26.5) (32.2) Available Revenue 1,724.0$ 1,863.8$ 1,986.5$ 2,090.8$ 2,111.8$
Projected Debt Service and ExpendituresDebt Service 687.1$ 767.9$ 806.2$ 854.7$ 903.3$ DOT - Operating Expense 291.0 302.5 313.8 325.5 337.8 DOT - Bus and Rail 417.1 417.4 449.3 460.1 471.2 DMV Budgeted Expenses 66.9 70.9 73.7 76.7 79.8 Fringe Benefits and Other Indirect Costs 242.1 256.1 272.8 289.4 291.4Program Costs Paid from Current Operations 13.7 13.7 14.0 14.3 14.7Estimated Unallocated Lapses (12.0) (12.0) (12.0) (12.0) (12.0) Total Expenditures 1,705.8$ 1,816.4$ 1,917.8$ 2,008.7$ 2,086.2$
Excess (Deficiency) 18.2$ 47.4$ 68.7$ 82.1$ 25.6$
Cumulative Excess (Deficicency) 347.0$ 408.4$ 497.1$ 605.7$ 663.5$
Debt Service Coverage Ratio 2.52 2.45 2.49 2.48 2.37
16
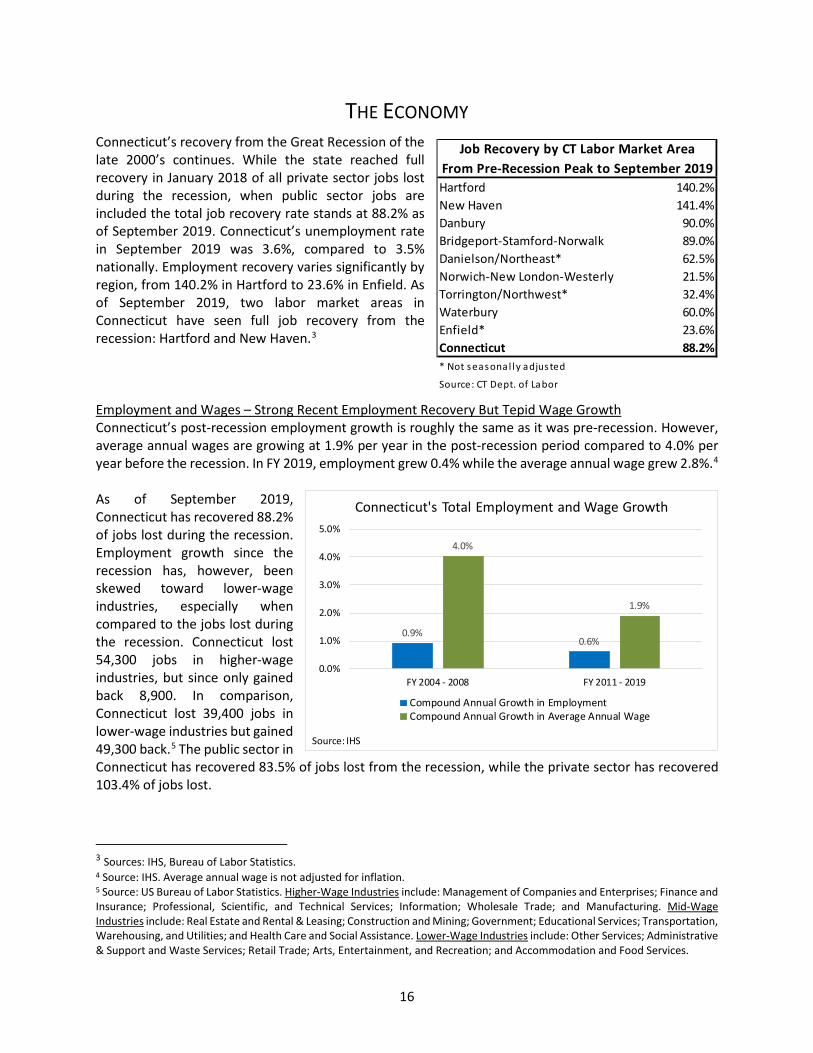
THE ECONOMY Connecticut’s recovery from the Great Recession of the late 2000’s continues. While the state reached full recovery in January 2018 of all private sector jobs lost during the recession, when public sector jobs are included the total job recovery rate stands at 88.2% as of September 2019. Connecticut’s unemployment rate in September 2019 was 3.6%, compared to 3.5% nationally. Employment recovery varies significantly by region, from 140.2% in Hartford to 23.6% in Enfield. As of September 2019, two labor market areas in Connecticut have seen full job recovery from the recession: Hartford and New Haven.3 Employment and Wages – Strong Recent Employment Recovery But Tepid Wage Growth Connecticut’s post-recession employment growth is roughly the same as it was pre-recession. However, average annual wages are growing at 1.9% per year in the post-recession period compared to 4.0% per year before the recession. In FY 2019, employment grew 0.4% while the average annual wage grew 2.8%.4 As of September 2019, Connecticut has recovered 88.2% of jobs lost during the recession. Employment growth since the recession has, however, been skewed toward lower-wage industries, especially when compared to the jobs lost during the recession. Connecticut lost 54,300 jobs in higher-wage industries, but since only gained back 8,900. In comparison, Connecticut lost 39,400 jobs in lower-wage industries but gained 49,300 back.5 The public sector in Connecticut has recovered 83.5% of jobs lost from the recession, while the private sector has recovered 103.4% of jobs lost.
3 Sources: IHS, Bureau of Labor Statistics. 4 Source: IHS. Average annual wage is not adjusted for inflation. 5 Source: US Bureau of Labor Statistics. Higher-Wage Industries include: Management of Companies and Enterprises; Finance and Insurance; Professional, Scientific, and Technical Services; Information; Wholesale Trade; and Manufacturing. Mid-Wage Industries include: Real Estate and Rental & Leasing; Construction and Mining; Government; Educational Services; Transportation, Warehousing, and Utilities; and Health Care and Social Assistance. Lower-Wage Industries include: Other Services; Administrative & Support and Waste Services; Retail Trade; Arts, Entertainment, and Recreation; and Accommodation and Food Services.
0.9%0.6%
4.0%
1.9%
0.0%
1.0%
2.0%
3.0%
4.0%
5.0%
FY 2004 - 2008 FY 2011 - 2019
Connecticut's Total Employment and Wage Growth
Compound Annual Growth in EmploymentCompound Annual Growth in Average Annual Wage
Source: IHS
Hartford 140.2%New Haven 141.4%Danbury 90.0%Bridgeport-Stamford-Norwalk 89.0%Danielson/Northeast* 62.5%Norwich-New London-Westerly 21.5%Torrington/Northwest* 32.4%Waterbury 60.0%Enfield* 23.6%Connecticut 88.2%* Not seasonal ly adjusted
Source: CT Dept. of Labor
Job Recovery by CT Labor Market AreaFrom Pre-Recession Peak to September 2019

17
Housing The housing market similarly remains below its pre-recession peak. Median prices on existing homes fell 9.9% from about $324,891 in the second quarter of 2006 to about $292,811 in the second quarter of 2019. Total home sales remain 39.2% below the pre-recession peak. Gross State Product and Population Connecticut’s real gross state product (GSP), which is a measure of all goods and services produced in Connecticut, fell 9.3% during the Great Recession. As seen in the following graph, Connecticut’s real GSP continued to fall even after the end of the recession and currently stands below 2006 levels. Connecticut’s total population also fell by 0.4% between 2013 and 2016 but held steady from 2017 to 2018.
The table below compares Connecticut’s growth since the last recession to states in the region and to the national average. In essentially all indicators Connecticut is the slowest or one of the slowest in growth. In summary, Connecticut’s economic recovery continues from the last recession, but we trail the region and the U.S.
-39.4
-26.3
-54.3
49.3
44.9
8.9
-60 -40 -20 0 20 40 60
Lower-Wage Industries(Annual Wage < $50,000)
Mid-Wage Industries(Between $50,000 to $80,000)
Higher-Wage Industries(Annual Wage > $80,000)
Connecticut(in Thousands)
Jobs Lost (Mar. 2008 - Feb. 2010) Jobs Gained (Feb. 2010 - Sep. 2019)
3,450.0
3,470.0
3,490.0
3,510.0
3,530.0
3,550.0
3,570.0
3,590.0
3,610.0
200.0
210.0
220.0
230.0
240.0
250.0
260.0
270.0
280.0
2003-Q3 2005-Q3 2007-Q3 2009-Q3 2011-Q3 2013-Q3 2016-Q3 2018-Q3
Popu
latio
n (T
hous
ands
)
Real
GSP
(Bill
ions
of 2
012
$)
Connecticut's Real GSP and Total Population
Population Real Gross State Product (GSP)

18
Sources: U.S. Bureau of Economic Analysis, U.S. Bureau of Labor Statistics, IHS
Connecticut’s Economic Projections The following table shows projections for various economic indicators for Connecticut over the biennium. Growth in real GSP is projected to remain below 2% over the forecast period. However, personal income and wages and salaries growth showed some recent strength and is anticipated to remain close to 4% over the biennium and beyond. Connecticut’s employment growth is projected to peak at 0.4% in FY 2019, but then slow and decline by 0.2% in FY 2023. The unemployment rate, however, is expected to hold steady at approximately 4% over the forecast period. The state’s population remains flat through FY 2022, then slightly increases in the out-years by 0.1%.
Source: IHS, as of 11/12/2019 These projections need to be tempered by the strong possibility of a national recession. Since 1945, on average, a recession occurs about every six years (from start to start). The last recession began in December 2007, which means the nation is currently 71 months past the national average for commencement of a recession. In addition, the yield curve, which is the spread between the 10-year and 2-year treasury yield, inverted this year. An inverted yield curve is a strong indicator of a recession. The Federal Reserve has raised interest rates nine times from 2015 to 2018, but subsequently cut rates three times this year to mitigate the risk of an economic downturn. Nonetheless, the factors noted above point to the possibility of a recession in the next few years.
Employment Population Home Sales Home Prices Real GSPConnecticut 4.8% -0.2% 18.9% 2.9% -2.1%Maine 6.0% 0.8% 30.7% 23.7% 5.4%Massachusetts 13.1% 5.1% 18.6% 33.8% 18.1%New Hampshire 9.2% 3.0% 26.7% 27.3% 13.8%New Jersey 8.3% 1.2% 35.4% 10.0% 7.4%New York 13.3% 0.6% 12.6% 20.3% 13.2%Rhode Island 8.4% 0.4% 26.4% 26.7% 4.4%Vermont 5.8% 0.1% 26.1% 14.9% 6.8%United States 14.4% 5.7% 27.7% 50.2% 19.5%
Growth in Various Economic Indicators (2010 to 2018)
2016-17 2017-18 2018-19 2019-20 2020-21 2021-22 2022-23 2023-24Real G.D.P. -0.8% 0.1% 2.2% 1.2% 1.6% 1.3% 1.2% 1.2%Personal Income 2.0% 5.0% 5.2% 3.7% 3.5% 3.5% 3.6% 3.7%Wages & Salaries 0.3% 2.1% 3.2% 4.6% 4.1% 3.9% 4.0% 3.8%Unemployment Rate 4.9% 4.5% 3.8% 3.6% 3.7% 3.8% 4.0% 4.4%Total Employment 0.2% 0.1% 0.4% 0.3% 0.0% -0.1% -0.2% -0.4%Population -0.2% -0.1% 0.0% 0.0% 0.0% 0.0% 0.1% 0.1%Housing Starts -18.9% -3.6% 1.6% 1.1% 15.0% 5.6% 1.6% 0.0%U.S. C.P.I. - U 1.9% 2.2% 2.1% 2.2% 1.8% 2.2% 2.6% 2.4%
Connecticut Economic Indicators(Year-Over-Year Changes)
19
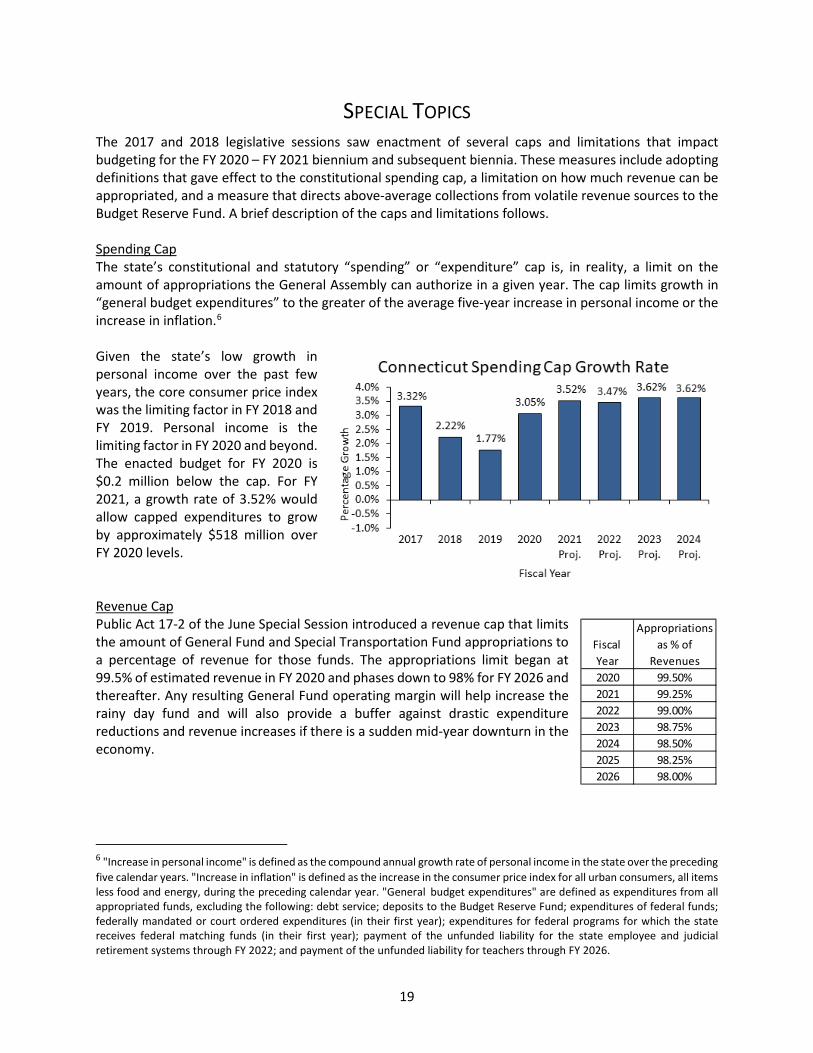
SPECIAL TOPICS The 2017 and 2018 legislative sessions saw enactment of several caps and limitations that impact budgeting for the FY 2020 – FY 2021 biennium and subsequent biennia. These measures include adopting definitions that gave effect to the constitutional spending cap, a limitation on how much revenue can be appropriated, and a measure that directs above-average collections from volatile revenue sources to the Budget Reserve Fund. A brief description of the caps and limitations follows. Spending Cap The state’s constitutional and statutory “spending” or “expenditure” cap is, in reality, a limit on the amount of appropriations the General Assembly can authorize in a given year. The cap limits growth in “general budget expenditures” to the greater of the average five-year increase in personal income or the increase in inflation.6 Given the state’s low growth in personal income over the past few years, the core consumer price index was the limiting factor in FY 2018 and FY 2019. Personal income is the limiting factor in FY 2020 and beyond. The enacted budget for FY 2020 is $0.2 million below the cap. For FY 2021, a growth rate of 3.52% would allow capped expenditures to grow by approximately $518 million over FY 2020 levels. Revenue Cap Public Act 17-2 of the June Special Session introduced a revenue cap that limits the amount of General Fund and Special Transportation Fund appropriations to a percentage of revenue for those funds. The appropriations limit began at 99.5% of estimated revenue in FY 2020 and phases down to 98% for FY 2026 and thereafter. Any resulting General Fund operating margin will help increase the rainy day fund and will also provide a buffer against drastic expenditure reductions and revenue increases if there is a sudden mid-year downturn in the economy. 6 "Increase in personal income" is defined as the compound annual growth rate of personal income in the state over the preceding five calendar years. "Increase in inflation" is defined as the increase in the consumer price index for all urban consumers, all items less food and energy, during the preceding calendar year. "General budget expenditures" are defined as expenditures from all appropriated funds, excluding the following: debt service; deposits to the Budget Reserve Fund; expenditures of federal funds; federally mandated or court ordered expenditures (in their first year); expenditures for federal programs for which the state receives federal matching funds (in their first year); payment of the unfunded liability for the state employee and judicial retirement systems through FY 2022; and payment of the unfunded liability for teachers through FY 2026.
Fiscal Year
Appropriations as % of
Revenues2020 99.50%2021 99.25%2022 99.00%2023 98.75%2024 98.50%2025 98.25%2026 98.00%
20
Revenue Volatility Cap The revenue volatility cap directs any collections from the estimated and finals component of the Personal Income Tax plus the Pass-through Entity Tax that in total exceed a designated threshold (adjusted for personal income growth) to the Budget Reserve Fund. The transfer threshold is indexed to the five-year compound annual growth rate in personal income and is estimated as shown in the table at right. See page 37 for a discussion of the Budget Reserve Fund.
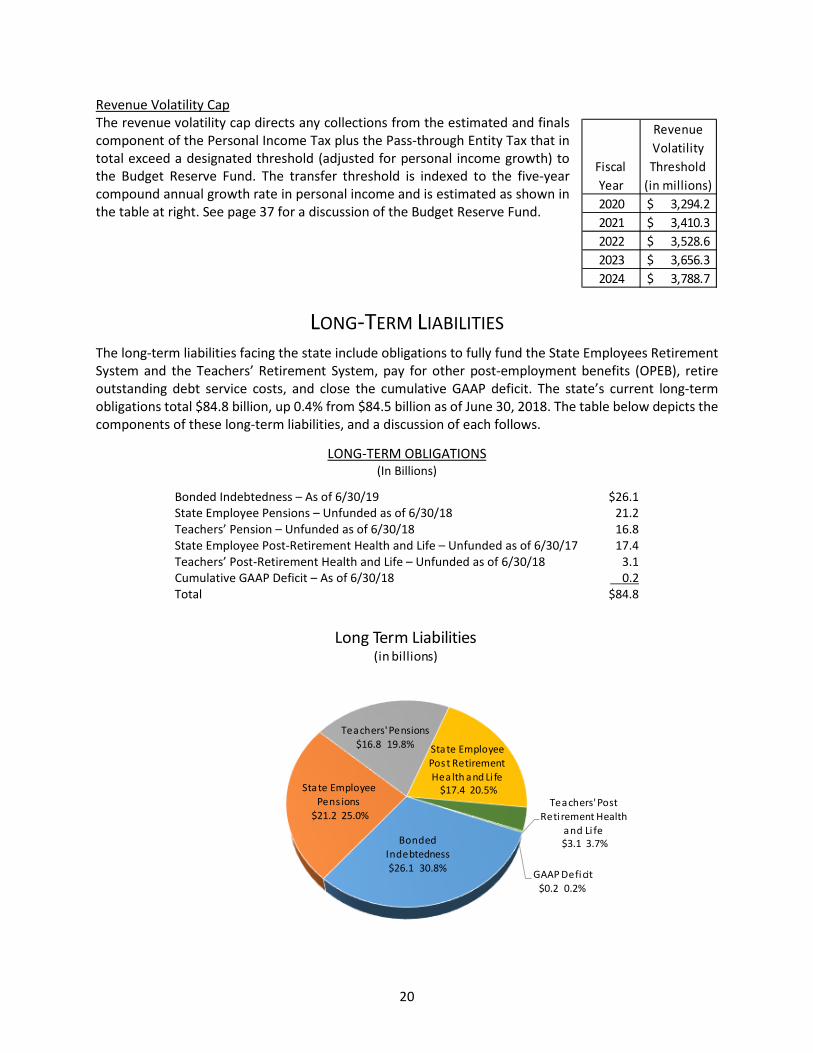
LONG-TERM LIABILITIES The long-term liabilities facing the state include obligations to fully fund the State Employees Retirement System and the Teachers’ Retirement System, pay for other post-employment benefits (OPEB), retire outstanding debt service costs, and close the cumulative GAAP deficit. The state’s current long-term obligations total $84.8 billion, up 0.4% from $84.5 billion as of June 30, 2018. The table below depicts the components of these long-term liabilities, and a discussion of each follows.
LONG-TERM OBLIGATIONS (In Billions)
Bonded Indebtedness – As of 6/30/19 $26.1 State Employee Pensions – Unfunded as of 6/30/18 21.2 Teachers’ Pension – Unfunded as of 6/30/18 16.8 State Employee Post-Retirement Health and Life – Unfunded as of 6/30/17 17.4 Teachers’ Post-Retirement Health and Life – Unfunded as of 6/30/18 3.1 Cumulative GAAP Deficit – As of 6/30/18 0.2 Total $84.8
Bonded Indebtedness$26.1 30.8%
State Employee Pens ions
$21.2 25.0%
Teachers' Pensions$16.8 19.8% State Employee
Post Retirement Health and Li fe
$17.4 20.5%Teachers' Post
Reti rement Health and Li fe$3.1 3.7%
GAAP Deficit$0.2 0.2%
Long Term Liabilities(in billions)
RevenueVolatilityThreshold
(in millions)2020 3,294.2$ 2021 3,410.3$ 2022 3,528.6$ 2023 3,656.3$ 2024 3,788.7$
Fiscal Year

21
PENSIONS The state is the sponsor of two large pension systems, one for state employees and one for teachers (SERS and TRS), as well as several smaller retirement plans for judges, family support magistrates and compensation commissioners; and for probate judges and employees. State Employees Retirement System (SERS) The state’s SERS obligation at the end of FY 2018 totaled $21.2 billion. The funded ratio is 38%. The market value investment returns of 13.82% for 2017 and 7.12% for 2018 were greater than the 6.9% assumed rate, however the return for 2019 was below the assumed rate at 5.9%. The impact of returns is smoothed over a five-year period to reduce volatility. The 6/30/2018 revised valuation7 recognized the increase in employee contributions of 1.5% of salary effective July 1, 2017 for all non-Tier IV members and the new Tier IV. The total SERS liability is $34.2 billion, with $21.2 billion the unfunded portion of that liability. Most of the liability – 72.5% – is related to already-retired employees. The pie chart and table that follow show the proportions of liability attributable to active employees and retirees. The overwhelming majority of the state’s contributions in FY 2020 – 85.4% –is to address the unfunded actuarial accrued liability.
7 SERS valuations are now conducted on an annual basis. The next valuation is due in December 2019.
Reti red/ Deferred Liability 72.5%
Active – Tier I 1.5%
Active – Tier I I11.5%
Active – Tier I IA12.2%
Active - Tier I II2.3%
Active - Tier IV0.0%
SERS Liability

22
Retired/Deferred Liability 24,813,844 72.5%Active – Tier I Hazardous 1,162 0.0%Active – Tier IB 501,017 1.5%Active – Tier IC 20,777 0.1%Active – Tier II Hazardous 729,335 2.1%Active – Tier II Others 3,197,760 9.3%Active – Tier IIA Hazardous 2,148,017 6.3%Active – Tier IIA Others 2,013,223 5.9%Active - Tier III Hazardous 154,906 0.5%Active - Tier III Hybrid 372,891 1.1%Active - Tier III Others 255,485 0.7%Active - Tier IV Hazardous 845 0.0%Active - Tier IV Hybrid 1,251 0.0%Active - Tier IV Others 3,650 0.0%Total Accrued Liability $34,214,163Actuarial Value of Assets 12,990,400Unfunded Accrued Liability $21,223,763
Normal cost $235,397Amortization of UAL $1,380,905FY 2020 Actuarially Determined Employer Contribution (ADEC)
$1,616,302
Liability Based on 6/30/18 Revised Valuation ($ in Thousands)
Teachers’ Retirement System (TRS) The state’s TRS unfunded liability at the end of FY 2018 totaled $16.8 billion, a $3.6 billion increase from the end of FY 2016 due primarily to the actuarial changes in Public Act 19-117 (these changes are discussed in the Recent Pension Changes section of this report). While market value investment returns were 14.41% in 2017 and 7.24% in 2018 – an average of 10.76% compared to the assumed rate at that time of 8% – TRS employs four-year asset smoothing which results in a two-year compound return of 6.88%, resulting in a $368 million loss. The return in FY 2019 was 5.9%. The following graph depicts the increase in contributions to the TRS. In FYs 2006 through 2009, contributions were supplemented with surplus funds. The bars in the graph for FY 2010 and beyond include debt service on the $2.3 billion pension obligation bonds issued on April 30, 2008 for the benefit of the Teachers’ Retirement System. Contributions grew in FYs 2018 and 2019 to reflect the impact of
$2.4 $2.6 $3.0 $3.2$2.2
$3.3
$5.2
$6.9 $6.5
$9.1
$11.1 $10.8
$13.1
$16.8
67%68%
69%70%
81%
76%
65%
60%
70%
61%
55%
59%
56% 52%
$1.5
$3.5
$5.5
$7.5
$9.5
$11.5
$13.5
$15.5
50%
55%
60%
65%
70%
75%
80%
85%
1992 1994 1996 1998 2000 2002 2004 2006 2008 2010 2012 20142016*2018*
Billions
Fund
ed R
atio
Unfunded Actuarial Accrued Liabilities
Unfunded Pensions
Funded Ratio
Teachers' Retirement SystemAs of 6/30

23
lowering the assumed rate of investment return to 8% from 8.5%. In FY 2020 the assumed rate was further reduced to 6.9%.
OUTLOOK FOR SERS AND TRS As noted above, the state is the sponsor of two large pension systems, one for state employees and one for teachers (SERS and TRS). Both systems are underfunded as a result of many decades of insufficient contributions to fund the promises made to generations of employees. Each system requires annual state contributions of over $1 billion now, and those are each expected to rise to over $2 billion or more in the coming years. Until recently, both systems were required to pay down virtually all of the unfunded liability by 2032, regardless of market performance in the meantime. Several changes have been implemented in recent years. Recent Pension Changes The 2019 legislative session yielded changes to both the State Employees Retirement System (SERS) and the Teachers’ Retirement System (TRS). These changes have resulted in a much steadier stream of projected contribution requirements as seen in the following graph.
$559 $582 $757 $788
$949 $984 $976 $1,012
$1,271 $1,292 $1,209 $1,250
$1,352
$170 $176
$90 $210
$59 $65
$81 $121
$145 $134 $133 $120
$140 $118$118
$118
$203
$396 $412
$519 $539 $618 $647
$838 $909
$1,094 $1,118 $1,108 $1,132
$1,411 $1,411 $1,327
$1,368
$1,555
$20$120$220$320$420$520$620$720$820$920
$1,020$1,120$1,220$1,320$1,420$1,520$1,620$1,720
'06 '07 '08 '09 '10 '11 '12 '13 '14 '15 '16 '17 '18 '19 '20Fcst.
'21Fcst.
'22Fcst.
Mill
ions
Fiscal Year
TRS Contributions
Debt Service
Surplus Funds
24
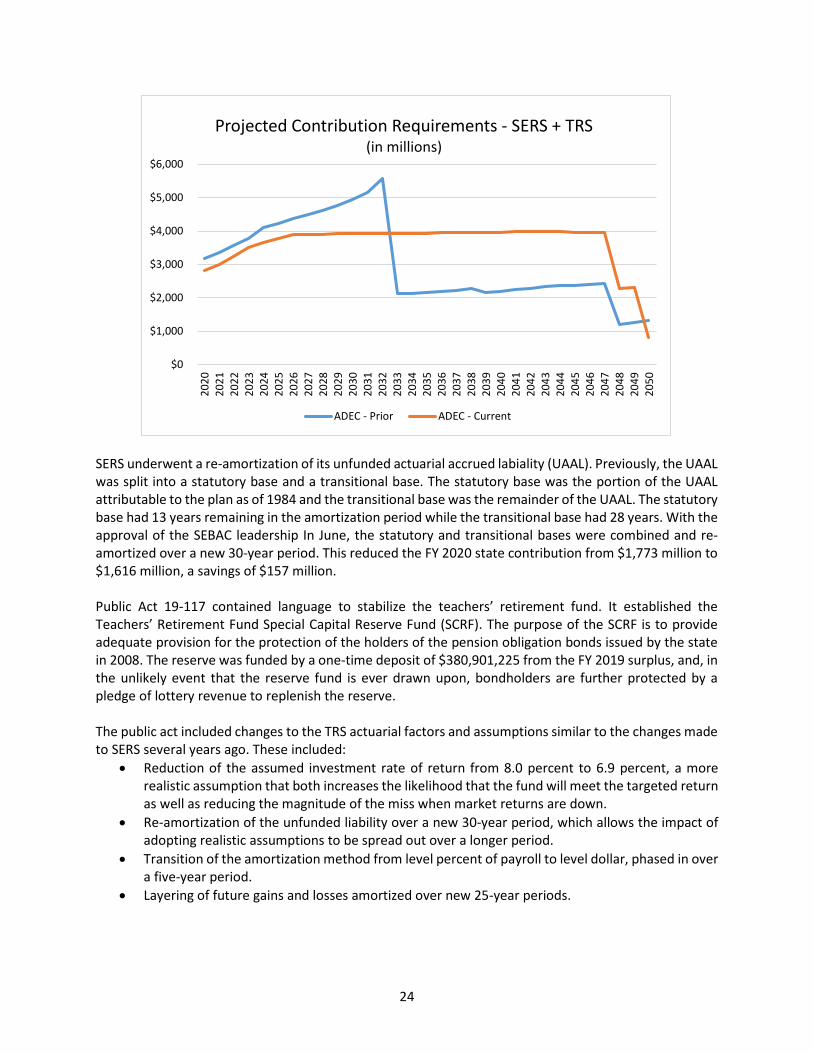
SERS underwent a re-amortization of its unfunded actuarial accrued labiality (UAAL). Previously, the UAAL was split into a statutory base and a transitional base. The statutory base was the portion of the UAAL attributable to the plan as of 1984 and the transitional base was the remainder of the UAAL. The statutory base had 13 years remaining in the amortization period while the transitional base had 28 years. With the approval of the SEBAC leadership In June, the statutory and transitional bases were combined and re-amortized over a new 30-year period. This reduced the FY 2020 state contribution from $1,773 million to $1,616 million, a savings of $157 million. Public Act 19-117 contained language to stabilize the teachers’ retirement fund. It established the Teachers’ Retirement Fund Special Capital Reserve Fund (SCRF). The purpose of the SCRF is to provide adequate provision for the protection of the holders of the pension obligation bonds issued by the state in 2008. The reserve was funded by a one-time deposit of $380,901,225 from the FY 2019 surplus, and, in the unlikely event that the reserve fund is ever drawn upon, bondholders are further protected by a pledge of lottery revenue to replenish the reserve. The public act included changes to the TRS actuarial factors and assumptions similar to the changes made to SERS several years ago. These included:
• Reduction of the assumed investment rate of return from 8.0 percent to 6.9 percent, a more realistic assumption that both increases the likelihood that the fund will meet the targeted return as well as reducing the magnitude of the miss when market returns are down.
• Re-amortization of the unfunded liability over a new 30-year period, which allows the impact of adopting realistic assumptions to be spread out over a longer period.
• Transition of the amortization method from level percent of payroll to level dollar, phased in over a five-year period.
• Layering of future gains and losses amortized over new 25-year periods.
$0
$1,000
$2,000
$3,000
$4,000
$5,000
$6,000
2020
2021
2022
2023
2024
2025
2026
2027
2028
2029
2030
2031
2032
2033
2034
2035
2036
2037
2038
2039
2040
2041
2042
2043
2044
2045
2046
2047
2048
2049
2050
Projected Contribution Requirements - SERS + TRS(in millions)
ADEC - Prior ADEC - Current
25
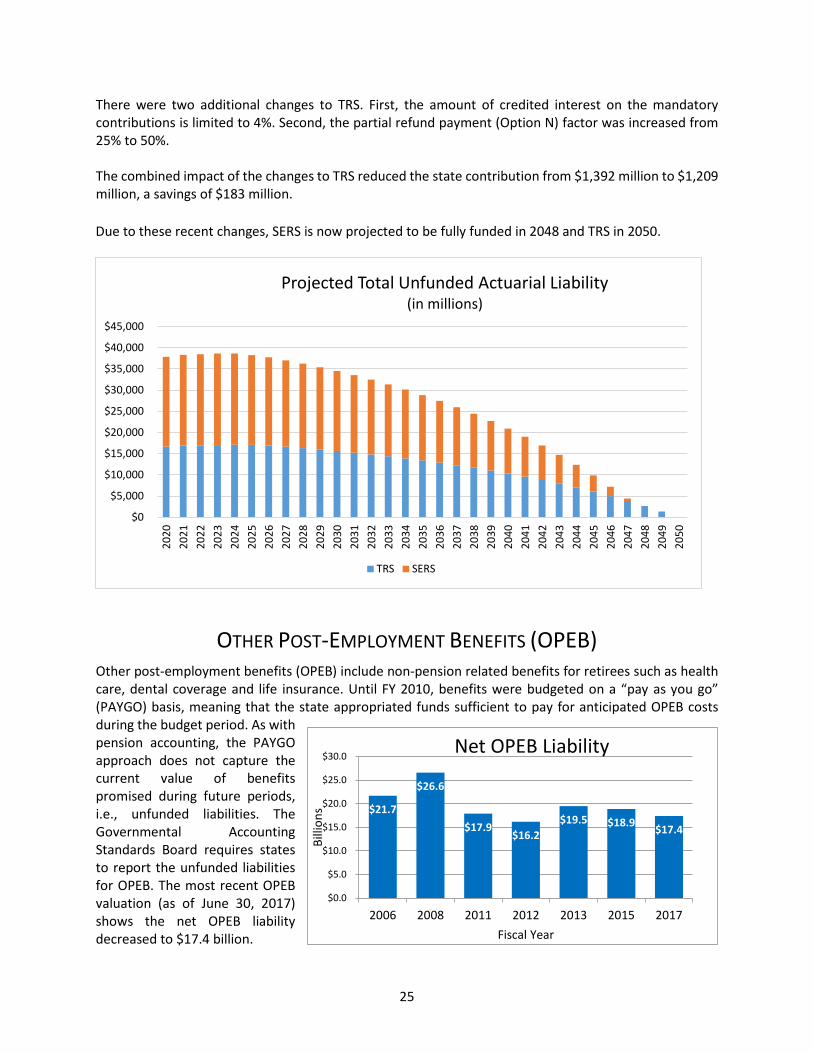
There were two additional changes to TRS. First, the amount of credited interest on the mandatory contributions is limited to 4%. Second, the partial refund payment (Option N) factor was increased from 25% to 50%. The combined impact of the changes to TRS reduced the state contribution from $1,392 million to $1,209 million, a savings of $183 million. Due to these recent changes, SERS is now projected to be fully funded in 2048 and TRS in 2050.
OTHER POST-EMPLOYMENT BENEFITS (OPEB) Other post-employment benefits (OPEB) include non-pension related benefits for retirees such as health care, dental coverage and life insurance. Until FY 2010, benefits were budgeted on a “pay as you go” (PAYGO) basis, meaning that the state appropriated funds sufficient to pay for anticipated OPEB costs during the budget period. As with pension accounting, the PAYGO approach does not capture the current value of benefits promised during future periods, i.e., unfunded liabilities. The Governmental Accounting Standards Board requires states to report the unfunded liabilities for OPEB. The most recent OPEB valuation (as of June 30, 2017) shows the net OPEB liability decreased to $17.4 billion.
$0
$5,000
$10,000
$15,000
$20,000
$25,000
$30,000
$35,000
$40,000
$45,000
2020
2021
2022
2023
2024
2025
2026
2027
2028
2029
2030
2031
2032
2033
2034
2035
2036
2037
2038
2039
2040
2041
2042
2043
2044
2045
2046
2047
2048
2049
2050
Projected Total Unfunded Actuarial Liability(in millions)
TRS SERS
$21.7
$26.6
$17.9 $16.2
$19.5 $18.9 $17.4
$0.0
$5.0
$10.0
$15.0
$20.0
$25.0
$30.0
2006 2008 2011 2012 2013 2015 2017
Billi
ons
Fiscal Year
Net OPEB Liability

26
Reforms negotiated in the 2011 and 2017 SEBAC agreements included: • Transitioning Medicare eligible retirees to a Medicare Advantage plan with pharmacy coverage which
is expected to save $135 million on an annual basis; • Increasing premium cost sharing and health care design changes for new retirees after October 1,
2017 and increasing again for new retirees after June 30, 2022; • Increasing copays for non-HEP drugs from $5 generic/$20 preferred/$35 brand to a four-tier system
of $5 preferred generic/$10 non-preferred generic/$25 preferred brand/$40 non-preferred brand; • Increasing the emergency room copay for non-emergencies from $35 to $250; • Converting to a tiered provider network plan; and • Increasing the number of years from ten to fifteen that health care eligible employees hired after July
1, 2017, must pay 3% of salary toward retiree health. In addition to the above, the state recently completed a competitive bidding process for a pharmacy benefits manager (PBM). The new contract, effective July 1, 2019, is expected to reduce the state’s pharmaceutical costs by approximately 10%. The impact will be reflected in the next OPEB valuation. In FY 2008, the state began the process of setting aside funds in trust to address the OPEB unfunded liability. While not a full actuarial funding approach, setting aside funds now could begin a long-term transition to actuarial pre-funding of OPEB costs. The 2009 and 2011 SEBAC agreements introduced employee contributions, and now all state employees contribute 3% to the OPEB trust fund, with the state matching those employee contributions. The table at right depicts OPEB contributions by both employees and the state. As of September 30, 2019, the OPEB trust fund has a market value of $1,213.7 million and is the fourth largest investment fund managed by the Treasurer’s Office after the State Employees Retirement Fund, Teachers’ Retirement Fund and the Municipal Employees Retirement Fund.
Fiscal YearEmployee
ContributionsState
ContributionsTotal
Contributions2007-08 - $10.0 $10.02008-09 - - $0.02009-10 $1.4 - $1.42010-11 $21.6 $14.5 $36.12011-12 $25.0 - $25.02012-13 $27.5 - $27.52013-14 $45.5 - $45.52014-15 $93.3 - $93.32015-16 $125.2 - $125.22016-17 $120.8 - $120.82017-18 $116.8 $122.2 $239.02018-19 $116.5 $125.8 $242.32019-20 est. $118.8 $124.7 $243.52020-21 est. $109.6 $109.6 $219.2Total $922.0 $506.8 $1,428.8
Other Post-Employment BenefitsSummary of Contributions
Excludes investment earnings* In Millions
27
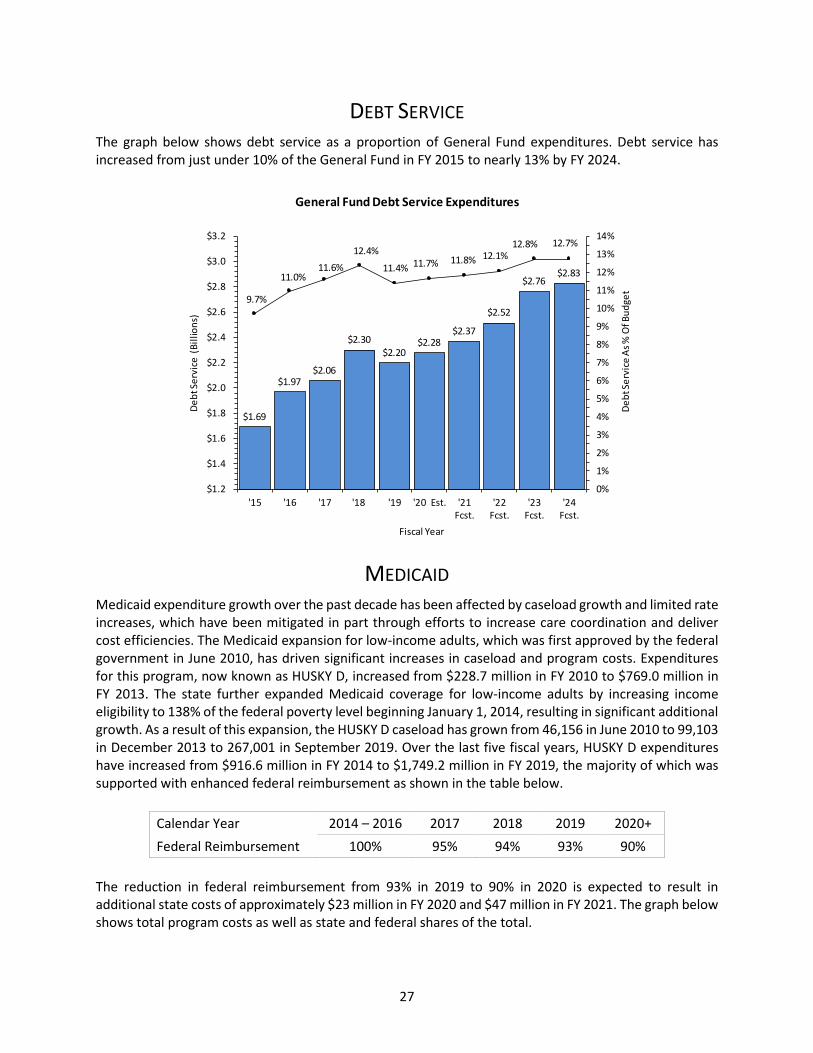
DEBT SERVICE The graph below shows debt service as a proportion of General Fund expenditures. Debt service has increased from just under 10% of the General Fund in FY 2015 to nearly 13% by FY 2024.
MEDICAID Medicaid expenditure growth over the past decade has been affected by caseload growth and limited rate increases, which have been mitigated in part through efforts to increase care coordination and deliver cost efficiencies. The Medicaid expansion for low-income adults, which was first approved by the federal government in June 2010, has driven significant increases in caseload and program costs. Expenditures for this program, now known as HUSKY D, increased from $228.7 million in FY 2010 to $769.0 million in FY 2013. The state further expanded Medicaid coverage for low-income adults by increasing income eligibility to 138% of the federal poverty level beginning January 1, 2014, resulting in significant additional growth. As a result of this expansion, the HUSKY D caseload has grown from 46,156 in June 2010 to 99,103 in December 2013 to 267,001 in September 2019. Over the last five fiscal years, HUSKY D expenditures have increased from $916.6 million in FY 2014 to $1,749.2 million in FY 2019, the majority of which was supported with enhanced federal reimbursement as shown in the table below.
Calendar Year 2014 – 2016 2017 2018 2019 2020+ Federal Reimbursement 100% 95% 94% 93% 90%
The reduction in federal reimbursement from 93% in 2019 to 90% in 2020 is expected to result in additional state costs of approximately $23 million in FY 2020 and $47 million in FY 2021. The graph below shows total program costs as well as state and federal shares of the total.
$1.69
$1.97 $2.06
$2.30 $2.20
$2.28 $2.37
$2.52
$2.76 $2.83
9.7%
11.0%11.6%
12.4%
11.4% 11.7% 11.8% 12.1%12.8% 12.7%
0%
1%
2%
3%
4%
5%
6%
7%
8%
9%
10%
11%
12%
13%
14%
$1.2
$1.4
$1.6
$1.8
$2.0
$2.2
$2.4
$2.6
$2.8
$3.0
$3.2
'15 '16 '17 '18 '19 '20 Est. '21Fcst.
'22Fcst.
'23Fcst.
'24Fcst.
Debt
Serv
ice
As %
Of B
udge
t
Debt
Serv
ice
(Bill
ions
)
Fiscal Year
General Fund Debt Service Expenditures
28
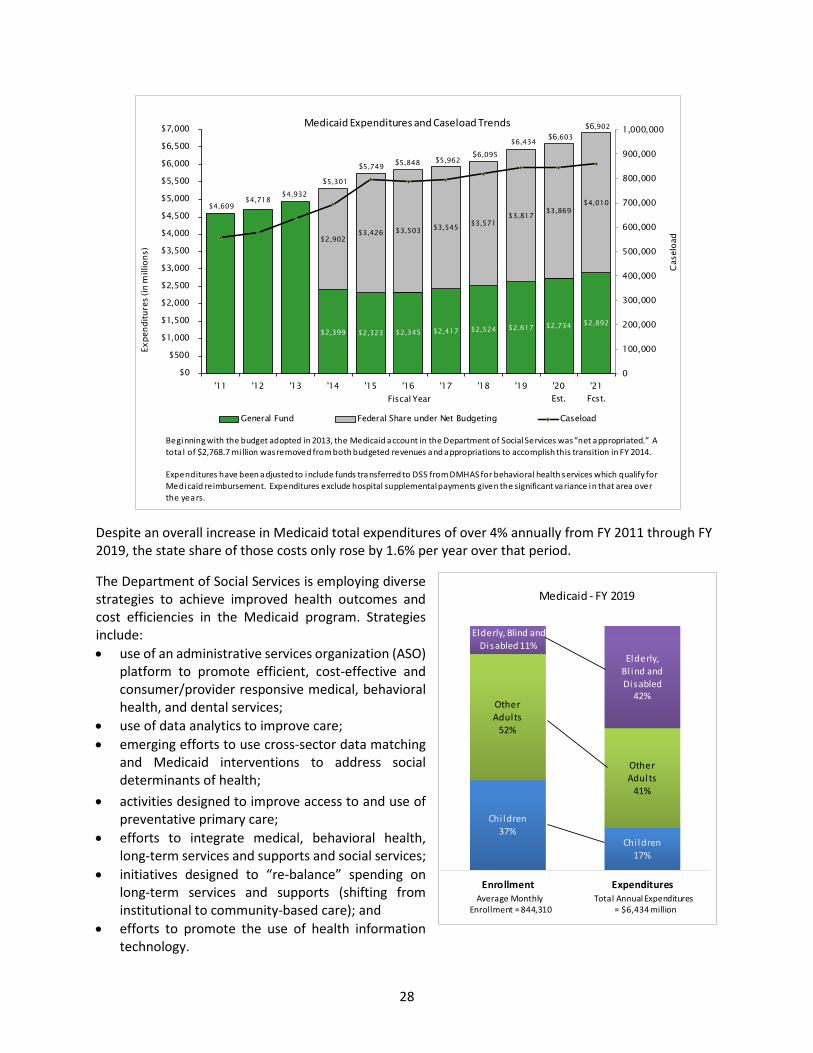
Despite an overall increase in Medicaid total expenditures of over 4% annually from FY 2011 through FY 2019, the state share of those costs only rose by 1.6% per year over that period. The Department of Social Services is employing diverse strategies to achieve improved health outcomes and cost efficiencies in the Medicaid program. Strategies include: • use of an administrative services organization (ASO)
platform to promote efficient, cost-effective and consumer/provider responsive medical, behavioral health, and dental services;
• use of data analytics to improve care; • emerging efforts to use cross-sector data matching
and Medicaid interventions to address social determinants of health;
• activities designed to improve access to and use of preventative primary care;
• efforts to integrate medical, behavioral health, long-term services and supports and social services;
• initiatives designed to “re-balance” spending on long-term services and supports (shifting from institutional to community-based care); and
• efforts to promote the use of health information technology.
$4,609 $4,718
$4,932
$2,399 $2,323 $2,345 $2,417 $2,524 $2,617 $2,734 $2,892
$2,902 $3,426 $3,503 $3,545 $3,571
$3,817 $3,869 $4,010
0
100,000
200,000
300,000
400,000
500,000
600,000
700,000
800,000
900,000
1,000,000
$0
$500
$1,000
$1,500
$2,000
$2,500
$3,000
$3,500
$4,000
$4,500
$5,000
$5,500
$6,000
$6,500
$7,000
'11 '12 '13 '14 '15 '16 '17 '18 '19 '20Est.
'21Fcst.
Cas
eloa
d
Expe
nditu
res
(in m
illio
ns)
Fiscal Year
General Fund Federal Share under Net Budgeting Caseload
$5,301
$5,749 $5,848
$6,434 $6,603
$5,962$6,095
$6,902Medicaid Expenditures and Caseload Trends
Beginning with the budget adopted in 2013, the Medicaid account in the Department of Social Services was “net appropriated.” A tota l of $2,768.7 mi llion was removed from both budgeted revenues and appropriations to accomplish this transition in FY 2014.
Expenditures have been adjusted to include funds transferred to DSS from DMHAS for behavioral health services which qualify for Medicaid reimbursement. Expenditures exclude hospital supplemental payments given the significant variance in that area overthe years.
Chi ldren37%
Chi ldren17%
Other Adults
52%
Other Adults
41%
Elderly, Blind and Disabled 11%
Elderly, Bl ind and Disabled
42%
Enrollment Expenditures
Medicaid - FY 2019
Average Monthly Total Annual ExpendituresEnrollment = 844,310 = $6,434 million

29
In contrast to almost all other Medicaid programs across the nation, Connecticut Medicaid uses a self-insured, managed, fee-for-service approach rather than a managed care arrangement. It is one of the very few Medicaid programs with relatively steady expenditures on a per member, per month (PMPM) basis. In fact, the Connecticut Medicaid program PMPM in FY 2019 remains virtually unchanged from FY 2014 levels.
4.5%
1.7%
-0.9%
2.7%
4.0%
1.9%
0.9%1.1%
4.5%
2.2%
3.1%
-0.9%
4.7%
5.6%
3.0%
2.5%
U.S. Medicaid Spending DSS Expenditures(Gross) *
Medicaid Growth Trends
FY 15 to FY 16 Change FY 16 to FY 17 Change
FY 17 to FY 18 Change FY 18 to FY 19 Change
DSS Enrollment (Average)
DSS PMPM (Average)
* Expenditures are net of drug rebates and exclude hospital supplemental payments given the significant variance in that area over the years. Expenditures include hospital rate increases effective 1/1/18; if these increases are excluded, the increase in expenditures would be reduced to 1.0% in FY 2018 and 4.0% in FY 2019 and the change in the PMPM would be revised to -2.0% in FY 2018 and 0.9% in FY 2019.

30
MUNICIPAL AID State aid to municipalities comes from a variety of sources: appropriated funds, bond funds, revenue intercepts, and transfers from non-appropriated funds. The table below shows major statutory aid to municipalities.
General Government FY 2020 FY 2021 FY 2022 FY 2023 FY 2024State Owned PILOT $ 54.9 $ 54.9 $ 54.9 $ 54.9 $ 54.9 College & Hospital PILOT 109.9 109.9 109.9 109.9 109.9 Mashantucket Pequot & Mohegan Grant 51.5 51.5 51.5 51.5 51.5 Town Aid Road Grant1 - - - - - LoCIP1 - - - - - Grants for Municipal Aid Projects1 - - - - - MRSA: Select PILOT2 - - 147.6 147.6 147.6 MRSA: Councils of Government2 4.1 4.1 7.0 7.0 7.0
MRSA: Motor Vehicle Tax Grants2
(Municipal Transition) 29.9 32.3 29.6 29.6 29.6
MRSA: Municipal Revenue Sharing Grant2 36.8 36.8 180.1 189.2 189.2 Municipal Stabilization Grants 38.0 38.0 - - - Municipal Restructuring 7.3 7.3 7.3 7.3 7.3 Municipal Restructuring: Debt Service 45.7 56.3 54.7 54.1 51.3 Misc. General Government Grants 29.6 28.9 29.0 29.0 29.0 Subtotal3 - General Government $ 407.7 $ 420.0 $ 671.6 $ 680.1 $ 677.2
EducationAdult Education $ 20.4 $ 20.4 $ 20.4 $ 20.4 $ 20.4 Education Cost Sharing 2,054.3 2,094.1 2,134.1 2,174.2 2,214.3 Magnet Schools 304.2 306.0 309.5 309.9 310.3Special Education - Student Based 140.6 140.6 202.7 206.8 210.9Local School Construction1 - - - - - Misc. Education Grants 191.9 192.8 193.6 194.7 195.8Subtotal3 - Education $ 2,711.4 $ 2,753.9 $ 2,860.3 $ 2,905.9 $ 2,951.7
Local Teachers' RetirementRetiree Health Service Cost $ 26.0 $ 26.1 $ 27.2 $ 28.3 $ 28.3 Retirement Contributions 1,208.8 1,249.8 $ 1,351.7 $ 1,472.6 $ 1,594.8 Debt Service - Pension Obligation Bonds 118.4 118.4 $ 203.1 $ 306.7 $ 315.7 Subtotal3 - Local Teachers' Retirement $ 1,353.2 $ 1,394.3 $ 1,582.0 $ 1,807.5 $ 1,938.7
Total3 - Aid to Municipalities $ 4,472.3 $ 4,568.2 $ 5,113.9 $ 5,393.6 $ 5,567.6
3. Totals may not sum due to rounding.
1. Bonded grants to municipalities are at the discretion of the State Bond Commission. As of November 12, 2019, there are no bond authorizations to fund these grants.2. Outyear projections for Municipal Revenue Sharing Account (MRSA) grants are based on formulas in section 4-66l of the General Statutes. Note that revenue to MRSA has been suspended until FY 2022, so FY 2020-2021 amounts represent General Fund appropriations only.
STATE AID TO OR ON BEHALF OF LOCAL GOVERNMENTS(in Millions)

31
Education Cost Sharing Grants The Education Cost Sharing Grant (ECS) is the state’s major education grant, designed to equalize the ability of towns to finance local education costs. The graph below shows past and projected levels of ECS funding; projections are based on the current formula.
Note: The budget for FY 2010 and FY 2011 included federal ARRA SFSF funding of $269 million (14% of the grant). From FY 2013 to FY 2016, Charter School Grants were appropriated under the ECS grant. Charter School funding is not included in the graph above. The Education Cost Sharing Grant was supplemented by $10 million in FY 2016 and FY 2017 from the Municipal Revenue Sharing Account (MRSA).
STATE WORKFORCE Long-Term Staffing Trends After falling dramatically during the past decade, the number of state employees in the executive branch of state government has remained relatively constant over the past year. As of the end of October 2019, there were 26,488 permanent full-time employees being paid from appropriated funds in the executive branch (excluding higher education). Even though hundreds of positions were transferred from the UConn Health Center to the Department of Correction beginning in June 2018, this current staffing level remains
$1,6
14
$1,6
20 $1
,889
$1,9
30
$1,9
93
$2,0
35
$2,0
52
$2,0
12
$1,9
27
$2,0
16
$2,0
54
$2,0
94
$2,1
34
$2,1
74
$2,2
14
$270
$269
$10 $10
$1,400
$1,500
$1,600
$1,700
$1,800
$1,900
$2,000
$2,100
$2,200
$2,300
'10 '11 '12 '13 '14 '15 '16 '17 '18 '19 '20 Est '21 Proj '22 Proj 23 Proj 24 Proj
in m
illio
ns
Fiscal Year
ECS Funding
ECS Grant ARRA MRSF

32
5,370 employees, or 16.9%, lower than the number at the end of fiscal year 2008. To take a longer perspective, this means that, when adjusted for changes in state population, executive branch agencies have fewer staff than at any time since the 1950s. This workforce reduction has resulted in significant budget savings, as state employee wages and salaries now account for less than 1/8th of the General Fund budget.
FEDERAL BUDGET AND POLICY ISSUES
Several significant federal budget and policy issues must be dealt with over the next year, creating uncertainty for state policymakers as well as for the budgeting process.
• Appropriations for federal fiscal year (FFY) 2021 have not yet been signed into law. The House has approved 10 of 12 appropriation bills, but by the end of October the Senate had passed only four appropriation bills covering Agriculture, Commerce-Justice-Science, Interior-Environment, and Transportation-Housing and Urban Development.
• The U.S. House and Senate are expected to vote this week on a new continuing resolution (CR) that would extend funding for the federal government; the current CR (P.L. 116-59) expires on November 21. Although text of the CR has not yet been released, it is expected to run through December 20. In the absence of an agreement on another CR, a government shutdown would ensue.
• House and Senate appropriators are negotiating topline spending levels for each of the 12 appropriations bills. Once those topline spending allocations are established, the House and Senate Appropriations subcommittees will still need to work out the details of their individual bills. To begin conferencing bills, the House and Senate need to agree on spending allocations for the 12 appropriations bills.
• The current continuing resolution extends TANF and Child Care entitlements through November 21, 2019, but those programs will need to be reauthorized. Mandatory programs with budget authority provided in an appropriations bill—such as Medicaid, Child Nutrition and the Supplemental Nutrition Assistance Program—may operate at FFY 2020 current-law levels in the absence of new appropriations language. In the event of a government shutdown, the CR allows certain mandatory benefit payments to be paid for up to 30 days after expiration of the CR.
• Under the federal Budget Control Act, enacted in 2011, several key programs are automatically subject to mandatory sequestration (cuts) of 5.9% in federal fiscal year 2020. The cuts would apply to such programs as the Social Services Block Grant, Promoting Safe and Stable Families, Vocational Rehabilitation, Special Milk (Child Nutrition), and a portion of highway funding. The Bipartisan Budget Act of 2019 allowed for increases in discretionary spending to avert or mitigate sequestration in FFY 2019, but the absence of a budget for FFY 2020 makes it is unclear whether sequestration will be applied to these programs going forward.
• The Affordable Care Act reduced Medicaid disproportionate share hospital (DSH) funding on the assumption that there would be fewer uninsured persons and less uncompensated care with the expansion of health coverage. The cuts—initially scheduled to begin in FFY 2014—have been delayed and modified repeatedly and are now scheduled to take effect in FFY 2020. The current CR delays the DSH cuts through November 21 and the new CR would further delay such cuts through December 20, but the prospects of additional delays beyond that date are unclear.
33
EFFORTS TO PRESERVE OR MAXIMIZE FEDERAL REVENUE8 The state continues to make federal revenue maximization efforts a priority. Numerous Medicaid state plan amendments have been submitted or are in the process of being submitted to the federal government, and initiatives not requiring federal approval are being operationalized by impacted state agencies. In the current fiscal year and through the biennium, new federal revenue could be realized from these initiatives beyond normal increases in federal Medicaid reimbursement associated with growth in caseload and utilization. An interagency workgroup meets monthly to discuss revenue opportunities and implementation issues. Some of the major revenue-maximization and -retention initiatives being explored or under development include: • Licensure change for the state’s healthcare facility for veterans in Rocky Hill; • Administrative process changes to help ensure Medicaid claims on behalf of the Department of
Developmental Services are not lost because clients miss eligibility determination deadlines; • Examining the implications of the new federal opioid bill on the state’s Medicaid program, including
whether development of an 1115 waiver is needed to permit coverage of certain substance use disorder treatment services currently ineligible for Medicaid reimbursement;
• Examining the implications and opportunities available under the new federal Family First Prevention Services Act for the state’s existing claims for federal Medicaid, Temporary Assistance for Needy Families (TANF) and Title IV-E (adoption and foster care services) reimbursement; and
• Development of a 1915(i) state plan amendment that will permit Medicaid reimbursement of formerly state-only funded tenancy supports for individuals that have high Medicaid utilization and have experienced homelessness.
While much effort goes into maximizing revenue, equal or greater effort goes into preserving existing sources of federal reimbursement. The federal Centers for Medicare and Medicaid Services has strengthened its compliance activities, resulting in significantly greater scrutiny of all state claims. Department of Social Services staff and impacted state agencies have experienced significantly increased time and effort explaining and justifying revenue items in order to sustain claims worth hundreds of millions of dollars that had once been considered routine.
8 This section fulfills the reporting requirement found in subsection (c) of Sec. 4-31d, CGS.

34
BONDING PROJECTED BOND AUTHORIZATIONS, ALLOCATIONS AND ISSUANCE
The table below depicts projected bond authorizations, allocations and issuance through FY 2024.
FY 2020 FY 2021 FY 2022 FY 2023 FY 2024Bond Authorizations Genera l Obl igation Bonds 1,407,074,000$ 1,277,500,000$ 1,500,000,000$ 1,500,000,000$ 1,500,000,000$ Bioscience Col laboration Program 10,565,000 10,570,000 - - - Bioscience Innovation Fund 15,000,000 25,000,000 25,000,000 25,000,000 25,000,000 Connecticut Strategic Defense Investment Act 9,096,428 9,446,428 9,621,428 9,796,428 9,971,428 UCONN 2000/Next Generation 197,200,000 260,000,000 190,500,000 125,100,000 84,700,000 CSUS 2020 80,000,000 46,000,000 - - - Specia l Tax Obl igation Bonds 1,482,615,000 782,375,000 800,000,000 800,000,000 800,000,000 Clean Water Fund Revenue Bonds - 84,000,000 150,000,000 150,000,000 150,000,000
Total Bond Authorizations 3,201,550,428$ 2,494,891,428$ 2,675,121,428$ 2,609,896,428$ 2,569,671,428$ Bond Allocations Genera l Obl igation Bonds 1,200,000,000$ 1,400,000,000$ 1,600,000,000$ 1,600,000,000$ 1,600,000,000$ Specia l Tax Obl igation Bonds 800,000,000 800,000,000 800,000,000 800,000,000 800,000,000 Clean Water Fund Revenue Bonds 150,000,000 150,000,000 150,000,000 150,000,000 150,000,000
Total Bond Allocations 2,150,000,000$ 2,350,000,000$ 2,550,000,000$ 2,550,000,000$ 2,550,000,000$
FY 2020 FY 2021 FY 2022 FY 2023 FY 2024Bond Issuance Genera l Obl igation Bonds 1,600,000,000$ 1,600,000,000$ 1,600,000,000$ 1,600,000,000$ 1,600,000,000$ Specia l Tax Obl igation Bonds 850,000,000 875,000,000 875,000,000 875,000,000 875,000,000 Clean Water Revenue Bonds 250,000,000 - 250,000,000 - 250,000,000 UCONN 2000/Next Generation 197,200,000 260,000,000 190,500,000 125,100,000 84,700,000
Total Bond Issuance 2,897,200,000$ 2,735,000,000$ 2,915,500,000$ 2,600,100,000$ 2,809,700,000$ Debt Service Genera l Fund 2,278,692,395$ 2,368,829,874$ 2,516,650,999$ 2,763,507,535$ 2,827,344,060$ Transportation Fund 697,100,000 767,900,000 806,200,000 854,700,000 903,300,000
Total Debt Service 2,975,792,395$ 3,136,729,874$ 3,322,850,999$ 3,618,207,535$ 3,730,644,060$
Assumptions in the absence of a bond bill:
Bond Authorizations
Bond Al locations- Projected GO Bond a l locations are based on budgeted debt service and the Governor's plan to l imit new debt.- Projected GO Bond Al locations wi l l be substantia l ly under the C.G.S. Section 3-20(d)(2) projected ca lendar year caps .- Projected Specia l Tax Obl igation Bond a l locations assume that a l locations continue at his torica l levels .
Bond Issuance- Projected GO Bond i ssuances are based on budgeted debt service and the Governor's plan to l imit new debt.- Projected GO Bond i ssuances wi l l be substantia l ly under the C.G.S. Section 3-21(f)(1) projected fi sca l year caps .
Estimated Caps Inflation Al location Cap Issuance CapCY/FY 2019 2.2% 2,079,000,000$ 1,900,000,000$ CY/FY 2020 2.4% 2,125,000,000$ 1,940,000,000$ CY/FY 2021 2.2% 2,176,000,000$ 1,983,000,000$ CY/FY 2022 2.3% 2,224,000,000$ 2,031,000,000$ CY/FY 2023 2.3% 2,275,000,000$ 2,076,000,000$ CY/FY 2024 2.3% 2,327,000,000$ 2,124,000,000$
Source: IHS Economics , Bureau of Labor Statis tics
- FY 2020-FY 2021 Projected Specia l Tax Obl igation Bond authorizations assume the amounts in the FRB JF.- FY 2022-FY2024 Projected Specia l Tax Obl igation Bond authorizations assume that authorizations continue at his torica l average levels .
- CSCU 2020 automatic authorizations in accordance with C.G.S. Section 10a-91e as proposed in the FRB JF.- Bioscience Col laboration Program automatic authorizations in accordance with C.G.S. Section 32-41z.- Bioscience Innovation Fund automatic authorizations in accordance with C.G.S. Section 32-41dd.- Connecticut Strategic Defense Investment Act automatic authorizations in accordance with C.G.S. Section 32-4o.- Specia l Tax Obl igation Bonds include $706 mi l l ion in FY 2020 previous ly authorized in section 232 of P.A. 15-1, June specia l sess ion.
FIVE YEAR BOND PROJECTIONS
- FY 2020-FY 2021 Projected Genera l Obl igation Bond authorizations assume the amounts in the Finance, Revenue and Bonding Committee (FRB) Joint Favorable Report (JF) of 5/1/2019.- FY 2022-FY2024 Projected Genera l Obl igation Bond authorizations assume that authorizations continue at his torica l average levels .- Clean Water Program Revenue Bond authorizations as proposed in the FRB JF and projected a l locations .- UConn Next Generation automatic authorizations in accordance with C.G.S. Section 10a-109g, as proposed in the FRB JF.
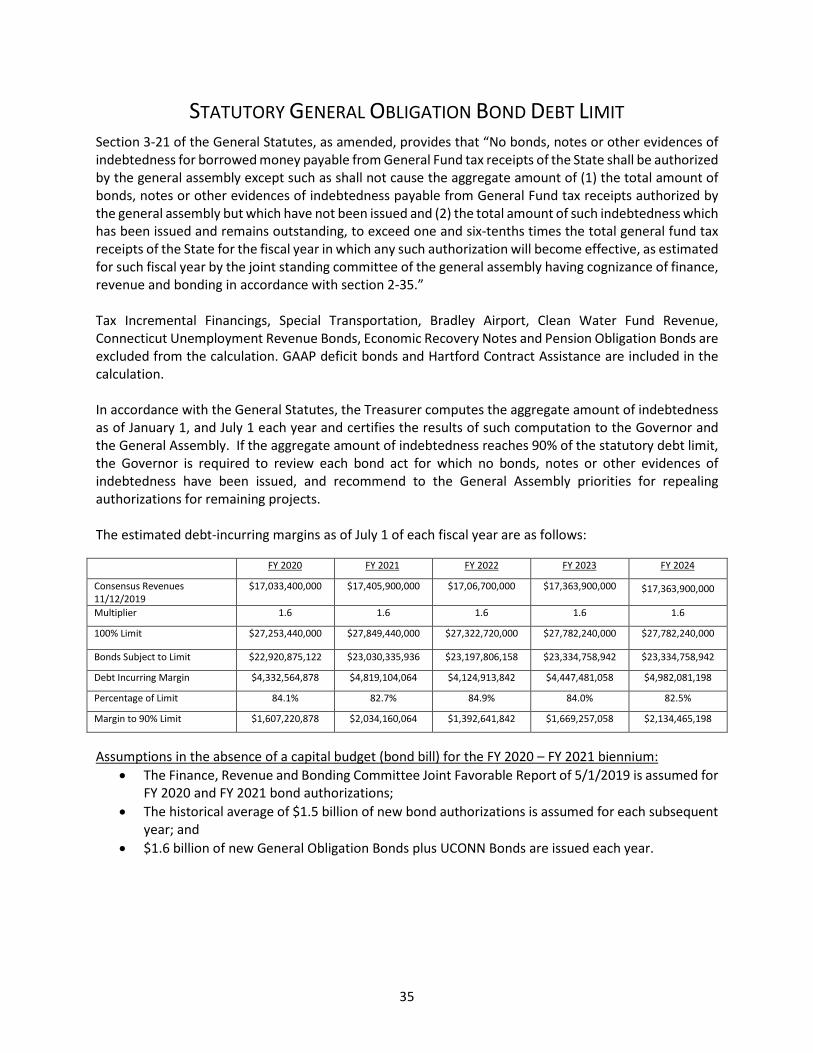
35
STATUTORY GENERAL OBLIGATION BOND DEBT LIMIT Section 3-21 of the General Statutes, as amended, provides that “No bonds, notes or other evidences of indebtedness for borrowed money payable from General Fund tax receipts of the State shall be authorized by the general assembly except such as shall not cause the aggregate amount of (1) the total amount of bonds, notes or other evidences of indebtedness payable from General Fund tax receipts authorized by the general assembly but which have not been issued and (2) the total amount of such indebtedness which has been issued and remains outstanding, to exceed one and six-tenths times the total general fund tax receipts of the State for the fiscal year in which any such authorization will become effective, as estimated for such fiscal year by the joint standing committee of the general assembly having cognizance of finance, revenue and bonding in accordance with section 2-35.” Tax Incremental Financings, Special Transportation, Bradley Airport, Clean Water Fund Revenue, Connecticut Unemployment Revenue Bonds, Economic Recovery Notes and Pension Obligation Bonds are excluded from the calculation. GAAP deficit bonds and Hartford Contract Assistance are included in the calculation. In accordance with the General Statutes, the Treasurer computes the aggregate amount of indebtedness as of January 1, and July 1 each year and certifies the results of such computation to the Governor and the General Assembly. If the aggregate amount of indebtedness reaches 90% of the statutory debt limit, the Governor is required to review each bond act for which no bonds, notes or other evidences of indebtedness have been issued, and recommend to the General Assembly priorities for repealing authorizations for remaining projects. The estimated debt-incurring margins as of July 1 of each fiscal year are as follows:
FY 2020 FY 2021 FY 2022 FY 2023 FY 2024
Consensus Revenues 11/12/2019
$17,033,400,000 $17,405,900,000 $17,06,700,000 $17,363,900,000 $17,363,900,000
Multiplier 1.6 1.6 1.6 1.6 1.6
100% Limit $27,253,440,000 $27,849,440,000 $27,322,720,000 $27,782,240,000 $27,782,240,000
Bonds Subject to Limit $22,920,875,122 $23,030,335,936 $23,197,806,158 $23,334,758,942 $23,334,758,942
Debt Incurring Margin $4,332,564,878 $4,819,104,064 $4,124,913,842 $4,447,481,058 $4,982,081,198
Percentage of Limit 84.1% 82.7% 84.9% 84.0% 82.5%
Margin to 90% Limit $1,607,220,878 $2,034,160,064 $1,392,641,842 $1,669,257,058 $2,134,465,198
Assumptions in the absence of a capital budget (bond bill) for the FY 2020 – FY 2021 biennium:
• The Finance, Revenue and Bonding Committee Joint Favorable Report of 5/1/2019 is assumed for FY 2020 and FY 2021 bond authorizations;
• The historical average of $1.5 billion of new bond authorizations is assumed for each subsequent year; and
• $1.6 billion of new General Obligation Bonds plus UCONN Bonds are issued each year.
36
BONDING CAPS During the 2017 legislative session, limitations on bond allocations, allotments and issuances were enacted. These limitations are described below. • Allocation Cap: This cap imposes a limit on State Bond Commission general obligation bond allocations
for each calendar year. The cap amount is indexed to inflation. The inflation-adjusted cap for calendar year 2019 is $2.079 billion.
• Allotment Cap: This cap limits allotments issued by the Governor's Office each fiscal year. The cap
amount is indexed to inflation. General obligation bonds issued as part of CSCU 2020 or UConn 2000 are exempted from the cap. The cap for FY 2020 is $1.94 billion.
• Issuance Cap: This cap limits bond issuances by the Treasurer's Office each fiscal year. The cap amount
is indexed to inflation. General obligation bonds issued as part of CSCU 2020 or UConn 2000 are exempted from this cap. The cap for FY 2020 is $1.94 billion.

37
BUDGET RESERVE FUND AND POTENTIAL USES OF SURPLUS After the accounts for the General Fund have been closed at the end of each fiscal year, Connecticut statute directs the Comptroller to deposit any unappropriated General Fund surplus in the Budget Reserve Fund (BRF, a.k.a. Rainy Day Fund) until the fund reaches an amount equal to 15% of net General Fund appropriations. The graph below depicts historical operating deposits to and withdrawals from the Budget Reserve Fund. If the budget for the FY 2020 and FY 2021 biennium is implemented without drawing from the BRF, and assuming adherence to the revenue volatility cap and the cap that limits the amount of revenue that can be appropriated, the BRF will reach its statutory cap at the end of FY 2021.
Impact of a Potential Recession An October 2019 report by Moody’s Analytics regarding state preparedness to withstand fiscal stress found Connecticut would need reserve balances totaling at least 10.1% of General Fund revenues to withstand a moderate recession scenario and 14.8% in a severe recession, which is consistent with the statutory 15% Budget Reserve Fund target. Moody’s concluded that while Connecticut is relatively well-positioned for a moderate recession (ranked 18th of the 50 states), the state has insufficient resources to weather a severe downturn (ranked 21st of the 50 states) without having to raise taxes or cut spending. As noted earlier in this report, a record twelve years have passed since the commencement of the last U.S. recession. Building a strong Budget Reserve Fund is a key step in preparing for the next inevitable downturn in the business cycle.
$0.0
$302.2 $363.9$446.5$269.2
$0.0 $0.0
-$1,278.5
-$103.2
$93.5
$177.2$248.5-$113.2-$170.4
-$22.7
$972.4
$1,320.2
$318.3
$106.8 $42.5$71.5 $83.3
$0.0
$666.0
$1,112.5
$1,381.7 $1,381.7$1,381.7
$103.2 $0.0
$270.7$519.2
$406.0
$235.6
$212.9
$1,185.3
$2,505.5
$2,823.8$2,930.6
$2,973.1
$3,044.6
$3,127.9
-$1,400-$1,100
-$800-$500-$200$100$400$700
$1,000$1,300$1,600$1,900$2,200$2,500$2,800$3,100$3,400$3,700
'03 '04 '05 '06 '07 '08 '09 '10 '11 '12 '13 '14 '15 '16 '17 '18 '19 '20Proj.
'21Proj.
'22Proj.
'23Proj.
'24Proj.
Mill
ions
Fiscal Year
Budget Reserve Fund Balance(In Millions)
Deposits/(Withdrawals)Account Balance
Outyear forecast assumes balanced budgets are enacted that adhere to the revenue, spending, and volatility caps. Projected balance reaches 15% in FY 2021, resulting in estimated deposits to SERS/TRS of $321.2 million in FY 2021, $442.6 million in FY 2022, $438.6 million in FY 2023, and $455.1 million in FY 2024.
38
Recent Reforms Several recent legislative changes impact the Budget Reserve Fund. Public Act 17-2 of the June Special Session implemented, and Public Act 18-81 later amended, a revenue volatility cap which directs collections from any volatile revenue sources above a certain threshold to the Budget Reserve Fund. (See page 20 for more about the revenue volatility cap.) The volatility cap resulted in transfers of $1,471.3 million to the rainy day fund in FY 2018 and $949.7 million in FY 2019, resulting in substantial — and much-needed — improvement in the state’s reserves. This will serve the state well during future economic downturns. Public Act 17-2 of the June Special Session also introduced a revenue cap that limits the amount of General Fund appropriations to a percentage of General Fund revenue. The limit began at 99.5% in fiscal year 2020 and phases down to 98% for fiscal year 2026 and thereafter. (See page 19 for more about the revenue cap.) The resulting operating margin will help add to the rainy day fund in good years and provide a buffer against drastic expenditure reductions or revenue increases when there is a sudden mid-year downturn in the economy. Use of Budget Reserve Fund Statutorily, the Budget Reserve Fund may only be expended: • To fund a deficit in the immediately preceding fiscal year; • By transfer of the General Assembly if any consensus revenue forecast projects a decline in
General Fund revenues in the current biennium of one per cent or more; • By transfer of the General Assembly if the April 30th consensus revenue forecast projects a decline
in General Fund revenues in the ensuing biennium of one percent or more from the current year; or
• By transfer of the General Assembly if the BRF equals 5% or more of current year appropriations of the amount in excess of the 5% for the payment of unfunded past service liability of the SERS and TRS pension systems which are in addition to any regular contributions.
Discussion of Possible Uses of Surplus Funds Under current law (CGS Sec. 4-30a), unappropriated surpluses are committed to the Budget Reserve Fund until the maximum 15 percent authorized by law. Other possible uses of surplus funds could include: • Reducing the unfunded liability of the State Employees Retirement Fund; • Reducing the unfunded liability of the Teachers’ Retirement Fund; • Reducing bonded indebtedness; • Reducing the unfunded liability for Other Post-Employment Benefits; or • Providing funds for higher education matching grants as per sections 10a-8c, 10a-77a, 10a-99a,
10a-109c, 10a-109i, and 10a-143a of the Connecticut General Statutes.
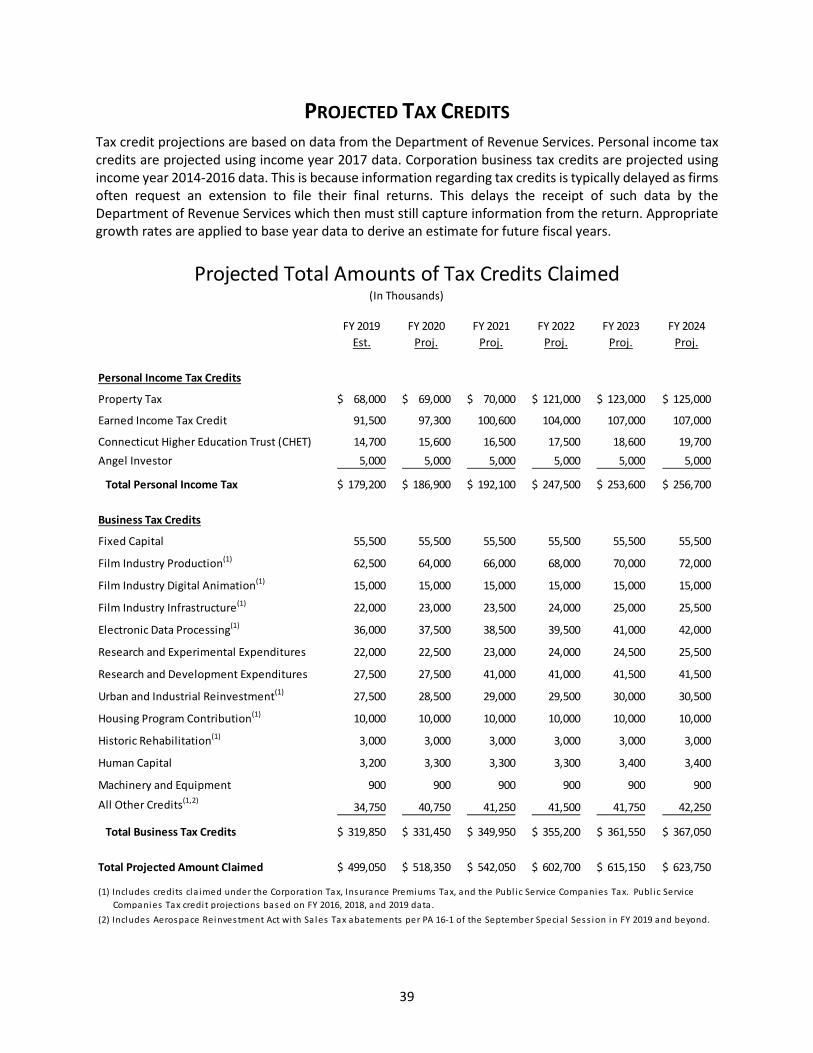
39
PROJECTED TAX CREDITS Tax credit projections are based on data from the Department of Revenue Services. Personal income tax credits are projected using income year 2017 data. Corporation business tax credits are projected using income year 2014-2016 data. This is because information regarding tax credits is typically delayed as firms often request an extension to file their final returns. This delays the receipt of such data by the Department of Revenue Services which then must still capture information from the return. Appropriate growth rates are applied to base year data to derive an estimate for future fiscal years.
Projected Total Amounts of Tax Credits Claimed
FY 2019 FY 2020 FY 2021 FY 2022 FY 2023 FY 2024Est. Proj. Proj. Proj. Proj. Proj.
Personal Income Tax Credits
Property Tax 68,000$ 69,000$ 70,000$ 121,000$ 123,000$ 125,000$
Earned Income Tax Credit 91,500 97,300 100,600 104,000 107,000 107,000
Connecticut Higher Education Trust (CHET) 14,700 15,600 16,500 17,500 18,600 19,700 Angel Investor 5,000 5,000 5,000 5,000 5,000 5,000
Total Personal Income Tax 179,200$ 186,900$ 192,100$ 247,500$ 253,600$ 256,700$
Business Tax Credits
Fixed Capital 55,500 55,500 55,500 55,500 55,500 55,500
Film Industry Production(1) 62,500 64,000 66,000 68,000 70,000 72,000
Film Industry Digital Animation(1) 15,000 15,000 15,000 15,000 15,000 15,000
Film Industry Infrastructure(1) 22,000 23,000 23,500 24,000 25,000 25,500
Electronic Data Processing(1) 36,000 37,500 38,500 39,500 41,000 42,000
Research and Experimental Expenditures 22,000 22,500 23,000 24,000 24,500 25,500
Research and Development Expenditures 27,500 27,500 41,000 41,000 41,500 41,500
Urban and Industrial Reinvestment(1) 27,500 28,500 29,000 29,500 30,000 30,500
Housing Program Contribution(1) 10,000 10,000 10,000 10,000 10,000 10,000
Historic Rehabilitation(1) 3,000 3,000 3,000 3,000 3,000 3,000
Human Capital 3,200 3,300 3,300 3,300 3,400 3,400
Machinery and Equipment 900 900 900 900 900 900
All Other Credits(1,2)34,750 40,750 41,250 41,500 41,750 42,250
Total Business Tax Credits 319,850$ 331,450$ 349,950$ 355,200$ 361,550$ 367,050$
Total Projected Amount Claimed 499,050$ 518,350$ 542,050$ 602,700$ 615,150$ 623,750$
(In Thousands)
(2) Includes Aerospace Reinvestment Act with Sa les Tax abatements per PA 16-1 of the September Specia l Sess ion in FY 2019 and beyond.
(1) Includes credi ts cla imed under the Corporation Tax, Insurance Premiums Tax, and the Publ ic Service Companies Tax. Publ ic Service Companies Tax credi t projections based on FY 2016, 2018, and 2019 data .