Embed Size (px)
Citation preview

FISCAL CONSTRAINT IN LONG-RANGE TRANSPORTATION
PLANNING Best Practices Case Studies
January 2012
Prepared for: U.S. Department of Transportation
Office of Planning, Environment, and Realty Federal Highway Administration
Prepared by:
U.S. Department of Transportation Research and Innovative Technology Administration
John A. Volpe National Transportation Systems Center

Acknowledgements: The U.S. Department of Transportation John A. Volpe National Transportation Systems Center (Volpe Center), in Cambridge, Massachusetts, prepared this report for the Federal Highway Administration’s (FHWA) Office of Planning, Environment, and Realty. William Lyons, of the Transportation Planning Division, manages the best practices in transportation planning project for FHWA, which includes this study. Melissa Laube of the Transportation Planning Division and Lydia Rainville of the Economic Analysis Division conducted the research and authored the report.

CONTENTS EXECUTIVE SUMMARY .................................................................. i
Key Findings ..............................................................................................................................ii
I. INTRODUCTION ....................................................................... 1 Regulatory Basis ...................................................................................................................... 1 Purpose .................................................................................................................................... 2 Research Approach .................................................................................................................. 2 Report Structure ...................................................................................................................... 3
II. FINDINGS and RECOMMENDATIONS .................................... 4 Nationwide Scan ...................................................................................................................... 4 Case Study Findings ................................................................................................................. 5 Recommendations................................................................................................................... 8
III. Nationwide Scan .................................................................. 10
IV. Metropolitan Area Case Studies ........................................ 22 Colorado Springs – Pikes Peak Area Council of Governments.............................................. 23 http://ppacg.org/ .................................................................................................................. 27 Los Angeles – Southern California Association of Governments .......................................... 28 Portland, OR - Metro ............................................................................................................. 34 Case Study: San Francisco Metropolitan Transportation Commission ................................ 44
V. Statewide Long Range Planning Case Studies ................. 53 Case Study: State of Colorado .............................................................................................. 54 Case Study: State of Georgia................................................................................................. 60 Case Study: State of Kansas .................................................................................................. 66 Case Study: State of Oregon ................................................................................................. 74
VI. Summary of Lessons Learned Error! Bookmark not defined.

EXECUTIVE SUMMARY
The joint planning regulations implementing the Safe, Accountable, Flexible, Efficient Transportation Act: A Legacy for Users (SAFETEA-LU) require long-range metropolitan area transportation plans that are financially realistic, balancing capital and operating costs with reasonable revenue expectations, as agreed upon by Metropolitan Planning Organizations (MPOs) and their modal transportation agency partners in the planning process (23 CFR 450.322). The regulations governing long-range statewide plans include a description of statewide financial planning components paralleling the metropolitan area planning requirements, while allowing State Departments of Transportation (State DOTs) to decide whether their individual long-range statewide plans will include financial plans. This report presents and synthesizes the findings from eight case studies that examine best practices in financial planning applied in the long-range transportation planning process conducted for metropolitan area and statewide transportation systems. The case studies document experience and lessons that can advance understanding of the elements of financial planning most important to developing high-quality long range transportation plans. Financial planning for transportation systems presents major challenges, particularly in the context of a long-range time horizon. Multimodal regional transportation networks are vast in scale
and complexity. The data required for rigorous, quantitative financial analysis and forecasting can be voluminous and require coordination from a multiplicity of sources. Moreover, a wide array of factors can result in changes over time in both costs and available funding. Uncertainty thus poses a much greater challenge in the development of long-range plans than for the programs with a shorter time horizon, such as metropolitan area Transportation Improvement Programs (TIPs) and State Transportation Improvement Programs (STIPs). Long range uncertainty may affect the viability of short range financial plans, however, and quality financial planning for major investments timed to occur in the near future should reflect careful evaluation of long range financial conditions and potential future risks, as well as collaboration on technical assumptions. Thus, long range financial planning has potentially critical implications for TIPS and STIPS. Specifically, the plans should help guide investment decisions in the STIP and TIP. The first phase of this study consisted of a nationwide scan of long-range financial planning among metropolitan area transportation agencies and States throughout the nation, consisting of the review of 26 Metropolitan Transportation Plans (MTPs) and 21 long-range statewide transportation plans (statewide plans). Considering a range of criteria, such as rigor and transparency of technical methods, the research team identified eight examples of notably effective

ii
practice among metropolitan areas and six examples were identified at the State level. This list was narrowed to four metropolitan areas and four states that provide a good geographic cross-section. One relatively small metropolitan area and one largely rural State were included in this sample, illustrating how the principles of sound financial planning can be applied in areas with limited planning resources. The case studies are: Colorado Springs; Los Angeles; Portland, Oregon; San Francisco; Colorado; Georgia; Kansas; and Oregon. Two of the metropolitan areas included among the case studies are located in states for which case studies also were conducted, providing the opportunity to draw connections that may exist between metropolitan area and statewide planning. Key Findings The best plans for both metropolitan areas and States meet all the primary criteria based on the role of financial constraint in transportation planning. The criteria for identifying best practice reflected the purposes and principles of good financial planning for transportation systems as embodied in SAFETEA-LU, but more broadly, as demonstrated by MPOs and States in addressing the reality of limited resources as a central factor in planning. The most basic criterion for judging effective practice was the rigor and clarity of technical methods. To provide credible information that will be of value in the planning process, financial analysis must be thorough and comprehensible, including all categories of systems costs, reasonably expected to be available revenues, forecasting methods, and supporting assumptions. In the absence of sound technical methods, the other criteria considered, such as ability to consider emerging funding issues or inclusion of
system operating and maintenance (O & M) costs, have little meaning. Upon review, eight of the twenty-six MTPs considered in the scan incorporated financial planning that was strong enough to be considered effective practice. The quality of financial planning in the statewide plans typically was lower than that for the metropolitan area plans. This disparity may reflect the absence of a specific regulatory requirement for the statewide plans to include a financial component. The scan did identify a number of quality financial plans at the State level, however, comparable in content to the financial component of the MTPs. The statewide plans tend to have a stronger emphasis on “needs” analysis for the roadway network than do the metropolitan area plans, probably because the State DOTs, who have primary responsibility for State highways, prepare the statewide plans, whereas MPOs have lead responsibility for MTPs. Only a small percentage of the States, however, have taken the further step of translating “needs” into cost estimates for their statewide plans. Following is a summary of findings from the individual case studies:
• Several of the case studies reveal the characteristics of technically sound financial planning/fiscal constraint. Case studies for Portland, Los Angeles, and San Francisco provide examples of technically rigorous, transparent analysis that can help to guide other metropolitan areas in developing sound technical methods. At the State level, Georgia’s technical approach is notably strong, although all eight case studies provide examples of high-quality technical analysis. Key qualities of these approaches include: documentation

iii
and justification of costs for all categories of O & M and planned system improvements, by mode; analysis that reflects clear, detailed identification of individual revenue sources for all modes; careful consideration of historical patterns of growth for all revenue sources and specific justification for projected increases in funding that exceed trends; and transparency.
• Transparency in financial planning is a critical attribute, not only to demonstrate that the financial analysis is valid and makes sense, but also to encourage public involvement, because the technical analysis must provide a comprehensible basis for assessing the impacts and trade-offs of different investment decisions.
• Among the metropolitan areas,
Portland provides an example of effective public participation in the process of financial planning, as do Kansas and to some degree, Georgia, at the State level. Collectively, these three case studies show how financial planning/fiscal constraint can provide a framework for engaging the public in developing budgetary priorities and assessing investment trade-offs.
• Virtually all the case studies address questions of risk, some more directly and analytically than others. Most commonly, risk is addressed by the analysis of scenarios that involve different levels or rates of growth in funding, but the San Francisco case study demonstrates application of a probabilistic risk model relating costs, scopes and schedules to estimate a risk contingency for potential cost overruns.
• Colorado is unique among the states reviewed in the degree of
coordination among the U.S. DOT, regions, and local governments that occurs in developing financial forecasts with official standing. As a result, the authority and consistency of financial plans developed both at the State and metropolitan area levels are exceptional.
• The case studies include an example of a relatively small metropolitan area—Colorado Springs—and a low population state—Kansas—that have successfully addressed the challenges of financial planning with more limited staff resources than are available to the nation’s larger metropolitan areas and states.
• Only one case study—Oregon—
provides an example of the application of financial performance measures, and this application is limited in that it is a broad, qualitative measure of whether or not financial conditions improve over time. Implementation of the strategic element incorporated in Portland’s MTP is to be guided, however, by specific proposed performance measures.
Recommendations The above findings provide the basis for recommendations that can help the U.S. Department of Transportation (U.S. DOT) to support effective financial planning by metropolitan areas and States and provide a technical resource for State DOTs and MPOs. These recommendations include: • Incorporate lessons learned from the
case studies in technical training and guidance materials;
• Develop alternative templates illustrating the components of sound technical cost and revenue analysis for all modes;

iv
• Continue research into effective and efficient approaches for coordination of financial planning among State, regional, and local governments that is compatible with planning resource constraints for jurisdictions varying in size. Support cross-agency collaboration.
• Continue to research the benefits of quantitative models for cost, revenue, and risk analysis.
• Research the effective application of performance measurement in financial
planning. Develop examples demonstrating practical approaches and resulting benefits in the planning process.
• Support public involvement in financial planning, budgeting, development of investment priorities, and resource allocation.
• Consider stronger support or incentives for long-range financial planning at the State level.

I. INTRODUCTION
Financial planning plays a crucial role in the transportation planning process, including development of “big picture” long range transportation system plans. Recognizing budget constraints injects vital realism into the practice of transportation planning, driving the difficult further tasks of setting priorities and taking actions to either adjust plans to lower costs or, alternatively, to increase financial resources. The ultimate result can be to invigorate the planning process, both increasing its value for guiding investments and motivating public engagement.
Regulatory Basis The intent of this report is to highlight real world examples illustrating the practical application of financial planning to produce high quality long range transportation plans. Provisions of the current Federal transportation law, the Safe, Accountable, Flexible, Efficient Transportation Equity Act: A Legacy for Users (SAFETEA-LU) identify key attributes of financial planning for metropolitan area and State transportation systems, helping to define the elements of effective practice. While the focus of this study is not on demonstrating how well agencies meet regulatory requirements, SAFETEA-LU provisions relevant to financial planning are summarized below as a frame of reference that the research team has used in developing best practice selection criteria. The joint planning regulations implementing SAFETEA-LU require long-range metropolitan transportation plans (MTPs)
that are financially realistic, balancing capital and operating costs with reasonable revenue expectations, as agreed upon by MPOs and their modal transportation agency partners in the planning process (23 CFR 450.322). The regulations governing long-range statewide plans include a description of statewide financial planning components paralleling the metropolitan area planning requirements, while allowing State Departments of Transportation (State DOTs) to decide whether their individual long-range statewide plans will include financial plans. Major regulatory provisions for metropolitan area and statewide long-range planning include: Metropolitan Areas: The MTP “shall include a financial plan that demonstrates how the adopted transportation plan can be implemented.” Requirements include: estimates of costs and revenue sources “that are reasonably expected to be available to adequately operate and maintain Federal-aid highways (as defined by 23 U.S.C. 101(a)(5)) and public transportation (as defined by title 49 U.S.C. Chapter 53)”; estimates of available funds from all necessary financial resources; recommendations for additional strategies to support the availability of any new sources; all projects and strategies proposed for funding under title 23 U.S.C., title 49 U.S.C. Chapter 53 or with other

2
Federal funds; State assistance; local sources and private participation; use of “year of expenditure dollars” for estimating revenue and costs in future years; specific financial strategies required to ensure the implementation of Transportation Control Measures in air quality nonattainment and maintenance areas, and “for illustrative purposes, the financial plan may (but is not required to) include additional projects that would be included in the adopted transportation plan if additional resources beyond those identified in the financial plan were to become available.” 1 Statewide: “The long-range statewide transportation plan may (but is not required to) include a financial plan that demonstrates how the adopted long-range statewide transportation plan can be implemented,” identifying public and private sources that are reasonably expected to be made available to carry out the plan, additional strategies for funding needed improvements, and “for illustrative purposes, the financial plan may (but is not required to) include additional projects that would be included in the adopted long-range statewide transportation plan if additional resources beyond those identified in the financial plan were to become available.” Purpose This report presents and synthesizes the findings from eight case studies that examine best practices in financial planning applied in the long-range transportation planning process conducted for metropolitan area and statewide transportation systems. The case studies document experience and lessons that may be useful to other metropolitan
1 Starting December 11, 2007
areas and states in responding to SAFETEA-LU regulations and most importantly, advancing understanding of the elements of financial planning that are most important to developing high-quality long range transportation plans. Financial planning for transportation systems presents major challenges, particularly in the context of a long-range time horizon. Multimodal regional transportation networks are vast in scale and complexity. The data required for rigorous, quantitative analysis and forecasting can be voluminous and require coordination from a multiplicity of sources. Moreover, a wide array of factors can result in changes over time in both costs and available funding. Contingencies and the effects of risk factors, such as inflation, advances in technology, demographic shifts, and policy changes increase with the duration of the planning time horizon. Uncertainty thus poses a much greater challenge in the development of long-range plans than for the programs of short-range improvements—metropolitan area Transportation Improvement Programs (TIPs) and State Transportation Improvement Programs (STIPs). Research Approach The first phase of this study consisted of a nationwide scan of long-range financial planning among metropolitan area transportation agencies and States throughout the nation, involving the review of 26 MTPs and 21 long-range statewide transportation plans (statewide plans). The research team used a range of criteria to identify best practices: rigor and transparency of technical methods; multimodal scope; consideration of funding issues, including risk and uncertainty; inclusion of operating and maintenance (O & M) costs; consideration

3
of innovative financing mechanisms; and use of financial performance measures. Considering all the criteria, the nationwide scan identified eight examples of notably effective practice among metropolitan areas and six examples were identified at the State level. The research team narrowed this list to four metropolitan areas and four states that provide a good geographic cross-section, with one relatively small metropolitan area, as well as one largely rural state, providing diversity among the examples chosen. The case studies are: Colorado Springs; Los Angeles; Portland, Oregon; San Francisco; Colorado; Georgia; Kansas; and Oregon. Two of the metropolitan areas included among the case studies are located in states for which case studies were conducted, providing the opportunity to draw connections that may exist between metropolitan and statewide planning. Report Structure Chapter 2 identifies the report’s principal findings and recommendations. Chapter 3 provides a summary of the nationwide scan of long-range financial planning practices by metropolitan areas and States. The individual case studies for metropolitan areas and States are the subjects of Chapter 4 and Chapter 5, respectively.

4
II. FINDINGS and RECOMMENDATIONS
Fiscal constraint in long-range transportation planning is intended to ensure that plans are based on a reasonable expectation of sufficient revenues to support the costs of maintaining the existing metropolitan area transportation system and any planned expansion of the system over at least a 20-year time frame. Maintaining the existing system requires the commitment of sufficient funds for re-capitalization and meeting expenses for continuing operations and maintenance. Financial planning must be based on credible assumptions regarding expenses, funding, and such factors as inflation and the timing of planned investments. Moreover, as indicated in the SAFETEA-LU regulations, long-range plans can provide the basis for developing investment priorities and evaluating strategies for securing additional funds, in the case of plans for which projected budget constraints limit investment below the level required to address identified transportation system needs and goals. Key findings from the case studies are discussed below, in terms of both the status of financial planning throughout the country and specific examples of best practice. Nationwide Scan The best plans for both metropolitan areas and States meet all the primary criteria for effective practice, such as multimodal scope, inclusion of costs for system O & M, and consideration of funding issues. The
most basic criterion for judging effective practice was the rigor and clarity of technical methods. To provide credible information that will be of value in the planning process, financial analysis must be thorough and comprehensible, including all categories of systems costs, reasonably expected to be available revenues, forecasting methods, and supporting assumptions. In the absence of sound technical methods, other characteristics, such as the ability to consider emerging funding issues or consideration of systems O & M costs, have little meaning. The nationwide scan showed the technical quality of metropolitan area financial planning to be highly variable. Upon review, eight of the twenty-six MTPs considered in the scan incorporated financial planning that was strong enough to be considered effective practice. The quality of financial planning in the statewide plans typically was lower than that for the metropolitan plans. This disparity may reflect the absence of a specific regulatory requirement for the statewide plans to include financial plans. The scan did identify a number of quality financial plans at the State level, however, comparable in content to the financial component of the MTPs. One of the statewide plans even addressed financial performance measures specifically, as did only one MTP—for a metropolitan area within the same state. The statewide plans tend to have a stronger emphasis on “needs” analysis for the roadway network than do the
5
metropolitan area plans, probably because the State DOTs, which have primary responsibility for State highways, prepare the statewide plans, whereas MPOs have lead responsibility for MTPs. Only a small percentage of the States, however, have taken the further step of translating “needs” into cost estimates for their statewide plans. Most of the statewide plans that include a financial planning component have a greater policy emphasis than the MTPs, in terms of focusing on the impacts of projected revenue shortfalls and potential responses. These plans, like some of the MTPS, serve as strategic documents intended specifically to guide Statewide funding and investment policies. Fiscal constraint is thus central to their purpose. Case Study Findings Findings from the individual case studies are summarized below. Technical Approach Several of the case studies reveal the characteristics of technically sound financial planning/fiscal constraint. The regulations allow individual metropolitan areas—and particularly the States—discretion in interpreting the requirements for financial planning. Case studies for Portland, Los Angeles, and San Francisco provide examples of technically rigorous, transparent analysis that can help to guide other metropolitan areas in developing sound technical methods. At the State level, Georgia’s technical approach is notably strong, although all eight case studies provide examples of sound technical methods. Key qualities of sound technical financial planning approaches include: documentation and justification of
costs for all categories of O & M and
planned system improvements, by mode;
analysis that reflects clear, detailed identification of individual revenue sources for all modes;
careful consideration of historical patterns of growth for all revenue sources and specific justification for projected increases in funding that exceed trends; and transparency.
Transparency Transparency in financial planning is a critical attribute, not only to demonstrate that the financial analysis is valid and makes sense, but also to encourage public involvement, because the technical analysis must provide a comprehensible basis for assessing the impacts and trade-offs of different investment decisions. All of the case studies demonstrate a high level of transparency, describing the individual components of cost, revenue, and needs analysis, sources of information, applicable formulas and rules governing revenue sources, revenue growth rate assumptions and their basis, historical patterns of revenue growth, financing (e.g., bonding) mechanisms and all other factors incorporated in the financial analysis. Public Participation in Financial Planning Among the metropolitan areas, Colorado Springs provides an example of effective public participation in the process of financial planning, as do Kansas and to some degree, Georgia, at the State level. Collectively, these three case studies show how financial planning/fiscal constraint can provide a framework for engaging the public in developing budgetary priorities and assessing investment trade-offs. Colorado Springs represents an example of strong, multifaceted public participation integrated throughout the long-range

6
planning process, including the selection of a financially constrained alternative. In preparing the Kansas Long-Range Transportation Plan 2008, the Kansas DOT conducted a year-long “dialogue” or public involvement effort largely devoted—directly or indirectly—to financial issues. Participants in this extended process included government officials; both elected and professional staff; economic development interests and private businesses; transportation planners; and transportation service providers. A Funding and Finance Topical Working Group led the review of existing and potential strategies to address unmet funding needs. Over 40 stakeholder meetings were held throughout the State, complementing the efforts of working groups, and more than 400 stakeholders attended public meetings conducted to review the recommendations emerging through the long-range planning process. The long-range planning process in Georgia pioneered the use of two techniques to assess public opinion:
• the use of comment forms distributed at two public meetings to determine funding priorities of participants, and
• break-out exercises conducted at community workshops, in which participants assigned rankings to funding allocations by mode and type of need.
Risk Assessment Virtually all the case studies address questions of risk, some more directly and analytically than others. Most commonly, risk is addressed by the analysis of scenarios that involve different levels or rates of revenue growth or the availability of new funding sources. The San Francisco case study demonstrates application of a probabilistic risk model for expenditures,
relating costs, scopes and schedules to a monetary valuation of risk. The San Francisco MPO, the Metropolitan Transportation Commission, performs an assessment to identify and quantify high risks for the program of projects included in the MTP and to determine the appropriate level of funding reserves. The model uses a Monte Carlo simulation to calculate a “risk score.” On the funding side, some of the MTPs and statewide plans use scenario analysis of varying complexity to address questions relating to funding shortfalls, including the issue of possible changes in factors such as inflation, motor fuel prices, and revenue allocation policies that are major sources of risk in forecasting future revenues. Portland’s MTP and Oregon’s statewide plans both exemplify this approach.
MTC has designated a category of “unspecified” funding “to strike a balance between the past practice,” which may be overly conservative, “of only including specific revenue sources currently in existence or statutorily authorized, and the more flexible Federal requirement of revenues that are reasonably expected to be available.” Estimates of “unspecified” funding are based on a review of past revenue forecasts in long-range plans compared to actual revenue levels over a 15-year period. Colorado Spring’s MTP incorporates detailed discussion of the sensitivity of financial forecasts to particular factors such as demographic change, motor fuel prices, and fuel economy. Generally, the examples of best practice reflect conservative estimates of long-range revenues. Effects of Financial Constraint All of the long range plans use scenarios to portray the differences in transportation outcomes resulting from conservative projections of future funding versus higher

7
levels of spending. In some cases, like Georgia and Kansas, the analysis consists of two scenarios, one in which expenditures are constrained to levels of reasonably expected revenues—or even more conservative growth assumptions—and a scenario that reflects additional growth in spending. Other metropolitan areas and States analyze three or more potential scenarios, one of which represents some increase in funding beyond a severely constrained level that allows for some adjustment for inflation or growth at historic levels, and a “vision” scenario corresponding to the needs and plans identified through the metropolitan area and statewide planning processes. This was the approach of all the metropolitan area planning processes and, at the State level, Colorado and Oregon. Most of the best practice examples include an assessment of potential policies and strategies to address projected funding shortfalls, including an analysis of individual existing and new revenue sources to identify risks as well as the potential for increasing revenues. While Colorado Springs is a relatively small Transportation Management Area (TMA), the MTP prepared by the region’s MPO, Pikes Peak Area Council of Governments, considered six scenarios to test different investment priorities, such as concentrating on transit and ITS to reduce environmental impacts versus regionally significant roadway projects.2 Among the States, Oregon uses the analysis of multiple scenarios to test different funding levels, policy choices, and contingencies, in terms of their impact on the State’s capacity to meet identified system investment needs.
2 A Transportation Management Area is an urbanized area (as defined by the U.S. Bureau of the Census) with a population of 200,000 or more or as designated by the U.S. Secretary of Transportation (23 U.S.C. Sec.134).
Use of Performance Measures Oregon has taken initial steps to develop a long-range planning performance measure based on financial factors. Financial feasibility is considered as a performance criterion in evaluating the impacts of alternative policy scenarios. The performance measure is simply whether the scenarios improve, worsen, or cause no change in the State’s financial condition. The financial component of Portland’s MTP includes a strategic element intended to stabilize transportation funding in the region, guided by proposed performance measures. Specific performance measures generally have not been used thus far in the financial planning processes of other metropolitan areas and States reviewed in this study. Intergovernmental Coordination Colorado is unique among the states reviewed in the degree of coordination among the State DOT, regions, and local governments in developing financial forecasts with official standing. As a result, the authority and consistency of financial plans developed both at the State and metropolitan area levels are exceptional. The Colorado DOT leads the financial planning effort through a process established under official policies, at the direction of a Transportation Commission accountable to the Governor and the State legislature. The process coordinates development of the financial plan with the State’s Regional Planning Commissions and MPOs, resulting in a consistent set of forecasts for all agencies that is subject to a single set of control totals. Moreover, the financial element in the statewide transportation plan is coordinated with the STIP, which is checked on an annual basis and updated as necessary to reflect actual financial conditions.

8
Adapting Financial Planning to Available Planning Resources The case studies include an example of a relatively small metropolitan area—Colorado Springs—and a low population state—Kansas—that have successfully addressed the challenges of financial planning with more limited staff resources than are available to planning agencies serving major cities and more populous states. These examples demonstrate that metropolitan areas and States of all sizes have the capability to adapt the principles of financial planning to their individual circumstances. Moreover, Kansas’ straightforward technical approach, reflected in a clear focus on future financial “needs” versus reasonably expected funding and serious consideration of options for addressing funding shortfalls, shows that quality is not synonymous with complexity. The essential lesson is that metropolitan areas and States can produce sound, effective long-range financial plans tailored to their individual needs and with a level of effort commensurate with available technical resources.
Recommendations The above findings provide the basis for recommendations that can help the U.S. Department of Transportation (U.S. DOT) to support effective financial planning by metropolitan areas and States. These recommendations include: • Incorporate lessons learned from the
case studies in technical training and guidance materials. Most helpful would be specific examples demonstrating how the practices described responded to financial planning challenges. Examples include intergovernmental coordination,
revenue forecasting, transparency, and scenario analysis.
• Develop alternative templates illustrating the components of sound technical cost and revenue analysis for all modes: show categorization of capital and O & M costs, revenue sources, growth rates, financing, allocation of funding to cost, categories, and forecasting methods.
• Continue research into effective and
efficient approaches for coordination of financial planning among State, regional, and local governments. The Colorado example can illustrate the concept, which could be adapted in different forms to the institutional structures of individual States. Support cross-agency collaboration.
• Continue to research the benefits of quantitative models for cost estimation, revenue forecasting, and risk analysis. Several individual metropolitan areas and States have started to develop analytical tools for financial planning, including risk analysis. The U.S. DOT can support these efforts and sponsor the development of technical tools that can be applied or adapted by MPOs and State DOTs.
• Research the effective application of
performance measurement in financial planning. Develop examples demonstrating practical approaches and resulting benefits in the planning process.
• Support public involvement in financial
planning, budgeting, development of investment priorities, and resource allocation.
• Consider stronger support or incentives
for effective long-range financial planning at the State level. The case studies demonstrate how sound

9
financial planning can enhance the value of the planning process. The scope and level of effort devoted to financial planning can be tailored to meet technical resource constraints of planning agencies.
• Develop technical assistance and
policy guidance on addressing projected transportation system budget
deficits. This is a problem identified in all the case studies.

10
III. Nationwide Scan
The first phase of this study consisted of a nationwide scan of 26 MTPs and 21 long-range statewide transportation plans, chosen to provide wide representation of current practice across regions and to identify the specific approaches MPOs and States apply to develop sound long-range financial plans. The scan provided the basis for distinguishing examples of effective practice. As the products of financial planning, the MTPs and statewide plans are the best indicators of sound financial planning processes, for two reasons: the process of financial analysis is largely technical and also, transparent documentation of financial information is essential as a basis for public consideration of financial trade-offs as part of the larger transportation planning process. The role of public involvement in financial planning is one of the issues that the research team explored further as part of the detailed case studies. The wide-ranging scan started with a review of a number of earlier studies and other sources of information on financial planning/fiscal constraint practices of MPOs and states:
• Analysis of State Long-Range Transportation Plans, prepared by the Volpe Center for FHWA and FTA, December 2005 and updated with a companion database in 2011.
• Evaluation of Statewide Long-Range Transportation Plans, prepared by the Volpe Center for FHWA, April 2002.
• Domestic Scan Tour: Financial Planning and Fiscal Constraint, U.S. DOT/Volpe Center, FHWA Office of Planning, Fall 2002.
• Let’s Talk Planning: Fiscal Constraint Issues videoconference presentations and materials, FHWA and FTA, 10/15/2007.
• Overview of Current Practices in Revenue Forecasting and Cost Estimation for Transportation Plans and Programs, September 2004, FHWA Office of Planning.
• Fiscal Constraint: What You Need to Know about Revenues, Costs, and O & M, August 18, 2009, FHWA Resource Center Planning Team.
These sources identified aspects of financial planning/fiscal constraint at the metropolitan area or State levels that were considered noteworthy in some respect at specific time periods when the sources were generated, mostly within the last five years. Volpe followed up on the examples included in these sources to assess their value as candidate examples of best practice to be analyzed in detail in the current study. While these sources served as the starting point for the scan, the Volpe Center expanded the search to encompass a wider range of metropolitan areas and states, taking into account the rapid evolution of the state of the practice, as metropolitan
11
areas and states – often motivated by the impetus of Federal regulations – strive to enhance their capabilities to take full advantage of the benefits of effective financial planning. Criteria The most basic criterion guiding the team’s assessment of financial planning/fiscal constraint was the rigor and clarity of technical methods. A set of additional criteria relating to specific characteristics of the metropolitan area and statewide planning process (e.g., multi-modal scope, inclusion of operations and maintenance costs), as captured in Federal regulations, also was considered. This list was refined as work on the scan proceeded and additional characteristics of effective practice were noted. Following is the revised set of criteria used to assess examples of financial planning/fiscal constraint included in the scan:
• Thorough and comprehensible analysis of all categories of systems costs, reasonably expected to be available revenues, forecasting methods and supporting assumptions;
• Multimodal and regional approach to financial planning, incorporating the financial plans developed by modal authorities;
• Ability to plan for all regionally significant projects, regardless of mode and funding source;
• Ability to consider emerging funding issues, including uncertainty during out-years of the MTP or statewide plan and assessment of alternative priorities and investment scenarios; potential options for securing alternative funds; this analysis requires a foundation in the forecasting of future funding needs and revenues;
• Approach to operations, maintenance, and management costs as well as capital costs;
• Application of innovative financing techniques such as Advance Construction (AC), public private partnerships, toll roads, and congestion pricing; assessment of discretionary funding sources; and
• Generation of costs and revenues for use in performance measures, including analysis of trade-offs among alternative strategies and investments.
The scan of financial planning/fiscal constraint in long-range metropolitan transportation plans is summarized in Table III-1 below, which identifies different approaches to long-range financial planning and strengths and weaknesses of the plans reviewed.

12
Table III-1 Scan of Long-Range Metropolitan Transportation Plans MPO Notes Plan and URL Denver Regional Council of Governments (DRCOG)
Section on fiscally constrained 2035 regional transportation plan, only presents the portions of the plan that could be accomplished with funds reasonably expected to be available. Then compares fiscally constrained and Metro Vision scenarios. Includes management, operation, and capital projects . Visualization: Good maps of fiscally constrained roadway system improvements and good bar chart and table of the metro vision system cost v. the fiscally constrained cost.
2035 Metro Vision Regional Transportation Plan
http://www.drcog.org/documents/2035%20MVRTP_revisedMarch09_Ch5.pdf
Providence, Rhode Island – Rhode Island Statewide Planning Program
Plan reflects the current funding level or “sink” scenario outlined in the Needs Assessment. Other scenarios are tread water, swim, win the race. Needs and revenues provided for each scenario. Limited visualization. Includes discussion on innovative financing techniques such as GARVEE Bonds and advanced construction and also has a chart on GARVEE debt service through 2026. Shows projections for all years in a table, broken down by project category and mode. Makes recommendations for RI financial strategy, has a chart of goals, objectives, policies, and performance measures for a number of areas, including finance.
Transportation 2030 http://www.planning.ri.gov/transportation/trans2030.pdf
San Francisco Bay Area, Metropolitan Transportation Commission (Bay Area)
Very clear breakdown of projections for each funding source, lists all assumptions clearly. Conducted a risk assessment to identify and quantify high risks for the program of projects and determine reserve funding—resulted in addition of risk contingency. Ties investments to “core concerns” like climate-friendly investments, focused growth, and equity and access. Section following “finances” is called “investments” and focuses on the key funding decisions. Visualization for funding shortfalls. Consistent vision with themes well incorporated.
Transportation 2035: Change in Motion
http://www.mtc.ca.gov/planning/2035_plan/DRAFT/3-Finances.pdf
Colorado Springs Pikes Peak Area Council of Governments
Clear explanation of a methodology (including forecasts of out years. Informative graphics that explain inflation/buying power. Sensitivity analysis of various revenue-generating strategies that also includes baseline, minimum growth,
Moving Forward: 2035 Regional Transportation Plan
http://ppacg.org/transportation/regional-transportation-plan/2035-moving-forward-update
13
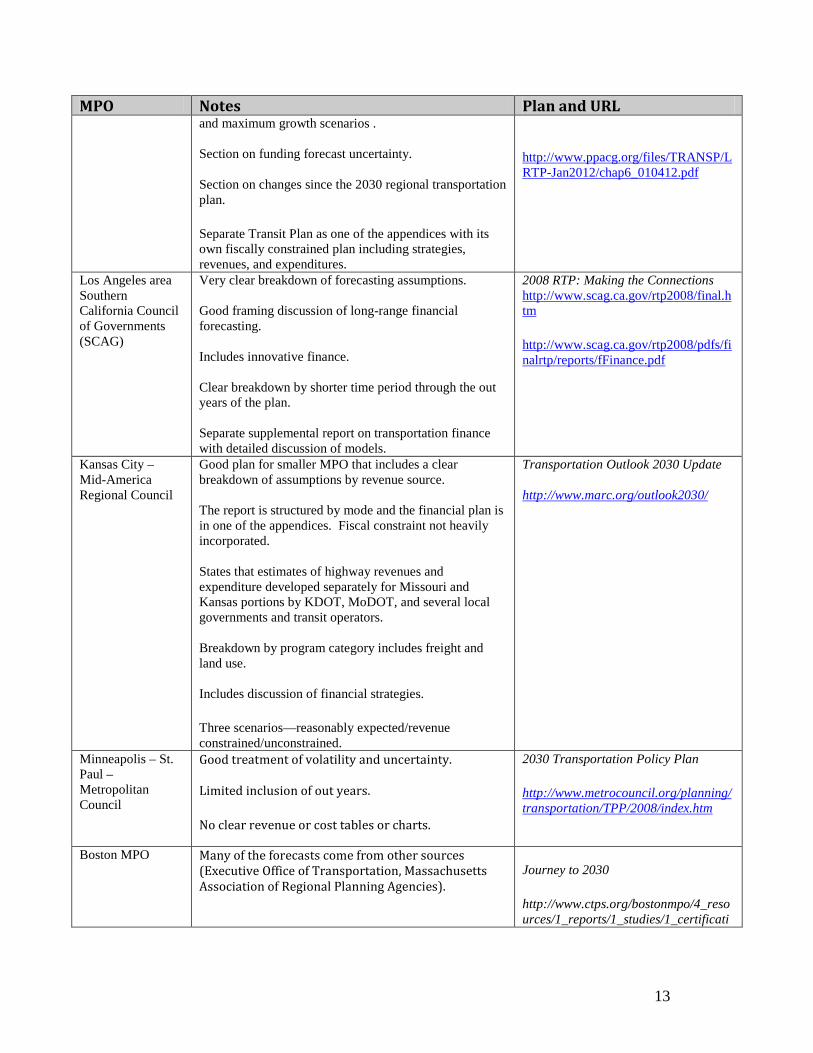
MPO Notes Plan and URL and maximum growth scenarios . Section on funding forecast uncertainty. Section on changes since the 2030 regional transportation plan.
Separate Transit Plan as one of the appendices with its own fiscally constrained plan including strategies, revenues, and expenditures.
http://www.ppacg.org/files/TRANSP/LRTP-Jan2012/chap6_010412.pdf
Los Angeles area Southern California Council of Governments (SCAG)
Very clear breakdown of forecasting assumptions. Good framing discussion of long-range financial forecasting. Includes innovative finance. Clear breakdown by shorter time period through the out years of the plan. Separate supplemental report on transportation finance with detailed discussion of models.
2008 RTP: Making the Connections http://www.scag.ca.gov/rtp2008/final.htm
http://www.scag.ca.gov/rtp2008/pdfs/finalrtp/reports/fFinance.pdf
Kansas City – Mid-America Regional Council
Good plan for smaller MPO that includes a clear breakdown of assumptions by revenue source. The report is structured by mode and the financial plan is in one of the appendices. Fiscal constraint not heavily incorporated. States that estimates of highway revenues and expenditure developed separately for Missouri and Kansas portions by KDOT, MoDOT, and several local governments and transit operators. Breakdown by program category includes freight and land use. Includes discussion of financial strategies.
Three scenarios—reasonably expected/revenue constrained/unconstrained.
Transportation Outlook 2030 Update http://www.marc.org/outlook2030/
Minneapolis – St. Paul – Metropolitan Council
Good treatment of volatility and uncertainty. Limited inclusion of out years.
No clear revenue or cost tables or charts.
2030 Transportation Policy Plan
http://www.metrocouncil.org/planning/transportation/TPP/2008/index.htm
Boston MPO
Many of the forecasts come from other sources (Executive Office of Transportation, Massachusetts Association of Regional Planning Agencies).
Journey to 2030
http://www.ctps.org/bostonmpo/4_resources/1_reports/1_studies/1_certificati

14
MPO Notes Plan and URL on/journey_2030/plan_2030.html
http://www.ctps.org/bostonmpo/4_resources/1_reports/1_studies/1_certification/journey_2030/2030Tranplan_ch12.pdf
Houston-Galveston Area Council
Less focus on out years than other plans. Well prepared GIS map of long-range transportation plan.
Bridging Our Communities 2035: The 2035 Houston-Galveston Regional Transportation Plan
http://www.h-gac.com/taq/plan/documents/2035_update/2035%20RTP%20Update%20FINAL%202011-01-21.pdff
Portland- Metro
Detailed discussion of assumptions and methodology, clear breakdown of funding sources and good charts of cost and revenue comparison and good visualization of costs and revenues. The revenue section provides good context (i.e., Oregon auto taxes compared with neighboring states). One of the goals of the plan is fiscal stewardship, and objectives and actions are outlined underneath. Financial analysis details are included in a separate document.
2035 Regional Transportation Plan
http://www.oregonmetro.gov/index.cfm/go/by.web/id=25038#files
Puget Sound Regional Council
Includes a specific discussions on financial principles, strategies, variable roadway pricing. Views the plan as articulating the long-range needs, so includes more than one financing scenario—system expansion, basic needs, and strategic investment. Mentions innovative financing techniques as something to be examined for potential use in addressing the financial shortfall. Very detailed, multimodal investments section with a number of GIS maps displaying plan visually Heavy reliance on Blue Ribbon Commission from 1998.
Destination 2030
http://www.psrc.org/assets/3133/d2030_2001plan.pdf
Albany, NY – Capital District Transportation Committee
Layout of sections affects clarity. Shows differences between 2025 and 2030 plan in a table at the beginning. Very well done chart of long-term funding that shows projections v. historical trends. Extensive discussion of pavement conditions. Unconstrained projects discussed in separate documents.
New Vision 2030 Finance Plan
http://www.cdtcmpo.org/rtp2030/materials/fp-doc.pdf
Naples, FL – Very thorough breakdown of funding sources and overall Naples, FL – Collier County MPO

15
MPO Notes Plan and URL Collier County MPO
a very clear, well-structured discussion. Maps of the financially feasible plan. Includes an interim 2015 financially feasible plan . Brief discussion of innovative finance.
2030 Long Range Transportation Plan https://www.communicationsmgr.com/projects/Collier_MPO_Admin/docs/2007LRTPUpdate.pdf
Collier and Lee County MPOs
Joint regional transportation plan between Collier and Lee Counties. 2030 needs derived from each MPO’s individual long-range transportation plans, and were approved jointly by both MPOs. Joint Regional Transportation Plan identifies highway needs, transit connections, etc.
Joint Regional Plan Collier-Lee Counties http://mpo-swfl.org/CollierLeeMPO.shtml
Fort Myers, Bonita Springs, FL - Lee County MPO
State and Federal funds estimates from FDOT. Less explanation than Collier County about the details of local revenue sources, but more information about the revenue projection process. Broken down into sections by mode – highways, ITS, bicycle and pedestrian, transit, – with a financially feasible plan at the end of each section (mostly tables of projects).
Transit element is basically its own report within the report, financially feasible plan in Chapter 10 of the transit element file. Good financial plan/methodology explanation/map of fiscally constrained transit plan.
2030 Long Range Transportation Plan [No longer available]
http://www.mpo-swfl.org/content/Plans/2030/Transit_Element.pdf
Atlanta Regional Commission
At the time of review, limited detail about the methodology for forecasting revenues, but very clear methodology for forecasting project costs.
Envision6
http://www.atlantaregional.com/land-use/long-range-planning/envision-6
Metropolitan Washington Council of Governments
Good plan for a fairly small area. Not really much visualization but clear tables that include out years individually. Overview of innovative finance.
Capital Region Financially Constrained Long-Range Transportation Plan http://www.mwcog.org/clrp/
http://www.mwcog.org/clrp/resources/Final_2006_Financial_Analsyis_Rpt.pdf
St. Louis, MO - East-West Gateway Council of Governments
Investment section heavily focused on the TIP instead of out years.
Limited discussion of forecasting process.
Legacy 2035
http://www.ewgateway.org/trans/LongRgPlan/longrgplan.htm
San Diego - SANDAG
Very clear breakdown of funding sources with assumptions laid out clearly. Reasonably expected revenue scenario and revenue
2030 San Diego Regional Transportation Plan: Pathways for the Future

16
MPO Notes Plan and URL constrained scenarios. Includes an unconstrained needs analysis. Actions section that includes actions that support the Plan’s Financial Strategies Chapter recommendations. Includes proposed actions and responsible parties. Appendix A includes projects, costs, and phasing for the scenarios (44 pages).
Technical Appendix on financial background and assumptions.
http://www.sandag.cog.ca.us/index.asp?projectid=292&fuseaction=projects.detail
Orlando - METROPLAN
At the time of review, 2030 plan in development.
Tampa - Hillsborough County MPO
Good plan for a fairly small MPO. Long Range Transportation Plan
http://www.hillsboroughmpo.org/pubmaps/pubmaps_folders/folderlrtp/lrtp_document
Miami-Dade MPO
Breaks projects into 4 categories of priority with the cost feasible plan as Priority I projects. Priority IV unfunded a separate category from Priority IV
Miami-Dade Transportation Plan to the Year 2030 http://www.metro-dade.com/mpo/docs/MPO_lrtp_2030_final_20050107.pdf
While the plans included in the scan were selected with the expectation that financial planning would be of good quality, there are clear differences among the metropolitan areas in terms of technical rigor, transparency, and the other assessment criteria identified earlier. A major observation is that the plans that generally are thorough and based on sound technical methods and assumptions tend also to rate highly in terms of most of the other individual criteria, for example, they are multi-modal in scope and incorporate an effective approach to operating and maintenance costs. Another observation is that risk is addressed by most of the plans and that the most common approach is to consider alternative funding scenarios, i.e., different levels of future funding based on alternative rates of growth or the availability of new funding sources, such as toll roads, and techniques, such as public/private partnerships and Transportation Infrastructure Finance and Innovation Act (TIFIA) financing. Thus, several of the criteria, such as risk assessment and consideration of innovative finance, overlap with one another. One of the plans is distinguished from the others in that it includes a more explicit assessment of the sources of potential risks.
17
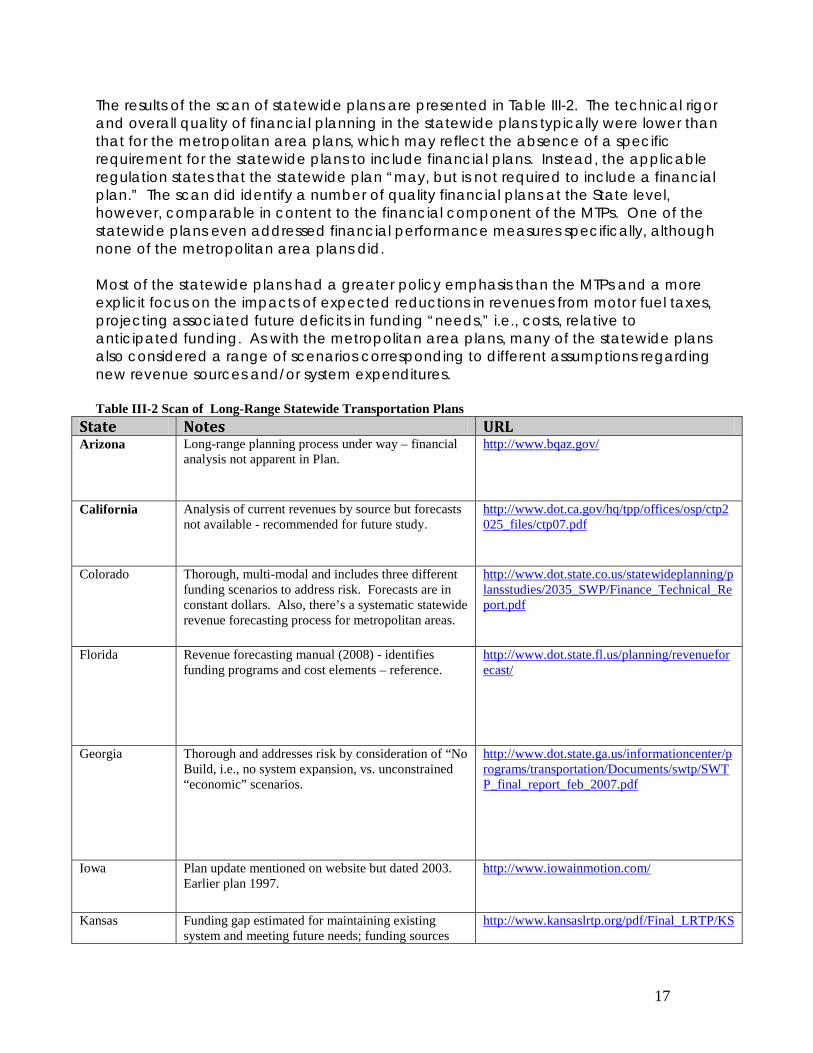
The results of the scan of statewide plans are presented in Table III-2. The technical rigor and overall quality of financial planning in the statewide plans typically were lower than that for the metropolitan area plans, which may reflect the absence of a specific requirement for the statewide plans to include financial plans. Instead, the applicable regulation states that the statewide plan “may, but is not required to include a financial plan.” The scan did identify a number of quality financial plans at the State level, however, comparable in content to the financial component of the MTPs. One of the statewide plans even addressed financial performance measures specifically, although none of the metropolitan area plans did. Most of the statewide plans had a greater policy emphasis than the MTPs and a more explicit focus on the impacts of expected reductions in revenues from motor fuel taxes, projecting associated future deficits in funding “needs,” i.e., costs, relative to anticipated funding. As with the metropolitan area plans, many of the statewide plans also considered a range of scenarios corresponding to different assumptions regarding new revenue sources and/or system expenditures. Table III-2 Scan of Long-Range Statewide Transportation Plans
State Notes URL Arizona Long-range planning process under way – financial
analysis not apparent in Plan.
http://www.bqaz.gov/
California Analysis of current revenues by source but forecasts not available - recommended for future study.
http://www.dot.ca.gov/hq/tpp/offices/osp/ctp2025_files/ctp07.pdf
Colorado Thorough, multi-modal and includes three different
funding scenarios to address risk. Forecasts are in constant dollars. Also, there’s a systematic statewide revenue forecasting process for metropolitan areas.
http://www.dot.state.co.us/statewideplanning/plansstudies/2035_SWP/Finance_Technical_Report.pdf
Florida Revenue forecasting manual (2008) - identifies
funding programs and cost elements – reference. http://www.dot.state.fl.us/planning/revenueforecast/
Georgia Thorough and addresses risk by consideration of “No
Build, i.e., no system expansion, vs. unconstrained “economic” scenarios.
http://www.dot.state.ga.us/informationcenter/programs/transportation/Documents/swtp/SWTP_final_report_feb_2007.pdf
Iowa Plan update mentioned on website but dated 2003.
Earlier plan 1997. http://www.iowainmotion.com/
Kansas Funding gap estimated for maintaining existing
system and meeting future needs; funding sources http://www.kansaslrtp.org/pdf/Final_LRTP/KS

18
State Notes URL documented; impacts of inflation and eventual decline in gas tax assessed; alternative potential sources of additional funding assessed.
%20LRTPFinal.Chapter%205.pdf
http://www.kansaslrtp.org/pdf/Final_LRTP/KS%20LRTPFinal.Chapter%206.pdf
Louisiana Quantitative and financial-focused but short and
from 2003 – no update evident.
Maryland Brief discussion of needs vs. expected revenues but lacks detail; high-level policy emphasis.
http://www.mdot.state.md.us/Planning/Maryland%20Transportation%20Plan/index.html
Minnesota Relatively thorough. More detailed cost analysis in
different sections. http://www.dot.state.mn.us/planning/stateplan/pdfs/STP%20Compiled.pdf
Missouri Appears thorough but elements of financial forecast
not presented in detail. http://www.modot.mo.gov/plansandprojects/long-range_plan/longrangetransportationplan.htm
Montana 2002 plan amended in 2008 – no comprehensive
recent financial plan. http://www.mdt.mt.gov/pubinvolve/tranplan21.shtml
New York Non-quantitative, brief treatment in plan. Special
commission financial study conducted (see link) but not too quantitative, focus more on transportation growth.
http://www.utrc2.org/publications/assets/16/troubleahead1.pdf
Ohio Appears thorough – includes financial tables – but
dated – circa 2004 (November). http://www.dot.state.oh.us/Divisions/Planning/SPR/StatewidePlanning/Documents/Final_Document1.pdf
Oregon Tests variety of scenarios, including roadway pricing
and “relaxed” land use; addresses “triage” in the absence of sufficient revenue; not as much quantitative information as some other states – strong issue/policy focus supported by moderate level of quantitative analysis and effective use of qualitative analysis. Scenarios evaluated in terms of performance criteria and associated cost.
http://www.oregon.gov/ODOT/TD/TP/docs/ortransplanupdate/2007/OTPvol1.pdf
http://www.oregon.gov/ODOT/TD/TP/docs/ortransplanupdate/2007/OTPvol2.pdf
Pennsylvania Extensive participatory effort for statewide plan but
little financial planning detail – reference to source document - “Investing in Our Future: Addressing Pennsylvania’s Transportation Funding Crisis,
http://www.pamobilityplan.com/pubs/DirectionDoc-6-8-07-lowres.pdf
ftp://ftp.dot.state.pa.us/public/pdf/TFRCFinalR

19
State Notes URL Commission’s Initial Findings and Request for Public Input” by Pennsylvania Transportation Funding and Reform Commission, August 2006. This is a 1-time special study – looks thorough. Good reference.
eport.pdf
Rhode Island Statewide Plan integrates transportation with broader
planning issues. Clear, concise, quality financial analysis more quantitative than most. Same plan for Providence metropolitan area.
http://www.planning.ri.gov/transportation/trans2030.pdf
South Carolina
Methods, assumptions, quantitative data not included in financial plan.
http://www.dot.state.sc.us/inside/multimodal/pdfs/InterstateCorridorPlan.pdf
Utah Plan for highways and non-metropolitan areas only.
MPO plans address metropolitan areas. http://www.udot.utah.gov/main/f?p=100:pg:0:::1:T,V:1843
Washington User-friendly, concise financial analysis, including
discussion of how gas taxes and other revenues are spent; innovative financing addressed; financial plan and methods not detailed; Separate project-oriented Cost Risk Assessment process.
http://www.wsdot.wa.gov/NR/rdonlyres/AC0DFE47-B31A-42D2-B649-A32F1E4F94A7/0/FocusonTransportation.pdf
http://www.wsdot.wa.gov/projects/projectmgmt/riskassessment
Wisconsin Thoughtful discussion and analysis but limited
quantitative forecast. Significant discussion of alternatives to motor fuel tax.
http://www.dot.wisconsin.gov/projects/state/docs/2030-chapter12.pdf
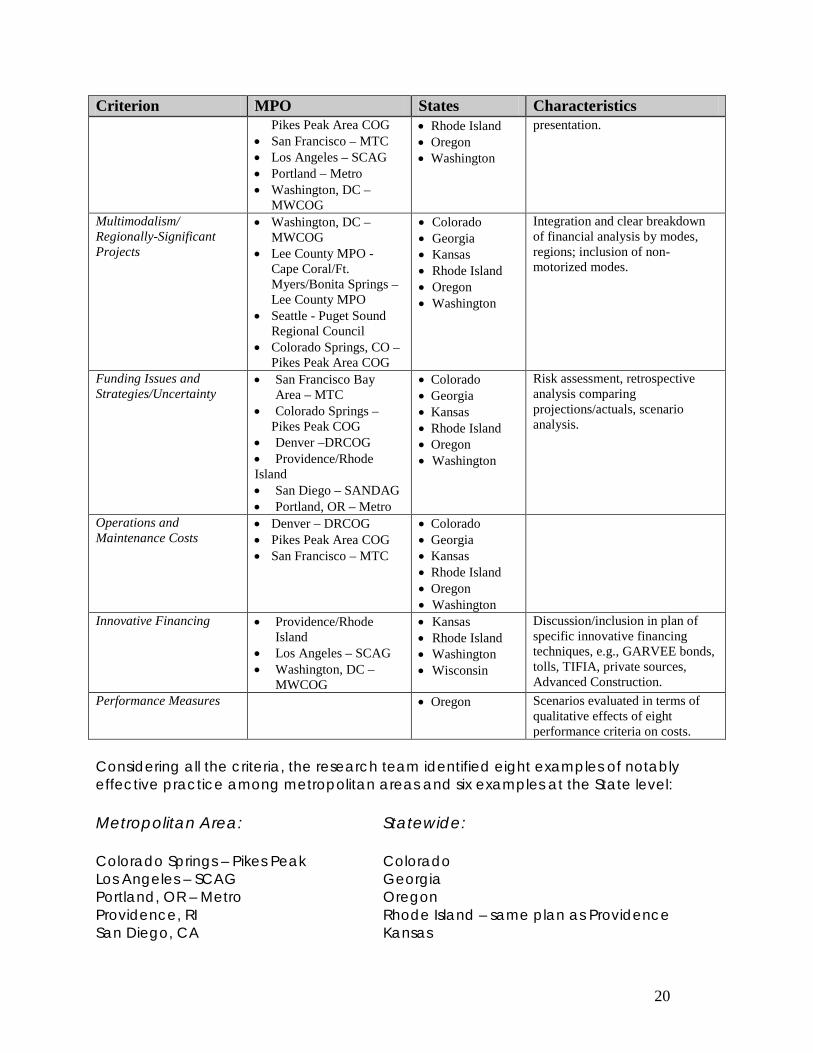
Recommended Case Studies Table III-3 below identifies the MTPs and statewide plans that are particularly strong in terms of the individual criteria identified earlier in this memorandum. The table affirms the observation, noted previously, that the same metropolitan areas and states having strong overall financial planning methods tend also to excel in terms of one or more additional criteria, such as inclusion of all modes and risk assessment. Table III-3 Effective Metropolitan and Statewide Financial Planning Practice Criterion MPO States Characteristics Thorough, rigorous technical methods
• Denver – DRCOG • San Diego – SANDAG • Colorado Springs –
• Colorado • Georgia • Kansas
Breakdown by cost items/funding sources; reasonable assumptions and future projections; clear
20
Criterion MPO States Characteristics Pikes Peak Area COG
• San Francisco – MTC • Los Angeles – SCAG • Portland – Metro • Washington, DC –
MWCOG
• Rhode Island • Oregon • Washington
presentation.
Multimodalism/ Regionally-Significant Projects
• Washington, DC – MWCOG
• Lee County MPO - Cape Coral/Ft. Myers/Bonita Springs – Lee County MPO
• Seattle - Puget Sound Regional Council
• Colorado Springs, CO – Pikes Peak Area COG
• Colorado • Georgia • Kansas • Rhode Island • Oregon • Washington
Integration and clear breakdown of financial analysis by modes, regions; inclusion of non-motorized modes.
Funding Issues and Strategies/Uncertainty
• San Francisco Bay Area – MTC
• Colorado Springs – Pikes Peak COG • Denver –DRCOG • Providence/Rhode Island • San Diego – SANDAG • Portland, OR – Metro
• Colorado • Georgia • Kansas • Rhode Island • Oregon • Washington
Risk assessment, retrospective analysis comparing projections/actuals, scenario analysis.
Operations and Maintenance Costs
• Denver – DRCOG • Pikes Peak Area COG • San Francisco – MTC
• Colorado • Georgia • Kansas • Rhode Island • Oregon • Washington
Innovative Financing • Providence/Rhode Island
• Los Angeles – SCAG • Washington, DC –
MWCOG
• Kansas • Rhode Island • Washington • Wisconsin
Discussion/inclusion in plan of specific innovative financing techniques, e.g., GARVEE bonds, tolls, TIFIA, private sources, Advanced Construction.
Performance Measures • Oregon Scenarios evaluated in terms of qualitative effects of eight performance criteria on costs.
Considering all the criteria, the research team identified eight examples of notably effective practice among metropolitan areas and six examples at the State level: Metropolitan Area: Statewide: Colorado Springs – Pikes Peak Colorado Los Angeles – SCAG Georgia Portland, OR – Metro Oregon Providence, RI Rhode Island – same plan as Providence San Diego, CA Kansas
21
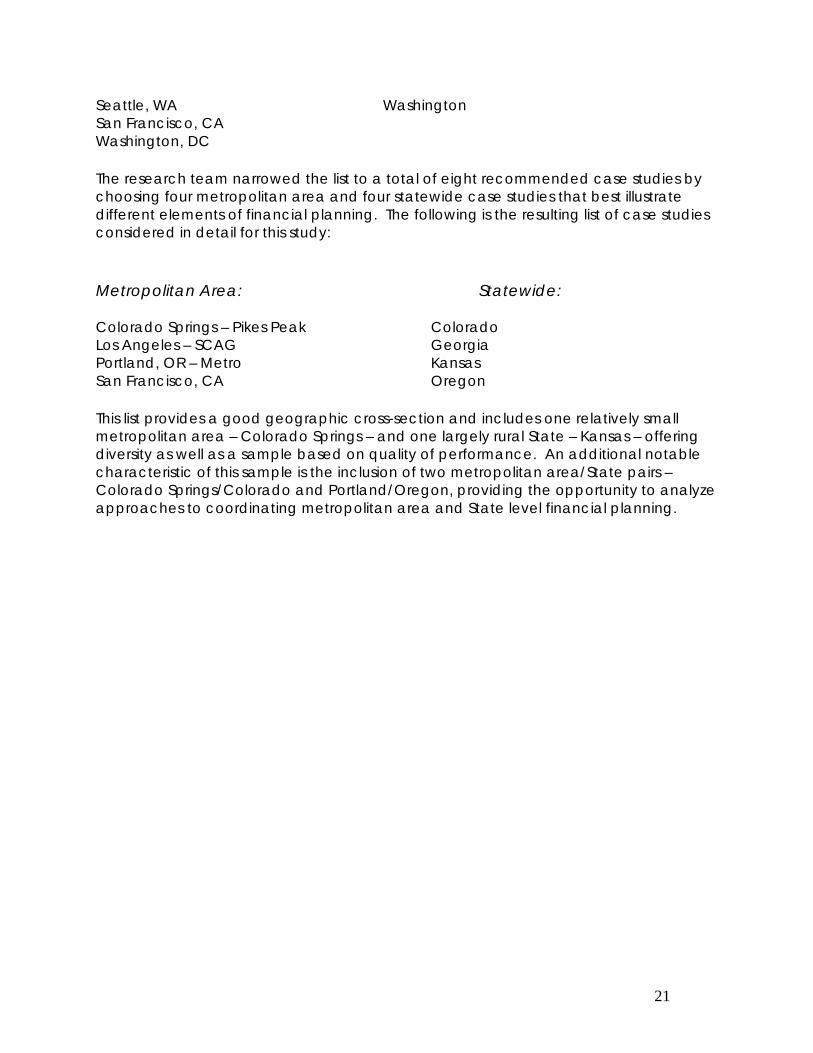
Seattle, WA Washington San Francisco, CA Washington, DC The research team narrowed the list to a total of eight recommended case studies by choosing four metropolitan area and four statewide case studies that best illustrate different elements of financial planning. The following is the resulting list of case studies considered in detail for this study: Metropolitan Area: Statewide: Colorado Springs – Pikes Peak Colorado Los Angeles – SCAG Georgia Portland, OR – Metro Kansas San Francisco, CA Oregon This list provides a good geographic cross-section and includes one relatively small metropolitan area – Colorado Springs – and one largely rural State – Kansas – offering diversity as well as a sample based on quality of performance. An additional notable characteristic of this sample is the inclusion of two metropolitan area/State pairs – Colorado Springs/Colorado and Portland/Oregon, providing the opportunity to analyze approaches to coordinating metropolitan area and State level financial planning.

22
IV. Metropolitan Area Case Studies
Case studies for the four metropolitan areas selected through the nationwide scan are presented in this section. Each case study includes an overview of the role of financial planning in MTP development, highlighting the particular features of financial planning that represent best practice. The approach to financial planning is explained, followed by a discussion of best practices and a summary of case study conclusions.
• Colorado Springs: Demonstrates an extensive alternatives comparison supported by a multifaceted public involvement process and analysis of uncertainty as related to changing financial conditions over time.
• Los Angeles: Exemplifies rigorous and transparent technical analysis, particularly clear and comprehensive explanation of reasonably available revenue sources, as well as transparent financial modeling.
• Portland, OR: Provides an example of another approach to quality technical financial analysis. In addition, the financial plan includes an assessment of potential strategies to stabilize transportation funding in the region and identifies potential performance measures to assess progress in achieving fiscal stewardship objectives. Public involvement contributed to development of the financial plan.
• San Francisco: Illustrates the examination of financial trends as a basis for projecting
future conditions, including a retrospective review of previous long-range plans and development of a risk model for project cost estimates.
23
Colorado Springs – Pikes Peak Area Council of Governments Overview The Moving Forward 2035 Regional Transportation Plan (RTP) is the vision for the development, operation, and management of the multimodal transportation system in the Colorado Springs metropolitan area for the years 2008 - 2035. The RTP addresses current and future regional needs within the constraints of reasonably available financial resources. The Pikes Peak Plan is an example of financial planning best practice in a metropolitan area, identifying practices that can be incorporated by MPOs in medium-sized metropolitan areas. Moving Forward is noteworthy for: (1) an extensive alternatives comparison supported by a multifaceted public involvement process; and (2) discussion of uncertainties as they relate to changes in financial conditions over time. With respect to public involvement, the outreach effort conducted in support of the development of Moving Forward 2035 included specific activities to collect information on public priorities that was used to inform the development of three alternative fiscally-constrained visions. Most notable were:
• Development of six alternatives representing different levels of funding, investment priorities, and strategies.
• Public involvement activities ranging from interviews with community leaders to public meetings and workshops.
The discussion of uncertainty acknowledges the risk elements that can positively or negatively affect revenue and cost forecasts. These risks may have significant implications for the ability of a region to fund needed transportation investments and thinking about them is a strategic first step to being able to address areas of uncertainty through the planning process. A notable example is the potential for the rising fuel-efficiency of the vehicle fleet to result in long-term decreases in gasoline tax revenues. These features are discussed below in relation to the purposes of Moving Forward 2035 and their significance for long-range metropolitan area transportation financial planning. Financial Approach The financial component of Moving Forward 2035 includes an overview of the funding sources, anticipated revenues, and estimated costs to maintain, operate, and expand the existing transportation system, while acknowledging the gap between the needs and available resources. The plan is multimodal in scope, integrating roads and highways, public transit, non-motorized transportation, rail, and aviation. The financial component of Moving Forward 2035 was developed through a four-step process:

24
(1) Determining costs of adding new capacity and inflating project costs from the 2030 plan from their 2004 base to a 2007 base level; (2) Estimating costs for routine maintenance and life-cycle treatments using the Highway Economic Requirements System; (3) Adjusting estimates of existing and future anticipated financial revenues to a year of expenditure level. The Colorado DOT and the State’s MPOs use revenue forecasts from the Colorado Office of Financial Management and Budget to cooperatively develop resource allocations to be used to prioritize projects. (4) Comparing forecast revenues against costs. For this analysis, outer years are grouped into five-year time periods. The third year of the five year period is used to project the costs and revenues for each time period. The plan provides a clearly-described explanation of the financial planning process, which is thorough and comprehensive. The revenue forecast includes descriptions of local, State, and Federal revenue sources. Local sources include property, gas, and sales taxes, street use permits, as well as street use permits and impact fees. State sources include the Colorado highway users tax fund and sales and gaming taxes. Federal sources include Congestion Mitigation and Air Quality (CMAQ), Surface Transportation Program (STP) and other surface transportation funding programs. Alternatives Comparison Moving Forward 2035 stands out not only as a general example of effective financial planning methods, but also for its thorough evaluation of multiple financially constrained alternatives. Whereas the financial planning process of many MPOs results in only one fiscally constrained alternative for consideration, the PPACG process allowed consideration of three distinct alternatives. The improvements ultimately selected for inclusion in the fiscally-constrained RTP were determined through an extensive alternatives comparison. A strong, multifaceted public involvement component integrated throughout the planning process supported the approach. The process engaged stakeholders in a number of ways, which enabled PPACG to develop alternative visions and subsequently to select a financially constrained alternative that best addresses the transportation priorities and challenges in the Colorado Springs metropolitan area. Public input was incorporated into the development of the alternatives and was considered in selection of the alternative that ultimately would be adopted for the fiscally-constrained 2035 RTP. Public engagement in the long-range planning process included the following activities:
• Community leader interviews were used as a means to learn about local issues, community characteristics, and seek ideas that would encourage public participation in developing the Plan.

25
• An online transportation survey sought information from website visitors about travel behavior in the Colorado Springs metropolitan area, transportation priorities, and willingness to use alternative travel modes.
• A PPACG traveling booth provided an opportunity for public input at community
events, farmers’ markets, and festivals in the Colorado Springs metropolitan area. PPACG distributed information on the transportation planning process and included brief activities such as a survey. The booth allowed PPACG to engage over 1,300 people.
• PPACG conducted eight open-house style meetings that provided an opportunity
for open and informal discussion sessions between PPACG staff, CDOT, and the region’s transit provider Mountain Metropolitan Transit.
• A Speaker’s Bureau and associated presentations were created to attend citizen’s
organizations, business groups, and transportation interest groups.
• A Regional Transportation Roundtable brought the region together to plan the future transportation system. Over 150 people at 19 tables participated to create future transportation plans that informed alternatives development.
Following the Regional Transportation Roundtable, facilitated advisory committee workshops were conducted to consolidate the 19 transportation proposals and other public comments into a finite set of alternatives for comparison and comment. The result of the workshop with the Community Advisory Committee and Transportation Advisory Committee was the development of six initial alternative transportation networks, based on public comments and previous planning efforts. All six alternatives were compared against a base case scenario of travel patterns on a network consisting of existing facilities coupled with all projects that will be completed by 2015. Exhibit IV-1 (below) presents the six scenarios. Exhibit IV-1 Alternative Scenarios
Alternative Scenarios
1. 2030 RTP projects—all projects in the 2030 long-range plan. 2. All interchanges—sensitivity analysis to test the impacts of upgrading facilities
with grade separated interchanges.
3. Reducing environmental impacts - environmentally least damaging. Concentrated on Transit and ITS, and limited roadway improvements.
4. Strategic corridors system—regionally significant roadway projects and
improving transit on regionally significant corridors. 5. Balancing investments - emphasized improved transit coverage and frequency;
express bus and BRT, and lower impact roadway improvements.
6. Dispersed projects—proposed projects that meet or reduce a mobility need and or are included in local entity transportation plans but not in a previous alternative.

26
Each of the alternatives represented certain ideas that were revealed as desirable during the public outreach efforts. To allow for deeper analysis, the six alternatives were refined into three main alternatives that incorporated important characteristics of those not selected into the final three. The three alternatives selected were the Strategic Corridors, Balancing Investments, and Reducing Environmental Impacts.
At a workshop with the PPACG Transportation and Community Advisory Committees, PPACG reviewed funds available for different types of projects and facilitated a process where committee members began to create three fiscally-constrained alternatives based on themes. The improvements included in each alternative were determined based on discussions of advantages and disadvantages of each project during the joint session with the advisory committees, communicating with local and State jurisdictions, and reviewing public comments. The three alternatives were evaluated based on adopted goals for the plan; PPACG ultimately agreed that the Balanced Investment System best addressed the regional perspective. This alternative focuses on improving strategic corridors while improving transit coverage and frequency. The alternative also includes policies to provide $1 million/year for operational improvements and to complete a planned list of non-motorized projects. Once the RTP was finalized, PPACG’s advisory committee members and other participants met to discuss how well expectations were met, what techniques were most successful or not, and what they would like to see implemented. This review also included an evaluation of comments received on forms distributed at public meetings. Treatment of Uncertainty in the Financial Plan Any financial plan or any forecast predicated on achieving results in the future entails a number of risks. Future outcomes are dependent on particular assumptions and actions/decisions, all of which have inherent risks. PPACG acknowledges this, noting that a good technical process will account for uncertainty and reflect a “precautionary” approach to decision-making. Where resources exist, analysis of the sensitivity of a decision to expected trends and specific assumptions can help to determine the extent of risk and potential responses. The discussion of these uncertainties is a notable strength of the RTP. PPACG identifies the risk elements associated with the Plan, acknowledging that they potentially have both positive and negative influences on the level of funding that will be available to the region. Some of the risk elements identified relate to external economic factors. For example, PPACG notes the risk of assumptions about inflation. Costs of the needs identified in the plan are assumed to increase at an annual inflation rate of 4% until 2035. If inflation is either higher or lower than this estimate, however, or if construction costs inflation diverges from that of the economy as a whole, funding needs probably will change accordingly. Another acknowledged risk stems from underlying assumptions of future regional conditions. Historical data indicate that employment, population, and income growth in

27
the Pikes Peak region have exceeded the national average; however, the future direction of these indicators could change, and would affect gasoline and fuel tax and registration fee revenues related to these factors. Finally, the RTP acknowledges risks associated with current funding structures and changes in response to environmental concerns. Traditionally, SUVs and light-duty trucks have been the fastest growing segment of the vehicle fleet. The fuel economy of these vehicles is below average, increasing gas tax revenues. Currently, hybrid vehicles are registering a growing market presence and auto manufacturers are developing more fuel efficient vehicles, leading to long-term decreases in gasoline tax revenues.
Meeting the needs or achieving the vision identified during the Moving Forward 2035 time frame will require new revenues. The Pikes Peak region has identified needs beyond the improvements identified within the fiscally-constrained portion of the plan. In light of the transportation funding shortfalls facing Pikes Peak and other regions across the country, acknowledging these risks may also better inform the development of strategies to increase revenues. Conclusions MPOs range greatly by size and resource availability. Not all metropolitan areas have the resources for planning that are available to the largest metropolitan areas. Moving Forward 2035 provides an example of a rigorous and credible analysis produced by a medium-sized MPO to address financial issues at the metropolitan area level. The alternatives comparison, in particular, reflects a skillful integration of public regional transportation priorities with the development of a fiscally constrained plan. In addition, explicit consideration of financial risk enables planners to identify vulnerabilities and to develop means of addressing outcomes that differ from current expectations. Planning for uncertainty may improve preparedness for a range of potential outcomes. When resources are available, sensitivity analysis on the effects of risks may be a useful exercise to supplement traditional financial analysis. Identifying and discussing these uncertainties may be useful exercise for other regions when developing a financial plan, so contingencies can be put into place when possible. References
• Moving Forward 2035 Regional Transportation Plan – Main Page: http://ppacg.org/transportation/regional-transportation-plan
• Moving Forward 2035 Regional Transportation Plan – Financial Plan:
http://ppacg.org/images/stories/pdf_files/rtp_chap6.pdf Contact Craig T. Casper, AICP – Transportation Director [email protected] Pikes Peak Area Council of Governments http://ppacg.org/

28
Los Angeles – Southern California Association of Governments Overview The Southern California Association of Governments (SCAG) 2008 Regional Transportation Plan (2008 RTP): Making the Connections presents the transportation vision and investment framework for addressing the region’s transportation challenges. The six-county SCAG region is a large, complex metropolitan area that is the nation’s second most populous. The 2008 RTP is an integrated, multimodal plan that contains strategies for addressing transportation needs within the constraints of reasonably available revenue sources, as well as strategies to address the needs beyond those addressed in the financially constrained plan. The SCAG 2008 RTP exemplifies overall excellence in financial planning because of the transparent, rigorous technical approach. An area that specifically stands out as best practice is the incorporation and clear explanation of reasonably available revenue sources, including innovative strategies and financing techniques. Another area that illustrates best practice is the transparency of the financial model. Approach to Financial Planning The 2008 RTP financial analysis is a comprehensive, multimodal plan that identifies how much money is available to support the region’s surface transportation investments from 2007 through 2036. The financially constrained 2008 RTP includes both a “core” revenue forecast and a forecast of revenue sources reasonably expected to be available over the Plan’s 30-year time horizon. The RTP specifies the effects of inflation, cost increases, and other assumptions upon which the forecasts are based. In addition, the plan includes action steps to obtain additional necessary revenues. The basic approach for the analysis was to:
• Incorporate financial planning documents developed by local county commissions and transit operators.
• Ensure consistency with State and local planning documents. • Evaluate historical trends and augment local forecasts using data from published
sources. The 2008 RTP identifies both traditional and non-traditional revenue sources available to support surface transportation investments, including transit, highways, local road improvements, system preservation, and demand management. SCAG opted for a conservative approach in forecasting available revenues and maintained historical growth trends for key sources. The analysis divides revenues into two categories:
1) Core revenues have been committed or historically available for the building, operation, and maintenance of current roadway and transit systems in the

29
SCAG region; core revenues do not include increases in tax rates nor extension of beyond expiration date authorized, unless already approved. These sources are intended to serve as a benchmark from which additional funding can be identified.
2) Reasonably available revenues, described in more detail later in this case study, are the new funding sources expected to increase the revenues available for the 2008 RTP.
To estimate costs of the Plan, SCAG asked each county transportation commission (CTC) to submit detailed capital costs for every highway and transit project. County transportation commissions must provide information on a standardized template that breaks down project cost by category and project expenditures by funding source. Plan expenditures are broken down by capital projects, operations and maintenance, and debt service. These expenditure categories are broken down into groups that demonstrate the multimodal nature of the plan, shown in Exhibit IV-2 below. The plan also emphasizes the importance of goods movement, telecommuting, airport ground access, and non-motorized transportation. Exhibit IV-2 RTP Costs
Reprinted from 2008 Regional Transportation Plan: Making the Connections, p.160
The financial plan contained within the body of the 2008 RTP is supplemented by the 2008 RTP Transportation Finance Report, which contains clear documentation and extensive discussion of the financial assumptions, methodologies, and results of the financial analysis.
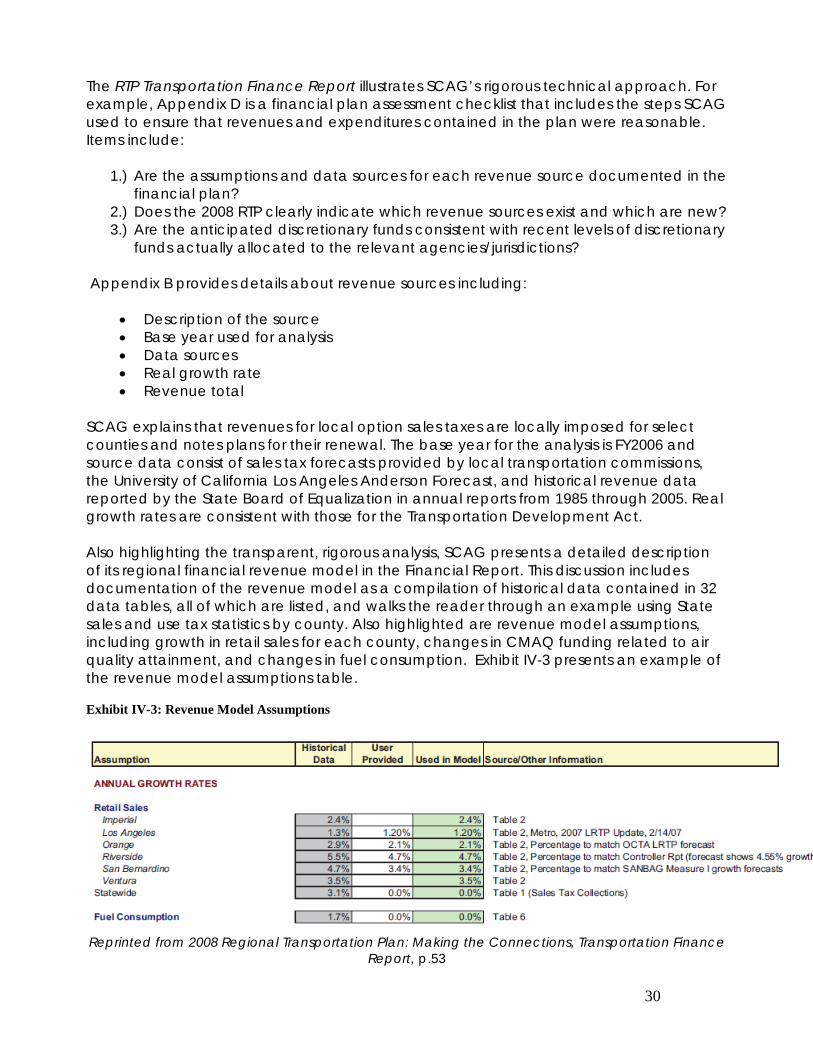
30
The RTP Transportation Finance Report illustrates SCAG’s rigorous technical approach. For example, Appendix D is a financial plan assessment checklist that includes the steps SCAG used to ensure that revenues and expenditures contained in the plan were reasonable. Items include:
1.) Are the assumptions and data sources for each revenue source documented in the financial plan?
2.) Does the 2008 RTP clearly indicate which revenue sources exist and which are new? 3.) Are the anticipated discretionary funds consistent with recent levels of discretionary
funds actually allocated to the relevant agencies/jurisdictions? Appendix B provides details about revenue sources including:
• Description of the source • Base year used for analysis • Data sources • Real growth rate • Revenue total
SCAG explains that revenues for local option sales taxes are locally imposed for select counties and notes plans for their renewal. The base year for the analysis is FY2006 and source data consist of sales tax forecasts provided by local transportation commissions, the University of California Los Angeles Anderson Forecast, and historical revenue data reported by the State Board of Equalization in annual reports from 1985 through 2005. Real growth rates are consistent with those for the Transportation Development Act. Also highlighting the transparent, rigorous analysis, SCAG presents a detailed description of its regional financial revenue model in the Financial Report. This discussion includes documentation of the revenue model as a compilation of historical data contained in 32 data tables, all of which are listed, and walks the reader through an example using State sales and use tax statistics by county. Also highlighted are revenue model assumptions, including growth in retail sales for each county, changes in CMAQ funding related to air quality attainment, and changes in fuel consumption. Exhibit IV-3 presents an example of the revenue model assumptions table. Exhibit IV-3: Revenue Model Assumptions
Reprinted from 2008 Regional Transportation Plan: Making the Connections, Transportation Finance
Report, p.53

31
The well-documented, transparent revenue and expenditure analyses can serve as a model for other metropolitan area transportation planning efforts. New and Innovative Funding Strategies SCAG recognizes transportation finance as the region’s most imminent challenge. The region faces funding shortfalls that may be further exacerbated by challenges such as the erosion of gasoline tax revenues, increasing construction costs, and the status of the Federal Highway Trust Fund. In the face of these challenges, SCAG conducted an extensive analysis to determine several new funding sources that would reasonably be expected to be available through 2036, including leveraging innovative financing strategies. The plan includes action steps to obtain the revenues necessary and also identifies associated risks. Revenues in the financial analysis are categorized either as core revenues or reasonably available revenues. The latter includes twelve sources not contained among the core revenues that were selected on the basis of their use in other areas of the State, their potential, historical precedence, and likelihood of implementation within the timeframe of the 2008 RTP. Among these reasonably available revenues are adjustments to State and Federal gas tax rates based on historical trends, extension of a local option sales tax, localized value capture strategies, container fees, and passenger and commercial truck tolls. Also noted are innovative financing strategies such as private equity participation and Transportation Infrastructure Finance and Innovation Act (TIFIA) Loans. Exhibit IV-4 below identifies these 12 sources.

32
Exhibit IV-4: Revenue Sources
Existing • Federal Non-Discretionary Funds (apportioned
FTA/FHWA) • Federal Funds Discretionary (FTA/FHWA) • Continuing Local Option Sales Tax • State Funds at Current Apportionment Levels
New
• Local Option Sales Tax Renewal for Imperial County
• Value Capture Strategies • Highway Tolls • State and Federal Gas Excise Tax Adjustment • Container Fees (including railroad user fees) • Private Equity Participation • Private Activity Bonds • Federal EPA Funding for Clean Freight Rail
Technology • Interest Earnings • Riverside County Measure A (Bond Anticipation
Notes) • TIFIA Loan • High Speed Rail Transit (Private Contribution and
User Fee)
For each reasonably available funding source, SCAG examined the associated policy and legal context and prepared an estimate of its revenue potential. The plan includes strategies for ensuring the availability of these sources, according to Federal guidelines. Table 2 of the Financial Report summarizes the results of this work. For private activity bonds (PAB), a tool resulting in interest savings from the issuance of tax-exempt private activity bonds, the action to ensure availability is to “work with railroads and other regional stakeholders to receive PAB allocation.” Parties to this process are identified as MPOs, freight railroads, local county transportation commissions, and the U.S. DOT. Strengthening the case for these new revenues, SCAG recognizes the uncertainty associated with revenue sources that may be reasonably expected to be available and includes a review of revenue risk assessment and mitigation for revenue sources in the reasonably available category. The results are summarized in a table that contains information on whether the source is new or existing, assumed availability, potential risk, and risk mitigation. SCAG, for example, cites highway tolls as being reasonably available based on the region’s financial experience with toll corridors (SR-91 and Transportation Corridor Agencies). The potential risks identified are inadequate toll generation and failure to pass necessary legislative authorization for specific facilities. Proposed risk mitigation is substitution of alternative funding sources or amendment of the RTP as needed.
Conclusion

33
The 2008 RTP for the SCAG region stands out as an example of a rigorous, technical, and transparent financial analysis. The well-documented process ensures clear communication of complex ideas to stakeholders, and makes it possible for the process to be recreated by SCAG, as well as other planning organizations in the future. Moreover, SCAG’s approach to identifying reasonably available revenue sources for long-range metropolitan area financial planning can serve as a model for other regions to follow when preparing their own financial analysis. Identifying new revenue sources and developing strategies for their implementation is increasingly important as regions across the country face eroding revenues and increasing costs to build, operate, and maintain their own transportation systems. References
• “SCAG 2008 Regional Transportation Plan” – Main Site: http://www.scag.ca.gov/rtp2008/final.htm
Contact Annie Nam – Manager, Transportation Finance & Goods Movement Division [email protected] Southern California Association of Governments http://www.scag.ca.gov/

34
Portland, OR - Metro
• Metro is the directly-
elected regional government
• 3 counties • 25 cities, including
the City of Portland • 463 square miles • 1.4 million residents • 50% of the state’s
jobs • 2 primary transit
agencies/operators (TriMet and SMART)
Regional Overview
Overview The 2035 update to the Metro Regional Transportation Plan (RTP), first adopted in 1983, serves as the blueprint for the “design, management and governance of all regional transportation investments” in the Portland, Oregon metropolitan area. Implementation of the plan moves the region toward its long-range vision and strategy for growth management, the 2040 Growth Concept, which was adopted in 1995. Like many areas across the country, the Metro region is growing rapidly and in the face of already limited funding, faces new challenges and opportunities related to climate change, energy uncertainty, and its position in the global economy. In response, the current update to the RTP involves a new approach to address these realities—using desired outcomes to define, evaluate, and prioritize critical investments. The RTP is an example of financial best practice because of its transparent, rigorous, and outcome-oriented financial planning process and analysis. The financial planning process, as well as the resulting analysis, is noteworthy for its clear and thorough descriptions of assumptions and methodology. This clarity and detail makes the technically complex concepts accessible to all who read the financial planning documents. With respect to transparency, Metro makes available information from the beginning to end of the financial planning process, explaining concepts such as “Year of Expenditure” (YOE). The RTP considers a range of scenarios representing “reasonably available revenue.” In addition to being technically rigorous, the RTP provides direction for future actions to stabilize transportation funding in the region, including raising new revenue, through fiscal stewardship goals supported by proposed performance measures. Financial Analysis Approach Within the framework of Federal and State transportation planning requirements, including fiscal constraint, Metro views the RTP as fundamentally about making good transportation-investment choices in support of the 2040 Growth Concept. The financial analysis was approached from the beginning of the planning process with clearly-defined goals, and with roles and responsibilities laid out explicitly. While contractors took a lead role on the financial analysis, the financial planning process involved partnership and collaboration with the Oregon Department of Transportation (ODOT), cities and counties in the Metro region, TriMet (the public transportation operator in Portland) and the South Metro Area Rapid Transit (SMART) district.” The 2035 RTP revenue forecast and financial analysis for operations and maintenance costs was based on a thorough evaluation of city and county, Oregon Department of Transportation (ODOT), and transit cost projections. The goals of the financial planning process were to:
• Investigate current fiscal realities • Determine reasonably anticipated financial resources
35
• Identify potential new revenue sources • Estimate funding available for capital projects after necessary operation and
maintenance costs are determined and implications for the system • Evaluate funding scenarios to address financial shortfall • Develop a 2007-2035 forecast.
To ensure compliance with SAFETEA-LU, the process started with a review of Federal requirements for the financial component of the metropolitan transportation plan. The next steps were to assemble, review, and synthesize existing information for meetings with local government experts and to develop methods for facilitating input from these experts. For the technical component, a memorandum was developed describing the financial analysis methods. The memorandum stands out not only for breaking down the approach selected, but also by reviewing the range of possible approaches and describing what the steps to be taken as part of that approach. For example, for estimating available future revenues and future capital and operating and maintenance (O&M) costs, the memorandum discusses two approaches: building on previous estimates and starting from scratch. For future revenue and capital costs and for O&M forecasts, the approach was to start from scratch. Once methods were agreed upon by the financial technical advisory group (FINTAG), a subgroup of the Metro’s MPO technical advisory committee, preliminary financial analysis was performed, including determination of revenues and capital and operations, maintenance, and preservation (OM&P) costs, providing an overview of public funding for transportation. This analysis included base-lining and forecasting the main sources of Federal, State, and local resources that ultimately are dedicated to transportation. The analysis also addressed operating and maintenance costs paid by member jurisdictions, as required by the 2004 Federal Certification Review. The results of this process were compiled in a preliminary report, Preliminary Financial Analysis for the 2035 Regional Transportation Plan Update (PFA), with supporting data, tables, and graphics, and appendices that document a 29-year revenue projection through 2035. The report documents all cost estimation methods, forecast assumptions, and scenarios, and provides a comprehensive assessment of the financial outlook for the regional transportation system. The Joint Policy Advisory Committee on Transportation (JPACT) and Metro Council have authority for final approval, with input from the Advisory Committees. The PFA serves as a precursor to the financial element of the final RTP. The report sets bounds on the range of possible revenue, as a basis for determining “reasonably” available funding sources. This early documentation and analysis was used to better inform the investment and decision-making process. The final financial analysis is presented in Chapters 5 and 6, “Finances” and “Investments” respectively, of the 2035 RTP. The analysis also acknowledges the uncertainty of long-range forecasts, noting that project costs reflect planning-level estimates that have not yet benefited from project development with more refined cost estimates. Costs exceed revenues by $120 million and $250 million in 2007 and YOE dollars, respectively, relative to a total revenue base of $9.07 billion. Metro believes that for that reason, coupled with the long 29-year planning horizon, the disparities fall within a reasonable margin of error and reflect a financially constrained RTP.

36
In addition to the financially constrained system, the 2035 RTP identifies a larger set of projects and programs for the “Illustrative System,” which is double the scale and cost of the financially constrained system. The Illustrative System represents the region’s preferred unconstrained approach strategy for implementing the Region 2040 Growth Concept Plan, which Metro incorporated into a subsequent update of the State component of the 2035 RTP. Financial Scenario Development and Evaluation The financial analysis performed for the PFA does not rush to a conclusion about the future revenues “reasonably expected to be available” for the 25-year planning horizon. The analysis sought to address the uncertainty associated with long-range forecasts by developing three financial scenarios. These scenarios are described in Exhibit IV-5 below. Exhibit IV-5: PFA Financial Scenarios
(E) Existing sources Most conservative scenario – represents the level of revenue available from existing sources with no increases in tax rates or fees.
• Changes in revenue result only from changes in underlying conditions such as property values, number of vehicles or volume of gasoline sales
• Underlying conditions are forecast on the basis of historical and recent trends in the region (E+) Existing sources plus a conservative estimate of new, future funding Includes revenues from existing sources, committed revenues, and reasonable but conservative assumptions for increases:
• Federal HPPP funds and other discretionary funds based on the region’s population • Other Federal highway funds as estimated by the 2004 RTP (about $800 million) • State Highway Trust Fund allocation through gas tax increase • Local sources by assumed increases in private development contributions and urban
renewal (E++) Includes the new sources in E+ plus others, This scenario is “optimistic”, but not “unreasonable” and includes revenue from E+ as well as what are considered reasonable but optimistic assumptions for increases in:
• Federal HPPP funds and other discretionary funds based on SAFETEA- LU allocation • Other Federal highway funds as estimated by share of recent STIP funding in the region • State Highway Trust Fund allocation through gas tax increase plus higher registration fees • Local sources through assumed increases in System Development Charges (by 10%),
private development contributions, and urban renewal
Reprinted from Preliminary Financial Analysis for the 2035 Regional Transportation Plan, p. 3-2,3
The preliminary financial analysis makes these scenarios easy to understand by carefully documenting the assumptions that distinguish them from each other. Each decision was made by and supported by careful review of existing information and approved through external review. For example, for Federal Transit Administration (FTA) New Starts funding, no level of funding is assumed for Scenario “E;” any current funding is accounted for in the analysis of local revenue. For the “E+” level of funding, $1 billion of new transit funding is assumed because of the Metro region’s success in obtaining Section 5309 funding and its

37
strong interest in new projects. This assumption was approved by an ODOT committee, which agreed with the assumption that the Section 5309 component of the region’s funding strategy would likely be successful. Finally, for the “E++” level of funding, the PFA assumes that New Starts funds would be available for transit capital projects that currently lack committed matching funds. Assuming 60% of the cost of all the major transit projects in the region, about $4.2 billion, the PFA projects about $2.5 billion for transit capital improvements at the E++ level of funding. The analysis also acknowledges decisions made to keep the three scenarios the same. For Urban Formula Transit funds (5307), the analysis documentation notes: “We found nothing more in the ODOT documents to give us a specific bases for making an additional forecast for “E++” for 5307 funds distributed to the region.” Revenue Analysis and Forecast In the financial plan contained within the 2035 RTP, Metro has identified Federal, State, and local revenue sources the region can reasonably expect to be available for the Metro region over the 29-year life of the RTP. Revenue estimates were developed in consultation with Metro’s Federal, State, and local agency partners and are based on preliminary revenue estimates developed by consultants.3 The process used to develop the revenue estimates is an example of a rigorous technical analysis of reasonably expected revenue. To establish a baseline, the existing funding situation (both revenues and expenditures) was thoroughly researched, reviewed, and analyzed. Preparation included a review of historical data, recent trends, and other relevant materials. The 2004 RTP was used as a baseline from which to reassess: assumptions that are no longer valid; funding sources that are no longer an option; funding sources that may have emerged as new possibilities; and changes or updates to underpinning forecasts. While the focus of the plan is on highway, local road, and transit revenue sources, the analysis acknowledges contributions/investment from the Port of Portland The RTP and supporting preliminary analysis reviews both traditional and non-traditional revenue sources. Traditional revenue sources include government funding; non-traditional sources include development-based sources and special funds and levies. For each source, the preliminary analysis provides a description and historical overview of the source and an explanation of what that funding can be used for. The analysis also provides a clear, detailed analysis of assumptions applied to the funding source and for forecasting it over the 29-year period of the plan. In line with the requirement for consistency with State plans, the forecast of future revenues relies heavily on ODOT’s Financial Assumptions; however, when making alternative assumptions, how they diverge from or supplement ODOT’s analysis is carefully documented. Another strength of the analysis is coordination with and use of other financial resources produced for the State. For example, one of the financial assumptions is that the share of State Highway Trust Fund revenue allocated to counties and cities will remain at current levels. In support, the PFA cites the Oregon Office of Economic Analysis predictions for a regional growth rate only slightly higher than statewide. This explanation not only 3 ECONorthwest was the primary consultant, with assistance from Kittleson and Associates.

38
addresses the assumption, but also why it is believed to be reasonable. An example of collaboration is that Urban Renewal Funds and private development revenues for road modernization projects were primarily developed through consultation with applicable local governments. Local revenues were forecast by year for the entire Metro region – these estimates were refined and extrapolated with the help of a financial technical assistance group. Throughout the development of this report, a finance technical advisory group, FINTAG, was convened as a subgroup of Metro’s MPO technical advisory committee known as the Transportation Policy Advisory Committee (TPAC). This group continued to guide the development of the information being collected for the report. For the Final RTP, the analysis from the PFA was used to identify revenues for various revenue categories by year (from 2007 – 2035) for six funding pools. The RTP presents the array of revenues sources identified for each of the pools based on historic use of the revenue sources and financial plans adopted by local governments. Exhibit IV-6 below presents the six funding pools, some of the funding sources contained in each pool, and key assumptions for that pool. For local government modernization funding pools assumptions, local modernization funding was disaggregated to four sub-districts on the basis of their proportionate population. Since the relative population between sub-districts changes annually, an approximate mid-point population for each sub-district was used, calculated at the average of population of the sub-districts between 2005 and 2035. Exhibit IV-6: Summary of Revenue Assumptions Investment Pool Funding Source
Examples Key Assumptions
ODOT Modernization Pool
Metro Region share of existing State and formula Federal funds excluding Federal funds allocated to local governments ODOT share of high priority projects and other discretionary grants in Metro region
Extrapolation of existing State and Federal revenues. 1-cent per year increase to State gas tax, with associated truck weight mile tax increases.
Regional Transit and Programs Funding Pool Assumptions
Metro Region CMAQ funds Metro Region Enhancement Funds Alternative Mode Share of Regional STP funds 5309 New Starts/Small Starts Grants and local match
New Starts and Small starts assumed for two transit capital projects comprising 60 percent of the total cost (40 % local match included). CMAQ- 80 percent from statewide CMAQ estimate, allocated to Alternative Mode Pool. Alternative mode share of STP funds using Metro Region STP funds forecast and assuming 25 percent to transit and regional programs.
Local Government Modernization Funding Pools
Metro Region STP Funds for Roads
75 percent to road modernization. Disaggregated to Portland and three counties on the basis of proportionate
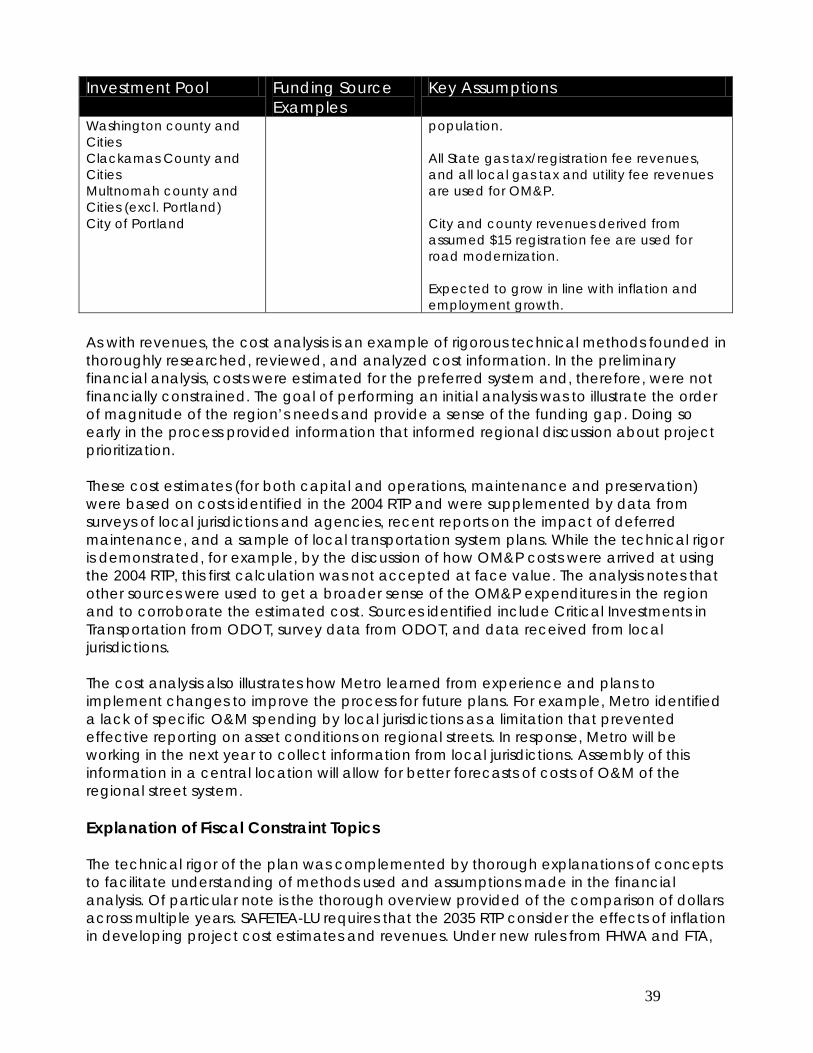
39
Investment Pool Funding Source Examples
Key Assumptions
Washington county and Cities Clackamas County and Cities Multnomah county and Cities (excl. Portland) City of Portland
population. All State gas tax/registration fee revenues, and all local gas tax and utility fee revenues are used for OM&P. City and county revenues derived from assumed $15 registration fee are used for road modernization. Expected to grow in line with inflation and employment growth.
As with revenues, the cost analysis is an example of rigorous technical methods founded in thoroughly researched, reviewed, and analyzed cost information. In the preliminary financial analysis, costs were estimated for the preferred system and, therefore, were not financially constrained. The goal of performing an initial analysis was to illustrate the order of magnitude of the region’s needs and provide a sense of the funding gap. Doing so early in the process provided information that informed regional discussion about project prioritization. These cost estimates (for both capital and operations, maintenance and preservation) were based on costs identified in the 2004 RTP and were supplemented by data from surveys of local jurisdictions and agencies, recent reports on the impact of deferred maintenance, and a sample of local transportation system plans. While the technical rigor is demonstrated, for example, by the discussion of how OM&P costs were arrived at using the 2004 RTP, this first calculation was not accepted at face value. The analysis notes that other sources were used to get a broader sense of the OM&P expenditures in the region and to corroborate the estimated cost. Sources identified include Critical Investments in Transportation from ODOT, survey data from ODOT, and data received from local jurisdictions. The cost analysis also illustrates how Metro learned from experience and plans to implement changes to improve the process for future plans. For example, Metro identified a lack of specific O&M spending by local jurisdictions as a limitation that prevented effective reporting on asset conditions on regional streets. In response, Metro will be working in the next year to collect information from local jurisdictions. Assembly of this information in a central location will allow for better forecasts of costs of O&M of the regional street system. Explanation of Fiscal Constraint Topics The technical rigor of the plan was complemented by thorough explanations of concepts to facilitate understanding of methods used and assumptions made in the financial analysis. Of particular note is the thorough overview provided of the comparison of dollars across multiple years. SAFETEA-LU requires that the 2035 RTP consider the effects of inflation in developing project cost estimates and revenues. Under new rules from FHWA and FTA,

40
the financial constraint of the RTP must be demonstrated in “Year-of-Expenditure” or YOE dollars. The careful treatment of comparing the value of dollars continues in the final analysis. The PFA acknowledges the challenges of dealing with dollar values in different years; specifically, to introduce the idea of constant dollars it discusses the idea that a dollar today is not the same as a dollar in future years, noting that $200 million would not buy the same amount of improvements today as in current 2035 dollars. The PFA also notes the complications of comparing dollars across years including:
• The issue of time-value of money • Difference in inflation for construction and the average rate of inflation • Risk associated with pledging a future stream of revenues.
The PFA then describes in detail how these challenges were approached. Construction costs, for example, are typically developed by estimating what it would cost to build today, without applying construction cost inflation and then discounting back to constant dollars. The analysis does not deal with the differentials of construction cost from the average rate of inflation—both because it is believed that construction costs are unlikely to grow at their currently high rate over the 29-year forecasting period and because it is believed direction of the effect is clear and the forecasts, even if otherwise perfect, will overstate the forecasted revenues for construction projects. In line with FHWA guidance, Metro selected a four percent annual inflation rate for the life of the plan. For financially constrained projects, cost estimates were inflated based on the time period for project construction to convert into YOE dollars. All forecasted revenues are shown in 2007 dollars, but YOE dollars are calculated for each of the six funding pools. Tables in the Technical Appendix 4 present the component funding sources included in the financially constrained forecast. Exhibit IV-7 (below) shows an excerpt of one of these tables. Exhibit IV-7: Excerpt of ODOT Modernization Funding Pool Funding Source Financially Constrained
Amount (millions) 2007 $ YOE $
Metro Region Share of Existing State and Federal Formula Funds excluding Federal Funds Allocated to Local Governments
$273.2 $453.00
ODOT Share of High Priority Project and Other Discretionary Federal Grants in Metro Region
$376.8 $689.90
Metro Region Share of New Revenues: Assumed for Analytical Purposes to be State Share of $15 Vehicle Registration Fee Increase for Modernization Every 8 Years beginning 7/1/09
$147.70 $301.10
OTIA $97.90 $108.10 Reprinted from 2035 Regional Transportation Plan, Technical Appendix 4.2, p. 2 Projects are reflected in YOE dollars for the last year of each estimated implementation time period (2017, 2025, and 2035). This is intended to reflect the costs of completing the project by the end of the time period. The YOE total was derived by applying the four percent inflation factor to the final year of each project based upon its estimated project implementation time period. For projects that fall into multiple implementation periods, the

41
total project cost was split evenly among the time periods and inflated by the respective time periods’ YOE dollars. Strategy Finally, the RTP financial component contains a strategic element intended to guide future actions to stabilize transportation funding in the region, including raising new revenue, by providing fiscal stewardship goals supported by proposed performance measures. The RTP identifies a regional investment pool expected to cost $16.12 billion, while reasonably anticipated revenue of only $9.07 billion is expected to be available. Exhibit IV--8 below shows the gaps by mode. Because of this gap between the fiscally constrained plan and the locally preferred system, Metro highlights the need for expanding potential revenue sources and promoting fiscal stewardship within the region. Exhibit IV-8: Comparison of Capital Costs and Revenues (2007 dollars)
Reprinted from 2035 Regional Transportation Plan, Final Draft for USDOT Review, p. 5-18 The plan notes that Oregon has no sales tax and has traditionally focused on bonding strategies based on future gas tax receipts and lottery funds at the State level, but has not developed a long-term strategy. The plan seeks to provide context supporting the room for growth in tax rates, Metro includes a chart (Exhibit IV-9 below) showing that Oregon auto taxes are among the lowest in the nation. Exhibit IV-9: Comparison of Oregon Auto Taxes with Nearby States
Reprinted from 2035 Regional Transportation Plan, Final Draft p. 3-12

42
The fundamental State requirement for the long range transportation plan is to develop a plan that serves planned land uses. The region must have a financing strategy that supports implementation of the land use plans. The State component of the RTP update is still underway and will further address key finance issues facing the region, including new funding strategies, enhanced public private collaborations, and stronger public support for seeking new revenue sources. Metro notes that system-level measures are no longer sufficient to determine whether investments lead to a safe, efficient, and reliable transportation system. As a part of strategy development, Metro began to include performance measures other than Level of Service in the 2000 RTP, which included modal targets and a special area of concern designation. Performance measures will be further defined for the State component of the next RTP update, but the Federal component provides a list of potential performance measures identified during its development. Development of a performance management process also satisfies benchmarks mandated by the Oregon Transportation Planning Rule (TPR). One of the objectives identified in relation to the goal of ensuring fiscal stewardship is “Stable and Innovative Funding,” which entails “stabilizing existing transportation revenue while securing new and innovative long-term sources of funding adequate to build, operate, and maintenance transportation system.” Potential actions identified for this objective are to:
• Implement investments that leverage other investment from governments or private business
• Develop innovative public and private partnerships to advance the long-term Region 2040 vision and establish appropriate revenue sources and financing mechanisms
• Develop a regional finance strategy and seek opportunities at the State and Federal levels to secure adequate and stable funding
• Define roles and responsibilities • Develop broad support for needed investments in transportation infrastructure and
resources for continuing operations, maintenance, and preservation of facilities. Finally, another strategic element was the development of potential performance measures for the fiscal stewardship goal. Included in these are:
• Percent of road maintenance and preservation needs funded at local and State levels
• New transportation funding sources secured beyond existing resources, including those forecasted as necessary for the financially constrained and illustrative systems
• Public and private commitments to pursue appropriate revenue sources. Conclusions Because of its transparent, rigorous, and outcome-oriented financial planning process, the 2035 update to the RTP exemplifies financial planning best practice. The financial analysis is noteworthy for its clarity and detail, both in providing information about the planning process and in translating complex concepts into accessible discussions for all audiences of the 2035 RTP. Moreover, in addition its technical rigor, the RTP is a strategic document, providing direction for future actions to stabilize transportation funding in the region,

43
including raising new revenue, through fiscal stewardship goals supported by proposed performance measures. References
• Preliminary Financial Analysis for the 2035 Regional Transportation Plan Update: http://library.oregonmetro.gov/files/rtp_preliminary_financial_analysisfinal.pdf
• Final Draft 2035 Regional Transportation Plan for U.S. DOT Review:
http://library.oregonmetro.gov/files/federal_2035_rtp_document.pdf
• Final 2035 Regional Transportation Plan: http://library.oregonmetro.gov/files//2035_rtp_final_document_as_submitted_to_dlcd_usdot_web.pdf
• 2035 Regional Transportation Plan Technical Appendix: http://library.oregonmetro.gov/files/2035_rtp_appendix.pdf
Contact Josh Naramore [email protected] Metro http://www.oregonmetro.gov/

Case Study: San Francisco Metropolitan Transportation Commission Overview The Metropolitan Transportation Commission (MTC) is responsible for transportation planning, coordinating, and financing in the San Francisco Bay Area region. MTC works under the guidance of a 19-member policy board, with a supporting staff of approximately 170 employees. Over time, Federal and State of California laws have given MTC an increasingly large role in arranging financing for transportation improvements, administering State funds, and setting priorities for the Federal and other sources of transportation funding. As the designated metropolitan planning organization (MPO), one of MTC’s responsibilities is regularly updating the long-range Metropolitan Transportation Plan (MTP). Following a two-year planning effort, on April 22, 2009, MTC adopted the most recent MTP, Transportation 2035 Plan for the San Francisco Bay Area: Change in Motion (Change in Motion).
In Change in Motion, MTC presents its vision for the Bay Area and specifies how $218 billion in Federal, State, and local transportation revenue will be spent in the region between 2010 and 2035. The plan is the result of partnerships and collaboration between MTC and area governments, businesses, neighborhood and civic organizations, groups concerned about transportation, the environment, and conservation, and individual members of the public. MTC places particular emphasis on the theme of change and notes that in the plan it is “looking ahead to a period of unprecedented change” with some of the changes being “extensions of trends that have been emerging for some time” and “abrupt departures from the trends we are familiar with.” In the midst of this climate of uncertainty, MTC strives to present a realistic, financially constrained vision for the San Francisco Bay Area. The plan stands out as an example of strong financial analysis, as illustrated by its approach to the examination of financial trends as a basis for projecting future conditions: the MTC planners not only examined historical growth trends of both traditional and nontraditional revenue sources; they strengthened the analysis with a supplemental study that included the following key components:
Regional Overview • 9 counties • 7,000 square miles • 7 million residents • 1,400 highway miles • 20,000 local streets and road
miles • 6 ports • 3 commercial airports • 8 primary transit operators • other operators

45
• Retrospective review of previous long-range plans and • Development of a risk model for project cost estimates.
This case study highlights these components of the supplemental analyses as a “best practice” in fiscal constraint. Approach to Financial Planning MTC’s Change in Motion strives to create a realistic financial picture for the region over the 25-year analysis period of the plan, and in doing so, goes beyond using specific funding sources to inform the fiscally constrained long-range vision. Fiscal constraint regulations governing the long-range MTP allow for some flexibility in determining reasonably available revenues to support transportation investments and in estimating expenditures to meet anticipated transportation needs. Project estimates in many MTPs are based solely on specific historical sources. Historically, MTC also used this approach in its financial analysis, but chose to incorporate supplemental analysis to augment the financial analysis for Change in Motion, including, at the recommendation of FHWA, a probabilistic risk analysis for project cost estimates. This best practice manifests itself in two ways – the inclusion of both “anticipated” but unspecified revenues and a risk assessment to estimate a risk contingency. Anticipated “unspecified” funding is included to “to strike a balance between past
practice of only including specific revenue sources currently in existence or statutorily authorized, and the more flexible Federal requirement of revenues that are reasonably expected to be available.”
Risk Assessment of cost estimates is performed to identify and quantify high risks for the
program of projects included in the plan and to determine the appropriate amount of funding reserve.
Financial analysis is included in three sections of the MTP. • Finances. Within this section of the Plan, MTC summarizes the Federal, State, and local
funding sources expected to be reasonably available, and carefully documents assumptions and data sources in the “Finances” section.
• Investments. Within this section of Change in Motion, MTC summarizes the investment needs, committed and discretionary funds, and subsequent shortfall, and also provides an overview of the local streets and roads and transit capital and operating needs analyses.
• Project Notebook. In a separate document, the Project Notebook, MTC provides a more detailed account of the methodology and revenue projection assumptions used to project reasonably available revenue sources, as well as the methods and assumptions used to estimate transportation system capital and operating needs, and details of the risk analysis.
Revenues

46
The Finance section includes an overview of reasonably available revenue sources and key assumptions used to project funding levels through 2035. MTC notes that the anticipated new surface transportation authorization could result in significant changes in Federal funding programs, but for the purposes of the financial plan, MTC uses best currently available financial assumptions to prepare the revenue projections. The highway program is therefore considered to continue in its current form and Federal revenue and most Federal sources are projected to grow at a nominal rate of four percent a year. Other funding source categories and some key assumptions are shown in Exhibit IV-10: (below).
In the financial plan, all anticipated revenue sources are characterized as committed or discretionary funds. MTC uses a three-step process to separate out the funds for which it has discretionary authority.
1) Prepare 25-year revenue forecasts 2) Determine funds that are committed by MTC policy 3) Subtract committed funds from total projected revenues
Exhibit IV-10 Funding Sources and Key Assumptions
Source Funding types Key assumptions
Federal
Highway and transit funding (ex. Surface Transportation Program, Federal Transit Administration Section 5307)
• Highway program to continue in current form. • A nominal 4% growth for most Federal sources,
determined by 15-year growth analysis.
State
State highway, transit, and rail funding from gas and sales taxes, bonds, and toll bridge revenues (ex. State gas tax subventions, State Transit Assistance, State-owned toll bridge revenue)
• State gas tax subventions (i.e., grants) and STIP maintain current structure and distribution formula.
• Bridge toll revenues based on projected travel
demand at varied annual rates between .3 and .5 percent over 25 years.
Regional and
Local
Highway, local road, transit, and rail funding from county and transit district transportation sales taxes, bonds, HOT lane and toll-bridge revenues (ex. Proposition 1A high-speed rail bonds, Golden Gate Bridge tolls, BART seismic bond proceeds)
• Local street and road revenues projected to increase based on historically-based average regionwide growth rate.
• County and district transportation sales tax
revenue measures set to expire not renewed. • Regional share of high-speed rail bonds based on
track mileage, revenue vehicle miles, and annual passenger trips data. Also includes estimate of high-speed rail project investment in the Bay Area.
Anticipated
Unspecified additional revenues that will become available over the course of the Transportation 235 Plan period (past ex. Traffic Congestion Relief Plan, nonformula Federal funds)
• Anticipated revenues projected forwarded at a 3% growth rate starting the sixth year of the plan.

47
Committed funds have been reserved by law for specific uses, or previously dedicated by MTC action or policy prior to the development of the Transportation 2035 Plan. Committed funds may include voter-approved funding mechanisms and certain State and Federal funds. Discretionary funds are unprogrammed funds, mostly State and Federal funds, available to MTC to fully fund existing projects or support new investments. Spending recommendations are focused on improving existing systems through operations, maintenance, and systems efficiency, with some support of strategic expansion. This approach seeks to optimize the existing transportation system, while making other key strategic expansion investments. The section also provides an overview of road maintenance and transit capital and operating costs over the 25-year analysis period. These overall system needs and the projected revenues are summarized in a table that includes “Total Need,” “Committed Funds,” “Discretionary Funds,” and “Remaining Shortfall.” The revenues expected to be available total $218 billion, while remaining identified need is projected at $49.4 billion. Expenditures Expenditures in the plan are broken down a number of ways to convey information about how investments are spread across modes, what function they serve, and how they relate to core regional concerns. MTC’s graphical representation of this information facilitates comprehension of relative magnitude of expenditures. The breakdown of plan expenditures helps to clarify the connection between expenditures and the core regional concerns of Economy, Environment, and Equity. MTC notes that investment decisions can have a major impact on core regional objectives: • Support public transit • Sustain the urban core • Foster focused growth • Support climate goals. Exhibits IV-11 and IV-12 show how MTC graphically represents investment decisions. MTC acknowledges, however, that the plan does not capture the modal “universe” of transportation spending, excluding airports, seaports, and private freight operations, which are predominantly privately operated and funded. The investment section presents a summary of discretionary funding and remaining shortfalls for the three categories of expenditure —Economy, Environment, and Equity—identified above as core regional concerns.
Exhibit IV-11 Expenditures by Function
Exhibit IV-12 Expenditures by Mode
Reprinted from Transportation 2035 Plan: Change in Motion, p. 35

48
Supporting documentation in the form of the Project Notebook provides a detailed breakdown and description of Plan finances and the process through with the revenues and expenditure needs were projected. The Project Notebook contains descriptions of each source of Federal, State, regional, and local funding for surface transportation. Regional toll roads and bridges and HOT lane networks are included. In addition to the written descriptions and more detailed explanation of assumptions and methods, the Project Notebook includes all assumptions for revenue projects in a concise table that provides information about the base year, data source, growth rate, assumption base, and baseline revenue. An excerpt of this table is shown in Exhibit IV-13 below. Funding for the plan comes from a variety of sources—Federal, State, regional, and local. As shown by the number of sources from which data were obtained, MTC coordinated with a range of organizations for data collection. Exhibit IV-13: Excerpt from Revenue Projection Assumptions Table Revenue Source
Revenue Projection Assumptions Baseline Revenue (millions)
AB 434 (Local Funds)
Base Year: FY2006-07 Data Source: Department of Motor Vehicles Annual Statistics; MTC/SAFE 2007 Annual Report Growth Rate: 1.84% annual average Assumption Base: Based on 20 years of historical data on growth in Bay Area vehicle registrations; assumes prescribed “local” share of 40%
$0.3
AC Transit Parcel Tax
Data Source: AC Transit Growth Rate: AC Transit estimates
$0.6
Anticipated Anticipated Base Year: 15-year annual average of unanticipated funds
Data Source: Bay Area shares of Proposition 42, Proposition 18, TCRP and Discretionary Revenue Growth Rate: 3% Assumption Base: Based on 15-year analysis of revenues generated for Bay Area transportation, but not expected and included in prior long-range plans
$12.9
Additionally, the Project Notebook contains detailed information on the transit operations and capital replacement financial analysis, as well as the local streets and roads financial analysis. For the transit financial analysis, transit operators provided MTC with system-wide and modal projections for operation and maintenance of existing transit service levels. MTC checked projections and assumptions for reasonableness and consistency, working with the transit operators to get any necessary clarification or additional information. Capital replacement and rehabilitation need projections are based on information from a database of the region’s transit capital assets, the Regional Transit Capital Inventory (RCTI). The RCTI includes replacement and rehabilitation lifecycles and costs for each type of asset. The local streets and roads analysis section details the projection methods for pavement, non-pavement, and local bridge needs. Pavement maintenance needs are projected with MTC’s pavement management system software, which uses pavement condition,

49
maintenance cost information, and decision trees to estimate the amount needed to maintain the network in a particular condition. MTC worked with consultants to develop a model to predict roadway non-pavement costs in a set of categories developed by MTC and a committee of public works representatives. Categories included: drainage, retaining walls, storm damage, pedestrian, and traffic safety needs. Finally, local bridge needs were estimated using the Pontis bridge management system software and data uploaded by Caltrans. The characteristics of financial analysis as outlined above are the major factors contributing to the realism of the Plan’s 25-year financial projection—in particular, the inclusion of unspecified but anticipated revenue streams and a risk assessment to calculate a risk contingent to add to expenditures. Attempting to forecast revenues over a 25-year period is a challenging undertaking for transportation planners. Many of the changes in transportation that brought us to where we are today would have been difficult to predict 25 years ago. However, while specific funding sources that will become available may be impossible to foresee, retrospective analysis may show that expectation of new sources is not unreasonable. Past performance is often an indicator of the future, and MTC seeks to account for future uncertainty by performing retrospective analysis of past long-range transportation plans. Unspecified, Anticipated Revenue Sources Historically, MTC practice has been to exclude all revenue sources from future projections except for specific sources that are currently in existence or statutorily authorized. In an attempt to strike a balance between this restrictive past practice and a more realistic interpretation of the Federal requirement concerning reasonably available revenues, MTC chose to address this issue using historical analysis of past long-range plans to attempt to quantify revenue that may reasonably be anticipated, but for which the source is uncertain. To determine “anticipated” revenues, MTC performed analysis of past long-range plan projections, including a review of unexpected revenues that had come to the region, but had not been anticipated or included in MTC projections before they occurred. Over a 15-year analysis period, the San Francisco Bay Area received an annualized total of approximately $400 million (in 2008 dollars). The sources of “unanticipated” funds include Traffic Congestion Relief Plan, Proposition 42, nonformula Federal funds, and Proposition 1B funding. For each source, MTC included only the amount distributed to the Bay Area. Based on this analysis, MTC concluded that it is reasonable to anticipate that additional anticipated revenues will become available to the region over the course of the plan and projected the $400m figure forward at a 3% annual growth rate, but excluded it from the first five years of the plan to be conservative. When preparing long-range MTPs, other MPOs can perform similar analysis on past long-range plans to identify additional revenues that may reasonably be expected to become available. This knowledge may play an important role in the creation of a long-term regional vision based on reasonable—but not unduly pessimistic – expectations of future funding. Risk Analysis

50
Uncertainty poses a challenge not only in relation to projecting revenue, but also for cost estimation. Recognizing this uncertainty and adjusting accordingly reduces error in the ultimate forecast. At the encouragement of the Federal Highway Administration (FHWA), MTC chose to address the issue of uncertainty in projecting cost estimates for individual projects. To do so, MTC worked with a consultant to develop a risk model to identify and quantify high risks for the program of projects and to determine the appropriate amount of funding reserve to include in the Transportation 2035 Plan. MTC modeled the risks associated with project costs, scopes, and schedules, taking into account project unknowns and unanticipated expenses. In December 2007, when MTC issued its call for transportation projects and programs for inclusion in the Transportation 2035 Plan, submittals were entered into a web-based form. To perform the risk assessment, MTC needed additional data for factors demonstrated by past experience, to have contributed to cost overruns, and incorporated the necessary fields into the web-based form. The additional data collected supported the risk analysis effort, but will also provide a wealth of additional data for future MTC activities. Exhibit IV-14 below shows an excerpt from the project application form. This additional information to be provided by project sponsors included:
• Detailed breakdowns of project costs o Support/engineering o Right-of-way capital o Construction capital o Transit procurement o Contingency set aside
• Types of environmental document for each project development phase • Types of right-of-way involved • Types of construction reviews completed • Types of transit procurement • Project complexity.

51
Exhibit IV-14: Transportation 2035 Project Application Excerpt
Reprinted from Transportation 2035 Plan: Change in Motion, Project Notebook, p. 6-5 In March 2008, MTC staff, supported by consultants, performed a cost review and risk assessment of expansion and operations projects proposed for consideration in the Plan. Basic cost, schedule, and project development information was extracted and put into a probabilistic risk model to calculate associated risks related to costs, scopes, schedules, and complexities. Based on this analysis of information provided by the sponsor, a risk score was identified and assigned to each project. Once this initial risk assessment was conducted, contingency estimates were developed and Monte Carlo simulations were performed to determine contingency for each investment type. Monte Carlo simulation is a method used to analyze complex problems by using random numbers and probability to simulate the various sources of uncertainty and determine an average value. Projects were grouped into one of four investment types: In construction, Committed, New Commitment, and Vision. The results of the Transportation 2035 Risk Assessment are summarized in Exhibit IV-15: Exhibit IV-15: Transportation 2035 Risk Assessment Summary (non-escalated, $ millions) Investment Type Project Count Project Cost Added Project Risk Project Cost Include
Risk In Construction 25 13,349.9 15.7 13,565.6 Committed 201 23,172.2 178.9 23,351.1 New Commitment 490 40,444.4 438.8 40,883.2 Vision 194 14,180.2 272.5 14,452.8 Total: 910 91,346.8 905.9 92,252.7 From Transportation 2035 Plan: Change in Motion, Project Notebook, p. 6-8 The risk assessment evaluation results showed that a majority of project sponsors did set aside sufficient project contingency for each development phase. Table IV-4 (above)

52
summarizes the results of the assessment. MTC concluded that evaluation results suggested a minimum risk contingency of $200 million would be appropriate to protect against cases where project risks might not be sufficient. This figure was included in the 2035 financial plan to cover any number of uncertainties, including cost overruns and schedule conflicts that may occur at the project level for nearer term projects.
Evolving Approach MTC will incorporate the lessons learned from recent experience as its approach to financial analysis continues to evolve and improve. The focus for the next plan is to make revenue assumptions more consistent with planning assumptions related to demographic change, fuel consumption, fuel prices, and other areas. Also, the discussion of “shortfalls” will be extended to address more specifically the affordability of system preservation and operations cost. In the next long range plan, MTC will be more explicit about what level of “state of repair” is being invested in, so there will not necessarily be shortfalls. Instead, the region may be accepting a specified level of state of repair. Conclusions In Change in Motion, MTC presents a financial analysis that is noteworthy both for its clarity and rigor, and for its approach to the uncertainty inherent over a long-range planning horizon. MTC uses the flexibility within the fiscal constraint regulations to create a more realistic future financial picture. In particular, two of the plan’s elements— a retrospective analysis to determine unspecified, but anticipated revenues, and a risk-model to enhance expenditure forecasts— are unique among metropolitan area long-range plans reviewed for best practices. References • Transportation 2035 Change in Motion – Main Page:
http://www.mtc.ca.gov/planning/2035_plan/ • Finances Section: http://www.mtc.ca.gov/planning/2035_plan/FINAL/3_Finances-
final.pdf • Project Notebook : http://www.mtc.ca.gov/planning/2035_plan/T2035-
Project_Notebook_web.pdf
Contact Alix Bockelman – Director, Programming and Allocation Metropolitan Transportation Commission http://www.mtc.ca.gov/

53
V. Statewide Long Range Planning Case Studies
Four statewide case studies are presented in this section, following the same format as the metropolitan area case studies:
• Colorado: Demonstrates how official authorization and coordination of financial planning statewide can enhance the consistency and reliability of financial planning for regional transportation systems. Also, analysis of alternative financial scenarios clarifies the trade-offs and consequences resulting from different policy priorities and investment decisions.
• Georgia: Provides an example of public involvement as an integral element of financial planning and rigorous revenue analysis and forecasting.
• Kansas: Demonstrates that a straight
forward, “no frills” analysis can provide the basis for high quality financial planning. This case study also illustrates how public engagement can help to establish funding priorities and strategies in response to limited financial resources. The examination of options and strategies for addressing projected budget deficits represents another strength of Kansas’ approach to financial planning.
• Oregon: Demonstrates integration of financial and policy analysis to an unusual degree, suggesting an expanded role of financial analysis in statewide long-range transportation planning. One aspect of this linkage between policy and financial planning is the initiative Oregon has shown in applying performance criteria to evaluate scenarios with a significant financial component.

Case Study: State of Colorado Overview Colorado has a statewide financial planning process that serves as the basis for the long-range statewide transportation plan. In addition, financial planning at the State level is integrally linked with the financial plans developed by MPOs for metropolitan areas within the State. The process of financial planning begins with revenue forecasting and resource allocation, approximately every four years prior to the development of the statewide transportation plan and the Statewide Transportation Improvement Program (STIP). The Colorado Department of Transportation (CDOT) incorporated financial planning as a central component of the Colorado 2035 Statewide Transportation Plan. An amendment to the 2035 Statewide Transportation Plan was adopted in May 2011 to address changes that had occurred since the plan was adopted in March 2008, most notably changes in financial conditions. The financial analysis was adjusted to reflect actual revenue data for 2008, 2009, and 2010, as well as legislative changes affecting two State funding programs. The plan amendment does not alter the financial planning methods used in developing the 2035 Statewide Transportation Plan, although the revenue forecasts for the years 2012-2017 have been updated.4 Colorado’s financial planning practice is notable in several respects, including its transparency and comprehensive inclusion of all modes, as well as the reasonableness of its expectations regarding the availability of future funding. Two characteristics stand out, however, above all others:
• Coordination of financial planning to produce statewide estimates of needs and revenues;
• Definition of alternative financial scenarios to clarify the consequences of different policy priorities and investment decisions.
Approach to Financial Planning
Colorado is exceptional in terms of the official standing of its financial planning process for the State’s transportation system. The Colorado DOT develops the forecasts, consistent with policies of the State Transportation Commission, which advises the Governor and General Assembly on transportation policy and has authority for adopting State Transportation Department budgets and programs. The financial analysis is a synthesis of Colorado DOT’s projections for the State programs it manages, combined with data collected from MPOs and local governments for other components of the multimodal transportation system. The forecasts address both capital improvements and preservation of the transportation system. Revenue projections include funding from Federal, State, and local sources. The Transportation Commission adopts official Resource Allocation Control Totals for CDOT managed funds that are applied to the statewide transportation plan and the STIP. The 4 Financial planning methods used in the 2035 Statewide Transportation Plan are documented in a technical report, Financial Assumptions, Revenue Needs, and Shortfalls. Additional information on the process, as well as revenue forecasts and allocations, are document in the 2035 Plan Amendment Resource Allocation.

55
control totals are used as a check on the consistency of the financial plans incorporated in the TIPs and metropolitan transportation plans produced by the State’s MPOs and their partner agencies. Thus, the financial planning process involves a high degree of coordination by the State and the MPOs. Moreover, technical and policy committees composed of representatives of CDOT executives, MPO board members, and technical staffs of multiple agencies participate in the process, assuring transparency and widespread knowledge and acceptance of the resulting forecasts. Thus, the products of the process serve as a foundation for transportation planning at both the statewide and metropolitan area levels. In addressing the balance of funding versus costs in the financial plan, Colorado considers three different scenarios: (1) Assume Forecast Revenue Only, limiting funding to reasonably expected to be available sources; (2) Sustain Current Conditions, including additional funding needed to maintain the existing transportation system performance; and (3) Implement Future Vision, incorporating improvements needed to achieve the performance goals established through the transportation planning process These three scenarios identify both the consequences of budget constraints and potential benefits of different levels of revenue and expenditure. Coordinated Statewide Financial Planning The assumptions underlying revenue forecasting for the 2035 Statewide Transportation Plan are based on official policies passed by resolution of the Transportation Commission for the 2030 Plan.5 The CDOT Executive Management Team worked in partnership with Transportation Commission and MPO board members, together with MPO and CDOT staff, on technical and policy committees that met over a six-month period to discuss methods for projecting revenue and allocating resources in the Plan. Policies established by the Transportation Commission apply to both revenues that are “Commission-directed” and “Non Commission-directed.” Revenue projections include all sources – Federal, State, local, and private, and the distribution of revenues among all modes – roadways (including non-motorized improvements), transit/rail, and aviation. An indication of the comprehensiveness of the process is that funding flows through different levels of government within Colorado are estimated, e.g., Federal funding to local governments for roadways and transit. The analysis accounts for local match, allowing only the levels of local match that can reasonably be expected, according to criteria that apply to all sources. These criteria are expressed in the Commission’s policies for revenue analysis and estimation, summarized below:
• Projections for existing and discretionary revenue sources are based on historic trends and are limited to expected levels under existing law and economic conditions;
• No new sources are assumed; • Matches for discretionary projects must come from regional, project-specific, or local
allocations; in the case of local match, governments must provide required match for Federal discretionary funds;
5 Transportation Commission Resolution No. 1212, October 16,2003

56
• Revenue projections are updated with each long-range plan update; • For revenues that are not Commission-directed, the same approach should be used
as for those funding sources that are Commission-directed; local jurisdictions should provide relevant information and guidance for financial planning at the regional level.
• STIP revenue projections are reviewed and compared to actual revenues annually and modification of fiscal constraint is considered if the differences exceed 10 percent.
The last policy above highlights another key attribute of the cooperative financial planning process in that the projections developed for fiscal constraint of the STIP are coordinated with the long-range projections for the statewide transportation plan. The revenue forecast is based on analysis of historical trends in State Highway User Tax Funds (HUTF) over the previous 15 years, including the amount of funding available to local governments. Regression models are used to estimate growth in the largest two revenue sources for the HUTF: the Motor Vehicle Fuel Tax and Motor Vehicle Registrations. The estimate of growth in local sources also reflects an extension of past trends. Similarly, the projections include estimates of local match for the STP Metropolitan, Transportation Enhancement, and Congestion Mitigation/Air Quality Program funding that are consistent with past rates of growth. Transit funding estimates are based on a comparable level of analysis. The estimated share of transit funding over the 28-year time span of the statewide plan is 23 percent. The relative contribution to total transit from local sources is 75 percent, including dedicated taxes, general fund contributions, and farebox revenues. Over 20 percent of transit funding is Federal and three percent is from a State program (SB 97-001) for strategic transit projects.6 The CDOT developed estimates of Federal transit funds based on a six-year historical average of allocations to Colorado Transportation Planning Regions. Transit taxing districts are the largest transit funding source in Colorado. The FasTracks initiative passed by voters in 2004 authorized an increase in the share of local sales taxes dedicated to transit. The availability of a reliable, dedicated source of local transit funding reduces the uncertainty associated with forecasting future revenue streams, as compared to other sources that are more dependent on the discretion of officials and competition with other types of public expenditures. Additional local funding sources include local government general funds, dedicated sales taxes, fares and user fees, service contracts, advertising revenue, and private business. The financial component of the statewide transportation plan includes aviation as well as surface transportation modes. While a majority of airports in Colorado are owned and operated by local governments, the primary source of airport funding is Federal and State grants. Colorado airports also can apply to the Colorado Aviation Fund for State discretionary funds. State and Federal aviation funding—the latter from the Federal Aviation Administration—is dedicated to aviation and cannot be used for funding other modes. The financial plan also includes loans from the State Infrastructure Bank (SIB), a source of innovative financing created by the State legislature in 1998. The SIB includes separate accounts for aviation and other modes. Thus, aviation is included in the 6 Transfers from SB 97-001 were eliminated in 2009 by SB 09-228. The funding provided by SB 97-001 was partially replaced by two new funding sources created by SB 09-228 and SB 009-108.

57
statewide plan even though aviation and surface transportation modes draw from different funding sources. The financial forecasts detail funding by source and by mode. Management systems are used to determine most of the State funding allocations to CDOT engineering regions, while formula-driven criteria are used for the distribution of funds to the MPOs for Colorado’s three TMAs—Denver Regional Council of Governments, North Front Range Metropolitan Planning Organization, and Pike’s Peak Area Council of Governments. CDOT engineering region allocation control totals include estimates of local funds, i.e., local match. Planned expenditures by CDOT region must match the allocation control totals. Financial Scenarios The costs of investments identified through system-wide needs assessment serve as the basis for defining three financial scenarios corresponding to different levels of funding:
• Assume Forecast Revenue Only • Sustain Current Conditions • Implement Future Vision.
System performance estimates are developed for each scenario. Thus, the three-way comparison of different expenditure levels demonstrates the impacts of constrained budgets relative to system performance in terms readily comprehensible to officials and the public: First, how much additional funding is needed to retain the current quality of transportation systems in the future? Second, how much additional funding is needed not only to sustain the performance of the transportation system at existing levels, but to attain the future vision for quality of life desired by Colorado’s population , as defined through State, regional, and local planning efforts? The Colorado DOT applies performance management systems to evaluate State highway, bridge, pavement, safety, and maintenance level of service conditions, assessing current data and projected conditions based on critical variables, such as age, maintenance level, and traffic volume. An assessment of local needs performed as part of the 2035 Statewide Transportation Plan is based on estimates that incorporate factors for local roadway unit costs, maintenance schedules, and minimum local roadway design standards. The assessment considers the current system backlog, in terms of meeting quality, mobility, and safety standards, future system preservation maintenance needs, and future system mobility needs. Methods for estimating transit needs conform to a framework set forth in the Regional Transportation Guidebook, applied by the State and other public agencies responsible for transit planning. Transportation Planning Regions (TPRs) and MPOs develop Local Transit Plans and Coordinated Human Services Plans under this framework in conjunction with their long-range plans. Transit Technical Advisory Committees, composed of representatives of the TPRs, MPOs, transit providers, local elected officials, CDOT, and members of the public, participate in the development of these plans. Needs are determined on the basis of demographic characteristics and unmet needs are defined as the difference between estimated demand and the level of service provided. Estimated transit financial needs are defined as the difference between fiscally constrained transit

58
components of regional and metropolitan area long-range plans and “preferred” or vision transit plans. The transit component of required Regional Transportation Plans includes an estimate of constrained revenue, cost to sustain the current level of transit service, and cost to complete preferred transit projects to meet the desired performance of a vision plan. The 2035 Statewide Transportation Plan included $28 billion in fiscally constrained transit projects carried forward from the Regional Transportation Plans. Transit providers throughout the State identify projects for inclusion in the vision component of the regional plans, which are then incorporated into the Statewide Transportation Plan. The Colorado Aviation System Plan, which identifies investments needed to meet current and future needs, serves as the basis for the aviation element of the Statewide Transportation Plan. The aviation element distinguishes fiscally constrained investments from unfunded improvements that are considered necessary to provide desirable levels of service. Inclusion of aviation systems as part of a statewide plan, with financial considerations, is unusual, and a strength. To assist the public in making sense of the large sums of money considered in the statewide transportation plan, cost differences for the constrained and sustained scenarios are presented on an average vehicle owner basis. The frame of reference illustrates the trade-offs among different levels of investment at a scale to which most people can relate. Conclusions The financial planning supporting Colorado’s Statewide Transportation Plan meets all criteria for financial constraint, even though financial planning for statewide transportation plans is optional under Federal regulations. The financial plan is thorough, documented clearly, and includes all modes, funding sources, and expenditures for system preservation, in addition to capital investments. The Colorado example sets a high standard in terms of the high profile and level of organization associated with financial planning/fiscal constraint. As documented in this case study, the Colorado DOT leads the financial planning effort through a process established under official policies at the direction of a Transportation Commission accountable to the Governor and the State legislature. The process coordinates development of the financial plan with the State’s Regional Planning Commissions and MPOs, resulting in a consistent set of forecasts for all agencies that is subject to a single set of control totals. The net result is financial plans for the State, regions, and MPOs that are transparent, reliable, comprehensive, and technically sound. Moreover, the financial element in the Statewide Transportation Plan is coordinated with the STIP, which is updated as necessary to reflect actual financial conditions. The use of scenarios capturing three different levels of expenditure is an effective means of addressing the ramifications of policies governing transportation funding. A financially constrained scenario demonstrates the results of limiting funding to sources that can be reasonably expected to be available. A sustainable scenario identifies the additional funding that would be needed to maintain the existing performance of the transportation system, and a vision scenario illustrates the costs of funding improvements needed to

59
meet the goals set for the multi-modal transportation system through integrated statewide, regional, metropolitan area, and local planning efforts. References
• Colorado 2035 Statewide Transportation Plan, Financial Assumptions, Revenue Needs, and Shortfalls, Technical Report: http://www.dot.state.co.us/statewideplanning/plansstudies/2035_SWP/Finance_Technical_Report.pdf
• Colorado 2035 Plan Amendment Resource Allocation:
http://www.coloradodot.info/business/budget/revenue-planning-and-resource-allocation/ResourceAllocation2035AmendmentFINAL.pdf/view Need new link.
• Colorado 2035 Statewide Transportation Plan Amendment: http://www.coloradodot.info/programs/statewide-planning/2035_Plan_Amendment_FinalFeb_2011_with_Appendices.pdf Same here.
• Colorado 2035 Statewide Transportation Plan: http://www.coloradodot.info/programs/statewideplanning/documents/2035%20Statewide%20Transportation%20Plan.pdf And here
• Colorado 2035 Resource Allocation: http://www.coloradodot.info/business/budget/revenue-planning-and-resource-allocation/Doc%203-13-07%20-%20Resource%20Allocation%202008-2035.pdf/view
Contacts Jeffrey Sudmeier – MPO & Regional Planning Manager Division of Transportation Development Sandi C. Kohrs – Branch Manager, Planning and Performance Colorado Department of Transportation http://www.coloradodot.info/

60
Case Study: State of Georgia Overview The 2005-2035 Georgia Statewide Transportation Plan (GSTP) has a practical perspective that focuses on determining the asset management and capacity expansion needs of the State’s transportation systems, rather than new policy directions. The purpose of the 2005-2035 GSTP is to document existing conditions and to assess infrastructure conditions and corresponding investment needs in relation to available funding expected over a 30-year time period. The current GSTP is the third update of the statewide plan prepared by Georgia Department of Transportation (GDOT) in the past 10 years and is intended to serve as an update of programs, following upon a major update completed five years ago. The GSTP is an example of two elements of financial planning best practice: (1) public involvement as an integral element of financial planning and (2) rigorous revenue analysis and forecasting. With respect to public involvement, the outreach effort conducted in support of Plan development included specific activities to collect information on public priorities related to financial planning. Most notable were two techniques used to assess public opinion:
• The use of comment forms distributed at two public meetings to determine funding priorities of participants and
• Break-out exercises conducted at community workshops, in which participants assigned rankings to funding allocations by mode and type of need.
Complementing the innovative approach to public involvement in financial planning was the technical quality of the revenue analysis and forecasting performed for the Plan. This analysis was distinguished by its detail, clarity, and comprehensiveness. Specific notable characteristics are as follows:
• Detailed identification of individual revenue sources for all sources and modes • Documentation of historical trends and existing funding levels • Documentation of the basis for determining funding levels • Cautious, reasonable, and transparent assumptions about future growth.
These features are discussed below in relation to the purposes of the GSTP and their significance for long-range statewide transportation financial planning. Approach to Financial Planning A primary focus of the GSTP is estimation of future transportation needs, particularly in relation to the highway network. Original “needs” analysis for other modes is limited and the plan relies on the compilation of planning results for other modes from multiple sources. Nevertheless, the plan has a strong multimodal perspective, integrating the results of metropolitan area level and transit agency plans effectively to synthesize financial planning for public transportation services, aviation, pedestrian and bicycle facilities, and freight movement, in addition to highways.

61
In addressing highway needs, the plan draws on asset management systems to assess preservation needs of existing infrastructure, coupled with capacity analysis as a basis for estimating the need for facility expansion. Together, these components provide the foundation for projecting capital investment “needs” over the timeframe of the plan. Highway cost estimates incorporate the results of the Georgia DOT’s Pavement Condition Evaluation System (PACES), bridge condition assessment, and safety statistics. Safety and congestion levels serve as primary indicators of existing needs for facility expansion. In contrast, while the scope of the plan is multimodal, encompassing transit, pedestrian, bicycle, maritime transportation, and aviation facilities, as well as highways, cost estimates for non-highway modes are based primarily on existing metropolitan area and modal agency transportation plans. To forecast future needs, the GSTP includes a significant economic forecasting component that serves principally as a factor in forecasting growth in highway Vehicle Miles Traveled (VMT). While transit-related projections of need are almost exclusively produced through independent planning efforts, as noted previously, an exception is that the GSTP development effort produced an original projection of transit expansion in rural areas by extrapolating current per-capita service levels to areas with growing populations. Georgia’s MPOs include a specific list of bicycle and pedestrian improvements, which are incorporated into the financial estimates of the GSTP and are designed into highway projects. The framework for the financial analysis is a comparison of costs to funding that is reasonably expected to be available for two future conditions: No-Build versus Build/Financially Unconstrained. The No-Build condition, which is presented only for illustrative purposes, provides for essential expenditures on system preservation but no new capital expenditures to expand highway capacity or transit service. The Build/Financially Unconstrained scenario represents the funding necessary to pay for all the transportation plans and programs of the State, metropolitan area and modal agencies, counties and cities. The analysis of funding sources is particularly noteworthy as an effective practice, reflecting a thorough, comprehensive assessment of individual funding sources for all modes. As with the analysis of costs, the GSTP draws upon the prior revenue projections of metropolitan transportation plans, but builds upon these components with a comprehensive analysis and forecast of future sources of public funding and, in the case of transit, user-generated revenues. By comparing the cost of the Build/Financially Unconstrained condition to projected funding by mode, the plan identifies additional future funding needs—or deficits in the absence of new funding. Public Involvement in Financial Planning Development of the GSTP included an extensive public outreach effort consisting of general public meetings, stakeholder advisory meetings, and public workshops. Including a specific focus on financial issues in this process represents a departure from the norm in its attempt to draw the public into an aspect of planning that often is viewed almost entirely as a technical activity.

62
One of the two techniques used to assess public funding priorities was the inclusion of a section on this topic on comment cards distributed at two rounds of public meetings conducted at three locations distributed across the State. Planners performed a quantitative analysis of the public responses reported on a total of 47 comment cards returned by participants at these meetings. Priorities were analyzed in terms of both mode and “need” or objective (e.g., mobility, economic development, environmental protection). A summary of results, reproduced below, was presented in graphic form. Figure V-1 Public Funding Priorities by “Need”
Reprinted from 2005-2035 Georgia Statewide Transportation Plan, p.2-22 Figure V-2 Public Funding Priorities by Mode
Reprinted from 2005-2035 Georgia Statewide Transportation Plan, p.2-21

63
The second public involvement technique consisted of interactive exercises conducted in break-out groups as part of a transportation workshop held after the completion of a statewide needs assessment. Workshop participants addressed the same issue as those completing the comment cards: assigning funding priorities by mode and transportation “need.” The responses to the public outreach effort were considered in setting priorities for applicable funding categories, i.e., funding for which the Georgia DOT has discretional authority. In addition, the public priorities emerging through this effort serve as a check on the allocation of transportation funding generally. Although the opinion sample is small, the initiative demonstrated by this effort represents a possible starting point that other states and MPOs can expand and adapt in developing their own long-range transportation plans. Revenue Forecasting The revenue analysis and forecasting approach applied in developing the GSTP includes all transportation modes at a sufficient level of detail to provide a credible representation of the financial condition of the State’s transportation system, now and over the timeframe of the GSTP. When compared to the projections of the costs associated with meeting future needs, the quality of the revenue forecasts supports realistic assessment of future limits and provides a basis for identifying unmet funding needs and formulating a plausible financial strategy that may involve spending cuts or expansion of funding resources. Thus, this effective practice in revenue analysis is central to the purposes of statewide long-range financial planning. One notable characteristic of the revenue analysis is the detailed identification of individual revenue sources for all sources and modes. The analysis methodically itemizes existing funding from Federal, State, and local sources, as well as transit fares, relating these individual sources to specific modes. Sources are shown in Exhibit V-1:

64
Exhibit V-1 Transportation System Funding Sources
• Federal
o FHWA: Funding appropriations in SAFETEA-LU Interstate Maintenance, National Highway System, Surface Transportation Program, Bridge, Congestion Mitigation and Air Quality Improvement, Program, Equity Bonus, Appalachian Development Highway System, Recreational Trails, Metropolitan Planning, Rail-Highway Crossings, Highway Safety Improvement Program (HSIP), Safe Routes to School
o Federal Transit Administration (FTA): Funding appropriations in SAFETEA-LU Formula Programs – Section 5307 Urbanized Area, Section 5309 Fixed Guideway Modernization, Section 5311 Non-Urbanized Area, Sectioin 5310 Elderly and Persons with Disability, Section 5316 Job Access and Reverse Commute (JARC), Section 5305 State Planning/Section 5303 Metropolitan Planning Discretionary Funds – Section 5309 Bus Capital and Section 5309 New Starts
• State o State Motor Fuel Taxes o General Fund Appropriations
• Local o Local General Fund Appropriations o Special Purpose Local Option Sales Taxes ( SPLOST)
• Transit and Passenger Rail Local Revenues o Farebox Revenues o MARTA 1% County Sales Tax o Municipal and County General Funds o Special Local Option Sales Tax Revenues o Property Tax Assessments
The methods used to project future funding are conservative and explained clearly. The distribution of both FHWA funds and FTA formula funding are based on SAFETEA-LU allocations. The projections for FTA New Starts funding are for several Bus Rapid Transit projects included in the Constrained Scenario of the Atlanta Regional Council’s Mobility 2030 Plan. Additional funding for projects included in ARC’s unconstrained Aspirational Plan is excluded from the GSTP. Historical patterns dating back to 1981 were examined and used as a basis for projecting future motor fuel tax receipts. This analysis included a regression of the relationship between the motor fuel tax and VMT. Motor fuel tax revenues are the source of funds to repay bonds used to fund the transportation program. Local revenues for highway needs are forecast on the basis of historical FY 1995-2002 allocations as reported in FHWA’s Highway Statistics, differentiating outlays for capital and operating expenditures. Funding from most sources is assumed to grow at the modest rate of the Highway Trust Fund.

65
Projections of local funding for transit, with the exception of MARTA sales tax levies, are based on existing expenditure patterns and adopted MPO plans. MARTA sales tax forecasts and farebox revenues are based on historical trends, while commuter and intercity rail farebox revenues are from Georgia Rail Passenger Program estimates. Conclusions The GSTP provides a good example of a careful and credible analysis produced to address financial issues at the statewide level. The revenue analysis, in particular, reflects a skillful integration of data and estimates from different sources, with effective application of historical patterns to project future trends. The inclusion of all modes is a notable strength of the analysis. Development of the GSTP also is noteworthy in relation to the effort to incorporate public involvement in financial planning. While the actual impact of public involvement is indirect and general in this example, the concept—as well as the specific techniques used—can be considered for further development and more direct application in shaping funding priorities through the transportation planning processes of other States and metropolitan areas. References
• Georgia 2005-2035 Statewide Transportation Plan: http://www.dot.state.ga.us/informationcenter/programs/transportation/Documents/swtp/SWTP_final_report_feb_2007.pdf
Contact Tom McQueen, AICP – Assistant Statewide Planning Administrator [email protected] GDOT Office of Planning http://www.dot.state.ga.us

66
Case Study: State of Kansas Overview The Kansas DOT (KDOT) developed the Kansas Long-Range Transportation Plan 2008 (LRTP) through a process that combined systematic technical analysis with an extensive public involvement effort. The time horizon of the LRTP is 20 years and the plan is designed to meet SAFETEA-LU requirements. Like many statewide long-range plans, an assessment of the current condition of facilities and performance of transportation services forms the core of the technical analysis, providing the basis for estimating system needs. The gap between the estimated expenditures associated with addressing those needs and expected revenues represents unmet needs – or additional needed revenue. This gap and strategies to eliminate the expected revenue shortfall are the major focus of the LRTP. Thus, financial planning can be viewed as the focus of the Plan. While several of the other case studies involve more complex, detailed technical methods, the Kansas example demonstrates that a straight-forward, transparent analysis can provide the basis for high quality financial planning. In addition, development of the LRTP illustrates how public engagement can help to establish funding priorities and strategies in response to limited financial resources. By responding to the feedback received during the planning process, Kansas was able to shape a supportable plan and secure additional State funding for transportation preservation and improvement programs. The thorough consideration of future funding challenges, particularly the expected decline in revenues due to the effects of inflation and the examination of options for addressing this pending problem, represents another strength of Kansas’ approach to financial planning that other states may find instructive. Approach to Financial Planning The LRTP’s “needs” assessment involves methodical review of performance indicators for all categories of roadways and a combination of sources and original analysis for other modes, as follows:
• State highways: In developing the LRTP, expenses for five categories of needs were calculated: fixed costs and operations, road preservation, bridge preservation, modernization, and capacity improvements. Growth in fixed costs, which include debt service, are estimated from historical trends. Standard ratings indicators are applied to estimate road and bridge preservation needs and modernization needs are derived from an assessment of road mileage with deficiencies compared to modern design standards, on the existing system. Capacity expansion needs were estimated through a combination of an assessment of congested mileage based on historical rates of traffic growth and specific planned improvements.
• Local roads: A local roads needs cost index was constructed based on truck counts
and future projections, coupled with qualitative information obtained from local highway stakeholders and, in urban areas, metropolitan transportation plans. The index was applied to historic construction and maintenance costs.

67
• Public transit: The analysis was divided into four categories: metropolitan, rural transit, and intercity rail and bus. The primary source of information on urban public transportation systems was the metropolitan transportation plans prepared by the state’s MPOs. KDOT projected rural transit needs for the LRTP using methods recommended by the Federal Transit Administration and then estimated costs by applying average cost per rider to demand projections. Funding for rural services is exclusively from non-profit agencies and was assumed to remain at existing levels. Intercity rail transit and bus cost estimates were drawn from recent studies and reports. No funding sources have been identified for intercity transportation services and expenditures were recorded in the plan as deficits.
• Aviation: Estimates of needs and corresponding costs were drawn from two existing
studies and records of continuing expenditures. Funding was held constant for three existing funding sources and a fourth source was assumed to expire.
• Rail freight: Public funding for railroads in Kansas is limited to safety improvements,
such as grade crossings, and infrastructure and rolling stock investments for short-line rail operations. Needs corresponding to these categories were estimated using existing data and studies, historical trends, and systems performance data and then were checked against the estimated Kansas share of national needs in a nationwide report by the American Association of State Highway and Transportation Officials. Funding was held constant for continuing sources.
• Bicycle and Pedestrian Systems: Needs were estimated from metropolitan area
transportation plans and applications for State-administered Surface Transportation Program Enhancement Programs. Historical Transportation Enhancement expenditures were the basis for projecting future funding from that program. A fixed amount per year ($2 million) also was projected to be provided through funding for highway improvements, which sometimes include bicycle-lane striping or sidewalks.
The total estimated annual cost of meeting system needs is estimated to be $2.9 billion in 2006 dollars, compared to estimated annual revenue of about $1.4 billion, yielding a gap of $1.5 billion, due in significant measure to the projected cost inflation of 2.8 percent per year, compared to annual revenue growth of only 1.7 percent. These technical analysis results, which are summarized in simple bar graphs that illustrate needs, revenues, and the gap that separates them (Figure V-3), are the primary focus of a multi-faceted outreach effort to elicit public priorities for allocating transportation funds and increasing revenues. Public Involvement in Financial Planning The KDOT conducted a year-long “dialogue” with over 120 Kansans to develop the LRTP; to a large extent this process was devoted directly or indirectly to financial issues. Participants in this extended process included government officials, both elected and professional staff; economic development interests and private businesses; transportation planners; and transportation service providers.

68
Figure V-3 – Funding Gap
Graphic reprinted from Kansas Long-Range Transportation Plan 2008, Chapter 5, p.55.
One of five topical working groups contributing to this effort addressed funding and finance. Over 40 stakeholder meetings were held throughout the state, complementing the efforts of the working groups, and more than 400 stakeholders attended public meetings conducted to review the recommendations emerging through the LRTP development process. As described in the LRTP: “Two points were raised in nearly every discussion during the development of the LRTP: the gap between future transportation needs and projected revenues and the need for KDOT to develop a more strategic, flexible and responsive approach to decision-making.”7 The working groups discussed priorities and tradeoffs for different investment decisions and stakeholders participated in a tradeoff exercise that involved allocation of funding under two scenarios: one in which no new transportation revenues would be available beyond KDOT’s 20-year projections and another in which revenues were increased by 30 percent. Through this exercise, planners were able to discern participants’ spending priorities given expected budget constraints and for an alternative scenario providing for additional expenditures on “needs” identified through the planning process. Public engagement contributed to the formulation of a series of recommendations to address continuing challenges identified through the long-range planning process. A number of recommendations concern modal-specific funding issues. For example, a recommendation concerning local roadways is to make it easier for
local governments to use Federal funding, by providing State Transportation Revolving Funds for local match and allowing local governments to “pool” or swap Federal funding. In the case of public transit, one recommendation is for KDOT to
7 Kansas Long-Range Transportation Plan 2008, Executive Summary, p. ii.

69
“assess state formulas for distributing transit funds and [to] consider additional factors such as ridership.” 8 In addition, seven recommendations address “General Transportation Funding,” as shown in Exhibit V-2 below. The public engagement process also highlighted stakeholders’ interest in linking transportation investments (particularly highway investments, which make up the vast majority of project expenditures) to the economic priorities of the State. Through subsequent intensive engagement work, the Kansas DOT revised the previously data-driven project selection process, which emphasized only engineering factors like safety, pavement condition and truck traffic, to include three broader factors. Those three factors and corresponding weights include: engineering factors (50 percent); projected economic impact (25 percent) and regional input (25 percent). This revised selection process allowed KDOT to give more explicit consideration to the link between transportation investment and economic impact and also to demonstrate that the KDOT was, indeed, taking stakeholders’ regional priorities into consideration. The Kansas DOT considers the shift in emphasis from an exclusive focus on engineering factors to the inclusion of economic impact and regional input as being instrumental in the 2010 Kansas Legislature’s approval of T-WORKS, a 10-year transportation funding package that makes more than $2 billion available in new revenue for the Kansas Department of Transportation.
8 Ibid, p.7.
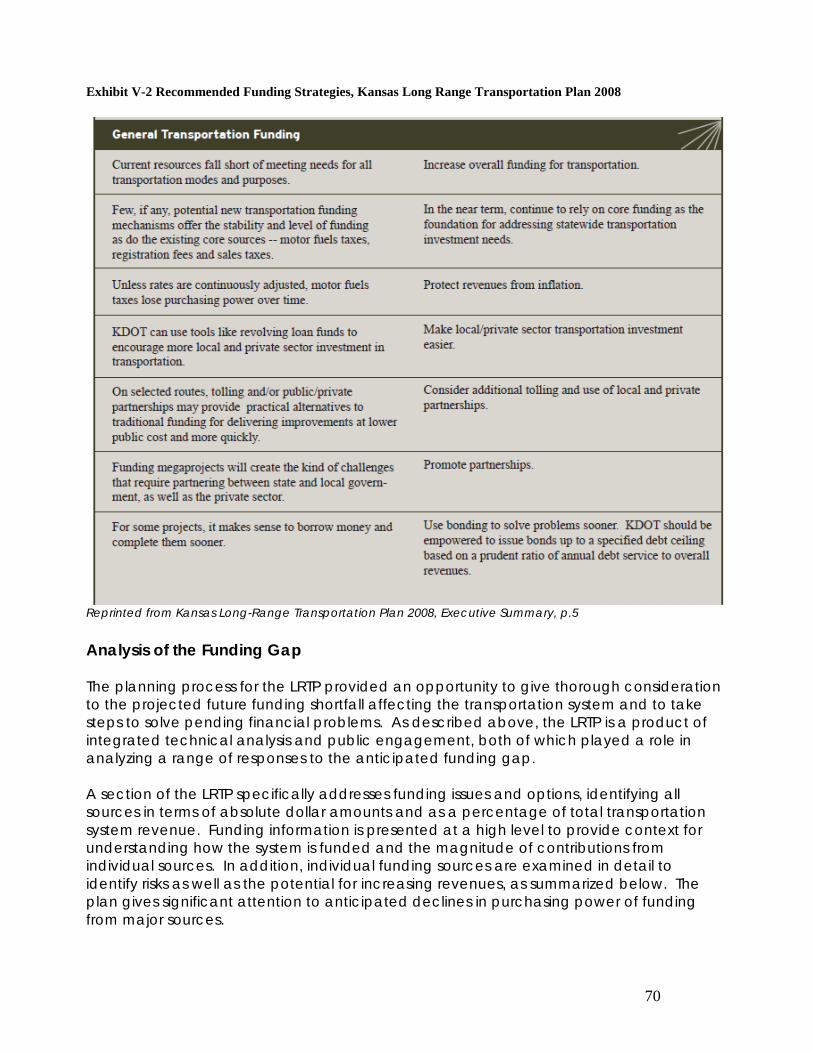
70
Exhibit V-2 Recommended Funding Strategies, Kansas Long Range Transportation Plan 2008
Reprinted from Kansas Long-Range Transportation Plan 2008, Executive Summary, p.5 Analysis of the Funding Gap The planning process for the LRTP provided an opportunity to give thorough consideration to the projected future funding shortfall affecting the transportation system and to take steps to solve pending financial problems. As described above, the LRTP is a product of integrated technical analysis and public engagement, both of which played a role in analyzing a range of responses to the anticipated funding gap. A section of the LRTP specifically addresses funding issues and options, identifying all sources in terms of absolute dollar amounts and as a percentage of total transportation system revenue. Funding information is presented at a high level to provide context for understanding how the system is funded and the magnitude of contributions from individual sources. In addition, individual funding sources are examined in detail to identify risks as well as the potential for increasing revenues, as summarized below. The plan gives significant attention to anticipated declines in purchasing power of funding from major sources.

71
• State motor fuels taxes – This is the largest source of funding for the multi-modal transportation system. The LRTP compares the fuel tax rate to national and regional averages, discloses the yield, in terms of revenue for each 1 cent of tax, and reviews historical patterns of taxation rates. In developing the plan, KDOT gave serious consideration to the question of the stability of motor vehicle tax revenues as the vehicle fleet becomes more fuel efficient. This is a concern shared by many State DOTs. Planners concluded that tax revenues will not decline as a consequence of this factor for at least 15 years. Thus, the anticipated decline in purchasing power from this source is due largely to the effects of inflation without compensating increases in the tax rate.
• State sales taxes – The LRTP reviews historical growth and allocation patterns and also identifies associated constraints. The sales tax is the only current revenue source projected to grow faster than inflation.
• State bonding – The assessment of this source considers current and future debt levels resulting from existing obligations and the potential to fund future expenses through bonding. State transportation bonds are backed and serviced by appropriations from the State General Fund. 9 Debt-service-to-revenue ratios are considered as a constraint on future borrowing and are compared to other states, as a frame of reference. The savings made possible by prudent debt management are considered.
• Federal funds – The flow of funds from the Federal Highway Trust Fund and the Federal Aviation Trust Fund to the State, transit agencies, and local airports is tracked and the status of these sources is reviewed. In projecting future funding for the LRTP, KDOT assumed a conservative rate of 1 percent annual growth in Federal funding sources.
• Local funds – The LRTP traces the flow of funds to city and county governments from different sources, including bonding. A 30 percent drop in purchasing power from this source is projected, due to inflation without corresponding growth in revenues.
• Tolling – The Kansas Turnpike is the only toll road in the state. The potential for additional tolling is limited due to low population densities and traffic volumes throughout much of Kansas, although stakeholders participating in development of the LRTP advocated consideration of additional tolling opportunities.
The Funding and Finance Topical Working Group led LRTP participants through a review of existing and potential strategies to address unmet funding needs. Potential mechanisms considered for increasing revenues include:
• Motor Fuels Taxes: Increase current tax; index motor fuels tax; sales tax; petroleum franchise tax
• Vehicle-Related Taxes: Increase current vehicle registration and license fee; dedicated transportation excise tax on vehicle sales; sales tax on automotive related parts and supplies; vehicle personal property tax
9 A sales tax is a major source of revenue for the State General Fund.

72
• Tolling, Pricing, Other User Fees, Public/Private Partnerships: tolling new roads and
bridge; tolling existing roads; raise existing tolls on the Kansas Turnpike; HOT lanes, express toll lanes, truck toll lanes; sales of assets/concessions; vehicles miles traveled fees
• Local/Project Based Mechanisms: dedicated property taxes; beneficiary charges/value capture (impact fees, transportation development districts); local option vehicle or registration fee; local option sales tax; local option motor fuel tax; local option income or payroll tax
• Others: dedicated portion of State sales tax; general fund transfers
• Financing: bonding; revolving loan funds. Stakeholders rated the viability of these potential funding mechanisms on a three-point scale (high, medium, or low). Planners assessed impacts in terms of magnitude of revenue-generating potential, administrative hurdles, and possible adverse economic impacts to specific industries or population groups. In addition, the analysis included a review of the experiences of other States with similar measures. Conclusions KDOT’s approach to financial planning for the LRTP 2008 has the potential to be broadly applicable in many other states. Noteworthy attributes include:
• Focus on essentials, specifically future financial “needs” versus reasonably expected funding
• Conservative revenue forecasts • Active public engagement in financial planning and integration of public
involvement and financial technical analysis • Development of a fiscally-constrained plan • Serious consideration of options for addressing funding shortfalls.
Another important characteristic of the statewide planning process is its multi-modal perspective, particularly considering the context of Kansas as a largely rural State with only a few, relatively small metropolitan areas. While the statewide perspective may differ from that in more urban states, the LRTP accords significant, balanced emphasis to public transit, as well as rail freight, aviation, and non-motorized transportation. The Kansas example illustrates how financial planning initiated as an element of the statewide long-range transportation plan can provide an impetus to systematic, cohesive assessment of goals and priorities for the transportation system throughout the state. The practical perspective demonstrated provides a manageable model for dealing with myriad, complex technical challenges within a participatory planning framework. A lesson from the Kansas experience is that financial planning—when presented coherently—can provide a focus for public involvement in setting investment priorities and developing funding strategies. Moreover, more direct public engagement in this process has the potential to produce a plan that can generate the legislative support necessary to secure funding for critical transportation needs.

73
References
• Kansas Long-Range Transportation Plan 2008: http://www.ksdot.org/lrtp2008/ Contact Lindsey Douglas, Chief of Governmental Affairs [email protected] Kansas Department of Transportation http://www.ksdot.org/
74
Case Study: State of Oregon Overview Financial analysis is a key component of the long-range statewide 2006 Oregon Transportation Plan (OTP). The plan establishes broad policy directions for the state’s multimodal transportation system over a 25-year period and evaluates alternative strategies for achieving future goals: mobility and accessibility; management of the system; economic vitality; sustainability; safety and security; funding the transportation system; and coordination, communication, and cooperation. The strategies considered explicitly account for financial constraints and several investment scenarios directly address the consequences of different levels of funding. The OTP responds to SAFETEA-LU requirements and planning factors. In addition, Oregon Administrative Rule 660-012-0030 (a portion of the State Transportation Planning Rule) requires the assessment of State, regional, and local transportation needs. State needs are defined as “movement of people and goods between and through regions of the state and between the state and other states.” The plan identifies the gap between needs and revenues to determine additional funding needs and priorities. The emphasis of the plan is on developing a foundation for achieving the State’s future transportation vision. This effort involves anticipating and responding to existing and future challenges related to the transportation system, including growth in population, increasing vehicle-miles traveled (VMT), globalization of the economy, climate change and other environmental conditions relevant to transportation, safety, security, and uncertainty regarding future fuel supplies and prices. One of the principal challenges identified is the need to expand the range of available funding options, due in part to the anticipated long-range trend of decreasing real-dollar motor vehicle fuel tax revenues10. A significant component of the plan consists of the analysis of scenarios involving policy choices, such as the impacts of relaxing existing land use restrictions, investing in operational improvements instead of capacity expansion, and roadway pricing. An additional scenario captures the impacts of high growth in fuel prices. Three investment scenarios also were considered representing different levels of expenditure for maintaining and improving the multimodal transportation network. Oregon‘s financial planning process demonstrates integration of financial and policy analysis to an unusual degree, suggesting an expanded role of financial analysis in statewide long-range transportation planning. One aspect of this linkage between policy and financial planning is the initiative Oregon has shown in applying performance criteria to evaluate scenarios that have a significant financial component. Approach to Financial Planning The OTP’s financial considerations rest on a foundation of needs analysis. A critical analysis concept is “feasible” need, defined as the funding level that would “maintain the 10 Since adoption of the 2006 Oregon Transportation Plan, the motor vehicle fuel tax has been raised by 6 cents and fees were increased during the 2009 Legislative Session.

75
[transportation] system at a slightly more than current” condition, with preservation of the existing system and implementation of improvements to bring facilities up to standard or to expand capacity “in a reasonable way.”11 Most estimates of the costs of meeting feasible needs are drawn from existing agency and program plans, including modal plans, capital improvement plans, and master plans. The OTP compares annual levels of expenditure required to meet feasible needs, as defined above (i.e. the existing transportation system with minor condition upgrades), with the current level of expenditures, to identify the annual funding gap, as summarized in Figure V-3 below, reproduced from the OTP. Exhibit 5-3 Summary of 2005-2030 Modal Needs and Growth Forecasts (Average 2004 dollars in millions)
Mode Forecasted Annual Growth Rate
Current Annual Expenditures
Annual Average Feasible Needs
Annual Gap
Air Freight and Passenger 2.62% - freight tons 2.40% - passengers
Portland International Airport $44.4 $115.3 $70.9
Major Modernization $13.9 $15.1 $1.2
Other Airports—Modernization and Preservation
$10.7 $47.4 $36.7
Intermodal Connectors 1.35% - total hwy.travel N/A $11.3 N/A
Local Roads and Bridges
Reflects State highway program and public transportation growth rates
$71.8 $1,000 - $1,200 $282 - $482
Natural Gas and Petroleum Pipelines N/A N/A N/A
Ports and Waterways
0.97% - deep draft freight 0.29% - shallow draft freight
$51.3 $56.2 $4.9
Public Transportation 3.16% - ridership $510 $812 $302
Rail Freight and Passenger 1.83% - freight tons 3.60% - passengers
Private Rail Facilities More than $6.7 $18.8 N/A
Passenger Rail $4.8 $9-$57 $4.2 - $52.2
Safety Programs $1.6
State Highway-Related Programs
1.35% - total hwy travel 1.35% - pass. hwy travel 1.40% - freight hwy travel
$786.5 $1,277.5 $490.9
11 2006 Oregon Transportation Plan, Summary of Financial and Technical Analyses, p.82.

76
Mode Forecasted Annual Growth Rate
Current Annual Expenditures
Annual Average Feasible Needs
Annual Gap
Transportation Options Program $2.8 $3.6 $0.8
Total N/A $2.2 billion $3.4-3.6 Billion
$1.2 – 1.4 billion
Plan documentation explains current and future issues and growth assumptions for all modes. In the case of State highway programs, the plan discloses current annual funding, annual feasible need funding levels, and the gap between them for individual programs, including bicycle and pedestrian investments. For bicycle and pedestrian facilities, the principal issue identified is future uncertainty regarding the availability of funding if motor fuel tax revenues decline, because the motor fuel tax is the major source of funding for both local and State bicycle and pedestrian facilities. Considering passenger and rail freight as another example, the plan concisely explains the respective roles of the State and private operators in providing funding. In addition, funding of major capital improvements is identified as a problem due to insufficient resources of private sector operators and the lack of government funding sources for major improvements that would serve privately-owned rail services. The plan includes two sets of scenario-based analyses in which all of the scenarios include a financial component. A policy analysis consists of scenarios incorporating critical policy choices, external factors and future pricing contingencies, all of which include a financial component. Financial feasibility also is considered as a performance criterion in evaluating the impacts of each scenario. In addition, three scenarios incorporating different levels of transportation system investment are analyzed and considered in conjunction with the development of implementation strategies. Integration of Financial Planning and Policy Analysis The Steering Committee for the OTP selected seven scenarios to consider the impacts on the state’s transportation system, economy, and land use associated with different policy choices or future circumstances. Financial conditions play a significant role in these scenarios, either as a causal factor or as an impact. The comprehensive analysis and forecasting of funding needs and sources, as summarized above, as well as other financial considerations, provided the necessary foundation for this further level of analysis, beyond the standard content of long-range plans at either the State or metropolitan area levels. Policy Scenarios A reference scenario was created to serve as a baseline representation of the transportation system’s expected future, against which the effects of different future conditions could be evaluated. The reference scenario is designed to represent funding for the state’s transportation system at current levels, in terms of inflation-adjusted dollars. Small growth rates in two major State funding sources are assumed and commitments to pay off the bonds for existing urban transit capital projects are fulfilled. MPO assumptions on financial constraint are used for metropolitan areas.

77
The other six scenarios examine the impacts of high fuel prices; impacts of relaxed land use restrictions allowing more decentralized growth; maximum implementation of traffic operational improvements instead of broader capacity expansion; major improvements identified in financially constrained MPO plans and several additional large highway capacity expansion projects; roadway pricing strategies; and flat funding for transportation programs, assuming no increases sufficient to account for inflation. The scenario analysis considered a complex set of interactions resulting from the scenario conditions – impacts on the economy, associated changes in the number of trips and VMT, and most critically from the standpoint of financial planning, transportation system costs and revenues. The analysis results are summarized qualitatively, although the analysis included quantitative components, such as application of the Oregon DOT statewide integrated economic, land use, and transportation model. Two of the scenarios with the most direct connection to financial planning are the Flat Funding and Roadway Pricing scenarios. Impacts of these scenarios are summarized below.
• Flat Funding – In the absence of increases in funding to keep pace with cost inflation, funding for the multimodal statewide transportation system will decrease by 40-50 percent by 2030. In addition, increasing fuel efficiency will lower motor vehicle tax revenues. The overall result of this scenario will be marked deterioration in pavement and bridge conditions, resulting over time in increased costs for rehabilitation and replacement. In addition, no publicly-funded investments are possible in rail or marine infrastructure and investment in enhanced transportation capacity will be severely curtailed.
• Roadway Pricing – This scenario, which involves collecting tolls on several major
highways, was found to have a strong impact in reducing congestion and travel times and also to produce more concentrated development and economic activity. The analysis results suggest that road pricing has the potential to generate enough toll revenue to cover operating costs of affected highway facilities in large urban areas, but not capital costs.
The scenario analysis illustrates how financial planning can be integrated with the assessment and forecasting of transportation system performance given potential changes in future conditions (e.g., economic conditions, land use patterns) and policies. Scenarios representing changes in external factors beyond the control of State policies, such as the price of motor fuel, provide a means of addressing specific types of risks that may affect the financing and performance of the transportation system and influence policy decisions. The OTP further enhances scenario analysis, including its financial component, through the use of performance measures/criteria. Nine performance measures are applied to evaluate the seven scenarios, including Mobility, Accessibility, Economic Vitality, Effectiveness & Efficiency, Reliable, Equity, Safety, and Sustainability. One of the performance measures is Public Support & Financial Feasibility. The performance measures are qualitative, identifying the direction of future change as follows:
• Improves over time
78
• No change over time • Worsens over time.
The analysis is multimodal, such that the performance measures are applied to five different modal categories: Passenger Surface Transportation, Trucking, Rail Freight, Aviation, and Ports. The net result is a broad analysis tracing the complex interplay of external conditions, policies, and financing of the transportation system. This effort breaks new ground and has the potential to serve as a departure point for further development of more precise performance measurement approaches in the context of financial planning. The OTP Policy Analysis effort received an FHWA and APA Transportation Planning Excellence award in 2008. Investment Scenarios In addition to the policy scenarios discussed above, analysis of three specific investment scenarios was performed in developing the OTP. These scenarios are designed to represent three different levels of transportation funding. The analysis identifies the results of the scenarios in terms of the investment strategies that merge financial constraints with the policy priorities identified through the statewide transportation planning process and OTP development. Scenario 1 – Response to Flat Funding, combines elements of the Flat Funding and Maximum Operations policy scenarios discussed previously in this case study. The results from this scenario maintain future funding at current purchasing power levels, not adjusted for inflation. Although maintaining the system would be the highest priority for highways, roads, bridges and airport runways, maintenance and performance standards for State highways would have to be modified and projects prioritized. Transit services would decline and system expansion across all modes would be curtailed. Performance impacts would include deterioration of transportation infrastructure, higher levels of congestion and longer travel times, higher freight costs, increased transit fares and wait times, reduced transportation service to the elderly and persons with disabilities, reduced safety, increased air pollution due to congestion, reduced use of transit, and deterioration of port facilities, resulting in the loss of ocean access. Scenario 2 – Maintaining and Improving Existing Infrastructure and Services, represents funding increases at the rate of inflation, preserving existing facilities and services at their current performance levels to the extent possible. This level of funding would allow limited operational improvements but not major capacity expansion. Many of the adverse impacts on infrastructure condition, safety, and air pollution of Scenario 1 would be avoided, but limitations on transportation system investments coupled with population growth would increase congestion and freight transportation costs, suppressing economic development. Scenario 3 – Expanding Facilities and Services, provides for real-dollar growth in funding to meet feasible needs, including investments in new infrastructure. Modifications in the existing financial structure would be needed to provide additional financial resources and the OTP identifies potential strategies and policy considerations to close the funding gap.

79
Conclusions The OTP’s strong emphasis on policy analysis highlights some potential applications of financial planning that go beyond balancing expected costs and revenues. The use of comparative scenario analysis is more advanced than in most other long-range statewide or metropolitan transportation plans. Specifically, the Oregon example illustrates how sound financial planning can provide the foundation for examining relatively complex scenarios representing alternative future conditions and policy impacts. While the specific approach to scenario analysis is not necessarily presented as a model to be replicated in other parts of the country, the general concepts may have applications in other states—or metropolitan areas—addressing the impacts of budget constraints. While the designation of a “vision” plan is an accepted approach to demonstrating the benefits of increasing system funding above the levels reasonably expected to be available in long-range plans, the OTP financial planning process exemplifies consideration of multiple funding levels. In addition, the scenario analysis identifies the effects of different policy choices and external factors, such as road pricing and rising fuel costs, on both funding levels and transportation system investment needs. Forecasting the impacts of potential changes in external factors is a strategy for assessing risks embedded in financial plans. Moreover, the ability to perform a far-reaching analysis of alternative transportation futures and their associated financial implications illustrates the potential benefits of investing in analytical tools such as the ODOT statewide model. One specific feature that may merit broader application is incorporation of financial impact as a performance criterion or measure in evaluating policy scenarios. Oregon has taken initial steps to develop a long-range planning performance measure based on financial factors. Further development of this concept merits consideration as a means of realizing the full potential of integrating financial analysis in the transportation planning process. References
• Oregon Transportation Plan, Volume 1: http://www.oregon.gov/ODOT/TD/TP/docs/ortransplanupdate/2007/OTPvol1.pdf
• Oregon Transportation Plan, Volume 2, Technical Appendices:
http://www.oregon.gov/ODOT/TD/TP/docs/ortransplanupdate/2007/OTPvol2.pdf Contact Michael Rock [email protected] Transportation Development Division Oregon Department of Transportation http://www.oregon.gov/ODOT/index.shtml

80
VI. Summary of Lessons Learned
Addressing Risk is a Key Challenge in Long-Range Financial Planning. • Uncertainty poses a much greater challenge in the development of long-range
transportation plans than for programs of short-range improvements – TIPs and STIPs. A wide array of factors can result in changes over time in both costs and available funding. Contingencies and the effects of risk factors, such as inflation, advances in technology, demographic shifts, and policy changes, increase with the duration of the planning time horizon.
• Some MPOs and States have developed effective approaches to addressing major sources of risk: Policy and program changes at the Federal, State, and local government level are recognized risk factors that are difficult to forecast over a time period of 20 -30 years. Plans identify specific risks, e.g. lower than expected revenues and need for legislative authorization. The best long-range plans quantify the potential impacts of variability in program funding. Some MPOs and States have developed effective approaches to addressing major sources of risk: Policy and program changes at the Federal, State, and local government level are recognized risk factors that are difficult to forecast over a time period of 20 -30 years. Plans identify specific risks, e.g. lower than expected revenues and need for legislative authorization. The best long-range plans quantify the potential impacts of variability in program funding.
• Additional risk factors relate to social and economic conditions that affect transportation conditions and funding availability: Principal factors examined in the case studies are the inflation rate, including construction costs, employment, population, income, and business activity, and their impacts on sales tax revenues.
• The primary strategy used to address future financial uncertainty is scenario analysis: Most of the case studies illustrate the use of scenarios to portray the difference in transportation outcomes resulting from conservative projections of future funding versus higher levels of spending. In some cases, the analysis consists of two scenarios, one in which expenditures are constrained to levels of reasonably expected revenues – or even more conservative “no growth” conditions – and a scenario that reflects greater increases in spending. Other metropolitan areas and States analyze three or more potential scenarios, one of which represents some increase in funding beyond a severely constrained level that allows for some adjustment for inflation or growth at historical levels, and a “vision” scenario corresponding to the needs and plans identified through the planning process.
The Functions of Scenario Analysis Go Beyond Balancing the Budget.
• The case studies of best practice include examples in which multiple scenarios are compared to assess trade-offs associated with investment choices and priorities. Scenario analysis can serve the vital purpose of demonstrating the impacts of budget constraints on planned transportation investments. In addition, alternative scenarios can be structured to illustrate the financial impacts of policy alternatives, such as varying emphasis on system expansion versus operational improvements or greater emphasis on transit or non-motorized transportation modes.

81
• Analysis of multiple alternatives can be used to assess the sensitivity of financial forecasts to specific variables. Comparison of the impacts of alternative assumptions regarding external conditions, such as employment growth, can help to bound financial forecasts and assess the magnitude of specific risk factors.
Effective Coordination Across Modes and Agencies is Essential for Producing Reliable Financial Plans. • Coordination involves the integration of financial information, cooperative forecasting,
and agreement on allocation of funding from shared sources. The synthesis of information from different agencies and levels of government can involve consolidation of data and forecasts from existing documents and plans, such as Capital Improvement Programs for transit agencies. In addition, agency officials, including local government representatives, should collaborate to reach consensus on policies and assumptions that will have a significant influence on future finances. A financial technical advisory group including representation from all agencies can serve this purpose.
• Critical assumptions requiring cross-agency agreement include the future of Federal, State, and local program funding. Issues include renewal prospects for programs requiring reauthorization, assessment of new revenue sources, and the allocation of revenues from shared resources. Reaching agreement on relevant economic factors that affect forecasts, such as inflation, is another important purpose of collaboration.
• Coordination at the State level can produce optimum consistency of financial forecasts across agencies. The best practices case studies include an example of the State leading the coordination of financial assumptions and forecasts for the long-range Statewide plan, the STIP, and all metropolitan transportation plans and TIPs. The result assured consistency of financial assumptions for MPOs, the State DOT, transit agencies, and local governments regarding the distribution of Federal and State funding, such as a dedicated portion of State sales taxes, including all flows to local governments. Participating in this effort were State DOT executives and staff, MPO board members, technical staff, and municipal and county officials.
Defining and Forecasting “Reasonably Expected to be Available Revenues” is a Crucial Element of Financial Constraint.
• Financial plans should distinguish new from existing sources and assess the availability
and reliability of funding from all sources. The level of funding should be specified by individual funding source, for all modes, now and throughout the timeframe of the plan. Sources requiring detailed attention, in terms of technical forecasting and assessment of reliability, are State motor fuel taxes, other vehicle-use related taxes, and especially new sources. Innovative financing, such as Transportation Infrastructure Finance and Innovation Act (TIFIA), private equity participation, private activity bonds, value capture, and tolls, plays a role in some quality financial plans.
• Key criteria for determining “reasonably expected to be available” funding include consistency with historical trends and degree of commitment for different categories of funding. Generally, consistency with historical trends is a primary criterion for assessing the reliability of future funding expectations. Funding authorization dates are an important indicator of commitment.

82
• Financial plans should provide specific justification for projected increases in funding that exceed historical trends. This principle applies to continuing programs and sources of funding. In some instances, historical trends also may provide a guide to the expected revenue stream from new funding sources. Past experience also should be considered in projecting future funding from discretionary sources, although an assumption of constant discretionary funding is likely to be unreliable.
• Economic, demographic, and system condition changes can account for departures from historical trends. A straight line projection of revenue growth may not be appropriate, due to recent shifts - either up or down - in regional employment or population. The duration of any new patterns – whether change is a short-term phenomenon or a continuing trend – will determine the significance of deviations from historical patterns for the purpose of revenue forecasting.
• “Reasonably expected to be available” funding expectations shuld reflect conservative assumptions, such as no growth in real of Year of Expenditure (YOE)dollars. Year to year increases may lag below the rate of inflation for some categories of funding. The rate of inflation assumed in forecasting revenue growth should be considered carefully and justified.
• The use of bonds to finance transportation infrastructure merits detailed assessment. To ensure that the projected role of bonding in funding capital improvements is realistic, best practice involves review and verification of assumptions regarding revenue sources (e.g. general fund, dedicated sales tax percentage, allocation to transportation versus other programs), debt service, legislative authorization, and eligibility.
Fiscal Constraint also Requires Reliable Forecasts of Expenses. • Operations and maintenance costs for all modes represent an essential component of
long-range plans, coupled with capital costs for infrastructure improvements. As with revenue projections, past experience provides the best indication of future operations and maintenance costs for existing systems. Detailed breakdown of cost components can be helpful in forecasting future operations and maintenance expenses for capital improvements. Trend analysis should be based on a sufficiently long period of time to account for asset rehabilitation costs.
• Actual versus projected costs of major capital projects is often a significant source of error in long-range financial plans. Project-specific contingencies, relative share of overall capital costs attributable to each project and the track record for capital cost estimation are factors that can indicate the degree of vulnerability of the financial plan to possible project cost overruns. A project cost risk model developed by one MPO quantifies financial risk for projects in the metropolitan transportation plan based on the factors contributing to past cost overruns – costs, reschedule, and environmental reviews/mitigation. The model estimate is then compared to the contingency set asides for capital projects included in the plan.
Financial Planning/Fiscal Constraint Can Motivate Public Engagement in Developing Budgetary Priorities and Assessing Investment Trade-Offs. • Several case studies demonstrate how forums like public meetings and working groups
can successfully incorporate public involvement in the financial planning process. Trade-off exercises allow the public to formulate spending priorities that can influence the allocation of funds and guide investment choices. Direct consideration of financial
83
constraints can help to focus public involvement on practical solutions to transportation needs. Public support lends legitimacy to financial plans and has influenced State legislative decisions on transportation program funding.
• Transparency is key to effective public involvement in financial planning. Clear documentation of all cost items, revenue sources, and assumptions regarding inflation, funding allocation, and other major financial factors is essential to support review and understanding of long range financial plans by all audiences, including Federal oversight staff. Presentation in an understandable format that clarifies financial trade-offs is particularly important to foster effective public involvement.
Financial Impacts Can be Key Performance Measures. • Performance measures can be constructed to assess financial impacts of long-range
financial plans. Performance measures based on system costs and revenues can link long-range transportation plans to fiscal stewardship goals. Measures can apply to the entire plan or alternative scenarios.
• Estimated measures used to evaluate the plan can later be applied in monitoring the results of plan implementation.
Smaller States and Metropolitan Areas Can Tailor Financial Planning Approaches to Available Planning Resources. • Financial planning can focus on essentials and still exemplify effective practice based
on sound technical methods and a participatory process. • Transparency is crucial to manage complexity. Clarity about assumptions helpf to
identify areas of uncertainty and how they affect the viability of long-range transportation plans, reducing potential complexity in the financial planning process by bringing the most critical factors into focus.