Embed Size (px)
Citation preview

FISCAL IMPACT
ANALYSIS
For
Rockport Ranch
May 4, 2018
Prepared By:

Fiscal Impact Analysis
May 4, 2018 Rockport Ranch
Table of Contents Page
1. Purpose of Fiscal Impact Analysis .................................................................................. 1 2. Project Description.......................................................................................................... 1 3. FIA Limiting Conditions................................................................................................. 2 4. General Sources of Information and Methodology Used in FIA .................................... 2 5. FIA Summary and Conclusions ...................................................................................... 3 6. FIA Recurring Revenues................................................................................................. 5
6.1 Property Tax .............................................................................................................. 5 6.2 Sales Tax.................................................................................................................... 6 6.2.1 Off-Site Retail Sales and Measure DD Sales Tax .................................................. 6 6.3 Property Tax In-Lieu of Vehicle License Fees (“VLF”) ........................................... 6 6.4 Property Transfer Tax ................................................................................................ 6 6.5 Other Revenues.......................................................................................................... 7
7. FIA Recurring Costs ....................................................................................................... 7 7.1 Legislative ................................................................................................................. 7 7.2 Police Services ........................................................................................................... 7 7.3 Fire Services .............................................................................................................. 7 7.4 Emergency Operations Services ................................................................................ 7 7.5 Animal Control .......................................................................................................... 7 7.6 Measure DD ............................................................................................................... 8 7.7 Public Works ............................................................................................................. 8 7.8 Engineering Department ............................................................................................ 8 7.9 Finance Department ................................................................................................... 8
8. Glossary of Defined Terms and Acronyms .................................................................... 8

Fiscal Impact Analysis
May 4, 2018 Rockport Ranch
1
1. Purpose of Fiscal Impact Analysis
This Fiscal Impact Analysis (“FIA”) has been prepared to determine the estimated fiscal
impacts on the City of Menifee (“City”) in connection with the proposed development of
Rockport Ranch (“Project”), a 305-unit residential development. The purpose of the FIA
is to show the net benefit of the proposed land use plan compared to the existing land use
plan. The reader should be aware that the FIA contains estimates or projections of the
Project’s future revenue and cost impacts on the City and actual fiscal results may vary
from estimates because events and circumstances may occur in a manner that is different
than projected in the FIA. The primary purpose of this FIA is to project the Project’s net
fiscal impact on the City’s General Fund over a 20-year time period.
2. Project Description
The Project is located slightly East of Highway 215 on the Southwestern corner of Newport
Road and Briggs Road. The Project is proposing to implement a General Plan Amendment
(GPA No. 2016-287), Change of Zone (CZ No. 2016-288), Specific Plan (SP No. 2016-
286), and Tentative Tract Map (TR No. 2016-285 [TR 37131]) to allow a subdivision with
the proposed planning areas detailed in the land use assumption table below, located on
72.6 acres.
LAND USE ASSUMPTIONS
Planning Area Residential Land Use
Designation
Density
Range
Net
Area
Proposed
Du’s
Target
Density
PA-1 Courtyard Residential
MHDR
5-8
du/ac
16.8
acres 96 5.71
PA-2 Single-Family
Residential MDR
2-5
du/ac
12.8
acres 60 4.69
PA-3 Single-Family
Residential MDR
2-5
du/ac
17.6
acres 79 4.49
PA-4 Single-Family
Residential MDR
2-5
du/ac
13.3
acres 43 3.23
PA-5 Single-Family
Residential MDR
2-5
du/ac
12.1
acres 27 2.23
Specific Plan
Area Total - 2-5 72.6 305 3.83
Each planning area is anticipated to be comprised of 3 plans; 90 DU’s of 40’ Wide product
with an average square footage of 2,150, 119 DU’s of 50’ Wide product with an average
square footage of 2,860 and 96 DU’s of Cluster product with an average square footage of
1,684.
Fiscal Impact Analysis
May 4, 2018 Rockport Ranch
2
3. FIA Limiting Conditions
The FIA is subject to the following limiting conditions:
The FIA contains an analysis of recurring revenues and costs to the City from
development of the Project. The FIA is based on estimates, assumptions, and other
information developed from DPFG’s research, interviews, telephone discussions with
City staff, and information from DPFG’s database which were collected through fiscal
impact analyses previously prepared by DPFG and others.
The sources of information and basis of the estimates are stated herein. While we believe
the sources of information are reliable, DPFG does not express an opinion or any other
form of assurance on the accuracy of such information.
The analysis of recurring revenues and cost impacts to the City contained in the FIA is
not considered to be a “financial forecast” or a “financial projection” as technically
defined by the American Institute of Certified Public Accountants. The word
“projection” used within this report relates to broad expectations of future events or
market conditions.
Since the analyses contained herein are based on estimates and assumptions which are
inherently subject to uncertainty and variation depending on evolving events, DPFG
cannot represent that results will definitely be achieved. Some assumptions inevitably
will not materialize and unanticipated events and circumstances may occur; therefore,
the actual results achieved may vary from the projections.
4. General Sources of Information and Methodology Used in FIA
The FIA was prepared to estimate the allocable revenue and cost impacts to the City’s
general fund (“General Fund”) as a result of the Project’s development. The FIA uses a
combination of case study methods and multiplier methods to estimate Project impacts.
When projecting fiscal impacts using a multiplier method, the FIA determines per
capita/employee impacts by applying the appropriate per capita, per employee, and per
capita and employee factors (“Factors”) to the Project land use assumptions. The Factors
were calculated using the City of Menifee Adopted 2017-18 Budget (“Budget”). Cost and
revenue factors are projected in 2018 dollars.
Information used in preparing the FIA was obtained from the following sources: (1) City
Adopted and Mid-Year Budgets; (2) Developer (land use information); (3) Sales price
projections per Real Estate Economics; (4) the California Department of Finance
(population information); and (5) the California Employment Development Department
(employment information).

Fiscal Impact Analysis
May 4, 2018 Rockport Ranch
3
5. FIA Summary and Conclusions
The FIA examines the financial impact the Project will have on the General Fund over a 20-
year time period. The Project will generate additional revenue for the General Fund primarily
through increased property taxes, property taxes in-lieu of vehicle license fees, sales tax, and
Measure DD sales tax.
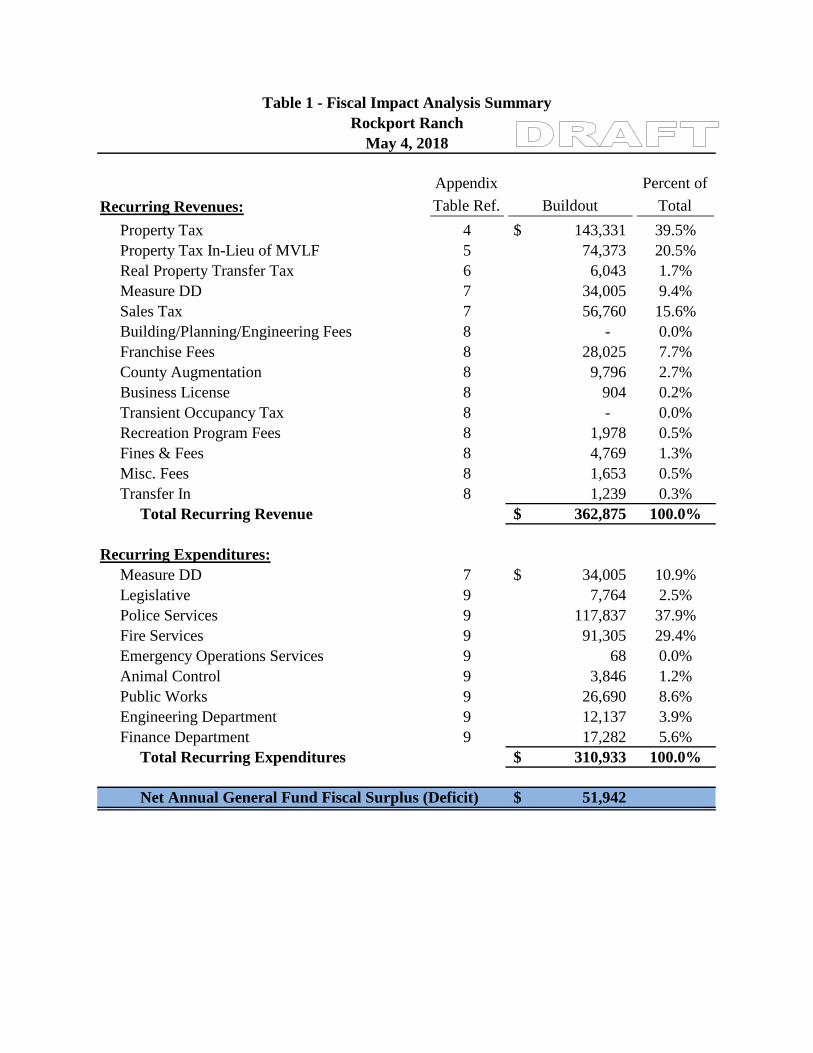
The Project’s direct impact to the General Fund at build-out is summarized in Table 1 of this
report.

Fiscal Impact Analysis
May 4, 2018 Rockport Ranch
4
Recurring Revenues:
Appendix
Table Ref. Buildout
Percent of
Total
Property Tax 4 143,331$ 39.5%
Property Tax In-Lieu of MVLF 5 74,373 20.5%
Real Property Transfer Tax 6 6,043 1.7%
Measure DD 7 34,005 9.4%
Sales Tax 7 56,760 15.6%
Building/Planning/Engineering Fees 8 - 0.0%
Franchise Fees 8 28,025 7.7%
County Augmentation 8 9,796 2.7%
Business License 8 904 0.2%
Transient Occupancy Tax 8 - 0.0%
Recreation Program Fees 8 1,978 0.5%
Fines & Fees 8 4,769 1.3%
Misc. Fees 8 1,653 0.5%
Transfer In 8 1,239 0.3%
Total Recurring Revenue 362,875$ 100.0%
Recurring Expenditures:
Measure DD 7 34,005$ 10.9%
Legislative 9 7,764 2.5%
Police Services 9 117,837 37.9%
Fire Services 9 91,305 29.4%
Emergency Operations Services 9 68 0.0%
Animal Control 9 3,846 1.2%
Public Works 9 26,690 8.6%
Engineering Department 9 12,137 3.9%
Finance Department 9 17,282 5.6%
Total Recurring Expenditures 310,933$ 100.0%
Net Annual General Fund Fiscal Surplus (Deficit) 51,942$
Table 1 - Fiscal Impact Analysis Summary
Rockport Ranch
May 3, 2018
Fiscal Impact Analysis
May 4, 2018 Rockport Ranch
5
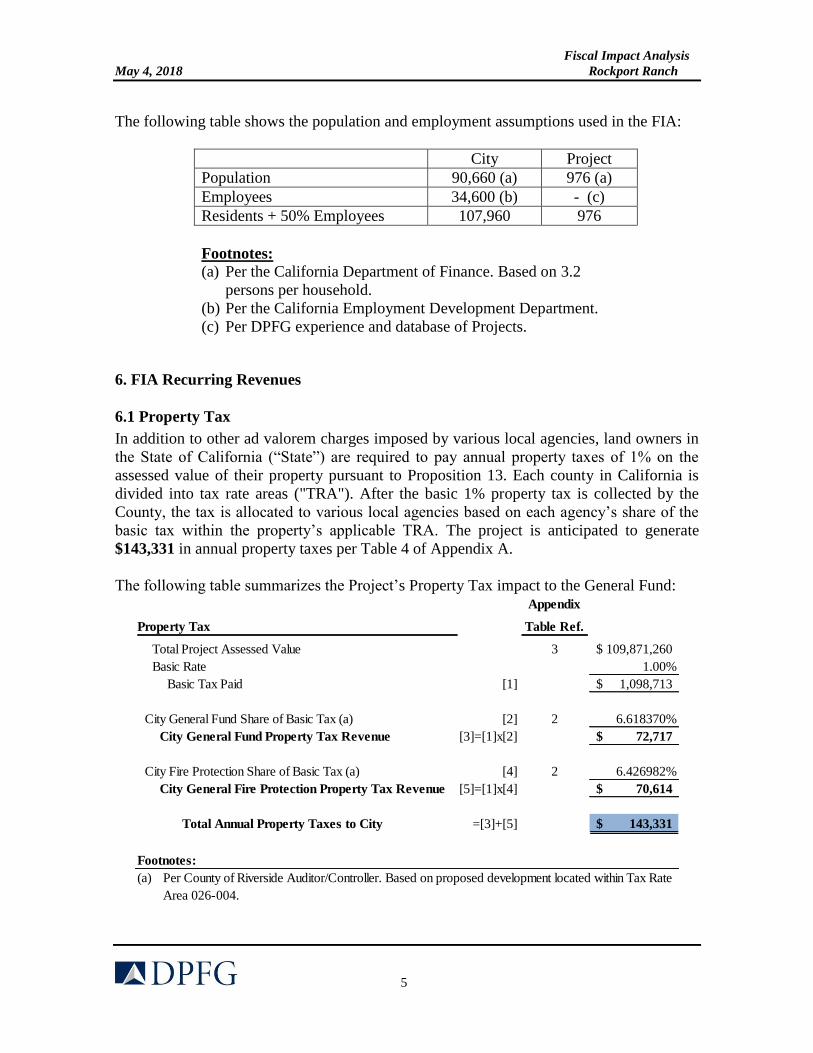
The following table shows the population and employment assumptions used in the FIA:
City Project
Population 90,660 (a) 976 (a)
Employees 34,600 (b) - (c)
Residents + 50% Employees 107,960 976
Footnotes:
(a) Per the California Department of Finance. Based on 3.2
persons per household.
(b) Per the California Employment Development Department.
(c) Per DPFG experience and database of Projects.
6. FIA Recurring Revenues
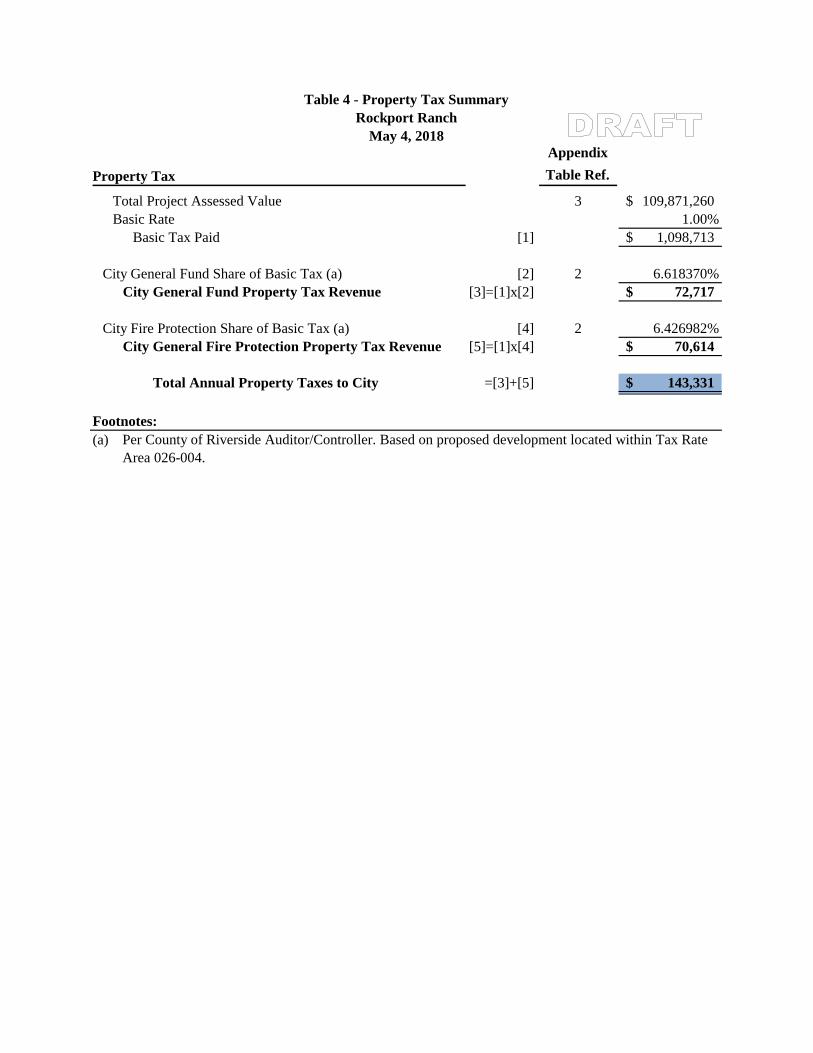
6.1 Property Tax
In addition to other ad valorem charges imposed by various local agencies, land owners in
the State of California (“State”) are required to pay annual property taxes of 1% on the
assessed value of their property pursuant to Proposition 13. Each county in California is
divided into tax rate areas ("TRA"). After the basic 1% property tax is collected by the
County, the tax is allocated to various local agencies based on each agency’s share of the
basic tax within the property’s applicable TRA. The project is anticipated to generate
$143,331 in annual property taxes per Table 4 of Appendix A.
The following table summarizes the Project’s Property Tax impact to the General Fund: Appendix
Table Ref.
Total Project Assessed Value 3 109,871,260$
Basic Rate 1.00%
Basic Tax Paid [1] 1,098,713$
City General Fund Share of Basic Tax (a) [2] 2 6.618370%
City General Fund Property Tax Revenue [3]=[1]x[2] 72,717$
City Fire Protection Share of Basic Tax (a) [4] 2 6.426982%
City General Fire Protection Property Tax Revenue [5]=[1]x[4] 70,614$
Total Annual Property Taxes to City =[3]+[5] 143,331$
Footnotes:
(a)
Property Tax
Per County of Riverside Auditor/Controller. Based on proposed development located within Tax Rate
Area 026-004.

Fiscal Impact Analysis
May 4, 2018 Rockport Ranch
6
6.2 Sales Tax
Under the California Sales and Use Tax Law, the sale of tangible personal property is subject
to sales or use tax unless exempt or otherwise excluded. When the sales tax applies, the use
tax does not apply and the opposite is also true. The sales tax is imposed on all retailers for
the privilege of selling tangible personal property in the State and is measured by the
retailer’s gross receipts.
As of November 2016, the effective sales tax rate in the City of Menifee is 8.00% of taxable
sales. The City receives 1.00% and the remainder goes to the State (6.50%) and the Riverside
County Transportation Commission (0.50%). On November 8, 2016, the City passed
Measure DD that authorized a 1.00% transaction and use tax, which increases the sales tax
rate to 9.00%. According to the City Manager’s budget message in the FY 2017-18 City of
Menifee Annual Budget, 66.22% of Measure DD revenue is dedicated towards fire and
police services.
6.2.1 Off-Site Retail Sales and Measure DD Sales Tax
The City will receive sales tax revenue from taxable purchases made within the City but
outside the Project area by the Project’s residents. Per the Bureau of Labor Statistics
Consumer Expenditure for 2016, a household spends 35% of their annual income on housing
cost. Similarly, each household spends 74% of their income in consumer expenditure of
which 32.56% counts towards taxable sales. It is assumed that 25% of the taxable sales is
captured outside of the City, leaving 75% of taxable spending to estimate retail taxable
expenditures captured by the City. The City will receive 1.00% in Sales Tax Revenue;
10.50% of the 1.00% in Use Tax Revenue and 1.00% in Measure DD will generate $56,760
in total off-site sales tax and $34,005 in Measure DD sales tax per Table 7 of Appendix A.
6.3 Property Tax In-Lieu of Vehicle License Fees (“VLF”)
In May 2004, Governor Schwarzenegger proposed a swap of city and county VLF revenue
for additional property tax share as part of a budget agreement between the State and local
governments. The swap was included in the 2004 budget package. Under this legislation,
property tax in-lieu of VLF is allocated to Cities and Counties pursuant to a complex formula
involving each agency’s relative share of assessed value. The property tax in-lieu of VLF
revenue that will be generated by the Project can be estimated by determining the (i)
percentage growth in the total assessed value of the City attributable to the Project and
multiplying by (ii) the property tax in-lieu of VLF revenue of $6,062,792 expected to be
received per the Budget. Based on these calculations, the Project is anticipated to generate
$74,373 annually in property tax in-lieu of VLF revenue per Table 5 of Appendix A.
6.4 Property Transfer Tax
The County may levy a transfer tax at the rate of $0.55 for each $500 of assessed value. The
FIA assumes a non-residential turnover rate of 10.00% of total assessed value per year (i.e.
properties change ownership every 10 years on average). Using these assumptions, the City
is anticipated to receive approximately $6,043 in annual property tax transfer revenue at
buildout per Table 6 of Appendix A.

Fiscal Impact Analysis
May 4, 2018 Rockport Ranch
7
6.5 Other Revenues
The City receives various other revenues analyzed under the FIA. These revenues include:
Franchise Fees
County Augmentation
Business License
Recreation Program Fees
Fines & Fees
Misc. Fees
Transfer In
These revenues have been estimated using a Per Capita & 50% Employee Multiplier against
the City’s budgeted revenue for each respective revenue category. Based on the weighted
average Per Capita & 50% Employee Multiplier, the total annual Other Revenues are
anticipated to be $48,363 at buildout per Table 8 of Appendix A.
7. FIA Recurring Costs
7.1 Legislative
The Legislative cost category includes City Council, City Manager, City Attorneys, City
Clerk, and all administrative expenses relating to those positions. Using a Per Capita & 50%
Employee Multiplier and a marginal increase of 50%, the total annual Legislative services
costs are anticipated to be $7,764 at buildout per Table 9 of Appendix A.
7.2 Police Services
The Police Department, under the direction of Captain Greg Fellows, is charged with
ensuring the safety of our community while maintaining the desired quality of life. The City
contracts with the Riverside County Sheriff’s Department for Police Services. Using a Per
Capita & 50% Employee Multiplier and a marginal increase of 100%, the total annual Police
Services costs are anticipated to be $117,837 at buildout per Table 9 of Appendix A.
7.3 Fire Services
The City contracts with the Riverside County Fire Department for all Fire Services.
Currently, the City operates four fire stations within the City Limits. Using a Per Capita &
50% Employee Multiplier and a marginal increase of 100%, the total annual Fire Services
costs are anticipated to be $91,305 at buildout per Table 9 of Appendix A.
7.4 Emergency Operations Services
Using a Per Capita & 50% Employee Multiplier and a marginal increase of 100%, the total
annual Emergency Operations Services costs are anticipated to be $68 at buildout per Table
9 of Appendix A.
7.5 Animal Control
The City contracts with private agencies to provide field and shelter services to the public
and also provides educational services about programs such as licensing, spay/neuter

Fiscal Impact Analysis
May 4, 2018 Rockport Ranch
8
services, and adoption. Using a Per Capita & 50% Employee Multiplier and a marginal
increase of 100%, the total annual Animal Control costs are anticipated to be $3,846 at
buildout per Table 9 of Appendix A.
7.6 Measure DD
The Measure DD expenditure category includes all expenses related to the transaction and
use tax which passed on November 8, 2016. The total annual Measure DD costs are
anticipated to be $34,005 at buildout per Table 7 of Appendix A.
7.7 Public Works
The Public Works cost category includes Planning, Building Safety, Code Enforcement,
Economic Development, and all public works administration expenses. Using a Per Capita
& 50% Employee Multiplier and marginal increase of 100%, the total annual Public Works
costs are anticipated to be $26,690 at buildout per Table 9 of Appendix A.
7.8 Engineering Department
The Engineering cost category includes all engineering expenses as well as all costs
associated with the NPDES. Using a Per Capita & 50% Employee Multiplier and marginal
increase of 50%, the total annual Engineering costs are anticipated to be $12,137 at buildout
per Table 9 of Appendix A.
7.9 Finance Department
The Finance and General Government services cost category includes executive office,
assessor/recorder/county clerk, treasurer – tax collector, Non-Departmental, Community
Services, and human resources costs. Using a Per Capita & 50% Employee Multiplier and
a marginal increase of 50%, the total Finance Department costs are anticipated to be $17,282
at buildout per Table 9 of Appendix A.
8. Glossary of Defined Terms and Acronyms
Budget City Adopted Budget for Years 2017-2018
County County of Riverside
Project Planner Abacherli Family Trust
DPFG Development Planning & Financing Group
FIA Fiscal Impact Analysis
General Fund City of Menifee General Fund
Project Rockport Ranch
State State of California
TRA Tax Rate Area
VLF Vehicle License Fees

Appendix A
Recurring Revenues:
Appendix
Table Ref. Buildout
Percent of
Total
Property Tax 4 143,331$ 39.5%
Property Tax In-Lieu of MVLF 5 74,373 20.5%
Real Property Transfer Tax 6 6,043 1.7%
Measure DD 7 34,005 9.4%
Sales Tax 7 56,760 15.6%
Building/Planning/Engineering Fees 8 - 0.0%
Franchise Fees 8 28,025 7.7%
County Augmentation 8 9,796 2.7%
Business License 8 904 0.2%
Transient Occupancy Tax 8 - 0.0%
Recreation Program Fees 8 1,978 0.5%
Fines & Fees 8 4,769 1.3%
Misc. Fees 8 1,653 0.5%
Transfer In 8 1,239 0.3%
Total Recurring Revenue 362,875$ 100.0%
Recurring Expenditures:
Measure DD 7 34,005$ 10.9%
Legislative 9 7,764 2.5%
Police Services 9 117,837 37.9%
Fire Services 9 91,305 29.4%
Emergency Operations Services 9 68 0.0%
Animal Control 9 3,846 1.2%
Public Works 9 26,690 8.6%
Engineering Department 9 12,137 3.9%
Finance Department 9 17,282 5.6%
Total Recurring Expenditures 310,933$ 100.0%
Net Annual General Fund Fiscal Surplus (Deficit) 51,942$
Table 1 - Fiscal Impact Analysis Summary
Rockport Ranch
May 4, 2018

TRA026-004 (a)
General Purpose 0.0000%
General 12.0984%
County Free Library 1.5720%
City of Menifee 6.6184%
City of Menifee Fire Protection 6.4270%
Menifee School 3.4178%
Perris Union HS 19.5530%
Mt San Jacinto Jr College 4.3410%
Perris Area Elementary School Fund 10.5231%
Perris Jr High Area Fund 7.0214%
Riverside County Office of Education 4.6065%
Riverside County Regional park and Open Space 0.3802%
Flood Control Administration 0.2572%
Flood Control Zone 4 4.0300%
CSA 33 Menifee 0.0000%
CSA 86 Menifee 0.0000%
CSA 146 Menifee 0.0000%
CSA 152 0.0000%
Perris Valley Cemetery 0.1663%
Valley Health Hospital District 0.0000%
Southern California, JT (19, 30, 33,36, 37, 56) 0.0000%
MWD East 1301999 0.0000%
EMWD 2.9304%
EMWD IMP District 13 0.0000%
EMWD IMP District A 0.0000%
San Jacinto Basin Resource Cons. 0.0000%
ERAF Fund 16.0573%
Total 100.0000%
Project Acres 79.68
% of Total 100.00%
City of Menifee General Fund 6.6184%
City of Menifee Fire Protection 6.4270%
Total to City 13.0454%
Footnotes:
(a) FY 2017-18 Share of the Basic Tax per Riverside County Auditor-Controller's Office, Property
Tax Division.
Agency
Table 2 - Post-ERAF Share of the Basic Tax Calculation
Rockport Ranch
May 4, 2018

1 2 3 4 5 6 7 8 9 10 11 12 13 14 15 Build-out - Total
I. Residential Land Use
Planning Area 1 32 32 32 - - - - - - - - - - - - 96
Planning Area 2 20 20 20 - - - - - - - - - - - - 60
Planning Area 3 27 27 25 - - - - - - - - - - - - 79
Planning Area 4 15 15 13 - - - - - - - - - - - - 43
Planning Area 5 9 9 9 - - - - - - - - - - - - 27
Total Residential 103 103 99 - - - - - - - - - - - - 305
II. Non-Residential Land Use
Retail - - - - - - - - - - - - - - - -
Office - - - - - - - - - - - - - - - -
Business Park - - - - - - - - - - - - - - - -
Total Non-Residential - - - - - - - - - - - - - - - -
Assessed
III. Assessed Values Value
Residential (b)
Cluster 30,056,640$
40' Wide 31,538,700
50' Wide 48,275,920
Total Residential 109,871,260
Total Residential & Non-Residential Assessed Value 109,871,260$
Total
IV. Population and Employment Residents
Residential 976
Total Residents and Employees 976
Total Residents and 50% Employees 976
Footnotes:
(a) Absorption for residential land use assumes 3 years for Project.
(b) Residential pricing and unit breakdown per Product and Pricing Recommendations, Housing Demand Profile and Optimized Land Plan for the Abacherli Dairy Site in Menifee dated July 2016.
(c) Per Derrigo Demogrpahic Studies, Demographic Analysis Report, City of Menifee, dated May 2013.
Table 3 - Land Use Assumptions
Rockport Ranch
May 4, 2018
360,234$ 305
Residential
Units
Absorption (a)
Residential
Property
Value/ Unit
313,090$
350,430
405,680
96
90
Residents
Per Unit (c)
3.2
119
Residential
Units
305
Appendix
Table Ref.
Total Project Assessed Value 3 109,871,260$
Basic Rate 1.00%
Basic Tax Paid [1] 1,098,713$
City General Fund Share of Basic Tax (a) [2] 2 6.618370%
City General Fund Property Tax Revenue [3]=[1]x[2] 72,717$
City Fire Protection Share of Basic Tax (a) [4] 2 6.426982%
City General Fire Protection Property Tax Revenue [5]=[1]x[4] 70,614$
Total Annual Property Taxes to City =[3]+[5] 143,331$
Footnotes:
(a)
Property Tax
Per County of Riverside Auditor/Controller. Based on proposed development located within Tax Rate
Area 026-004.
Table 4 - Property Tax Summary
Rockport Ranch
May 4, 2018

I. MOTOR VEHICLE LICENSE FEE ("MVLF")
Nominal Dollars: FY 2017-18
City Assessed Valuation (a) [1] 8,685,564,917$
Property Tax Vehicle License Fees (VLF) (b) [2] 6,062,792
VLF Increase per $1,000 increase in AV [3]=[2]/[1]*1000 0.6980
Property Tax in Lieu of MVLF:
Total Assessed Value (c) [4] 109,871,260$
Less: Existing Assessed Value [5] 3,324,896
Net (New) Assessed Value [6]=[4]-[5] 106,546,364$
Project Assessed Valuation / 1,000 [7]=[6]/1000 106,546.36$
VLF Increase per $1,000 increase in AV [3] 0.6980
Property Tax in Lieu of MVLF =[3]*[7] 74,373$
Footnotes:
(a) Per County of Riverside Assessor's Office 2017/2018 Assessment Roll.
(b) Per City of Menifee Mid-Year 2017-18 Budget, page 133.
(c) See Table 3 - Land Use Assumptions.
Table 5 - MVLF Revenue Calculations
Rockport Ranch
May 4, 2018

Proposed
Project
Total Assessed Value per Table 3 109,871,260$
Turnover Rate 10.00%
Annual Taxable Assessed Value 10,987,126$
Property Transfer Tax Rate (a) 0.055000%
Total Annual Property Transfer Taxes 6,043$
Footnotes:
(a)
Table 6 - Property Transfer Tax
Rockport Ranch
May 4, 2018
The County may levy a transfer tax at the rate of $0.55 for each
$500 of assessed value. A City within the County that levies this
tax can levy a transfer tax at a rate of $0.55 per $1,000. If both the
County and City levy the transfer tax, a credit shall be allowed
against the amount imposed by the County in the amount of tax
that is imposed by the City per California Revenue and Taxation
Code 11911.

A. Sales Tax
Off-Site Sales and Use Tax Revenue Table Ref. Factor Proposed
Number of Units 3 305
Average Sales Price 3 360,234$
Down Payment 10.00% 36,023
Loan Amount 324,211
Annual Mortgage Payment (5.5% Interest for 30 Yrs.) 22,090$
HOA 300$ 3,600
Insurance 50$ 600
Property Taxes (a) 1.800% 6,484
Total Annual Housing Costs 32,774
Annual Income Required (Estimated 31% Spent on Housing) 35.00% 93,641$
Aggregate Income per Unit 28,560,372$
Consumer Expenditure at 73.65% (a) 73.65% 21,034,714
Taxable Spending (a) 32.56% 6,848,903
Less: On-site Capture 0.00% -
Less: Capture outside City Boundaries 25.00% (1,712,226)
Net Taxable Spending 5,136,677
Annual Sales Taxes to City 1.00% 51,367$
Annual Use Tax 10.50% 5,394
Total Off-Site Sales Tax Revenue [1] 56,760$
B. Measure DD Sales Tax
Off-Site Measure DD Tax Amount
Retail Taxable Sales 5,136,677$
Total Off-Site Measure DD Sales Tax (b) 1.00% 51,367
Measure DD Revenue to the General Fund (c) 66.20% [2] 34,005$
Measure DD Expenditures to the General Fund (d) [3] (34,005)
Total Measure DD Sales Tax [4]=[2]+[3] -$
Footnotes:
(a)
(b) Per Bureau of Labor Statistics Consumer Expenditure for 2016.
(c)
(d) Per City's FY 2017-18 Annual Budget, City Manager's Budget Message.
(e) Site is expected to incur expenditures equal to all revenue generated by Measure DD.
Table 7 - Sales Tax
Rockport Ranch
May 4, 2018
Assumes base ad valorem rate of 1.13425% per 2017/18 property tax bills adjusted to include probable facility and
maintenance CFD's likely required for Project development.
Represents the City of Menifee local sales tax Measure DD. Per measure DD, 1% of the sales tax is transferred to the City's
general fund.
(

FY 2017-18
Annual Budget
(a)
City
Equivalent
Units (b) Measure Factor
Project
Equivalent
Units (c)
Project
Revenues
Property Tax
Current Secured Prop Tax $ 5,545,000 -------------------------------------See Table 4-------------------------------------
Current Unsecured Prop Tax 200,000 - Not Used -$ -$ -
Current Year Homeowners Prop Tax 65,000 - Not Used - - -
Prior Yr Secured Prop Tax 100,000 - Not Used - - -
Prior Year Unsecured Prop Tax 20,000 - Not Used - - -
Current Year Supplemental 35,000 - Not Used - - -
Prior Year Supplemental 40,000 - Not Used - - -
Current Year Unsecured Fire PP Tax 210,000 - Not Used - - -
Structural Fire Prop Tax 5,633,000 -------------------------------------See Table 4-------------------------------------
RDA Pass Thru 200,000 - Not Used - - -
Teeter Settlement 200,000 - Not Used - - -
Subtotal 12,248,000$ -$ -$
Measure DD
Measure DD 8,700,000$ -------------------------------------See Table 7-------------------------------------
Subtotal 8,700,000$ -$ -$
Sales Tax
Sales & Use Tax 7,500,000$ -------------------------------------See Table 7-------------------------------------
Subtotal 7,500,000$ -$ -$
Building/Planning/Engineering Fees
Building Permits 1,300,000 - Not Used - - -
Building Plan Check Fees 500,000 - Not Used - - -
Plumbing Permit Fees 325,000 - Not Used - - -
Mechanical Permit Fees 225,000 - Not Used - - -
Electrical Permit Fees 925,000 - Not Used - - -
Fire Plan Check 150,000 - Not Used - - -
Fire Inspection 150,000 - Not Used - - -
Planning Fees 1,000,000 - Not Used - - -
Engineering Fees 1,300,000 - Not Used - - -
Subtotal 5,875,000$ -$ -$
Franchise Fees
Franchise Fee-Electric 700,000$ 107,960 per capita & 50% employee 6.48$ 976 6,328$
Franchise Fee-Natural Gas 400,000 107,960 per capita & 50% employee 3.71 976 3,616
Franchise Fee-Cable TV 950,000 107,960 per capita & 50% employee 8.80 976 8,588
Franchise Fee-Solid Waste 1,050,000 107,960 per capita & 50% employee 9.73 976 9,492
Subtotal 3,100,000$ 28.71$ 28,025$
County Augmentation
County Augmentation 1,083,541$ 107,960 per capita & 50% employee 10.04$ 976 9,796$
Subtotal 1,083,541$ 10.04$ 9,796$
Business License
Business License Registration 100,000$ 107,960 per capita & 50% employee 0.93$ 976 904$
Subtotal 100,000$ 0.93$ 904$
Transient Occupancy Tax
Transient Occupancy Tax 210,000$ - Not Used -$ - -$
Subtotal 210,000$ -$ -$
Recreation Program Fees
Class Registration Fee 75,000$ 107,960 per capita & 50% employee 0.69$ 976 678$
Drop-in Recreation Fees 2,000 107,960 per capita & 50% employee 0.02 976 18
Camp/Program Enrollment Fees 25,000 107,960 per capita & 50% employee 0.23 976 226
Trips and Tours Tickets 1,500 107,960 per capita & 50% employee 0.01 976 14
Picnic Shelter Rental 10,200 107,960 per capita & 50% employee 0.09 976 92
Athletic Field Rental 12,000 107,960 per capita & 50% employee 0.11 976 108
Athletic Field Lights Fee 8,000 107,960 per capita & 50% employee 0.07 976 72
Facility/Building Rental 40,000 107,960 per capita & 50% employee 0.37 976 362
Non-Resident Fee 2,000 - Not Used - - -
City Sports League Fees 1,000 107,960 per capita & 50% employee 0.01 976 9
Park & Rec Misc. Revenue 44,097 107,960 per capita & 50% employee 0.41 976 399
Subtotal 220,797$ 2.03$ 1,978$
Revenue Category
Table 8 - General Fund Revenues
Rockport Ranch
May 4, 2018

FY 2017-18
Annual Budget
(a)
City
Equivalent
Units (b) Measure Factor
Project
Equivalent
Units (c)
Project
RevenuesRevenue Category
Table 8 - General Fund Revenues
Rockport Ranch
May 4, 2018
Fines & Fees
Code Enforcement Fines 200,000$ 107,960 per capita & 50% employee 1.85$ 976 1,808$
Animal License Fees 90,000 107,960 per capita & 50% employee 0.83 976 814
Impound Fee 25,000 107,960 per capita & 50% employee 0.23 976 226
Repossession Fee 1,000 107,960 per capita & 50% employee 0.01 976 9
Police Report Fee 10,000 107,960 per capita & 50% employee 0.09 976 90
Traffic Citations 75,000 107,960 per capita & 50% employee 0.69 976 678
Weed/Hazardous Vegetation Fines 1,500 107,960 per capita & 50% employee 0.01 976 14
Abandoned Vehicle Abatement Fees 25,000 107,960 per capita & 50% employee 0.23 976 226
Fines & Forfeitures 100,000 107,960 per capita & 50% employee 0.93 976 904
Subtotal 527,500$ 4.89$ 4,769$
Real Property Transfer Tax
Real Prop Transfer Tax 400,000$ -------------------------------------See Table 6-------------------------------------
Subtotal 400,000$ -$ -$
Misc. Fees
Motor Vehicle License Fee 6,062,792$ -------------------------------------See Table 5-------------------------------------
New Business Zoning Review Fee 10,000 107,960 per capita & 50% employee 0.09 976 90
Foreclosure Registration 15,000 107,960 per capita & 50% employee 0.14 976 136
Water Quality Mgmt Plans Fees 10,000 107,960 per capita & 50% employee 0.09 976 90
AMR Fines 30,000 107,960 per capita & 50% employee 0.28 976 271
Public Records Requests 300 107,960 per capita & 50% employee 0.00 976 3
Late Fees 500 107,960 per capita & 50% employee 0.00 976 5
Donations 2,000 107,960 per capita & 50% employee 0.02 976 18
Event Sponsorships 1,000 107,960 per capita & 50% employee 0.01 976 9
Military Banner Fees 5,000 107,960 per capita & 50% employee 0.05 976 45
General Plan Maintenance Fee 50,000 - Not Used - - -
Cell Tower Revenue 39,000 107,960 per capita & 50% employee 0.36 976 353
Blood Draw Reimbursements 15,000 107,960 per capita & 50% employee 0.14 976 136
Miscellaneous Revenue 15,000 107,960 per capita & 50% employee 0.14 976 136
Interest Income 40,000 107,960 per capita & 50% employee 0.37 976 362
Subtotal 6,295,592$ 1.69$ 1,653$
Transfer In
Operating Transfers In 137,071$ 107,960 per capita & 50% employee 1.27$ 976 1,239$
Subtotal 137,071$ 1.27$ 1,239$
Total 46,397,501$ 49.55$ 48,363$
Footnotes:
(a) Per City of Menifee FY 2017-18 Annual Budget.
(b) Based on (1) 90,660 City of Menifee residents, California Department of Finance, January 1, 2017, (2) 34,600 total City of Menifee employees,
California Employment Development Department, January 2018, and (3) City employment reduction by 50% to account for the estimated
less frequent use of City public services by employees than residents.
(c) See Table 3 - Land Use Assumptions.

Expenditure Category
FY 2017-18
Annual
Budget (a)
Marginal
Increase
Net General
Fund
Contribution
City
Equivalent
Units (b) Measure Factor
Project
Equivalent
Units (c) Project Cost
Legislative
City Council 176,361$ 50% 88,181$ 107,960 per capita & 50% employee 0.82$ 976 797$
City Attorney 360,186 50% 180,093 107,960 per capita & 50% employee 1.67 976 1,628
City Clerk 343,054 50% 171,527 107,960 per capita & 50% employee 1.59 976 1,551
Administrative Services - 50% - 107,960 per capita & 50% employee - 976 -
City Manager 837,990 50% 418,995 107,960 per capita & 50% employee 3.88 976 3,788
Subtotal 1,717,591$ 858,796$ 7.95$ 7,764$
Public Safety
Police Services 13,034,499 100% 13,034,499$ 107,960 per capita & 50% employee 120.73$ 976 117,837
Fire Services 10,099,717 100% 10,099,717 107,960 per capita & 50% employee 93.55 976 91,305
Emergency Operations Services 7,500 100% 7,500 107,960 per capita & 50% employee 0.07 976 68
Animal Control 425,438 100% 425,438 107,960 per capita & 50% employee 3.94 976 3,846
Measure DD 8,289,420 100% 8,289,420 -------------------------------------See Table 7-------------------------------------
Subtotal 31,856,574$ 31,856,574$ 218.30$ 213,056$
Public Works
Community Development 1,975,354$ 50% 987,677$ 107,960 per capita & 50% employee 9.15$ 976 8,929$
Building and Safety 1,708,042 50% 854,021 107,960 per capita & 50% employee 7.91 976 7,721
Code Enforcement 700,886 50% 350,443 107,960 per capita & 50% employee 3.25 976 3,168
Economic Development 818,527 50% 409,264 107,960 per capita & 50% employee 3.79 976 3,700
Public Works Administration 701,758 50% 350,879 107,960 per capita & 50% employee 3.25 976 3,172
Subtotal 5,904,567$ 2,952,284$ 27.35$ 26,690$
Engineering Department
Engineering 2,415,011$ 50% 1,207,506$ 107,960 per capita & 50% employee 11.18$ 976 10,916$
NPDES 270,000 50% 135,000 107,960 per capita & 50% employee 1.25 976 1,220
Subtotal 2,685,011$ 1,342,506$ 12.44$ 12,137$
Finance Department
Finance 1,113,417$ 50% 556,709$ 107,960 per capita & 50% employee 5.16$ 976 5,033
Non-Departmental 1,135,677 50% 567,839 107,960 per capita & 50% employee 5.26 976 5,133
Human Resources 372,841 50% 186,421 107,960 per capita & 50% employee 1.73 976 1,685
Community Services 1,201,243 50% 600,622 107,960 per capita & 50% employee 5.56 976 5,430
Subtotal 3,823,178$ 1,911,589$ 17.71$ 17,282$
Total General Fund Expenditures 45,986,921$ 38,921,748$ 283.74$ 276,928$
Footnotes:
(a) Per City of Menifee FY 2017-18 Annual Budget.
(b) Based on (1) 90,660 City of Menifee residents, California Department of Finance, January 1, 2017, (2) 34,600 total City of Menifee employees,
California Employment Development Department, January 2018, and (3) City employment reduction by 50% to account for the estimated less
frequent use of City public services by employees than residents.
(c) See Table 3 - Land Use Assumptions.
Table 9 - General Fund Expenditures
Rockport Ranch
May 4, 2018

Rockport Ranch
Table
Factor Ref. 1 2 3 4 5 6 7 8 9 10 11
General Fund Financing Sources
Property Tax 10.3 48,404$ 96,807$ 143,331$ 143,331$ 143,331$ 143,331$ 143,331$ 143,331$ 143,331$ 143,331$ 143,331$
Property Tax in Lieu of MVLF 10.4 23,579 49,479 74,373 74,373 74,373 74,373 74,373 74,373 74,373 74,373 74,373
Measure DD 10.6 11,484 22,967 34,005 34,005 34,005 34,005 34,005 34,005 34,005 34,005 34,005
Sales Tax 10.6 19,168 38,336 56,760 56,760 56,760 56,760 56,760 56,760 56,760 56,760 56,760
Building/Planning/Engineering Fees 10.7 - - - - - - - - - - -
Franchise Fees 10.7 9,464 18,928 28,025 28,025 28,025 28,025 28,025 28,025 28,025 28,025 28,025
County Augmentation 10.7 3,308 6,616 9,796 9,796 9,796 9,796 9,796 9,796 9,796 9,796 9,796
Business License 10.7 305 611 904 904 904 904 904 904 904 904 904
Transient Occupancy Tax 10.7 - - - - - - - - - - -
Recreation Program Fees 10.7 668 1,336 1,978 1,978 1,978 1,978 1,978 1,978 1,978 1,978 1,978
Fines & Fees 10.7 1,610 3,221 4,769 4,769 4,769 4,769 4,769 4,769 4,769 4,769 4,769
Real Property Transfer Tax 10.5 2,041 4,081 6,043 6,043 6,043 6,043 6,043 6,043 6,043 6,043 6,043
Misc. Fees 10.7 558 1,116 1,653 1,653 1,653 1,653 1,653 1,653 1,653 1,653 1,653
Transfer In 10.7 418 837 1,239 1,239 1,239 1,239 1,239 1,239 1,239 1,239 1,239
Total Financing Sources 121,008$ 244,336$ 362,875$ 362,875$ 362,875$ 362,875$ 362,875$ 362,875$ 362,875$ 362,875$ 362,875$
General Fund Financing Requirements
Legislative 10.8 -$ 2,622$ 5,244$ 7,764$ 7,764$ 7,764$ 7,764$ 7,764$ 7,764$ 7,764$ 7,764$
Police Services 10.8 - 39,794 79,588 117,837 117,837 117,837 117,837 117,837 117,837 117,837 117,837
Fire Services 10.8 - 30,834 61,669 91,305 91,305 91,305 91,305 91,305 91,305 91,305 91,305
Emergency Operations Services 10.8 - 23 46 68 68 68 68 68 68 68 68
Animal Control 10.8 - 1,299 2,598 3,846 3,846 3,846 3,846 3,846 3,846 3,846 3,846
Measure DD 10.8 11,484 22,967 34,005 34,005 34,005 34,005 34,005 34,005 34,005 34,005 34,005
Public Works 10.8 - 9,013 18,027 26,690 26,690 26,690 26,690 26,690 26,690 26,690 26,690
Engineering Department 10.8 - 4,099 8,197 12,137 12,137 12,137 12,137 12,137 12,137 12,137 12,137
Finance Department 10.8 - 5,836 11,672 17,282 17,282 17,282 17,282 17,282 17,282 17,282 17,282
Total Financing Requirements 11,484$ 116,487$ 221,045$ 310,933$ 310,933$ 310,933$ 310,933$ 310,933$ 310,933$ 310,933$ 310,933$
General Fund Fiscal Impact
Ongoing Surplus/(Deficit) 109,524$ 127,849$ 141,830$ 51,942$ 51,942$ 51,942$ 51,942$ 51,942$ 51,942$ 51,942$ 51,942$
Surplus/(Deficit) per Unit 1,063$ 621$ 465$ 170$ 170$ 170$ 170$ 170$ 170$ 170$ 170$
Revenue/Cost Ratio 10.54 2.10 1.64 1.17 1.17 1.17 1.17 1.17 1.17 1.17 1.17
10.1 Cumulative Residents
Residential Absorption Assumptions 3 103 103 99 - - - - - - - -
Total Cumulative Units 3 103 206 305 305 305 305 305 305 305 305 305
Total Cumulative Residents 3.20 3 330 659 976 976 976 976 976 976 976 976 976
10.2 Residential Property Value per Unit
Subtotal Assessed Value 360,234$ 3 37,104,065$ 37,104,065$ 35,663,130$ -$ -$ -$ -$ -$ -$ -$ -$
Total Cumulative Residential Assessed Value 37,104,065$ 74,208,130$ 109,871,260$ 109,871,260$ 109,871,260$ 109,871,260$ 109,871,260$ 109,871,260$ 109,871,260$ 109,871,260$ 109,871,260$
10.3 Property Tax
Basic Tax Paid - Residential 1.00% 4 371,041$ 742,081$ 1,098,713$ 1,098,713$ 1,098,713$ 1,098,713$ 1,098,713$ 1,098,713$ 1,098,713$ 1,098,713$ 1,098,713$
City of Menifee - General Fund 6.6184% 4 24,557 49,114 72,717 72,717 72,717 72,717 72,717 72,717 72,717 72,717 72,717
City of Menifee - Fire Protection Fund 6.4270% 4 23,847 47,693 70,614 70,614 70,614 70,614 70,614 70,614 70,614 70,614 70,614
Total Residential Property Tax 48,404$ 96,807$ 143,331$ 143,331$ 143,331$ 143,331$ 143,331$ 143,331$ 143,331$ 143,331$ 143,331$
10.4 Property Tax in Lieu of MVLF Revenue
Cumulative Assessed Value 5 37,104,065$ 74,208,130$ 109,871,260$ 109,871,260$ 109,871,260$ 109,871,260$ 109,871,260$ 109,871,260$ 109,871,260$ 109,871,260$ 109,871,260$
(Less) Existing Land Value 5 (3,324,896) (3,324,896) (3,324,896) (3,324,896) (3,324,896) (3,324,896) (3,324,896) (3,324,896) (3,324,896) (3,324,896) (3,324,896)
Net (New) Cumulative Assessed Value 33,779,169$ 70,883,234$ 106,546,364$ 106,546,364$ 106,546,364$ 106,546,364$ 106,546,364$ 106,546,364$ 106,546,364$ 106,546,364$ 106,546,364$
Total Property In Lieu of MVLF 0.6980$ 5 23,579$ 49,479$ 74,373$ 74,373$ 74,373$ 74,373$ 74,373$ 74,373$ 74,373$ 74,373$ 74,373$
10.5 Residential Documentary Transfer Tax
Residential Property Turnover Rate 10.0% 6 3,710,406$ 7,420,813$ 10,987,126$ 10,987,126$ 10,987,126$ 10,987,126$ 10,987,126$ 10,987,126$ 10,987,126$ 10,987,126$ 10,987,126$
Transfer Tax as a % of Price 0.06% 6 - - - - - - - - - - -
Total Documentary Transfer Tax 2,041$ 4,081$ 6,043$ 6,043$ 6,043$ 6,043$ 6,043$ 6,043$ 6,043$ 6,043$ 6,043$
10.6 Off-Site Sales Tax Factor Ref.
Annual Housing Costs 93,641$ 7 9,644,978$ 19,289,956$ 28,560,372$ 28,560,372$ 28,560,372$ 28,560,372$ 28,560,372$ 28,560,372$ 28,560,372$ 28,560,372$ 28,560,372$
Consumer Expenditure at 73.65% (c) 74% 7 7,103,526 14,207,053 21,034,714 21,034,714 21,034,714 21,034,714 21,034,714 21,034,714 21,034,714 21,034,714 21,034,714
Taxable Spending 32.56% 7 2,312,908 4,625,816 6,848,903 6,848,903 6,848,903 6,848,903 6,848,903 6,848,903 6,848,903 6,848,903 6,848,903
Less: On-site Capture 0.00% 7 - - - - - - - - - - -
Less: Capture outside City Boundaries 25.00% 7 (578,227) (1,156,454) (1,712,226) (1,712,226) (1,712,226) (1,712,226) (1,712,226) (1,712,226) (1,712,226) (1,712,226) (1,712,226)
Net Taxable Spending 1,734,681$ 3,469,362$ 5,136,677$ 5,136,677$ 5,136,677$ 5,136,677$ 5,136,677$ 5,136,677$ 5,136,677$ 5,136,677$ 5,136,677$
Annual Sales Taxes to City 1.00% 7 17,347 34,694 51,367 51,367 51,367 51,367 51,367 51,367 51,367 51,367 51,367
Annual Use Tax 10.50% 7 1,821 3,643 5,394 5,394 5,394 5,394 5,394 5,394 5,394 5,394 5,394
Total Sales Tax 19,168$ 38,336$ 56,760$ 56,760$ 56,760$ 56,760$ 56,760$ 56,760$ 56,760$ 56,760$ 56,760$
Annual Sales Taxes to City 1.00% 7 17,347$ 34,694$ 51,367$ 51,367$ 51,367$ 51,367$ 51,367$ 51,367$ 51,367$ 51,367$ 51,367$
Measure DD Revenue to the General Fund 66.20% 7 11,484$ 22,967$ 34,005$ 34,005$ 34,005$ 34,005$ 34,005$ 34,005$ 34,005$ 34,005$ 34,005$
10.7 Other General Fund Discretionary Revenue
Building/Planning/Engineering Fees -$ 8 -$ -$ -$ -$ -$ -$ -$ -$ -$ -$ -$
Franchise Fees 28.71 8 9,464 18,928 28,025 28,025 28,025 28,025 28,025 28,025 28,025 28,025 28,025
County Augmentation 10.04 8 3,308 6,616 9,796 9,796 9,796 9,796 9,796 9,796 9,796 9,796 9,796
Business License 0.93 8 305 611 904 904 904 904 904 904 904 904 904
Transient Occupancy Tax - 8 - - - - - - - - - - -
Recreation Program Fees 2.03 8 668 1,336 1,978 1,978 1,978 1,978 1,978 1,978 1,978 1,978 1,978
Fines & Fees 4.89 8 1,610 3,221 4,769 4,769 4,769 4,769 4,769 4,769 4,769 4,769 4,769
Misc. Fees 1.69 8 558 1,116 1,653 1,653 1,653 1,653 1,653 1,653 1,653 1,653 1,653
Transfer In 1.27 8 418 837 1,239 1,239 1,239 1,239 1,239 1,239 1,239 1,239 1,239
Total Other General Fund Discretionary Revenue 16,333$ 32,665$ 48,363$ 48,363$ 48,363$ 48,363$ 48,363$ 48,363$ 48,363$ 48,363$ 48,363$
Total General Fund Recurring Revenues 121,008$ 244,336$ 362,875$ 362,875$ 362,875$ 362,875$ 362,875$ 362,875$ 362,875$ 362,875$ 362,875$
May 4, 2018
Table 10 - Phasing Analysis Detail

Rockport Ranch
Table
Factor Ref. 1 2 3 4 5 6 7 8 9 10 11
May 4, 2018
Table 10 - Phasing Analysis Detail
10.8 General Fund Recurring Expenditures (a)
Legislative
City Council 0.82$ 9 -$ 269$ 538$ 797$ 797$ 797$ 797$ 797$ 797$ 797$ 797$
City Attorney 1.67 9 - 550 1,100 1,628 1,628 1,628 1,628 1,628 1,628 1,628 1,628
City Clerk 1.59 9 - 524 1,047 1,551 1,551 1,551 1,551 1,551 1,551 1,551 1,551
Administrative Services - 9 - - - - - - - - - - -
City Manager 3.88 9 - 1,279 2,558 3,788 3,788 3,788 3,788 3,788 3,788 3,788 3,788
Subtotal - 2,622 5,244 7,764 7,764 7,764 7,764 7,764 7,764 7,764 7,764
Public Safety
Police Services 120.73$ 9 -$ 39,794$ 79,588$ 117,837$ 117,837$ 117,837$ 117,837$ 117,837$ 117,837$ 117,837$ 117,837$
Fire Services 93.55 9 - 30,834 61,669 91,305 91,305 91,305 91,305 91,305 91,305 91,305 91,305
Emergency Operations Services 0.07 9 - 23 46 68 68 68 68 68 68 68 68
Animal Control 3.94 9 - 1,299 2,598 3,846 3,846 3,846 3,846 3,846 3,846 3,846 3,846
Measure DD - 9 11,484 22,967 34,005 34,005 34,005 34,005 34,005 34,005 34,005 34,005 34,005
Subtotal 11,484 94,917 177,905 247,061 247,061 247,061 247,061 247,061 247,061 247,061 247,061
Public Works
Community Development 9.15$ 9 -$ 3,015$ 6,031$ 8,929$ 8,929$ 8,929$ 8,929$ 8,929$ 8,929$ 8,929$ 8,929$
Building and Safety 7.91 9 - 2,607 5,215 7,721 7,721 7,721 7,721 7,721 7,721 7,721 7,721
Code Enforcement 3.25 9 - 1,070 2,140 3,168 3,168 3,168 3,168 3,168 3,168 3,168 3,168
Economic Development 3.79 9 - 1,249 2,499 3,700 3,700 3,700 3,700 3,700 3,700 3,700 3,700
Public Works Administration 3.25 9 - 1,071 2,142 3,172 3,172 3,172 3,172 3,172 3,172 3,172 3,172
Subtotal - 9,013 18,027 26,690 26,690 26,690 26,690 26,690 26,690 26,690 26,690
Engineering Department
Engineering 11.18$ 9 -$ 3,686$ 7,373$ 10,916$ 10,916$ 10,916$ 10,916$ 10,916$ 10,916$ 10,916$ 10,916$
NPDES 1.25 9 - 412 824 1,220 1,220 1,220 1,220 1,220 1,220 1,220 1,220
Subtotal - 4,099 8,197 12,137 12,137 12,137 12,137 12,137 12,137 12,137 12,137
Finance Department
Finance 5.16$ 9 -$ 1,700$ 3,399$ 5,033$ 5,033$ 5,033$ 5,033$ 5,033$ 5,033$ 5,033$ 5,033$
Non-Departmental 5.26 9 - 1,734 3,467 5,133 5,133 5,133 5,133 5,133 5,133 5,133 5,133
Human Resources 1.73 9 - 569 1,138 1,685 1,685 1,685 1,685 1,685 1,685 1,685 1,685
Community Services 5.56 9 - 1,834 3,667 5,430 5,430 5,430 5,430 5,430 5,430 5,430 5,430
Subtotal - 5,836 11,672 17,282 17,282 17,282 17,282 17,282 17,282 17,282 17,282
Total General Fund Recurring Expenditures 11,484$ 116,487$ 221,045$ 310,933$ 310,933$ 310,933$ 310,933$ 310,933$ 310,933$ 310,933$ 310,933$
Net Annual Surplus/ (Deficit) 109,524$ 127,849$ 141,830$ 51,942$ 51,942$ 51,942$ 51,942$ 51,942$ 51,942$ 51,942$ 51,942$
Footnotes:
(a) Expenditures are assumed in the Fiscal Year following move-ins to match information used for City

Rockport Ranch
Table
Factor Ref.
General Fund Financing Sources
Property Tax 10.3
Property Tax in Lieu of MVLF 10.4
Measure DD 10.6
Sales Tax 10.6
Building/Planning/Engineering Fees 10.7
Franchise Fees 10.7
County Augmentation 10.7
Business License 10.7
Transient Occupancy Tax 10.7
Recreation Program Fees 10.7
Fines & Fees 10.7
Real Property Transfer Tax 10.5
Misc. Fees 10.7
Transfer In 10.7
Total Financing Sources
General Fund Financing Requirements
Legislative 10.8
Police Services 10.8
Fire Services 10.8
Emergency Operations Services 10.8
Animal Control 10.8
Measure DD 10.8
Public Works 10.8
Engineering Department 10.8
Finance Department 10.8
Total Financing Requirements
General Fund Fiscal Impact
Ongoing Surplus/(Deficit)
Surplus/(Deficit) per Unit
Revenue/Cost Ratio
10.1 Cumulative Residents
Residential Absorption Assumptions 3
Total Cumulative Units 3
Total Cumulative Residents 3.20 3
10.2 Residential Property Value per Unit
Subtotal Assessed Value 360,234$ 3
Total Cumulative Residential Assessed Value
10.3 Property Tax
Basic Tax Paid - Residential 1.00% 4
City of Menifee - General Fund 6.6184% 4
City of Menifee - Fire Protection Fund 6.4270% 4
Total Residential Property Tax
10.4 Property Tax in Lieu of MVLF Revenue
Cumulative Assessed Value 5
(Less) Existing Land Value 5
Net (New) Cumulative Assessed Value
Total Property In Lieu of MVLF 0.6980$ 5
10.5 Residential Documentary Transfer Tax
Residential Property Turnover Rate 10.0% 6
Transfer Tax as a % of Price 0.06% 6
Total Documentary Transfer Tax
10.6 Off-Site Sales Tax Factor Ref.
Annual Housing Costs 93,641$ 7
Consumer Expenditure at 73.65% (c) 74% 7
Taxable Spending 32.56% 7
Less: On-site Capture 0.00% 7
Less: Capture outside City Boundaries 25.00% 7
Net Taxable Spending
Annual Sales Taxes to City 1.00% 7
Annual Use Tax 10.50% 7
Total Sales Tax
Annual Sales Taxes to City 1.00% 7
Measure DD Revenue to the General Fund 66.20% 7
10.7 Other General Fund Discretionary Revenue
Building/Planning/Engineering Fees -$ 8
Franchise Fees 28.71 8
County Augmentation 10.04 8
Business License 0.93 8
Transient Occupancy Tax - 8
Recreation Program Fees 2.03 8
Fines & Fees 4.89 8
Misc. Fees 1.69 8
Transfer In 1.27 8
Total Other General Fund Discretionary Revenue
Total General Fund Recurring Revenues
May 4, 2018
Table 10 - Phasing Analysis Detail
12 13 14 15 16 17 18 19 20
143,331$ 143,331$ 143,331$ 143,331$ 143,331$ 143,331$ 143,331$ 143,331$ 143,331$
74,373 74,373 74,373 74,373 74,373 74,373 74,373 74,373 74,373
34,005 34,005 34,005 34,005 34,005 34,005 34,005 34,005 34,005
56,760 56,760 56,760 56,760 56,760 56,760 56,760 56,760 56,760
- - - - - - - - -
28,025 28,025 28,025 28,025 28,025 28,025 28,025 28,025 28,025
9,796 9,796 9,796 9,796 9,796 9,796 9,796 9,796 9,796
904 904 904 904 904 904 904 904 904
- - - - - - - - -
1,978 1,978 1,978 1,978 1,978 1,978 1,978 1,978 1,978
4,769 4,769 4,769 4,769 4,769 4,769 4,769 4,769 4,769
6,043 6,043 6,043 6,043 6,043 6,043 6,043 6,043 6,043
1,653 1,653 1,653 1,653 1,653 1,653 1,653 1,653 1,653
1,239 1,239 1,239 1,239 1,239 1,239 1,239 1,239 1,239
362,875$ 362,875$ 362,875$ 362,875$ 362,875$ 362,875$ 362,875$ 362,875$ 362,875$
7,764$ 7,764$ 7,764$ 7,764$ 7,764$ 7,764$ 7,764$ 7,764$ 7,764$
117,837 117,837 117,837 117,837 117,837 117,837 117,837 117,837 117,837
91,305 91,305 91,305 91,305 91,305 91,305 91,305 91,305 91,305
68 68 68 68 68 68 68 68 68
3,846 3,846 3,846 3,846 3,846 3,846 3,846 3,846 3,846
34,005 34,005 34,005 34,005 34,005 34,005 34,005 34,005 34,005
26,690 26,690 26,690 26,690 26,690 26,690 26,690 26,690 26,690
12,137 12,137 12,137 12,137 12,137 12,137 12,137 12,137 12,137
17,282 17,282 17,282 17,282 17,282 17,282 17,282 17,282 17,282
310,933$ 310,933$ 310,933$ 310,933$ 310,933$ 310,933$ 310,933$ 310,933$ 310,933$
51,942$ 51,942$ 51,942$ 51,942$ 51,942$ 51,942$ 51,942$ 51,942$ 51,942$
170$ 170$ 170$ 170$ 170$ 170$ 170$ 170$ 170$
1.17 1.17 1.17 1.17 1.17 1.17 1.17 1.17 1.17
- - - - - - - - -
305 305 305 305 305 305 305 305 305
976 976 976 976 976 976 976 976 976
-$ -$ -$ -$ -$ -$ -$ -$ -$
109,871,260$ 109,871,260$ 109,871,260$ 109,871,260$ 109,871,260$ 109,871,260$ 109,871,260$ 109,871,260$ 109,871,260$
1,098,713$ 1,098,713$ 1,098,713$ 1,098,713$ 1,098,713$ 1,098,713$ 1,098,713$ 1,098,713$ 1,098,713$
72,717 72,717 72,717 72,717 72,717 72,717 72,717 72,717 72,717
70,614 70,614 70,614 70,614 70,614 70,614 70,614 70,614 70,614
143,331$ 143,331$ 143,331$ 143,331$ 143,331$ 143,331$ 143,331$ 143,331$ 143,331$
109,871,260$ 109,871,260$ 109,871,260$ 109,871,260$ 109,871,260$ 109,871,260$ 109,871,260$ 109,871,260$ 109,871,260$
(3,324,896) (3,324,896) (3,324,896) (3,324,896) (3,324,896) (3,324,896) (3,324,896) (3,324,896) (3,324,896)
106,546,364$ 106,546,364$ 106,546,364$ 106,546,364$ 106,546,364$ 106,546,364$ 106,546,364$ 106,546,364$ 106,546,364$
74,373$ 74,373$ 74,373$ 74,373$ 74,373$ 74,373$ 74,373$ 74,373$ 74,373$
10,987,126$ 10,987,126$ 10,987,126$ 10,987,126$ 10,987,126$ 10,987,126$ 10,987,126$ 10,987,126$ 10,987,126$
- - - - - - - - -
6,043$ 6,043$ 6,043$ 6,043$ 6,043$ 6,043$ 6,043$ 6,043$ 6,043$
28,560,372$ 28,560,372$ 28,560,372$ 28,560,372$ 28,560,372$ 28,560,372$ 28,560,372$ 28,560,372$ 28,560,372$
21,034,714 21,034,714 21,034,714 21,034,714 21,034,714 21,034,714 21,034,714 21,034,714 21,034,714
6,848,903 6,848,903 6,848,903 6,848,903 6,848,903 6,848,903 6,848,903 6,848,903 6,848,903
- - - - - - - - -
(1,712,226) (1,712,226) (1,712,226) (1,712,226) (1,712,226) (1,712,226) (1,712,226) (1,712,226) (1,712,226)
5,136,677$ 5,136,677$ 5,136,677$ 5,136,677$ 5,136,677$ 5,136,677$ 5,136,677$ 5,136,677$ 5,136,677$
51,367 51,367 51,367 51,367 51,367 51,367 51,367 51,367 51,367
5,394 5,394 5,394 5,394 5,394 5,394 5,394 5,394 5,394
56,760$ 56,760$ 56,760$ 56,760$ 56,760$ 56,760$ 56,760$ 56,760$ 56,760$
51,367$ 51,367$ 51,367$ 51,367$ 51,367$ 51,367$ 51,367$ 51,367$ 51,367$
34,005$ 34,005$ 34,005$ 34,005$ 34,005$ 34,005$ 34,005$ 34,005$ 34,005$
-$ -$ -$ -$ -$ -$ -$ -$ -$
28,025 28,025 28,025 28,025 28,025 28,025 28,025 28,025 28,025
9,796 9,796 9,796 9,796 9,796 9,796 9,796 9,796 9,796
904 904 904 904 904 904 904 904 904
- - - - - - - - -
1,978 1,978 1,978 1,978 1,978 1,978 1,978 1,978 1,978
4,769 4,769 4,769 4,769 4,769 4,769 4,769 4,769 4,769
1,653 1,653 1,653 1,653 1,653 1,653 1,653 1,653 1,653
1,239 1,239 1,239 1,239 1,239 1,239 1,239 1,239 1,239
48,363$ 48,363$ 48,363$ 48,363$ 48,363$ 48,363$ 48,363$ 48,363$ 48,363$
362,875$ 362,875$ 362,875$ 362,875$ 362,875$ 362,875$ 362,875$ 362,875$ 362,875$

Rockport Ranch
Table
Factor Ref.
May 4, 2018
Table 10 - Phasing Analysis Detail
10.8 General Fund Recurring Expenditures (a)
Legislative
City Council 0.82$ 9
City Attorney 1.67 9
City Clerk 1.59 9
Administrative Services - 9
City Manager 3.88 9
Subtotal
Public Safety
Police Services 120.73$ 9
Fire Services 93.55 9
Emergency Operations Services 0.07 9
Animal Control 3.94 9
Measure DD - 9
Subtotal
Public Works
Community Development 9.15$ 9
Building and Safety 7.91 9
Code Enforcement 3.25 9
Economic Development 3.79 9
Public Works Administration 3.25 9
Subtotal
Engineering Department
Engineering 11.18$ 9
NPDES 1.25 9
Subtotal
Finance Department
Finance 5.16$ 9
Non-Departmental 5.26 9
Human Resources 1.73 9
Community Services 5.56 9
Subtotal
Total General Fund Recurring Expenditures
Net Annual Surplus/ (Deficit)
Footnotes:
(a) Expenditures are assumed in the Fiscal Year following move-ins to match information used for City
12 13 14 15 16 17 18 19 20
797$ 797$ 797$ 797$ 797$ 797$ 797$ 797$ 797$
1,628 1,628 1,628 1,628 1,628 1,628 1,628 1,628 1,628
1,551 1,551 1,551 1,551 1,551 1,551 1,551 1,551 1,551
- - - - - - - - -
3,788 3,788 3,788 3,788 3,788 3,788 3,788 3,788 3,788
7,764 7,764 7,764 7,764 7,764 7,764 7,764 7,764 7,764
117,837$ 117,837$ 117,837$ 117,837$ 117,837$ 117,837$ 117,837$ 117,837$ 117,837$
91,305 91,305 91,305 91,305 91,305 91,305 91,305 91,305 91,305
68 68 68 68 68 68 68 68 68
3,846 3,846 3,846 3,846 3,846 3,846 3,846 3,846 3,846
34,005 34,005 34,005 34,005 34,005 34,005 34,005 34,005 34,005
247,061 247,061 247,061 247,061 247,061 247,061 247,061 247,061 247,061
8,929$ 8,929$ 8,929$ 8,929$ 8,929$ 8,929$ 8,929$ 8,929$ 8,929$
7,721 7,721 7,721 7,721 7,721 7,721 7,721 7,721 7,721
3,168 3,168 3,168 3,168 3,168 3,168 3,168 3,168 3,168
3,700 3,700 3,700 3,700 3,700 3,700 3,700 3,700 3,700
3,172 3,172 3,172 3,172 3,172 3,172 3,172 3,172 3,172
26,690 26,690 26,690 26,690 26,690 26,690 26,690 26,690 26,690
10,916$ 10,916$ 10,916$ 10,916$ 10,916$ 10,916$ 10,916$ 10,916$ 10,916$
1,220 1,220 1,220 1,220 1,220 1,220 1,220 1,220 1,220
12,137 12,137 12,137 12,137 12,137 12,137 12,137 12,137 12,137
5,033$ 5,033$ 5,033$ 5,033$ 5,033$ 5,033$ 5,033$ 5,033$ 5,033$
5,133 5,133 5,133 5,133 5,133 5,133 5,133 5,133 5,133
1,685 1,685 1,685 1,685 1,685 1,685 1,685 1,685 1,685
5,430 5,430 5,430 5,430 5,430 5,430 5,430 5,430 5,430
17,282 17,282 17,282 17,282 17,282 17,282 17,282 17,282 17,282
310,933$ 310,933$ 310,933$ 310,933$ 310,933$ 310,933$ 310,933$ 310,933$ 310,933$
51,942$ 51,942$ 51,942$ 51,942$ 51,942$ 51,942$ 51,942$ 51,942$ 51,942$
![ROCKPORT PUBLIC SCHOOLS GIVES BACK: A FIRST NIGHT · [ ROCKPORT, MA ] WELCOME TO RPS GIVES BACK: A FIRST NIGHT FOR EDUCATION The Rockport Public School Community and the Town of Rockport](https://img.pdfslide.net/doc/110x75/5f291645751f531d1b49dcd6/rockport-public-schools-gives-back-a-first-night-rockport-ma-welcome-to-rps.jpg)