Embed Size (px)
Citation preview

Fiscal Implications of Urbanization
Sanjeev GuptaDeputy Director
Fiscal Affairs DepartmentINTERNATIONAL MONETARY FUND
SEPTEMBER 21, 2017

OutlineI. Stylized facts about the urbanization
II. Fiscal policy and urbanization nexus
III. How to mobilize resources for cities
IV. Conclusions
1

I. Stylized Facts about Urbanization
2

Rapid increase in urbanization
From 746 million in 1950 to 3.4 billion in 2014
Currently 54% of the world’s population
resides in urban areas
Going forward, much of the urbanization is
expected to happen in developing countries
3
Number of urban agglomeration with 1 million or
more inhabitants
3 3 3 6 8 9 15 20 24 2738 43 47
5668
84
27 33 3947 53 60
7287
115137
172190
221
267
302
331
- 40
10
60
110
160
210
260
310
360
1950 1960 1970 1980 1990 2000 2010 2020 2030
Africa Asia Europe
L.A. and the Caribbean Nothern America Ocenia
Source: UN Department of Economic and Social Affairs (UN DESA)
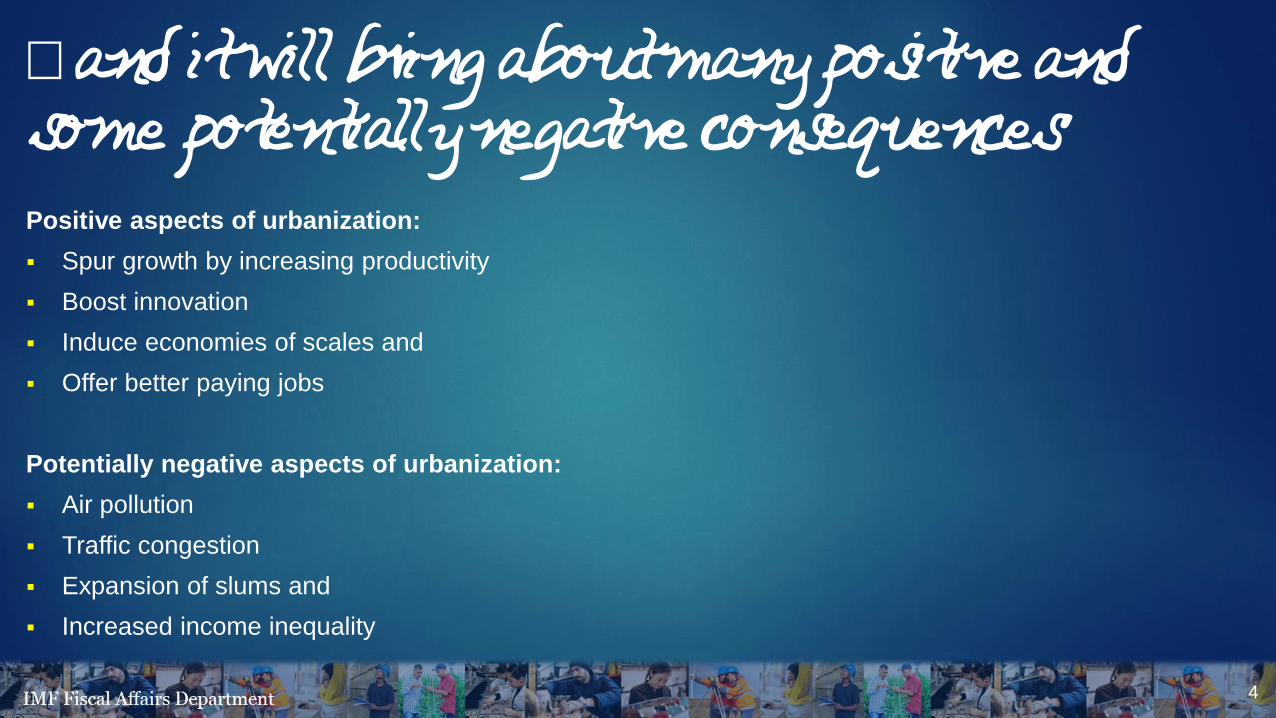
…and it will bring about many positive and some potentially negative consequencesPositive aspects of urbanization:
Spur growth by increasing productivity
Boost innovation
Induce economies of scales and
Offer better paying jobs
Potentially negative aspects of urbanization:
Air pollution
Traffic congestion
Expansion of slums and
Increased income inequality
4

II. Fiscal Policy and Urbanization Nexus
5

What are the fiscal implications?
Urbanization in developing countries will entail:
Use of more land
Construction of more housing
Investment in infrastructure
Tackling environmental damage
A key fiscal challenge:
How to mobilize resources for cities to ensure sustainable provision of infrastructure and basic
services?
6

Rapid urbanization creates large infrastructure needs in DCs
70% of global infrastructure demand will emanate from urban areas
90% of the increase in urban population by 2050 will be concentrated in Asia and Africa
Already 650 million people in Africa and 427 million people in Asia lack access to electricity
240 million of urban residents in Africa and 523 million urban residents in Asia live in slums
Going forward, infrastructure annual investment needs are estimated at $240 billion in Africa and $2.08 trillion in Asia
7
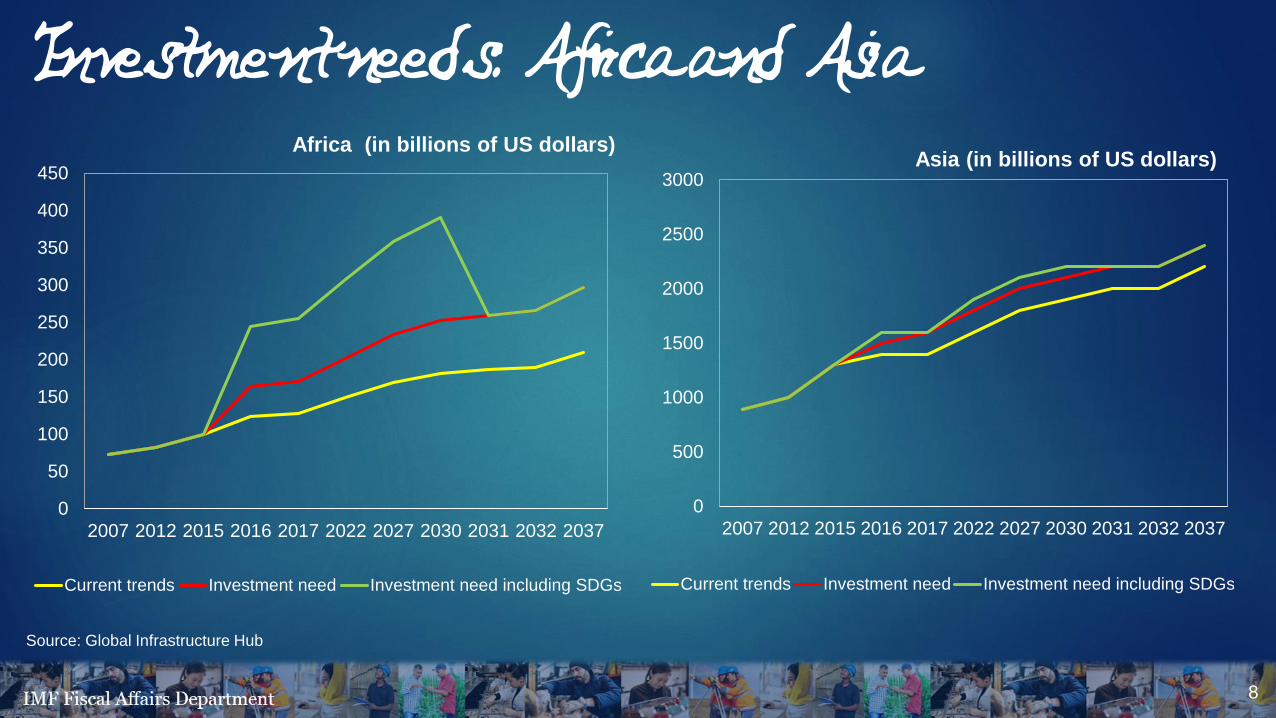
Investment needs: Africa and Asia
8
Source: Global Infrastructure Hub
0
50
100
150
200
250
300
350
400
450
2007 2012 2015 2016 2017 2022 2027 2030 2031 2032 2037
Current trends Investment need Investment need including SDGs
0
500
1000
1500
2000
2500
3000
2007 2012 2015 2016 2017 2022 2027 2030 2031 2032 2037
Current trends Investment need Investment need including SDGs
Asia (in billions of US dollars)Africa (in billions of US dollars)

Rapid urbanization induces increase in environmental damage
Urban areas generate 80 percent of the world’s GDP and consume more than two-thirds of the world’s energy, thereby generating 70 percent of world’s greenhouse (GHG) emissions
Buildings - both commercial and residential - account for a fifth of the total energy emissions
Transportation accounts for one fifth of global carbon emissions
The IMF has estimated the total cost of fossil fuel subsidies broadly defined at $5.3 trillion (or 6 percent of global GDP)
Removal of fossil fuel subsidies will:
1. Reduce global CO2 emissions by more than 20%
2. Reduce primary deaths from air pollution by more than 50%
3. Generate fiscal gains of $2.9 trillion (3.6% of world GDP) for lowering distortionary taxes and high priority spending
9

III. How to mobilize resources for cities?
10

Many options
Reassess the design fiscal federal framework
Seek improvement in public investment processes
Leverage new sources of finance
Generate revenue from land assets (land value capture, land leases and land sales, and land asset management)
12

Reassess the Design of Intergovernmental Relations
In DCs, local governments collect on
average less than 25% of their spending
needs against 56% in much more
developed regions. This affects their
ability to finance urbanization
Ideally, one should seek to improve
fiscal arrangements (tax and expenditure
assignments) between federal and local
governments, but politically difficult in
the short term
12
Regions Revenues Expenditures
East Asia 20.0 40.0
North America 17.8 26.8
Europe 13.0 23.9
Latin America 4.0 11.1
Africa 3.2 7.9
South Asia 1.5 16.0
Source: United Cities and Local Governments (UCLG)
Local Government Shares of Total Public Sector

Seek improvements in public investment processes
On average, DCs lose about 40% of the value of their public investment because of
inefficiencies in the investment process
In emerging and LICs, Public Investment Management Assessments suggest weaknesses in
institutions that govern public investment, particularly in the implementation stage of
investment. Additional fiscal space can be created both at the federal and local levels by
improving investment processes
13
Leveraging Innovative Financing Mechanism
Private sector: The assets under management (AUM) controlled by the private finance is
estimated at $120 trillion globally. However, infrastructure projects attract only 10% of private
equity AUM
Public finance: The total official development assistant (ODA) is estimated at $186.1 billion.
However, infrastructure projects financing account only for 23% of total ODA
Urban Development Fund: Creation of sustainable Urban Development Fund to make urban
infrastructure investments more attractive to the private sector
14

Revenue from land assetsLand Value Capture (LVC)
Land values increase with urbanization because of government investment in infrastructure
Fair to tax the surplus - price appreciation - created by the provision of public infrastructure through betterment levies, a one time tax
Betterment levies collected at the time investment or when permission to change land is granted
Land Value Capture has been used in Brazil and Hong Kong ($18 billion over 25 years)
17
0
2
4
6
8
10
12
Water supply Road paving Wastewater removal
5-10 km 15-20 km 25-30 km
Source: Paterson (2009)
Land value gains from infrastructure investment in Recife,
Brazil
Revenue from land assets Land lease and land sale
It also benefits corporate taxes
Important in China: 40% to 60% of revenue for local governments (between 2008 and 2014 it generated $2.4 trillion) through long-term leasing, e.g., 50 years for industrial uses, 70 years for residential use
Land lease/sale has some notable downsides. It can:
1. Reduce land for agriculture
2. Make fiscal position unsustainable over the medium to long term when local governments exhaust land resources
3. Not conducive to transparency if transactions are conducted off budget
18

Revenue from land assets
Land asset management
Huge land and property assets in public balance sheets, which are noncore
Worth exploring swapping these (noncore) assets for productive assets.
Example Egypt sold desert land for construction of Cairo Ring Road
19

Revenue from property taxation
Fair for governments to capture part of the price increase, and is efficient as it
does not affect urban investment
A sustainable source of revenue (less cyclical)
20

Revenue from property taxation…could also contribute to reducing inequality within
countries
More urbanized countries seem to be more unequal
In the U.S., 23% of the increase in earning inequality is
explained by large urban areas
Higher urbanization tends to attract more productive
workers
Skilled labor captures a share of the urban rents at the
expense of the landowners (e.g., financial sector workers
in London)
Rationale for a more progressive income taxation and not
only land taxation
21
10
15
20
25
30
35
40
45
50
55
60
15 35 55 75 95 115
Urb
an
po
pu
latio
n
Gini of income
Source: WB, UN DESA and IMF staff estimates

Revenue from property taxation
However, revenue from property taxes is relatively low in emerging and low-income countries
22
Source: OECD and IMF
OECD
countries
Emerging
Markets
Low income
countries
Property taxes as
% of GDP1.9 0.6 0.3
Property taxes as
% total taxation 5.5 3.4 1.8

Revenue from property taxation
Local governments in OECD rely more on property taxes
Taxes on property as % of total local revenue: 46% for local governments in OECD countries
24
Source: OECD
0%
20%
40%
60%
80%
100%
Esto
nia
Slo
vak R
epu
blic
New
Ze
ala
nd
United
Sta
tes
Pola
nd
Slo
ven
ia
Cana
da
Latv
ia
Sw
ede
n
United
Kin
gd
om
Ja
pa
n
Chile
De
nm
ark
Isra
el
Me
xic
o
Port
ug
al
Neth
erla
nds
Fra
nce
Icela
nd
Italy
Fin
land
Austr
alia
Czech R
ep
ub
lic
Spa
in
Hung
ary
Germ
any
Ire
land
OE
CD
-…
Belg
ium
Austr
ia
Gre
ece
Norw
ay
Kore
a
Tu
rkey
Sw
itze
rla
nd
Luxe
mb
ou
rg
Recurrent on property Recurrent on net wealth Estate, inheritance and gift
Financial and capital transactions Non-recurrent on property
Composition of Property Taxes in OECD

Revenue from property taxation
There are many obstacles to collecting higher property taxes:
1. Base not updated on a regular basis because of weak administration, leading the
authorities to raise tax rates instead. This increases the unpopularity of property
taxes. Tax rates range between 10 and 30 percent in Egypt and Kenya as against
0.5 to 1 percent in USA and Europe.
2. Tax base erosion through incentives
3. Weak or undefined property rights
25

IV. Conclusions
26

Key messages on fiscal implications of rapid urbanization
Rapid urbanization is a challenge for policymakers, which policymakers has to manage with an appropriate policy mix
Fiscal policy is key to managing this challenge
An effective fiscal policy can help to support sustainable infrastructure that the rapid urbanization requires and ensure adequate provision of public services
It can also help to internalize negative externalities generated by urban areas
27

References Baffour Awuah, K. G., Hammond, F. N., Lamond, J. and Booth, C. (2014) Benefits of urban land use planning in Ghana. Geoforum, 51. pp. 37-46. ISSN 0016-
7185.
Baum-Snow N. and Ronni Pavan R., (2013), ‘’ Inequality and City Size’’, Review of Economics and Statistics, Volume 95 | Issue 5 | December 2013, p.1535-1548.
Behrens K. and F. Robert-Nicoud ‘‘Survival of the Fittest in Cities: Urbanisation and Inequality’’, The Economic Journal.
Bhattacharya A., Meltzer J., Oppenhem J,, Qureshi Z. and Stern N. (2016), ‘’Delivring on Sustainable Infrastructure for Better Development and Better Climate’’, Global Economy and Development at Brookings.
CCFLA (2015), ‘’The State of City Climate Finance 2015’’. Cities Climate Finance Leadership Alliance.
Clements B., Coady D., Fabrizio S., Gupta S., Alleyne T., and Sdralevich C. (2013), ‘’Energy Subsidy Reform: Lessons and Implication’’, International Monetary Fund.
CKGSB Knowledge (2014), ‘’The Role of Land Sales in Local Government Financing in China’, Major Tian.’
Collier and al. (2017), ‘’Land and property taxes: Exploiting untapped municipal revenues’’, International Growth Center, Policy Brief.
Collier P. and Venables A. (2017), ‘’Who Gets the Urban Surplus’’, CERP Discussion Paper, No 12001.
Faye I. and Bah E. (2017), ‘’Housing Market Dynamic in Africa’’, forthcoming.
GCEC (2016), “”The Sustainable Infrastructure Imperative: Financing for Better Growth and Development’, The 2016 New Climate Economy Report, The Global Commission on the Economy.
Gupta S., Kangur C. and Wane A., (2014), “Efficiency-Adjusted Public Capital and Growth”, World Development, Vol. 57.
IEA (2012), “Energy Technology Perspectives 2012: Pathways to a Clean Energy System”. Paris: International Energy Agency.
IMF (2015), ‘’Making the Public Investment More Efficient’’, International Monetary Fund, Staff Report.
28

References (continued) Lin, G. C. and Yi F. (2011), ‘’Urban of capital or capitalization of urban land? Land development and local public finance in urbanizing China’’, Urban Geography,
32(1), pp. 50-79.
Lu Y. and Sun T. (2013), ‘’Local Government Financing Platforms in China: A Fortune or Misfortune?’’, IMF Working Paper 13/243.
Murray S., Kopanyi M. and McSharry P. (2016), ‘’A Land Value Tax for Kigali: Analysis and Policy Considerations’’, International Growth Center.
Norregaard J. (2015), “Taxing Immovable Property: Revenue Potential and Implementation Challenges” in Inequality and Fiscal Policy” by B. Clements, R. de Mooij, S. Gupta, and M. Keen, International Monetary Fund.
Paice E. (2015), ‘’Lagos Proves Africa’s Property Tax Potential’’, The Africa Report.
Peterson G. (2009), “”Unlocking Land Values to Finance Urban Infrastructure””, The World Bank.
Slack E. (2011), ‘’The Property Tax in Theory and Practice’’, IMFG Working Paper No. 2.
Ter-Minassian T. (2016), “Fiscal and Financial Issues for 21st Century Cities: Background and Overview”, Global Economy and Development at Brookings.
Ter-Minassian T. (1997), “Fiscal Federalism in Theory and Practice”, International Monetary Fund.
Ter-Minassian T. (2017), “Promoting Effective and Fiscally Sound Local Investments in Infrastructure”, Unpublished draft.
UCLG (2016), ‘’Financing Urban and Local Development: the Missing Link in Sustainable Development Finance’’, The Global Taskforce of Local and Regional Governments.
United Nations (2014), ‘’World Urbanization Prospects: The 2014 Revision, Highliths’’, ST/ESA/SER.A/352.
UNHABITAT (2011), ‘’Land and Property Tax: A Policy Guide’’, Global Land Tool Network.
Wu Xun (2016), ‘’China’s Growing Local Government Debt Levels’’, MIT Center for Finance and Policy.
Yin Qiu (2016), “The Role of Local Government in China's Urbanization: The Relationship Between. Local Land Finance and Government-led Urbanization”. MPA Research.
29