Embed Size (px)
Citation preview

Fiscal Policy over the Election Cycle in Low-
Income Countries
Christian Ebeke and Dilan Ölçer
WP/13/153

© 2013 International Monetary Fund WP/13/153
IMF Working Paper
Strategy, Policy, and Review Department
Fiscal Policy over the Election Cycle in Low-Income Countries1
Prepared by Christian Ebeke and Dilan Ölçer
Authorized for distribution by Chris Lane
June 2013
Abstract
Focusing on Low-Income Countries, we investigate the behavior of fiscal variables during and after
elections. The results indicate that during election years, government consumption significantly
increases and leads to higher fiscal deficits. During the two years following elections, the fiscal
adjustment takes the form of increased revenue mobilization in trade taxes and cuts to government
investment, with no significant cuts in government consumption. Using a new dataset on national
fiscal rules and IMF programs, we find that both the presence of fiscal rules and IMF programs help
dampen the magnitude of the political budget cycle in LICs. We conclude that elections not only
imply a macroeconomic cost when they take place but also trigger a painful fiscal adjustment in
which public investment is largely sacrificed.
JEL Classification Numbers: D72; E62; P16; P26
Keywords: Elections, budgets, fiscal rules, IMF programs
Author’s E-Mail Address: [email protected]; [email protected]
1 We would like to thank Chris Lane, Christian Mumssen, Catherine Patillo, Noah Ndela Jean-Frederic, Susan Yang, Alejandro
Guerson, colleagues in the Low-Income Countries Division of the Strategy, Policy, and Review Department, at the IMF as well as
participants at the 6th CESifo Workshop on Political Economy and the lunch seminar at Sciences Po (France).
This Working Paper should not be reported as representing the views of the IMF.
The views expressed in this Working Paper are those of the author(s) and do not necessarily
represent those of the IMF or IMF policy. Working Papers describe research in progress by the
author(s) and are published to elicit comments and to further debate.

2
Content Page
Abstract ..................................................................................................................................... 1
I. Introduction ........................................................................................................................... 3
II. How is fiscal policy conducted over the election cycle? Preliminary evidence .................. 5
A. Baseline specification and data ........................................................................................ 5
B. Baseline estimates ............................................................................................................ 8
Composition of expenditures ............................................................................................ 8
Composition of tax revenues ............................................................................................ 8
Overall fiscal balance ........................................................................................................ 9
III. Dealing with the endogeneity of election timing .............................................................. 10
IV. Domestic and international scrutiny ................................................................................. 11
A. Do fiscal rules matter? ................................................................................................... 11
B. IMF program engagement .............................................................................................. 12
V. Concluding remarks ........................................................................................................... 15
References ....................................................................................................................... 16
Appendix ............................................................................................................................. 19
Table A1: List of countries in the sample and number of national elections by country,
1990-2010 ....................................................................................................................... 19
Table A2. Descriptive statistics. LICs sample, 1990–2010. ........................................... 19
Table A3: Correlates of the participation into Fund programs in LICs. ......................... 20
Regression results ............................................................................................................... 21
Table 1. Estimates of the Political Budget Cycle across selected Fiscal Variables in
LICs: 1990–2010. ........................................................................................................... 21
Table 2: Addressing the endogeneity of the election timing in LICs. 1990–2010. ........ 22
Table 3. Do fiscal rules and IMF programs dampen the Political Budget Cycle in LICs?
......................................................................................................................................... 23

3
I. INTRODUCTION
There is growing literature that assesses the detrimental effects of policy volatility on long
term growth and aggregate welfare (Fatas and Mihov, 2003; 2012). One source of policy
volatility might be related to national elections and the incumbent’s incentive to use the
economic policy instruments for re-election purposes. Re-election minded incumbents might
have an incentive to use policy instruments (fiscal and/or monetary policy) in such a way that
during election years, public spending and/or money aggregate increase to satisfy the median
voter despite potential adverse effects on fiscal sustainability and aggregate macroeconomic
stability.2 These cycles appear because of asymmetric information where voters are assumed
to lack full information about the incumbent’s competencies.
Empirical studies on the political business cycle in the 1970s until the 1990s focused almost
entirely on advanced economies and generally do not find a regular statistically significant
evidence of cycles (Alesina et al., 1997; and Drazen, 2001, provide excellent reviews on the
empirical results). However, more recent studies have shown the existence of politically
driven economic cycles in developing countries on government current expenditures, indirect
tax revenues, and budget deficits (Brender and Drazen, 2005; Shi and Svensson, 2006;
Block, 2002; Schuknecht, 2000; Vergne, 2009; Drazen and Eslava, 2010; Ehrhart, 2012), and
monetary aggregates (Fouda, 1997; Block, 2002).
However, several limitations and pending issues remain. First, most of these studies did not
explicitly focus on Low Income Countries (LICs) but rather pooled together developing
countries. Our analysis focuses on LICs because they are particularly vulnerable when
conducting election-related cycles. With weaker institutional capacity and poor transparency
in budgets, these countries face greater risks of conducting election-related fiscal policies. By
depleting their fiscal buffers during election years, LICs further increase their
macroeconomic vulnerability and limit their capabilities of guarding themselves against
external shocks. Therefore, it is important to better understand the composition of the
political budget cycles in this type of counties and consider ways to mitigate related fiscal
policy volatility.
Second, although these papers give insight into what happens to specific variables during
elections, they do not provide any analysis of the composition of the post-election
adjustment. Block (2002) does analyze, in a sample restricted to Sub Saharan Africa, a
number of fiscal and monetary variables during and after elections and conclude that
government spending shifts toward more visible, current expenditures and away from public
investment. However, there are several limitations of his analysis. The period of study is
restricted to 1980 to 1995, although for many countries in Sub-Saharan Africa, elections
were not competitive before 1990, and even during the first half of 1990s.3 Moreover, the
2 See Brender and Drazen (2008) for an analysis of whether fiscal outcomes affect the re election prospects for
incumbents. They find that fiscal deficits do not improve incumbents’ re-election prospects in general. In
developed countries, a deficit even punishes the incumbent. 3 Our paper analyzes the whole period after 1990, takes into account both presidential and parliamentary
elections, distinguishes between endogenously as well as exogenously timed elections, and performs the
empirical analyses on various fiscal outcomes (expenditures, revenues, budget balance).
4
analysis is limited to presidential systems in order to address issues related to endogenously
timed elections, yet it induces an important selection bias.4 Our paper investigates the
behavior of a comprehensive set of fiscal variables during and two years after national
elections. It seeks to shed light on the main form of fiscal expansion during the election-year
and the composition of the fiscal retrenchment (if any) in the subsequent years. We use a
recent dataset, National Elections across Democracy and Autocracy (NELDA) (Hyde and
Marinov, 2012) for the election variable and follow the convention in this literature (e.g. Shi
and Svensson 2006; Brender and Drazen, 2008) by focusing on the highest level of national
elections. Therefore, we only include legislative elections for countries with parliamentary
political systems and executive elections for countries with presidential elections.
Third, the paper explores the efficiency of two main constraints on the ability of the
incumbent to pursue a politically-motivated fiscal impulse in election years. We formally test
whether active national fiscal rules and IMF programs in LICs help dampen the magnitude of
the political budget cycle by limiting the incumbent’s incentives to significantly modify
fiscal policy for re-election purposes. To our best knowledge, there is no empirical work that
examines the effects of fiscal rules and IMF programs on the likelihood, the size, and the
composition of the political budget cycles in LICs. Inspired by the pioneer work by Rose
(2006) in the case of US states, we test the extent to which national fiscal rules matter in
LICs using the recently published IMF dataset on fiscal rules (Schaechter et al., 2012). This
is an interesting question to investigate as experts always express doubts regarding the
effectiveness of these rules in the LICs context.5 The issue of the effect of IMF programs on
the political budget cycle in LICs is also intellectually attractive. With several LICs having
experienced various waves of IMF programs over the past decades, one important question
could be to which extent IMF program conditionalities have constrained the incumbents’
election-year extravagances. We follow the recent work by Hyde and O’Mahony (2010) but
focus on the dampening role of IMF programs on the political budget cycle in LICs.
Fourth, taking advantage of the comprehensive dataset on elections (NELDA) compiled by
Hyde and Marinov (2012), we are able to address the endogeneity of the election timing
within countries. Moreover, we also factor in the self-selection bias in the decision to adopt
fiscal rules or participate in IMF programs. The econometric models used control for several
variables that ensure that the election effects are well identified so that any shift in fiscal
variables associated with a national election must be interpreted as a discretionary fiscal
policy by the incumbent. These control variables include external sources of financing
4 Block (2002) analyses elections that take place at regular times in presidential systems. However, presidential
regimes have endogenously timed elections too, particularly in developing countries (Shi and Svensson, 2006).
Also, countries with presidential regimes have characteristics that systematically distinguish them from
parliamentary regimes (Persson and Tabellini, 2003).
5 Debt rules are the predominant national rules for LICs, possibly reflecting institutional weaknesses that would
complicate, for example the implementation of expenditure rules or cyclically-adjusted budget balance rules.
However, only 4 LICs use national fiscal rules. Other LICs operate under supra-national rules. However, the
enforcement and compliance with supranational fiscal rules has been, at best, mixed, in most EU member states,
WAEMU countries, and in the CEMAC region (Cabezon and Prakash, 2008; Schaechter et al., 2012).
5
(grants and loans), the current year business cycle captured by the real GDP growth rate, the
inflation rate and other covariates.
Our results indicate that during election years, government consumption increases leading to
higher fiscal deficits by about 1 percentage point. During the two years following elections,
the fiscal retrenchment takes the form of increased revenue effort in trade taxes and cuts to
government investment. However, this post-election partial fiscal adjustment is not translated
into reduced envelopes associated with current spending, or enough revenue mobilization
efforts to fully offset the deviation allowed during the election-year. The paper also finds that
national fiscal rules help to mitigate the cycles in government consumption. Results also
uncover that LICs with an active IMF program during a national election experienced a much
lower political budget cycle compared to non-IMF program years.
The remainder of the paper is organized as follows. In Section 2, we set up the main
empirical framework and present the baseline results. In Section 3, we test the robustness of
our baseline results by factoring in the endogeneity of the election timing. Section 4
investigates the role of fiscal rules and IMF programs as mitigating factors. Section 5
concludes.
II. HOW IS FISCAL POLICY CONDUCTED OVER THE ELECTION CYCLE? PRELIMINARY
EVIDENCE
This section presents the general framework and the data used to assess the dynamic of fiscal
variables during and after the occurrence of a national election in LICs. Several fiscal
outcomes (government consumption, public investment, breakdown of tax revenues, and
budget balance as percentage of GDP) are used to assess the magnitude of the shocks on the
budget during and after elections. The section also discusses the baseline econometric results.
A. Baseline specification and data
This paper estimates several dynamic panel equations linking a given fiscal outcome with the
election dummy while controlling for standard determinants of the given fiscal variable. As it
has now become standard in the literature on fiscal policy, dynamic equations are specified to
control for the inertia characterizing fiscal variables over time. We use a panel dataset that
covers 68 LICs over 21 years, 1990-2010. Around 51 of these LICs have had at least one
election.6 A country is classified as Low-Income if it benefits from the IMF Poverty
Reduction and Growth Trust (PRGT) as of 2010. The choice of time period is based on
available data after the democratic reforms that many countries, particularly in Sub-Saharan
Africa, implemented in 1990 with the consequence of making elections more competitive.
The baseline specification is as follow:
6 See Appendix Table A1 for the list of countries. The panel data is unbalanced since some countries have
missing values.

6
tititi
p
ptipiti YELEY ,,1,
2
0
,1,
ΓX [1],
where tiY , is the fiscal outcome in each country i at year t. ti ,X is the vector of country-level
covariates which follow and slightly augment the empirical literature on the determinants of
government consumption, tax revenues and budget deficits in developing countries (Rodrik,
1998; Keen and Lockwood, 2010; Combes and Saadi-Sedik, 2006). More specifically,
models control for variables such as: real GDP growth rate, inflation rate, trade openness,
foreign aid, external debt, natural resource rents, agriculture value added, and fiscal rules. All
the fiscal variables, inflation rate, external debt, and foreign aid are drawn from the IMF
WEO database whereas real per capita GDP growth series have been downloaded from Penn
World Table 7.1 dataset. Natural resource rents and total population data have been drawn
from the World Development Indicators database.7
The main variables of interest are the three election dummies tiELE , , 1, tiELE , and 2, tiELE ,
which take the value 1 in case of a national election and 0, otherwise. From equation [1], the
three coefficients 1 ,
2 , and 3 , measure the percentage point change in the fiscal variable
during, one year after, and two years after a national election, respectively.8 We use the
NELDA dataset (Hyde and Marinov, 2012) for the election variables and follow the
convention in this literature (e.g. Shi and Svensson, 2006; Brender and Drazen, 2008) by
focusing on the highest level of national elections. Therefore, we only include legislative
elections for countries with parliamentary political systems and executive elections for
countries with presidential elections. The binary election indicator, ELE, takes the value 1
depending on the year in the election cycle, and 0 otherwise, as described above. There were
191 national elections during the sample period. Table A1 in the Appendix shows the
distribution of national elections across LICs over the period of analysis.
One important contribution of this paper is to provide a comprehensive view of the existence
of the political budget cycle on various fiscal variables, from expenditures, to revenues, and
to budget balance. We take advantage of the information on fiscal variables available in the
IMF datasets on both expenditure and revenues composition within countries. This effort is
necessary as many LICs have usually been neglected in previous papers due to lack of data.
The IMF dataset we use is a comprehensive source of information on budget composition
based on data collected by economist desks in the field and officially approved by countries.
Regarding government spending, this paper differentiates between current expenditures
7 Descriptive statistics of all the dependent variables are provided in Table A2 in the Appendix.
8 When investigating how elections affect government spending, one critique may be that the political budget
cycles observed are due to the extra cost of running elections, and not necessarily a strategic allocation that is
driven by re-election incentives. This is a fair point, though not a real concern in the case for low- income
countries. These countries are very poor and highly dependent on aid. Most of the expenses related to elections
are also born through aid. Therefore, we investigate the effect of elections on government spending while
controlling for aid as a share of GDP. The fact that political budget cycles are observed even when keeping aid
constant shows that there is a political incentive even if elections were costly to run.

7
(proxied by government final consumption) and public investment to assess the effects of
elections on the composition of spending.
On tax revenues, we also allow for a certain granularity.9 Instead of using only overall tax
revenue as many other papers in this literature do, we decompose tax revenue into three
categories; direct, indirect and trade taxes.10 We see the merit in distinguishing between these
types of taxes since it would make our analysis richer in terms of understanding which taxes
the government will put a particular effort on collecting during the different years of the
election cycle. Ehrhart (2012) bases her analysis on direct and indirect taxes but we believe
that there might be a political economy story behind trade taxes as well. Since trade involves
crossing borders, it is potentially easier for the government to vary tax effort on these specific
locations on the borders (Stotsky and WoldeMariam, 1997).11 By looking at tax revenue
ratios at a more disaggregated level, our paper provides additional insights regarding the shift
in the composition of tax revenue efforts among various types of tax revenues over the
whole eletion cycle. The focus on LICs also constitutes one important difference from
existing papers.
Equation [1] is a dynamic specification and is used given the strong inertia characterizing the
fiscal variables of interest. Government administrations are constrained by budgets, and the
current budget largely determines the next period’s appropriations. Although such inertia has
been argued to provide some stability and predetermines fiscal spending (Schuknecht, 2000),
the presence of lagged dependent variables and the country-specific effects renders the OLS
estimator biased since the lagged dependent variable is correlated with the error term
(Nickell, 1981). In order to deal with this issue, there are two commonly used estimators; the
difference-GMM estimator (Arellano and Bond, 1991) and the System-GMM estimator
(Arellano and Bover, 1995; Blundell and Bond, 1998). In the difference-GMM estimator,
equation [1] is taken in first differences (to remove country fixed effects), and the first
differentiated variables are instrumented by their lagged values in level. However, Arellano
and Bover (1995) and Blundell and Bond (1998) have shown that when the explanatory
variables are persistent over time, the lagged values of variables in level risk to be poor
instruments for variables in first-differences. In order to improve the efficiency, they propose
the System-GMM estimator, which increases the moment conditions. The equation in levels
9 Non-resource tax revenue mobilization is a major challenge in many LICs. While overall tax revenues
correspond to more than 50 percent of GDP in some countries in the sample, others barely manage to collect 1
percent of GDP. The mean overall tax revenue in the sample is 14.8 percent. The largest contribution to
revenues comes from indirect taxes (mean in the sample is 5.6 percent of GDP), followed by direct taxes (4.4
percent of GDP), and trade taxes (3.8 percent of GDP).
10 Indirect taxes, which are broad-based taxes on goods and services, are paid by most citizens and correspond
to 5.6 percent of GDP in our sample. Direct taxes represent taxes on income, profits and capital gains,
correspond to 4.4 per cent of GDP and are mostly paid by corporations since personal income taxes are almost
non-existent. Finally, trade taxes, which correspond to 3.8 percent of GDP, are taxes on trade and international
transactions paid by corporations.
11 For the Indian states, Khemani (2004) provides an analysis with subcategories of commodity taxes; sales,
excise and trade. Data is not available on this level for the 68 low-income countries that we study in this paper.

8
and the equation in differences are combined in a system, and then are estimated with an
extended GMM system which allows for the use of lagged differences and lagged levels of
the explanatory variables as instruments. Hence, the System-GMM estimator controls for
unobserved country-specific effects as well as potential endogeneity of the explanatory
variables. The paper uses the Windmeijer’s (2005) correction of standard errors for finite
sample bias. Two specification tests check the validity of the instruments. The first is the
standard Sargan/Hansen test of over-identifying restrictions. The second test examines the
hypothesis that there is no second-order serial correlation in the first-differenced residuals.
The number of lags of the explanatory variables used as instruments is usually limited to
reduce the ‘over-fitting’ bias (Roodman, 2009).
B. Baseline estimates
We first report the baseline findings for the expenditure side, thereafter for the revenue side,
and finally for the fiscal balance.
Composition of expenditures
Table 1 presents the results for the System-GMM estimator for the various fiscal outcomes.
Column 1 reports that government consumption increases during election year, with no
significant decrease the two years after elections. The coefficient on ELEt is significant and
shows that on average, consumption as a share of GDP increases by 0.8 percentage point
during the election year. The results for government investment is reported in column 2,
which shows that government investment as a share of GDP decreases by almost 0.4
percentage point the year following the election. This result is statistically significant.
Although the sign of the coefficients for ELEt-2 is also negative, it is not significant.
These results indicate that political budget cycles on government expenditures are present in
LICs. More specifically, the governments in LICs tend to increase consumption expenditures
during election years while investments are unchanged. The post-election adjustment takes
the form of decreased government investment. These results confirm previous claims
(Vergne, 2009) that government spending shifts towards more visible consumption during
election years. In addition, we show that the negative effect on government investment
appears with a lag and implies that publicly financed projects, for example in infrastructures,
stagnate the year after elections. From the politicians’ point of view, this is strategic, since a
stagnation of investments during election years would probably have a negative impact on re-
election prospects. Although we do not study it explicitly in this paper, this post-election
stagnation in investments may have serious consequences for economic growth.
[Table 1 about here]
Composition of tax revenues
Column 3 shows that the effort put by the government in collecting overall taxes improves
significantly in the years following an election. A look at the composition of tax revenues
reveals a more detailed picture of the governments’ effort in resource mobilization over the
election cycle. In column 4, where indirect taxes (taxes on goods and services) are reported,
the results do not suggest the existence of an election related cycle. Although the coefficient

9
on the ELEt variable is negative, it is not statistically significant. The coefficients on ELEt-1
and ELEt-2 are not significantly different from zero either. These results contrast with recent
findings by Ehrhart (2012) who finds a significant and negative impact of elections on
indirect taxes using a broader sample of all developing countries. Our results suggest the
opposite, implying that LICs’ tax policy differs from other developing countries over the
election cycle. The differences of results compared with existing studies can be explained by
at least two factors. First, we have decomposed total tax revenues into various components to
get a better granularity and found that at least for LICs, the impact of national elections is
observed in the case of trade tax revenues during the run to rebuild eroded fiscal buffers.
Second, our results provide a more detailed assessment of the impact of elections on
government indirect tax revenues since it does not pool together taxes on goods and services
with trade taxes, an approach which is different from previous papers. Our results show that
within the broad definition of indirect taxes, it is the trade tax revenue ratio which matters
and not the taxes on goods and services.
In addition, the effort put on collecting direct taxes (on income, profits, and capital gains)
does not either vary along the election cycle, as shown in column 5. Column 6 shows the
results for tax revenues on international trade. Econometric estimates indicate that the
government changes its effort in collecting trade taxes during election years. There is a slight
(barely statistically significant) increase in trade taxes-to-GDP of about 0.11 percentage
point of GDP during the election year, an effort which is maintained and strengthened during
during the two post-election years. This explains why total tax revenues increase one and two
years after elections. Our results clearly suggest that LICs tend to partially rebuild the eroded
policy buffers on the revenue side through increased discretionary tax revenue mobilization
on international trade. This may be due to the fact that trade taxes tend to be relatively easier
to collect in LICs, as these countries tend to be more challenged than advanced and emerging
economies in terms of revenue mobilization, particularly in terms of domestic tax revenues.
Overall fiscal balance
The dynamic of the overall fiscal balance throughout the election cycle mirrors the behavior
of the expenditure and revenue variables (column 7). The overall fiscal deficit ratio increases
by about 1 percentage point of GDP during the election year, and this is mainly driven by the
observed increase in government current spending.12 In the post-election years, there is
certainly an attempt to rebuild the eroded fiscal buffers, but it does not appear large and
balanced enough to generate any significant statistical impact. The decline in public
investment and the observed tax revenue increases in the post-election years constitute the
main adjustment package in LICs, but fall short of fully rebuilding the eroded fiscal buffers.
The irreversibility of government current expenditures represents the main factor behind the
protracted pressure exerted by elections on the overall fiscal performace throughout the
years.
12
The magnitude of the deviation in the fiscal balance attributed to elections is similar to previous results by Shi
and Svensson (2006).

10
III. DEALING WITH THE ENDOGENEITY OF ELECTION TIMING
One potential critique of the baseline results above is that we treated the election variables as
exogenous relative to fiscal policy, which may not be the case. Both timing of elections and
fiscal policies could, for example, be influenced by a number of (unobserved) variables
which are not included in the regressions. There may be a bias if, for example, the timing of
the election is strategically chosen by the incumbent politician to coincide with favorable
economic conditions. One way to address this potential bias is to distinguish between
elections whose timing is predetermined relative to current fiscal policies (Shi and Svensson,
2006). Using information provided in the NELDA dataset, we classify an election as
predetermined if the election took place on the date fixed by an established constitution or
procedure. Conversely, the election timing is considered endogenous if the election was early
or late relative to the date it was supposed to be held per established procedure.13
We create new election indicators, ELEPREi,t and ELEENDOi,t to replace ELEi,t. The
variable ELEPREi,t equals 1 in country i and year t when there was a predetermined election,
and 0, otherwise. The variable ELEENDOi,t equals 1 in country i and year t if an election that
was not predetermined took place, and 0 otherwise. The indicators for the post-election were
coded accordingly. Among the 191 elections in our sample, 56.5 percent are classified as
predetermined.14 We re-estimate the baseline regressions with the new election indicators. If
the baseline results are robust, they should also hold for predetermined elections. The revised
model takes the following form:
tititi
p
ptip
p
ptipiti YELEENDOELEPREY ,,1,
2
0
,
2
0
,,
ΓX [2],
The coefficients of interest are p which capture the impact of elections after ruling out the
effects of elections that occurred in an unpredicted schedule compared to the constitutional
calendar.
Table 2 presents the econometric results. They are very similar to the previous ones in terms
of magnitude and impacted fiscal outcomes. Government current expenditures significantly
deviate from their normal level during election years, leading to an increase in the overall
fiscal deficit of about 1.3 percentage point of GDP. The post-election years are characterized
by an effort to partially rebuild fiscal buffers but this comes with a price. Public investment is
reduced by about 0.4 percentage point of GDP. The result that governments increase their
effort in the mobilization of trade tax revenues still holds. Two years after the election, our
estimates indicate a reduction of the fiscal deficit by about 0.5 percentage of GDP.
13
This coding is done using the variable NELDA6 in the NELDA dataset. An established procedure is
interpreted as according to the constitution.
14 Out of the 191 elections, 108 are classified predetermined and 38 endogenous. We were unable to classify 45
elections.

11
[Table 2 about here]
IV. DOMESTIC AND INTERNATIONAL SCRUTINY
There is an ongoing literature which has tried to identify the role played by various
macroeconomic factors on the magnitude of political budget cycles in developing countries.
O’Mahony (2010) examined the role played by openness (globalization). Vergne (2009) and
Faye and Niehaus (2011) considered the role of media and financing variables such as natural
resource rents and official development assistance as potential factors. Recently, Combes,
Ebeke and Maurel (2013) examined the role of migrant remittance inflows on the magbitude
of the political budget cycles in developing countries. This section examines two main
factors not fully analyzed in the LICs context, as means to dampen the electoral fiscal
manipulation. We distinguish between a domestic institutional constraint on fiscal policy and
the participation into a program with the International Monetary Fund (IMF).
A. Do fiscal rules matter?
The political budget cycle may be reduced in presence of national fiscal rules if the rules
prevent the incumbent from fiscal extravagances in the time of national elections. We focus
on national fiscal rules as they are more effective and enforced than supranational rules in the
LICs context. However, the enforcement and compliance with supranational fiscal rules has
been, at best, mixed, in most EU member states, WAEMU countries, and in the CEMAC
region (Cabezon and Prakash, 2008; Schaechter et al., 2012).
One main challenge to isolate the impact of fiscal rules is to address the obvious endogeneity
(self-selection) of the adoption and the stability of these rules. This issue will be addressed in
the empirical specifications. The literature on the role of fiscal rules on the reduction of
political budget cycles is not large. Based on a study on the US states, Rose (2006) shows
that balanced budget rules help dampen politically driven cycles in overall spending, taxes
and deficits. Not surprisingly, Rose (2006) finds that the stricter the rules are, the weaker are
the cycles. Inspired by this study, we test whether national fiscal rules act as a domestic
scrutiny factor which helps dampen political budget cycles in LICs. We have not come
across any article testing the dampening ability of fiscal rules in LICs context. However, it is
important to be prudent when interpreting the results as only few LICs use national fiscal
rules with limited enforcement or compliance.
The econometric model exploits the interaction term between the national election dummy
and a dummy for the presence of a fiscal rule to quantify the dampening impact (if any) of
the presence of a national fiscal rule during election times. Because the adoption and the
presence of a fiscal rule are likely to be non random, we address this issue by using a dummy
variable capturing whether a national fiscal rule has been in place for at least 5 years.
Basically, the strategy consists in interacting the election dummy with the 5-year lag of the
fiscal rule dummy (FR).15 More formally, the specification is the following:16
15
The reader may wonder whether the proposed identification strategy to assess the impact of fiscal rule is the
best available. For example, it could be interesting to proceed with an instrumental variable strategy to tackle
(continued…)

12
titititititiiti YFRELEFRY ,,1,5,2,5,11, ΓX [3],
The magnitude of the political budget cycle on public consumption in absence of a national
fiscal rule is measured by 1 . In presence of a rule, the size of the electoral fiscal
manipulation is captured by 11 . The main hypothesis is that: 01 ; 01 . This
suggests that the political budget cycle is higher when the country lacks a fiscal rule
compared to the case where the country has one.
Estimation results are presented in Table 3. Results indicate that for LICs without national
fiscal rules (the vast majority of countries), the size of the political budget cycle on
government consumption is around 1 percent of GDP. This result is not that different from
the previous estimations performed early in the paper. However, once the election dummy is
interacted with the national fiscal rule dummy, the coefficient turns negative and statistically
significant. However, the significance of the coefficient of the interaction term is low,
suggesting that the strength of the dampening role of national fiscal rules is still low in LICs
possibly due to the lack of enforcement, compliance and limited numbers of LICs using
national numerical fiscal rules . When focusing on the marginal effect of elections in LICs
having adopted national fiscal rules, our coefficient estimates in Table 3 suggest that the size
of the fiscal deviation during an election year is close to 0.13 percentage point of GDP (1-
0.87 = 0.13).
B. IMF program engagement
The paper further tests whether countries engaged in programs with the IMF are less likely to
experience a political budget cycle. In other words, we assess whether IMF programs act as
an international scrutiny mechanism which constraints incumbents to use fiscal policy for
electoral motives. There are several reasons why IMF programs may contribute to reduce the
magnitude of the political budget cycle in LICs. LICs that enter into IMF agreements are
subject to conditionality. One key component of programs’ conditionality is the adoption of
sustainable macroeconomic policies. As a result, if implemented, conditionality constrains
government finances, making it more difficult for governments to engage in expansionary
fiscal policies during elections. This issue has been discussed and tested by Hyde and
O’Mahony (2010) in the context of a large panel of developing countries (94 countries)
mixing LICs with other developing nations. The authors find that IMF scrutiny of the
economy and pressure on governments to maintain a sustainable fiscal policy make pre-
the potential endogeneity of fiscal rules. However, finding such instrumental variable, which needs to be fully
exogenous to fiscal outcomes, is very challenging. Another strategy may also be to pursue a two-step approach
where a selection equation explaining the decision to have a fiscal rule is estimated and used to control for the
self-selection bias in the fiscal equation. However, with such a small number of LICs having national fiscal
rules, it does not seem suitable to perform the two-step approach.
16 Also, we will disregard the post-election dummies used before and concentrate the analysis on the election
year only since the cycles in government consumption has been observed during election year and cycles on
revenues are less robust. Moreover, we do not need to break down the fiscal rule dummy into subcomponents as
national fiscal rules in LICs are primarily dominated by debt rules.
13
electoral manipulation of government balance less likely. This result appears robust to the
treatment of the selection bias characterizing the decision to request a program with the
Fund. Our paper will follow the pioneer work by Hyde and O’Mahony (2010) in the case of a
large sample of countries but will depart from it in several ways which will be outlined
below.
One important issue in this literature is the potential endogeneity of IMF programs with
respect to both elections and macroeconomic outcomes. Scholars have argued that
governments prefer not to be under IMF agreements during elections (Dreher, 2004), and
research has shown that governments are more likely to enter into IMF agreements after
elections (Przeworski and Vreeland 2000). We will explore this issue in details in the first-
stage selection equation estimated to purge the endogeneity of IMF programs with respect to
both election timing and macroeconomic developments.17 Our paper therefore tries to
robustly investigate the effect of IMF programs on the size of the political budget cycle by
focusing only on LICs.18 We also depart from the previous literature as the main dependent
variable is government consumption, the budget item which was found to be strongly
correlated with elections throughout the paper. As we will explain further below, the
selection bias associated with Fund programs has been carefully accounted for using an
improved version of the standard first-stage probit model identifying the correlates of Fund
programs which take into account LICs specifiities.
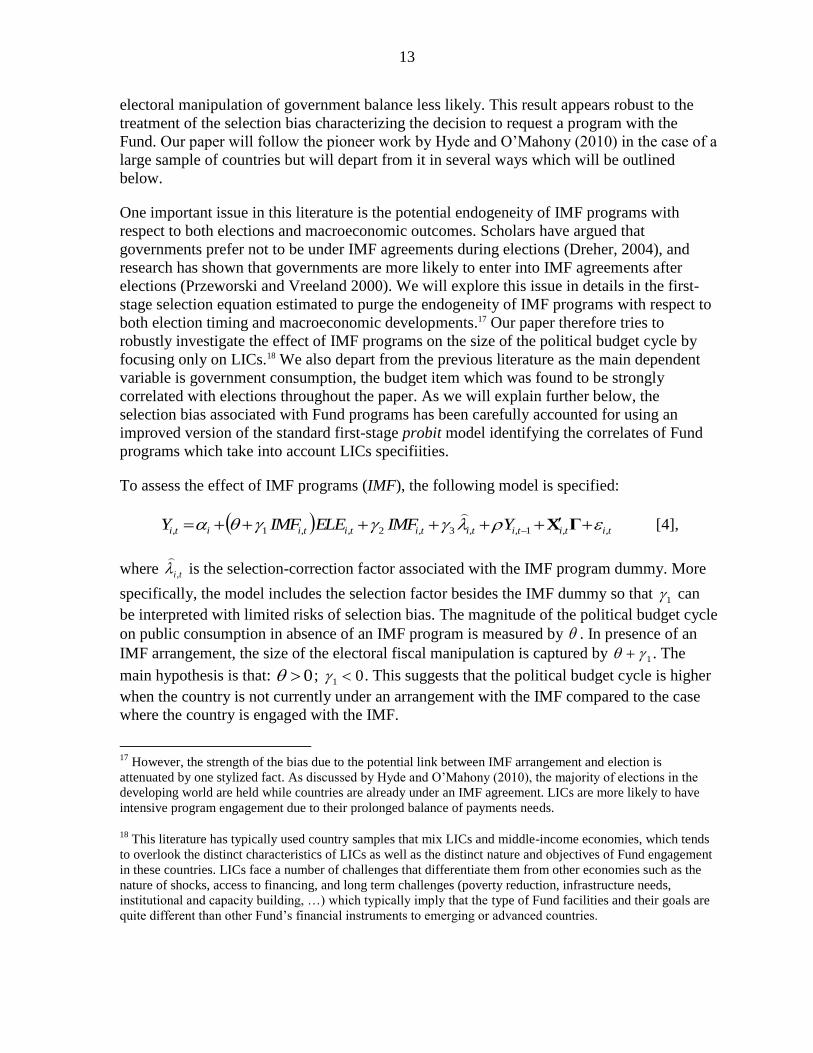
To assess the effect of IMF programs (IMF), the following model is specified:
tititititititiiti YIMFELEIMFY ,,1,,3,2,,1, ΓX
[4],
where ti ,
is the selection-correction factor associated with the IMF program dummy. More
specifically, the model includes the selection factor besides the IMF dummy so that 1 can
be interpreted with limited risks of selection bias. The magnitude of the political budget cycle
on public consumption in absence of an IMF program is measured by . In presence of an
IMF arrangement, the size of the electoral fiscal manipulation is captured by 1 . The
main hypothesis is that: 0 ; 01 . This suggests that the political budget cycle is higher
when the country is not currently under an arrangement with the IMF compared to the case
where the country is engaged with the IMF.
17
However, the strength of the bias due to the potential link between IMF arrangement and election is
attenuated by one stylized fact. As discussed by Hyde and O’Mahony (2010), the majority of elections in the
developing world are held while countries are already under an IMF agreement. LICs are more likely to have
intensive program engagement due to their prolonged balance of payments needs.
18 This literature has typically used country samples that mix LICs and middle-income economies, which tends
to overlook the distinct characteristics of LICs as well as the distinct nature and objectives of Fund engagement
in these countries. LICs face a number of challenges that differentiate them from other economies such as the
nature of shocks, access to financing, and long term challenges (poverty reduction, infrastructure needs,
institutional and capacity building, …) which typically imply that the type of Fund facilities and their goals are
quite different than other Fund’s financial instruments to emerging or advanced countries.

14
The correction of the self-selection associated with the decision to participate in an IMF
program proceeds as follow. A pooled probit model on the determinants of IMF programs in
LICs over the period 1990-2010 is estimated. Standard determinants of IMF programs
include previous levels of: external reserves, fiscal balance, trade openness, inflation rate. We
also add to this list the size of natural resource rents, and a dummy variable indicating
whether a national election is scheduled in the next year, and the election variable crossed
with an indicator of electoral competitiveness. These two variables are added to the selection
model to capture to what extent LICs are less likely to request IMF programs in the year
prior to national elections, conditional on the degree of competitiveness in the considered
election.19 This is an improvement to the literature having dealt with the selection bias
associated with the decision of requesting a Fund program. Controlling for resource rents, for
the electoral calendar, and for the degree of electoral competitiveness before the year of Fund
programs help factor in some specificities in the LICs context.
Once the probit is estimated on the group of control variables ti ,Z , the selection correction
factor is computed as follows (see Maddala, 1983; Vella and Verbeek, 1999; Keen and
Lockwood, 2010):20
,0,1
,1,
,
,
,
,
,
,
,
ti
ti
ti
ti
ti
ti
ti
IMF
IMF
Z
Z
Z
Z
where and represent the probability density and cumulative density functions of the
standard normal distribution, respectively.
Estimation results are presented in Table 3. Results point to a negative effect of IMF
programs on the magnitude of the political budget cycle on consumption in LICs. In absence
of an IMF program, government consumption deviates by about 1 percentage point of GDP
during national elections whereas the size of the deviation drops to 0.34 percentage point of
GDP in presence of an active IMF program. Results also indicate a positive and significant
effect of the selection factor ti ,
, which suggests that it was crucial and legitimate to
account for the selection bias in the estimates. Our results have indicated that both fiscal rules
19
The selection equation also helps deal with the potential bias which could arise if IMF lending were
significantly higher during months prior to elections. Dreher and Vaubel (2004) found that it is indeed the case.
We rule out this effect by always controlling for official development assistance in the regressions and by
explictly controlling for the electoral calendar and timing in the selection equation. There are thefore limited
risks that our results are fully driven by IMF lending dynamics before and after elections. Moreover, the
direction of this bias would work in lowering the estimated effect of the IMF programs leading to
underestimnated effects instead of inflated effects.
20 Results of the probit selection model identifying the determinants of LICs’ participation into IMF programs
are available in Appendix A3.

15
and IMF programs play an important role in LICs in limiting the propensity of incumbents to
allow large deviations in government consumption during election years as means to
maximize their chance of re-election. Although the results seem appealing, they should be
interpreted with caution. Indeed, the coefficients associated with the interaction terms of
elections crossed with fiscal rules and IMF programs exhibit a low significance, which
suggests that the dampening role is at play but it is not strong enough to generate more
precise estimates. There are several reasons which can be evoked to explain these results.
First, only few LICs (4 LICs to be precise) have adopted active national fiscal rules, an issue
which certainly contributes to reduce the explanatory power of the fiscal dummy in the
model. It could also be that these rules are not sufficiently enforced, exacerbating the
credibility problems faced by these institutional arrangements in many LICs. Second, despite
the fact the selection equation associated with IMF programs explicitly controls for several
covariates, the self-selection bias is always only partially controlled for. In addition, as the
majority of elections in LICs are held while countries are already under an IMF agreement,
this limits the statistical power of the IMF program dummy in dampening the political cycle.
V. CONCLUDING REMARKS
This paper investigates political budget cycles in LICs by analyzing the behavior of the
following variables throughout the election cycle: government consumption, government
investment, composition of tax revenue, and fiscal balance. We find that during election
years, government consumption increases and leads to higher fiscal deficits. During the two
years following elections, fiscal adjustment takes the form of increased revenue effort in
trade taxes and cuts to government investment. We showed that the size of the political
budget cycle is much lower in countries having adopted national fiscal rules or those
participating in IMF programs during the election period.
We analyzed the behavior of these variables throughout the election cycle because the way
the governments decide to manipulate fiscal policy may have implications for future
economic growth. The results in this paper show that elections not only imply a
macroeconomic cost when they take place, but also trigger a painful fiscal adjustment in
which public investment is largely sacrificed and trade put at risk. Although economic
growth was not explicitly studied in this paper, the different policy tools that low-income
countries seem to be using during the political budget cycle indicate a negative effect on
economic growth. One reason is due to the overall volatility in fiscal policy that elections
trigger. The other reason is because trade may be hampered by the post election increased
effort in mobilizing trade taxes. Similarly, the decrease in investment may directly hamper
growth.
This paper used a novel dataset on fiscal rules to highlight that such rules may help to
dampen election-driven cycles in the budget. Although the mere existence of fiscal rules does
not mean that they will be enforced, it may be a first step toward tying the hands of a
politician or government incentivized to conduct political budget cycles. The paper also
showed that IMF programs in LICs have contributed to lowering the magnitude of the
political budget cycle.
16
References
Alesina, A., Roubini, N., Cohen, G.D., 1997. Political cycles and the macroeconomy. the
MIT Press.
Arellano, M., Bond, S., 1991. Some Tests of Specification for Panel Data: Monte Carlo
Evidence and an Application to Employment Equations. Review of Economic Studies
58, 277–297.
Arellano, M., Bover, O., 1995. Another look at the instrumental variable estimation of error-
components models. Journal of Econometrics 68, 29–51.
Block, S.A., 2002. Political business cycles, democratization, and economic reform: the case
of Africa. Journal of Development Economics 67, 205–228.
Blundell, R., Bond, S., 1998. Initial conditions and moment restrictions in dynamic panel
data models. Journal of Econometrics 87, 115–143.
Brender, A., Drazen, A., 2005. Political budget cycles in new versus established
democracies. Journal of Monetary Economics 52, 1271–1295.
Brender, A., Drazen, A., 2008. How do budget deficits and economic growth affect
reelection prospects? Evidence from a large panel of countries. The American
Economic Review 98, 2203–2220.
Combes, J.-L., Saadi-Sedik, T., 2006. How does trade openness influence budget deficits in
developing countries? Journal of Development Studies 42, 1401–1416.
Combes, J.-L., Ebeke, C., and Maurel, M. 2013. Remittances prior to an election. CERDI
Etudes et Documents, 2013-07.
Drazen, A., 2001. The political business cycle after 25 years, in: NBER Macroeconomics
Annual 2000, Volume 15. MIT Press, pp. 75–138.
Drazen, A., Eslava, M., 2010. Electoral manipulation via voter-friendly spending: Theory
and evidence. Journal of Development Economics 92, 39–52.
Dreher, A., 2004. The Influence of IMF Programs on the Re-election of Debtor
Governments. Economics & Politics 16, 53–76.
Dreher, A., and Vaubel, R., 2004. Do IMF and IBRD Cause Moral Hazard and Political
Business Cycles? Evidence from Panel Data, Open Economies Review, 15, 5-22.
Ehrhart, H., 2012. Elections and the structure of taxation in developing countries. Public
Choice 1–17.
Fatás, A., Mihov, I., 2003. The Case for Restricting Fiscal Policy Discretion. The Quarterly
Journal of Economics 118, 1419–1447.

17
Fatás, A., Mihov, I., 2012. Policy Volatility, Institutions and Economic Growth. Review of
Economics and Statistics. doi: 10.1162/REST_a_00265
Fouda, S.M., 1997. Political Monetary Cycles and Independence of the Central Bank in a
Monetary Union: an Empirical Test for a BEAC Franc Zone Member Country.
Journal of African Economies 6, 112–131.
Faye, M., and Niehaus, P., 2012. Political Aid Cycles. American Economic Review, 107,
3516-3530.
Hyde, S.D., Marinov, N., 2012. Which Elections Can Be Lost? Political Analysis 20, 191–
210.
Hyde, S.D., O’Mahony, A., 2010. International Scrutiny and Pre-Electoral Fiscal
Manipulation in Developing Countries. The Journal of Politics 72, 690–704.
Keen, M., Lockwood, B., 2010. The value added tax: Its causes and consequences. Journal of
Development Economics 92, 138–151.
Khemani, S., 2004. Political cycles in a developing economy: effect of elections in the Indian
States. Journal of Development Economics 73, 125–154.
Maddala, G.S., 1983. Limited-Dependent and Qualitative Variables in Econometrics,
Econometric Society Monographs, Cambridge University Press.
Nickell, S., 1981. Biases in Dynamic Models with Fixed Effects. Econometrica 49, 1417–
1426.
O’Mahony A., 2010. Engineering Good Times : Fiscal Manipulation in a Global Economy,
British Journal of Political Science, 41, 315-340.
Przeworski, A., Vreeland, J.R., 2000. The effect of IMF programs on economic growth.
Journal of Development Economics 62, 385–421.
Rodrik, D., 1998. Why Do More Open Economies Have Bigger Governments? Journal of
Political Economy 106, 997–1032.
Roodman, D., 2009. A Note on the Theme of Too Many Instruments. Oxford Bulletin of
Economics and Statistics 71, 135–158.
Rose, S., 2006. Do fiscal rules dampen the political business cycle? Public choice 128, 407–
431.
18
Schaechter, A., Kinda, T., Budina, N., and Weber, A., 2012. Fiscal Rules in Response to the
Crisis - Toward the Next-Generation Rules. A New Dataset, IMF Working Papers
12/187, International Monetary Fund.
Schuknecht, L., 2000. Fiscal Policy Cycles and Public Expenditure in Developing Countries.
Public Choice 102, 113–128.
Shi, M., Svensson, J., 2006. Political budget cycles: Do they differ across countries and why?
Journal of Public Economics 90, 1367–1389.
Stotsky, J., G., and WoldeMariam, A., 1997. Tax Effort in Sub-Saharan Africa, IMF
Working Paper 97/107, International Monetary Fund.
Vella, F., Verbeek, M., 1999. Estimating and Interpreting Models With Endogenous
Treatment Effects. Journal of Business & Economic Statistics 17, 473–478.
Vergne, C., 2009. Democracy, elections and allocation of public expenditures in developing
countries. European Journal of Political Economy 25, 63–77.
Windmeijer, F., 2005. A finite sample correction for the variance of linear efficient two-step
GMM estimators. Journal of Econometrics 126, 25–51.
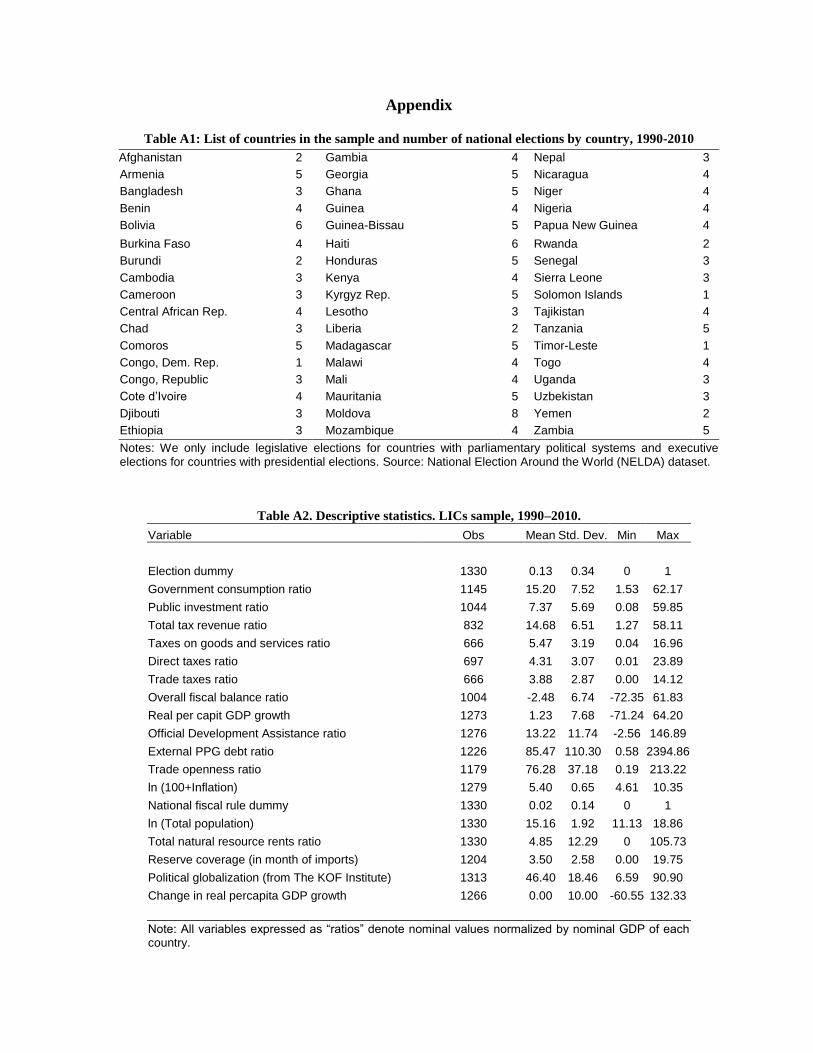
Appendix
Table A1: List of countries in the sample and number of national elections by country, 1990-2010
Afghanistan 2 Gambia 4 Nepal 3
Armenia 5 Georgia 5 Nicaragua 4
Bangladesh 3 Ghana 5 Niger 4
Benin 4 Guinea 4 Nigeria 4
Bolivia 6 Guinea-Bissau 5 Papua New Guinea 4
Burkina Faso 4 Haiti 6 Rwanda 2
Burundi 2 Honduras 5 Senegal 3
Cambodia 3 Kenya 4 Sierra Leone 3
Cameroon 3 Kyrgyz Rep. 5 Solomon Islands 1
Central African Rep. 4 Lesotho 3 Tajikistan 4
Chad 3 Liberia 2 Tanzania 5
Comoros 5 Madagascar 5 Timor-Leste 1
Congo, Dem. Rep. 1 Malawi 4 Togo 4
Congo, Republic 3 Mali 4 Uganda 3
Cote d’Ivoire 4 Mauritania 5 Uzbekistan 3
Djibouti 3 Moldova 8 Yemen 2
Ethiopia 3 Mozambique 4 Zambia 5
Notes: We only include legislative elections for countries with parliamentary political systems and executive elections for countries with presidential elections. Source: National Election Around the World (NELDA) dataset.
Table A2. Descriptive statistics. LICs sample, 1990–2010.
Variable Obs Mean Std. Dev. Min Max
Election dummy 1330 0.13 0.34 0 1
Government consumption ratio 1145 15.20 7.52 1.53 62.17
Public investment ratio 1044 7.37 5.69 0.08 59.85
Total tax revenue ratio 832 14.68 6.51 1.27 58.11
Taxes on goods and services ratio 666 5.47 3.19 0.04 16.96
Direct taxes ratio 697 4.31 3.07 0.01 23.89
Trade taxes ratio 666 3.88 2.87 0.00 14.12
Overall fiscal balance ratio 1004 -2.48 6.74 -72.35 61.83
Real per capit GDP growth 1273 1.23 7.68 -71.24 64.20
Official Development Assistance ratio 1276 13.22 11.74 -2.56 146.89
External PPG debt ratio 1226 85.47 110.30 0.58 2394.86
Trade openness ratio 1179 76.28 37.18 0.19 213.22
ln (100+Inflation) 1279 5.40 0.65 4.61 10.35
National fiscal rule dummy 1330 0.02 0.14 0 1
ln (Total population) 1330 15.16 1.92 11.13 18.86
Total natural resource rents ratio 1330 4.85 12.29 0 105.73
Reserve coverage (in month of imports) 1204 3.50 2.58 0.00 19.75
Political globalization (from The KOF Institute) 1313 46.40 18.46 6.59 90.90
Change in real percapita GDP growth 1266 0.00 10.00 -60.55 132.33
Note: All variables expressed as “ratios” denote nominal values normalized by nominal GDP of each country.

Table A3: Correlates of the participation into Fund programs in LICs.
Dependent variable: Fund program dummy LPM Probit Period: 1990–2010. (1) (2)
International reserve coverage (in months of imports),t-1 0.00496 -0.0425**
[0.0152] [0.0178]
Fiscal balance-to-GDP,t-1 0.00286 -0.00296
[0.00349] [0.00966]
ln(100+Inflation) ,t-1 -0.0494 0.00539
[0.0867] [0.0650]
Official development assistance-to-GDP,t-1 0.00882*** 0.0417***
[0.00261] [0.00547]
ln(Population) ,t-1 -0.0856 0.146***
[0.313] [0.0307]
(Election*Competition) ,t+1 0.0408** 0.163**
[0.0198] [0.0665]
Election dummy,t+1 -0.244* -0.790*
[0.133] [0.410]
Political globalization (KOF Institute index) ,t -0.00115 0.0204***
[0.00382] [0.00325]
Change in real per capita GDP growth ,t -0.00204** -0.00654
[0.000880] [0.00499]
Intercept 2.085 -3.430***
[4.483] [0.532]
Country-fixed effects Yes No Observations 916 916 R-squared 0.043 0.177 Number of countries 63 63
Note: Robust standard errors in brackets. *** p<0.01, ** p<0.05, * p<0.1. LPM: Linear probability model with country-fixed effects. The variable “Competition” is not included additively because of its mechanical perfect colinearity with the election dummy variable.

Regression results
Table 1. Estimates of the Political Budget Cycle across selected Fiscal Variables in LICs: 1990–2010.
(1) (2) (3) (4) (5) (6) (7) G I T TGS TD TT Bal
Election t 0.841
*** -0.194 0.209 -0.075 0.102 0.112
* -1.047
*
[0.258] [0.210] [0.152] [0.061] [0.083] [0.066] [0.542]
Election t-1 -0.059 -0.371** 0.340
* 0.134 0.023 0.173
*** 0.275
[0.223] [0.159] [0.187] [0.084] [0.084] [0.064] [0.330]
Election t-2 -0.049 -0.081 0.290* 0.026 -0.046 0.212
* -0.262
[0.197] [0.208] [0.159] [0.101] [0.061] [0.114] [0.322]
Lagged dependent variable 0.730***
0.813***
0.893***
1.029***
0.831***
0.976***
0.260***
[0.103] [0.089] [0.168] [0.057] [0.105] [0.064] [0.094]
Real per capita GDP growth -0.032 0.027 0.041** 0.033
*** -0.003 0.016
*** 0.084
***
[0.034] [0.023] [0.020] [0.006] [0.010] [0.006] [0.031]
Official development assistance-to-GDP 0.073** 0.038
** -0.001 -0.000 -0.002 0.005 -0.019
[0.037] [0.015] [0.014] [0.003] [0.003] [0.003] [0.018]
External debt-to-GDP -0.002 -0.001 -0.004 -0.000 -0.001 -0.001 -0.005
[0.003] [0.001] [0.004] [0.001] [0.001] [0.001] [0.003]
Trade openness 0.028** 0.011
** 0.013 0.000 0.008
* 0.002 0.014
[0.012] [0.005] [0.012] [0.002] [0.004] [0.001] [0.010]
ln (100+Inflation rate) -0.149 0.419 -0.049 0.005 0.046 -0.164* 0.582
[0.443] [0.335] [0.214] [0.083] [0.088] [0.094] [0.458]
Fiscal rule dummy t-1 1.625***
0.345 0.179 -0.036 0.281 -0.232** -0.400
[0.470] [0.327] [0.541] [0.170] [0.206] [0.093] [1.603]
Natural resource rents-to-GDP -0.003 -0.005 0.010 -0.003
[0.006] [0.005] [0.013] [0.003]
ln (Total population) 0.020 -0.010 0.035 0.004
[0.104] [0.029] [0.023] [0.049]
Intercept 1.999 -2.086 0.760 0.040 -0.556 0.711 -5.941**
[2.348] [1.785] [2.320] [0.590] [0.653] [1.225] [2.385]
N 1234 1140 815 679 705 679 970 No of countries 60 57 56 52 53 52 61 m1:p-value 0.004 0.001 0.003 0.000 0.022 0.000 0.017 m2:p-value 0.516 0.416 0.530 0.350 0.294 0.104 0.260 Hansen OID: p-value: 0.829 0.060 0.031 0.839 0.249 0.540 0.114 No of instruments 17 17 21 21 21 25 23
Note: Standard errors in brackets. G: Government consumption ratio; I: Public investment ratio; T: Total tax revenue ratio; TGS: Tax revenues on goods and services ratio; TD: Tax revenues on income; TT: Trade tax revenues ratio; Bal: Overall fiscal balance ratio. All equations are estimated using the two-step System-GMM with Windmeijer (2005) correction of standard errors.
* p < 0.10,
** p < 0.05,
*** p < 0.01.

Table 2: Addressing the endogeneity of the election timing in LICs. 1990–2010.
(1) (2) (3) (4) (5) (6) (7) G I T TGS TD TT Bal
Predetermined election t 0.758
** -0.231 0.095 -0.074 0.147 0.098
* -1.278
**
[0.327] [0.183] [0.167] [0.089] [0.116] [0.055] [0.618]
Predetermined election t-1 0.224 -0.398** 0.131 0.053 0.093 0.112
* 0.253
[0.305] [0.188] [0.255] [0.108] [0.086] [0.058] [0.438]
Predetermined election t-2 -0.031 -0.159 0.076 -0.020 -0.057 0.171* -0.466
*
[0.218] [0.308] [0.148] [0.108] [0.096] [0.094] [0.278]
N 1131 1043 758 633 657 631 900 No of countries 60 57 56 52 53 52 61 m1:p-value 0.007 0.002 0.004 0.000 0.009 0.001 0.019 m2:p-value 0.653 0.390 0.236 0.269 0.250 0.089 0.210 Hansen OID: p-value: 0.583 0.022 0.031 0.864 0.238 0.705 0.217 No of instruments 20 20 24 24 24 28 20
Note: Windmeijer (2005) corrected standard errors in brackets. G: Government consumption ratio; I: Public investment ratio; T: Total tax revenue ratio; TGS: Tax revenues on goods and services ratio; TD: Tax revenues on income; TT: Trade tax revenues ratio; Bal: Overall fiscal balance ratio. All specifications include the exact control variables as in Table 1. The models also control for the endogeneous election dummies (dated at year t, t-1, and t-2, respectively) which identify whether the election was early or late relative to the date it was supposed to be held per established constitution or procedure. The predetermined election dummies identify elections which took place on the date fixed by an established constitution or procedure. All equations are estimated using the two-step System-GMM with Windmeijer (2005) correction of standard errors.
* p < 0.10,
**
p < 0.05, ***
p < 0.01

Table 3. Do fiscal rules and IMF programs dampen the Political Budget Cycle in LICs?
(1) (2) G G
Election dummy 1.009
*** 0.963
***
[0.331] [0.293]
Election*Lagged fiscal rule dummy -0.870*
[0.511]
Election*IMF program dummy -0.623*
[0.342]
Lagged fiscal rule dummy 1.986***
1.621***
[0.662] [0.376]
IMF program dummy -0.712
[0.444]
(Predicted selection correction factor) 0.621**
[0.253]
Lagged dependent variable 0.695***
0.837***
[0.089] [0.041]
Real GDP growth -0.017 0.004
[0.041] [0.014]
Official development assistance-to-GDP 0.073* 0.045
***
[0.037] [0.017]
External debt-to-GDP -0.003 -0.001
[0.003] [0.003]
Trade openness 0.032***
0.015***
[0.011] [0.005]
ln (100+Inflation) -1.189 -0.442
[0.976] [0.344]
Intercept 7.809 3.488*
[5.321] [1.896]
N 1234 864 No of countries 60 59 Joint significance of election coefficients: P-value 0.007 0.002 m1:p-value 0.002 0.019 m2:p-value 0.341 0.114 Hansen OID: p-value: 0.808 0.132 No of instruments 17 18
Note: Windmeijer (2005) corrected standard errors in brackets. All equations are estimated using the two-step System-GMM with Windmeijer (2005) correction of standard errors. In column 2, the model controls for the self-selection bias associated with the participation into IMF programs through a two-step approach a la Maddala (1983), Vella and Verbeek (1999), and Keen and Lockwood (2010).
* p < 0.10,
** p < 0.05,
*** p < 0.01.