Embed Size (px)
Citation preview
Fiscal Third Quarter 2021 Earnings Presentation
JULY 7, 2021
Cautionary Note Regarding Forward-Looking Statements
2
Statements in this presentation may constitute "forward-looking statements" under the Private Securities Litigation Reform Act of 1995. All statements, other than statements of historical fact, that address activities, events or developments that we expect, believe or anticipate will or may occur in the future, including statements about the future impact of COVID-19 on our business operations, results of operations and financial condition, expected future results, expected benefits from our investment and strategic plans and other initiatives, and expected future growth, profitability and return on invested capital, are forward-looking statements. The words “will,”, “may,” “believes,” “anticipates,” “thinks,” “expects,” “estimates,” “plans,” “intends,” and similar expressions are intended to identify forward-looking statements. Forward-looking statements involve risks and uncertainties that could cause actual results to differ materially from those anticipated by these forward-looking statements. Readers are cautioned not to place undue reliance on these forward-looking statements, which speak only as of the date hereof. The inclusion of any statement in this presentation does not constitute an admission by MSC Industrial or any other person that the events or circumstances described in such statement are material. Factors that could cause actual results to differ materially from those in forward-looking statements include the following, many of which are and will be amplified by the COVID-19 pandemic: the impact of the COVID-19 pandemic on our sales, operations and supply chain; general economic conditions in the markets in which we operate, including conditions resulting from the COVID-19 pandemic; changing customer and product mixes; competition, including the adoption by competitors of aggressive pricing strategies and sales methods; industry consolidation and other changes in the industrial distribution sector; our ability to realize the expected benefits from our investment and strategic plans, including our transition from being a spot-buy supplier to a mission-critical partner to our customers; our ability to realize the expected cost savings and benefits from our restructuring activities and structural cost reductions; the retention of key personnel; volatility in commodity and energy prices; the credit risk of our customers, including changes in credit risk as a result of the COVID-19 pandemic; the risk of customer cancellation or rescheduling of orders; difficulties in calibrating customer demand for our products, in particular personal protective equipment or “PPE” products, which could cause an inability to sell excess products ordered from manufacturers resulting in inventory write-downs or could conversely cause inventory shortages of such products; work stoppages, labor shortages or other business interruptions (including those due to extreme weather conditions or as a result of the COVID-19 pandemic) at transportation centers, shipping ports, our headquarters or our customer fulfillment centers; disruptions or breaches of our information systems, or violations of data privacy laws; the retention of qualified sales and customer service personnel and metalworking specialists; the risk of loss of key suppliers or key brands or supply chain disruptions, including due to import restrictions resulting from the COVID-19 pandemic; changes to governmental trade policies, including the impact from significant import restrictions or tariffs; risks related to opening or expanding our customer fulfillment centers; our ability to estimate the cost of healthcare claims incurred under our self-insurance plan; litigation risk due to the nature of our business; risks associated with the integration of acquired businesses or other strategic transactions; financial restrictions on outstanding borrowings; our ability to maintain our credit facilities; the interest rate uncertainty due to the London Interbank Offered Rate (“LIBOR”) reform; the failure to comply with applicable environmental, health and safety laws and regulations, including government action in response to the COVID-19 pandemic, and other laws applicable to our business; the outcome of government or regulatory proceedings or future litigation; goodwill and intangible assets recorded resulting from our acquisitions could be impaired; our common stock price may be volatile due to factors outside of our control; and our principal shareholders exercise significant control over us, which may result in our taking actions or failing to take actions that are in the best interests of other shareholders. Additional information concerning these and other risks is described under "Risk Factors" and "Management's Discussion and Analysis of Financial Condition and Results of Operations" in our Annual and Quarterly Reports on Forms 10-K and 10-Q, respectively, and in the other reports and documents that we file with the U.S. Securities and Exchange Commission. We expressly disclaim any obligation to update any of these forward-looking statements, except to the extent required by applicable law.
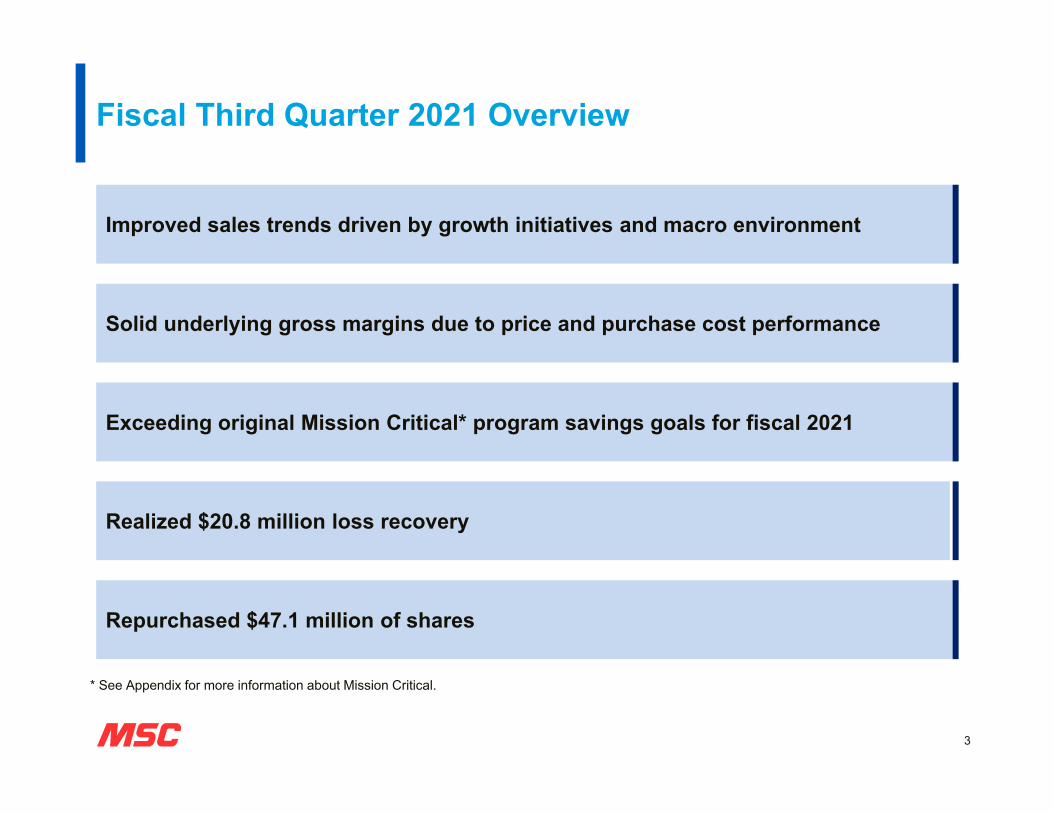
Fiscal Third Quarter 2021 Overview
Improved sales trends driven by growth initiatives and macro environment
Solid underlying gross margins due to price and purchase cost performance
Exceeding original Mission Critical* program savings goals for fiscal 2021
Realized $20.8 million loss recovery
Repurchased $47.1 million of shares
3
* See Appendix for more information about Mission Critical.
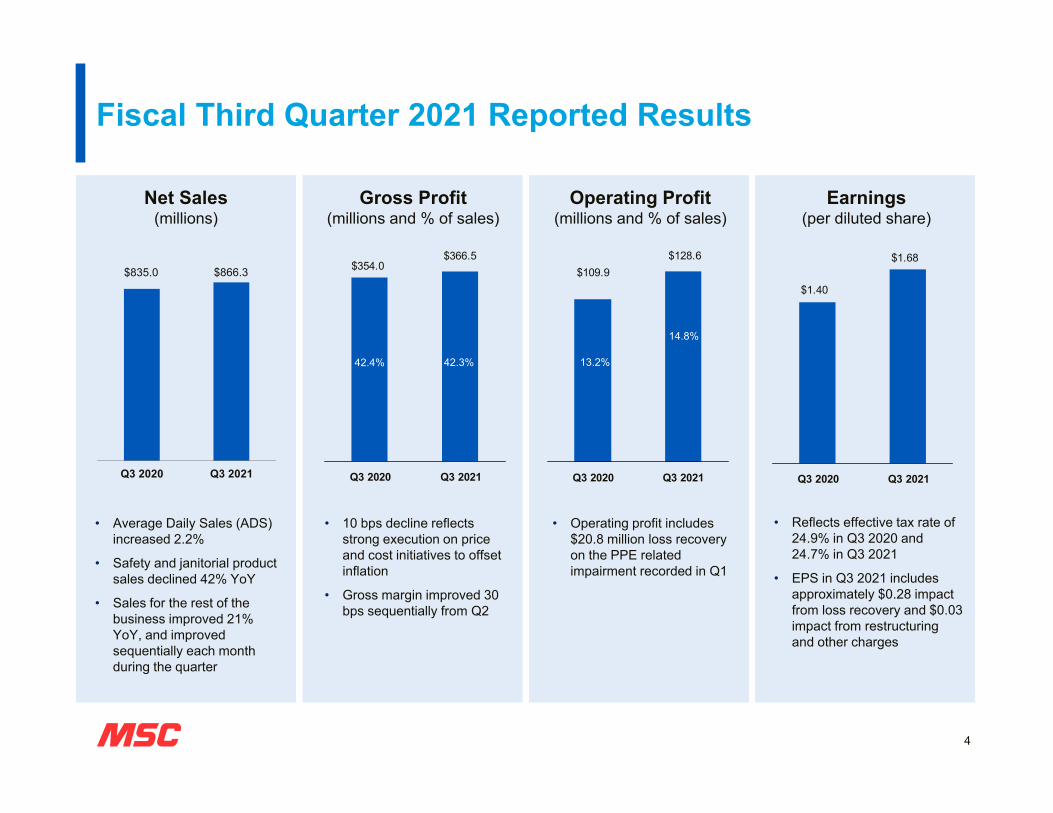
Fiscal Third Quarter 2021 Reported Results
4
Net Sales(millions)
Gross Profit(millions and % of sales)
Operating Profit(millions and % of sales)
• Average Daily Sales (ADS) increased 2.2%
• Safety and janitorial product sales declined 42% YoY
• Sales for the rest of the business improved 21% YoY, and improved sequentially each month during the quarter
• 10 bps decline reflects strong execution on price and cost initiatives to offset inflation
• Gross margin improved 30 bps sequentially from Q2
• Operating profit includes $20.8 million loss recovery on the PPE related impairment recorded in Q1
Earnings(per diluted share)
$366.5$354.0
Q3 2020 Q3 2021
42.3%42.4%
$835.0 $866.3
Q3 2020 Q3 2021
$128.6$109.9
Q3 2020 Q3 2021
$1.68
$1.40
Q3 2020 Q3 2021
13.2%
14.8%
• Reflects effective tax rate of 24.9% in Q3 2020 and 24.7% in Q3 2021
• EPS in Q3 2021 includes approximately $0.28 impact from loss recovery and $0.03 impact from restructuring and other charges
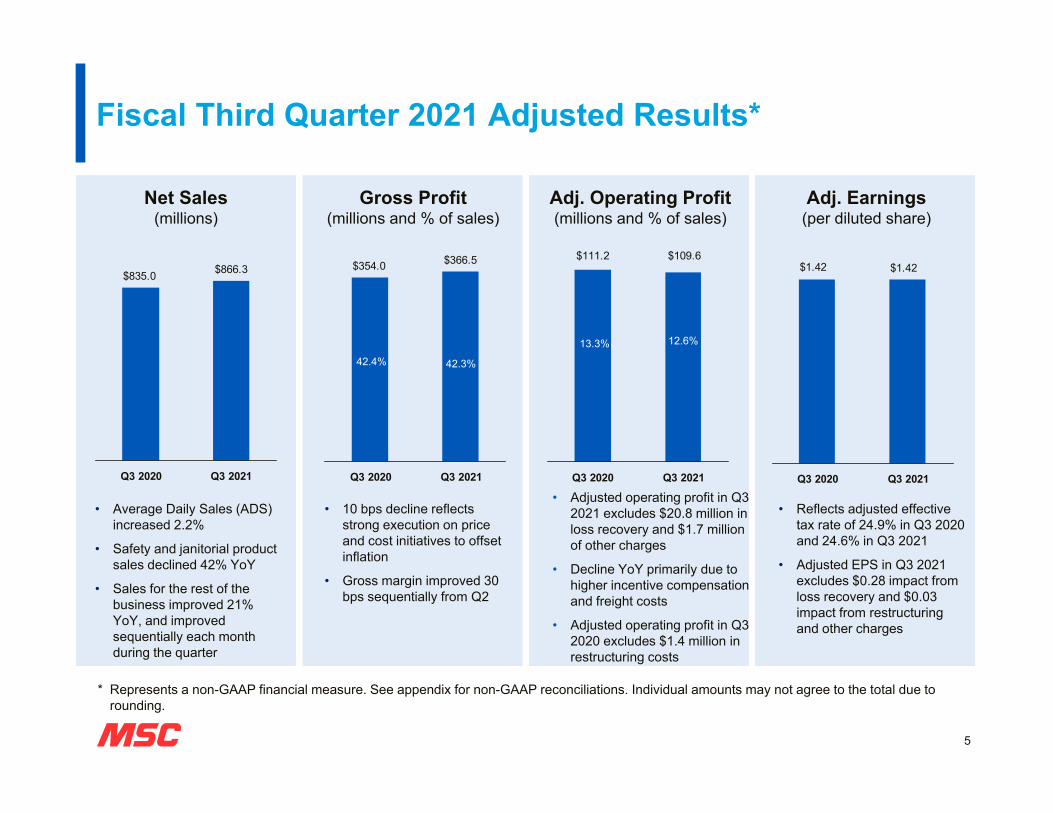
Fiscal Third Quarter 2021 Adjusted Results*
5
Net Sales(millions)
Gross Profit(millions and % of sales)
Adj. Operating Profit(millions and % of sales)
• Average Daily Sales (ADS) increased 2.2%
• Safety and janitorial product sales declined 42% YoY
• Sales for the rest of the business improved 21% YoY, and improved sequentially each month during the quarter
• 10 bps decline reflects strong execution on price and cost initiatives to offset inflation
• Gross margin improved 30 bps sequentially from Q2
• Adjusted operating profit in Q3 2021 excludes $20.8 million in loss recovery and $1.7 million of other charges
• Decline YoY primarily due to higher incentive compensation and freight costs
• Adjusted operating profit in Q3 2020 excludes $1.4 million in restructuring costs
Adj. Earnings(per diluted share)
• Reflects adjusted effective tax rate of 24.9% in Q3 2020 and 24.6% in Q3 2021
• Adjusted EPS in Q3 2021 excludes $0.28 impact from loss recovery and $0.03 impact from restructuring and other charges
* Represents a non-GAAP financial measure. See appendix for non-GAAP reconciliations. Individual amounts may not agree to the total due to rounding.
$366.5$354.0
Q3 2020 Q3 2021
$866.3$835.0
Q3 2020 Q3 2021
$109.6$111.2
Q3 2020 Q3 2021
$1.42$1.42
Q3 2020 Q3 2021
42.4% 42.3%
13.3% 12.6%
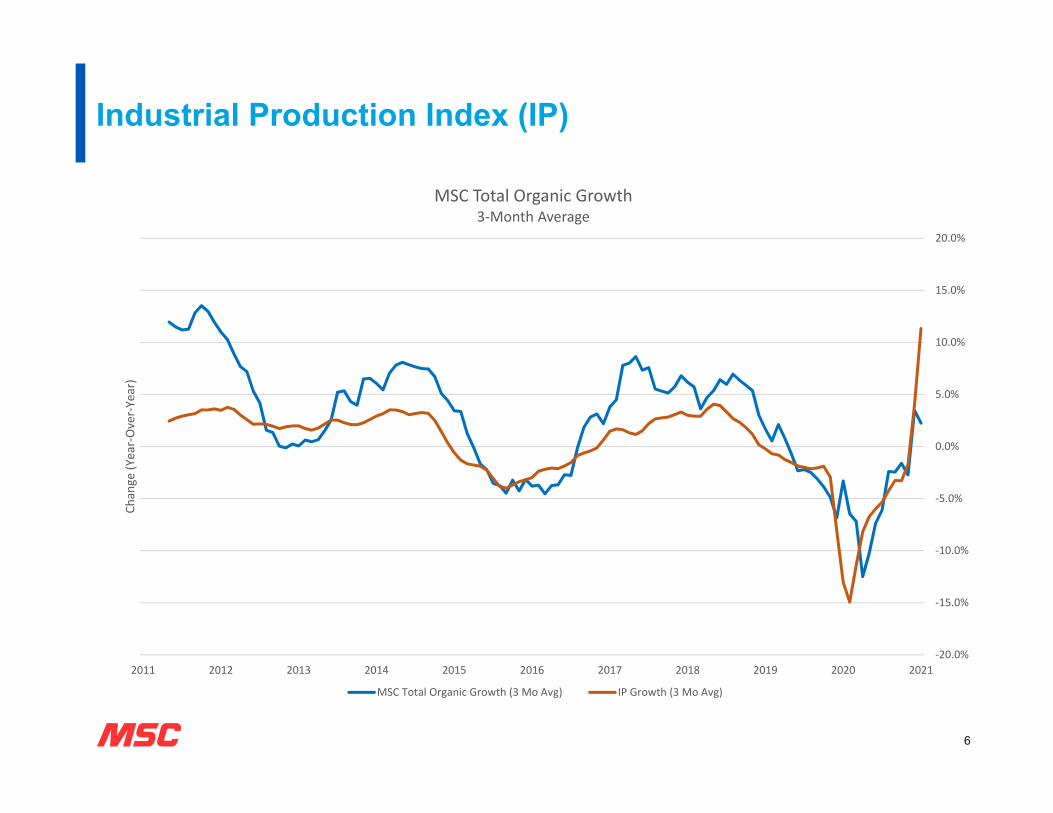
Industrial Production Index (IP)
6
‐20.0%
‐15.0%
‐10.0%
‐5.0%
0.0%
5.0%
10.0%
15.0%
20.0%
2011 2012 2013 2014 2015 2016 2017 2018 2019 2020 2021
Change (Year‐Over‐Year)
MSC Total Organic Growth 3‐Month Average
MSC Total Organic Growth (3 Mo Avg) IP Growth (3 Mo Avg)
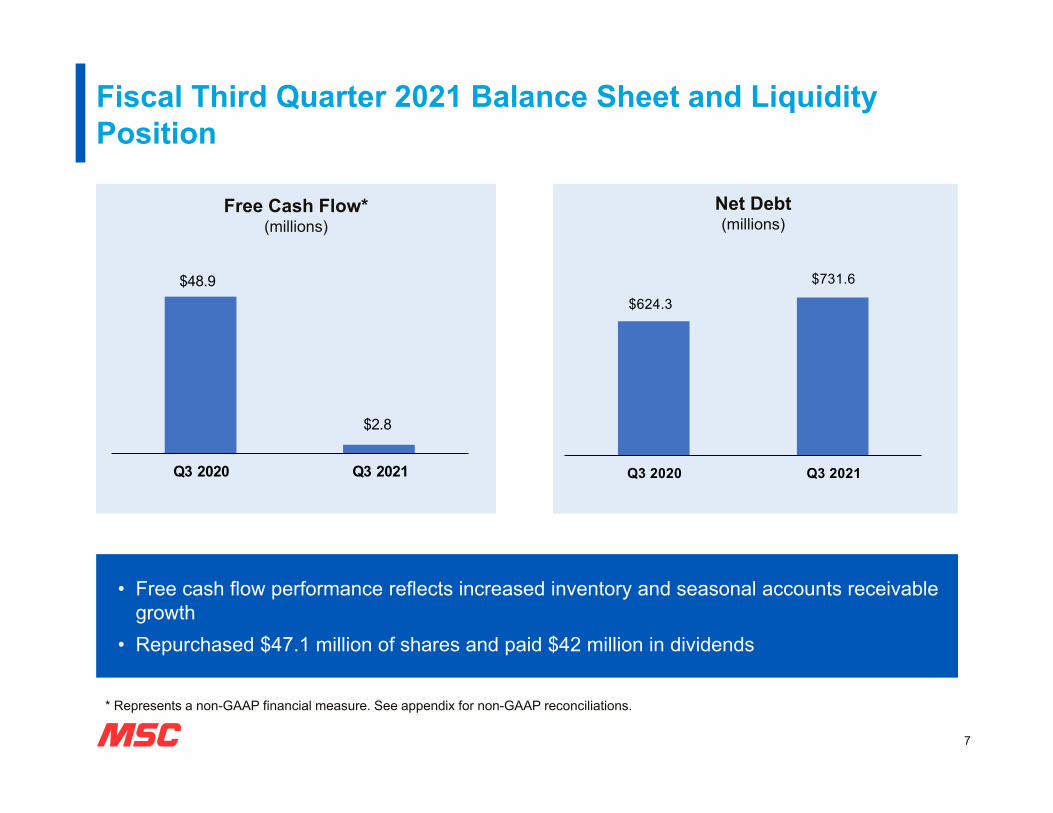
Fiscal Third Quarter 2021 Balance Sheet and Liquidity Position
• Free cash flow performance reflects increased inventory and seasonal accounts receivable growth
• Repurchased $47.1 million of shares and paid $42 million in dividends
7
Free Cash Flow*(millions)
Net Debt(millions)
* Represents a non-GAAP financial measure. See appendix for non-GAAP reconciliations.
$48.9
$2.8
Q3 2020 Q3 2021
$624.3
$731.6
Q3 2020 Q3 2021
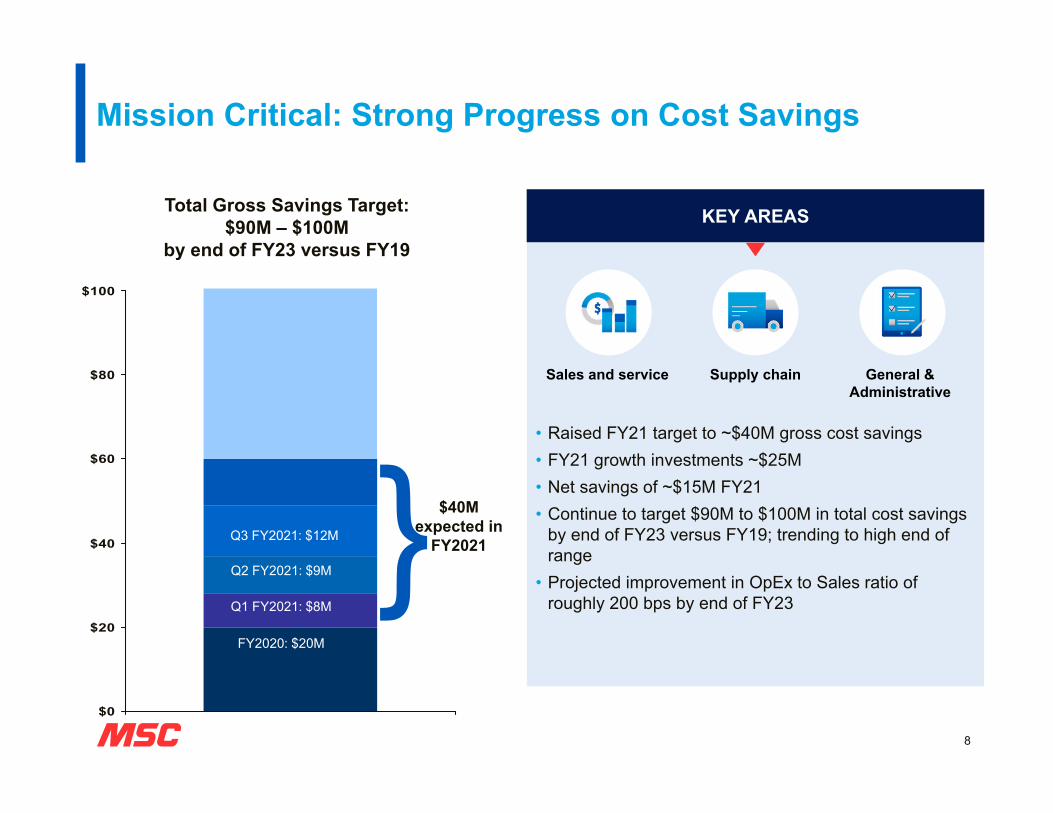
Mission Critical: Strong Progress on Cost Savings
Total Gross Savings Target:$90M – $100M
by end of FY23 versus FY19
Sales and service Supply chain General & Administrative
KEY AREAS
• Raised FY21 target to ~$40M gross cost savings• FY21 growth investments ~$25M • Net savings of ~$15M FY21• Continue to target $90M to $100M in total cost savings
by end of FY23 versus FY19; trending to high end of range
• Projected improvement in OpEx to Sales ratio of roughly 200 bps by end of FY23
$40Mexpected in
FY2021
8
$0
$20
$40
$60
$80
$100
FY2020: $20M
Q1 FY2021: $8M
Q2 FY2021: $9M
Q3 FY2021: $12M
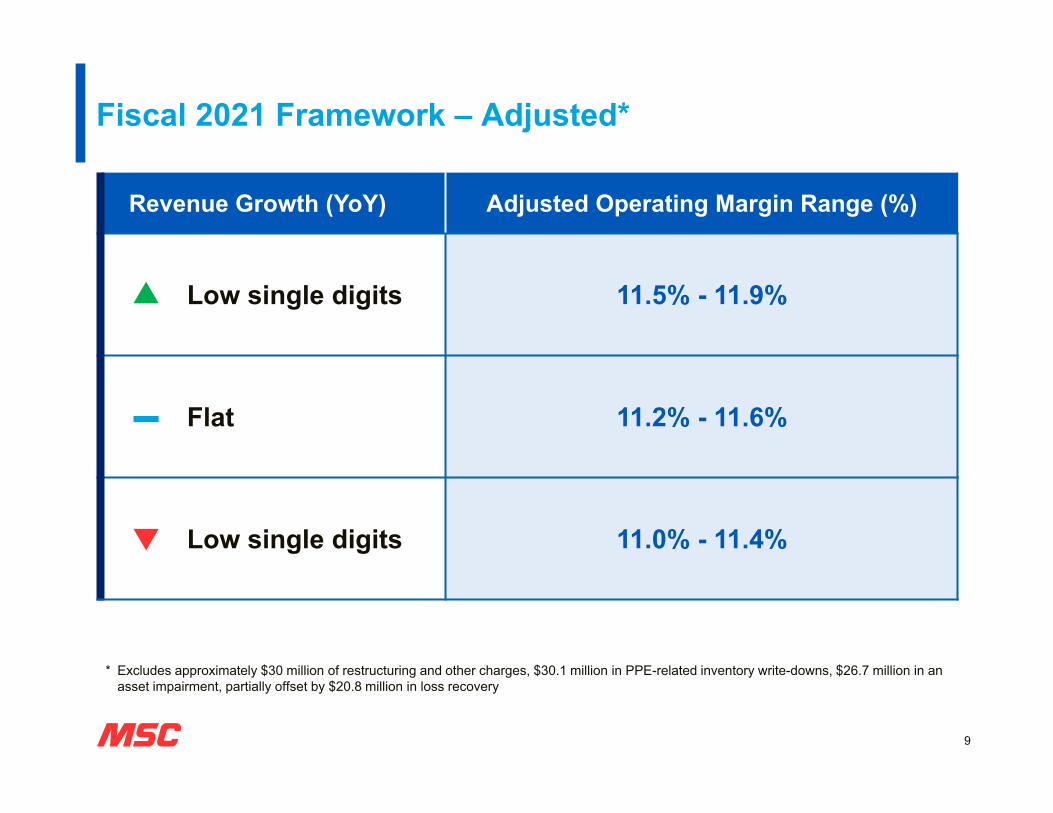
Fiscal 2021 Framework – Adjusted*
Revenue Growth (YoY) Adjusted Operating Margin Range (%)
Low single digits 11.5% - 11.9%
Flat 11.2% - 11.6%
Low single digits 11.0% - 11.4%
9
* Excludes approximately $30 million of restructuring and other charges, $30.1 million in PPE-related inventory write-downs, $26.7 million in an asset impairment, partially offset by $20.8 million in loss recovery
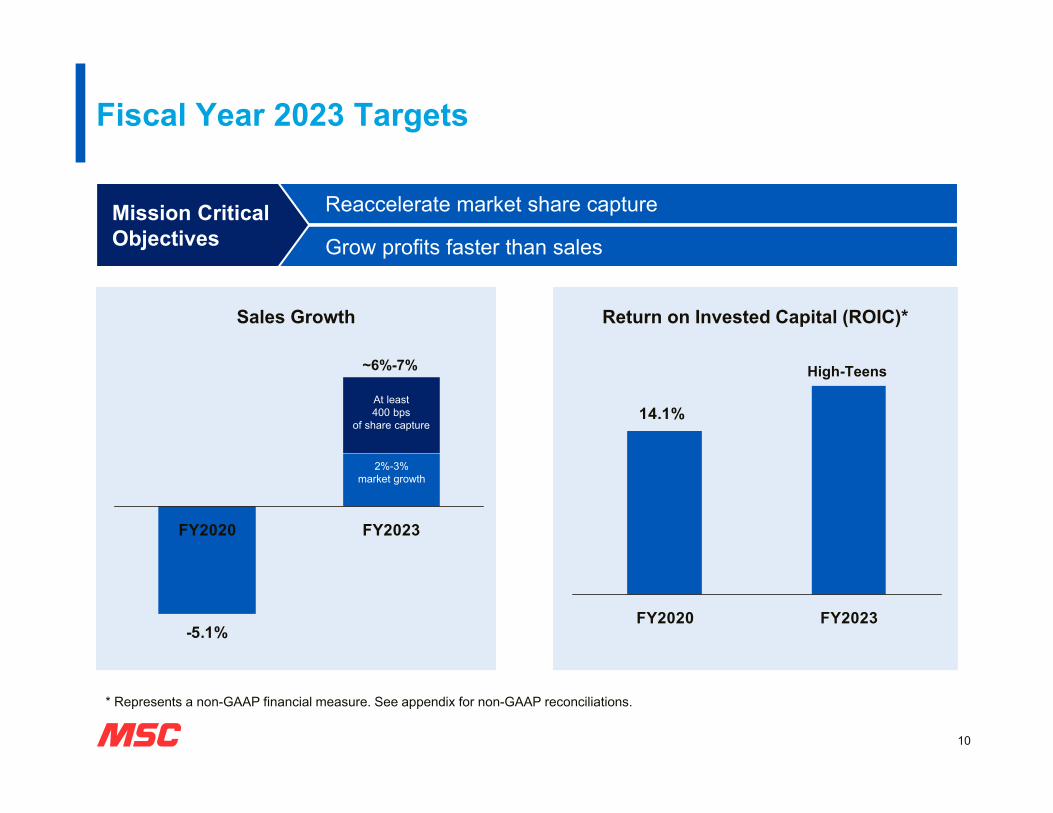
Reaccelerate market share capture
Grow profits faster than sales
Fiscal Year 2023 Targets
Mission Critical Objectives
Sales Growth Return on Invested Capital (ROIC)*
10
* Represents a non-GAAP financial measure. See appendix for non-GAAP reconciliations.
-5.1%
FY2020 FY2023
At least400 bps
of share capture
2%-3%market growth
~6%-7%
14.1%
FY2020 FY2023
High-Teens
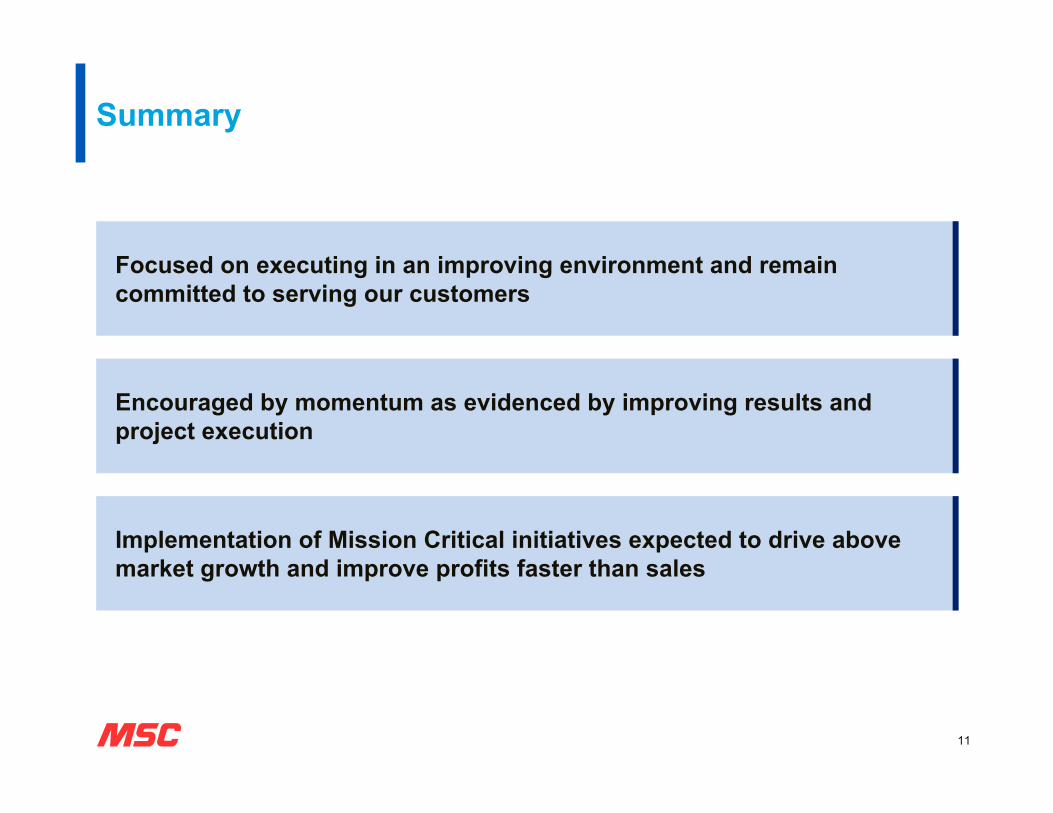
Summary
Focused on executing in an improving environment and remain committed to serving our customers
Encouraged by momentum as evidenced by improving results and project execution
Implementation of Mission Critical initiatives expected to drive above market growth and improve profits faster than sales
11
Appendix
12
SolidifyMetalworking
LeveragePortfolioStrength
ExpandSolutions
GrowE-commerce
DiversifyCustomers &End Markets
Sales & Services
SupplyChain
General & Administrative
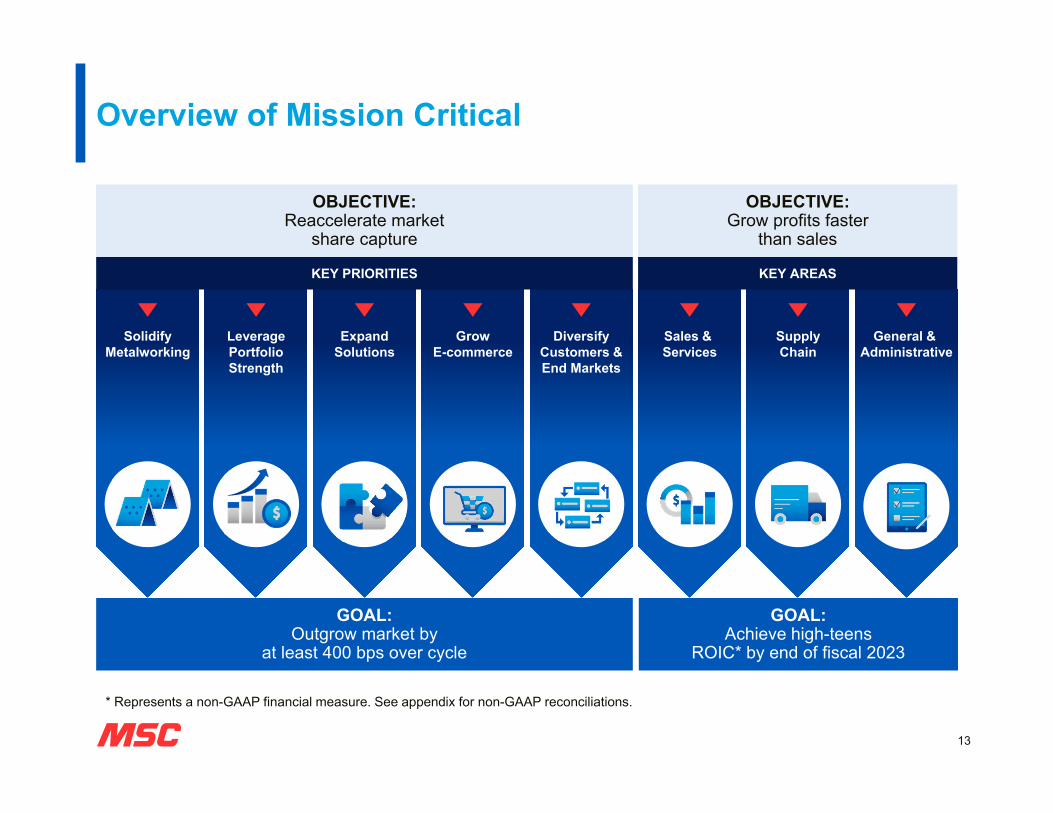
Overview of Mission Critical
OBJECTIVE: Reaccelerate market
share capture
GOAL: Outgrow market by
at least 400 bps over cycle
13
KEY PRIORITIES
OBJECTIVE: Grow profits faster
than sales
KEY AREAS
GOAL: Achieve high-teens
ROIC* by end of fiscal 2023
* Represents a non-GAAP financial measure. See appendix for non-GAAP reconciliations.
SolidifyMetalworking
LeveragePortfolioStrength
ExpandSolutions
GrowE-commerce
DiversifyCustomers &End Markets
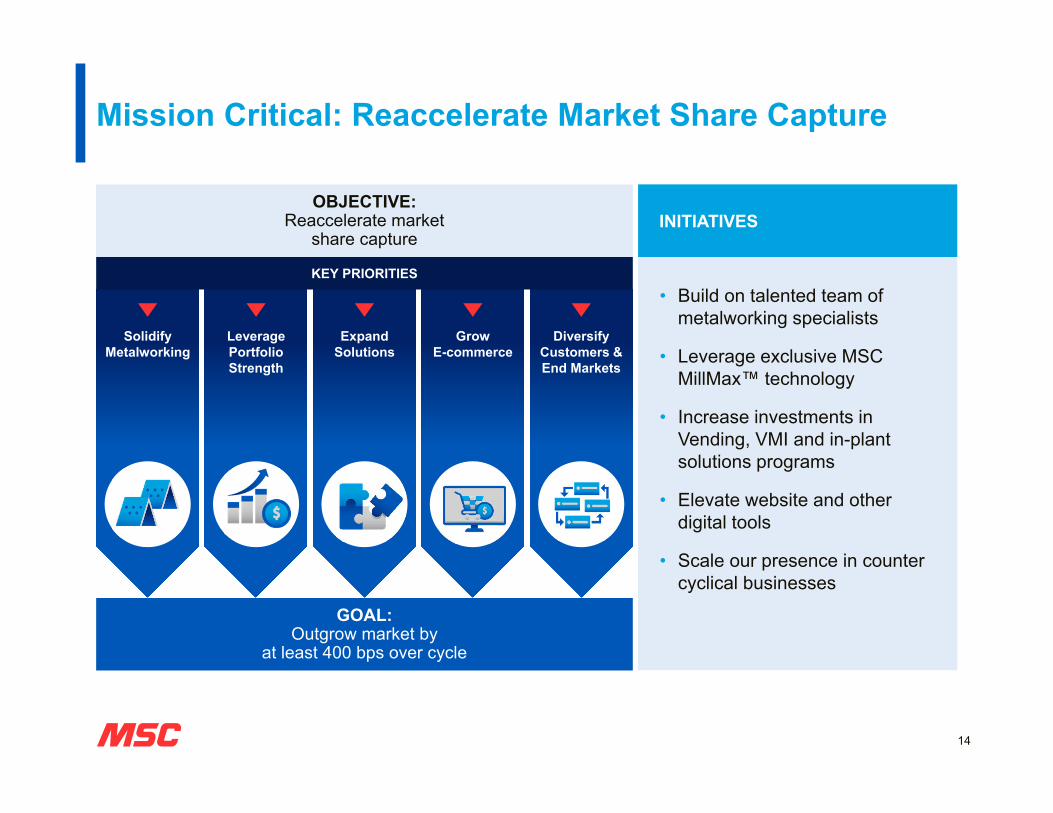
Mission Critical: Reaccelerate Market Share Capture
OBJECTIVE: Reaccelerate market
share capture
GOAL: Outgrow market by
at least 400 bps over cycle
14
KEY PRIORITIES• Build on talented team of
metalworking specialists
• Leverage exclusive MSC MillMax™ technology
• Increase investments in Vending, VMI and in-plant solutions programs
• Elevate website and other digital tools
• Scale our presence in counter cyclical businesses
INITIATIVES
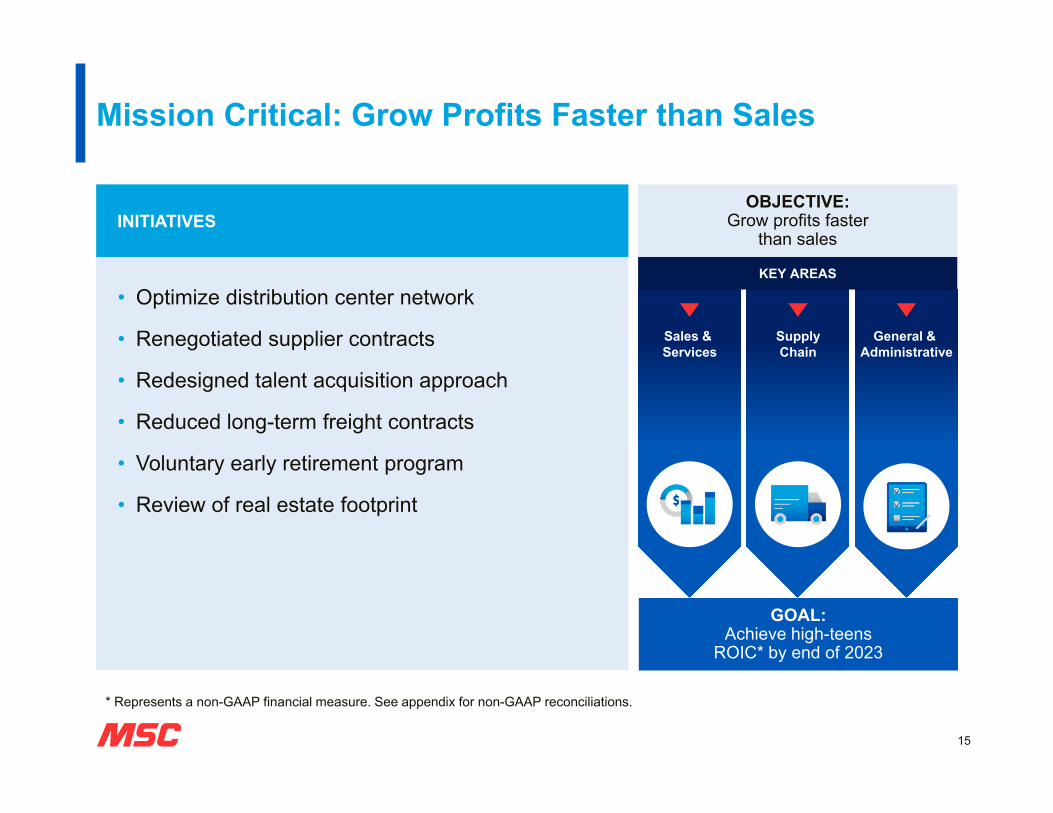
Mission Critical: Grow Profits Faster than Sales
15
Sales & Services
SupplyChain
General & Administrative
OBJECTIVE: Grow profits faster
than sales
KEY AREAS
GOAL: Achieve high-teens
ROIC* by end of 2023
• Optimize distribution center network
• Renegotiated supplier contracts
• Redesigned talent acquisition approach
• Reduced long-term freight contracts
• Voluntary early retirement program
• Review of real estate footprint
INITIATIVES
* Represents a non-GAAP financial measure. See appendix for non-GAAP reconciliations.
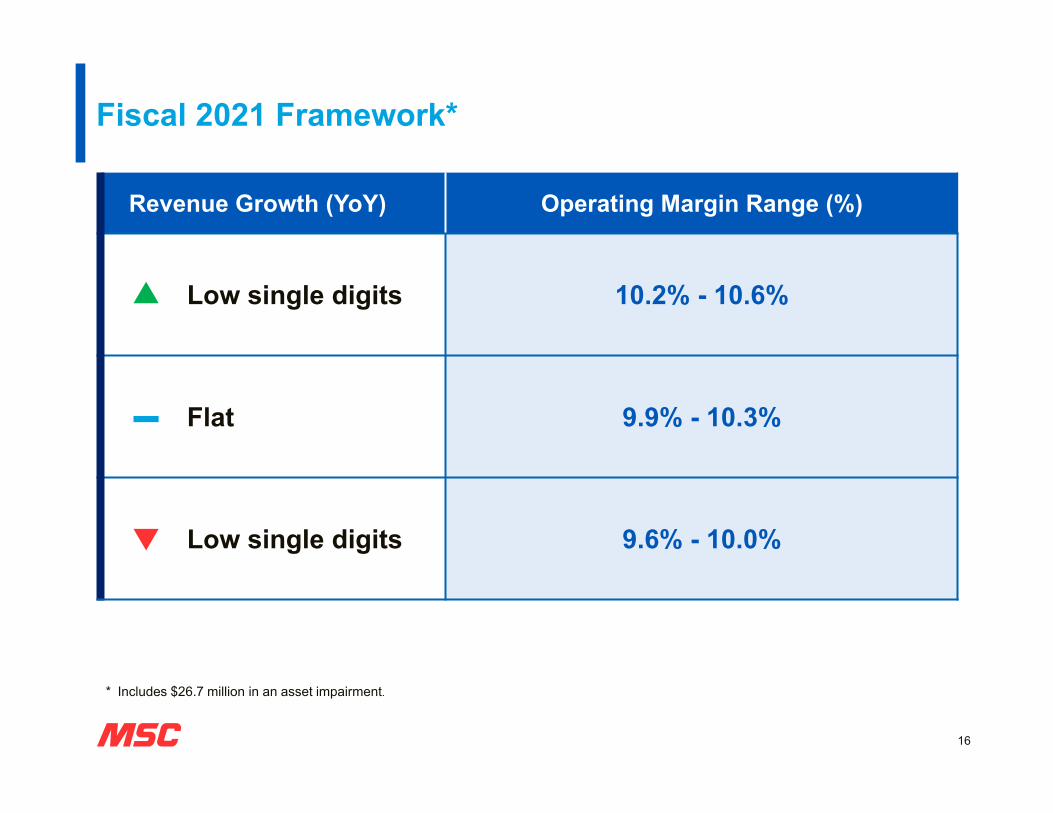
Fiscal 2021 Framework*
Revenue Growth (YoY) Operating Margin Range (%)
Low single digits 10.2% - 10.6%
Flat 9.9% - 10.3%
Low single digits 9.6% - 10.0%
16
* Includes $26.7 million in an asset impairment.
Reconciliations
17
Non-GAAP Financial Measures
Free Cash Flow (“FCF”)
FCF is a non-GAAP financial measure. FCF is used in addition to and in conjunction with results presented in accordance with accounting principles generally accepted in the United States (“GAAP”), and FCF should not be relied upon to the exclusion of GAAP financial measures. Management strongly encourages investors to review our financial statements and publicly-filed reports in their entirety and to not rely on any single financial measure. FCF, which we reconcile to “Net cash provided by operating activities,” is cash flow from operations reduced by “Expenditures for property, plant and equipment”. We believe that FCF, although similar to cash flow from operations, is a useful additional measure since capital expenditures are a necessary component of ongoing operations. Management also views FCF, as a measure of the Company’s ability to reduce debt, add to cash balances, pay dividends, and repurchase stock. FCF has limitations due to the fact that it does not represent the residual cash flow available for discretionary expenditures. For example, FCF does not incorporate payments made on finance lease obligations or required debt service payments. In addition, different companies define FCF differently. Therefore, we believe it is important to view FCF as a complement to our entire consolidated statements of cash flows. A reconciliation of cash provided by operating activities to FCF for the thirteen and thirty-nine-week periods ended May 29, 2021 and May 30, 2020, respectively is shown below.
Return on Invested Capital (“ROIC”)
ROIC is calculated using a non-GAAP financial measure. We calculate ROIC by dividing non-GAAP net operating profit after tax (“NOPAT”) by average invested capital, a GAAP measure. NOPAT is defined as tax effected income from operations. Average invested capital is defined as net debt plus shareholder’s equity using a trailing 13-month average. We believe that ROIC is useful to investors as a measure of performance and of the effectiveness of the use of capital in our operations. We use ROIC as one measure to monitor and evaluate operating performance. This method of determining non-GAAP ROIC may differ from other companies' methods and therefore may not be comparable to those used by other companies. ROIC should be considered in addition to, rather than as a substitute for, other information provided in accordance with GAAP. The financial measure calculated under GAAP which is most directly comparable to ROIC is considered to be the ratio of Net income to Average invested capital. See below for the calculation of ROIC and the reconciliation to the comparable GAAP measure.
Reconciliations
18
Results Excluding Impairment Loss (Loss Recovery), Restructuring Costs, Inventory Write-downs, and Other Charges
To supplement MSC Industrial’s unaudited selected financial data presented consistent with accounting principles generally accepted in the United States (“GAAP”), the Company discloses certain non-GAAP financial measures, including non-GAAP gross profit, non-GAAP operating expenses, non-GAAP income from operations, non-GAAP operating margin, non-GAAP provision for income taxes, non-GAAP net income and non-GAAP diluted earnings per share, that exclude impairment losses (loss recovery), restructuring costs, inventory write-downs related to certain PPE inventory, and other related costs and tax effects.
These non-GAAP financial measures are not presented in accordance with GAAP or an alternative for GAAP financial measures and may be different from similar non-GAAP financial measures used by other companies. The presentation of this additional information is not meant to be considered in isolation or as a substitute for the most directly comparable GAAP financial measures and should only be used to evaluate MSC Industrial’s results of operations in conjunction with the corresponding GAAP financial measures.
In calculating non-GAAP financial measures, we exclude impairment losses (loss recovery), restructuring costs, inventory write-downs related to certain PPE inventory, and other related costs and tax effects. Management makes these adjustments to facilitate a review of the Company’s operating performance on a comparable basis between periods, for comparison with forecasts and strategic plans, for identifying and analyzing trends in the Company’s underlying business and for benchmarking performance externally against competitors. We believe that investors benefit from seeing results from the perspective of management in addition to seeing results presented in accordance with GAAP for the same reasons and purposes for which management uses such non-GAAP financial measures.
Reconciliations
19
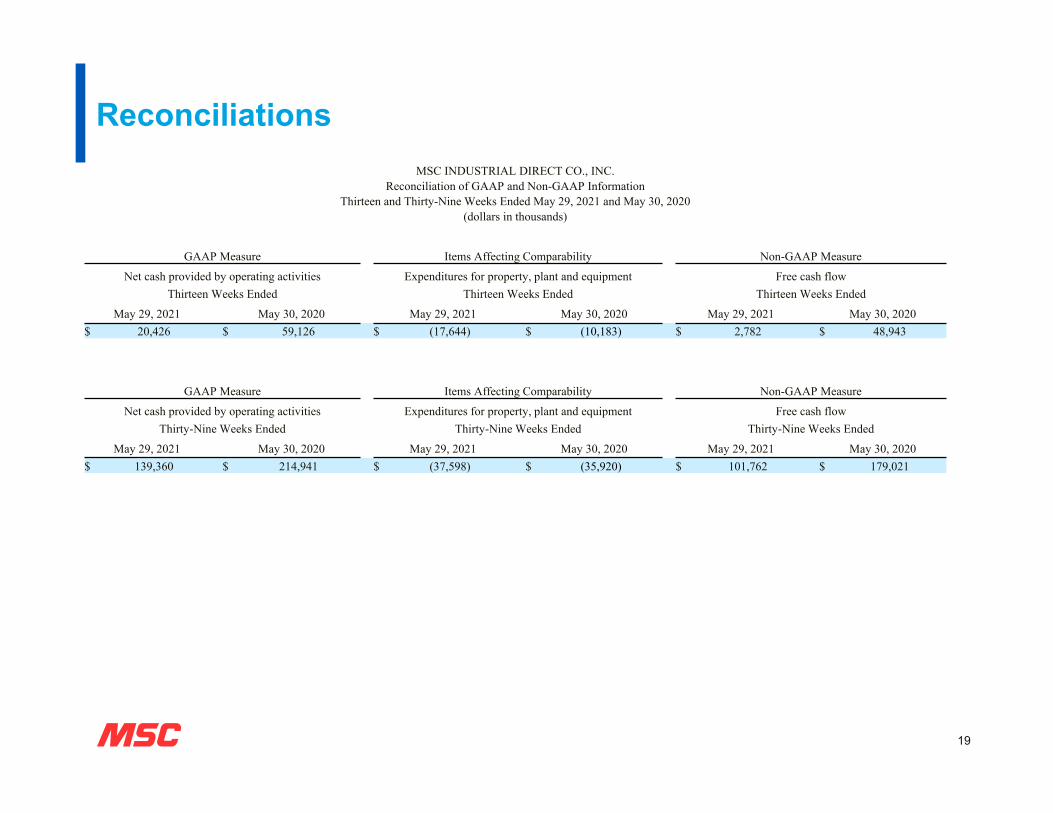
MSC INDUSTRIAL DIRECT CO., INC.Reconciliation of GAAP and Non-GAAP Information
Thirteen and Thirty-Nine Weeks Ended May 29, 2021 and May 30, 2020(dollars in thousands)
GAAP Measure Items Affecting Comparability Non-GAAP Measure
Net cash provided by operating activities Expenditures for property, plant and equipment Free cash flowThirteen Weeks Ended Thirteen Weeks Ended Thirteen Weeks Ended
May 29, 2021 May 30, 2020 May 29, 2021 May 30, 2020 May 29, 2021 May 30, 2020$ 20,426 $ 59,126 $ (17,644) $ (10,183) $ 2,782 $ 48,943
GAAP Measure Items Affecting Comparability Non-GAAP Measure
Net cash provided by operating activities Expenditures for property, plant and equipment Free cash flowThirty-Nine Weeks Ended Thirty-Nine Weeks Ended Thirty-Nine Weeks Ended
May 29, 2021 May 30, 2020 May 29, 2021 May 30, 2020 May 29, 2021 May 30, 2020$ 139,360 $ 214,941 $ (37,598) $ (35,920) $ 101,762 $ 179,021
Reconciliations
20
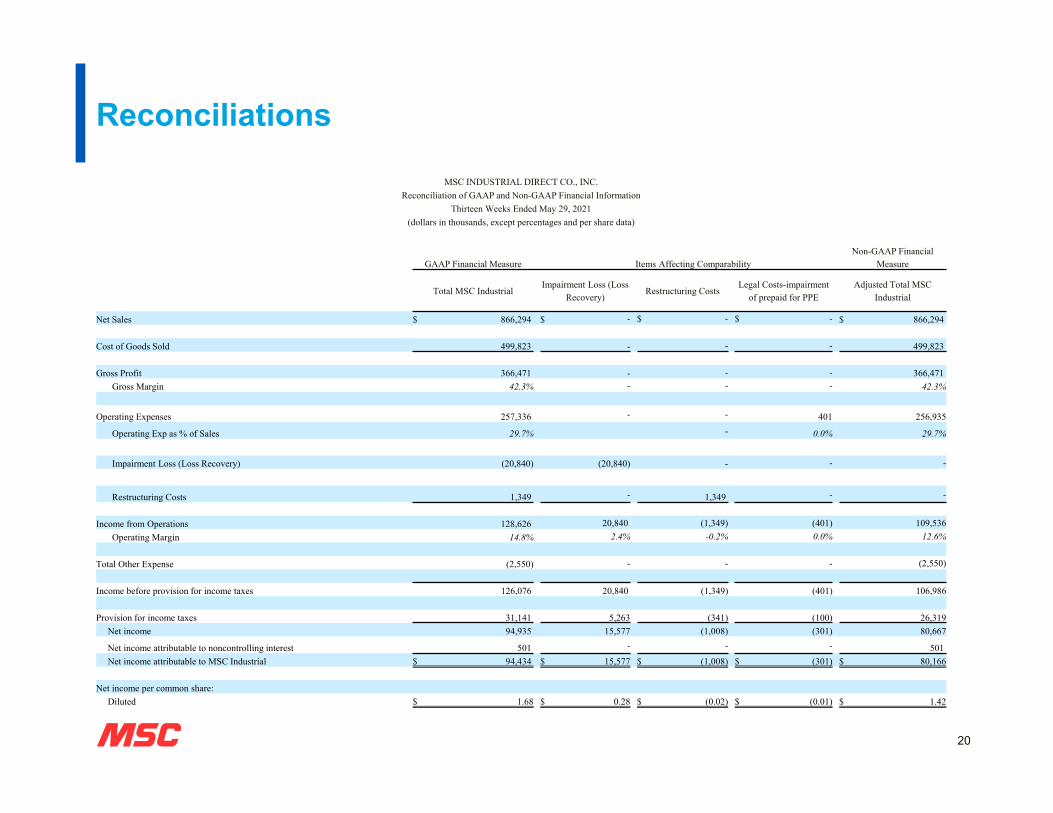
MSC INDUSTRIAL DIRECT CO., INC.Reconciliation of GAAP and Non-GAAP Financial Information
Thirteen Weeks Ended May 29, 2021(dollars in thousands, except percentages and per share data)
GAAP Financial Measure Items Affecting ComparabilityNon-GAAP Financial
Measure
Total MSC IndustrialImpairment Loss (Loss
Recovery) Restructuring Costs
Legal Costs-impairment of prepaid for PPE
Adjusted Total MSC Industrial
Net Sales $ 866,294 $ - $ - $ - $ 866,294
Cost of Goods Sold 499,823 - - - 499,823
Gross Profit 366,471 - - - 366,471Gross Margin 42.3% - - - 42.3%
Operating Expenses 257,336 - - 401 256,935
Operating Exp as % of Sales 29.7% - 0.0% 29.7%
Impairment Loss (Loss Recovery) (20,840) (20,840) - - -
Restructuring Costs 1,349 - 1,349 - -
Income from Operations 128,626 20,840 (1,349) (401) 109,536Operating Margin 14.8% 2.4% -0.2% 0.0% 12.6%
Total Other Expense (2,550) - - - (2,550)
Income before provision for income taxes 126,076 20,840 (1,349) (401) 106,986
Provision for income taxes 31,141 5,263 (341) (100) 26,319Net income 94,935 15,577 (1,008) (301) 80,667
Net income attributable to noncontrolling interest 501 - - - 501Net income attributable to MSC Industrial $ 94,434 $ 15,577 $ (1,008) $ (301) $ 80,166
Net income per common share:Diluted $ 1.68 $ 0.28 $ (0.02) $ (0.01) $ 1.42
Reconciliations
21
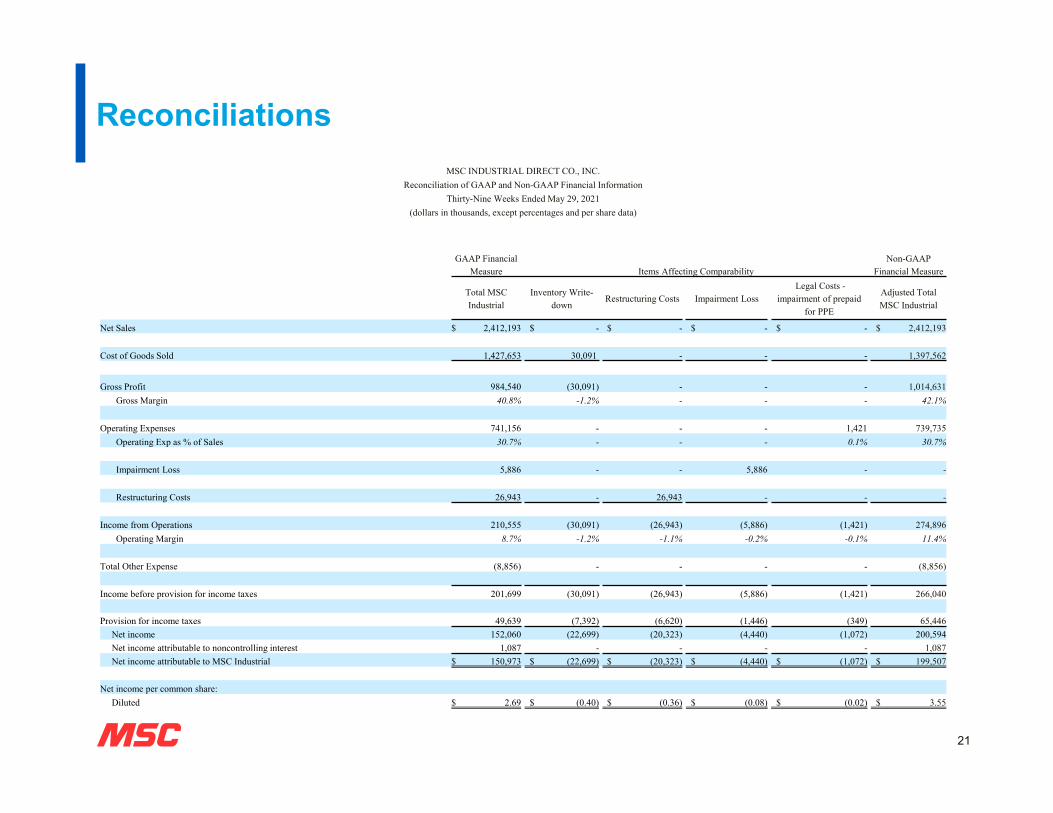
MSC INDUSTRIAL DIRECT CO., INC.Reconciliation of GAAP and Non-GAAP Financial Information
Thirty-Nine Weeks Ended May 29, 2021(dollars in thousands, except percentages and per share data)
GAAP Financial Measure Items Affecting Comparability
Non-GAAP Financial Measure
Total MSC Industrial
Inventory Write-down
Restructuring Costs Impairment Loss Legal Costs -
impairment of prepaid for PPE
Adjusted Total MSC Industrial
Net Sales $ 2,412,193 $ - $ - $ - $ - $ 2,412,193
Cost of Goods Sold 1,427,653 30,091 - - - 1,397,562
Gross Profit 984,540 (30,091) - - - 1,014,631Gross Margin 40.8% -1.2% - - - 42.1%
Operating Expenses 741,156 - - - 1,421 739,735Operating Exp as % of Sales 30.7% - - - 0.1% 30.7%
Impairment Loss 5,886 - - 5,886 - -
Restructuring Costs 26,943 - 26,943 - - -
Income from Operations 210,555 (30,091) (26,943) (5,886) (1,421) 274,896Operating Margin 8.7% -1.2% -1.1% -0.2% -0.1% 11.4%
Total Other Expense (8,856) - - - - (8,856)
Income before provision for income taxes 201,699 (30,091) (26,943) (5,886) (1,421) 266,040
Provision for income taxes 49,639 (7,392) (6,620) (1,446) (349) 65,446Net income 152,060 (22,699) (20,323) (4,440) (1,072) 200,594Net income attributable to noncontrolling interest 1,087 - - - - 1,087Net income attributable to MSC Industrial $ 150,973 $ (22,699) $ (20,323) $ (4,440) $ (1,072) $ 199,507
Net income per common share:Diluted $ 2.69 $ (0.40) $ (0.36) $ (0.08) $ (0.02) $ 3.55
Reconciliations
22
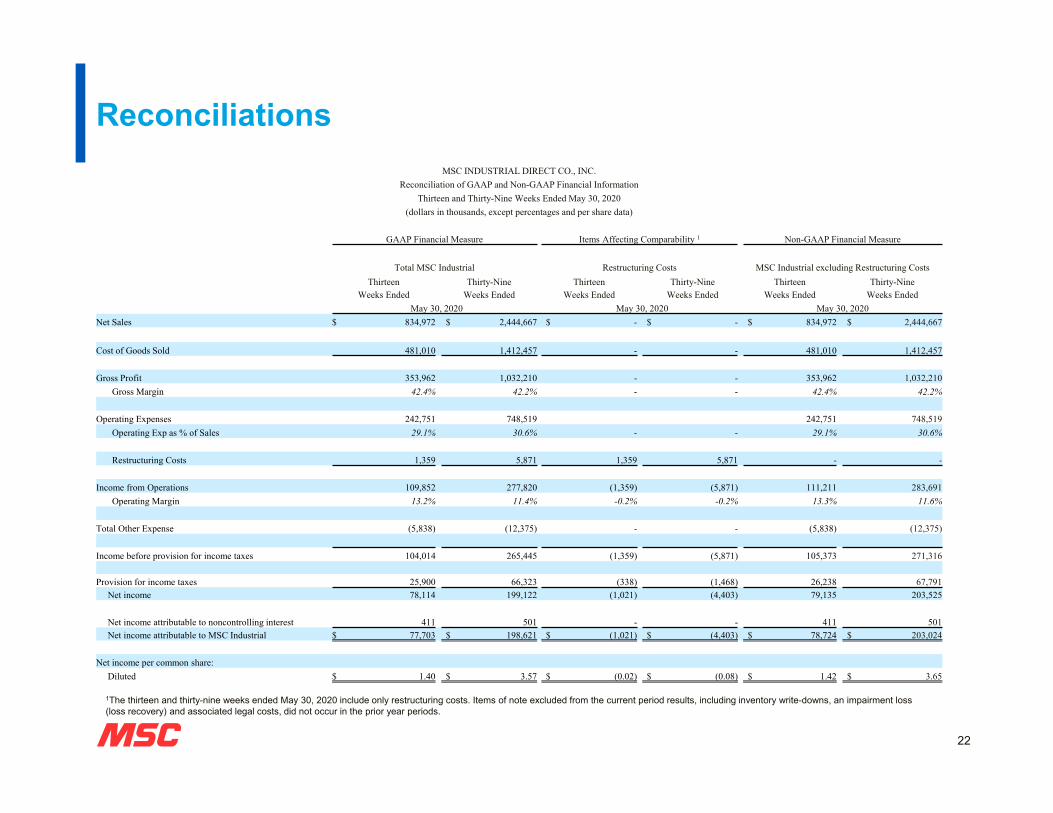
MSC INDUSTRIAL DIRECT CO., INC.Reconciliation of GAAP and Non-GAAP Financial Information
Thirteen and Thirty-Nine Weeks Ended May 30, 2020(dollars in thousands, except percentages and per share data)
GAAP Financial Measure Items Affecting Comparability 1 Non-GAAP Financial Measure
Total MSC Industrial Restructuring Costs MSC Industrial excluding Restructuring CostsThirteen
Weeks EndedThirty-Nine
Weeks EndedThirteen
Weeks EndedThirty-Nine
Weeks EndedThirteen
Weeks EndedThirty-Nine
Weeks EndedMay 30, 2020 May 30, 2020 May 30, 2020
Net Sales $ 834,972 $ 2,444,667 $ - $ - $ 834,972 $ 2,444,667
Cost of Goods Sold 481,010 1,412,457 - - 481,010 1,412,457
Gross Profit 353,962 1,032,210 - - 353,962 1,032,210Gross Margin 42.4% 42.2% - - 42.4% 42.2%
Operating Expenses 242,751 748,519 242,751 748,519Operating Exp as % of Sales 29.1% 30.6% - - 29.1% 30.6%
Restructuring Costs 1,359 5,871 1,359 5,871 - -
Income from Operations 109,852 277,820 (1,359) (5,871) 111,211 283,691Operating Margin 13.2% 11.4% -0.2% -0.2% 13.3% 11.6%
Total Other Expense (5,838) (12,375) - - (5,838) (12,375)
Income before provision for income taxes 104,014 265,445 (1,359) (5,871) 105,373 271,316
Provision for income taxes 25,900 66,323 (338) (1,468) 26,238 67,791Net income 78,114 199,122 (1,021) (4,403) 79,135 203,525
Net income attributable to noncontrolling interest 411 501 - - 411 501Net income attributable to MSC Industrial $ 77,703 $ 198,621 $ (1,021) $ (4,403) $ 78,724 $ 203,024
Net income per common share:Diluted $ 1.40 $ 3.57 $ (0.02) $ (0.08) $ 1.42 $ 3.65
1The thirteen and thirty-nine weeks ended May 30, 2020 include only restructuring costs. Items of note excluded from the current period results, including inventory write-downs, an impairment loss (loss recovery) and associated legal costs, did not occur in the prior year periods.
Reconciliations
23
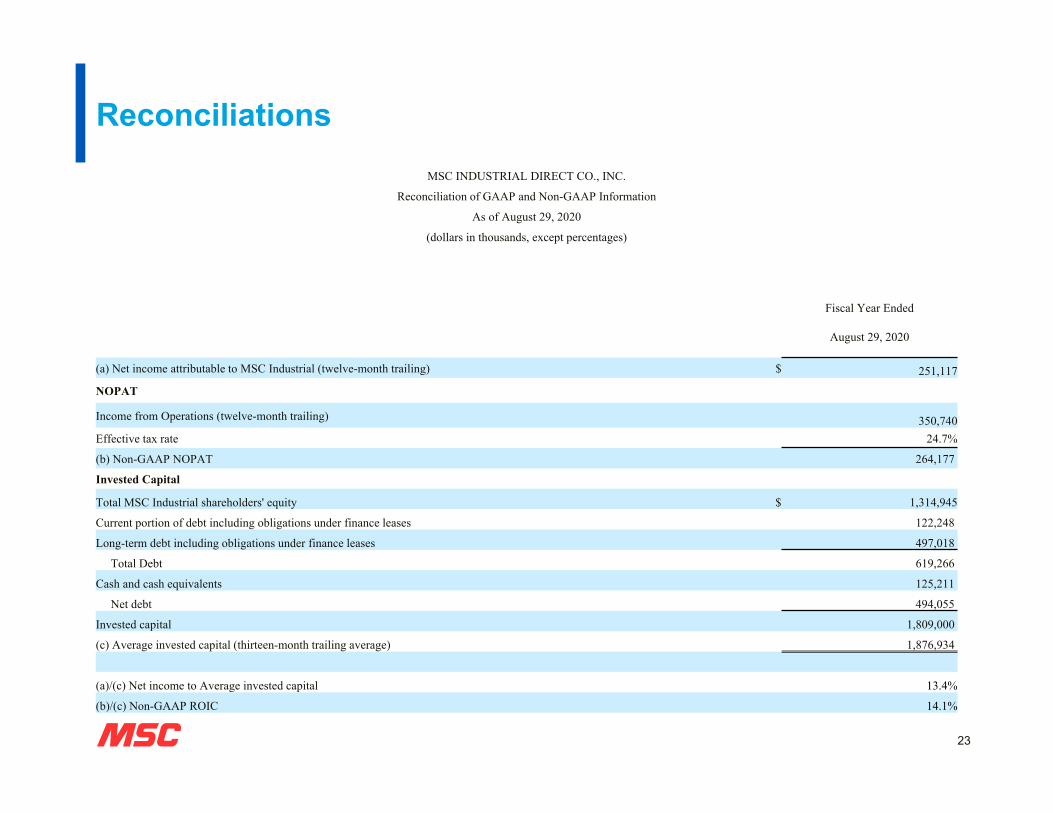
MSC INDUSTRIAL DIRECT CO., INC.
Reconciliation of GAAP and Non-GAAP Information
As of August 29, 2020
(dollars in thousands, except percentages)
Fiscal Year Ended
August 29, 2020
(a) Net income attributable to MSC Industrial (twelve-month trailing) $ 251,117
NOPAT
Income from Operations (twelve-month trailing) 350,740Effective tax rate 24.7%
(b) Non-GAAP NOPAT 264,177
Invested Capital
Total MSC Industrial shareholders' equity $ 1,314,945
Current portion of debt including obligations under finance leases 122,248
Long-term debt including obligations under finance leases 497,018
Total Debt 619,266
Cash and cash equivalents 125,211
Net debt 494,055
Invested capital 1,809,000
(c) Average invested capital (thirteen-month trailing average) 1,876,934
(a)/(c) Net income to Average invested capital 13.4%
(b)/(c) Non-GAAP ROIC 14.1%