Embed Size (px)
Citation preview

Footer Text Date
Fiscal Year 2016 4th Quarter Report Quarterly Report of Actual Traffic and Revenue
June 2016 – August 2016

Table of Contents
2
Section Page Number
Notes and Observations 3-4
Significant Events and Milestones 5
SECTION I: CTTS Overview
Executive Summary 7
SECTION II: CTTS Traffic
Historical Monthly Transactions 9-10
Historical Monthly Transactions by Facility 11
Historical Monthly Transactions by Vehicle Type 12
Historical ETC vs. PBM Transactions 13
SECTION III: CTTS Revenue
Historical Monthly Toll Revenue 15-16
Historical Monthly Toll Revenue by Facility 17
SECTION IV: Debt Service Coverage
Actual and Projected Debt Service Coverage 19
SECTION V: Additional CTTS Information
CTTS Map 21
Toll Rates per Mile 22
Data Tables 23-32
Additional Disclosures 33-34
Disclaimer 35

Notes and Observations
3
The Central Texas Turnpike System (CTTS) Fiscal Year Report provides information on projected transactions and revenues
compared to actuals.
Transaction and revenue projections used in this report are based on the transaction and revenue projections documented in the
2014 CTTS Traffic and Revenue Forecast dated December 30, 2014, and has been seasonally adjusted to better represent the
month-to-month trends established over recent years.
All revenue projections are based on the assumed shares of transactions by payment method and adjusted to reflect anticipated
losses due to uncollectable transactions assumed at the time the 2014 forecasts were prepared.
Toll Revenue reported excludes fees and charges.
Transaction and revenue trends may not exactly correlate on a monthly or quarterly basis due to the following factors:
• Transaction counts are generated through the roadway Toll Management System (TMS) and revenue are derived from
Xerox Vector back office reports.
• On a monthly basis, transactions (when a vehicle passes through a toll facility, plaza or ramp) are reported in the period in
which they occur.
• Revenue for Electronic Toll Collection (ETC) transactions are recognized when they are earned, which is at the time the
transaction occurs.
• Pay By Mail (PBM) revenues are recognized when cash payment is received. For example, a PBM transaction may be
reported in one month, but revenue for that transaction may not be received until a later month.
• Each transaction represents a different amount of revenue depending on the rate charged for the type of vehicle, type of
transaction, and tolling point.

4
Notes and Observations
Seasonal impacts, such as holidays and the number of weekdays in each month, have an impact on month-to-month
changes in revenue and transactions.
A fiscal year end adjustment is made to revenue in the Annual Financial Report to reflect Pay By Mail revenues earned but
not collected, less an allowance for doubtful accounts. Thus total annual toll revenues in the Annual Financial Report should
reflect the revenue earned, adjusted for an allowance for doubtful accounts, during the fiscal year for transactions that
occurred in the fiscal year.
Toll waiver transactions are reported in the period they occur.
Traffic and Revenue data table for individual roadways may vary slightly from the CTTS totals due to rounding.
Data in this report is unaudited.

Significant Events and Milestones
5
In August of 2012, the Texas Transportation Commission (Commission) adopted a number of changes to the CTTS which weredesigned in aggregate to make the CTTS more self-sufficient and to strengthen the CTTS financial credit including an adoptionof the annual toll escalation, scheduled for January of each year based on the Consumer Price Index-Urban (or “CPI-U”). Theinitial toll rate escalation of 1.5% to all roads occurred on January 1, 2014, and a subsequent escalation of 1.7% occurred onJanuary 1, 2015. In accordance with the toll rate escalation policy, a toll rate escalation percentage of 0.2% was applied to the2015 base toll rates for each CTTS element and pay point. Due to rounding, this generated no increase to the toll rates forcalendar year 2016 as adopted by the Commission in Minute Order 114411 on October 29, 2015.
Beginning September 1, 2013, Senate Bill 1792 was implemented to strengthen the toll collection process by authorizingadditional toll collection remedies for habitual violators. The legislation provides more authority to enforce non-payment,including publishing violator names, addresses and amounts due on websites and in newspapers, and banning the vehiclesfrom using Texas Department of Transportation (TxDOT) toll roads. If caught driving after being banned and ticketed, theviolator’s vehicle may be impounded. The legislation also includes authority to report habitual violators to county tax assessorcollectors, who have the discretion to block their vehicle registration.
As previously disclosed, the vendor for the customer service activities (e.g. invoicing, printing and mailing services, paymentprocessing and toll violation collection) was transitioned to the Xerox system beginning July 3, 2014 which required interruptionsto certain customer service and billing functions including delayed toll postings, statement processing, PBM billing, andescalation of past due transactions to violations and collections. To foster better customer relations due to impact of late billingfrom the Xerox transition, the escalation of late fees was suspended as of February, 2015. TxDOT re-established the late feeassessments in September 2016.
In 2015, House Bill 1 (Rider 49) passed by the 84th Legislature appropriated a total of $18.7 million for fiscal years 2016 and2017 combined to fund a truck toll discount program to be used for congestion relief and air quality mitigation strategies. Thetemporary truck toll discount includes Segments 1-4 of SH 130 and SH 45SE. Minute Order # 114528 details the programwhich began on April 18, 2016. The CTTS will be reimbursed for the toll revenue discount. The discount does not impactreported toll revenue as revenue recognition includes the discount, in anticipation of the reimbursement which may be receivedin a later period.
Published CTTS reports may be accessed at: http://www.txdot.gov/business/investors.html. Additional information on the CTTS,including a current toll rate schedule may be accessed at: https://www.txtag.org/en/about/tollroad_austin_area.shtml.

Footer Text Date
Section I: CTTS Overview
6

Historical Monthly Transactions Summary
Executive Summary
7
Historical Monthly Toll Revenue Summary
Actual vs. Projected Transactions and Toll
Revenue Debt Service Coverage
0.4
1.46
0.4
4.4
5.14
4.4
5.14
1.46
0
2
4
6
8
10
12
14
Sep Oct Nov Dec Jan Feb Mar Apr May Jun Jul Aug
Mil
lio
ns FY2014 FY2015 FY2016
$0
$5
$10
$15
$20
Sep Oct Nov Dec Jan Feb Mar Apr May Jun Jul Aug
Mil
lio
ns FY2014 FY2015 FY2016
$8
$10
$12
$14
$16
9
11
13R
eve
nu
eM
illio
ns
Tra
ffic
Mil
lio
ns
Actual Traffic Projected TrafficActual Toll Revenue Projected Toll Revenue
0.00x
0.70x
1.40x
2.10x
2.80x
3.50x
4.20x
FY12 FY13 FY14 FY15 FY16
1st Tier Debt Service Coverage 1st Tier Rate Covenant
Total Debt Service Coverage Total Rate Covenant

Footer Text Date
Section II: CTTS Transactions
8
Historical Monthly Transactions (millions)
Historical Monthly Transactions
9
Sep Oct Nov Dec Jan Feb Mar Apr May Jun Jul Aug
FY2014 8.6 9.2 8.9 8.5 8.0 7.9 9.4 9.5 9.8 9.7 9.8 9.9
FY2015 9.6 10.5 9.6 9.9 9.2 9.0 10.7 11.0 10.9 11.2 11.6 11.4
FY2016 11.2 11.7 10.9 11.2 10.7 11.1 12.6 12.2 12.5 12.7 12.4 12.6
0
2
4
6
8
10
12
14FY2014 FY2015 FY2016

7.5
8.5
9.5
10.5
11.5
12.5
13.5
Sep Oct Nov Dec Jan Feb Mar Apr May Jun Jul Aug
Mil
lio
ns FY2014 FY2015 FY2016
Historical Monthly Transactions
10
Historical Monthly Transactions (millions)

Historical Monthly Transactions by Facility
11
SH 45N Historical Monthly Transactions SH 130 Historical Monthly Transactions
SH 45SE Historical Monthly Transactions
1.5
1.6
1.7
1.8
1.9
2.0
Sep Oct Nov Dec Jan Feb Mar Apr May Jun Jul Aug
Mil
lio
ns FY2014 FY2015 FY2016
2.8
3.0
3.2
3.4
3.6
3.8
4.0
4.2
4.4
Sep Oct Nov Dec Jan Feb Mar Apr May Jun Jul Aug
Mil
lio
ns FY2014 FY2015 FY2016
3.0
3.5
4.0
4.5
5.0
5.5
6.0
Sep Oct Nov Dec Jan Feb Mar Apr May Jun Jul Aug
Mil
lio
ns
FY2014 FY2015 FY2016
0.3
0.4
0.4
0.5
0.5
0.6
0.6
0.7
Sep Oct Nov Dec Jan Feb Mar Apr May Jun Jul Aug
Mil
lio
ns
FY2014 FY2015 FY2016
Loop 1 Historical Monthly Transactions

Monthly Transactions versus Projections – Total (millions) (12 Month Moving Avg)
Historical Monthly Transactions by Vehicle Type
12
Monthly Transactions versus Projections – Auto (millions) (12 Month Moving Avg)
Monthly Transactions versus Projections – Truck (millions) (12 Month Moving Avg)
9.00
10.00
11.00
12.00
Sep-15 Oct-15 Nov-15 Dec-15 Jan-16 Feb-16 Mar-16 Apr-16 May-16 Jun-16 Jul-16 Aug-16
Projected Actual
0.58
0.68
0.78
Sep-15 Oct-15 Nov-15 Dec-15 Jan-16 Feb-16 Mar-16 Apr-16 May-16 Jun-16 Jul-16 Aug-16
Projected Actual
9.00
10.00
11.00
12.00
Sep-15 Oct-15 Nov-15 Dec-15 Jan-16 Feb-16 Mar-16 Apr-16 May-16 Jun-16 Jul-16 Aug-16
Projected Actual

Historical ETC vs. PBM Transactions
13
Historical ETC vs. PBM Transactions
71.60% 71.40% 71.80% 70.00% 68.42% 65.17%
20.50% 20.50%25.80% 30.00% 31.58% 34.83%
7.90% 8.10%2.40%
0%
10%
20%
30%
40%
50%
60%
70%
80%
90%
100%
FY2011 FY2012 FY2013 FY2014 FY2015 FYTD 2016
ETC PBM Cash
Note: In 2013, CTTS eliminated all toll collection booths/automatic cash machines and implemented “All Electronic Tolling.”

Footer Text Date
Section III: CTTS Revenue
14

Historical Monthly Toll Revenue (millions)
Historical Monthly Toll Revenue
15
Sep Oct Nov Dec Jan Feb Mar Apr May Jun Jul Aug
FY2014 $11.0 $11.4 $10.5 $9.2 $9.4 $9.4 $10.9 $10.8 $10.5 $12.6 $9.9 $9.5
FY2015 $9.9 $10.4 $11.5 $12.2 $12.4 $12.2 $14.0 $13.3 $13.8 $13.7 $14.0 $14.2
FY2016 $13.8 $13.6 $13.6 $13.5 $13.5 $13.6 $15.2 $14.0 $15.0 $14.6 $14.4 $15.9
$0
$2
$4
$6
$8
$10
$12
$14
$16
$18 FY2014 FY2015 FY2016

Historical Monthly Toll Revenue
16
Historical Monthly Toll Revenue (millions)
$9.0
$10.0
$11.0
$12.0
$13.0
$14.0
$15.0
$16.0
Sep Oct Nov Dec Jan Feb Mar Apr May Jun Jul Aug
Mil
lio
ns FY2014 FY2015 FY2016

Historical Monthly Toll Revenue by Facility
17
SH 45N Historical Monthly Toll Revenue SH 130 Historical Monthly Toll Revenue
SH 45SE Historical Monthly Toll Revenue
$1.4
$1.6
$1.8
$2.0
Sep Oct Nov Dec Jan Feb Mar Apr May Jun Jul Aug
Mil
lio
ns
FY2014 FY2015 FY2016
$2.6
$2.8
$3.0
$3.2
$3.4
$3.6
$3.8
$4.0
Sep Oct Nov Dec Jan Feb Mar Apr May Jun Jul Aug
Mil
lio
ns FY2014 FY2015 FY2016
$3.4
$4.4
$5.4
$6.4
$7.4
$8.4
$9.4
Sep Oct Nov Dec Jan Feb Mar Apr May Jun Jul Aug
Mil
lio
ns FY2014 FY2015 FY2016
$0.3
$0.4
$0.5
$0.6
$0.7
Sep Oct Nov Dec Jan Feb Mar Apr May Jun Jul Aug
Mil
lio
ns FY2014 FY2015 FY2016
Loop 1 Historical Monthly Toll Revenue

Footer Text Date
Section IV: Debt Service Coverage
18

FY11 FY12 FY13 FY14 FY15 FY16 FY17 FY18 FY19 FY20
Toll Revenue $68.8 $75.7 $105.8 $130.9 $152.3 $170.7 $165.0 $177.3 $189.6 $201.7
Fees 6.1 10.1 13.3 13.3 10.9 1.5 17.4 18.0 18.6 19.1
Interest, Other 6.6 6.7 6.1 6.0 6.4 7.6 7.3 7.3 7.3 7.3
Total Revenues $81.5 $92.5 $125.3 $150.2 $169.6 $179.8 $189.7 $202.6 $215.5 $228.1
First Tier D/S $42.9 $45.8 $41.5 $41.0 $51.1 $50.9 $57.1 $63.4 $69.6 $75.9
Second Tier D/S $30.1 $31.7 $33.7 $35.0 $30.7 $57.9 $57.9 $57.9 $57.9 $57.9
FY11 FY12 FY13 FY14 FY15 FY16 FY17 FY18 FY19 FY20
First Tier DSCR 1.90x 2.02x 3.02x 3.66x 3.32x 3.53x 3.32x 3.20x 3.10x 3.01x
Total DSCR 1.12x 1.19x 1.67x 1.98x 2.07x 1.65x 1.65x 1.67x 1.69x 1.71x
0.00
0.50
1.00
1.50
2.00
2.50
3.00
3.50
4.00D
eb
t S
erv
ice
Cove
rage
First Tier DSCR
Total DSCR
Actual and Projected Debt Service Coverage
Actual and Projected Debt Service Coverage
19
Actual Projected
* The debt service presented is based on scheduled cash payments in accordance with the 2015 Official Statement. Differences with the CTTS Annual Financial Report
are based on GAAP rules applicable to enterprise funds. All dollar amounts are shown in millions. Preliminary and based on unaudited FY16 numbers.

Footer Text Date 20
Section V: Additional CTTS Information

CTTS Map
21
l 't -I 'I
I
I I
I I
I I
I ~.
I Spicewood I
/
I I
I
/'', ......... ..... ' ...
I ... I I
I I
... .. ...... Wimberley
.........
,, .!""~~ Leander
I ~ , ... 9
... I \
l
Lago Vista ~
~
Lakeway
®
@
'~ 9 Lil (!3 ' @)
'
@)
~
tml
,M'ustang Ridge
I /
Hutto
9 Manor
® /
'
I /
I
/ I
I
... ... ... ...

Toll Rates per Mile
22
January 1, 2015 January 1, 2016 January 1, 2015 January 1, 2016
SH 130 49.0 $7.00 $7.00 $0.14 $0.14
SH 45N 12.8 $2.12 $2.12 $0.17 $0.17
SH 45SE 7.0 $1.04 $1.04 $0.15 $0.15
Loop 1 4.0 $1.06 $1.06 $0.27 $0.27
Full Length Toll Rates Toll Rates per Mile
Roadway Miles
Annual Toll Rates
The rates shown are for ETC transactions for two-axle vehicles (“Auto”). The full length Toll Rates include mainline plaza rates
multiplied by the number of mainline tolling points for each roadway and exclude entrance and exit ramp charges. There was
no increase in Toll Rates for January 2016.

Data Tables - Transactions
23
CTTS Transactions
82%
0.52
1.35
Current Transactions Current -vs- Projected Current -vs- Prior Year
FY 2016 ETC PBM
Total
Transactions
Total Projected
Transactions
Total Variance
$
Total
Variance %
Prior Year Total
Transactions
Total Variance
$
Total
Variance %
September 7,454,613 3,740,433 11,195,046 10,011,500 1,183,546 12% 9,646,649 1,548,397 16%
October 7,740,998 3,909,294 11,650,292 10,891,100 759,192 7% 10,512,275 1,138,017 11%
November 7,229,380 3,698,334 10,927,714 10,445,400 482,314 5% 9,644,466 1,283,248 13%
December 7,336,700 3,895,135 11,231,835 10,169,300 1,062,535 10% 9,877,355 1,354,480 14%
January 7,083,534 3,574,168 10,657,702 9,572,600 1,085,102 11% 9,182,045 1,475,657 16%
February 7,366,335 3,749,953 11,116,288 9,419,500 1,696,788 18% 9,008,894 2,107,394 23%
March 8,181,743 4,461,645 12,643,388 11,083,500 1,559,888 14% 10,694,942 1,948,446 18%
April 8,001,970 4,200,239 12,202,209 11,184,600 1,017,609 9% 10,967,043 1,235,166 11%
May 8,188,601 4,354,821 12,543,422 11,378,600 1,164,822 10% 10,867,386 1,676,036 15%
June 8,206,781 4,509,327 12,716,108 11,288,700 1,427,408 13% 11,188,868 1,527,240 14%
July 7,981,797 4,460,744 12,442,541 11,484,100 958,441 8% 11,554,580 887,961 8%
August 7,756,358 4,890,988 12,647,346 11,636,400 1,010,946 9% 11,361,172 1,286,174 11%
TOTAL 92,528,810 49,445,081 141,973,891 128,565,300 13,408,591 10% 124,505,675 17,468,216 14%

Data Tables - Transactions
24
SH 130 Transactions
82%
0.52
1.35
Current Transactions Current -vs- Projected Current -vs- Prior Year
FY 2016 ETC PBM
Total
Transactions
Total Projected
Transactions
Total Variance
$
Total
Variance %
Prior Year Total
Transactions
Total Variance
$
Total
Variance %
September 3,145,933 1,911,685 5,057,618 4,079,600 978,018 24% 4,120,743 936,875 23%
October 3,281,477 2,002,920 5,284,397 4,478,800 805,597 18% 4,538,141 746,256 16%
November 3,073,403 1,903,751 4,977,154 4,519,700 457,454 10% 4,299,049 678,105 16%
December 3,026,972 1,946,861 4,973,833 4,222,900 750,933 18% 4,248,358 725,475 17%
January 2,854,616 1,739,085 4,593,701 3,831,600 762,101 20% 3,835,395 758,306 20%
February 3,072,037 1,868,834 4,940,871 3,868,500 1,072,371 28% 3,846,224 1,094,647 28%
March 3,565,625 2,344,925 5,910,550 4,821,500 1,089,050 23% 4,796,322 1,114,228 23%
April 3,454,829 2,165,889 5,620,718 4,804,700 816,018 17% 4,855,918 764,800 16%
May 3,551,941 2,263,348 5,815,289 4,879,300 935,989 19% 4,800,725 1,014,564 21%
June 3,586,239 2,372,685 5,958,924 4,964,800 994,124 20% 5,046,303 912,621 18%
July 3,506,024 2,360,969 5,866,993 5,078,500 788,493 16% 5,287,629 579,364 11%
August 3,290,395 2,532,010 5,822,405 5,061,200 761,205 15% 5,110,909 711,496 14%
TOTAL 39,409,491 25,412,962 64,822,453 54,611,100 10,211,353 19% 54,785,716 10,036,737 18%

Data Tables - Transactions
25
SH 45N Transactions
82%
0.52
1.35
Current Transactions Current -vs- Projected Current -vs- Prior Year
FY 2016 ETC PBM
Total
Transactions
Total Projected
Transactions
Total Variance
$
Total
Variance %
Prior Year Total
Transactions
Total Variance
$
Total
Variance %
September 2,679,360 1,104,429 3,783,789 3,551,500 232,289 7% 3,393,120 390,669 12%
October 2,768,667 1,150,599 3,919,266 3,833,400 85,866 2% 3,654,959 264,307 7%
November 2,574,146 1,085,395 3,659,541 3,535,000 124,541 4% 3,259,662 399,879 12%
December 2,671,946 1,186,238 3,858,184 3,572,000 286,184 8% 3,454,315 403,869 12%
January 2,629,119 1,119,866 3,748,985 3,440,300 308,685 9% 3,278,894 470,091 14%
February 2,661,999 1,139,965 3,801,964 3,315,300 486,664 15% 3,154,511 647,453 21%
March 2,855,579 1,268,178 4,123,757 3,725,800 397,957 11% 3,593,014 530,743 15%
April 2,833,292 1,227,758 4,061,050 3,827,100 233,950 6% 3,752,554 308,496 8%
May 2,892,232 1,263,009 4,155,241 3,900,700 254,541 7% 3,728,699 426,542 11%
June 2,861,995 1,272,911 4,134,906 3,777,700 357,206 9% 3,761,674 373,232 10%
July 2,771,582 1,246,831 4,018,413 3,808,500 209,913 6% 3,814,861 203,552 5%
August 2,775,610 1,406,766 4,182,376 3,938,700 243,676 6% 3,839,806 342,570 9%
TOTAL 32,975,527 14,471,945 47,447,472 44,226,000 3,221,472 7% 42,686,069 4,761,403 11%

Data Tables - Transactions
26
SH 45SE Transactions
82%
0.52
1.35
Current Transactions Current -vs- Projected Current -vs- Prior Year
FY 2016 ETC PBM
Total
Transactions
Total Projected
Transactions
Total Variance
$
Total
Variance %
Prior Year Total
Transactions
Total Variance
$
Total
Variance %
September 302,762 198,562 501,324 432,300 69,024 16% 419,357 81,967 20%
October 320,521 214,146 534,667 470,700 63,967 14% 469,124 65,543 14%
November 308,434 202,166 510,600 461,300 49,300 11% 444,746 65,854 15%
December 291,821 198,135 489,956 418,000 71,956 17% 424,100 65,856 16%
January 273,191 176,505 449,696 384,200 65,496 17% 382,164 67,532 18%
February 298,527 194,295 492,822 396,200 96,622 24% 393,167 99,655 25%
March 347,611 243,118 590,729 497,700 93,029 19% 488,699 102,030 21%
April 330,211 227,609 557,820 477,800 80,020 17% 489,623 68,197 14%
May 339,781 236,841 576,622 497,800 78,822 16% 483,663 92,959 19%
June 359,103 258,324 617,427 502,400 115,027 23% 506,684 110,743 22%
July 343,367 254,780 598,147 519,000 79,147 15% 545,266 52,881 10%
August 319,069 273,876 592,945 513,600 79,345 15% 519,271 73,674 14%
TOTAL 3,834,398 2,678,357 6,512,755 5,571,000 941,755 17% 5,565,864 946,891 17%

Data Tables - Transactions
27
Loop 1 Transactions
82%
0.52
1.35
Current Transactions Current -vs- Projected Current -vs- Prior Year
FY 2016 ETC PBM
Total
Transactions
Total Projected
Transactions
Total Variance
$
Total
Variance %
Prior Year Total
Transactions
Total Variance
$
Total
Variance %
September 1,326,558 525,757 1,852,315 1,948,100 (95,785) -5% 1,713,429 138,886 8%
October 1,370,333 541,629 1,911,962 2,108,200 (196,238) -9% 1,850,051 61,911 3%
November 1,273,397 507,022 1,780,419 1,929,400 (148,981) -8% 1,641,009 139,410 8%
December 1,345,961 563,901 1,909,862 1,956,400 (46,538) -2% 1,750,582 159,280 9%
January 1,326,608 538,712 1,865,320 1,916,500 (51,180) -3% 1,685,592 179,728 11%
February 1,333,772 546,859 1,880,631 1,839,500 41,131 2% 1,614,992 265,639 16%
March 1,412,928 605,424 2,018,352 2,038,500 (20,148) -1% 1,816,907 201,445 11%
April 1,383,638 578,983 1,962,621 2,075,000 (112,379) -5% 1,868,948 93,673 5%
May 1,404,647 591,623 1,996,270 2,100,800 (104,530) -5% 1,854,299 141,971 8%
June 1,399,444 605,407 2,004,851 2,043,800 (38,949) -2% 1,874,207 130,644 7%
July 1,360,824 598,164 1,958,988 2,078,100 (119,112) -6% 1,906,824 52,164 3%
August 1,371,284 678,336 2,049,620 2,122,900 (73,280) -3% 1,891,186 158,434 8%
TOTAL 16,309,394 6,881,817 23,191,211 24,157,200 (965,989) -4% 21,468,026 1,723,185 8%

Data Tables - Revenue
28
CTTS Revenue
75%
0.52
1.35
Current -vs- Projected Current -vs- Prior Year Current Transactions
FY 2016
Current Toll
Revenue
Total Projected
Toll Revenue
Total
Variance
$
Total
Variance
%
Prior Year Total
Toll Revenue
Total
Variance
$
Total
Variance
%
September 13,839,858$ 11,274,700$ 2,565,158$ 23% 9,921,515$ 3,918,343$ 39%
October 13,582,170$ 11,868,000$ 1,714,170$ 14% 10,382,211$ 3,199,959$ 31%
November 13,627,421$ 11,826,400$ 1,801,021$ 15% 11,519,300$ 2,108,121$ 18%
December 13,506,037$ 11,449,700$ 2,056,337$ 18% 12,152,439$ 1,353,598$ 11%
January 13,534,141$ 12,296,000$ 1,238,141$ 10% 12,415,756$ 1,118,385$ 9%
February 13,625,380$ 11,830,600$ 1,794,780$ 15% 12,247,790$ 1,377,590$ 11%
March 15,161,908$ 13,890,600$ 1,271,308$ 9% 14,005,840$ 1,156,068$ 8%
April 13,970,116$ 13,522,800$ 447,316$ 3% 13,310,304$ 659,812$ 5%
May 15,004,312$ 14,046,200$ 958,112$ 7% 13,803,862$ 1,200,450$ 9%
June 14,554,820$ 14,545,500$ 9,320$ 0% 13,657,325$ 897,495$ 7%
July 14,368,606$ 13,262,400$ 1,106,206$ 8% 13,981,577$ 387,029$ 3%
August 15,881,777$ 13,087,000$ 2,794,777$ 21% 14,232,157$ 1,649,620$ 12%
TOTAL $ 170,656,545 $ 152,899,900 $ 17,756,645 12% $ 151,630,076 $ 19,026,469 13%

Data Tables - Revenue
29
SH 130 Revenue
75%
0.52
1.35
Current -vs- Projected Current -vs- Prior Year Current Transactions
FY 2016
Current Toll
Revenue
Total Projected
Toll Revenue
Total
Variance
$
Total
Variance
%
Prior Year Total
Toll Revenue
Total
Variance
$
Total
Variance
%
September 8,097,183$ 5,772,400$ 2,324,783$ 40% 5,319,238$ 2,777,945$ 52%
October 7,869,226$ 5,992,800$ 1,876,426$ 31% 5,491,147$ 2,378,079$ 43%
November 7,933,461$ 6,215,700$ 1,717,761$ 28% 6,431,037$ 1,502,424$ 23%
December 7,745,788$ 5,655,600$ 2,090,188$ 37% 6,786,934$ 958,854$ 14%
January 7,683,809$ 6,175,900$ 1,507,909$ 24% 7,061,447$ 622,362$ 9%
February 7,831,902$ 5,979,700$ 1,852,202$ 31% 7,076,976$ 754,926$ 11%
March 8,843,610$ 7,209,800$ 1,633,810$ 23% 8,091,300$ 752,310$ 9%
April 8,116,077$ 7,007,000$ 1,109,077$ 16% 7,540,480$ 575,597$ 8%
May 8,807,183$ 7,379,700$ 1,427,483$ 19% 7,966,476$ 840,707$ 11%
June 8,538,530$ 7,709,700$ 828,830$ 11% 7,925,397$ 613,133$ 8%
July 8,507,069$ 6,998,000$ 1,509,069$ 22% 8,161,981$ 345,088$ 4%
August 9,329,575$ 6,833,600$ 2,495,975$ 37% 8,342,874$ 986,701$ 12%
TOTAL $ 99,303,415 $ 78,929,900 $ 20,373,515 26% $ 86,195,287 $ 13,108,128 15%

Data Tables - Revenue
30
SH 45N Revenue
75%
0.52
1.35
Current -vs- Projected Current -vs- Prior Year Current Transactions
FY 2016
Current Toll
Revenue
Total Projected
Toll Revenue
Total
Variance
$
Total
Variance
%
Prior Year Total
Toll Revenue
Total
Variance
$
Total
Variance
%
September 3,434,997$ 3,245,700$ 189,297$ 6% 2,790,240$ 644,757$ 23%
October 3,411,366$ 3,458,800$ (47,434)$ -1% 2,962,245$ 449,121$ 15%
November 3,398,713$ 3,276,700$ 122,013$ 4% 3,032,759$ 365,954$ 12%
December 3,445,240$ 3,443,800$ 1,440$ 0% 3,193,417$ 251,823$ 8%
January 3,496,734$ 3,593,500$ (96,766)$ -3% 3,157,924$ 338,810$ 11%
February 3,463,780$ 3,445,700$ 18,080$ 1% 3,045,692$ 418,088$ 14%
March 3,788,198$ 3,940,900$ (152,702)$ -4% 3,502,023$ 286,175$ 8%
April 3,542,238$ 3,819,800$ (277,562)$ -7% 3,447,017$ 95,221$ 3%
May 3,719,576$ 3,962,200$ (242,624)$ -6% 3,476,040$ 243,536$ 7%
June 3,618,504$ 4,057,200$ (438,696)$ -11% 3,400,360$ 218,144$ 6%
July 3,501,474$ 3,723,500$ (222,026)$ -6% 3,454,277$ 47,197$ 1%
August 3,909,869$ 3,732,300$ 177,569$ 5% 3,495,080$ 414,789$ 12%
TOTAL $ 42,730,689 $ 43,700,100 $ (969,411) -2% $ 38,957,074 $ 3,773,615 10%
Data Tables - Revenue
31
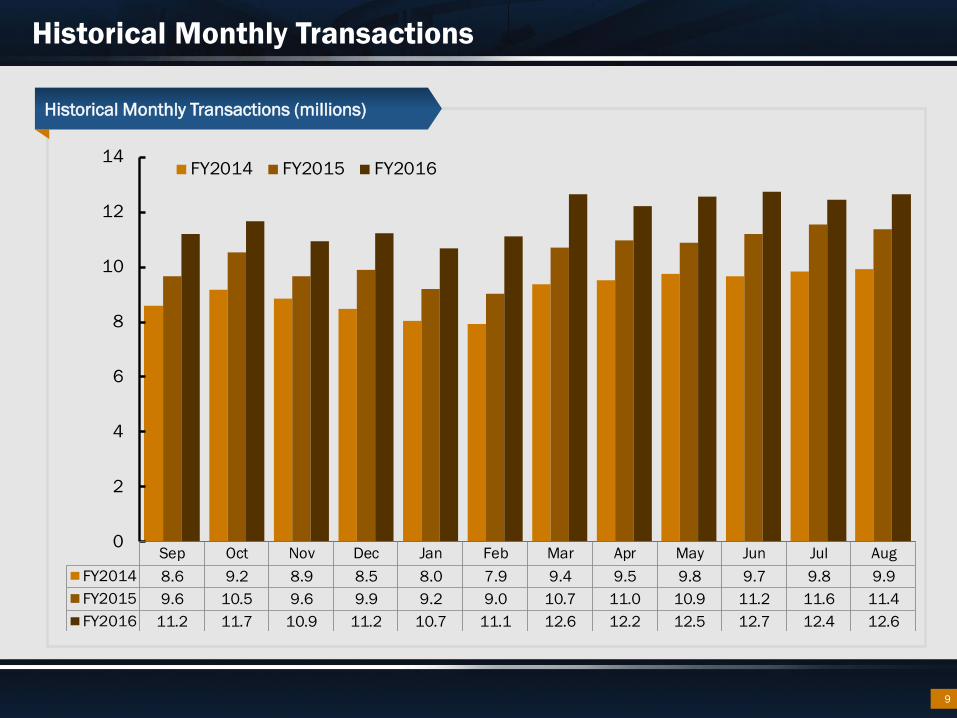
SH 45SE Revenue
75%
0.52
1.35
Current -vs- Projected Current -vs- Prior Year Current Transactions
FY 2016
Current Toll
Revenue
Total Projected
Toll Revenue
Total
Variance
$
Total
Variance
%
Prior Year Total
Toll Revenue
Total
Variance
$
Total
Variance
%
September 556,277$ 411,000$ 145,277$ 35% 356,387$ 199,890$ 56%
October 550,070$ 445,900$ 104,170$ 23% 382,848$ 167,222$ 44%
November 564,761$ 473,100$ 91,661$ 19% 457,128$ 107,633$ 24%
December 533,964$ 453,700$ 80,264$ 18% 481,538$ 52,426$ 11%
January 538,038$ 458,300$ 79,738$ 17% 499,965$ 38,073$ 8%
February 539,434$ 439,200$ 100,234$ 23% 505,565$ 33,869$ 7%
March 616,019$ 517,800$ 98,219$ 19% 560,650$ 55,369$ 10%
April 544,230$ 549,500$ (5,270)$ -1% 514,892$ 29,338$ 6%
May 603,090$ 501,200$ 101,890$ 20% 555,729$ 47,361$ 9%
June 593,905$ 513,600$ 80,305$ 16% 550,526$ 43,379$ 8%
July 600,432$ 460,900$ 139,532$ 30% 568,393$ 32,039$ 6%
August 656,640$ 450,800$ 205,840$ 46% 585,460$ 71,180$ 12%
TOTAL $ 6,896,860 $ 5,675,000 $ 1,221,860 22% $ 6,019,081 $ 877,779 15%

Data Tables - Revenue
32
Loop 1 Revenue
75%
0.52
1.35
Current -vs- Projected Current -vs- Prior Year Current Transactions
FY 2016
Current Toll
Revenue
Total Projected
Toll Revenue
Total
Variance
$
Total
Variance
%
Prior Year Total
Toll Revenue
Total
Variance
$
Total
Variance
%
September 1,751,400$ 1,845,600$ (94,200)$ -5% 1,455,650$ 295,750$ 20%
October 1,751,508$ 1,970,500$ (218,992)$ -11% 1,545,971$ 205,537$ 13%
November 1,730,485$ 1,860,900$ (130,415)$ -7% 1,598,376$ 132,109$ 8%
December 1,781,045$ 1,896,600$ (115,555)$ -6% 1,690,550$ 90,495$ 5%
January 1,815,560$ 2,068,300$ (252,740)$ -12% 1,696,420$ 119,140$ 7%
February 1,790,264$ 1,966,000$ (175,736)$ -9% 1,619,557$ 170,707$ 11%
March 1,914,082$ 2,222,100$ (308,018)$ -14% 1,851,867$ 62,215$ 3%
April 1,767,571$ 2,146,500$ (378,929)$ -18% 1,807,915$ (40,344)$ -2%
May 1,874,462$ 2,203,100$ (328,638)$ -15% 1,805,617$ 68,845$ 4%
June 1,803,881$ 2,265,000$ (461,119)$ -20% 1,781,042$ 22,839$ 1%
July 1,759,631$ 2,080,000$ (320,369)$ -15% 1,796,926$ (37,295)$ -2%
August 1,985,692$ 2,070,300$ (84,608)$ -4% 1,808,743$ 176,949$ 10%
TOTAL $ 21,725,581 $ 24,594,900 $ (2,869,319) -12% $ 20,458,634 $ 1,266,947 6%

Additional Disclosures
33
During the quarter ended May 2016, the Toll Operations Division of TxDOT (“TOD”) has continued to work on
resolving all posting, processing, billing and escalation issues in connection with the transition. In furtherance
of achieving final acceptance of the Xerox system, TxDOT has implemented action to dismiss certain
problematic toll and fee transactions totaling approximately $20,380,000 of tolls and approximately
$4,430,000 of fees relating to CTTS. Such dismissals will enable toll invoices and violation notices to resume
typical cycles. TxDOT anticipates there will be future additional tolls and fees that could also be deemed
uncollectable and subject to dismissal in accordance with a comprehensive receivable dismissal policy under
consideration by TxDOT management. Such dismissals may adversely impact the PBM collection assumptions
previously assumed by TxDOT.
The TxDOT Office of Internal Audit in August 2015 issued an Internal Audit Report, Toll Operations Contract
Management (“Audit Report”), which is available on the TxDOT website at txdot.gov – Audit Reports Database
– 2015 Toll Operations Contract Management. The report covers contract management activity and oversight
related to the TxTag billing and customer service processes from June 28, 2013 to February 28, 2015 (notice
to proceed on the conversion process from the previous toll operations vendor to Xerox occurred July 2013).
Based on the audit scope areas reviewed, the auditors determined at that time, that the overall assessment
ratings were unsatisfactory regarding contract management/oversight and performance measure
achievement relating to the Xerox contract. According to the internal auditors, TOD contract management and
oversight activities during the conversion to the Xerox system were not fully designed, documented and
executed to provide reasonable assurance that 1) implementation of the customer service center system was
completed timely and 2) implementation, billing and operational issues identified during the conversion
process were prioritized and addressed to achieve effective resolution.

Additional Disclosures (cont.)
34
TxDOT management concurred with the audit findings and prepared an action plan to address the
deficiencies. According to TxDOT management, as of May 2016, TOD has successfully implemented the action
plan and addressed substantially all of the deficiencies indicated in the Audit Report with the major
deficiencies still pending being to (1) achieve final acceptance of the Xerox system and (2) fully resolve certain
contract performance issues by Xerox. The TxDOT Office of Internal Audit is expected to release by December
2016 an update of their Audit Report noting the progress of TOD in implementing the action plan and reaching
final acceptance of the Xerox system. Such final acceptance is currently expected to occur by December 2016.

Disclaimer
35
Information in this report regarding the Central Texas Turnpike System has been compiled and provided by
TxDOT’s records and other sources which are believed by TxDOT to be reliable and is provided as a voluntary
disclosure. This report contains information prescribed by Rule 15c2-12 of the Securities and Exchange
Commission. TxDOT does not make any warranty concerning the usefulness of such information to a decision to
invest in, hold, or sell bonds, notes or other obligations payable, in whole or in part, from the sources pledged to
the payment of the Issues.