Embed Size (px)
Citation preview
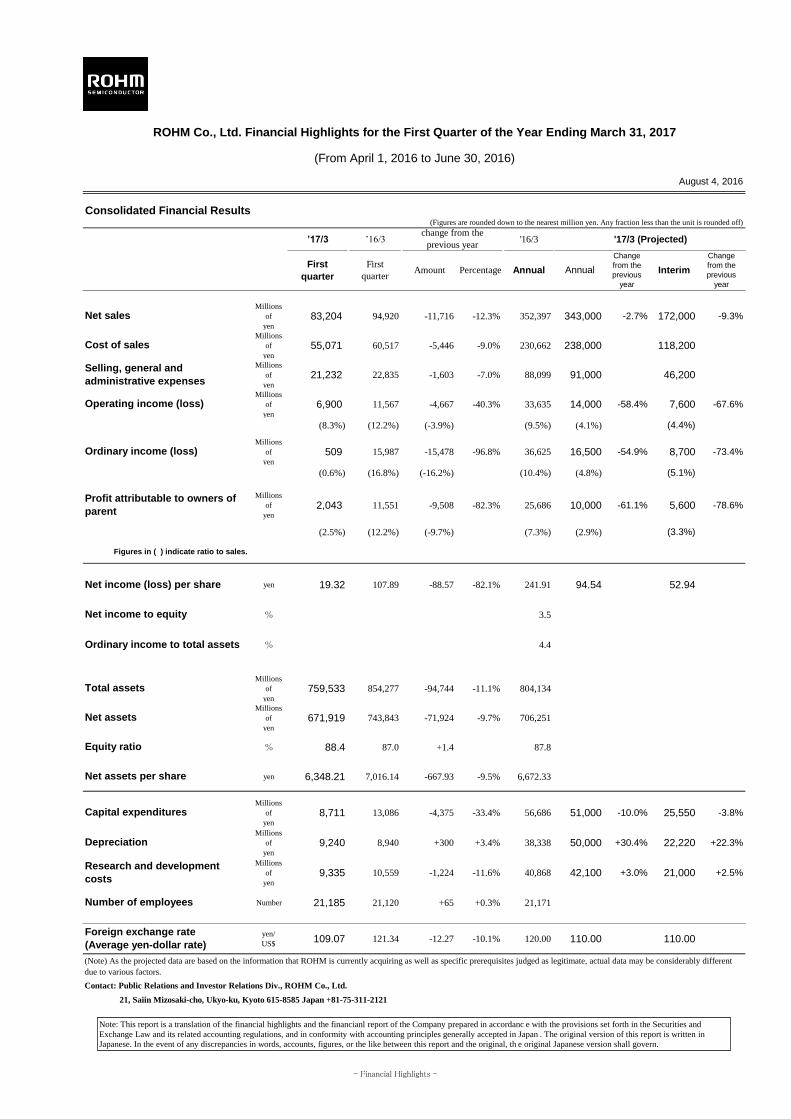
ROHM Co., Ltd. Financial Highlights for the First Quarter of the Year Ending March 31, 2017
(From April 1, 2016 to June 30, 2016)
August 4, 2016
Consolidated Financial Results(Figures are rounded down to the nearest million yen. Any fraction less than the unit is rounded off)
’17/3 ’16/3 '16/3 '17/3 (Projected)
Millions
of
yen
83,204 94,920 -11,716 -12.3% 352,397 343,000 -2.7% 172,000 -9.3%
Millions
of
yen
55,071 60,517 -5,446 -9.0% 230,662 238,000 118,200
Millions
of
yen
21,232 22,835 -1,603 -7.0% 88,099 91,000 46,200
Millions
of
yen
6,900 11,567 -4,667 -40.3% 33,635 14,000 -58.4% 7,600 -67.6%
(8.3%) (12.2%) (-3.9%) (9.5%) (4.1%) (4.4%)
Millions
of
yen
509 15,987 -15,478 -96.8% 36,625 16,500 -54.9% 8,700 -73.4%
(0.6%) (16.8%) (-16.2%) (10.4%) (4.8%) (5.1%)
Millions
of
yen
2,043 11,551 -9,508 -82.3% 25,686 10,000 -61.1% 5,600 -78.6%
(2.5%) (12.2%) (-9.7%) (7.3%) (2.9%) (3.3%)
yen 19.32 107.89 -88.57 -82.1% 241.91 94.54 52.94
% 3.5
% 4.4
Millions
of
yen
759,533 854,277 -94,744 -11.1% 804,134
Millions
of
yen
671,919 743,843 -71,924 -9.7% 706,251
% 88.4 87.0 +1.4 87.8
yen 6,348.21 7,016.14 -667.93 -9.5% 6,672.33
Millions
of
yen
8,711 13,086 -4,375 -33.4% 56,686 51,000 -10.0% 25,550 -3.8%
Millions
of
yen
9,240 8,940 +300 +3.4% 38,338 50,000 +30.4% 22,220 +22.3%
Millions
of
yen
9,335 10,559 -1,224 -11.6% 40,868 42,100 +3.0% 21,000 +2.5%
Number 21,185 21,120 +65 +0.3% 21,171
yen/
US$109.07 121.34 -12.27 -10.1% 120.00 110.00 110.00
Contact: Public Relations and Investor Relations Div., ROHM Co., Ltd.
ローム株式会社 広報IR室 21, Saiin Mizosaki-cho, Ukyo-ku, Kyoto 615-8585 Japan +81-75-311-2121
change from the
previous year
Amount Percentage Annual Annual
Net assets
Change
from the
previous
year
Net sales
Cost of sales
Selling, general and
administrative expenses
Operating income (loss)
Ordinary income (loss)
Change
from the
previous
year
Profit attributable to owners of
parent
Net income (loss) per share
Net income to equity
Ordinary income to total assets
Total assets
Equity ratio
Net assets per share
Capital expenditures
Depreciation
Research and development
costs
Number of employees
Foreign exchange rate
(Average yen-dollar rate)
(Note) As the projected data are based on the information that ROHM is currently acquiring as well as specific prerequisites judged as legitimate, actual data may be considerably different
due to various factors.
First
quarter
First
quarterInterim
Figures in ( ) indicate ratio to sales.
Note: This report is a translation of the financial highlights and the financianl report of the Company prepared in accordanc e with the provisions set forth in the Securities and
Exchange Law and its related accounting regulations, and in conformity with accounting principles generally accepted in Japan . The original version of this report is written in
Japanese. In the event of any discrepancies in words, accounts, figures, or the like between this report and the original, th e original Japanese version shall govern.
- Financial Highlights -
ROHM CO., LTD. (6963) Financial Report for the First Quarter of the Year Ending March 31, 2017
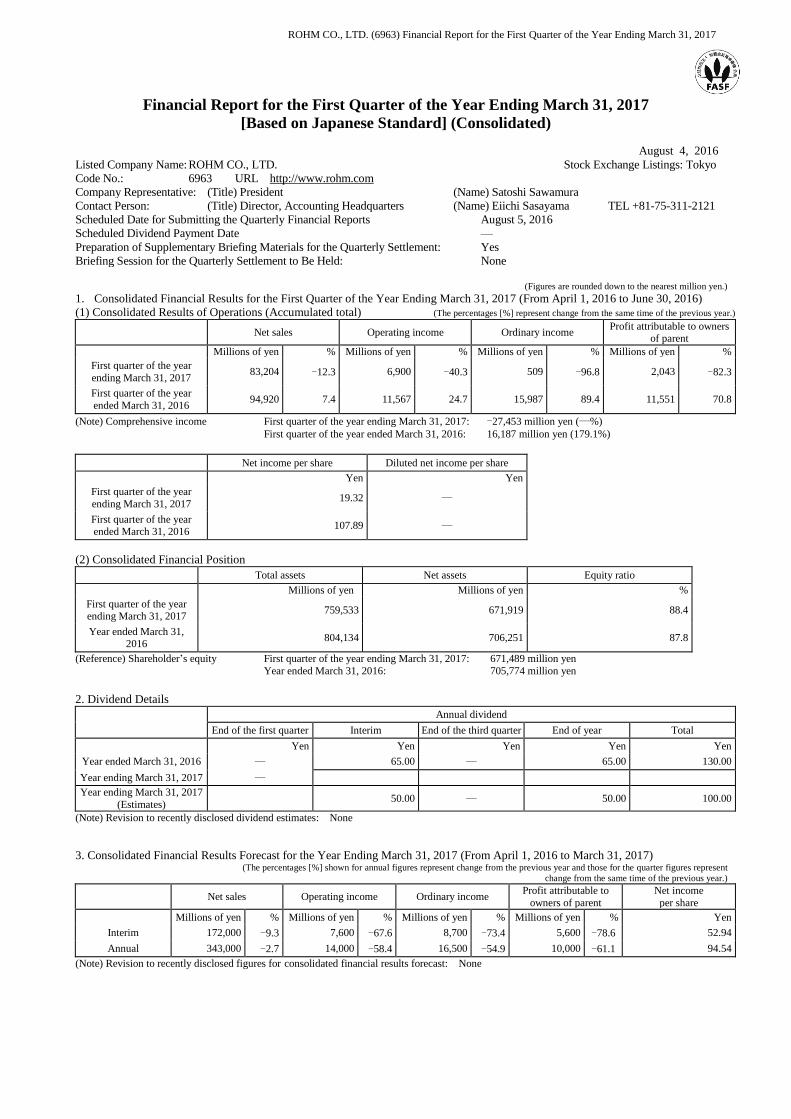
Financial Report for the First Quarter of the Year Ending March 31, 2017
[Based on Japanese Standard] (Consolidated)
August 4, 2016
Listed Company Name: ROHM CO., LTD. Stock Exchange Listings: Tokyo
Code No.: 6963 URL http://www.rohm.com
Company Representative: (Title) President (Name) Satoshi Sawamura
Contact Person: (Title) Director, Accounting Headquarters (Name) Eiichi Sasayama TEL +81-75-311-2121
Scheduled Date for Submitting the Quarterly Financial Reports August 5, 2016
Scheduled Dividend Payment Date —
Preparation of Supplementary Briefing Materials for the Quarterly Settlement: Yes
Briefing Session for the Quarterly Settlement to Be Held: None
(Figures are rounded down to the nearest million yen.)
1. Consolidated Financial Results for the First Quarter of the Year Ending March 31, 2017 (From April 1, 2016 to June 30, 2016)
(1) Consolidated Results of Operations (Accumulated total) (The percentages [%] represent change from the same time of the previous year.)
Net sales Operating income Ordinary income Profit attributable to owners
of parent Millions of yen % Millions of yen % Millions of yen % Millions of yen %
First quarter of the year
ending March 31, 2017 83,204 -12.3 6,900 -40.3 509 -96.8 2,043 -82.3
First quarter of the year
ended March 31, 2016 94,920 7.4 11,567 24.7 15,987 89.4 11,551 70.8
(Note) Comprehensive income First quarter of the year ending March 31, 2017: -27,453 million yen (―%)
First quarter of the year ended March 31, 2016: 16,187 million yen (179.1%)
Net income per share Diluted net income per share
Yen Yen
First quarter of the year
ending March 31, 2017 19.32 ―
First quarter of the year ended March 31, 2016
107.89 ―
(2) Consolidated Financial Position
Total assets Net assets Equity ratio
Millions of yen Millions of yen %
First quarter of the year ending March 31, 2017
759,533 671,919 88.4
Year ended March 31, 2016
804,134 706,251 87.8
(Reference) Shareholder’s equity First quarter of the year ending March 31, 2017: 671,489 million yen
Year ended March 31, 2016: 705,774 million yen
2. Dividend Details
Annual dividend
End of the first quarter Interim End of the third quarter End of year Total
Yen Yen Yen Yen Yen
Year ended March 31, 2016 ― 65.00 ― 65.00 130.00
Year ending March 31, 2017 ―
Year ending March 31, 2017
(Estimates) 50.00 ― 50.00 100.00
(Note) Revision to recently disclosed dividend estimates: None
3. Consolidated Financial Results Forecast for the Year Ending March 31, 2017 (From April 1, 2016 to March 31, 2017) (The percentages [%] shown for annual figures represent change from the previous year and those for the quarter figures represent
change from the same time of the previous year.)
Net sales Operating income Ordinary income Profit attributable to
owners of parent
Net income
per share
Millions of yen % Millions of yen % Millions of yen % Millions of yen % Yen
Interim 172,000 -9.3 7,600 -67.6 8,700 -73.4 5,600 -78.6 52.94
Annual 343,000 -2.7 14,000 -58.4 16,500 -54.9 10,000 -61.1 94.54
(Note) Revision to recently disclosed figures for consolidated financial results forecast: None
ROHM CO., LTD. (6963) Financial Report for the First Quarter of the Year Ending March 31, 2017
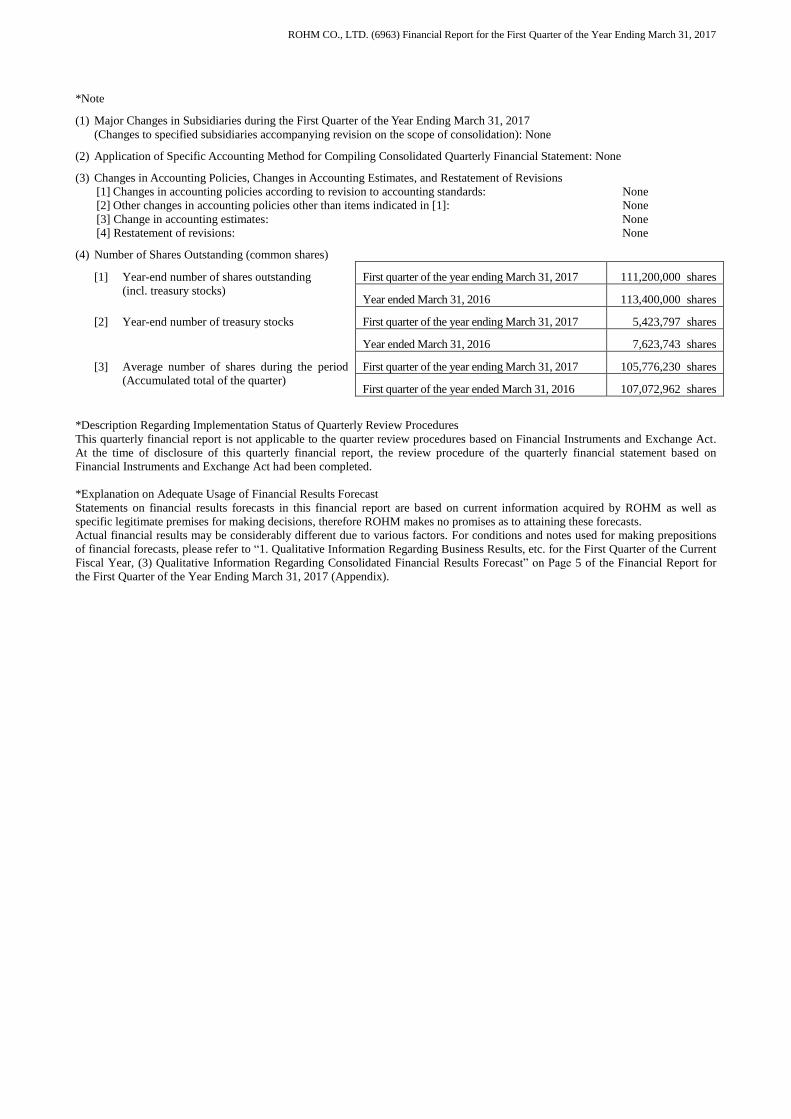
*Note
(1) Major Changes in Subsidiaries during the First Quarter of the Year Ending March 31, 2017
(Changes to specified subsidiaries accompanying revision on the scope of consolidation): None
(2) Application of Specific Accounting Method for Compiling Consolidated Quarterly Financial Statement: None
(3) Changes in Accounting Policies, Changes in Accounting Estimates, and Restatement of Revisions
[1] Changes in accounting policies according to revision to accounting standards: None
[2] Other changes in accounting policies other than items indicated in [1]: None
[3] Change in accounting estimates: None
[4] Restatement of revisions: None
(4) Number of Shares Outstanding (common shares)
[1] Year-end number of shares outstanding
(incl. treasury stocks)
First quarter of the year ending March 31, 2017 111,200,000 shares
Year ended March 31, 2016 113,400,000 shares
[2] Year-end number of treasury stocks First quarter of the year ending March 31, 2017 5,423,797 shares
Year ended March 31, 2016 7,623,743 shares
[3] Average number of shares during the period
(Accumulated total of the quarter)
First quarter of the year ending March 31, 2017 105,776,230 shares
First quarter of the year ended March 31, 2016 107,072,962 shares
*Description Regarding Implementation Status of Quarterly Review Procedures
This quarterly financial report is not applicable to the quarter review procedures based on Financial Instruments and Exchange Act.
At the time of disclosure of this quarterly financial report, the review procedure of the quarterly financial statement based on
Financial Instruments and Exchange Act had been completed.
*Explanation on Adequate Usage of Financial Results Forecast
Statements on financial results forecasts in this financial report are based on current information acquired by ROHM as well as
specific legitimate premises for making decisions, therefore ROHM makes no promises as to attaining these forecasts.
Actual financial results may be considerably different due to various factors. For conditions and notes used for making prepositions
of financial forecasts, please refer to “1. Qualitative Information Regarding Business Results, etc. for the First Quarter of the Current
Fiscal Year, (3) Qualitative Information Regarding Consolidated Financial Results Forecast” on Page 5 of the Financial Report for
the First Quarter of the Year Ending March 31, 2017 (Appendix).
ROHM CO., LTD. (6963) Financial Report for the First Quarter of the Year Ending March 31, 2017
- 1 -
Table of Contents
1. Qualitative Information Regarding Business Results, etc. for the First Quarter of the Current Fiscal Year ......................... 2
(1) Business Results ............................................................................................................................................................. 2
(2) Financial Conditions ....................................................................................................................................................... 4
(3) Qualitative Information Regarding Consolidated Financial Results Forecast ................................................................. 5
2. Items Regarding Summary Information (Note) .................................................................................................................. 5
(1) Major Changes in Subsidiaries During the First Three Months of the Current Fiscal Year ............................................ 5
(2) Application of Specific Accounting Procedure for Compiling Consolidated Quarterly Financial Statement ................. 5
(3) Changes in Accounting Policies, Changes in Accounting Estimates, and Restatement of Revisions.............................. 5
(4) Additional Information.................................................................................................................................................... 5
3. Consolidated Quarterly Financial Statements ....................................................................................................................... 6
(1) Consolidated Quarterly Balance Sheet .......................................................................................................................... 6
(2) Consolidated Quarterly Statement of Income and Consolidated Quarterly Statement of Comprehensive Income ......... 8
(Consolidated quarterly statement of income) .............................................................................................................. 8
(First quarter of the year ending March 31, 2017) ........................................................................................................ 9
(3) Note on Consolidated Quarterly Financial Statement ................................................................................................... 10
(Note on going concern) ............................................................................................................................................... 10
(Note in case of significant change in amount of shareholders’ equity) ........................................................................ 10
(Segment information etc.) ........................................................................................................................................... 10
* Separately attached as supplementary material are “Financial Highlights for the First Quarter of the Year Ending March 31, 2017.”
ROHM CO., LTD. (6963) Financial Report for the First Quarter of the Year Ending March 31, 2017
- 2 -
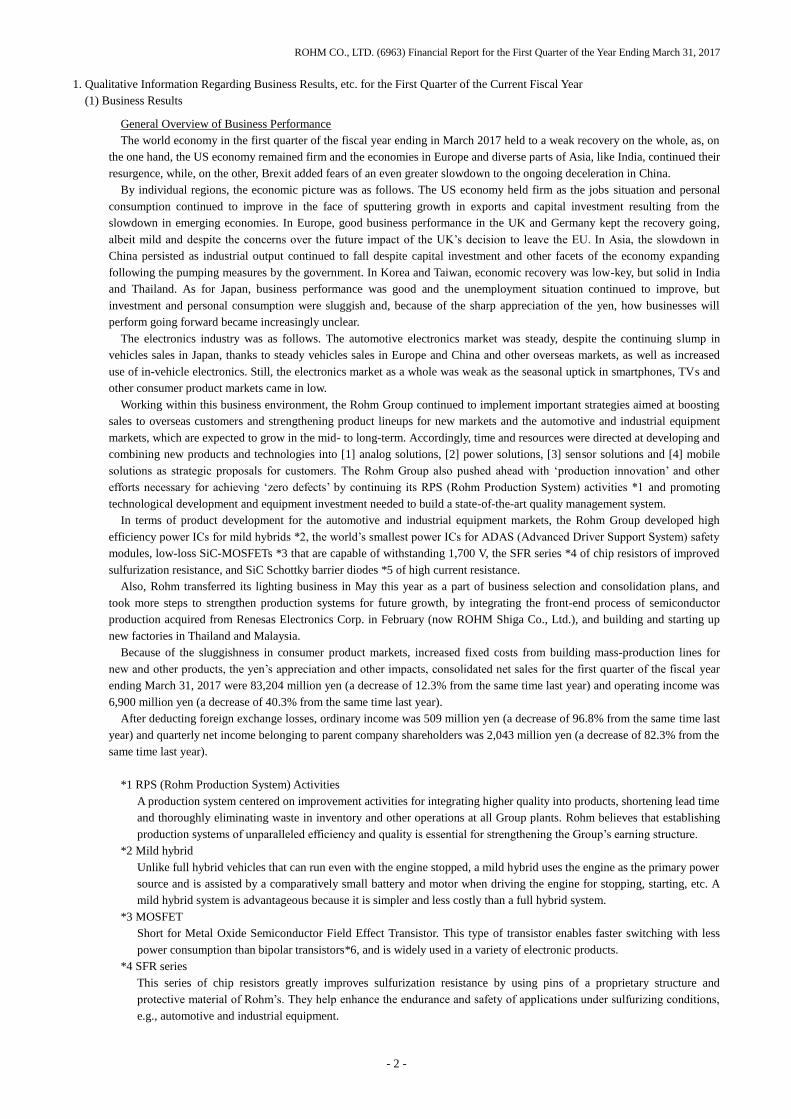
1. Qualitative Information Regarding Business Results, etc. for the First Quarter of the Current Fiscal Year
(1) Business Results
General Overview of Business Performance
The world economy in the first quarter of the fiscal year ending in March 2017 held to a weak recovery on the whole, as, on
the one hand, the US economy remained firm and the economies in Europe and diverse parts of Asia, like India, continued their
resurgence, while, on the other, Brexit added fears of an even greater slowdown to the ongoing deceleration in China.
By individual regions, the economic picture was as follows. The US economy held firm as the jobs situation and personal
consumption continued to improve in the face of sputtering growth in exports and capital investment resulting from the
slowdown in emerging economies. In Europe, good business performance in the UK and Germany kept the recovery going,
albeit mild and despite the concerns over the future impact of the UK’s decision to leave the EU. In Asia, the slowdown in
China persisted as industrial output continued to fall despite capital investment and other facets of the economy expanding
following the pumping measures by the government. In Korea and Taiwan, economic recovery was low-key, but solid in India
and Thailand. As for Japan, business performance was good and the unemployment situation continued to improve, but
investment and personal consumption were sluggish and, because of the sharp appreciation of the yen, how businesses will
perform going forward became increasingly unclear.
The electronics industry was as follows. The automotive electronics market was steady, despite the continuing slump in
vehicles sales in Japan, thanks to steady vehicles sales in Europe and China and other overseas markets, as well as increased
use of in-vehicle electronics. Still, the electronics market as a whole was weak as the seasonal uptick in smartphones, TVs and
other consumer product markets came in low.
Working within this business environment, the Rohm Group continued to implement important strategies aimed at boosting
sales to overseas customers and strengthening product lineups for new markets and the automotive and industrial equipment
markets, which are expected to grow in the mid- to long-term. Accordingly, time and resources were directed at developing and
combining new products and technologies into [1] analog solutions, [2] power solutions, [3] sensor solutions and [4] mobile
solutions as strategic proposals for customers. The Rohm Group also pushed ahead with ‘production innovation’ and other
efforts necessary for achieving ‘zero defects’ by continuing its RPS (Rohm Production System) activities *1 and promoting
technological development and equipment investment needed to build a state-of-the-art quality management system.
In terms of product development for the automotive and industrial equipment markets, the Rohm Group developed high
efficiency power ICs for mild hybrids *2, the world’s smallest power ICs for ADAS (Advanced Driver Support System) safety
modules, low-loss SiC-MOSFETs *3 that are capable of withstanding 1,700 V, the SFR series *4 of chip resistors of improved
sulfurization resistance, and SiC Schottky barrier diodes *5 of high current resistance.
Also, Rohm transferred its lighting business in May this year as a part of business selection and consolidation plans, and
took more steps to strengthen production systems for future growth, by integrating the front-end process of semiconductor
production acquired from Renesas Electronics Corp. in February (now ROHM Shiga Co., Ltd.), and building and starting up
new factories in Thailand and Malaysia.
Because of the sluggishness in consumer product markets, increased fixed costs from building mass-production lines for
new and other products, the yen’s appreciation and other impacts, consolidated net sales for the first quarter of the fiscal year
ending March 31, 2017 were 83,204 million yen (a decrease of 12.3% from the same time last year) and operating income was
6,900 million yen (a decrease of 40.3% from the same time last year).
After deducting foreign exchange losses, ordinary income was 509 million yen (a decrease of 96.8% from the same time last
year) and quarterly net income belonging to parent company shareholders was 2,043 million yen (a decrease of 82.3% from the
same time last year).
*1 RPS (Rohm Production System) Activities
A production system centered on improvement activities for integrating higher quality into products, shortening lead time
and thoroughly eliminating waste in inventory and other operations at all Group plants. Rohm believes that establishing
production systems of unparalleled efficiency and quality is essential for strengthening the Group’s earning structure.
*2 Mild hybrid
Unlike full hybrid vehicles that can run even with the engine stopped, a mild hybrid uses the engine as the primary power
source and is assisted by a comparatively small battery and motor when driving the engine for stopping, starting, etc. A
mild hybrid system is advantageous because it is simpler and less costly than a full hybrid system.
*3 MOSFET
Short for Metal Oxide Semiconductor Field Effect Transistor. This type of transistor enables faster switching with less
power consumption than bipolar transistors*6, and is widely used in a variety of electronic products.
*4 SFR series
This series of chip resistors greatly improves sulfurization resistance by using pins of a proprietary structure and
protective material of Rohm’s. They help enhance the endurance and safety of applications under sulfurizing conditions,
e.g., automotive and industrial equipment.
ROHM CO., LTD. (6963) Financial Report for the First Quarter of the Year Ending March 31, 2017
- 3 -
*5 Schottky barrier diode
A diode that utilizes the characteristics of a Schottky junction formed by contact of metal and a semiconductor. It is
mainly used for switching power supplies and the like as voltage drop in the forward direction is low and switching
speed is fast.
*6 Bipolar transistor
A 3-terminal semiconductor in which N-type semiconductors and P-type semiconductors have a P-N-P or N-P-N junction
structure. Primarily used for current amplification and switching.
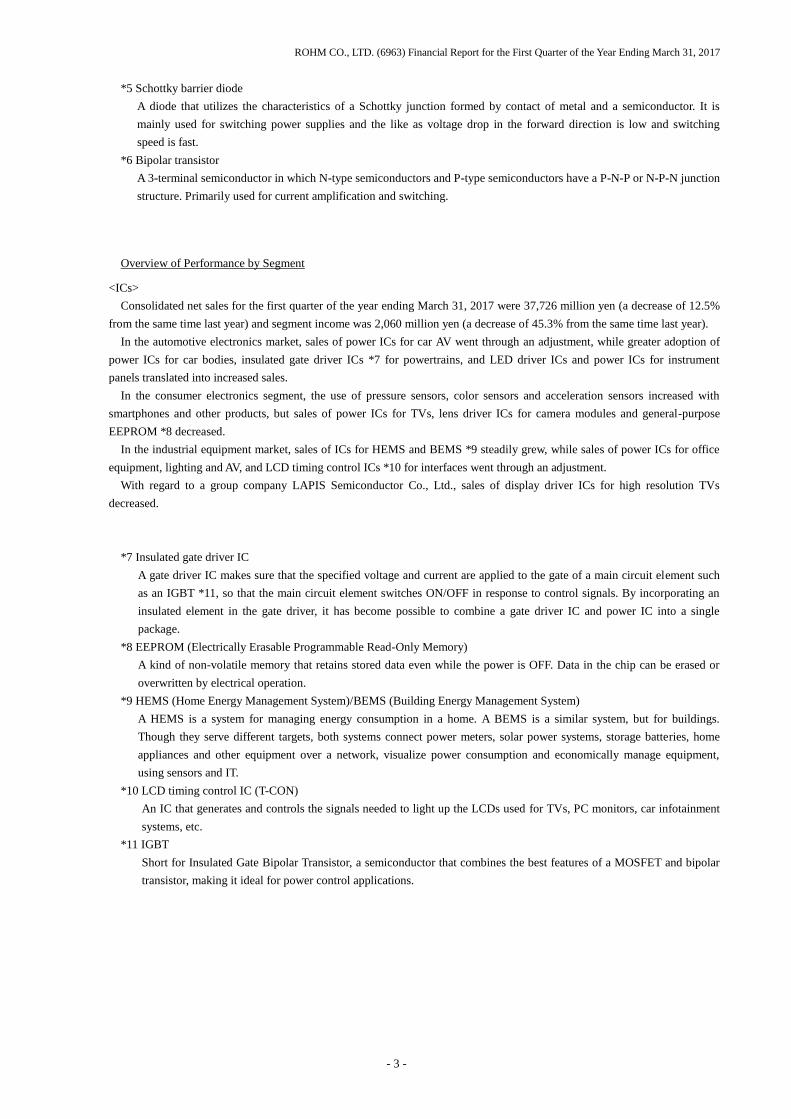
Overview of Performance by Segment
<ICs>
Consolidated net sales for the first quarter of the year ending March 31, 2017 were 37,726 million yen (a decrease of 12.5%
from the same time last year) and segment income was 2,060 million yen (a decrease of 45.3% from the same time last year).
In the automotive electronics market, sales of power ICs for car AV went through an adjustment, while greater adoption of
power ICs for car bodies, insulated gate driver ICs *7 for powertrains, and LED driver ICs and power ICs for instrument
panels translated into increased sales.
In the consumer electronics segment, the use of pressure sensors, color sensors and acceleration sensors increased with
smartphones and other products, but sales of power ICs for TVs, lens driver ICs for camera modules and general-purpose
EEPROM *8 decreased.
In the industrial equipment market, sales of ICs for HEMS and BEMS *9 steadily grew, while sales of power ICs for office
equipment, lighting and AV, and LCD timing control ICs *10 for interfaces went through an adjustment.
With regard to a group company LAPIS Semiconductor Co., Ltd., sales of display driver ICs for high resolution TVs
decreased.
*7 Insulated gate driver IC
A gate driver IC makes sure that the specified voltage and current are applied to the gate of a main circuit element such
as an IGBT *11, so that the main circuit element switches ON/OFF in response to control signals. By incorporating an
insulated element in the gate driver, it has become possible to combine a gate driver IC and power IC into a single
package.
*8 EEPROM (Electrically Erasable Programmable Read-Only Memory)
A kind of non-volatile memory that retains stored data even while the power is OFF. Data in the chip can be erased or
overwritten by electrical operation.
*9 HEMS (Home Energy Management System)/BEMS (Building Energy Management System)
A HEMS is a system for managing energy consumption in a home. A BEMS is a similar system, but for buildings.
Though they serve different targets, both systems connect power meters, solar power systems, storage batteries, home
appliances and other equipment over a network, visualize power consumption and economically manage equipment,
using sensors and IT.
*10 LCD timing control IC (T-CON)
An IC that generates and controls the signals needed to light up the LCDs used for TVs, PC monitors, car infotainment
systems, etc.
*11 IGBT
Short for Insulated Gate Bipolar Transistor, a semiconductor that combines the best features of a MOSFET and bipolar
transistor, making it ideal for power control applications.
ROHM CO., LTD. (6963) Financial Report for the First Quarter of the Year Ending March 31, 2017
- 4 -
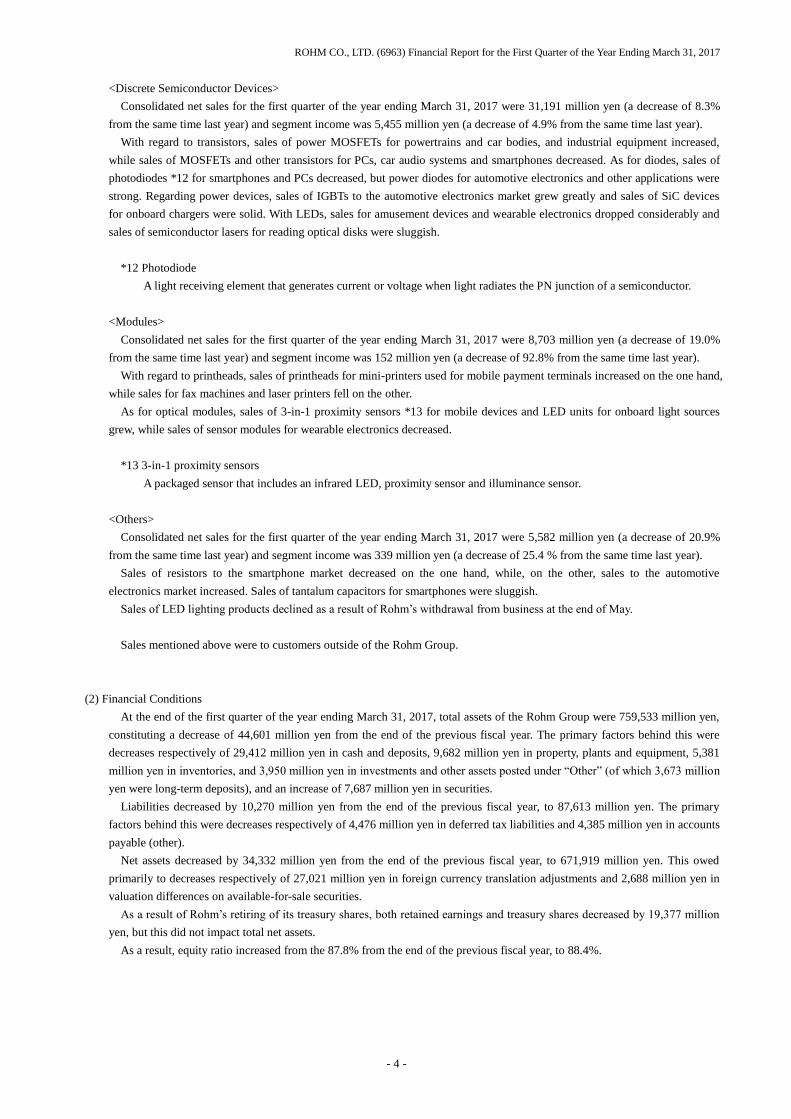
<Discrete Semiconductor Devices>
Consolidated net sales for the first quarter of the year ending March 31, 2017 were 31,191 million yen (a decrease of 8.3%
from the same time last year) and segment income was 5,455 million yen (a decrease of 4.9% from the same time last year).
With regard to transistors, sales of power MOSFETs for powertrains and car bodies, and industrial equipment increased,
while sales of MOSFETs and other transistors for PCs, car audio systems and smartphones decreased. As for diodes, sales of
photodiodes *12 for smartphones and PCs decreased, but power diodes for automotive electronics and other applications were
strong. Regarding power devices, sales of IGBTs to the automotive electronics market grew greatly and sales of SiC devices
for onboard chargers were solid. With LEDs, sales for amusement devices and wearable electronics dropped considerably and
sales of semiconductor lasers for reading optical disks were sluggish.
*12 Photodiode
A light receiving element that generates current or voltage when light radiates the PN junction of a semiconductor.
<Modules>
Consolidated net sales for the first quarter of the year ending March 31, 2017 were 8,703 million yen (a decrease of 19.0%
from the same time last year) and segment income was 152 million yen (a decrease of 92.8% from the same time last year).
With regard to printheads, sales of printheads for mini-printers used for mobile payment terminals increased on the one hand,
while sales for fax machines and laser printers fell on the other.
As for optical modules, sales of 3-in-1 proximity sensors *13 for mobile devices and LED units for onboard light sources
grew, while sales of sensor modules for wearable electronics decreased.
*13 3-in-1 proximity sensors
A packaged sensor that includes an infrared LED, proximity sensor and illuminance sensor.
<Others>
Consolidated net sales for the first quarter of the year ending March 31, 2017 were 5,582 million yen (a decrease of 20.9%
from the same time last year) and segment income was 339 million yen (a decrease of 25.4 % from the same time last year).
Sales of resistors to the smartphone market decreased on the one hand, while, on the other, sales to the automotive
electronics market increased. Sales of tantalum capacitors for smartphones were sluggish.
Sales of LED lighting products declined as a result of Rohm’s withdrawal from business at the end of May.
Sales mentioned above were to customers outside of the Rohm Group.
(2) Financial Conditions
At the end of the first quarter of the year ending March 31, 2017, total assets of the Rohm Group were 759,533 million yen,
constituting a decrease of 44,601 million yen from the end of the previous fiscal year. The primary factors behind this were
decreases respectively of 29,412 million yen in cash and deposits, 9,682 million yen in property, plants and equipment, 5,381
million yen in inventories, and 3,950 million yen in investments and other assets posted under “Other” (of which 3,673 million
yen were long-term deposits), and an increase of 7,687 million yen in securities.
Liabilities decreased by 10,270 million yen from the end of the previous fiscal year, to 87,613 million yen. The primary
factors behind this were decreases respectively of 4,476 million yen in deferred tax liabilities and 4,385 million yen in accounts
payable (other).
Net assets decreased by 34,332 million yen from the end of the previous fiscal year, to 671,919 million yen. This owed
primarily to decreases respectively of 27,021 million yen in foreign currency translation adjustments and 2,688 million yen in
valuation differences on available-for-sale securities.
As a result of Rohm’s retiring of its treasury shares, both retained earnings and treasury shares decreased by 19,377 million
yen, but this did not impact total net assets.
As a result, equity ratio increased from the 87.8% from the end of the previous fiscal year, to 88.4%.
ROHM CO., LTD. (6963) Financial Report for the First Quarter of the Year Ending March 31, 2017
- 5 -
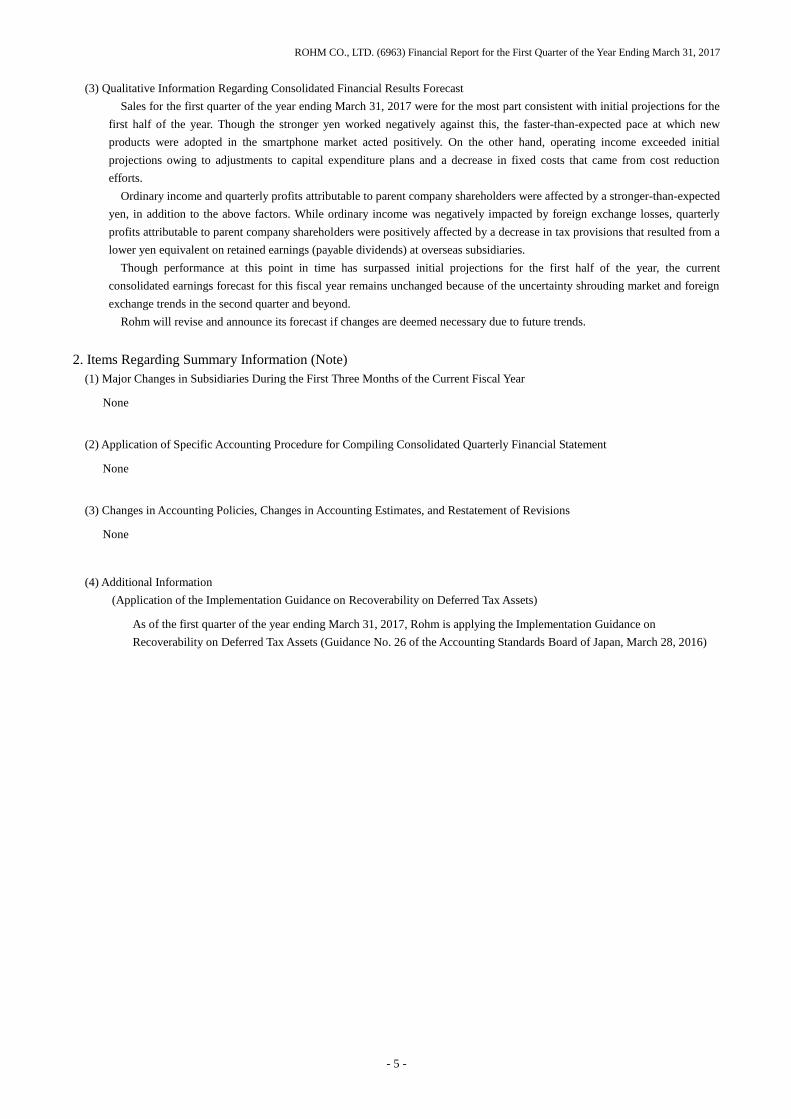
(3) Qualitative Information Regarding Consolidated Financial Results Forecast
Sales for the first quarter of the year ending March 31, 2017 were for the most part consistent with initial projections for the
first half of the year. Though the stronger yen worked negatively against this, the faster-than-expected pace at which new
products were adopted in the smartphone market acted positively. On the other hand, operating income exceeded initial
projections owing to adjustments to capital expenditure plans and a decrease in fixed costs that came from cost reduction
efforts.
Ordinary income and quarterly profits attributable to parent company shareholders were affected by a stronger-than-expected
yen, in addition to the above factors. While ordinary income was negatively impacted by foreign exchange losses, quarterly
profits attributable to parent company shareholders were positively affected by a decrease in tax provisions that resulted from a
lower yen equivalent on retained earnings (payable dividends) at overseas subsidiaries.
Though performance at this point in time has surpassed initial projections for the first half of the year, the current
consolidated earnings forecast for this fiscal year remains unchanged because of the uncertainty shrouding market and foreign
exchange trends in the second quarter and beyond.
Rohm will revise and announce its forecast if changes are deemed necessary due to future trends.
2. Items Regarding Summary Information (Note)
(1) Major Changes in Subsidiaries During the First Three Months of the Current Fiscal Year
None
(2) Application of Specific Accounting Procedure for Compiling Consolidated Quarterly Financial Statement
None
(3) Changes in Accounting Policies, Changes in Accounting Estimates, and Restatement of Revisions
None
(4) Additional Information
(Application of the Implementation Guidance on Recoverability on Deferred Tax Assets)
As of the first quarter of the year ending March 31, 2017, Rohm is applying the Implementation Guidance on
Recoverability on Deferred Tax Assets (Guidance No. 26 of the Accounting Standards Board of Japan, March 28, 2016)
- 6 -
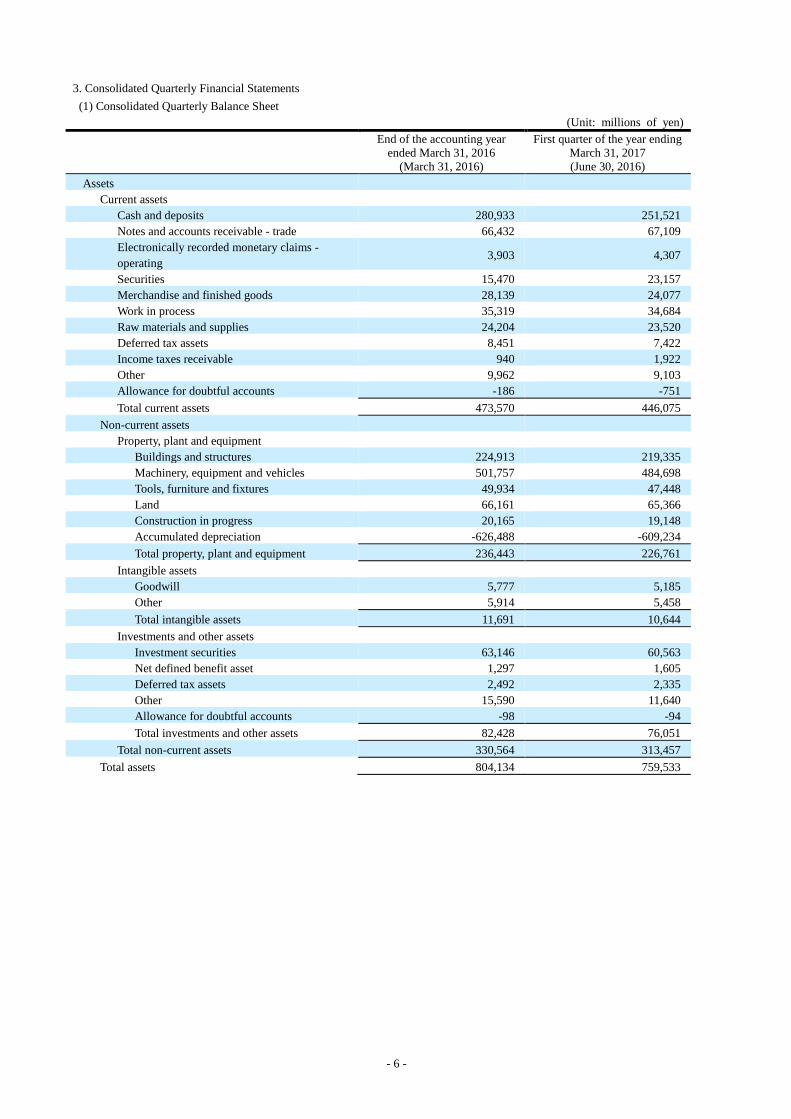
3. Consolidated Quarterly Financial Statements
(1) Consolidated Quarterly Balance Sheet
(Unit: millions of yen)
End of the accounting year
ended March 31, 2016
(March 31, 2016)
First quarter of the year ending
March 31, 2017
(June 30, 2016)
Assets
Current assets
Cash and deposits 280,933 251,521
Notes and accounts receivable - trade 66,432 67,109
Electronically recorded monetary claims -
operating 3,903 4,307
Securities 15,470 23,157
Merchandise and finished goods 28,139 24,077
Work in process 35,319 34,684
Raw materials and supplies 24,204 23,520
Deferred tax assets 8,451 7,422
Income taxes receivable 940 1,922
Other 9,962 9,103
Allowance for doubtful accounts -186 -751
Total current assets 473,570 446,075
Non-current assets
Property, plant and equipment
Buildings and structures 224,913 219,335
Machinery, equipment and vehicles 501,757 484,698
Tools, furniture and fixtures 49,934 47,448
Land 66,161 65,366
Construction in progress 20,165 19,148
Accumulated depreciation -626,488 -609,234
Total property, plant and equipment 236,443 226,761
Intangible assets
Goodwill 5,777 5,185
Other 5,914 5,458
Total intangible assets 11,691 10,644
Investments and other assets
Investment securities 63,146 60,563
Net defined benefit asset 1,297 1,605
Deferred tax assets 2,492 2,335
Other 15,590 11,640
Allowance for doubtful accounts -98 -94
Total investments and other assets 82,428 76,051
Total non-current assets 330,564 313,457
Total assets 804,134 759,533
- 7 -
(Unit: millions of yen)
End of the accounting year
ended March 31, 2016
(March 31, 2016)
First quarter of the year ending
March 31, 2017
(June 30, 2016)
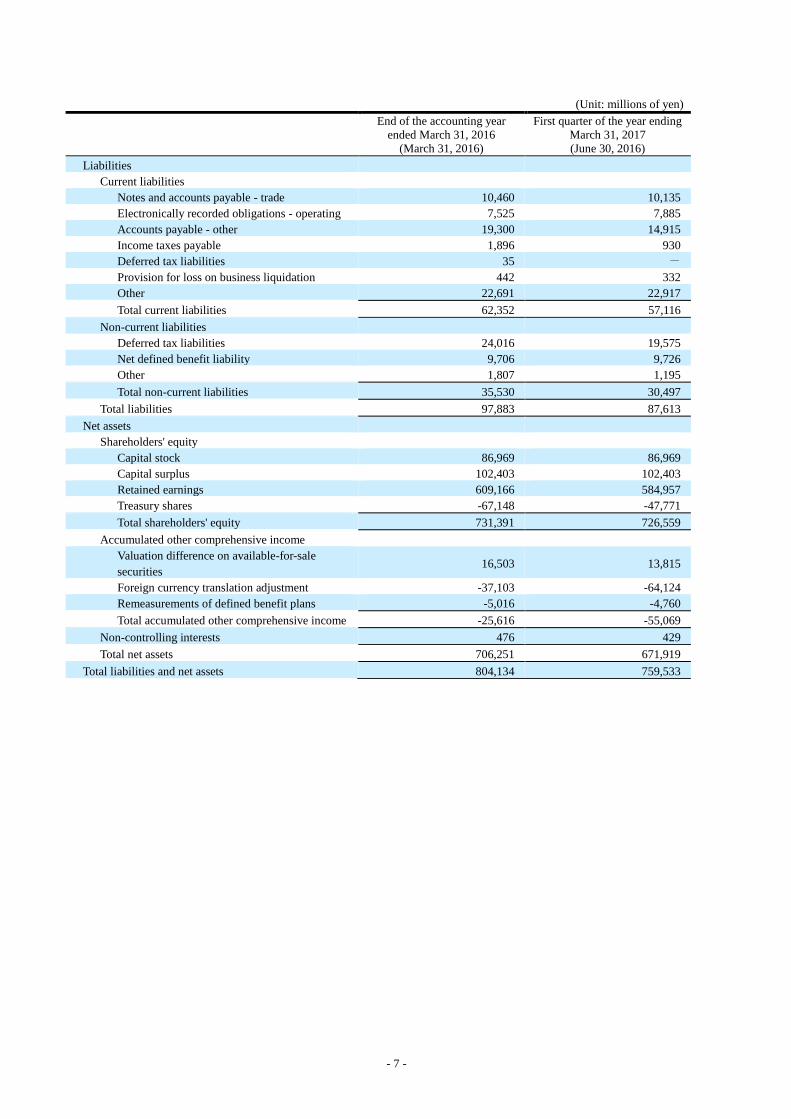
Liabilities
Current liabilities
Notes and accounts payable - trade 10,460 10,135
Electronically recorded obligations - operating 7,525 7,885
Accounts payable - other 19,300 14,915
Income taxes payable 1,896 930
Deferred tax liabilities 35 -
Provision for loss on business liquidation 442 332
Other 22,691 22,917
Total current liabilities 62,352 57,116
Non-current liabilities
Deferred tax liabilities 24,016 19,575
Net defined benefit liability 9,706 9,726
Other 1,807 1,195
Total non-current liabilities 35,530 30,497
Total liabilities 97,883 87,613
Net assets
Shareholders' equity
Capital stock 86,969 86,969
Capital surplus 102,403 102,403
Retained earnings 609,166 584,957
Treasury shares -67,148 -47,771
Total shareholders' equity 731,391 726,559
Accumulated other comprehensive income
Valuation difference on available-for-sale
securities 16,503 13,815
Foreign currency translation adjustment -37,103 -64,124
Remeasurements of defined benefit plans -5,016 -4,760
Total accumulated other comprehensive income -25,616 -55,069
Non-controlling interests 476 429
Total net assets 706,251 671,919
Total liabilities and net assets 804,134 759,533
- 8 -
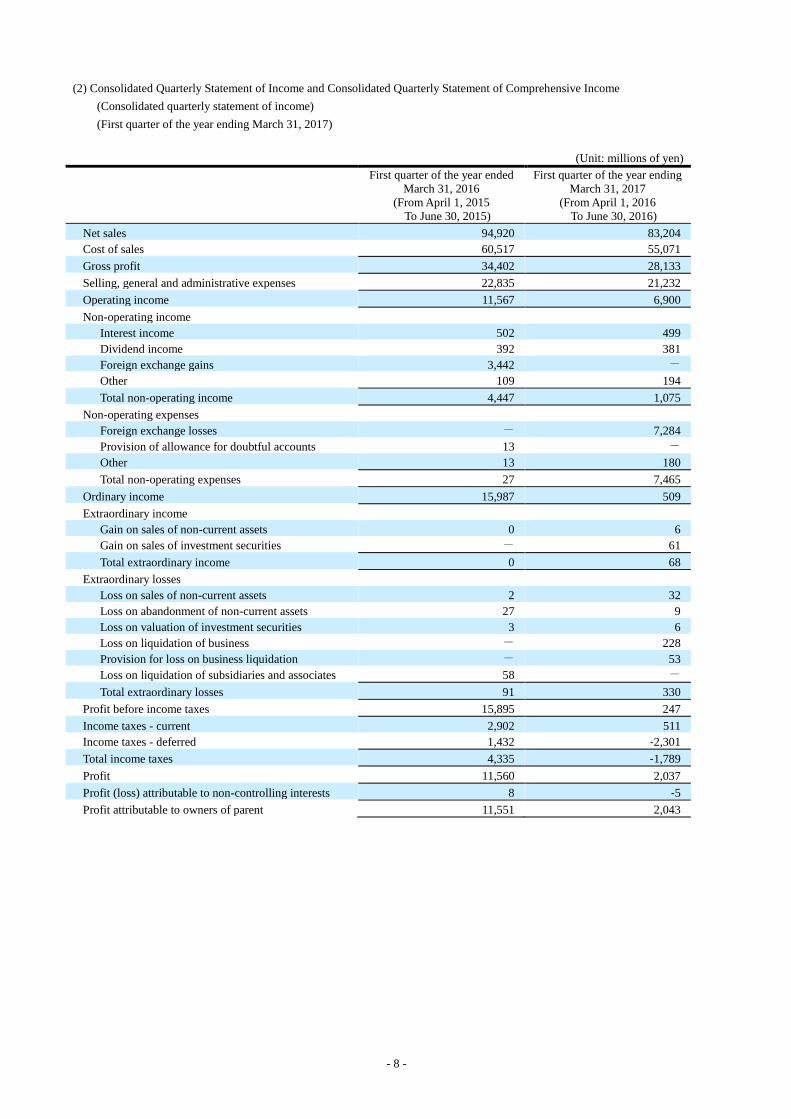
(2) Consolidated Quarterly Statement of Income and Consolidated Quarterly Statement of Comprehensive Income
(Consolidated quarterly statement of income)
(First quarter of the year ending March 31, 2017)
(Unit: millions of yen)
First quarter of the year ended
March 31, 2016
(From April 1, 2015
To June 30, 2015)
First quarter of the year ending
March 31, 2017
(From April 1, 2016
To June 30, 2016)
Net sales 94,920 83,204
Cost of sales 60,517 55,071
Gross profit 34,402 28,133
Selling, general and administrative expenses 22,835 21,232
Operating income 11,567 6,900
Non-operating income
Interest income 502 499
Dividend income 392 381
Foreign exchange gains 3,442 -
Other 109 194
Total non-operating income 4,447 1,075
Non-operating expenses
Foreign exchange losses - 7,284
Provision of allowance for doubtful accounts 13 -
Other 13 180
Total non-operating expenses 27 7,465
Ordinary income 15,987 509
Extraordinary income
Gain on sales of non-current assets 0 6
Gain on sales of investment securities - 61
Total extraordinary income 0 68
Extraordinary losses
Loss on sales of non-current assets 2 32
Loss on abandonment of non-current assets 27 9
Loss on valuation of investment securities 3 6
Loss on liquidation of business - 228
Provision for loss on business liquidation - 53
Loss on liquidation of subsidiaries and associates 58 -
Total extraordinary losses 91 330
Profit before income taxes 15,895 247
Income taxes - current 2,902 511
Income taxes - deferred 1,432 -2,301
Total income taxes 4,335 -1,789
Profit 11,560 2,037
Profit (loss) attributable to non-controlling interests 8 -5
Profit attributable to owners of parent 11,551 2,043
- 9 -
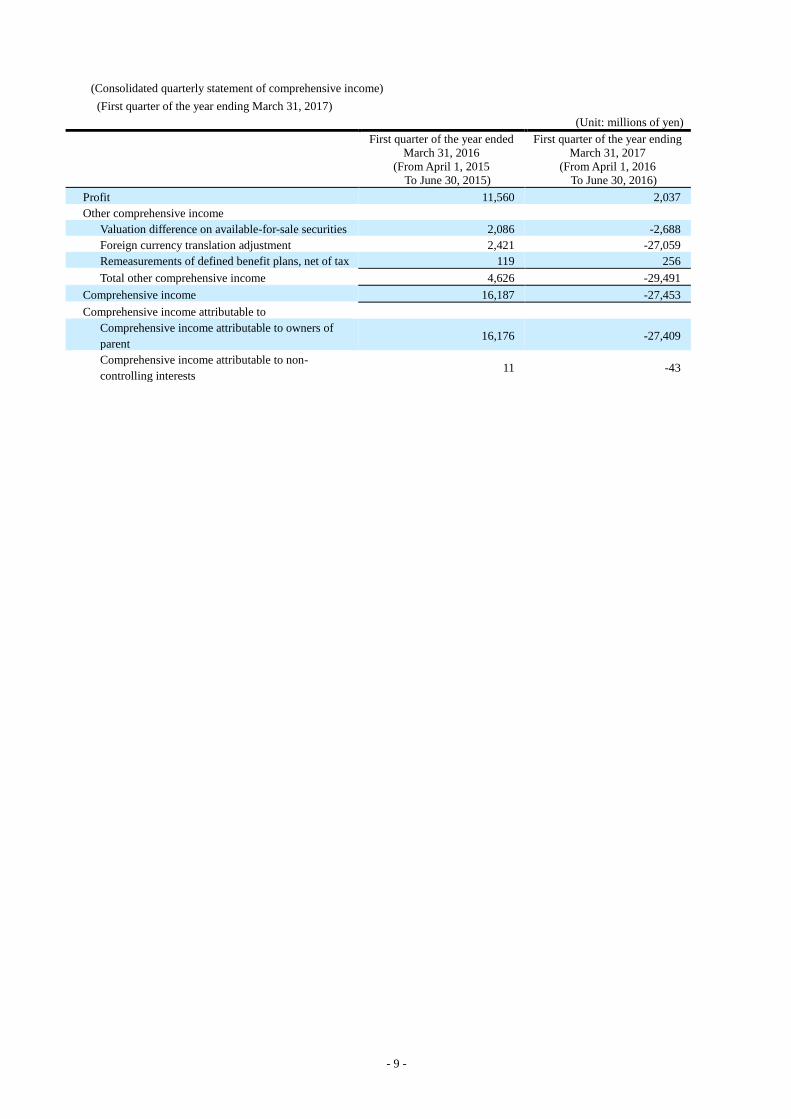
(Consolidated quarterly statement of comprehensive income)
(First quarter of the year ending March 31, 2017)
(Unit: millions of yen)
First quarter of the year ended
March 31, 2016
(From April 1, 2015
To June 30, 2015)
First quarter of the year ending
March 31, 2017
(From April 1, 2016
To June 30, 2016)
Profit 11,560 2,037
Other comprehensive income
Valuation difference on available-for-sale securities 2,086 -2,688
Foreign currency translation adjustment 2,421 -27,059
Remeasurements of defined benefit plans, net of tax 119 256
Total other comprehensive income 4,626 -29,491
Comprehensive income 16,187 -27,453
Comprehensive income attributable to
Comprehensive income attributable to owners of
parent 16,176 -27,409
Comprehensive income attributable to non-
controlling interests 11 -43
ROHM CO., LTD. (6963) Financial Report for the First Quarter of the Year Ending March 31, 2017
- 10 -
(3) Note on Consolidated Quarterly Financial Statement
(Note on going concern)
None
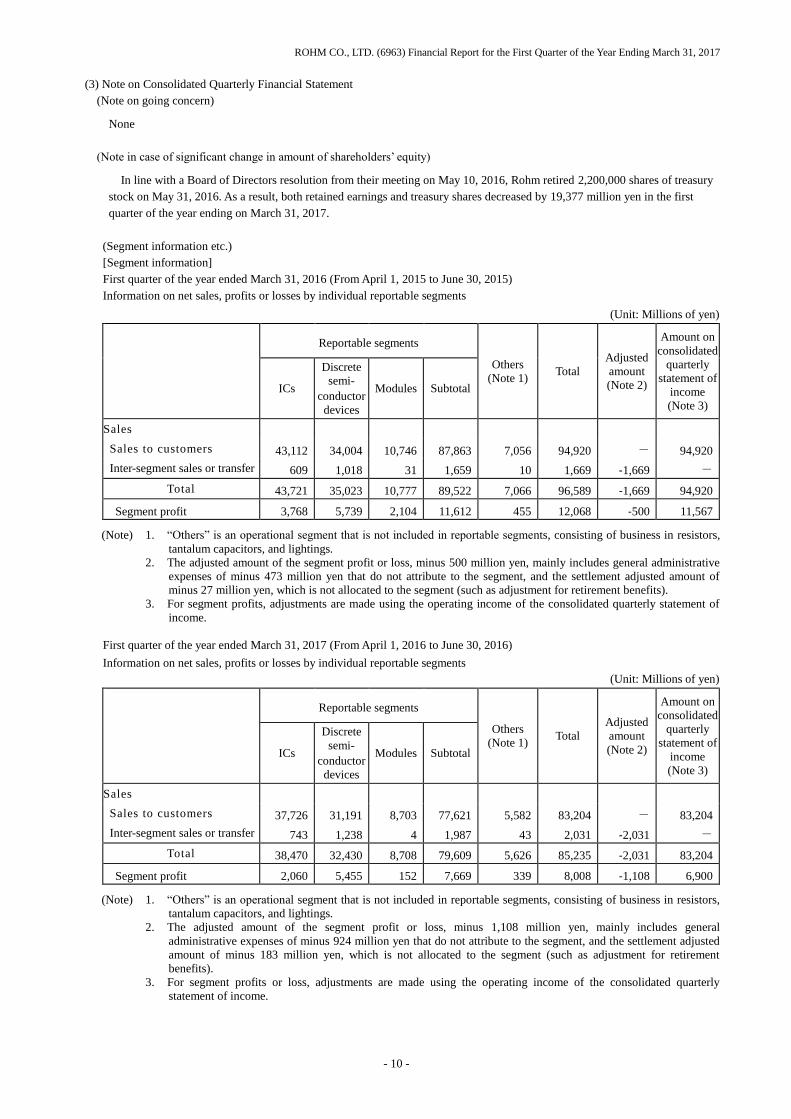
(Note in case of significant change in amount of shareholders’ equity)
In line with a Board of Directors resolution from their meeting on May 10, 2016, Rohm retired 2,200,000 shares of treasury
stock on May 31, 2016. As a result, both retained earnings and treasury shares decreased by 19,377 million yen in the first
quarter of the year ending on March 31, 2017.
(Segment information etc.)
[Segment information]
First quarter of the year ended March 31, 2016 (From April 1, 2015 to June 30, 2015)
Information on net sales, profits or losses by individual reportable segments
(Unit: Millions of yen)
Reportable segments
Others
(Note 1) Total
Adjusted
amount
(Note 2)
Amount on
consolidated
quarterly
statement of
income
(Note 3)
ICs
Discrete
semi-
conductor
devices
Modules Subtotal
Sales
Sales to customers 43,112 34,004 10,746 87,863 7,056 94,920 - 94,920
Inter-segment sales or transfer 609 1,018 31 1,659 10 1,669 -1,669 -
Total 43,721 35,023 10,777 89,522 7,066 96,589 -1,669 94,920
Segment profit 3,768 5,739 2,104 11,612 455 12,068 -500 11,567
(Note) 1. “Others” is an operational segment that is not included in reportable segments, consisting of business in resistors,
tantalum capacitors, and lightings.
2. The adjusted amount of the segment profit or loss, minus 500 million yen, mainly includes general administrative
expenses of minus 473 million yen that do not attribute to the segment, and the settlement adjusted amount of
minus 27 million yen, which is not allocated to the segment (such as adjustment for retirement benefits).
3. For segment profits, adjustments are made using the operating income of the consolidated quarterly statement of
income.
First quarter of the year ended March 31, 2017 (From April 1, 2016 to June 30, 2016)
Information on net sales, profits or losses by individual reportable segments
(Unit: Millions of yen)
Reportable segments
Others
(Note 1) Total
Adjusted
amount
(Note 2)
Amount on
consolidated
quarterly
statement of
income
(Note 3)
ICs
Discrete
semi-
conductor
devices
Modules Subtotal
Sales
Sales to customers 37,726 31,191 8,703 77,621 5,582 83,204 - 83,204
Inter-segment sales or transfer 743 1,238 4 1,987 43 2,031 -2,031 -
Total 38,470 32,430 8,708 79,609 5,626 85,235 -2,031 83,204
Segment profit 2,060 5,455 152 7,669 339 8,008 -1,108 6,900
(Note) 1. “Others” is an operational segment that is not included in reportable segments, consisting of business in resistors,
tantalum capacitors, and lightings.
2. The adjusted amount of the segment profit or loss, minus 1,108 million yen, mainly includes general
administrative expenses of minus 924 million yen that do not attribute to the segment, and the settlement adjusted
amount of minus 183 million yen, which is not allocated to the segment (such as adjustment for retirement
benefits).
3. For segment profits or loss, adjustments are made using the operating income of the consolidated quarterly
statement of income.