Embed Size (px)
Citation preview

Fiscal Year 2017 Integrated Financial Plan
Fiscal Year 2017 Integrated Financial Plan
Fiscal Year 2017 Integrated Financial Plan United States Postal Service 1
Introduction As a self-supporting, independent establishment of the executive branch, the Postal Service is the only delivery service that reaches every American address. The Postal Service binds the nation together by providing reliable, efficient, trusted, and affordable universal delivery service that connects people and helps businesses grow. The Postal Service employs more than 600,000 men and women and processes 154 billion pieces of mail annually, which are delivered to 156 million business and residential delivery points six days a week. In addition to being one of the nation’s largest employers, it also is one of the nation’s largest employers of veterans, with approximately 113,000 employees, nearly 18 percent of the workforce, having served in the military. A recent Pew Research Center national poll found the Postal Service to be the most trusted federal agency and Oxford Strategic Consulting has named the Postal Service the most efficient post among posts that operate in the top 20 major global economies. If it were a private sector company, the Postal Service would rank 43rd in the 2015 Fortune 500. However, despite our vital role in the American economy, the Postal Service continues to face significant financial headwinds driven by continuing declines in First-Class Mail volume, which has decreased 37 percent since 2006 due largely to the effects of the Great Recession and continuing digital migration. We self-finance our operations through the sale of postal products and services instead of relying on taxpayer funds, so we compete for customers in a very competitive communications and delivery marketplace. We are also obligated to provide universal service and maintain the significant processing, transportation, and delivery infrastructure that providing universal service requires. Paying for that infrastructure, which continues to rise in cost every year as delivery points continue to grow, is becoming increasingly challenging as our most profitable mail product (First-Class Mail) continues to decline, and as other mandated costs also continue to rise. These problems are exacerbated by statutory pricing constraints and product and service constraints which limit our ability to generate enough revenue to pay our bills. Among the mandated fixed costs, the Postal Service operates with an unaffordable requirement to fund retiree health benefits, even though those benefits are not fully integrated with Medicare. In fact, if it were not for this pre-funding requirement, the Postal Service would have posted net incomes over the past several years rather than net losses, despite the volume declines. Additionally, our pension obligations are calculated based on overall federal government demographic and economic assumptions, rather than appropriate Postal-specific assumptions. The Postal Service is subject to a rigid price cap on about 70% of its revenue, which is a limitation not faced by private companies. The cap limits price increases to changes in consumer inflation, which does not reflect the financial realities of our business. The cap severely limits our ability to raise necessary revenue to cover the rising costs of universal service, which continue to be incurred even as mail volume declines. That problem is exacerbated by statutory pricing constraints and product and service constraints which further limit our ability to generate sufficient revenues to cover our costs. The Postal Service has responded aggressively to these constraints and long-term trends, reducing our annual cost base by approximately $14 billion since 2008. In that time period, we consolidated our processing, delivery and retail operations, reduced the size of our workforce, and dramatically improved productivity. Nevertheless, the Postal Service cannot overcome its long-term financial challenges without legislative reform and pricing system changes.
Fiscal Year 2017 Integrated Financial Plan United States Postal Service 2
America needs a financially strong Postal Service to most effectively bring the best technologies and solutions to market, and to best serve our customers and communities. To ensure long-term financial sustainability, the Postal Service continues to work with Congress to gain the legislative changes necessary to reduce our unique and burdensome retirement health care costs, to provide greater business flexibility to generate adequate revenues and control costs, and to continue to adapt to a rapidly changing marketplace. Importantly, these changes are very achievable with the enactment of the prudent, measured reform legislation that has broad stakeholder support and that is already pending before Congress. Thank you for taking the time to review our “Fiscal Year 2017 Integrated Financial Plan.” We’re proud to serve you, and all of the American public. Note: Unless otherwise specified, all references to “years” refer to fiscal years beginning October 1 and ending September 30.

Fiscal Year 2017 Integrated Financial Plan United States Postal Service 3
EXECUTIVE SUMMARY The Postal Service enters fiscal year (FY) 2017 having achieved three consecutive years of controllable income and four consecutive years of revenue growth, largely as a result of package growth, the temporary exigent surcharge on Market-Dominant products that expired on April 10, 2016, and continuing cost control initiatives. Despite these recent improvements in financial results, the financial challenge facing the Postal Service remains significant. It will take significant legislative reforms, a successful Postal Regulatory Commission (PRC) 10-year pricing review, and years of sustained profitability to re-balance our assets and liabilities and eliminate the accumulated net deficiency. The Postal Service continues to pursue financial stability through product development and innovation, pricing, improving operational efficiencies, and reducing those costs that are within our control. The FY2017 Integrated Financial Plan (IFP) demonstrates the Postal Service’s commitment to a financially stable organization by balancing revenue growth initiatives, cost controls and investments in the future. The FY2017 IFP projects controllable income of $0.1 billion, versus actual controllable income of $0.6 billion in FY2016 (which benefited from $1.1 billion of temporary exigent surcharge revenue). The FY2017 net loss is forecasted to be $4.2 billion. Beginning in FY2017, a number of changes take place in the legally-mandated costs the Postal Service is required to pay. The 10-year retiree health benefits (RHB) pre-funding schedule has been replaced with a 40-year amortization calculated by the Office of Personnel Management (OPM); the estimated amortization expense for FY2017 is $2.9 billion. Further, the Postal Service is now required to make an amortization payment to fund its obligation to the Civil Service Retirement System (CSRS), currently estimated at $1.2 billion per year, for 27 years, beginning as early as FY2017. Lastly, the $0.2 billion Federal Employees Retirement System (FERS) unfunded liability amortization continues. There is no estimate included in the plan for the non-cash portion of workers’ compensation expense, because it is highly sensitive to changes in discount rates. For example, an increase of 1% in the interest rates would have decreased the liability at September 30, 2016, and 2016 expense by approximately $2.2 billion. A decrease of 1% would have increased the liability at September 30, 2016, and 2016 expense by approximately $2.7 billion. All of these costs are excluded from our controllable income calculation, as they are dependent on actuarial assumptions, interest rates, and other factors outside of management’s control. In addition to these items, 2016 controllable income also excluded a change in accounting estimate for deferred revenue. All revenue and controllable income comparisons to FY2016 in this document are defined as shown in the table above.
The IFP projects revenue growth, excluding temporary exigent surcharge revenue of $1.1 billion, of $1.3 billion compared to FY2016. The increase is driven primarily by package growth and modest price increases for Market-Dominant and Competitive products. Controllable expenses in FY2017 are expected to increase by only $0.7 billion over FY2016, but due to the roll-back of the exigent surcharge, controllable income is expected to decrease from $0.6 billion in FY2016 to $0.1 billion in FY2017.
Statement of Operations
In Billions FY2016 Actual
FY2017Plan
Revenue 1 69.4$ 70.7$
Temporary Exigent Surcharge 1.1 -
Total Revenue 70.5$ 70.7$
Controllable Expenses 2, 3 69.9 70.6
Controllable Income 2, 3 0.6$ 0.1$
RHB Pre-funding (5.8) -
FERS Unfunded Liability Amortization (0.2) (0.2)
CSRS Unfunded Liability Amortization - (1.2)
RHB Unfunded Liability Amortization - (2.9)
Workers' Comp. Fair Value and Other Non-Cash Adj. (1.3) -
Change in Accounting Est. 4 1.1 -
Net Loss (5.6)$ (4.2)$
Mail Volume 153.9 152.9
1 - Revenue does not include the change in accounting estimate of $1.1B.2 - Before RHB pre-funding, FERS / CSRS / RHB unfunded liability amortization, and non-cash adjustments to w orkers’ compensation liabilities.3 - Includes RHB premiums of $3.3B in 2016 and normal costs of $2.9B in 2017.4 - New ly available data on prepaid postage resulted in a $1.1B decrease in the liability for deferred

Fiscal Year 2017 Integrated Financial Plan United States Postal Service 4
The IFP anticipates that work hours will remain relatively flat (a reduction of 1 million work hours) compared to FY2016. This is in spite of the continued growth in delivery points and the growth in more labor-intensive package volumes. In addition, we continue to identify incremental cost savings opportunities and make equipment investments and efficiency improvements in all aspects of processing, delivery, retail, maintenance, and transportation. However, these savings will not be sufficient to offset inflationary and other cost increase drivers, as our total expenses are expected to grow in FY2017. The Postal Service ended FY2016 with an unrestricted cash balance of $8.1 billion, equivalent to approximately 29 days of operating cash. We define days of cash available as unrestricted cash divided by estimated average cash disbursements (including capital expenditures) per business day (approximately $275 million per day). This level of liquidity was achieved in part by defaulting on RHB pre-funding payments since 2012 totaling $33.9 billion. Aside from the defaults, the improvement is also attributable to the temporary exigent surcharge, which generated approximately $4.6 billion in incremental revenue from January 2014 through April 10, 2016, as well as USPS's aggressive management of the capital expenditures and operating expenses within its control. We have no remaining borrowing capacity, as we ended FY2016 with $15 billion in debt, which is the legally mandated ceiling. In FY2017, our liquidity is projected to decrease to approximately $4.0 billion if we pay all of the required amortization and normal cost payments. By mid-October 2017, we estimate that liquidity will dip to approximately $2.8 billion. These levels are insufficient for an organization with over $70 billion in annual controllable expenses.
ECONOMIC ASSUMPTIONS At the time this plan was developed, the economy was projected to show further improvement in 2017, driven by improvements in real disposable income and employment leading to more robust and stable Gross Domestic Product (GDP) growth, continuing growth in housing, and higher investment. Growth in online shopping, emerging technologies, and improved consumer confidence could have further positive influence on economic growth in 2017. However, risks remain as economic weakness overseas could spread to the U.S. and other potential factors could slow economic growth. The Postal Service’s financial position and results of operations will continue to be impacted by the state of the economy. In developing the IFP forecast, we consider factors such as multi-year trends in our product sales (with greater weight on more recent trends), expected market growth, competitive market dynamics, changes in prices and marketing programs, the expected rate of migration of hard copy mail to digital media, and the expected state of the overall economy. For 2017, it is anticipated that the US economy will remain stable, with the GDP growth rate increasing to 2.3 percent from 1.9 percent in 2016. Employment continues to increase though at a slower rate, and inflation adjusted consumer spending is expected to increase by 2 percent. Additionally, the generally positive economic outlook centers on a continued improvement of the housing sector, growth in capital expenditures, and strong exports. The improving economic conditions and an influx of election-related mailings in early FY2017 will not be enough to offset the negative impact on First-Class Mail volumes caused by ongoing diversionary trends. The Great Recession forced a shift in consumer and business attitudes and behaviors that affected their needs for and use of Standard and First-Class Mail. Electronic diversion continues to adversely affect First-Class Mail volumes and will likely continue to do so in 2017. While Market-Dominant revenue is expected to decline in 2017, Competitive products, comprising mostly packages, are expected to grow, as economic and e-commerce growth continues, and Postal Service marketing initiatives continue to drive sales growth.
FY2016 Estimated
FY2017 Estimated
Gross Domestic Product 1.9% 2.3%
Retail Sales 1.9% 3.0%
Consumer Price Index for All Urban Consumers
1.0% 2.2%
Consumer Price Index for Wage Earners 0.6% 2.2%
Employment Cost Index 2.3% 2.7%
Employment 2.0% 1.5%
Investment 0.3% 3.0%
Economic Drivers

Fiscal Year 2017 Integrated Financial Plan United States Postal Service 5
2017 OPERATING PLAN – MAIL VOLUME AND REVENUE
A. Volume The 2017 IFP projects total mail volume of 152.9 billion pieces, a decline of 1.0 billion pieces, or 0.6 percent, from 2016. For First-Class Mail, the IFP projects a decline of approximately 1.5 billion pieces, or 2.5 percent, from 2016, reflecting the ongoing migration of communications and transactions out of First-Class Mail. Standard Mail (to be renamed USPS Marketing Mail, effective in January 2017) is expected to increase 0.4 percent from the level of 2016, due mainly to growth in election mailings. Shipping and Packages volume is expected to grow 7.8 percent to 5.5 billion pieces in 2017, led by the strong year-over-year growth in e-commerce, growth initiatives, and price increases. Priority Mail, Parcel Select, and First-Class Packages, the three largest Shipping and Packages categories, are all expected to continue to show growth, driven by their consistent, reliable service, and price competitiveness. Volume for the remaining products is expected to decline from 7.0 billion pieces in 2016 to 6.8 billion pieces in 2017, driven primarily by a decline of 0.2 billion pieces in Periodicals. Periodicals volume is continuing its long-term decline, as electronic content continues to supplant hard copy. B. Revenue Revenue for 2017 is expected to increase by $1.3 billion, excluding the effect of the temporary exigent surcharge in 2016. The 2017 growth is driven primarily by Shipping and Packages and modest price increases for Market-Dominant and Competitive products. First-Class Mail revenue is projected to decline by $0.6 billion, or 2.3 percent, as the ongoing migration of communications and transactions out of First-Class Mail continues to cause volumes to decline. Standard Mail revenue is expected to increase by $0.1 billion, or 0.6 percent. Revenues from Shipping and Packages are projected to increase by approximately $1.7 billion in 2017. Although Shipping and Packages revenue is expected to show double digit growth, the products within Shipping and Packages generally have lower contribution margins than First-Class Mail.
Volume
Billion piecesFY2016 Actual
FY2017Plan
First-Class Mail 60.9 59.4
Standard Mail 80.9 81.2
Shipping and Packages 5.1 5.5
International 1.0 1.0
Periodicals 5.6 5.4
Other 0.4 0.4
Total Volume 153.9 152.9
Revenue
in Billions
FY2016
Actual 1FY2017
Plan
First-Class Mail 26.6$ 26.0$
Standard Mail 17.6 17.7
Shipping and Packages 17.3 19.0
International 2.7 2.8
Periodicals 1.5 1.4
Other 3.7 3.8
Revenue 1 69.4$ 70.7$
1- FY2016 excludes temporary exigent surcharge of $1.1B and change in accounting estimate of $1.1B.

Fiscal Year 2017 Integrated Financial Plan United States Postal Service 6
2017 OPERATING PLAN –WORK HOURS & EXPENSES The 2017 IFP projects total work hours of 1,157 million, a work hour reduction target of 1 million compared to 2016. The increase in package volumes and continuing growth in the delivery network result in growth in work hours. This growth is offset by efficiency improvements and the reduction of one delivery day in 2017, compared to 2016 due to the leap year in 2016. The Postal Service has increased productivity and decreased work hour usage over the last decade. We continue to implement strategies to manage work hours, but as seen in 2016, the continued growth in the number of packages -- which are much more labor-intensive than letters – and the ever-growing number of delivery points, make it increasingly difficult to reduce work hours. We will continue to innovate to drive efficiency. Controllable expenses, which exclude RHB pre-funding, amortization of the FERS, CSRS, and RHB unfunded liabilities, and non-cash adjustments to the workers’ compensation liability are projected to increase by $0.7 billion, or 1.0 percent, in 2017. Compensation and benefits expense is expected to increase by $0.4 billion in 2017, driven primarily by scheduled general wage increases, cost of living adjustments, and higher health benefits costs. These upward pressures are partially offset by the 1 million work hour reduction described above and continued workforce attrition trends. In 2017, compensation and benefits expense includes the estimated (by OPM) $2.9 billion normal cost of providing future retirement health benefits to current career employees. Non-personnel expenses are expected to grow largely due to expenditures for information systems and support for our package growth initiatives. Inflationary pressures and repairs to our aging vehicle fleet will also push non-personnel costs higher. Transportation costs are expected to grow in 2017 as savings from our efficiency improvement initiatives are offset by additional package growth, projected increased fuel prices, and increased highway transportation needs.
Expenses
in BillionsFY2016 Actual
FY2017Plan
Compensation and Benefits 1 53.2$ 53.6$
Transportation 7.0 7.2
Depreciation 1.7 1.6
Supplies & Services 2.8 3.0
Rent / Utilities / Other 5.2 5.2
Controllable Expenses 2 69.9$ 70.6$
RHB Pre-funding 5.8 -
FERS Unfunded Liability Amortization 0.2 0.2
CSRS Unfunded Liability Amortization - 1.2
RHB Unfunded Liability Amortization - 2.9
Workers' Comp. Fair Value and Other Non-Cash Adj. 1.3 -
Total Expenses 77.2$ 74.9$
1 - Before RHB pre-funding, FERS / CSRS / RHB unfunded liability amortization, and non-cash adjustments to w orkers’ compensation liabilities.2 -Includes RHB premiums of $3.3B in 2016 and normal costs of $2.9B in 2017.
Fiscal Year 2017 Integrated Financial Plan United States Postal Service 7
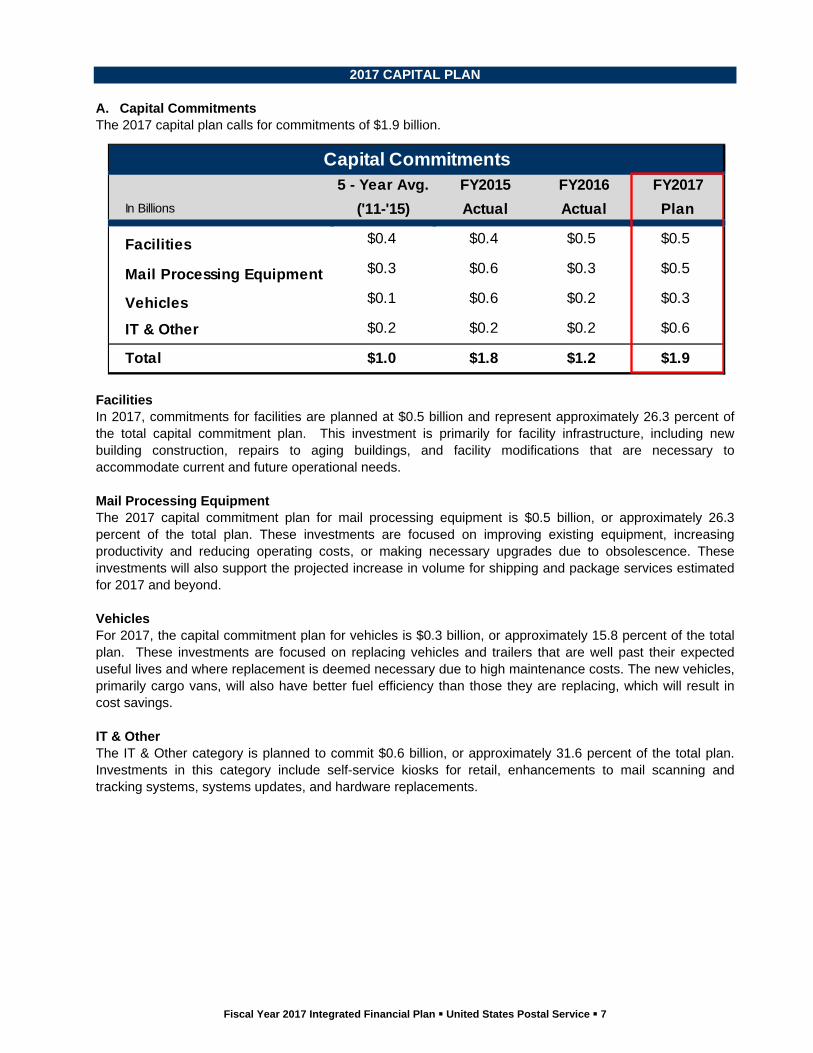
2017 CAPITAL PLAN A. Capital Commitments The 2017 capital plan calls for commitments of $1.9 billion.
Facilities In 2017, commitments for facilities are planned at $0.5 billion and represent approximately 26.3 percent of the total capital commitment plan. This investment is primarily for facility infrastructure, including new building construction, repairs to aging buildings, and facility modifications that are necessary to accommodate current and future operational needs. Mail Processing Equipment The 2017 capital commitment plan for mail processing equipment is $0.5 billion, or approximately 26.3 percent of the total plan. These investments are focused on improving existing equipment, increasing productivity and reducing operating costs, or making necessary upgrades due to obsolescence. These investments will also support the projected increase in volume for shipping and package services estimated for 2017 and beyond. Vehicles For 2017, the capital commitment plan for vehicles is $0.3 billion, or approximately 15.8 percent of the total plan. These investments are focused on replacing vehicles and trailers that are well past their expected useful lives and where replacement is deemed necessary due to high maintenance costs. The new vehicles, primarily cargo vans, will also have better fuel efficiency than those they are replacing, which will result in cost savings. IT & Other The IT & Other category is planned to commit $0.6 billion, or approximately 31.6 percent of the total plan. Investments in this category include self-service kiosks for retail, enhancements to mail scanning and tracking systems, systems updates, and hardware replacements.
Capital Commitments5 - Year Avg. FY2015 FY2016 FY2017
In Billions ('11-'15) Actual Actual Plan
Facilities $0.4 $0.4 $0.5 $0.5
Mail Processing Equipment $0.3 $0.6 $0.3 $0.5
Vehicles $0.1 $0.6 $0.2 $0.3
IT & Other $0.2 $0.2 $0.2 $0.6
Total $1.0 $1.8 $1.2 $1.9

Fiscal Year 2017 Integrated Financial Plan United States Postal Service 8
B. Capital Cash Outlays
Capital cash outlays are expected to increase due both to payments on commitments made in 2016 and 2017. Cash outlays for 2017 are for similar items as described above for capital commitments.
2017 LIQUIDITY AND FINANCING PLAN A. Cash Flow and Debt For 2017, the projected net loss of $4.2 billion includes amortization of supplemental liabilities of $0.2 billion for FERS, $1.2 billion for CSRS, and $2.9 billion for RHB.
Compared to 2016, the Postal Service is expected to use $4.1B of cash, rather than generate $1.5B. The year-over-year decline in cash flows is primarily driven by the lower controllable income in 2017, higher projected capital investments that have been deferred but are now necessary, and the projected cash outlays for retirement and retiree health benefits costs due by September 30, 2017.
This will result in a critically low level of liquidity. If all legally-mandated payments are made, and all other financial results conform to plan, our year-end 2017 liquidity would be roughly $4.0 billion. This is an insufficient level of liquidity for an enterprise with annual expenses of nearly $75 billion in 2017. Although we ended 2016 with approximately $8.1 billion of unrestricted cash, the projected $4.1 billion (~50%) reduction in liquidity that will occur if all obligations are paid illustrates the tenuousness of our financial position. This assumes that we are able to achieve all elements of our operating plan, as well as fulfilling the capital investment plan.
Capital Cash Outlays5 - Year Avg. FY2015 FY2016 FY2017
In Billions ('11-'15) Actual Actual Plan
Facilities $0.4 $0.4 $0.4 $0.6
Mail Processing Equipment $0.3 $0.5 $0.4 $0.4
Vehicles $0.0 $0.1 $0.4 $0.3
IT & Other $0.2 $0.2 $0.2 $0.5
Total $0.9 $1.2 $1.4 $1.8
in BillionsFY2016 Actual
FY2017Plan
Net Loss $ (5.6) (4.2)
Adjustments to Reconcile Net Loss to Cash Provided/Used
(+) RHB Pre-Funding - Not Paid 5.8 -
(+) FERS not Paid (under appeal) 0.2 0.2
(+) Depreciation 1.7 1.6
(+) Non-cash Workers' Compensation Adj 1.3 -
(-) Capital Cash Outlays (1.4) (1.8)
(+) PIHOP & Deferred Revenue (1.1) -
(+-) Other Changes in Working Capital 0.6 0.1
Cash Provided/Used $ 1.5 (4.1)
Cash at Start of Year (less restricted - $0.2) 6.6 8.1 Borrowing - -
Cash at End of Year (less restricted - $0.3) $ 8.1 4.0

B. LiquidThe graphof our ungraph becannual wwhich inclpayments We endedlegally-matotaling $exigent sassuminglevels, anenvironme Unless thdown debCongressgranted s We will co2017. Mahealth bemodel and
F
dity h below plotsrestricted cascause Octoborkers’ compludes approxis.
d 2016 with $andated $15 33.9 billion.
surcharge on all revenue,
nd provides lent.
ere is a fundbt, and we ws takes actionignificant add
ontinue to purany of the strnefits with Md a successfu
Fiscal Year 2017
s estimated liqsh balance per is a critica
pensation reimimately $75 m
$8.1 billion of billion debt ce Our liquidity
n Market-Domexpense, an
little cushion
damental chawill have no n on the com
ditional pricing
rsue legislativuctural reformedicare, can
ul PRC 10-yea
2017 LIQUID
7 Integrated Fina
quidity on a mlus any availal liquidity mombursement million for adm
unrestricted ceiling, despitey position imminant prodund capital spe
for an orga
nge in our finability to bo
mprehensive g flexibility.
ve changes, cms needed to
only be achiar pricing rev
DITY DAYS O
ancial Plan Un
monthly basisable borrowinonth. Each to the Depa
ministrative ex
cash and no e defaulting oproved by $
ucts, but is ending targetsanization of o
nancial condirrow additionlegislative re
cost reductiono ensure long-eved with legiew.
OF OPERATI
nited States Pos
s for FY2016ng capacity. year in Octortment of La
xpenses as w
remaining boon retiree hea1.4 billion in expected to
s are met. Lour size, ope
tion, we will nal funds. Teforms that
ns, and additio-term viabilitygislative chan
ING CASH AV
stal Service 9
and FY2017. We include
ober we are bor of appro
well as the reim
orrowing capaalth benefits p
2016, aidedo decrease siquidity remaerating in an
not have suffThese conditiwe have req
onal ways to y, such as fulnge to our un
VAILABLE
. Liquidity is October 201
required to roximately $1.5mbursement o
acity, as we apre-funding pd by the nowsignificantly iains below ac
uncertain e
fficient liquiditons will exis
quested, and
generate revl integration o
nsustainable b
the sum 17 in our remit our 5 billion, of claims
are at the ayments
w-expired in 2017,
cceptable economic
ty to pay st unless we are
venues in of retiree business
Fiscal Year 2017 Integrated Financial Plan United States Postal Service 10
CONCLUSION The 2017 IFP reflects the Postal Service’s continued efforts to achieve financial health and stability, within the limits of current law. Before adjusting for the expiration of the exigent surcharge, the IFP projects a $1.3 billion growth in revenues. Commensurate with this revenue growth, the Postal Service continues to experience a rapidly changing mailing environment, which requires the Postal Service to balance cost management as we serve a growing delivery network with increasing volumes of labor-intensive packages. Despite revenue growth and cost-containment initiatives, the Postal Service continues to have insufficient liquidity to fully fund all legally-required obligations, maintain a margin of safety in the event of an economic downturn and make a meaningful reduction in debt. Although our controllable income, as shown on page three, is estimated to be positive, significant risks such as negative economic developments, continued fiscal uncertainty of the U.S. government, inflation in fuel or wages, etc. could eliminate that positive controllable income. We continue to inform the Administration, Congress, the PRC, and other stakeholders of the immediate and longer-term financial issues we face and the legislative changes that would help provide financial stability. Given the vital role the Postal Service plays in the U.S. economy, a financially healthy and stable Postal Service should continue to be a top priority for all stakeholders from legislative and regulatory bodies to management, employees, and customers.