Embed Size (px)
Citation preview

30th
Annual
FY2018Aviation
Safety Summary and Annual
Report
HTTPS://WWW.DOI.GOV/AVIATION
Partnering for better, faster, cheaper, safer aviation missionsPublished by: Office of Aviation Services (OAS)

FY18 DOI Annual Aviation Safety Summary Page 2
Fiscal Year 2018 DOI Aviation Safety Summary and Annual Report
OAS - Points of Contact
Mark Bathrick - Director(208) 433-5000
Susie Bates - Assistant Director(208) 433-5065
Keith Raley - Chief, Aviation Safety, Training, Program Evaluations & Quality Management(208) 433-5071
Woody Kessler - Training Branch Chief(208) 433-5090
John Mills - Air Safety Investigator(208) 433-5072
John Waddell - Air Safety Investigator (208) 433-5073
Blaine Moriarty - Aviation Program Evaluation Specialist(208) 433-5045
Matt Shaddle - Aviation Program Evaluation Specialist (208) 433-5062
Vicki Johnston - QMS/SMS Coordinator(208) 433-5022
Monique Way - Aviation Safety Data Analyst(208) 433-5070
The Department of the Interior’s Aviation Safety
and Aircraft Accident Prevention program is
founded on the four pillars of an integrated
Safety Management System (SMS):
The Department’s aviation programs are built on Federal Aviation Administration (FAA) regulatory requirements, Federal Management Regulations (FMR) Departmental regulations (DMs) and industry best practices.
This foundation requires each bureauand their respective region/state/unit to develop customized practices and policies to ensure they are readily adopted in their respective operational arenas. Management is responsible for ensuring their respective aviation programs are properly resourced. These requirements apply to all programs regardless of the amount of flying or type of aircraft (i.e. manned, sUAS).
Inside this issue: Page:
Points of Contact 2
Aviation Overview 3-13
Policy and Assurance 14-15
Risk Management 16-19
Promotion 20-23
Executive Summary 24

FY18 DOI Annual Aviation Safety Summary Page 3
Aircraft Accident Rate
The U.S. Department of the Interior (DOI) ended the year recording four incidents with potential (IWPs) and three accidents. The annual aircraft accident rate is 5.09 per 100,000 flight hours, an increase of 1.63 from last year. The DOI mishap rate is 11.88, which is an increase from the previous year by 1.5. Zero aircraft accidents IS an attainable goal. We must meet and exceed expectations set for ourselves through training, safety guidelines, and safety tools. (https://www.doi.gov/aviation/library/guides)
As of October 1, 2018, flight data captured 58,911 total flight hours (approximately 1,095 hours more than the previous year). Flights on contracted aircraft accounted for 44,258 hours (over 75% of all hours flown). The remaining 14,653 hours, or 25%, were flown using bureau-owned fleet aircraft.
Since 1975, DOI’s aviation safety program has resulted in estimated savings of $718M to the Department and its supporting vendors in reduced losses. Flight missions performed for DOI were supported in part by bureau requested and OAS supported aviation contracts that required 2,071 vendor pilot evaluations, 1,111 vendor aircraft inspections, 135 Interior fleet pilot evaluations, and 82 Interior fleet aircraft inspections. Aviation Training supported 715 instructor led course offerings accounting for 5,220.5 available student hours of training and the Interagency Aviation Training website recorded 40,134 course completions (30,074 Online, 6,760 Residential Classroom, 2,376 ACE| Workshop, 891 Webinars, and 33 Video Teleconferencing course completions).3
1Historical aircraft accident rate is defined as total historical aircraft accidents per 100,000 flight hours flown. This is standard throughout the global aviation industry. 2Annual aircraft accident rate is defined as total aircraft accidents in one year per 100,000 flight hours flown. This is standard throughout the global aviation industry. 3Includes DOI Fleet, Commercial Vendor, and Cooperator aircraft from other agencies. Pilots receive evaluations for each specific special use mission area qualification.

FY18 DOI Annual Aviation Safety Summary Page 4
DOI FY18 Mishap*OverviewFY18 Flight Mishap
Rate: 11.88
(Manned) Mishaps = Accidents + IWPs
FY18 sUAS Mishap Rate: 5.80
(sUAS) Mishaps = Accidents + IWPs + Aircraft loss
Accident Rate (manned aircraft)
**2018 General Aviation Accident data is not yet available
*Accidents are defined
by 49 CFR 830.2 and
are determined by the
NTSB. An Incident
With Potential (IWP)
is an incident that
narrowly misses being
an accident and is
determined by OAS.
sUAS uses slightly
different criteria due
to lower flight hours
and aircraft losses that
don’t meet either
criteria. Mishaps
include accidents,
IWP’s, and incidents.
In FY18, The DOI accident rate increased to 5.09accidents for every 100,000 hours flown, a 47% over the previous year.
FY18 DOI Annual Aviation Safety Summary Page 5
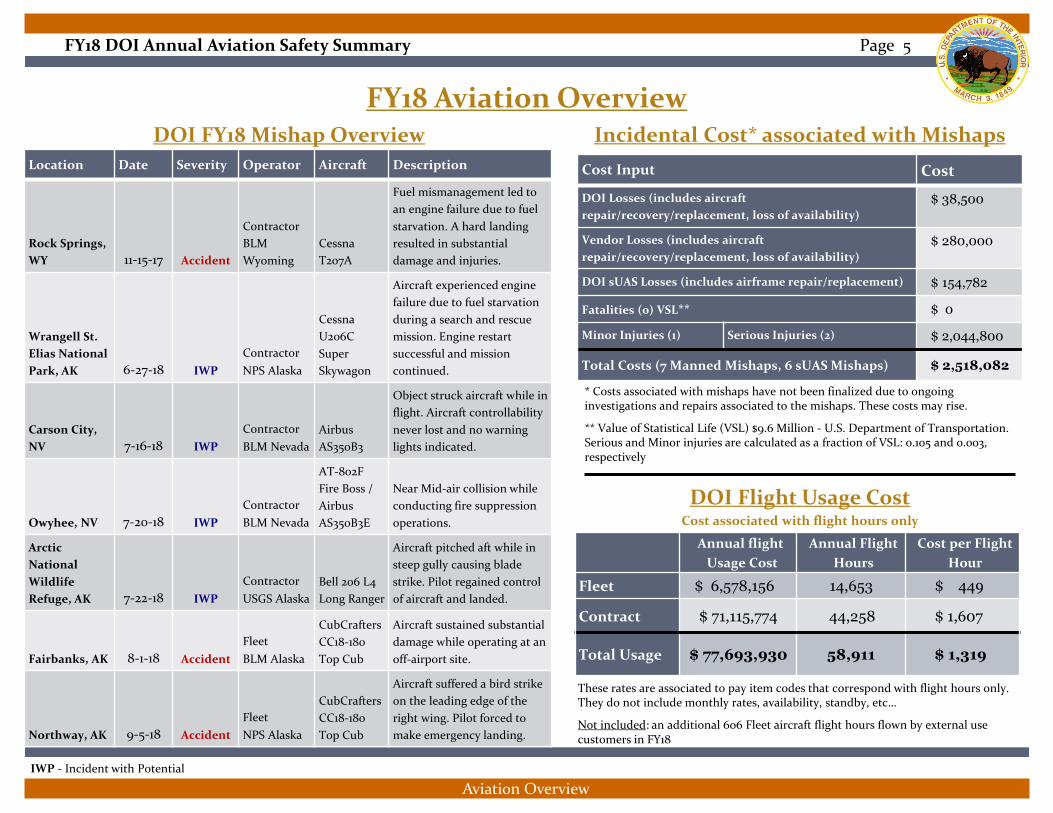
FY18 Aviation OverviewDOI FY18 Mishap Overview
Location Date Severity Operator Aircraft Description
Rock Springs,
WY 11-15-17 Accident
Contractor
BLM
Wyoming
Cessna
T207A
Fuel mismanagement led to
an engine failure due to fuel
starvation. A hard landing
resulted in substantial
damage and injuries.
Wrangell St.
Elias National
Park, AK 6-27-18 IWP
Contractor
NPS Alaska
Cessna
U206C
Super
Skywagon
Aircraft experienced engine
failure due to fuel starvation
during a search and rescue
mission. Engine restart
successful and mission
continued.
Carson City,
NV 7-16-18 IWP
Contractor
BLM Nevada
Airbus
AS350B3
Object struck aircraft while in
flight. Aircraft controllability
never lost and no warning
lights indicated.
Owyhee, NV 7-20-18 IWP
Contractor
BLM Nevada
AT-802F
Fire Boss /
Airbus
AS350B3E
Near Mid-air collision while
conducting fire suppression
operations.
Arctic
National
Wildlife
Refuge, AK 7-22-18 IWP
Contractor
USGS Alaska
Bell 206 L4
Long Ranger
Aircraft pitched aft while in
steep gully causing blade
strike. Pilot regained control
of aircraft and landed.
Fairbanks, AK 8-1-18 Accident
Fleet
BLM Alaska
CubCrafters
CC18-180
Top Cub
Aircraft sustained substantial
damage while operating at an
off-airport site.
Northway, AK 9-5-18 Accident
Fleet
NPS Alaska
CubCrafters
CC18-180
Top Cub
Aircraft suffered a bird strike
on the leading edge of the
right wing. Pilot forced to
make emergency landing.
IWP - Incident with Potential
Incidental Cost* associated with Mishaps
Cost Input Cost
DOI Losses (includes aircraft
repair/recovery/replacement, loss of availability)
$ 38,500
Vendor Losses (includes aircraft
repair/recovery/replacement, loss of availability)
$ 280,000
DOI sUAS Losses (includes airframe repair/replacement) $ 154,782
Fatalities (0) VSL** $ 0
Minor Injuries (1) Serious Injuries (2) $ 2,044,800
Total Costs (7 Manned Mishaps, 6 sUAS Mishaps) $ 2,518,082
* Costs associated with mishaps have not been finalized due to ongoing investigations and repairs associated to the mishaps. These costs may rise.
** Value of Statistical Life (VSL) $9.6 Million - U.S. Department of Transportation.Serious and Minor injuries are calculated as a fraction of VSL: 0.105 and 0.003, respectively
DOI Flight Usage CostCost associated with flight hours only
Annual flight
Usage Cost
Annual Flight
Hours
Cost per Flight
Hour
Fleet $ 6,578,156 14,653 $ 449
Contract $ 71,115,774 44,258 $ 1,607
Total Usage $ 77,693,930 58,911 $ 1,319
These rates are associated to pay item codes that correspond with flight hours only. They do not include monthly rates, availability, standby, etc…
Not included: an additional 606 Fleet aircraft flight hours flown by external use customers in FY18
Aviation Overview

FY18 DOI Annual Aviation Safety Summary Page 6
Department of the Interior Fleet Aircraft, Pilots, and Inspectors by State
Note: Fleet aircraft and pilots occasionally move their home base location. For the latest location information, call the Fleet Maintenance Manager in OAS-Technical Services at (208) 433-5082 for Lower 48, or at (907) 271-6104 in Alaska. Aircraft locations can be found at https://sites.google.com/a/ibc.doi.gov/aviation-resources/doi-fleet

FY18 DOI Annual Aviation Safety Summary Page 7
DOI Fleet Aircraft Inventory
DOI Fleet Aircraft: 93 (average age: 24 years old)
# of
AircraftType of Aircraft
1 Aerospatiale AS350
1 Aviat A-1B Husky
2 Beechcraft BE200 King Air
2 Bell 206 B-3
2 Bell 206 L-3
3 Bell 412
3 Cessna 182
14 Cessna 185
21 Cessna 206
20 Cub Crafters CC-18 Top Cub
2 DHC2 MK1 Beaver
1 DHC-6-300 Twin Otter
6 Found FBA 2C
2 Partenavia P-68 Observer
1 Pilatus PC-12
4 Piper PA-18 Super Cub
2 Quest Kodiak 100
6 Quest Kodiak 100 Amphibian
DOI Fleet Pilots: 96
Manned Aircraft Pilots: 82
Pilot: 19
Dual Function Pilot: 60
Pilot Trainee: 3
Inspector Pilots: 14
(1.02 pilots per manned aircraft)
Note: A pilot to aircraft ratio of at least 1.0 or
greater is desirable.
Fleet Aircraft Inspectors: 14
A low fleet diversity is desirable, due to savings in training and maintenance.

FY18 DOI Annual Aviation Safety Summary Page 8
FY18 Aviation Overview
BLMAnnual
Flight Hours
Annual flight
Usage Cost
Cost per
Flight Hour
Fleet 1,284 $ 1,219,714 $ 950
Contract 24,263 $47,908,458 $ 1,975
FY18 BLM Fleet Statistics
Manned Aircraft
Unmanned Aircraft
7
196
Manned Aircraft Age
0-10 Years
11-20 Years
> 20 Years
2
0
5
*Pilots
Dual Function Pilots
Trainee
sUAS Pilots
4
8
2
155
Manned Pilot-Aircraft Ratio
Unmanned Pilot-Aircraft Ratio
2.0
0.79
*BLM pilots fly commercial-owned governmentoperated (COGO) aircraft in addition to fleet aircraft.Dual Function Pilots: Pilots who also have another job.(Ex. Scientist)
BLM sUAS Flights 2018
Total
FlightsFleet: 3895 Contract: 15
Principal
Mission
Types
Pilot Proficiency/Training
Mapping-Non Fire
Reconnaissance
Mapping-Interagency Fire
Aircraft
Systems
Used
3DR Solo
Mavic
FireFly
Autel EVO
M600
Silent
Falcon
BLM has one of the highest SAFECOM completion rates in DOI for FY18 at 97% with 2 SAFECOM remaining open from 2014 to 2017. BLM’s manned aircraft SAFECOM reporting rate increased 12% from FY17, while the sUAS SAFECOM reporting rate increased 42% over FY17.
Aviation Mishaps = 2 Accidents, 2 Incidents with Potential (IWP)BLM manned aircraft flight hours increased 11% from FY17.
Total BLM sUAS flights increased 41% over FY17.
BIAAnnual Flight
Hours
Annual flight
Usage Cost
Cost per
Flight Hour
Contract 2,620 $4,117,890 $ 1,572
FY18 BIA Fleet Statistics
Unmanned Aircraft 8
sUAS Pilots 3
Unmanned Pilot-Aircraft Ratio 0.38
BIA sUAS Flights 2018
Total
Flights60
Principal
Mission
Types
Air Crew Training
Pilot Proficiency/Training
Mapping-Non Fire
Aircraft
Systems
Used
3DR Solo
BIA has the highest SAFECOM completion rate in DOI at 100% with 3SAFECOMs remaining open from 2014 to 2017. BIA’s manned aircraft SAFECOM reporting rate decreased 57% from FY17, while the sUAS
SAFECOM reporting rate remained unchanged from FY17.
BIA manned aircraft flight hours increased 13% from FY17.BIA did not have sUAS flights prior to FY18.
Flight hour, cost, and mission data are obtained from Aircraft Use Reports (AURs) submitted by the user. Costs (such as monthly rates and central bill costs) not associated with flight hours are not included.

FY18 DOI Annual Aviation Safety Summary Page 9
FY18 Aviation O
FY18 USBR Fleet Statistics
Unmanned Aircraft 26
sUAS Pilots 18
Unmanned Pilot-Aircraft Ratio 0.69
verview
BOEMAnnual Flight
Hours
Annual flight
Usage Cost
Cost per
Flight Hour
Fleet 116 $ 83,226 $ 715
Contract 466 $ 736,707 $ 1,582
No SAFECOMs were submitted by BOEM in FY17. No SAFECOMsremain open for the period between 2014 and 2017.
BOEM manned aircraft flight hours increased 6% from FY17.
BSEEAnnual Flight
Hours
Annual flight
Usage Cost
Cost per
Flight Hour
Contract 6,143 $ 6,939,218 $ 1,130
BSEE has one of the best SAFECOM completion rates in DOI at 96% with no SAFECOMs remaining open from 2014 to 2017. BSEE’s manned
aircraft SAFECOM reporting rate increased 23% from FY17.
BSEE manned aircraft flight hours decreased 18% from FY17.
USBRAnnual Flight
Hours
Annual flight
Usage Cost
Cost per
Flight Hour
Fleet 13 $ 11,560 $ 889
Contract 43 $ 62,704 $ 1,452
USBR sUAS Flights 2018
Total
Flights781
Principal
Mission
Types
Mapping-Non Fire
Pilot Proficiency/Training
Auto Surveyor
Reconnaissance
Air Crew Training
Aircraft
Systems
Used
3DR Solo
USBR has one of the lowest SAFECOM completion rates at 40% for FY18, with 4 SAFECOMs remaining open from 2014 to 2017. BOR’s
manned aircraft reporting rate suffered a 100% decline over the previous year, while the sUAS SAFECOM reporting rate decreased
47% from FY17.
USBR manned aircraft flight hours decreased 72% from FY17.Total USBR sUAS flights increased 135% over FY17.
Flight hour, cost, and mission data are obtained from Aircraft Use Reports (AURs) submitted by the user. Costs (such as monthly rates and central bill costs) not associated with flight hours are not included.

FY18 DOI Annual Aviation Safety Summary Page 10
FY18 Aviation Overview
FWSAnnual Flight
Hours
Annual flight
Usage Cost
Cost per
Flight Hour
Fleet 8,015 $ 2,608,817 $ 325
Contract 1,305 $ 827,184 $ 634
FY18 FWS Fleet Statistics
Manned Aircraft
Unmanned Aircraft
53
109
Manned Aircraft Age
0-10 Years
11-20 Years
> 20 Years
24
9
20
Pilots
Dual Function Pilots
sUAS Pilots
6
33
47
Manned Pilot-Aircraft Ratio
Unmanned Pilot-Aircraft Ratio
0.74
0.43
FWS sUAS Flights 2018
Total
Flights985
Principal
Mission
Types
Pilot Proficiency/Training
Mapping-Non Fire
Wildlife Surveys
Habitat/Environmental
Evaluations
Law Enforcement
Reconnaissance
Aircraft
Systems
Used
3DR Solo
FireFly
FWS has a SAFECOM completion rate of 87% with no SAFECOMs remaining open from 2014 to 2017. FWS’s manned aircraft
SAFECOM reporting rate decreased 1% from FY17, while the sUASSAFECOM reporting rate decreased 94% from FY17.
FWS manned aircraft flight hours decreased 17% from FY17.Total FWS sUAS flights increased 804% over FY17.
NPSAnnual Flight
Hours
Annual flight
Usage Cost
Cost per
Flight Hour
Fleet 4,719 $ 2,417,344 $ 512
Contract 7,893 $ 9,401,951 $ 1,191
FY18 NPS Fleet Statistics
Manned Aircraft
Unmanned Aircraft
31
23
Manned Aircraft Age
0-10 Years
11-20 Years
> 20 Years
6
6
19
Pilots
Dual Function Pilots
Trainee
sUAS Pilots
9
18
1
27
Manned Pilot-Aircraft Ratio
Unmanned Pilot-Aircraft Ratio
0.9
1.17
NPS sUAS Flights 2018
Total
Flights446
Principal
Mission
Types
Pilot Proficiency/Training
Mapping-Non Fire
Reconnaissance
Habitat/Environmental
Evaluations
Air Crew Training
Aircraft
System
Used
3DR Solo
NPS has a SAFECOM completion rate of 98% with 25 SAFECOMsremaining open from 2014 to 2017. NPS’s manned aircraft
SAFECOM reporting rate decreased 26% from FY17, while the sUAS SAFECOM reporting rate decreased 68% from FY17.
Aviation Mishaps = 1 Accident, 1 Incident with Potential (IWP)NPS manned aircraft flight hours increased 14% from FY17.
Total NPS sUAS flights increased 57% over FY17.
Flight hour, cost, and mission data are obtained from Aircraft Use Reports (AURs) submitted by the user. Costs (such as monthly rates and central bill costs) not associated with flight hours are not included.

FY18 DOI Annual Aviation Safety Summary Page 11
FY18 Aviation Overview
OSMREAnnual Flight
Hours
Annual flight
Usage Cost
Cost per
Flight Hour
Contract 21 $ 10,550 $ 500
FY18 OSMRE Fleet Statistics
Unmanned Aircraft 15
sUAS Pilots 24
Unmanned Pilot-Aircraft Ratio 1.6
OSMRE sUAS Flights 2018
Total
Flights119
Principal
Mission
Types
Pilot Proficiency/Training
Mapping-Non Fire
Air Crew Training
Aircraft
System
Used
3DR SoloOSMRE has a 0% completion rate for FY18. Their sUAS SAFECOM reporting rate increased 100% over FY17, while the manned aircraft reporting rate remained unchanged.
OSMRE manned aircraft flight hours have decreased 33% from FY17.
Total sUAS flights increased 38% over FY17.
Annual Flight
Hours
Annual flight
Usage Cost
Cost per
Flight Hour
Contract 35 $ 25,380 $ 734
No SAFECOMs were submitted by OST and none remain open from 2014-2017.
OST manned aircraft flight hours decreased 7% from FY17.
USGSAnnual Flight
Hours
Annual flight
Usage Cost
Cost per
Flight Hour
Fleet 62 $ 30,435 $ 494
Contract 1,458 $ 1,071,288 $ 735
FY18 USGS Fleet Statistics
Unmanned Aircraft 133
Dual Function Pilot
sUAS Pilots
1
89
Pilot to Aircraft Ratio 0.67
USGS sUAS Flights 2018
Total
Flights2,937
Principal
Mission
Types
Mapping-Non Fire
Pilot Proficiency/Training
Habitat/Environmental Eval
Reconnaissance
Wildlife Surveys
Aircraft
Systems
Used
3DR Solo
Mavic
M600
Firefly
Autel EVO
Pulse
Vapor 55
Eval Aircraft
MLB
Superbat
USGS closed out FY18 with a 100% completion rate. 2 SAFECOMs remain open from 2014 to 2017. The USGS manned aircraft
SAFECOM reporting rate increased 281% from FY17, while the sUASSAFECOM reporting rate decreased 37% from FY17.
Aviation Mishaps = 1 Incident with Potential (IWP)USGS manned aircraft flight hours increased 5% from FY17.
Total USGS sUAS flights increased 171% over FY17.
Flight hour, cost, and mission data are obtained from Aircraft Use Reports (AURs) submitted by the user. Costs (such as monthly rates and central bill costs) not associated with flight hours are not included.

FY18 DOI Annual Aviation Safety Summary Page 12
FY18 Aviation Overview
OASAnnual
Flight Hours
Annual flight
Usage Cost
Cost per
Flight Hour
Fleet 445 $ 207,061 $ 466
Contract 13 $ 14,445 $ 1,139
FY18 OAS Fleet Statistics
Manned Aircraft
Unmanned Aircraft
2
21
Manned Aircraft Age
0-10 Years
11-20 Years
> 20 Years
0
0
2
Inspector Pilots
sUAS Pilots
14
11
Manned Pilot-Aircraft Ratio
Unmanned Pilot-Aircraft Ratio
6.5
0.67
OAS sUAS Flights 2018
Total
Flights722
Principal
Mission
Types
Reconnaissance
PSD Aerial Ignition
Pilot Proficiency/Training
Mapping - NonFire
Habitat/Environmental Eval
Aircraft
Systems
Used
M600
3DR Solo
Mavic
FireFly
Evaluation
Aircraft
Autel EVO
OAS has a SAFECOM completion rate of 78% with no SAFECOMs remaining open from 2014 to 2017. OAS’s manned aircraft SAFECOM reporting rate decreased 17% from FY17, while the sUAS SAFECOM
reporting rate decreased 57% from FY17.
OAS manned aircraft flight hours decreased 9% from FY17.Total number of OAS sUAS flights increased 135% over FY17.
Office of Aviation Services
PERFORMANCE
Performance Quantity
Interagency Safety Communications Issued 16
Program Evaluations completed 8
Student Hours of Training completed 119,059
Fleet Pilot Evaluations completed 135
Fleet Aircraft Inspections completed 82
Fleet Maintenance facilities inspections completed 1
UAS Operator Individual Inspections 621
UAS Pilots Qualified by OAS 205
Commercial Pilot Evaluations 2,071
Commercial Aircraft Inspections 1,111
Point to Point Inspections 585
Fuel Service Vehicle Inspections 373
Cooperator Approvals 128
Flight hour, cost, and mission data are obtained from Aircraft Use Reports (AURs) submitted by the user. Costs (such as monthly rates and central bill costs) not associated with flight hours are not included.
FY18 DOI Annual Aviation Safety Summary Page 13
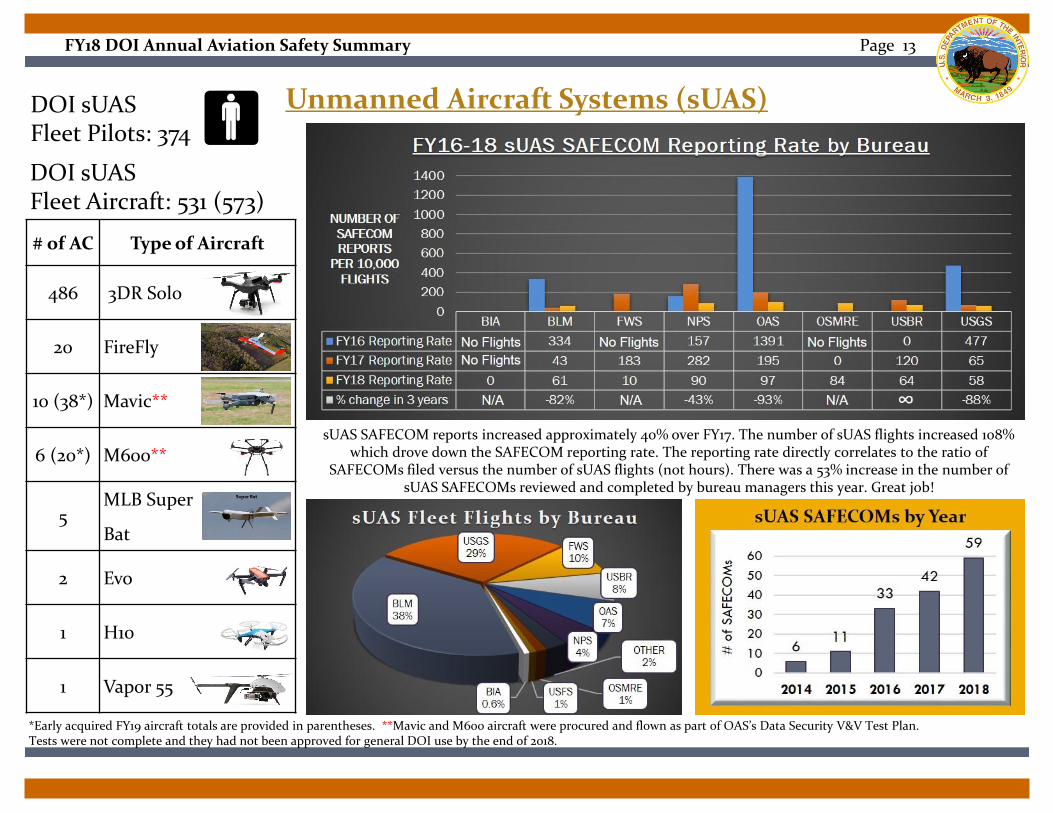
Unmanned Aircraft Systems (sUAS)DOI sUASFleet Pilots: 374
DOI sUASFleet Aircraft: 531 (573)
# of AC Type of Aircraft
486 3DR Solo
20 FireFly
10 (38*) Mavic**
6 (20*) M600**
5MLB Super
Bat
2 Evo
1 H10
1 Vapor 55
*Early acquired FY19 aircraft totals are provided in parentheses. **Mavic and M600 aircraft were procured and flown as part of OAS’s Data Security V&V Test Plan. Tests were not complete and they had not been approved for general DOI use by the end of 2018.
sUAS SAFECOM reports increased approximately 40% over FY17. The number of sUAS flights increased 108% which drove down the SAFECOM reporting rate. The reporting rate directly correlates to the ratio of
SAFECOMs filed versus the number of sUAS flights (not hours). There was a 53% increase in the number of sUAS SAFECOMs reviewed and completed by bureau managers this year. Great job!

FY18 DOI Annual Aviation Safety Summary Page 14
FY18 UAS Program Update
Policy & Assurance
Where We’ve Been
The DOI UAS program began in 2006. In 2008, DOI acquired surplus DOD small UAS to conduct operational test and evaluation flights in support of requirements development. The Department utilized these aircraft for several years during the initial phases of the program. While useful in some cases, it became readily apparent the excess DOD aircraft/sensors did not meet the mission requirements for the DOI bureaus. This led DOI to search for consumer off the shelf solutions that would better suit DOI operational needs. In 2014, the department selected the 3DR Solo aircraft for purchase. This aircraft was widely adopted by the bureaus and presently accounts for 85% of the DOI fleet. Simultaneous to the selection of the 3DR solo, the FAA released 14CFR Part 107 which allowed for much easier access to airspace for commercial use of UAS. These factors led to explosive growth in the DOI program between 2017 and 2018.
2018 Program HighlightsIn 2018, the DOI UAS program continued its tradition of innovation, collaboration, and leadership in drone space. Adoption and integration of UAS in missions by DOI bureaus continued to grow with 10,342 UAS flights conducted across more than 25 mission applications in 42 States and U.S. Territories in 2018; a 108% increase in DOI UAS flights over 2017’s record setting year.
The number of Interior owned UAS and Interior and FAA trained and certified operators also grew to meet the increasing bureau demand for UAS in 2018 with 531 drones and 359 active operators distributed across 37 States and seven of Interior’s nine bureaus.
A couple highlights from 2018 include:
• DOI UAS Teams Quickly Respond to Support Kilauea Volcano EmergencyResponse, Rescue, and Monitoring –DOI teams of UAS operators fromUSGS, BLM and OAS rapidly deployed and provided extended support forthe monitoring of the Kilauea Volcano eruptions in Hawaii. The UASteams monitored volcanic activity using thermal video imagery and on-board gas sensors, able to provide never before acquired data. In addition,the Interior UAS team assisted the local county and fire emergencymanagers in support of monitoring lava movement and on May 27th wereinstrumental in directing the rescue of a stranded resident from fast-moving lava that had rapidly inundated their neighborhood.
• DOI Conducts Operational Testing and Fielding of Groundbreaking UASAerial Ignition Capability – Continuing development that began in 2016,Interior conducted operational testing and initial fielding of the first-everdrone based aerial ignition capability, including the first-ever night aerialignition ability. Aerial ignition is an important tool in the reduction ofhazardous fuels ahead of the fire year and in conducting burnoutoperations during a wildfire. Traditional aerial ignition methods oftenpose significant risk and have resulted in numerous fatalities. Drones offersafer ignition operations and expanded utilization opportunities.
Where We Are HeadedDOI is in the process of selecting several new platforms for use by the bureaus. All new platforms will be selected utilizing the DOI’s master UAS requirements specifications. The DOI fleet will continue to grow during the next several years in both size and scope. One of the biggest changes in the near future will be the increase in the use of cloud processing and artificial intelligence to increase the speed in which data can be turned into useful information and that information into actionable knowledge.
FY18 DOI Annual Aviation Safety Summary Page 15
FY18 Safety & Training Updates
OAS Training Division Update
IAT.GOV
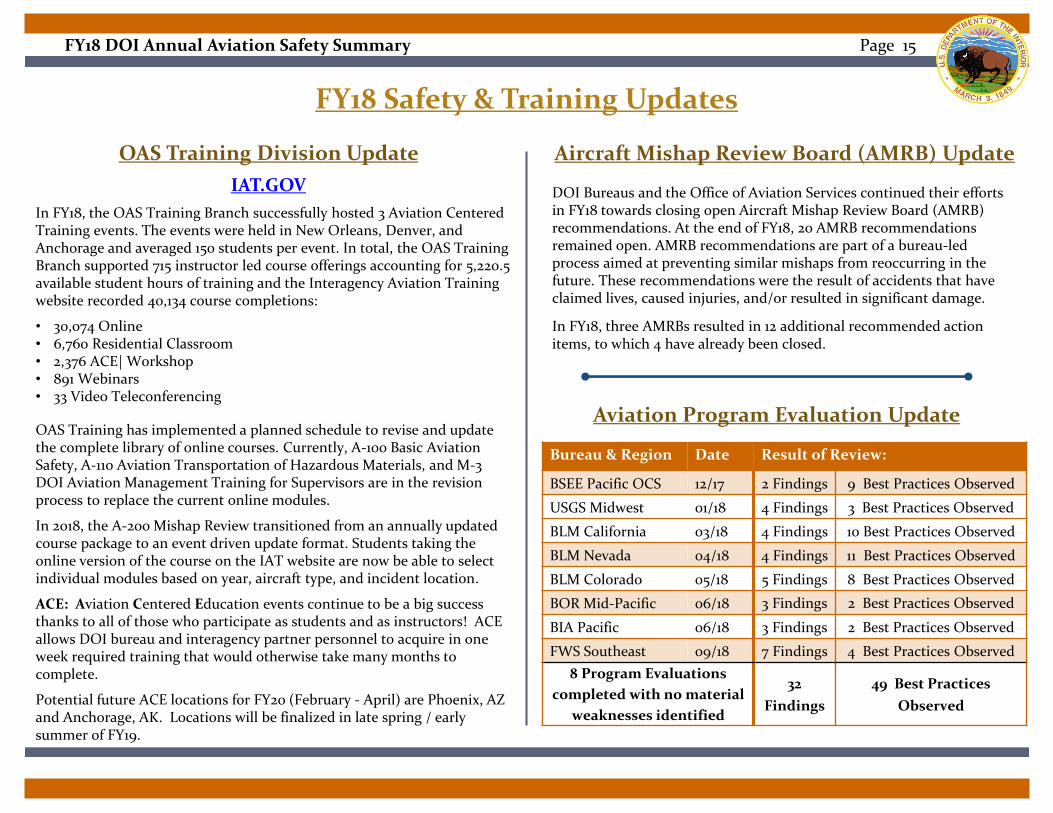
In FY18, the OAS Training Branch successfully hosted 3 Aviation Centered Training events. The events were held in New Orleans, Denver, and Anchorage and averaged 150 students per event. In total, the OAS Training Branch supported 715 instructor led course offerings accounting for 5,220.5 available student hours of training and the Interagency Aviation Training website recorded 40,134 course completions:
• 30,074 Online• 6,760 Residential Classroom• 2,376 ACE| Workshop• 891 Webinars• 33 Video Teleconferencing
OAS Training has implemented a planned schedule to revise and update the complete library of online courses. Currently, A-100 Basic Aviation Safety, A-110 Aviation Transportation of Hazardous Materials, and M-3 DOI Aviation Management Training for Supervisors are in the revision process to replace the current online modules.
In 2018, the A-200 Mishap Review transitioned from an annually updated course package to an event driven update format. Students taking the online version of the course on the IAT website are now be able to select individual modules based on year, aircraft type, and incident location.
ACE: Aviation Centered Education events continue to be a big success thanks to all of those who participate as students and as instructors! ACE allows DOI bureau and interagency partner personnel to acquire in one week required training that would otherwise take many months to complete.
Potential future ACE locations for FY20 (February - April) are Phoenix, AZ and Anchorage, AK. Locations will be finalized in late spring / early summer of FY19.
Aircraft Mishap Review Board (AMRB) Update
DOI Bureaus and the Office of Aviation Services continued their efforts in FY18 towards closing open Aircraft Mishap Review Board (AMRB) recommendations. At the end of FY18, 20 AMRB recommendations remained open. AMRB recommendations are part of a bureau-led process aimed at preventing similar mishaps from reoccurring in the future. These recommendations were the result of accidents that have claimed lives, caused injuries, and/or resulted in significant damage.
In FY18, three AMRBs resulted in 12 additional recommended action items, to which 4 have already been closed.
Aviation Program Evaluation Update
Bureau & Region Date Result of Review:
BSEE Pacific OCS 12/17 2 Findings 9 Best Practices Observed
USGS Midwest 01/18 4 Findings 3 Best Practices Observed
BLM California 03/18 4 Findings 10 Best Practices Observed
BLM Nevada 04/18 4 Findings 11 Best Practices Observed
BLM Colorado 05/18 5 Findings 8 Best Practices Observed
BOR Mid-Pacific 06/18 3 Findings 2 Best Practices Observed
BIA Pacific 06/18 3 Findings 2 Best Practices Observed
FWS Southeast 09/18 7 Findings 4 Best Practices Observed
8 Program Evaluations
completed with no material
weaknesses identified
32
Findings
49 Best Practices
Observed

FY18 DOI Annual Aviation Safety Summary Page 16
First-Ever Interagency Aviation Helmet Standard Promotes Safety and Industry Innovation
The rollout of the Interagency Aviation Helmet Standard was the culmination of a lengthy collaborative process involving experts from both
government and private industry. It wasn’t too long ago that adopting the military’s equipment was the only option for our aviation
operations, which greatly limited industry’s ability to enter this market. We relied on Personal Protective Equipment (PPE) the military
developed for their crewmembers.
Many of us who used the old equipment still remember the cranial “hotspots” the old
suspension system caused.
Today, we have a vastly different environment where there are a myriad of helmet manufacturers
and models to chose from. Unfortunately, some of these helmets offer varying degrees of
protection to which the consumer has little basis for judging the relative effectiveness of
any given model.
Some of the helmets we have seen in the field have been made with surplus and often
obsolete parts, others are state of the art.
Aviation helmets provide multiple levels of protection and need to be evaluated for many
properties including (but not limited to) crown and side impact, sound attenuation,
retention, and weight. Outside of the military, the flight helmet world lacked a meaningful,
relevant performance standard…until now. OAS has contracted with a recognized helmet
expert to provide technical and scientific expertise to develop a civil flight helmet
performance standard.
This Standard presents a rational means for differentiating between helmets which meet specified standards for impact protection and
retention system effectiveness and those which do not. Additionally, the requirement of modern testing methodologies and validation through
updated accredited laboratories provide the assurance the helmet will perform when it’s needed most.
The DOI/USFS Aviation Helmets Standard Specification provides a first-ever avenue to allow non-military helmets to be considered for
acquisition within our aviation communities through their respective procurement channels. Both manufacturers and distributors can
test their helmets using an ISO certified laboratory to the DOI/USFS Aviation Helmet Standards. Those meeting or exceeding these standards
can be issued a certificate of compliance by the laboratory. These helmets will be identified by the manufacturer and model type on the OAS
website (www.doi.gov/aviation/safety/helmet) within 30 days of receiving the certificate.

FY18 DOI Annual Aviation Safety Summary Page 17
Risk Management
FY18 SAFECOM Overview
Well-represented
Hazards include:
Pilot Action
Mission Equipment
Pre-flight Action
Policy Deviation
Communications
Instructions
Top Maintenance
Issues:
Avionics
Engine
Airframe
Electrical
Chip Light
Mission Equipment
Using the SAFECOM system for punitive actions is prohibited
(352 DM 3.10B).
Submitting a SAFECOM is not a substitute for "on-the-spot"
corrections to a safety concer. It’s a tool used to identify, document, track, and correct safety related
issues.
A SAFECOM does not replace the requirement for initiating an accident or incident report.
SAFECOM.gov
BureauPercentage of
SAFECOM’s Submitted
BLM 37%
BSEE 33%
NPS 11%
FWS 6%
USGS 5%
BIA 4%
OAS 2%
BOR 1%
OSM <1%
BOEM 0%

FY18 DOI Annual Aviation Safety Summary Page 18
FY18 SAFECOM Overview
Chart 1 –Mishap prevention efforts are more effective when reporting rates are high, as you only know what’s being reported. USGS’ FY18 mishap rate is relatively high, partially due to their lower flight hours. In FY18, BSEE had the highest reporting rate, submitting one SAFECOM for every 48 hours flown.
Chart 2 – Three Bureaus (BIA, NPS, and USGS) finished the year with 100% of SAFECOMs completed by Bureau Management. Overall, the DOI SAFECOM completion rate increased by 4% over the previous year. Conversely, the SAFECOM reporting rate decreased over 2% this year.
Chart 3 – We continue to see an inverse correlation between SAFECOM reporting and DOI’s accident rate. SAFECOM reporting for the period between2009 and 2018 has increased 40% while the accident rate has decreased by 8%.
NOTE: The data above does NOT include sUAS SAFECOM reporting statistics. That information can be found on page 13 of this report.

FY18 DOI Annual Aviation Safety Summary Page 19
SAFECOM Trends
Between FY16 and FY18, the Department of the Interior’s SAFECOM Reporting Rate has decreased by 16% while the accident rate has
increased by 49%. As demonstrated on slide 3 of the previous page, as reporting goes up, accidents go down. The opposite is also true.
Lower SAFECOM reporting rates could mean that managers may not know what hazards aren’t being reported. The SAFECOM system
remains an essential tool in our continued efforts to reduce aviation mishaps by applying lessons learned from less serious incidents. In order to maintain a culture that balances safety and accountability,
DOI continues to depend on input from aviation users.
If you see something, say something.
NOTE: The data above does NOT include sUAS SAFECOM reporting statistics. That information can be found on page 13 of this report.

FY18 DOI Annual Aviation Safety Summary Page 20
Promotions and Achievements
FY18 Awards and Achievements
In-Flight Action Award
Lynn Ellis National Park Service
Andy Hermansky National Park Service
Terry Liddick U.S. Fish and Wildlife Service
Airward
Scott Beck Bureau of Land Management
Greg Burch Bureau of Land Management
Kyle Beinschroth Bureau of Land Management
Rick Gicla (USFS) Bureau of Indian Affairs
Cannon Mix (OAS) U.S. Geological Survey
Mark Oberman National Park Service
Safe Flying - Award of Honor
20 years or 7,500 hours
This award is restricted to DOI employees who have distinguished themselves by safe flying for the period
considered.
Kenneth Burchell National Park Service
Award for Significant Contribution to Aviation Safety
This award is established to recognize an individual, group, or organization for outstanding contribution to aviation safety or
aircraft accident prevention.
Scott Bishaw U.S. Fish and Wildlife Service
Jim Traub National Park Service

FY18 DOI Annual Aviation Safety Summary Page 21
FY18 Awards and Achievements
Departmental Award for Outstanding Contribution to Aviation Safety
This award is established to recognize an individual,
group, or organization for outstanding contribution to
aviation safety or aircraft accident prevention.
This year’s Departmental Award recipients were members of a Multi-Bureau Unmanned Aircraft Systems Response Team. This team is recognized for their outstanding leadership and technical contributions to the Aviation Safety
Program of the Department of the Interior (DOI) in support of the 2018 Mount Kilauea volcanic activity.
USGS OAS BLM
Seth Ackerman James Foreman Erich Peitzsch Brad Koeckeritz Gary Baumgartner
Josip Adams Amy Gilmer Elizabeth Pendleton Colin Milone Bobby Eisele
Mark Bauer Shawn Harrison Tobyn Rhodes Steve Ramaekers
Brad Bickford Steve Hartley Jeff Sloan Steve Stroud
Sandy Brosnahan Rogelio Hernandez Kevin Smith Richard Thurau
Todd Burton Shelby Hunter Matthew Struckhoff John Vogel
Geoff Debendetto Bill Jones Emily Sturdivant
Angie Diefenbach Cameron Marshall Ryan Thompson
Frank Engel Timothy McKinney Ken Tiffan
Brandon Forbes Christopher Holmquist-Johnson

FY18 DOI Annual Aviation Safety Summary Page 22
DOI Accident Free Pilots
Abate, Mike Lindley, Jonathan
Eavasick, Ryan Perkins, Christopher
Haapapuro, Eric Wright, Keaton
Bureau of LandManagement
Allen, Lisa McCormick, Bob
Bell, Don Meierotto, Marty
Gusse, Walker Pearson, Craig
House, Greg Smyth, Scott
Lenmark, Paul Warbis, Rusty
Mascheroni, Andrew
Office of Aviation Services
Bannister, Gene James, William
Castillo, James Kearney, Patrick
Curtis, Scott Kopczynski, Jim
Englert, Rich Miller, Arlyn
Flack, Andy Pena, Terry
Fowler, Dale Wittkop, Jim
Howell, Gil
U.S. Fish and Wildlife Service
Anderson, Anna Koneff, Mark Scotton, Brad
Bayless, Shawn Liddick, Terry Shelden, Dan
Bosch, Brandon Lubinski, Brian Shults, Brad
Daniels, Chris Mallek, Ed Spangler, Robert
Earsom, Stephen Mullin, Brian Sundown, Robert
Greeley, Chris Olson, Nate Thorpe, Phil
Greil, Thomas Pepin, Dan Twitchell, Hollis
Guldager, Nikolinda Rayfield, John VanHatten, Kevin
Hamilton, Clay Rees, Kurt Wade, Mike
Hilwig, Kara Rhodes, Walt Wortham, James
Kadrmas, Neil Rippeto, Dave Yates, Sarah
U.S. Geological Survey
Heywood, Charles
National Park Service
Babcock, Jeff Howell, Galen
Bell, Steven Hummel, James
Capra, Jim Larsen, Amy
Cebulski, Curtis Nigus, Brett
Dolan, Richard Richotte, Rich
Drum, Gregory Sample, Scott
Enzfelder, Glen Stevenson, Dan
Goodwin, Fred Taylor, Scott
Grenda, Adam Thompson, Nick
Hamon, Troy Welty, Don
U.S. Park Police
FY18 DOI Annual Aviation Safety Summary Page 23
FY18 Safety Improvement Opportunities
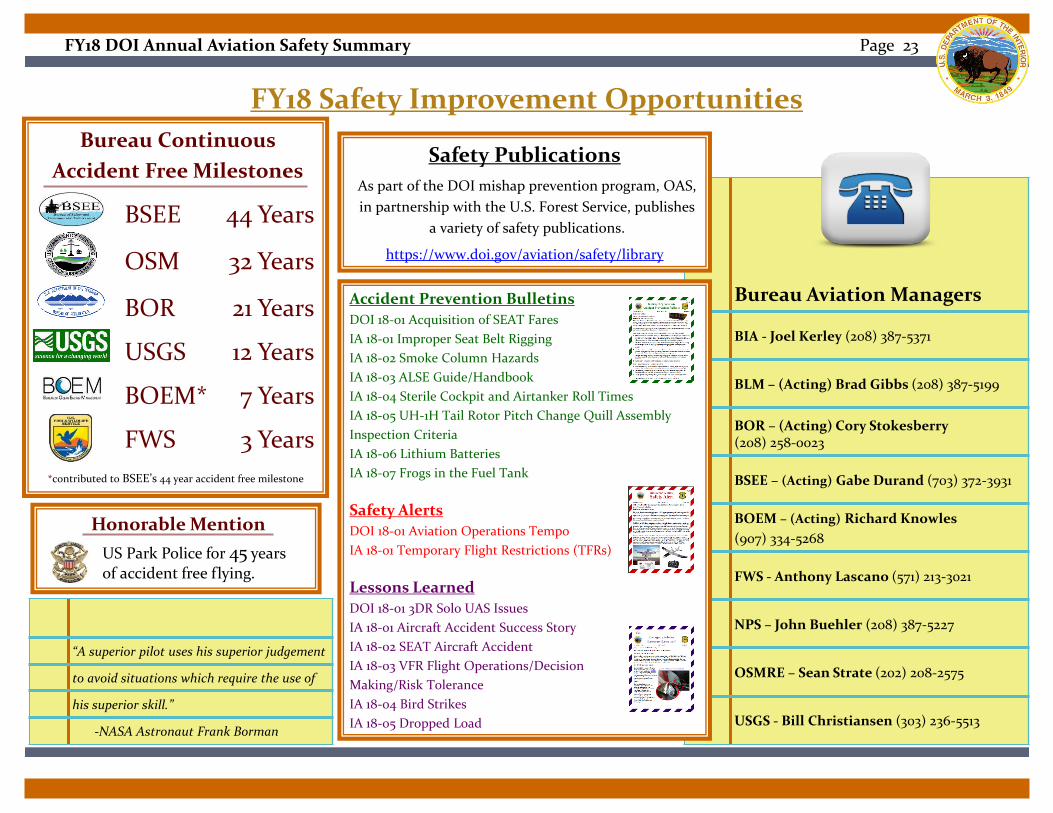
Bureau Continuous
Accident Free Milestones
BSEE 44 Years
OSM 32 Years
BOR 21 Years
USGS 12 Years
BOEM* 7 Years
FWS 3 Years
*contributed to BSEE’s 44 year accident free milestone
Honorable Mention
US Park Police for 45 years of accident free flying.
“A superior pilot uses his superior judgement
to avoid situations which require the use of
his superior skill.”
-NASA Astronaut Frank Borman
Bureau Aviation Managers
BIA - Joel Kerley (208) 387-5371
BLM – (Acting) Brad Gibbs (208) 387-5199
BOR – (Acting) Cory Stokesberry (208) 258-0023
BSEE – (Acting) Gabe Durand (703) 372-3931
BOEM – (Acting) Richard Knowles
(907) 334-5268
FWS - Anthony Lascano (571) 213-3021
NPS – John Buehler (208) 387-5227
OSMRE – Sean Strate (202) 208-2575
USGS - Bill Christiansen (303) 236-5513
Safety Publications
As part of the DOI mishap prevention program, OAS,
in partnership with the U.S. Forest Service, publishes
a variety of safety publications.
https://www.doi.gov/aviation/safety/library
Accident Prevention Bulletins
DOI 18-01 Acquisition of SEAT Fares
IA 18-01 Improper Seat Belt Rigging
IA 18-02 Smoke Column Hazards
IA 18-03 ALSE Guide/Handbook
IA 18-04 Sterile Cockpit and Airtanker Roll Times
IA 18-05 UH-1H Tail Rotor Pitch Change Quill Assembly
Inspection Criteria
IA 18-06 Lithium Batteries
IA 18-07 Frogs in the Fuel Tank
Safety Alerts
DOI 18-01 Aviation Operations Tempo
IA 18-01 Temporary Flight Restrictions (TFRs)
Lessons Learned
DOI 18-01 3DR Solo UAS Issues
IA 18-01 Aircraft Accident Success Story
IA 18-02 SEAT Aircraft Accident
IA 18-03 VFR Flight Operations/Decision
Making/Risk Tolerance
IA 18-04 Bird Strikes
IA 18-05 Dropped Load

FY18 DOI Annual Aviation Safety Summary Page 24
Executive SummaryTake Away Sheet
3 Accidents and 4 Incidents with Potential
Annual Flight
Usage Cost
Annual Flight
Hours
Cost per Flight
Hour
Fleet $6,578,156 14,651 $449
Contract $71,115,774 44,258 $1,607
Total Usage $77,693,930 58,911 $1,319
POLICY: In FY18, three AMRBs resulted in 12 additional recommended action items, to which 4 have already been closed. As of today, 26 AMRB recommendations remain open.
POLICY: OAS has developed a modern, cost effectivecivilian aviation performance helmet standard. The DOI/USFS Standard presents a rational means for differentiating between helmets which meet specified standards for impact protection and retention system effectiveness and those which do not.
RISK MANAGEMENT: The SAFECOM system remains an essential tool in our continued efforts to reduce aviation mishaps. Over the last two years, the DOI manned aircraft SAFECOM reporting rate has declined by 16% while the accident rate has increased 49%.
ASSURANCE: In FY18, 8 Program Evaluations were completed among 6 bureaus with no material weaknesses found. These evaluations resulted in 32 findings and a total of 49 best practices observed.
ASSURANCE: The 108% increase in sUAS flights over FY17 outpaced the 40% increase in sUAS SAFECOMs reported in FY18. As a result, the overall sUAS SAFECOM reporting rate decreased this year.
PROMOTION: FY18 award nominations came from 5 different bureaus/offices. FY18 awards included 2 Awards for Significant Contribution to Aviation Safety, 2 In-Flight Action Awards, 6 Airwards, and 1 Safe Flying Award. The FY18 Departmental Award for Outstanding Contribution to Aviation Safety was awarded to a Multi-Bureau UAS Response Team who supported the Kilauea Volcano Activity in May 2018.
PROMOTION: Bureaus maintaining excellence in aviation safety through their continuous accident-free years record include: BSEE-44 years (manned aircraft reporting rate-2068), OSM-32 years (sUAS reporting rate-168), BOR-21 years (sUAS reporting rate-64), USGS-12 years (manned aircraft reporting rate-263), BOEM-7 years (manned aircraft and sUASreporting rate-0), and FWS-3 years (manned aircraft reporting rate-236). US Park Police is to be commended for their 45 continuous accident-free years.
Keith Raley - Chief, Aviation Safety, Training, Program Evaluations and Quality Management, OAS - (208) 433-5071 Monique Way - Aviation Safety Data Analyst, OAS - (208) 433-5070