Embed Size (px)
Citation preview

FiscalYear
2021Final
RevisedBudget

Final Revised Budget for the Fiscal Year
July 1, 2020 – June 30, 2021
Mayor Lee Brand
City Council Esmeralda Soria - District 1
Mike Karbassi - District 2 Miguel Arias, Council President - District 3
Paul Caprioglio - District 4 Luis Chavez - District 5
Garry Bredefeld - District 6 Nelson Esparza - District 7
City Manager Wilma Quan
City Attorney Douglas T. Sloan
City Clerk Yvonne Spence
Executive Management Team Jane Sumpter - Assistant City Manager
Jim Schaad - Assistant City Manager Kevin Meikle - Aviation Director
Michael Lima - City Controller / Finance Director Kerri Donis - Fire Chief
Bryon Horn - Information Services Director TJ Miller - Parks, After School, Recreation and Community Services Director
Jeffrey Cardell - Personnel Services Director Jennifer Clark - Planning and Development Services Director
Andy Hall - Police Chief Michael Carbajal - Public Utilities Director
Scott Mozier - Public Works Director Gregory A. Barfield - Transportation Director
Budget Preparation Staff Henry Fierro, Budget Manager
Pedro Rivera, Principal Budget Analyst Scott Motsenbocker, Principal Budget Analyst
Alma Torres, Principal Budget Analyst Todd Stermer, Senior Budget Analyst
Michelle Wooten, Senior Budget Analyst Alyse Muniz, Budget Technician
CCiittyy ooff FFrreessnnoo,, CCaalliiffoorrnniiaa

Table of Contents
2020-2021 Table of Contents
Director’s Cover Page
CITYWIDE SUMMARY
City Organizational Chart .................................................................................................................... A-1
City Operating Fund Structure Chart .................................................................................................. A-2
Total City Resources ............................................................................................................................ A-3
Total City Appropriations .................................................................................................................... A-4
Appropriations Summary by Department/Primary Funding Source .................................................... A-5
Revenues Summary by Department/Primary Funding Source ............................................................ A-6
Revenues Summary by Fund Classification .......................................................................................... A-7
Appropriations Summary by Fund Classification ................................................................................. A-8
Appropriations Summary – FY 2021 by Operating, Capital and Debt Service. ..................................... A-9
Authorized Position Detail ................................................................................................................. A-11
Authorized Position Changes ............................................................................................................. A-13
Debt Obligations Summary ............................................................................................................... A-15
Measure C Extension Revenue & History ............................................................................................ A-17
New Citywide Lease Purchases for FY 2021 ....................................................................................... A-18
FY 2020-2021 Federal Entitlement Funding ...................................................................................... A-19
Combined Fund Summary ................................................................................................................. A-27
GENERAL FUND SUMMARY
FY 2020-2021 General Fund Overview and Five Year Forecast ........................................................... A-37
General Fund Debt Service.................................................................................................................A-54
DEPARTMENT SUMMARIES
Office of the Mayor and City Manager ................................................................................................. B-1
City Council ......................................................................................................................................... B-9
Airports Department .......................................................................................................................... B-19
City Attorney’s Office ........................................................................................................................ B-27
City Clerk’s Office .............................................................................................................................. B-35
Convention Center and Stadium Department .................................................................................... B-43
Finance Department .......................................................................................................................... B-53
Fire Department ................................................................................................................................ B-61
General City Purpose Department ..................................................................................................... B-71
Information Services Department ..................................................................................................... B-81
Parks, After School, Recreation & Community Services Department .................................................B-89
Personnel Services Department ...................................................................................................... B-101

2020-2021 Table of Contents
Planning and Development Services Department ............................................................................ B-109
Police Department ........................................................................................................................... B-123
Public Utilities Department .............................................................................................................. B-133
Public Works Department ................................................................................................................ B-147
Transportation/FAX Department ..................................................................................................... B-159
CAPITAL IMPROVEMENT PROGRAM
Capital Improvement Program............................................................................................................. C-1
Capital User’s Guide and Glossary ...................................................................................................... C-14
Department Capital Summary ........................................................................................................... C-15
Capital Improvement Projects Fund Legend ...................................................................................... C-17
Capital Improvement Program by Department/Project ..................................................................... C-25
Capital Improvement Program by Department/Fund/Project ............................................................ C-47

City Organizational Chart
City Clerk
Secretary to:City CouncilFresno Revitalization CorporationRecords ManagementAdministration
City Attorney
LitigationAdministrationTransactions Code Enforcement
Bus ServiceBus Repair/MaintenancePlanningAdministrationParatransitFleet Management
Acquisition & Maintenance Public Safety Fleet Division
Transportation(FAX)
Airports
FYI OperationsAirport Projects ManagementAirport Security & SafetyChandler Downtown AirportAdministration
CC managed by ASM GlobalStadium managed by Fresno Sports & Events LLCSporting EventConventionConcertsEmergency Shelter/Hosp Services
Convention Center and Stadium
CITY COUNCILMAYOR
LEE
BRAND
CouncilAssistants
CITIZENS OF
FRESNO
Parks, After School, Recreation &
Community Services
Park MaintenanceAfter School Programs RecreationCommunity CentersSenior ProgramsSportsWeekend Recreation and Fitness ProgramGraffiti
InformationServices
Computer ServicesSystems & Network SecurityHelp DeskSystems & Applications
ProgrammingCommunications311 Call Center
PersonnelServices
Recruitment & ExamJob & Salary AnalysisCivil Service BoardRisk ManagementTrainingLabor RelationsEmployee Benefits
Fire
Fire Suppression & Emergency ResponseHazMatPrevention & InvestigationTraining & SupportAdministration
Patrol & Crime SuppressionSpecial OperationsInvestigative ServicesAdministration
Public Works
Engineering ServicesStreet MaintenanceCapital Project ManagementTraffic Operations CenterADA Citywide ProgramTraffic Signals & StreetlightsPark MaintenanceFacilities ManagementUrban Growth ManagementCommunity RevitalizationSustainable Fresno
City Manager
Support Services for Mayor and Council
Citywide Project MgmtOffice of Independent ReviewEconomic DevelopmentBudget DevelopmentBudget MonitoringMaster Fee Schedule
Public Utilities
Water Production, Water Quality & Water DeliveryWastewater & Sewer
ManagementSolid Waste Services
Recycling Program Operation Clean Up Litter Control
AccountingFinancial Reporting/GrantsBusiness Tax/PermitsPurchasingCentral PrintingAdministrationInternal AuditUtility Billing & CollectionDBE Program
Planning & Development Services
PlanningBuilding & Safety InspectionDevelopment ReviewLocal Business InitiativesParking ServicesCDBG Monitoring & Administration
Retirement OfficeFresno Revitalization Corporation SupportIntergovernmental RelationsCitywide Resources and Appropriations
General City Purpose
Finance Police
FY 2020-2021 Final Revised Budget A - 1
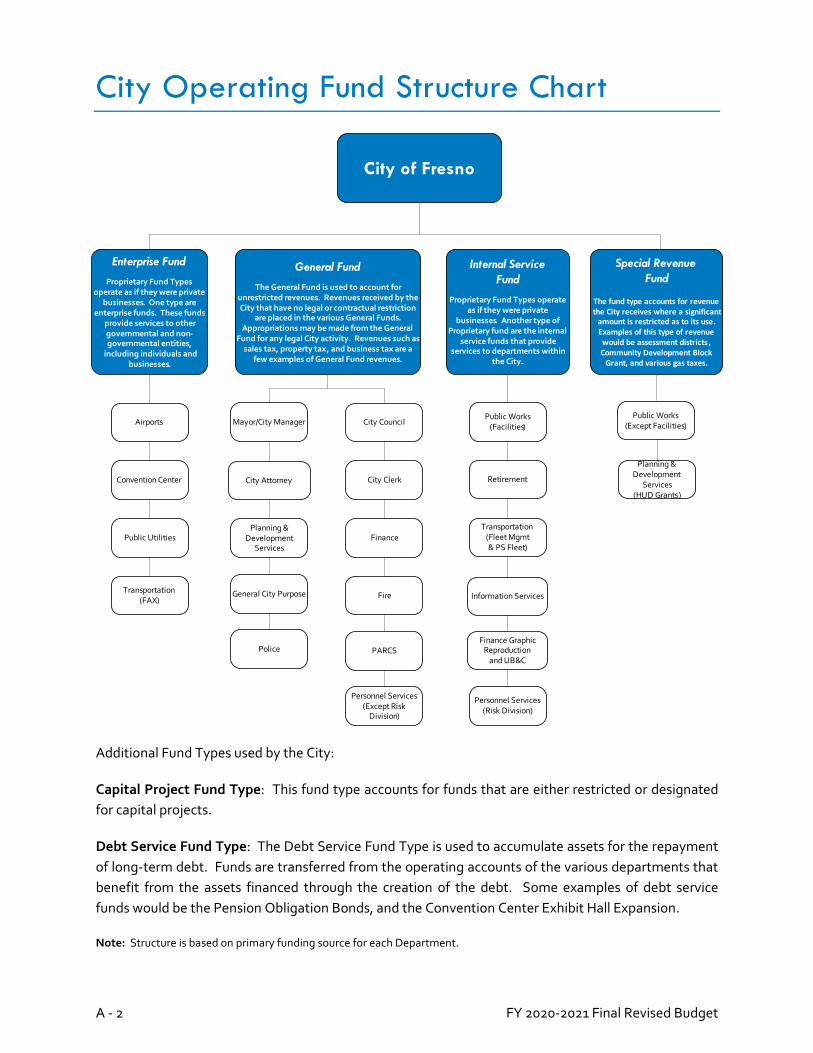
City Operating Fund Structure Chart
Additional Fund Types used by the City:
Capital Project Fund Type: This fund type accounts for funds that are either restricted or designated for capital projects.
Debt Service Fund Type: The Debt Service Fund Type is used to accumulate assets for the repayment of long-term debt. Funds are transferred from the operating accounts of the various departments that benefit from the assets financed through the creation of the debt. Some examples of debt service funds would be the Pension Obligation Bonds, and the Convention Center Exhibit Hall Expansion.
Note: Structure is based on primary funding source for each Department.
Enterprise Fund
Proprietary Fund Types operate as if they were private
businesses. One type are enterprise funds. These funds
provide services to other governmental and non-governmental entities,
including individuals and businesses.
City of Fresno
Internal ServiceFund
Proprietary Fund Types operate as if they were private
businesses. Another type of Proprietary fund are the internal
service funds that provide services to departments within
the City.
Airports
Transportation(FAX)
Finance
Fire
Personnel Services(Except Risk
Division)
City Clerk
Mayor/City Manager
Convention Center City Attorney
PARCS
Public Works(Facilities)
Planning & Development
Services
City Council
General Fund
The General Fund is used to account for unrestricted revenues. Revenues received by the City that have no legal or contractual restriction
are placed in the various General Funds. Appropriations may be made from the General
Fund for any legal City activity. Revenues such as sales tax, property tax, and business tax are a
few examples of General Fund revenues.
Police
Public Utilities
General City Purpose
Retirement
Special Revenue Fund
The fund type accounts for revenue the City receives where a significant
amount is restricted as to its use. Examples of this type of revenue would be assessment districts , Community Development Block
Grant, and various gas taxes.
Public Works(Except Facilities)
Transportation(Fleet Mgmt& PS Fleet)
Information Services
Planning & Development
Services(HUD Grants)
Finance Graphic Reproduction
and UB&C
Personnel Services (Risk Division)
A - 2 FY 2020-2021 Final Revised Budget

Total City Resources The total amount of money received by the City of Fresno in all appropriated funds is shown on this page. The total Net Resources amounts represent all the revenue available to pay for services and capital projects. It excludes interfund transfers, and interdepartmental charge revenue.
FY 2019 FY 2020 FY 2021 Percent Actuals Amended Final Change
Beginning Balance 385,730,900 512,321,300 447,116,300 (12.7)
Local Taxes Property Taxes 137,206,500 140,218,300 148,546,800 5.9 Sales Tax(1) 103,748,300 100,727,300 96,360,000 (4.3) Measure C(2) 26,703,200 29,600,900 32,903,200 11.2 Room Tax 14,113,000 14,429,600 10,203,900 (29.3) Real Estate Transfer Tax 1,669,600 1,362,600 1,632,100 19.8 Franchise Fees 14,943,700 16,422,600 16,339,400 (0.5)
Total Local Taxes 298,384,300 302,761,300 305,985,400 1.1
Licenses & Permits 28,337,400 27,455,200 28,413,600 3.5
Intergovernmental Federal(3) 44,296,100 116,884,400 263,828,100 125.7 State 64,261,700 88,133,900 90,459,800 2.6 Local 25,736,800 24,787,700 30,740,200 24.0
Total Intergovernmental 134,294,600 229,806,000 385,028,100 67.5
Charges for Current Services 329,316,100 327,381,800 320,532,400 (2.1) Fines 6,337,900 7,486,500 4,509,600 (39.8) Other Revenue 25,975,600 21,051,500 22,292,300 5.9 Interdepartmental Charges 104,780,300 140,876,400 132,585,900 (5.9) Miscellaneous(4) 61,075,200 59,685,600 87,058,700 45.9 Transfers 16,173,300 15,558,500 18,209,800 17.0
Total City Revenue 1,390,405,600 1,644,384,100 1,751,732,100 6.5
Less: Net Interfund Transfers 16,173,300 15,558,500 18,209,800 17.0 Less: Interdepartmental Charges 101,491,200 132,235,700 132,494,000 0.2
Total Net Resources 1,272,741,100 1,496,589,900 1,601,028,300 7.0 Note: (1) The FY 2019 Sales Tax revenue included a one-time $7.7 million entry. This entry corresponded to the August 2019 or 13th month revenue receipt. (2) Measure C revenues reflect anticipated revenue receipts consistent with Fresno County Transportation Authority approved projects.(3) Federal revenue increases reflects recognition of CARES Act funding by several departments. $79.6 million in the Finance Department, $32.5 in the Transportation Department, $13 million in Planning and Development and $8.1 million in the Airports Department.(4) Miscellaneous revenue includes $31 million Ibank bond proceeds related to the Airports FATForward parking garage project.
FY 2020-2021 Final Revised Budget A - 3

Total City Appropriations
APPROPRIATIONS BY CATEGORY The total budget for all appropriated funds within the City of Fresno is shown on this page. The amounts shown as Total Net City Budget represent the "net" budget after all interdepartmental charges are removed.
FY 2019 FY 2020 FY 2021 Percent Actuals Amended Final Change
Employee Services 347,103,400 386,703,000 409,540,800 5.9 Retirement Contribution 33,088,900 36,862,300 45,609,800 23.7 Pension Obligation Bonds 16,190,000 16,215,300 16,188,500 (0.2) Operations & Maintenance 293,394,300 431,937,000 479,409,800 11.0 Interdepartmental Charges 101,491,200 132,235,700 132,494,000 0.2 Minor Capital (Including Construction) 128,182,200 373,796,600 379,919,600 1.6 Contingencies 24,088,300 28,021,500 31,903,400 13.9
Total Appropriations 943,538,300 1,405,771,400 1,495,065,900 6.4
Less: Interdepartmental Charges 101,491,200 132,235,700 132,494,000 0.2 Total Net City Budget 842,047,100 1,273,535,700 1,362,571,900 7.0
A - 4 FY 2020-2021 Final Revised Budget

Appropriations Summary by Department/Primary Funding Source Including Operating, Capital & Debt Service
The total budget by Department and primary funding source is shown on this page. The amounts shown as total Net City Budget represent the "net" budget after all interdepartmental charges are removed.
Department FY 2019 Actuals
FY 2020 Amended
FY 2021 Final
% Change FY 2020 to
FY 2021 General Fund Departments Mayor/CMO 4,104,300 19,528,800 5,042,800 (74.2) Council 3,243,300 5,521,200 5,170,400 (6.4) Police 178,522,300 202,961,300 210,274,600 3.6 Fire 71,121,400 78,431,600 76,563,000 (2.4) Parks, After School, Recreation & Community Services 21,369,200 33,009,700 40,686,200 23.3 General City Purpose 42,490,200 57,627,700 53,645,100 (6.9)
Finance 6,740,700 21,760,000 43,016,700 97.7 City Clerk 869,100 969,100 1,455,900 50.2 City Attorney 6,339,600 16,759,200 20,326,300 21.3 Personnel Services 33,790,000 39,200,000 43,991,300 12.2 Planning & Development Services 43,486,600 48,917,800 81,930,400 67.5
Subtotal 412,076,700 524,686,400 582,102,700 10.9
Special Revenue Fund Departments Public Works 104,121,300 236,924,400 278,472,600 17.5
Subtotal 104,121,300 236,924,400 278,472,600 17.5
Internal Service Fund Departments Information Services Department 16,950,400 23,517,300 29,894,200 27.1
Subtotal 16,950,400 23,517,300 29,894,200 27.1
Enterprise Fund Departments Department of Public Utilities 253,070,400 341,979,200 323,701,400 (5.3) Transportation 98,850,000 160,803,600 165,991,700 3.2 Airports 44,324,500 105,586,700 107,667,200 2.0 Convention Center 14,145,000 19,186,600 15,556,400 (18.9)
Subtotal 410,389,900 627,556,100 612,916,700 (2.3)
Less: Expense Reduction 0 6,912,800 8,320,300 20.4 Less: Interdepartmental Charges 101,491,200 132,235,700 132,494,000 0.2
Net City Budget 842,047,100 1,273,535,700 1,362,571,900 7.0
FY 2020-2021 Final Revised Budget A - 5

Revenues Summary by Department/Primary Funding Source Including Operating, Capital & Debt Service
The total budget by Department and primary funding source is shown on this page.
Department FY 2019 Actuals
FY 2020 Amended
FY 2021 Final
% Change FY 2020 to
FY 2021
General Government Mayor/CMO 137,400 18,543,100 253,900 (98.6) Council 300 0 124,600 0.0 General City Purpose 376,857,200 395,016,700 392,524,500 (0.6) Personnel Services 35,005,700 35,696,900 42,122,200 18.0 Finance 27,662,900 16,153,300 61,303,700 279.5 ISD 21,907,900 26,993,300 31,449,800 16.5 City Clerk 2,600 0 500,000 0.0 City Attorney 22,300 2,638,100 2,881,700 9.2 Planning & Development Services 28,060,900 45,743,400 76,533,400 67.3
Subtotal 489,657,200 540,784,800 607,693,800 12.4
Public Protection Police 28,805,200 28,230,800 38,644,000 36.9 Fire 17,226,000 14,436,100 17,075,900 18.3
Subtotal 46,031,200 42,666,900 55,719,900 30.6
Public Ways and Means Public Works 183,541,100 207,324,700 206,367,400 (0.5)
Subtotal 183,541,100 207,324,700 206,367,400 (0.5)
Culture and Recreation Parks, After School, Recreation & Community Services 7,714,800 8,269,000 9,923,200 20.0
Subtotal 7,714,800 8,269,000 9,923,200 20.0
Enterprises (Business-Type Activities) Department of Public Utilities 453,715,700 487,104,300 526,374,200 8.1 Transportation 117,822,800 205,190,700 201,338,900 (1.9) Airports 74,085,400 133,758,100 128,743,400 (3.7) Convention Center 17,837,400 19,285,600 15,571,300 (19.3)
Subtotal 663,461,300 845,338,700 872,027,800 3.2
Total City Revenues 1,390,405,600 1,644,384,100 1,751,732,100 6.5
A - 6 FY 2020-2021 Final Revised Budget

Revenues Summary by Fund Classification Total City revenues and appropriations are shown on this page. The total revenue amount represents all of the revenues available to pay for services and capital projects, while the Net City Budget represents the "net" budget after all interdepartmental charges are removed.
FY 2019 Actuals
FY 2020 Amended
FY 2021 Final
% Change FY 2020 to
FY 2021 Governmental Activities General Fund(1) 382,398,700 403,055,200 448,528,700 11.3
Trust 4,261,900 0 0 0.0
Special Revenues 126,728,300 170,717,700 221,757,000 29.9
Capital 52,321,800 75,972,300 51,296,500 (32.5)
Debt Service 30,734,800 30,724,800 30,935,300 0.7
Subtotal 596,445,500 680,470,000 752,517,500 10.6
Proprietary (Business-Like Activities) Enterprise 637,847,800 803,955,900 832,011,300 3.5
Internal Service 156,112,300 159,958,200 167,203,300 4.5
Subtotal 793,960,100 963,914,100 999,214,600 3.7
Total Revenue 1,390,405,600 1,644,384,100 1,751,732,100 6.5
(1) The General Fund Category includes amounts in the Emergency Reserve Fund, Asset Sale Reserve, the 27th Pay Period Reserve, and the Housing General Fund.
FY 2020-2021 Final Revised Budget A - 7

Appropriations Summary by Fund Classification The Net City Budget represents the “net” budget after all interdepartmental changes are removed.
FY 2019 Actuals
FY 2020 Amended
FY 2021 Final
% Change FY 2020 to
FY 2021 Governmental Activities General Fund(1) 317,324,600 364,838,900 409,701,000 12.3
Trust 1,792,200 0 0 0.0
Special Revenues 96,778,000 224,866,900 296,966,000 32.1
Capital 20,499,700 54,500,500 31,197,800 (42.8)
Debt Service 30,711,200 30,714,100 30,935,300 0.7
Subtotal 467,105,700 674,920,400 768,800,100 13.9
Proprietary (Business-Like Activities) Enterprise 377,190,400 593,802,800 572,710,500 (3.6)
Internal Service 99,242,200 137,048,200 153,555,300 12.0
Subtotal 476,432,600 730,851,000 726,265,800 (0.6)
Less: Interdepartmental Charges 101,491,200 132,235,700 132,494,000 0.2
Net City Budget 842,047,100 1,273,535,700 1,362,571,900 7.0
(1)The General Fund Category includes the Housing General Fund.
FY 2020-2021 Final Revised BudgetA - 8

Appropriations Summary – FY 2021 by Operating, Capital & Debt Service
The total adopted budget by department and primary funding source is shown on this page. The amounts shown as Net Budget represent the total "net" City budget after all interdepartmental charges are removed.
Department FY 2021
Operating FY 2021 Capital
FY 2021 Debt
Service Total General Fund Departments Mayor/CMO 5,042,800 0 0 5,042,800
Council 4,488,400 682,000 0 5,170,400
Police 208,771,200 130,000 1,373,400 210,274,600
Fire 75,253,900 124,500 1,184,600 76,563,000
Parks, After School, Recreation & Community Services 26,435,800 12,424,300 1,826,100 40,686,200
General City Purpose 24,428,000 0 29,217,100 53,645,100
Finance 43,016,700 0 0 43,016,700
City Clerk 1,455,900 0 0 1,455,900
City Attorney 20,326,300 0 0 20,326,300
Personnel Services 43,991,300 0 0 43,991,300
Planning and Development Services 62,807,700 18,894,900 227,800 81,930,400
Subtotal 516,018,000 32,255,700 33,829,000 582,102,700
Special Revenue Fund Departments Public Works 85,064,700 193,269,000 138,900 278,472,600
Subtotal 85,064,700 193,269,000 138,900 278,472,600
Internal Service Fund Departments Information Services Department 29,894,200 0 0 29,894,200
Subtotal 29,894,200 0 0 29,894,200
Enterprises Fund Departments Department of Public Utilities 169,649,600 105,556,400 48,495,400 323,701,400
Transportation 113,063,200 52,928,500 0 165,991,700
Airports 21,705,400 79,534,100 6,427,700 107,667,200
Convention Center 3,544,300 3,667,600 8,344,500 15,556,400
Subtotal 307,962,500 241,686,600 63,267,600 612,916,700
Less: Expense Reduction(1) 8,320,300 0 0 8,320,300
Less: Interdepartmental Charges 132,494,000 0 0 132,494,000
Net Budget 798,125,100 467,211,300 97,235,500 1,362,571,900
(1) This represents the total expense reduction needed in the General Fund. It has been placed here for accounting purposes only.
FY 2020-2021 Final Revised Budget A - 9

A - 10 FY 2020-2021 Final Revised Budget
Appropriations Summary - FY 2021 by Operating, Capital & Debt Service
Authorized Position Detail
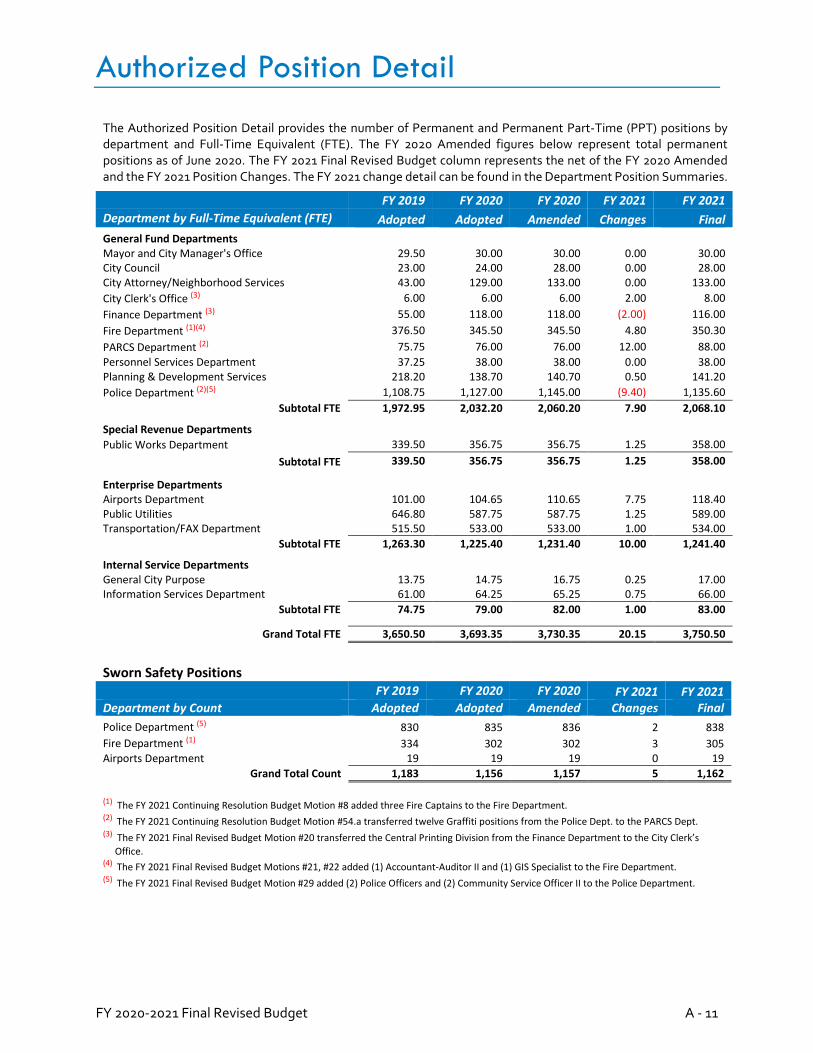
The Authorized Position Detail provides the number of Permanent and Permanent Part-Time (PPT) positions by department and Full-Time Equivalent (FTE). The FY 2020 Amended figures below represent total permanent positions as of June 2020. The FY 2021 Final Revised Budget column represents the net of the FY 2020 Amended and the FY 2021 Position Changes. The FY 2021 change detail can be found in the Department Position Summaries.
FY 2019 FY 2020 FY 2020 FY 2021 FY 2021 Department by Full-Time Equivalent (FTE) Adopted Adopted Amended Changes Final General Fund Departments Mayor and City Manager's Office 29.50 30.00 30.00 0.00 30.00 City Council 23.00 24.00 28.00 0.00 28.00 City Attorney/Neighborhood Services 43.00 129.00 133.00 0.00 133.00 City Clerk's Office (3) 6.00 6.00 6.00 2.00 8.00 Finance Department (3) 55.00 118.00 118.00 (2.00) 116.00 Fire Department (1)(4) 376.50 345.50 345.50 4.80 350.30 PARCS Department (2) 75.75 76.00 76.00 12.00 88.00 Personnel Services Department 37.25 38.00 38.00 0.00 38.00 Planning & Development Services 218.20 138.70 140.70 0.50 141.20 Police Department (2)(5) 1,108.75 1,127.00 1,145.00 (9.40) 1,135.60
Subtotal FTE 1,972.95 2,032.20 2,060.20 7.90 2,068.10
Special Revenue Departments Public Works Department 339.50 356.75 356.75 1.25 358.00
Subtotal FTE 339.50 356.75 356.75 1.25 358.00
Enterprise Departments Airports Department 101.00 104.65 110.65 7.75 118.40 Public Utilities 646.80 587.75 587.75 1.25 589.00 Transportation/FAX Department 515.50 533.00 533.00 1.00 534.00
Subtotal FTE 1,263.30 1,225.40 1,231.40 10.00 1,241.40
Internal Service Departments General City Purpose 13.75 14.75 16.75 0.25 17.00 Information Services Department 61.00 64.25 65.25 0.75 66.00
Subtotal FTE 74.75 79.00 82.00 1.00 83.00
Grand Total FTE 3,650.50 3,693.35 3,730.35 20.15 3,750.50
Sworn Safety Positions FY 2019 FY 2020 FY 2020 FY 2021 FY 2021
Department by Count Adopted Adopted Amended Changes Final Police Department (5) 830 835 836 2 838 Fire Department (1) 334 302 302 3 305 Airports Department 19 19 19 0 19
Grand Total Count 1,183 1,156 1,157 5 1,162
(1) The FY 2021 Continuing Resolution Budget Motion #8 added three Fire Captains to the Fire Department.(2) The FY 2021 Continuing Resolution Budget Motion #54.a transferred twelve Graffiti positions from the Police Dept. to the PARCS Dept. (3) The FY 2021 Final Revised Budget Motion #20 transferred the Central Printing Division from the Finance Department to the City Clerk’s
Office. (4) The FY 2021 Final Revised Budget Motions #21, #22 added (1) Accountant-Auditor II and (1) GIS Specialist to the Fire Department.(5) The FY 2021 Final Revised Budget Motion #29 added (2) Police Officers and (2) Community Service Officer II to the Police Department.
FY 2020-2021 Final Revised Budget A - 11

THIS PAGE WAS INTENTIONALLY LEFT BLANK.
A - 12 FY 2020-2021 Final Revised Budget

Authorized Position Changes
The detail below describes the new position changes by fund type for FY 2021 Final Revised Budget. Additional position detail can be found in the respective department’s staffing section. The position changes noted below reflect whole position changes unlike the Authorized Position Detail, which notes changes by FTE.
Funding Source Service New
Positions General Fund
Police Department – Per the Final Revised Budget Motion #29, two (2) Police Officer and two (2) Community Service Officer II positions were added to the Department to support the Department of Public Utilities recycling and illegal dumping programs.
4
Fire Department – Per the Continuing Resolution Motion #8, three (3) Fire Captains to the Department’s Safety Program. Per the Final Revised Budget Motions #21, #22, one (1) Accountant-Auditor II and one (1) GIS Specialist were added to the Department.
5
General Fund Total 9
General FundNon-Sworn
874.99
General Fund Sworn
1,124.08
Special Revenue380.53
Enterprise1,071.45
Internal Service299.45
General Fund 1,999.07
Authorized Full-Time Equivalent (FTE) by Fund Type FY 2021 Final Revised Budget
FY 2020-2021 Final Revised Budget A - 13

THIS PAGE WAS INTENTIONALLY LEFT BLANK.
A - 14 FY 2020-2021 Final Revised Budget

Debt Obligations Summary As of June 30, 2020, the City will have total long-term bond principal and interest outstanding of $698.8 billion. Of this amount, $334.9 million or 47.9 percent is revenue bonds of the City’s business enterprise funds, and $145.7 million is associated with the pension obligation bond, backed by the full faith and credit of the City. The remaining $218.2 million includes lease revenue bonds for general governmental projects. Total bonded indebtedness backed by the General Fund is $363.9 million.
The City’s total bonded principal and interest outstanding at June 30, 2020 is approximately $30.5 million less than the prior year due to debt service payments made in FY 2020.
The ratio of net bonded obligation debt to taxable valuation and the amount of bonded debt per capita are useful indicators of the City’s debt position to management, citizens, and investors. A comparison of these indicators at June 30th is on the table shown above.
The City’s Charter imposes a limit on the amount of general obligation bonds the City can have outstanding at any given time; this limit is 20 percent of the assessed value of property in the City. Bonded indebtedness constituting a general obligation of the City can only be created by the affirmative votes of a majority of the electors. The City currently has no general obligation debt.
The current ratings from Moody’s, Standard & Poor’s, and Fitch for the City’s general obligation and lease revenue bonds are shown in the table below.
BOND RATING LEASE REVENUE
BONDS GENERAL
OBLIGATION Rating Outlook Rating Outlook
Fitch A- Stable A Stable S&P A Stable A+ Stable Moody's Baa1 Positive A3 Stable
Loans and leases outstanding at June 30, 2020 are estimated to be $519.8 million. $470.3 million dollars of the outstanding balance is in the form of Safe Drinking Water State Revolving Fund low or no-interest loans received by the Water and Wastewater Divisions. These loans will be repaid with enterprise revenues through the year 2047. FY 2020 FY 2021
Bonded Obligation Debt (Principal Only) $116,160,000 $107,555,000
Bonded Obligation Debt per Capita $215.78 $200.41
Debt Service tax rate per $ 100 taxable valuation $0.34 $0.29
FY 2020-2021 Final Revised Budget A - 15

FY 2021 Current Portion of L-T Debt
Bonds Backed By General Fund (GF)
Current Repayment
Source
Outstanding Principal &
Interest Bonds @ 6/30/20
Outstanding Principal &
Interest Loans @ 6/30/20
Payment Principal
Payment Interest Total D/S*
GF Portion
Pension Obligation GF/Enterprise 145,710,785 0 9,160,000 7,027,829 16,187,829 12,679,000
Exhibit Hall Expansion Lease Revenue General Fund 19,370,800 0 1,156,075 1,002,426 2,158,500 2,158,500
Stadium Lease Revenue Various 35,025,875 0 1,670,000 1,522,110 3,192,110 2,712,109
Various Capital Project Lease Revenue General Fund 32,407,740 0 1,460,000 1,220,983 2,680,983 2,680,983
Convention Center Lease Revenue General Fund 10,256,665 0 2,440,000 538,110 2,978,110 2,978,110
No Neighborhood Left Behind Lease Revenue
General Fund/ Measure C 8,892,099
0 2,580,000 381,950 2,961,950 2,961,950
Parks Impact/Riverside Golf Course Lease Revenue
Impact Fees/ Enterprise/GF 35,067,500
0 820,000 1,129,001 1,949,001 955,010
Public Safety Lease Revenue Impact Fees/GF 45,859,750 0 1,110,000 1,442,750 2,552,750 1,381,688
City Hall Chiller Rent Revenue 3,221,500 0 0 135,500 135,500 135,500
City Hall/Granite Park/Bee Bldg Lease Revenue
Rent Revenue/GF 28,065,124 0 3,565,000 863,451 4,428,451 4,012,101
Total Bonds 363,877,838 0 23,961,075 15,264,110 39,225,184 32,654,951
Loans Backed by General Fund
California Infrastructure Bank General Fund 0 1,875,681 83,582 50,787 134,368 134,368
HUD Loan (Neighborhood Streets & Parks) CDBG 0 399,327 114,000 18,721 132,721 0
Master Equipment Lease Purchase Program(1) Various 0 47,288,429 8,364,915 1,026,134 9,391,046 8,523,602
Total Loans 0 49,563,437 8,562,497 1,095,642 9,658,135 8,657,970
General Fund Backed Obligations 363,877,838 49,563,437 32,523,572 16,359,752 48,883,319 41,312,921
Bonds & Loans Backed by Enterprise Funds
Sewer Revenue Bonds 1993 A Enterprise 7,178,250 0 6,050,000 183,513 6,233,513 0
Water Revenue Bonds 2010 A-1 Enterprise 31,437,425 0 6,390,000 1,467,500 7,857,500 0
Water Revenue Bonds 2010 A-2 Enterprise 173,407,288 0 0 6,097,263 6,097,263 0
Airport Revenue Bonds 2007 A Enterprise 34,747,346 0 370,000 1,199,848 1,569,848 0
Airport Revenue Bonds 2013 A Enterprise 33,024,459 0 1,595,000 1,168,944 2,763,944 0
Airport Revenue Bonds 2019 A Enterprise 55,095,496 0 756,097 1,194,457 1,950,554 0
State Water Resources Control Board Loans Enterprise 0 470,269,130 7,929,508 2,784,407 10,713,915 0
Enterprise Fund Backed Obligations 334,890,264 470,269,130 23,090,605 14,095,932 37,186,537 0
Total Citywide Debt Obligations 698,768,102 519,832,567 55,614,177 30,455,684 86,069,856 41,312,921
(1) Master Equipment Lease Purchase Programs includes all leases through 06/30/2020 * Total D/S column may not add up due to rounding.
A - 16 FY 2020-2021 Final Revised Budget
Debt Obligations Summary

FY 2020-2021 Measure C Extension Revenue and History The Measure C Extension Plan is a multi-modal funding program, which distributes a percentage of local sales tax revenue to the City
of Fresno through three main programs: the Regional Public Transit Program; the Regional Transportation
Program; and, the Local Transportation Program.
Public Transit Program The goal is to expand mass transit programs that have a demonstrated ability to get people out of their cars and improve air quality. The transit agencies would use the funds to address major new expansions of the express, local and feeder bus service to include additional:
• Routes• Buses (including low emission)• Night and Weekend Service• Bus Shelters• Safer access to Public Transit Services
Local Transportation Program The goal is to improve the City’s local transportation program by addressing the problem of aging streets and road infrastructure. Funding is provided to fill potholes, repave streets, improve sidewalks, and upgrade the local transportation infrastructure.
The funding is distributed as follows: • Street Maintenance / Rehabilitation• Flexible Program• ADA Compliance• Pedestrian Trails• Bicycle Facilities
Regional Transportation Program The Regional Transportation Program provides for the movement of goods, services, and people throughout the County.
The Fresno Yosemite International Airports is an important component of both the urban and rural area transportation systems and is critical to the continued economic development in Fresno County. Funding for the program is designed for runway and infrastructure
rehabilitation, runway land acquisition and construction, and associated infrastructure construction projects.
Measure C Extension revenue is budgeted at $22,835,700 in FY 2021 or an increase of $723,976 when compared to the FY 2020 Actuals of $22,111,724.
Measure C Revenue
Public Works FAX Airports
Total Revenue
2015 Actuals 10,135,605 9,021,231 658,486 19,815,322 2016 Actuals 10,754,973 9,512,168 694,319 20,961,460 2017 Actuals 10,812,893 9,635,196 703,299 21,151,388 2018 Actuals 10,427,803 10,352,429 748,705 21,528,937 2019 Actuals 10,954,384 10,601,384 773,052 22,328,819 2020 Actuals 10,611,680 10,720,960 779,084 22,111,724 2021 Final 9,821,500 12,135,000 879,200 22,835,700
FY 2020-2021 Final Revised Budget A - 17
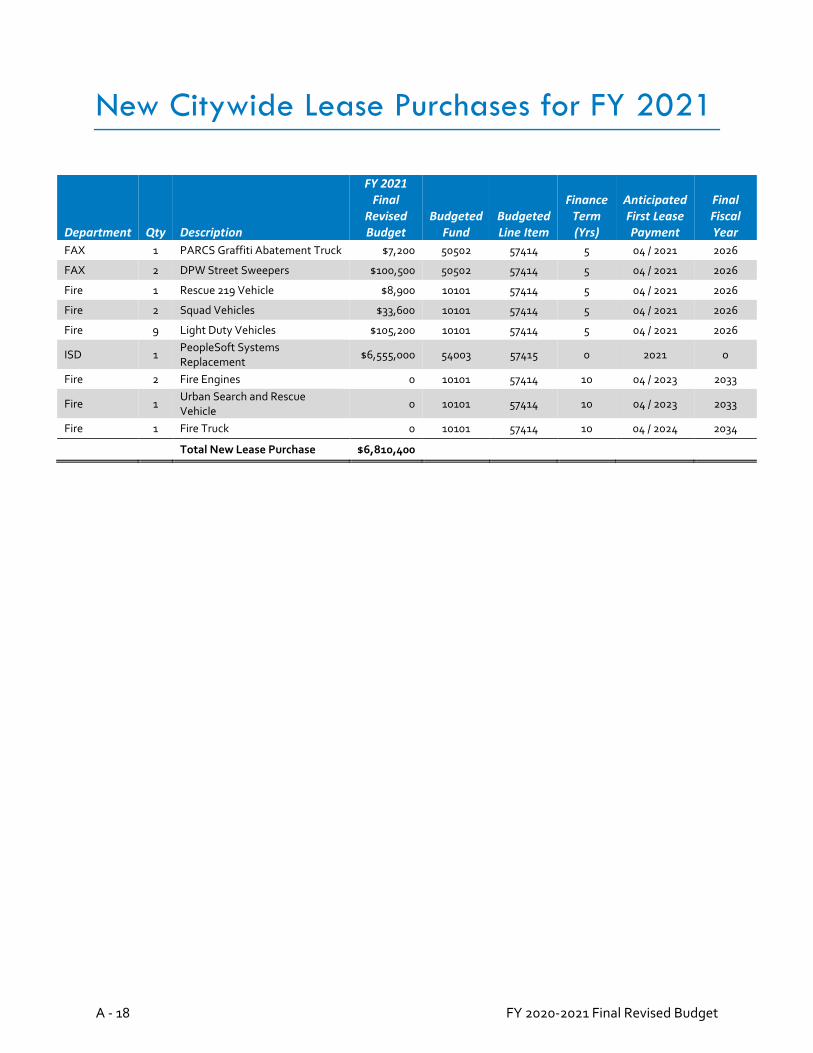
New Citywide Lease Purchases for FY 2021
Department Qty Description
FY 2021 Final
Revised Budget
Budgeted Fund
Budgeted Line Item
Finance Term (Yrs)
Anticipated First Lease Payment
Final Fiscal Year
FAX 1 PARCS Graffiti Abatement Truck $7,200 50502 57414 5 04 / 2021 2026
FAX 2 DPW Street Sweepers $100,500 50502 57414 5 04 / 2021 2026
Fire 1 Rescue 219 Vehicle $8,900 10101 57414 5 04 / 2021 2026
Fire 2 Squad Vehicles $33,600 10101 57414 5 04 / 2021 2026
Fire 9 Light Duty Vehicles $105,200 10101 57414 5 04 / 2021 2026
ISD 1 PeopleSoft Systems Replacement
$6,555,000 54003 57415 0 2021 0
Fire 2 Fire Engines 0 10101 57414 10 04 / 2023 2033
Fire 1 Urban Search and Rescue Vehicle
0 10101 57414 10 04 / 2023 2033
Fire 1 Fire Truck 0 10101 57414 10 04 / 2024 2034
Total New Lease Purchase $6,810,400
A - 18 FY 2020-2021 Final Revised Budget

FY 2020-2021 Federal Entitlement Funding
Introduction
The City of Fresno (City) receives annual allocations from the U.S. Department of Housing and Urban Development (HUD) through four grant programs: • Community Development Block Grant
(CDBG)• HOME Investment Partnership Program
(HOME)• Emergency Solutions Grant (ESG), and• Housing Opportunities for Persons With
AIDS/HIV (HOPWA)The overarching purpose of these four programs is to assist low- and moderate-income families and households, which are those that earn less than 80 percent of the area
median income. ESG and HOPWA funds are earmarked to assist the homeless and persons living with HIV/AIDS, respectively. The funds are used to pursue three
goals: 1) Provide decent, affordable housing; 2) Create suitable living environments, and 3) Expand economic opportunities.
In order to access federal funds, the City must carry out a planning process to identify the scope of housing and community development
needs in its jurisdiction and how the available funding can best be used to meet those needs. This planning process, called the Consolidated Plan, was conducted in late 2019 and early 2020. The term of the plan began on July 1, 2020 and will end on June 30, 2024. A full copy of the Consolidated Plan is available for review on the City’s Planning & Development Department webpage.
Each year, the City prepares an Annual Action Plan that describes the projects and actions it will undertake to carry out the strategies outlined in the Consolidated Plan. The First Year Annual Action Plan covers the period from July 1, 2020 to June 30, 2021.
In FY 2021, the City will receive $12 million in new federal funds, and estimates that $330,000 will be available in program income to address its most pressing affordable housing and community development priorities. The most pressing needs in the City include improved access to affordable housing and neighborhood revitalization. As such, CDBG resources available to the City through the programs covered by this plan will focus on the development of affordable housing in high opportunity areas and rehabilitation of existing affordable housing units, public facility and infrastructure projects, and supportive public services. HOME funds will primarily be used to increase housing opportunities for low-income rental households. ESG funds will continue to serve the needs of homeless populations, and HOPWA funds will provide housing assistance to persons living with HIV/AIDS and their families.
Community Development Block Grant
This long-standing program of HUD provides jurisdictions, also known as “entitlement communities,” federal funds to sustain
FY 2020-2021 Final Revised Budget A - 19
affordable housing, create suitable living environments, and expand economic opportunities primarily for low- to moderate-income persons. CDBG was enacted through the Housing and Community Development Act of 1974 and took effect in January 1975. CDBG funds are allocated to more than 1,200 local and state governments on a formula basis; the total program was approximately $3.25 billion in 2018. Larger cities and urban counties, or entitlement communities, are required to prepare and submit a "Consolidated Plan" that establishes goals for the use of CDBG funds. Grantees are also required to hold public meetings to solicit input from the community, ensuring that proposed projects are aligned with the community's prioritized needs as established in the City’s Consolidated Plan.
CDBG projects must be consistent with broad national objectives including: activities that benefit low- to moderate-income persons, the prevention or elimination of slums or blight, or other community development activities to address an urgent threat to health or safety. CDBG funds may be used for community development activities (such as real estate acquisition, relocation, rehabilitation of housing and commercial buildings), construction of public facilities and improvements (such as water, sewer, and other utilities, street paving, and sidewalks), construction of neighborhood centers, and the conversion of school buildings, public services, and economic development and job creation or retention activities. CDBG funds can also be used for preservation and restoration of historic properties in low-income neighborhoods.
Overview of City CDBG HUD released its FY 2021 allocation levels and the City will receive approximately $7.2 million of CDBG funds for use in FY 2021. A dozen community meetings were held from
November 2019 to February 2020 to obtain input from residents on the public’s needs.
CDBG revenues used to build the FY 2021 Budget are comprised of the entitlement from HUD, estimated program income, and carryover. Program income, which is the gross income received by the City and its subrecipients directly generated from the use of CDBG funds, is estimated at $125,000. Expenditures related to the FY 2021 new allocation and estimated program income are classified according to the summary chart.
The carryover is the total of unused, cancelled, or not yet completed funds or projects from prior fiscal years. This can occur when a capital project is completed under budget; when a program does not use all of its allocation; or when a project is not completed within that fiscal year. The FY 2021 Budget includes several carryover projects that have previously been funded, but are not yet complete, including, but not limited to: 1) Fresno Equal Opportunities Commission Street Saints After School Program, 2) Park Improvements at various sites including Pinedale, Fink-White, and Quigley (learner pool design); Fink-White (splash park); and Romain (challenger course) , 3) Public Works neighborhood streetimprovements, 4) Lead Paint Abatement andSenior Paint/Minor Rehabilitation Programs,and 5) Several other nonprofit subrecipientprojects.
The annual payment of Debt Service is required to repay Section 108 loans for Street and Park Improvements within CDBG areas. In addition to the activity limitations placed upon CDBG, HUD has also limited the use of CDBG for certain types of projects. By regulation, all Public Service activities are capped at fifteen percent of the entitlement
A - 20 FY 2020-2021 Final Revised Budget
FY 2020-2021 Federal Entitlement Funding

and program income. Planning and Administration activities are capped at twenty percent of the entitlement and program income. For FY 2021, the “allocation caps” for Public Service and Administration are estimated to be $1.1 million and $1.4 million respectively.
Housing The Consolidated Plan identified access to affordable housing for low-income and special needs households as a high priority, as well as neighborhood revitalization through
improvements to current public infrastructure and facilities. The City manages several programs that serve to arrest deterioration and provide assistance to improve access to affordable housing.
The Housing and Community Development Division utilizes a portion of the CDBG Program funds each year for administration and rehabilitation of affordable housing for low-income households. The Housing budget category consists of rehabilitation programs and program delivery that serves to absorb
SUMMARY CHART FY 2021 Allocation and Program Income CDBG
Section 108 Loan HOME ESG HOPWA
HOUSING Housing Rehabilitation Admin 200,000 0 0 0 0
Senior Paint Program 150,000 0 0 0 0 Housing Rehab (Nonprofit*) 1,028,100 0 0 0 0
CHDO Set Aside (15% Allocation) 0 0 488,300 0 0 Tenant Based Rental Assistance (Homeless) 0 0 711,800 0 0
HOME Rental Rehab/New Construction 0 0 1,914,100 0 0
FACILITIES AND PUBLIC IMPROVEMENTS Neighborhood Street Improvements 3,095,200 0 0 0 0
D4 Multi-Generational Community Center 0 7,500,000 0 0 0 Section 108 Loan Repayment 227,800 0 0 0 0
PUBLIC SERVICES (15% CAP) PARCS Senior Hot Meals 187,900 0 0 0 0
PARCS After School Program 718,100 0 0 0 0 Nonprofit* Public Services 161,000 0 0 0 0
SECTION 3 TRAINING Micro-Enterprise Assistance (Nonprofit*) 35,000 0 0 0 0
HOMELESS AND SPECIAL NEEDS ESG (Various Subrecipients) 2020-2021 0 0 0 717,300 0
HOPWA (Subrecipient WestCare) 2020-2021 0 0 0 0 617,100
PLANNING AND ADMINISTRATION CDBG/HOME/HOPWA/ESG Admin (20% CAP) 1,397,600 0 0 0 0
HOME Program Administration (10% CAP) 0 0 346,000 0 0 HOPWA Program Administration (3% CAP) 0 0 0 0 19,100
ESG Program Administration (7.5% CAP) 0 0 0 45,800 0 Fair Housing (Nonprofit*) 50,000 0 0 0 0
TOTALS 7,250,700 7,500,000 3,460,200 763,100 636,200
*Nonprofit activities are identified in the 2020-2021 Annual Action Plan published under separate cover.
FY 2020-2021 Final Revised Budget A - 21
FY 2020-2021 Federal Entitlement Funding

costs associated with the creation of affordable housing projects in the HOME program.
With the City performed Senior Paint Program, CDBG funds will pay for a licensed lead-certified painting contractor to paint the exterior of the home and may include minor repairs, (i.e., screens, broken window panes, loose or damaged gutters, etc.) provided there are enough funds available after deducting the cost of the paint project. This program serves low-income seniors (62 years of age or older) who own and occupy their homes. In addition to the City performed program, CDBG funded nonprofits will offer complimentary senior paint/paint programs.
Additional repair programs are proposed to be implemented by CDBG funded nonprofits. The rehabilitation to be performed includes emergency home repair for seniors and minor repairs for health and safety items that need immediate attention but homeowners are unable to afford to correct the problem.
Public Facilities and Improvements The Consolidated Plan identified the need for neighborhood revitalization through improvements to current public infrastructure and facilities. The City is focused on strategic investments that will enhance other private and public investments targeted to low and very low-income neighborhoods.
Neighborhood Street Improvements will use approximately $3 million to address infrastructure needs in eligible neighborhoods throughout the city. Proposed areas include: Yosemite Middle School Complete Streets; Highway City Neighborhood Streets; West Fresno Elementary and MLK Neighborhood streets; Burroughs Elementary Neighborhood Streets; and Ericson Elementary Neighborhood Streets. The work plan will involve
street/streetscape and sidewalk projects in low-income areas.
Public Services The Consolidated Plan identified services for low-income and special needs households to be high priorities. The City provides essential services to targeted low- and very low-income neighborhoods through its PARCS Senior and After School Programs.
PARCS Senior Programs provide enrichment programs for adults 62 and older. Programs are offered at seven neighborhood centers throughout Fresno, including: 1) Mosqueda Community Center 2) Ted C. Wills Community Center 3) Pinedale Community Center 4) Mary Ella Brown Community Center 5) Senior Citizens Village 6) Lafayette Neighborhood Center, and 7) Inspiration Park. The Senior Program sites are strategically offered throughout the community with operations occurring in North Fresno (Pinedale) Central Fresno (Ted C. Wills and Lafayette), Southeast Fresno (Mosqueda and Senior Citizens Village), Southwest Fresno (Mary Ella Brown), and West Fresno (Inspiration Park).
PARCSs goal is to serve 1,000 low-income and moderate-income seniors through its programs for FY 2021. Staff will provide the program compliance documentation, recreational activities, volunteer coordination/ recruitment, and activities. Staff will also continue to coordinate with the Fresno-Madera Area Agency on Aging for Senior Programs. The Ted C. Wills Community Center will have two seniorcoordinators assigned to the site because of thesize of the site. The Senior Programs willcontinue to have a site monitor that will assiststaff in compliance and paperwork reportingneeds.
A - 22 FY 2020-2021 Final Revised Budget
FY 2020-2021 Federal Entitlement Funding

The PARCS After School Program will use CDBG funds to help serve nearly 700 children at ten neighborhood and community centers throughout the City of Fresno. At-risk children and youth have an opportunity to complete their homework in the computer labs, obtain a healthy snack, and participate in physical and recreational activities that are important to their well-being and development. In addition to the PARCS performed After School Program, a CDBG funded nonprofit will offer after school services at two sites, for a total of 12 sites receiving services.
CDBG funds will be provided to local non-profits to support programs that serve predominantly low- and moderate-income clientele. Nonprofit activities are identified in the 2020-2021 Annual Action Plan published under separate cover.
Planning and Administration The Consolidated Plan identified improved transparency, increased community involvement, and full compliance with federal regulations as a priority. CDBG Administration ensures all federal regulations are met for entitlement programs and subcomponents of CDBG. Program administration includes the preparation of the Consolidated Plan, Citizen Participation Plan, Annual Action Plan as well as the Consolidated Annual Evaluation and Performance Report (CAPER).
The City will also fund nonprofit(s) to provide education and enforcement of state and federal fair housing laws. Education (housing civil rights) will encompass outreach to Fresno city residents, landlords, property managers, real estate industry, housing-related insurance brokers/agents, lenders, and banking representatives. Resolution of housing discrimination claims of Fresno city residents will be accomplished by investigation (and
testing) of credible claims and by assisting claimants with case referrals to HUD, the California Department of Fair Employment and Housing, or mediation and/or injunctive relief through state or federal court.
Section 108 Loan Guarantee Program
As a recipient of CDBG funding, the City of Fresno is eligible to participate in the Section 108 Loan Guarantee program administered by HUD. Under this program, the City is able to leverage up to five times its annual CDBG allocation for large community development investments.
In an effort to provide multiple services integrated into one common space to meet the needs of youth, seniors, and neighborhoods, the City applied for a $7.5 million Section 108 Loan Guarantee. If approved by HUD, these funds will be used for the construction of a new multi-generational community center and improved park facilities that will increase the quality of life for the low and moderate income population in the surrounding neighborhoods. Specifically, a multi-generational community center would improve the quality of life for constituents by providing after school activities for youth, senior enrichment activities, recreational space, meeting space, and improved green space with sports fields and a tot lot.
HOME Program
The HOME Investment Partnerships Program (HOME) provides formula grants to entitlement communities , often in partnership with local nonprofit groups, to fund a wide range of activities including building, buying, and/or rehabilitating affordable housing for rent or homeownership or providing direct rental assistance to low-income people. HOME is the largest federal block grant to state and local governments designed exclusively to create
FY 2020-2021 Final Revised Budget A - 23
FY 2020-2021 Federal Entitlement Funding
affordable housing for low-income households. In FY 2021 the City will receive $3.2 million in HOME entitlement and estimates receiving $205,000 in program income.
HOME funds are awarded annually as formula grants to participating jurisdictions. At least 15 percent of the HOME funds must be awarded to certified Community Housing Development Organizations (CHDOs). Fresno currently has three CHDOs, Community Housing Works, Habitat for Humanity, and Self-Help Enterprises. As projects are identified, the City will approve agreements for new or rehabilitated housing for very low-income homebuyers as part of the CHDO program. The FY 2021 funding identified for CHDO use is approximately $488,300.
The HOME Program’s flexibility allows for the use of HOME funds for grants, direct loans, loan guarantees or other forms of credit enhancements, or rental assistance or security deposits. The City budget currently alternates annually between identifying a minimum of $1 million for minor rehabilitation, or affordable rental substantial rehabilitation and/or new construction activities. The FY 2021 budget identifies approximately $1.91 million for new construction activities.
Tenant-based rental assistance funding of approximately $711,800 will subsidize private market units for low-income households to increase affordability. The program will continue being implemented through the Fresno Housing Authority to provide housing assistance for persons transitioning from homelessness.
Emergency Solutions Grant (ESG) Program
The Homeless Emergency Assistance and Rapid Transition to Housing Act of 2009 (HEARTH Act) amended the McKinney-Vento Homeless Assistance Act, revising the Emergency Shelter Grants Program in significant ways and renaming it the Emergency Solutions Grants (ESG) program. The ESG program provides funding to: (1) engage homeless individuals and families living on the street; (2) improve the number and quality of emergency shelters for homeless individuals and families; (3) help operate these shelters; (4) provide essential services to shelter residents; (5) rapidly re-house homeless individuals and families; and, (6) prevent families and individuals from becoming homeless. ESG funds may be used for five program components: street outreach, emergency shelter, homelessness prevention, rapid re-housing assistance, and HMIS; as well as administrative activities (up to 7.5 percent of a recipient’s allocation can be used for administrative activities).
Through consultation with the Fresno Madera Continuum of Care, the City will use ESG program funds within the identified categories of activities to award subrecipient agreements to agencies that will be identified in the 2020-2021 Annual Action Plan published under separate cover.
Street Outreach/Emergency Shelter The City anticipates providing approximately $257,000 of its ESG allocation to fund a portion of the full-service multidisciplinary outreach and engagement efforts as well as full-service emergency shelter program(s) that serve specific target populations, including homeless individuals, families, youth, and victims of domestic violence. Services will include the
A - 24 FY 2020-2021 Final Revised Budget
FY 2020-2021 Federal Entitlement Funding
provision of shelter beds, case management, deposit/rental assistance, and other services as appropriate. The goal of this program is to provide all of the services and support that the participating families and youth need to become and remain permanently housed.
Homelessness Prevention The City will provide approximately $41,600 to service providers to offer homelessness prevention services to stabilize housing for individuals and families at risk of homelessness.
Rapid Re-Housing The City will provide approximately $418,700 to offer housing relocation and stabilization services and short-and/or medium-term rental assistance as necessary to help individuals or families living in an emergency shelter or other place described in paragraph (1) of the “homeless” definition in 24 CFR 576.2 move as quickly as possible into permanent housing and achieve stability in that housing.
Component services and assistance may consist of short-term and medium-term rental assistance, rental arrears, rental application fees, security deposits, advance payment of last month’s rent, utility deposits and payments, moving costs, housing search and placement, housing stability case management, mediation, legal services, and credit repair.
Administration In an effort to assure coordination, communication, and program management, the City will continue to utilize the maximum 7.5 percent administrative allocation for FY 2021.
Housing Opportunities for Persons with AIDS (HOPWA) Program
HOPWA supports communities in developing affordable housing opportunities and related supportive services for low-income persons living with HIV/AIDS and their families. HOPWA-eligible activities include direct housing, support services, information and referral, resource identification, and technical assistance. The HUD HOPWA program provides resources that benefit low-income persons medically diagnosed with HIV/AIDS and their families, including housing and social services, chemical dependency treatment, nutritional services, case management, and assistance with daily living.
As of FY 2016, the City of Fresno’s housing program is the direct grantee responsible for the implementation of the HOPWA Program. Under previous Consolidated Plans the State of California administered the HOPWA Program on behalf of the City. The City of Fresno will provide $617,040 for a comprehensive array of HOPWA activities, including short term rent, mortgage payment, utility payment, and emergency housing services.
CARES Act Funding
As part of the Coronavirus Aid, Relief, and Economic Security Act (CARES Act) passed by the U.S. Congress and signed into law by the President on March 27, 2020, HUD allocated additional entitlement funds to the City through the CDBG-CV, ESG-CV, and HOPWA-
CV programs. The purpose of these funds is to assist the City in preventing, preparing for, and responding to the coronavirus (COVID-19).
FY 2020-2021 Final Revised Budget A - 25
FY 2020-2021 Federal Entitlement Funding

CDBG-CV HUD released two rounds of CDBG-CV allocations that resulted in $7.98 million in funding for the City. Examples of activities that can be funded with CDBG-CV include: • Construction of medical facilities for testing
and treatment• Acquisition of motels or hotels to expand
capacity of hospitals• Replacement of HVAC systems to
temporarily transform commercialbuildings or closed school buildings intoclinics
• Support for business manufacturingmedical supplies
• Construction of group living facilities tocentralize patients undergoing treatment
• New or increased public services to providetesting or diagnosis, job training to expandthe pool of health care workers, and delivermeals on wheels to quarantined individuals
ESG-CV In its first round of ESG-CV funding, HUD allocated $2.1 million to the City. These funds were used in accordance with a memorandum of understanding for a joint funding framework between the City, County of Fresno, and Fresno Madera Continuum of Care to align resources to execute the COVID-19 Homeless Response for the prevention and containment of COVID-19 among individuals experiencing homelessness community-wide.
HUD released a second round of ESG-CV funding that allocated an additional $8.8 million to the City. These can be used on the following types of activities: • Building more emergency shelters for
homeless individuals and families• Operating emergency shelters by providing
maintenance, rent, repair, security, fuel,equipment, insurance, utilities, food,furnishings, and supplies necessary for theoperation
• Providing hotel/motel vouchers forhomeless families or individuals
• Providing essential services to peopleexperiencing homelessness
• Preventing individuals from becominghomeless and rapidly rehousing homelessindividuals
HOPWA-CV HUD allocated approximately $92,600 to the City to augment existing housing services for persons living with HIV/AIDS. The City entered into an agreement with WestCare California, Inc., the current provider of HOPWA services on behalf of the City, to maintain HIV/AIDS assistance, program operations providing rental assistance, supportive services, and other necessary actions in order to prevent, prepare for, and respond to COVID-19.
SUMMARY CHART FY 2021 COVID-19 Allocations CDBG-CV ESG-CV HOPWA-CV
To be allocated 6,384,100 8,845,500 0 Homeless Response 0 1,998,400 0
HOPWA (Subrecipient WestCare) 0 0 87,000 PLANNING AND ADMINISTRATION
CDBG-CV Program Administration (20% CAP) 1,596,000 0 0 HOPWA-CV Program Administration (6% CAP) 0 0 5,600
ESG Program Administration (10% CAP) 0 105,200 0
TOTALS 7,980,100 10,949,100 92,600
A - 26 FY 2020-2021 Final Revised Budget
FY 2020-2021 Federal Entitlement Funding

Combined Fund Summary
All Funds (in 00)
Description General
Fund
Special Revenue
Funds Capital Funds
Enterprise Funds
Internal Service Funds
Debt Service Funds Total
Revenues
Beginning Balance 650,716 143,045 357,315 2,966,899 353,188 0 4,471,163
Taxes 2,698,322 352,740 0 8,821 11 0 3,059,894
Licenses & Permits 281,134 1,502 0 1,500 0 0 284,136
Intergovernmental Revenue 103,715 2,132,868 59,029 1,550,798 3,871 0 3,850,281
Charges for Services 310,082 35,473 92,628 2,747,020 20,121 0 3,205,324
Fines 29,846 1,500 0 0 13,750 0 45,096
Other Revenue 11,905 11,115 5,584 186,292 7,987 0 222,883
Interdepartmental Charges for Services 103,879 0 0 0 1,220,604 1,376 1,325,859
Misc. Revenue 17,425 1,423 2,600 837,356 11,783 0 870,587
Transfers 278,263 (462,096) (4,191) 21,427 40,718 307,977 182,098
Total Revenues 4,485,287 2,217,570 512,965 8,320,113 1,672,033 309,353 17,517,321
Expenditures
Employee Services 2,768,170 381,343 30,850 1,201,403 331,625 0 4,713,391
Purchased Prof and Tech 428,992 244,418 4,000 381,603 54,797 321 1,114,131
Purchased Property Services 90,587 56,496 38,681 313,749 139,413 0 638,926
Other Purchased Services 14,015 11,211 34 12,189 56,406 0 93,855
Supplies 39,085 227,015 9,243 252,565 173,137 0 701,045
Property 114,493 1,148,910 160,722 2,044,117 330,954 0 3,799,196
Other Objects 191,944 740,517 48,125 910,100 46,423 309,032 2,246,141
Interdepartmental Charges 448,027 159,750 20,323 611,379 85,461 0 1,324,940
Contingencies 1,697 0 0 0 35,000 0 36,697
Insurance Claims, Refunds 0 0 0 0 282,337 0 282,337
Total Expenditures 4,097,010 2,969,660 311,978 5,727,105 1,535,553 309,353 14,950,659
Ending Balance 388,277 (752,090) 200,987 2,593,008 136,480 0 2,566,662
Note 1: The Ending Balance in the General Fund Type includes $35,882,300 Emergency Fund, $1,716,300 for the 27th Pay Period Reserve, and $1,299,800 for the Asset Sale Reserve Fund. Note 2: Special Revenue Fund includes grants and Measure C Tier 1 that requires expenditures before receiving reimbursement. The deficit balance is a temporary timing difference between expenditure and request for funds.
FY 2020-2021 Final Revised Budget A - 27

General Fund (in 00)
Description City
Council
Office of the Mayor
City Clerk
City Attorney Police Fire
Parks & Rec
Public Works
Revenues
Beginning Balance 0 0 0 0 0 0 0 0
Taxes 0 0 0 0 0 0 0 0
Licenses & Permits 0 0 0 0 600 6,470 0 12,705
Intergovernmental Revenue 0 0 0 0 48,204 9,700 314 800
Charges for Services 0 0 0 15,068 57,485 64,155 14,584 33,971
Fines 0 0 0 8 470 600 0 0
Other Revenue 0 0 0 180 25 0 745 650
Interdepartmental Charges for Services 0 0 0 0 50 0 0 0
Misc. Revenue 0 0 0 3,195 690 2,555 2,554 12
Transfers 1,246 2,539 0 8,000 140,242 50,494 27,404 604
Total Revenues 1,246 2,539 0 26,451 247,766 133,974 45,601 48,742
Expenditures
Employee Services 23,609 38,666 5,323 145,166 1,661,190 602,114 103,275 52,502
Purchased Prof and Tech 511 1,655 177 8,631 17,889 10,257 1,201 5,787
Purchased Property Services 20 2,520 75 97 24,520 11,918 38,658 4,600
Other Purchased Services 321 419 272 1,140 3,380 5,415 352 99
Supplies 553 120 449 702 10,324 12,346 8,850 2,593
Property 0 50 0 346 8,332 33,631 46,557 6,056
Other Objects 17,461 689 1,135 21,328 3,988 2,683 63,192 2,433
Interdepartmental Charges 7,532 6,309 2,508 23,487 233,941 56,763 25,645 32,661
Contingencies 1,697 0 0 0 0 0 0 0
Insurance Claims, Refunds 0 0 0 0 0 0 0 0
Total Expenditures 51,704 50,428 9,939 200,897 1,963,564 735,127 287,730 106,731
Ending Balance (50,458) (47,889) (9,939) (174,446) (1,715,798) (601,153) (242,129) (57,989)
Note 1: The Ending Balance in the General Fund Type includes $35,882,300 Emergency Fund, $1,716,300 for the 27th Pay Period Reserve, and $1,299,800 for the Asset Sale Reserve Fund. Note 2: Balances in red denote the amount of General Fund support to cover the appropriations. The majority of General Fund revenues are captured in the General City Purpose Department.
A - 28 FY 2020-2021 Final Revised Budget
Combined Fund Summary
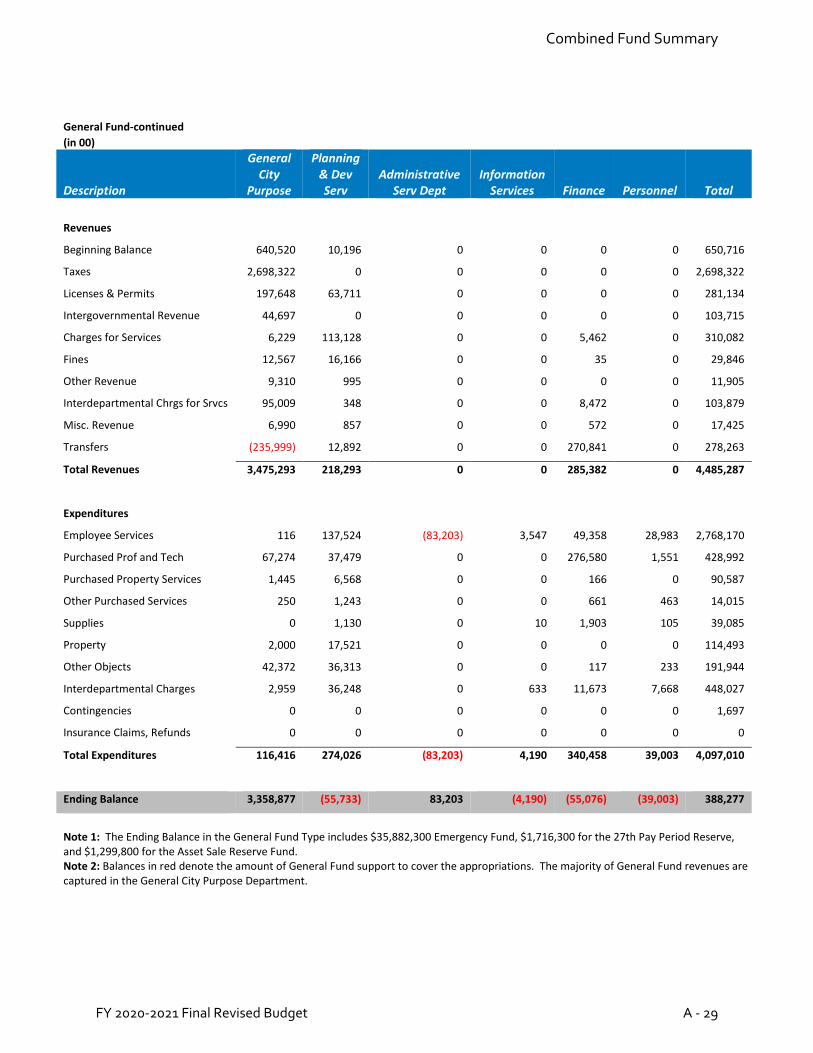
General Fund-continued (in 00)
Description
General City
Purpose
Planning & Dev Serv
Administrative Serv Dept
Information Services Finance Personnel Total
Revenues
Beginning Balance 640,520 10,196 0 0 0 0 650,716
Taxes 2,698,322 0 0 0 0 0 2,698,322
Licenses & Permits 197,648 63,711 0 0 0 0 281,134
Intergovernmental Revenue 44,697 0 0 0 0 0 103,715
Charges for Services 6,229 113,128 0 0 5,462 0 310,082
Fines 12,567 16,166 0 0 35 0 29,846
Other Revenue 9,310 995 0 0 0 0 11,905
Interdepartmental Chrgs for Srvcs 95,009 348 0 0 8,472 0 103,879
Misc. Revenue 6,990 857 0 0 572 0 17,425
Transfers (235,999) 12,892 0 0 270,841 0 278,263
Total Revenues 3,475,293 218,293 0 0 285,382 0 4,485,287
Expenditures
Employee Services 116 137,524 (83,203) 3,547 49,358 28,983 2,768,170
Purchased Prof and Tech 67,274 37,479 0 0 276,580 1,551 428,992
Purchased Property Services 1,445 6,568 0 0 166 0 90,587
Other Purchased Services 250 1,243 0 0 661 463 14,015
Supplies 0 1,130 0 10 1,903 105 39,085
Property 2,000 17,521 0 0 0 0 114,493
Other Objects 42,372 36,313 0 0 117 233 191,944
Interdepartmental Charges 2,959 36,248 0 633 11,673 7,668 448,027
Contingencies 0 0 0 0 0 0 1,697
Insurance Claims, Refunds 0 0 0 0 0 0 0
Total Expenditures 116,416 274,026 (83,203) 4,190 340,458 39,003 4,097,010
Ending Balance 3,358,877 (55,733) 83,203 (4,190) (55,076) (39,003) 388,277
Note 1: The Ending Balance in the General Fund Type includes $35,882,300 Emergency Fund, $1,716,300 for the 27th Pay Period Reserve, and $1,299,800 for the Asset Sale Reserve Fund. Note 2: Balances in red denote the amount of General Fund support to cover the appropriations. The majority of General Fund revenues are captured in the General City Purpose Department.
FY 2020-2021 Final Revised Budget A - 29
Combined Fund Summary
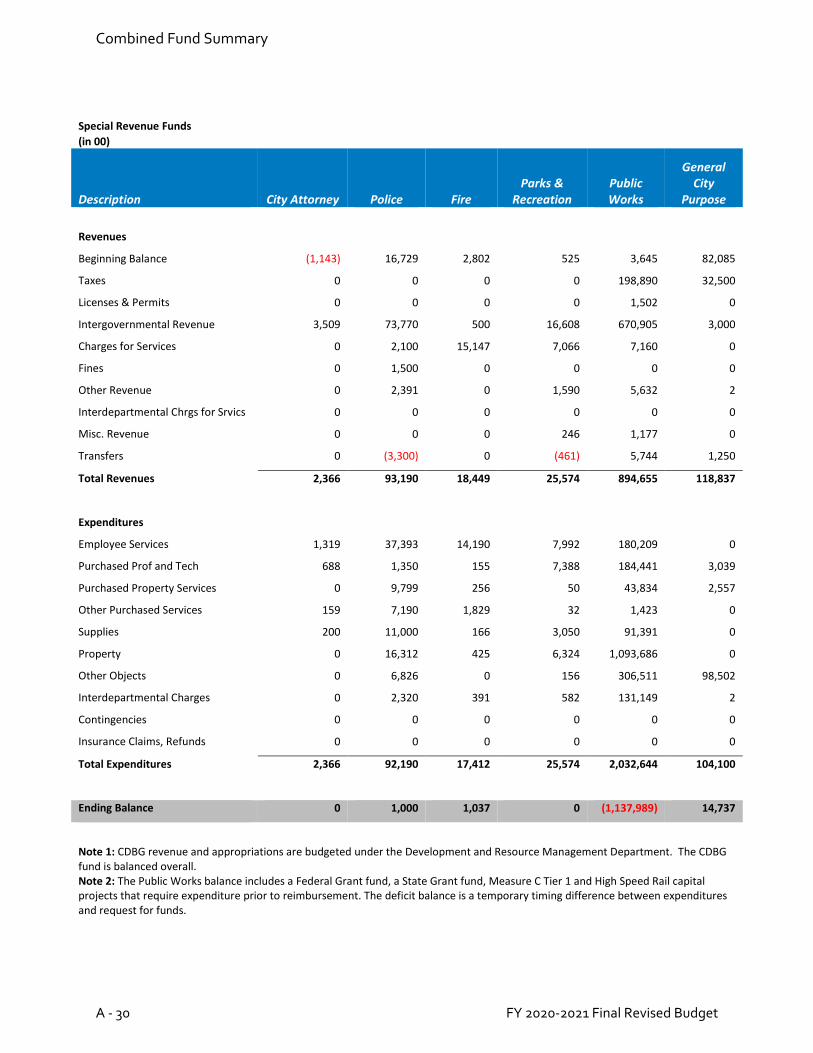
Special Revenue Funds (in 00)
Description City Attorney Police Fire Parks &
Recreation Public Works
General City
Purpose
Revenues
Beginning Balance (1,143) 16,729 2,802 525 3,645 82,085
Taxes 0 0 0 0 198,890 32,500
Licenses & Permits 0 0 0 0 1,502 0
Intergovernmental Revenue 3,509 73,770 500 16,608 670,905 3,000
Charges for Services 0 2,100 15,147 7,066 7,160 0
Fines 0 1,500 0 0 0 0
Other Revenue 0 2,391 0 1,590 5,632 2
Interdepartmental Chrgs for Srvics 0 0 0 0 0 0
Misc. Revenue 0 0 0 246 1,177 0
Transfers 0 (3,300) 0 (461) 5,744 1,250
Total Revenues 2,366 93,190 18,449 25,574 894,655 118,837
Expenditures
Employee Services 1,319 37,393 14,190 7,992 180,209 0
Purchased Prof and Tech 688 1,350 155 7,388 184,441 3,039
Purchased Property Services 0 9,799 256 50 43,834 2,557
Other Purchased Services 159 7,190 1,829 32 1,423 0
Supplies 200 11,000 166 3,050 91,391 0
Property 0 16,312 425 6,324 1,093,686 0
Other Objects 0 6,826 0 156 306,511 98,502
Interdepartmental Charges 0 2,320 391 582 131,149 2
Contingencies 0 0 0 0 0 0
Insurance Claims, Refunds 0 0 0 0 0 0
Total Expenditures 2,366 92,190 17,412 25,574 2,032,644 104,100
Ending Balance 0 1,000 1,037 0 (1,137,989) 14,737
Note 1: CDBG revenue and appropriations are budgeted under the Development and Resource Management Department. The CDBG fund is balanced overall. Note 2: The Public Works balance includes a Federal Grant fund, a State Grant fund, Measure C Tier 1 and High Speed Rail capital projects that require expenditure prior to reimbursement. The deficit balance is a temporary timing difference between expenditures and request for funds.
A - 30 FY 2020-2021 Final Revised Budget
Combined Fund Summary

Special Revenue Funds (in 00)
Description
Planning & Development
Services Convention
Center FAX Finance Total
Revenues
Beginning Balance (21,674) 0 60,076 0 143,045
Taxes 0 0 121,350 0 352,740
Licenses & Permits 0 0 0 0 1,502
Intergovernmental Revenue 568,715 0 0 795,861 2,132,868
Charges for Services 0 4,000 0 0 35,473
Fines 0 0 0 0 1,500
Other Revenue 0 0 1,500 0 11,115
Interdepartmental Chrgs for Srvics 0 0 0 0 0
Misc. Revenue 0 0 0 0 1,423
Transfers 0 (4,000) 97,023 (558,352) (462,096)
Total Revenues 547,041 0 279,949 237,509 2,217,570
Expenditures
Employee Services 41,390 0 98,850 0 381,343
Purchased Prof and Tech 47,357 0 0 0 244,418
Purchased Property Services 0 0 0 0 56,496
Other Purchased Services 578 0 0 0 11,211
Supplies 110,486 0 10,722 0 227,015
Property 31,063 0 1,100 0 1,148,910
Other Objects 308,572 0 19,950 0 740,517
Interdepartmental Charges 5,832 0 19,474 0 159,750
Contingencies 0 0 0 0 0
Insurance Claims, Refunds 0 0 0 0 0
Total Expenditures 545,278 0 150,096 0 2,969,660
Ending Balance 1,763 0 129,853 237,509 (752,090)
Note 1: CDBG revenue and appropriations are budgeted under the Development and Resource Management Department. The CDBG fund is balanced overall. Note 2: The Public Works balance includes a Federal Grant fund, a State Grant fund, Measure C Tier 1 and High Speed Rail capital projects that require expenditure prior to reimbursement. The deficit balance is a temporary timing difference between expenditures and request for funds.
FY 2020-2021 Final Revised Budget A - 31
Combined Fund Summary

Capital Funds
(in 00)
Description Police Fire Parks &
Recreation Public Works Total
Revenues
Beginning Balance (15,388) 10,063 1,380 361,260 357,315
Taxes 0 0 0 0 0
Licenses & Permits 0 0 0 0 0
Intergovernmental Revenue 0 0 0 59,029 59,029
Charges for Services 0 0 624 92,004 92,628
Fines 0 0 0 0 0
Other Revenue 0 0 19 5,565 5,584
Interdepartmental Charges for Services 0 0 0 0 0
Misc. Revenue 0 0 0 2,600 2,600
Transfers 17,129 (3,573) 0 (17,747) (4,191)
Total Revenues 1,741 6,490 2,023 502,711 512,965
Expenditures
Employee Services 0 0 1,034 29,816 30,850
Purchased Prof and Tech 0 0 847 3,153 4,000
Purchased Property Services 1,699 0 80 36,902 38,681
Other Purchased Services 0 0 0 34 34
Supplies 0 0 89 9,154 9,243
Property 1,250 1,245 63,512 94,715 160,722
Other Objects 300 0 900 46,925 48,125
Interdepartmental Charges 0 0 25 20,298 20,323
Contingencies 0 0 0 0 0
Insurance Claims, Refunds 0 0 0 0 0
Total Expenditures 3,249 1,245 66,487 240,997 311,978
Ending Balance (1,508) 5,245 (64,464) 261,714 200,987
A - 32 FY 2020-2021 Final Revised Budget
Combined Fund Summary

Enterprise Funds (in 00)
Description Police
Parks & Recreation
Public Works
Public Utilities Airports
Convention Center FAX Total
Revenues
Beginning Balance 4,435 3,823 230,681 2,211,280 294,741 30,525 191,414 2,966,899
Taxes 0 0 1 28 8,792 0 0 8,821
Licenses & Permits 0 0 1,500 0 0 0 0 1,500
Intergovernmental Revenue 0 0 1,872 82,548 422,453 0 1,043,925 1,550,798
Charges for Services 25,574 193 189,821 2,335,404 149,235 3,000 43,793 2,747,020
Fines 0 0 0 0 0 0 0 0
Other Revenue 0 3,296 3,935 65,148 102,185 5,463 6,265 186,292
Interdepartmental Chrgs for Srvcs 0 0 0 0 0 0 0 0
Misc. Revenue 0 0 3,235 509,628 310,028 11,765 2,700 837,356
Transfers 0 461 1,874 11,155 0 104,960 (97,023) 21,427
Total Revenues 30,009 7,773 432,919 5,215,191 1,287,434 155,713 1,191,074 8,320,113
Expenditures
Employee Services 30,001 709 81,055 658,697 117,462 0 313,479 1,201,403
Purchased Prof and Tech 0 54 6,360 210,337 33,877 32,160 98,815 381,603
Purchased Property Services 0 165 12,490 232,421 31,876 701 36,096 313,749
Other Purchased Services 0 0 562 7,132 1,914 0 2,581 12,189
Supplies 8 68 7,499 199,091 7,714 0 38,185 252,565
Property 0 6,454 974 731,033 774,931 36,676 494,049 2,044,117
Other Objects 0 1,300 30,458 719,821 64,717 86,027 7,777 910,100
Interdepartmental Charges 0 60 82,247 430,876 44,181 0 54,015 611,379
Contingencies 0 0 0 0 0 0 0 0
Insurance Claims, Refunds 0 0 0 0 0 0 0 0
Total Expenditures 30,009 8,810 221,645 3,189,408 1,076,672 155,564 1,044,997 5,727,105
Ending Balance 0 (1,037) 211,274 2,025,783 210,762 149 146,077 2,593,008
FY 2020-2021 Final Revised Budget A - 33
Combined Fund Summary
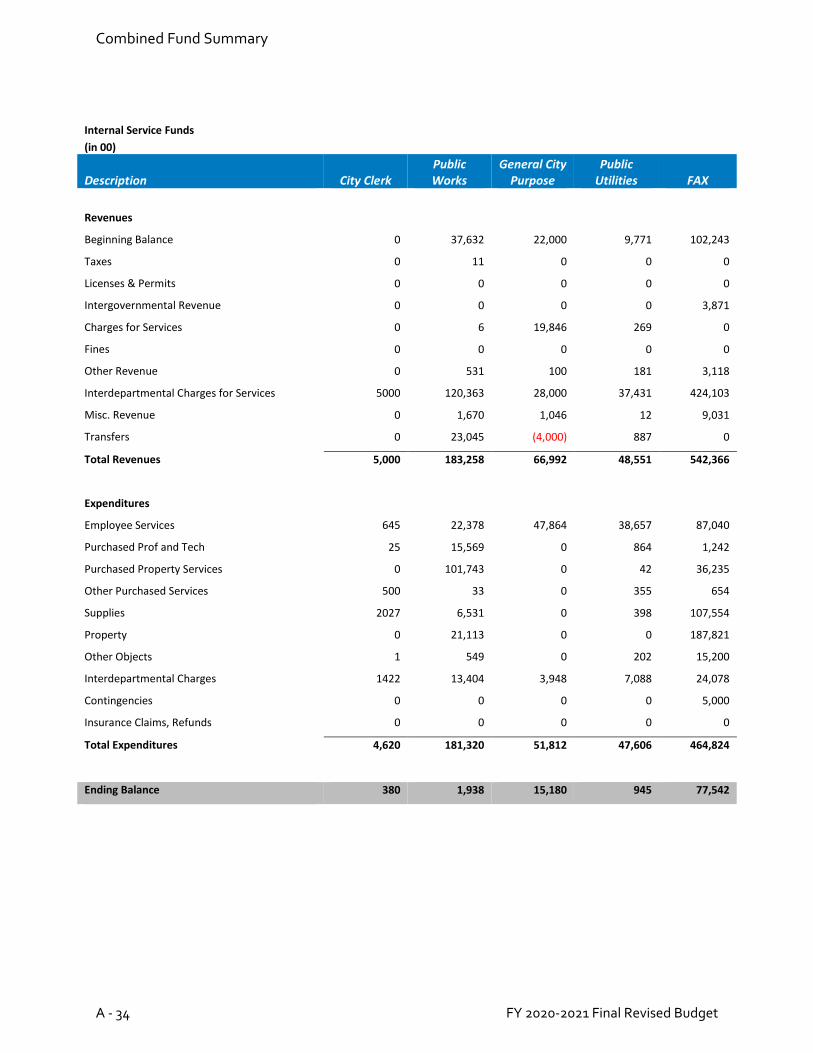
Internal Service Funds
(in 00)
Description City Clerk Public Works
General City Purpose
Public Utilities FAX
Revenues
Beginning Balance 0 37,632 22,000 9,771 102,243
Taxes 0 11 0 0 0
Licenses & Permits 0 0 0 0 0
Intergovernmental Revenue 0 0 0 0 3,871
Charges for Services 0 6 19,846 269 0
Fines 0 0 0 0 0
Other Revenue 0 531 100 181 3,118
Interdepartmental Charges for Services 5000 120,363 28,000 37,431 424,103
Misc. Revenue 0 1,670 1,046 12 9,031
Transfers 0 23,045 (4,000) 887 0
Total Revenues 5,000 183,258 66,992 48,551 542,366
Expenditures
Employee Services 645 22,378 47,864 38,657 87,040
Purchased Prof and Tech 25 15,569 0 864 1,242
Purchased Property Services 0 101,743 0 42 36,235
Other Purchased Services 500 33 0 355 654
Supplies 2027 6,531 0 398 107,554
Property 0 21,113 0 0 187,821
Other Objects 1 549 0 202 15,200
Interdepartmental Charges 1422 13,404 3,948 7,088 24,078
Contingencies 0 0 0 0 5,000
Insurance Claims, Refunds 0 0 0 0 0
Total Expenditures 4,620 181,320 51,812 47,606 464,824
Ending Balance 380 1,938 15,180 945 77,542
A - 34 FY 2020-2021 Final Revised Budget
Combined Fund Summary

Internal Service Funds (in 00)
Description Information
Services Finance Personnel Services Total
Revenues
Beginning Balance 74,150 21,456 85,936 353,188
Taxes 0 0 0 11
Licenses & Permits 0 0 0 0
Intergovernmental Revenue 0 0 0 3,871
Charges for Services 0 0 0 20,121
Fines 0 10,000 3,750 13,750
Other Revenue 884 2,590 583 7,987
Interdepartmental Charges for Services 218,903 55,851 330,953 1,220,604
Misc. Revenue 24 0 0 11,783
Transfers 20,537 249 0 40,718
Total Revenues 314,498 90,146 421,222 1,672,033
Expenditures
Employee Services 73,695 48,174 13,172 331,625
Purchased Prof and Tech 915 81 36,101 54,797
Purchased Property Services 596 759 38 139,413
Other Purchased Services 19,394 4,255 31,215 56,406
Supplies 46,587 9,206 834 173,137
Property 120,270 1,750 0 330,954
Other Objects 19,893 10,030 548 46,423
Interdepartmental Charges 13,402 15,454 6,665 85,461
Contingencies 0 0 30,000 35,000
Insurance Claims, Refunds 0 0 282,337 282,337
Total Expenditures 294,752 89,709 400,910 1,535,553
Ending Balance 19,746 437 20,312 136,480
FY 2020-2021 Final Revised Budget A - 35
Combined Fund Summary

Debt Service Funds (in 00)
Description Police Fire
Parks & Recreation Public Works
General City Purpose Total
Revenues
Beginning Balance 0 0 0 0 0 0
Taxes 0 0 0 0 0 0
Licenses & Permits 0 0 0 0 0 0
Intergovernmental Revenue 0 0 0 0 0 0
Charges for Services 0 0 0 0 0 0
Fines 0 0 0 0 0 0
Other Revenue 0 0 0 0 0 0
Interdepartmental Charges for Services 0 0 0 0 1,376 1,376
Misc. Revenue 0 0 0 0 0 0
Transfers 13,734 11,846 18,261 1,389 262,747 307,977
Total Revenues 13,734 11,846 18,261 1,389 264,123 309,353
Expenditures
Employee Services 0 0 0 0 0 0
Purchased Prof and Tech 27 25 50 45 174 321
Purchased Property Services 0 0 0 0 0 0
Other Purchased Services 0 0 0 0 0 0
Supplies 0 0 0 0 0 0
Property 0 0 0 0 0 0
Other Objects 13,707 11,821 18,211 1,344 263,949 309,032
Interdepartmental Charges 0 0 0 0 0 0
Contingencies 0 0 0 0 0 0
Insurance Claims, Refunds 0 0 0 0 0 0
Total Expenditures 13,734 11,846 18,261 1,389 264,123 309,353
Ending Balance 0 0 0 0 0 0
A - 36 FY 2020-2021 Final Revised Budget
Combined Fund Summary
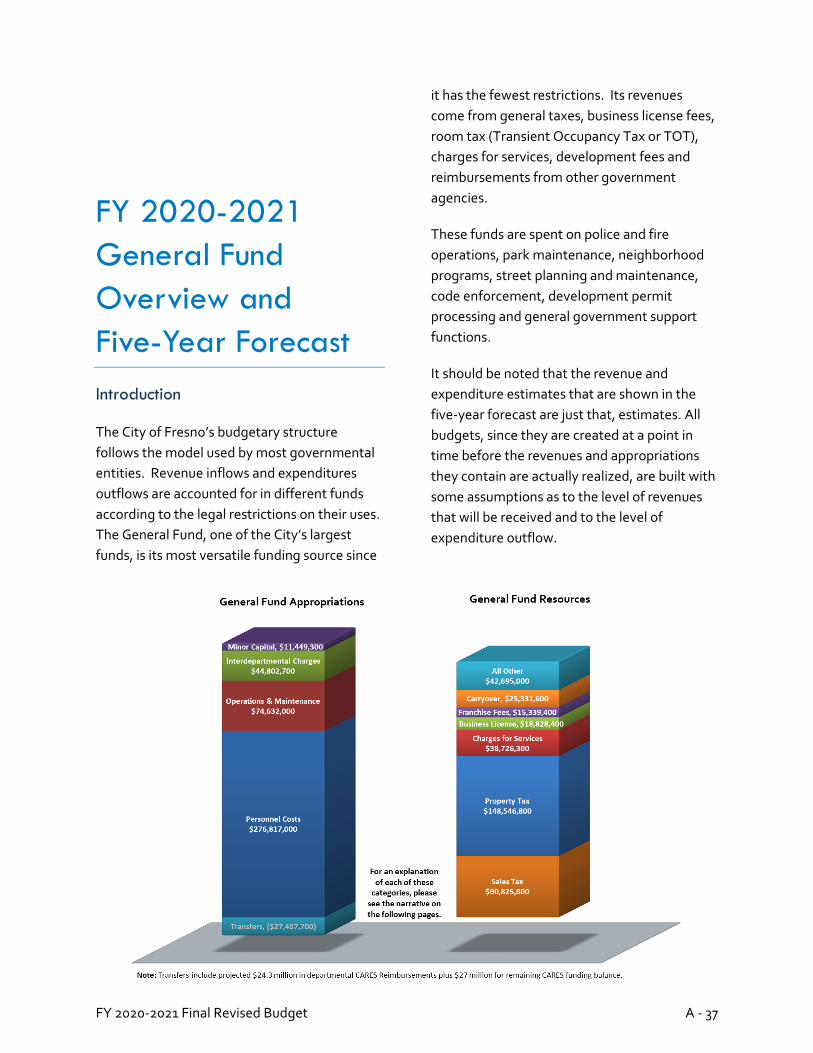
FY 2020-2021 General Fund Overview and Five-Year Forecast Introduction
The City of Fresno’s budgetary structure follows the model used by most governmental entities. Revenue inflows and expenditures outflows are accounted for in different funds according to the legal restrictions on their uses. The General Fund, one of the City’s largest funds, is its most versatile funding source since
it has the fewest restrictions. Its revenues come from general taxes, business license fees, room tax (Transient Occupancy Tax or TOT), charges for services, development fees and reimbursements from other government agencies.
These funds are spent on police and fire operations, park maintenance, neighborhood programs, street planning and maintenance, code enforcement, development permit processing and general government support functions.
It should be noted that the revenue and expenditure estimates that are shown in the five-year forecast are just that, estimates. All budgets, since they are created at a point in time before the revenues and appropriations they contain are actually realized, are built with some assumptions as to the level of revenues that will be received and to the level of expenditure outflow.
FY 2020-2021 Final Revised Budget A - 37
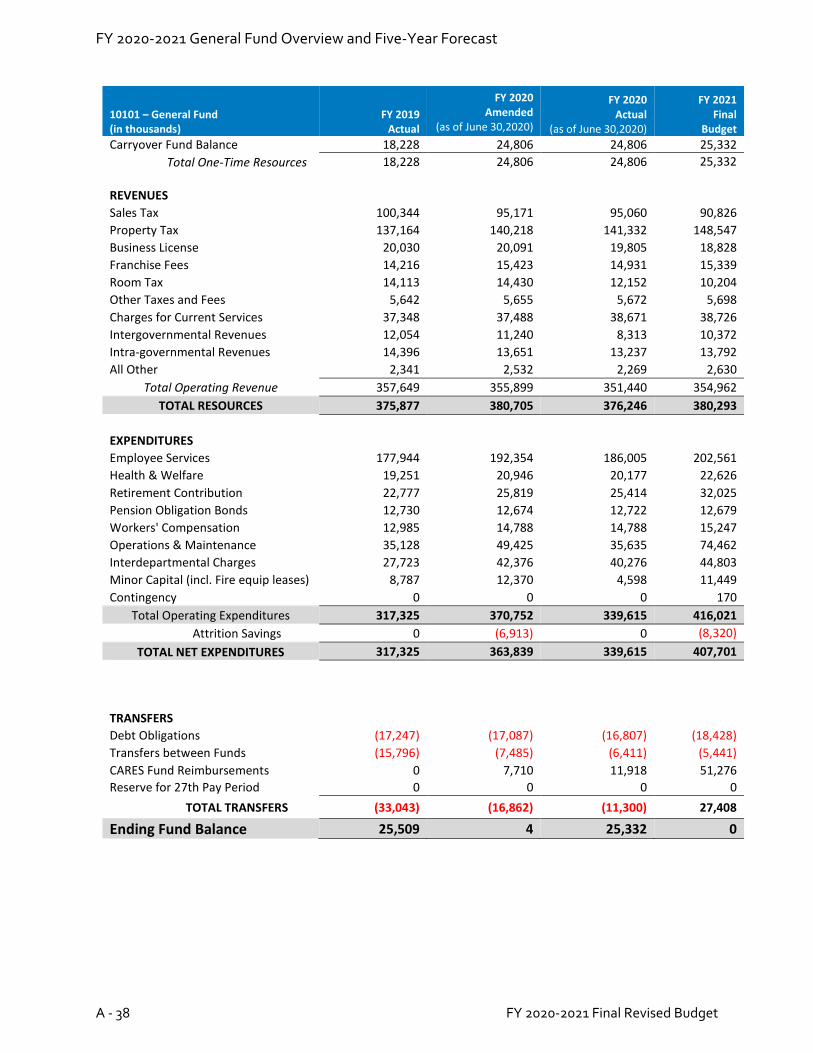
10101 – General Fund (in thousands)
FY 2019 Actual
FY 2020 Amended
(as of June 30,2020)
FY 2020 Actual
(as of June 30,2020)
FY 2021 Final
Budget Carryover Fund Balance 18,228 24,806 24,806 25,332
Total One-Time Resources 18,228 24,806 24,806 25,332
REVENUES Sales Tax 100,344 95,171 95,060 90,826 Property Tax 137,164 140,218 141,332 148,547 Business License 20,030 20,091 19,805 18,828 Franchise Fees 14,216 15,423 14,931 15,339 Room Tax 14,113 14,430 12,152 10,204 Other Taxes and Fees 5,642 5,655 5,672 5,698 Charges for Current Services 37,348 37,488 38,671 38,726 Intergovernmental Revenues 12,054 11,240 8,313 10,372 Intra-governmental Revenues 14,396 13,651 13,237 13,792 All Other 2,341 2,532 2,269 2,630
Total Operating Revenue 357,649 355,899 351,440 354,962 TOTAL RESOURCES 375,877 380,705 376,246 380,293
EXPENDITURES Employee Services 177,944 192,354 186,005 202,561 Health & Welfare 19,251 20,946 20,177 22,626 Retirement Contribution 22,777 25,819 25,414 32,025 Pension Obligation Bonds 12,730 12,674 12,722 12,679 Workers' Compensation 12,985 14,788 14,788 15,247 Operations & Maintenance 35,128 49,425 35,635 74,462 Interdepartmental Charges 27,723 42,376 40,276 44,803 Minor Capital (incl. Fire equip leases) 8,787 12,370 4,598 11,449 Contingency 0 0 0 170
Total Operating Expenditures 317,325 370,752 339,615 416,021 Attrition Savings 0 (6,913) 0 (8,320)
TOTAL NET EXPENDITURES 317,325 363,839 339,615 407,701
TRANSFERS Debt Obligations (17,247) (17,087) (16,807) (18,428) Transfers between Funds (15,796) (7,485) (6,411) (5,441) CARES Fund Reimbursements 0 7,710 11,918 51,276 Reserve for 27th Pay Period 0 0 0 0
TOTAL TRANSFERS (33,043) (16,862) (11,300) 27,408
Ending Fund Balance 25,509 4 25,332 0
A - 38 FY 2020-2021 Final Revised Budget
FY 2020-2021 General Fund Overview and Five-Year Forecast

10101 – General Fund (in thousands)
FY 2022 Forecast
FY 2023 Forecast
FY 2024 Forecast
FY 2025 Forecast
Carryover Fund Balance 0 (28,731) (55,354) (71,359) Total One Time Resources 0 (28,731) (55,354) (71,359)
REVENUES Sales Tax 94,460 98,706 103,143 108,298 Property Tax 155,992 163,809 172,018 180,638 Business License 20,500 21,013 21,538 22,076 Franchise Fees 15,723 16,116 16,519 16,932 Room Tax 12,698 13,206 13,735 14,284 Other Taxes and Fees 5,812 5,928 6,046 6,167 Charges for Current Services 41,459 41,527 42,773 44,056 Intergovernmental Revenues 9,362 9,422 9,482 9,543 Intra-governmental Revenues 14,068 14,304 14,585 14,876 All Other 3,854 4,878 6,903 7,928
Total Operating Revenue 373,928 388,909 406,741 424,798 TOTAL RESOURCES 373,928 360,178 351,387 353,440
EXPENDITURES Employee Services 208,638 215,418 222,420 230,204 Health & Welfare 23,370 24,141 24,938 25,761 Retirement Contribution 33,142 34,302 35,502 36,745 Pension Obligation Bonds 12,679 12,679 12,679 12,679 Workers' Compensation 15,552 15,863 16,180 16,504 Operations & Maintenance 39,854 40,749 41,563 42,392 Interdepartmental Charges 44,453 45,247 45,925 46,614 Minor Capital (incl. Fire equip leases) 10,186 11,325 11,783 12,147 Contingency 0 0 0 0
Total Operating Expenditures 387,873 399,724 410,990 423,046 Attrition Savings (8,421) (8,692) (8,971) (9,276)
TOTAL NET EXPENDITURES 379,452 391,033 402,019 413,770
TRANSFERS Debt Obligations (19,274) (19,716) (16,200) (14,769) Transfers between Funds (3,533) (3,984) (3,726) (3,733) CARES Fund Reimbursements 0 0 0 0 Reserve for 27th Pay Period (400) (800) (800) (800)
TOTAL TRANSFERS (23,207) (24,500) (20,726) (19,302) Ending Fund Balance (28,731) (55,354) (71,359) (79,632)
Note: Data in the actual columns may not equal the column totals due to rounding.
FY 2020-2021 Final Revised Budget A - 39
FY 2020-2021 General Fund Overview and Five-Year Forecast

For FY 2020 actual results, the General Fund’s ending net balance totaled a positive $25.3 million. Key contributors towards the positive ending balance included total expenditures ending the fiscal year at $339.6 million or $24.2 million lower than the Amended Budget along with transfers ending the fiscal year at a negative $11.3 million or $5.6 million lower than Budget.
The General Fund expenditures favorable variance primarily corresponded to $9.1 million of unspent capital, as well as $15.1 million in lower departmental operational spending. In addition, net transfers activity were $5.6 million under budget, primarily due to additional reimbursements from the CARES Act Fund.
The favorable variances were partially offset by overall FY 2020 revenues ending the fiscal year at $376.2 million, which was $4.5 million under Budget. Over 50 percent of this decline was accounted for by the $2.3 million reduction in
Room Tax that correlates to the COVID-19 pandemic effect as the State and local emergency orders of in-sheltering along with travel restrictions that have taken place.
Further detailed discussion will be provided on the following pages by revenue and expenditure category in regards to FY 2020 actual results along with FY 2021 Final Revised Budget assumptions.
Revenues
The General Fund’s three largest revenues are Property Tax, Sales Tax and Charges for Services; together they accounted for 78.3 percent of total FY 2020 actual operating revenues. In combination, these categories ended the fiscal year better than Budget by $2.2 million.
A - 40 FY 2020-2021 Final Revised Budget
FY 2020-2021 General Fund Overview and Five-Year Forecast

Property Tax The category of Property Tax is made up of several different types of property taxes including real secured, unsecured, delinquent taxes, penalties and supplemental taxes. Of these, only real secured is impacted by changes in the Assessed Valuations (AV). During the recession, downward reassessments caused the AV and secured property revenue to decline. This trend has reversed itself, with property values seeing a steady growth.
Also included in the Property Tax category is property tax received as a part of the “MVLF Swap.” Effective in FY 2012, State Senate bill 89 eliminated the remaining Motor Vehicle License Fee (MVLF) revenue allocated to cities. Instead cites now receive property taxes under the “MVLF Swap.” The Swap provides cities with additional property tax share to compensate for the related cut in the MVLF tax rate and revenue.
FY 2020 actual Property Tax revenues ended at $141.3 million, a $1.1 million increase above Budget. The bulk of the increase was the result of better than anticipated 2nd and 3rd Real Secured disbursements. This revenue category accounted 40.2 percent of total operating revenues.
Property Tax Assumptions For the FY 2021 Final Revised Budget, the total amount of Property Tax revenues is projected to be $148.5 million, making this the largest General Fund resource at 41.8 percent. The FY 2021 amount represents a 5.1 percent increase over FY 2020 actual revenues. This increase is believed to be reasonable given the annual growth over the last three years has averaged at 5.0 percent.
This projection includes revenues estimated as a result of the anticipated increase in assessed property values. In addition, current and
projected development activity, such as permit, inspection and plan checks, in conjunction to the current low interest rate environment indicate continued growth in housing demand.
For FY 2022-2025, increases of 5.0 percent per year are assumed. The Property Tax growth rate percentages include the additional Property Tax increment.
Sales and Use Tax Sales and Use Taxes are the second largest revenue for the General Fund. Historical trends and the health of the local economy are primary measures for projecting this revenue. The City employs Muni Services, LLC to ensure the City receives all of the sales tax revenue to which it is entitled, as well as provide an independent resource for forecasting.
According to the latest data, the five largest revenue producing economic segments for the City are restaurants, department stores, new auto sales, service stations, and Building Materials wholesale. Out of the 28 business segments tracked by Muni Services, these five are nearly 48 percent of total City Sales Tax revenues.
FY 2020 actual Sales Tax ended the fiscal year at $95.1 million, just under Budget. It also accounted for 27.0 percent of total operating revenues. The City’s last projection, based on actuals through February 2020, looked to end the fiscal year at $84.5 million. However, this projection was made just prior to the implementation of State and local emergency orders. Little to no formal consumer spending data was available at that time to begin gauging the pandemic effect on Sales Tax.
The months of April 2020 through June 2020 or 2nd quarter Sales Tax receipts were finalized by the California Department of Taxes and Fees Administration in August 2020. The 2nd quarter
FY 2020-2021 Final Revised Budget A - 41
FY 2020-2021 General Fund Overview and Five-Year Forecast

Sales Tax disbursement reflected continued consumer spending at our top businesses, such as Wal Mart, Target, Costco, as well as construction suppliers, which all held steady compared to the prior quarter results.
In addition, our share of Sales Tax that is received through the County pool continues to grow. The City of Fresno received $4.7 million for the 2nd quarter of 2020 (April through June), an increase of $1.3 million from prior quarter. Of this increase, $0.6 million resulted from the established Marketplace Facilitators Act for third party retailers. The City of Fresno received 59.6 percent of the total County pool for the 2nd quarter.
It should also be noted that that the CARES Act passed in March 2020, specifically the $600 weekly enhancement to unemployment benefits, contributed towards consumer
spending as observed from April through June. It is anticipated that this benefit’s positive effect on consumer spending will be reflected in the July’s Sales Tax receipts given the benefit ended July 31, 2020.
In addition, the City of Fresno has leveraged the funding provided by the passage of the Coronavirus Aid Relief and Economic Security (CARES) Act. The City of Fresno received $92.8 million of CARES Act funds. With Council’s approval of the Coronavirus Relief Fund Strategic Plan, funds have been designated to assist local businesses and residents. For example, $4.0 million have been designated to assist small businesses in the form of offering grants ($2.5 million appropriated), $0.5 million was committed to assist Micro Farmers, and $5.0 million towards residential housing assistance ($1.5 million appropriated).
A - 42 FY 2020-2021 Final Revised Budget
FY 2020-2021 General Fund Overview and Five-Year Forecast

Sales Tax Assumptions FY 2021 Sales Tax revenue is projected at $90.8 million; reflecting a decline of $4.2 million or a 4.5 percent drop from FY 2020 actual results. The projection was developed with the guidance by Muni Services, LLC. The drop incorporates the assumption that the COVID-19 Pandemic will place downward pressure on
the local economy during the 1st half of FY 2021 but also targets a gradual Sales Tax rebound for the second half of the fiscal year, trending towards pre-COVID levels.
FY 2021 – 2025 sales tax revenue is projected to grow by 4.0 percent in FY 2022 and leveling at 5.0 percent by FY 2025.
FY 2020-2021 Final Revised Budget A - 43
FY 2020-2021 General Fund Overview and Five-Year Forecast

Charges for Current Services This revenue category is the third largest General Fund source. For FY 2020, this revenue ended the FY at $38.7 million, a $1.2 million increase over the Budget. It accounted for 11.0 percent of total operating revenues. It represents revenues collected by General Fund departments: including permit fees, planning fees, building inspection fees, Park gate fees, as well as parking and citation revenues.
The $1.2 million favorable variance was primarily driven by $2.2 million of revenue generated by higher development activity (permit, planning, and inspections), along with $1.2 million for street work and subdivision inspections. However, parking and citations fees were down $1.1 million and park gate fees and recreational fees were also down $0.8 million, The drop in fees corresponded to Fresno citizens practicing in-sheltering and
teleworking protocol as a result of emergency orders in place.
For FY 2021, Charges for Current Services is projected at $38.7 million, which is flat compared to FY 2020 actual results. However, it should be noted that development fees look to decline by $0.5 million, while parking and citations decline by $1.1 million from FY 2020 actual results. These reductions are negated by a $1.6 million projected increase in Fire inspections and Hydrant Maintenance fees.
Other Revenues
Business License Most cities in California levy a business license fee. Rates and methodology are determined by each city which collects the fees. For the City of Fresno, the maximum fee is specified in the Master Fee Schedule for Retail and Wholesale Business Tax and in the Municipal Code 7-
A - 44 FY 2020-2021 Final Revised Budget
FY 2020-2021 General Fund Overview and Five-Year Forecast

1202B. The primary driver for maintaining this revenue stream is the ongoing efforts of the Finance Department to utilize technology to enhance collection efforts.
FY 2020 Business License Fees reflected minimal impact of the Pandemic due to the timing in processing such fees. These fees ended the fiscal year at $19.8 million, a $0.3 million reduction from Budget. The Pandemic’s impact to our local businesses is projected to come into light starting October 2020. This fee is traditionally assessed twice a year.
FY 2020’s second assessment that occurred in April 2020 included payments for the period of October 2019 through March 2020. However, as mentioned the Pandemic’s effect should come into light during FY 2021’s first assessment starting October 2020, including payments for the period of April 2020 through September 2020.
FY 2021 Business License Fees are projected at $18.8 million, which is $1.0 million below FY 2020 actual results. This projection factors a slow return to pre-COVID levels starting with the second assessment in April 2021. The five-forecast assumes an average growth rate of 2.3 percent growth from FY 2022 to FY 2025.
Franchise Fees This category is comprised of revenues from several different sources. Franchise Fees are collected from Comcast, AT&T and PG&E in lieu of rent for use of the streets and rights of way in the City. The fees collected from these sources (totaling $9.1 million in FY 2020) are subject to commodity and usage. The City renegotiated the PG&E franchise fee in FY 2011, increasing the amount on the gas franchise from 1 percent to 2 percent. In FY
2012, the City began collecting a franchise fee for roll-off trash bin services and Commercial Solid Waste (CSW) operations. For FY 2020, both of these Franchise fees totaled $5.8 million.
The FY 2021 projection for these three Franchise Fee sources totals $15.3 million, a 2.7 percent growth from FY 2020 actual results. The forecast assumes a growth rate of 2.5 percent for the outer years.
Room Tax or Transient Occupancy Tax (TOT) Like Business License, a TOT may be levied by a city under the regulatory powers granted to cities in the State Constitution. More than 380 cities in California assess a TOT on people staying for 30 days or less in a hotel, inn or other lodging facility. Rates range from 4 to 15 percent of the lodging cost; the City of Fresno’s TOT rate is 12 percent.
Fiscal Year 2020 actual revenues from Room Taxes ended at $12.2 million, a $2.3 million decline from the Amended Budget. The COVID-19 Pandemic’s impact affected this revenue much faster than Sales Tax or Business License Fees. State and local emergency orders of in-sheltering along with traveling restrictions have negatively affected local hotel occupancy rates.
The FY 2021 Room Tax projection totals $10.2 million, a decline of $1.9 million from FY 2020 actual results. The projection is based on continued minimal activity through FY 2021, which correlates to tourism not recovering until late 2021 or possibly early 2022. The five-year forecast reflects a 4.0 percent per year growth for the outer fiscal years.
FY 2020-2021 Final Revised Budget A - 45
FY 2020-2021 General Fund Overview and Five-Year Forecast

Inter - and Intra - governmental Revenues The Intergovernmental type represents revenues received by the City from other governmental entities. Examples include federal and state grants, SB-90 Mandate reimbursements and reimbursements from school districts for the Student Neighborhood Resource Police Officers (SNRO) Program.
For FY 2020 actual results, Inter-governmental revenues were $8.3 million, a decline of $2.9 million from Budget. A main contributor to this decline was $1.7 million of deferred payments regarding the Fresno Unified School District School Resource Officers (SRO) and Student Neighborhood Resource Officers (SNRO) Programs. In addition, the State’s reimbursement for firefighting assistance came in $0.3 million below Budget.
The FY 2021 projection totals $10.4 million, which includes $1.3 million for FY 2020 past due payments regarding SRO & SNRO Programs. The forecast for FY 2022-2025 assumes an average growth rate of 1.0 percent.
Intra-governmental revenues are received by the General Fund for services provided to other
city departments. Examples are cost allocation charges from General Fund central service providers (such as Finance and the City Attorney’s Office) to the enterprise and internal service funds. The FY 2021 Final Revised Budget for this category totals $13.8 million, just above the FY 2020 Amended Budget.
It should be noted that this category includes the reimbursements for public safety positions utilized by the Department of Public Utilities and the Transportation Department. These personnel work for those departments on security, illegal dumping and recycling issues. These reimbursements for FY 2021 total $2.7 million, a $0.5 million drop from the FY 2020 Amended Budget.
Other Revenues This group of revenues contains miscellaneous items that do not fit in any of the above categories; these include refunds, donations, revenue from securing property, property losses and sales of real property, unclaimed property and obsolete items. The category is budgeted at $2.6 million or just below 1.0 percent of total operating revenue.
A - 46 FY 2020-2021 Final Revised Budget
FY 2020-2021 General Fund Overview and Five-Year Forecast

Appropriations
The FY 2020 actual General Fund appropriations ended the fiscal year at $339.6 million, a $24.2 million decrease from Budget. This decrease corresponded to key factors such as $9.1 million in unspent capital, $5.9 million of unspent CARES appropriations rolled into FY 2021, as well as $9.2 million lower than budgeted O&M and ID charges. The favorable variance due to CARES expenditures lower than budgeted resulted from FY 2020 appropriations established towards the end of the fiscal year with minimal time to incur expenditures. These appropriations are re-established in the FY 2021 Final Revised Budget.
The FY 2021 General Fund appropriations total $407.7 million, a $43.9 million increase from the Amended Budget. The increase primarily corresponds to establishing appropriations for the remaining balance of CARES Act funding totaling $27.0 million. This amount was derived based on the CARES Act fund’s FY 2021 beginning balance of $79.6 million, less $28.8 million included in citywide departments’ Final Revised Budget, less $23.8 million through the amendment to the Annual Appropriation Resolution process in accordance with the Coronavirus Relief Fund Strategic Plan approved by Council.
The remaining $16.9 million variance is partially the result of $3.8 million in additional appropriations established by City Council during the October Budget Hearings as follows: • Motion #13: $5,000,000 added to PARCS
budget.
• Motion #17: $150,000 for focused EIR toassess increasing the density in all mixeduse districts.
• Motion #18: $200,000 to conductComprehensive Fiscal Impact Analyses.
• Motion #20: $28,700 to convert one FireAdmin. Captain position to an Admin.Battalion Chief position.
• Motion #21: $47,700 to fund one newAccountant-Auditor position.
• Motion #22: $64,000 to fund one new GISSpecialist position.
• Motion #24: $500,000 to fundrecommendations of the Commission onPolice Reform.
• Motion #28: $50,000 to lay the groundworkand pay for associated startup costs for aCottage Home Program.
• Motion #29 & #30: $274,900 to fund twonew Police Officer and two newCommunity Service Officer positionsassigned to address illegal dumping.
• Motion #37:o $220,000 to fund additional Fire
positions.o $100,000 to fund Echo/Weldon
feasibility analysis.o $200,000 or $25,000 added to each
Council District and Mayor/CityManager’s budget.
o $1,000,000 budgeted as additionalattrition savings.
The remainder of the variance is a result of a multitude of factors including the impact of existing labor contracts, increases in Workers Compensation and other employee services. Further variance discussion by expenditure category is provided on the following pages.
FY 2020-2021 Final Revised Budget A - 47
FY 2020-2021 General Fund Overview and Five-Year Forecast

The following two charts within this section show the uses of General Fund in two different ways: 1) by Department; and 2) appropriation category. The Department graph shows the largest use of the General Fund is for public safety, Police and Fire operating, capital and safety related debt service expenditures.
The Uses of the General Fund by Department graph also includes net transfers since they provide funding to other funds for debt service, grant matches, and other items; they are still obligations for which the General Fund is responsible.
All these public safety uses comprise 70.9 percent of all General Fund uses (including Transfers). Infrastructure planning and maintenance is 9.4 percent of the General Fund
(Planning and Development, and Public Works). Parks, After School, Recreation and Community Services (PARCS) Department is 7.5 percent; the remaining departments are General Government in nature and will consume 7.1 percent of the General Fund budget in FY 2021. General Fund net transfers comprise 0.2 percent of total General Fund uses. However, it should be noted that the graph below excludes the $30.0 million budgeted in net transfers and $27.0 million in the Finance Department’s appropriations related to the remaining balance of CARES Act funding in order to normalize departments’ “true” share of the General Fund.
A - 48 FY 2020-2021 Final Revised Budget
FY 2020-2021 General Fund Overview and Five-Year Forecast

The second chart below categorizes appropriations by type. These types are explained in the following pages.
FY 2020-2021 Final Revised Budget A - 49
FY 2020-2021 General Fund Overview and Five-Year Forecast

Personnel Costs This category, made up of Employee Services (salary, fringe, overtime, leave payoffs, workers compensation, etc.), Attrition Savings, Health & Welfare, Retirement and Pension Obligation Bond (POB) costs. The increase over FY 2020 Amended is $17.2 million or 6.6 percent increase is primarily due to existing contractual wage obligations. The FY 2021 Final Revised Budget totals $276.8 million and is 67.9 percent of total net expenditures. New permanent positions added to the FY 2021 Final Revised Budget included three Fire Captains or Safety Officers established per Council Motion #8 (per June Budget Hearings).
Additional positions added during October’s Budget Hearings included an Accountant-Auditor (Motion #21), a GIS Specialist (Motion #22), two Police Officers (Motion #29), and two Community Service Officers (Motion #30) It should be also noted that $23.4 million of personnel costs is budgeted to be funded by reimbursements from the CARES Act Fund. For example, $14.8 million for Police, $4.7 million for Fire, $0.8 million for Code Enforcement.
Also increasing are Workers Compensation costs, Health & Welfare expenses, as well as pension rates. The outer years assume 3.25 percent average growth rate for employee services. As with all of the assumptions in the future years, this will be revisited and revised as the City moves into those fiscal years.
With regards to the POB, in 1983 the City of Fresno adopted Ordinance 83-116 which authorized the City to collect an additional levy upon the taxable property within the City. This levy is allowed by Section 93.31 of the Revenue and Taxation Code. However, the money collected can only be used towards payment of the bonds that were issued by the City to fully
fund the Fire and Police retirement systems. For FY 2021, revenue from this levy is estimated to cover the total General Fund POB debt service, which is $12.7 million.
Personnel costs have been calculated citywide assuming 1) a 4.0 percent increase in the Health & Welfare premium; this was based on rates approved by the Health & Welfare Board in March 2020. For FY 2022 through FY 2025, a 3.3 percent increase in total costs every year is assumed. Note that for certain bargaining units the percentage paid by the City for Health & Welfare will vary due to contract provisions.
Retirement calculations are based on the FY 2021 rates approved by the Retirement Boards on December 17, 2019. The Public Safety retirement rate is 22.82 percent (a 1.92 percent increase), and the Employee retirement rate is 13.03 percent (a 3.23 percent increase). Note that for certain bargaining units the percentage paid by the City for the retirement contribution will vary due to contract provisions.
Attrition Savings Savings of $8.3 million are assumed to be realized during Fiscal Year 2021. This amount was initially determined by taking 2.8 percent of the total combined Employee Services, Health & Welfare and Retirement Contribution costs. An additional $1.0 million of savings was budgeted per Motion #37. Historically the General Fund has underspent in its employee costs, primarily due to the normal turn over in staffing which occurs during the course of the fiscal year.
Operations and Maintenance (O&M) Total appropriations for FY 2021 are budgeted at $74.5 million, an increase of $25.0 million over FY 2020 Amended. Of the total variance, $22.0 million corresponds to appropriations added for planned CARES funding activities. These appropriations are under the Finance
A - 50 FY 2020-2021 Final Revised Budget
FY 2020-2021 General Fund Overview and Five-Year Forecast

Department ($27.0 million in FY 2021; remaining CARES Fund Balance versus $5.0 million in FY 2020; Mobile HeaL Project). The overall variance also includes $5.0 million added to PARCS Budget per Motion #13.
The $25.0 million was partially offset by $1.5 million in FY 2020 one-time appropriations ($500 thousand for Cesar Chavez Foundation, $250 thousand for Census Outreach, and $750 thousand for Save Our Small Business Program) along with $0.8 million in the planned completion of the FY 2020 capital project Neighborhood Street Improvements ($1.0 million budgeted in FY 2020 versus $0.2 million re-budgeted in FY 2021 to complete project).
Interdepartmental charges (ID Charges) This category captures costs associated with services provided by internal departments. Examples of providers include the Information Service Department that manages the City’s technology infrastructure, systems, and equipment, the Personnel Department that oversees the City’s self-insured Liability and Property funds along with managing Workers’ Compensation claims process, the Fleet Division (Transportation Department) that provide maintenance service, fuel, and acquisition of a wide-range of City vehicles, and the Facilities Division (Public Works Department) that manages work performed on citywide properties.
This expenditure category is budgeted in FY 2021 at $44.8 million, a growth of $2.4 million from the Amended Budget. The increase mainly corresponds to $1.4 million Information System services (i.e., funding to cover contractual licenses’ increases as well as required network equipment replacement) and $0.7 million in Property and Liability costs as a result of reserve depletions.
Minor Capital This category is comprised of funding for building improvements, furniture, new and replacement vehicles, computer software and lease payments for equipment. This category is budgeted in FY 2021 at $11.4 million, an overall decline of $0.9 million from FY 2020 Amended Budget. The decline was mostly attributable to the completion of the capital project Fountain Way Cedar Neighborhood Paving in August 2020 (FY 2021) under SB1 funding.
FY 2020-2021 Final Revised Budget A - 51
FY 2020-2021 General Fund Overview and Five-Year Forecast

Transfers An interdepartmental transfer between funds is the authorized exchanges of cash, or other resources between funds. The General Fund’s transfers out total $25.6 million, of which $18.4 million is legally committed to the repayment of debt service and $7.2 million corresponds to transfers out related to various contractual obligations, while $1.7 million relates to transfers into the General Fund.
In addition, the FY 2021 Final Revised Budget includes $51.3 million of one-time CARES Act reimbursements. The reimbursements include $24.3 million for anticipated reimbursements for citywide department COVID-19 efforts (i.e., salaries and operational equipment) plus $27.0 million to establish appropriations for the projected remaining balance of the CARES Act Fund.
The remaining FY 2021 CARES Act Fund balance was projected based on the following.
Type of Transfer Budget Amount CARES ACT Fund – Beg. Bal 79,586,100
Dept. Budget Submissions(1) 28,813,500
Amendments in PeopleSoft:
Small Business & Housing 2,990,000
Farm to Family 250,000
EDC 110,000
Restaurant Loss of indoor dining 600,000 `
Mobile HeaL Project 5,000,000
CV Children Serv Network 2,389,900
ISD Equip Reimb 99,500
Food Distribution 4,512,600
Testing & Tracing 3,818,100
Parkeon Pay 462,000
Telework Technology 2,500,000
Senior Aid Food Resources 500,000
Emerg. Shelter & Food Serv 518,800
Subtotal 23,750,900 CARES ACT Fund – Remaining Balance 27,021,700
Note: (1) $24.3 million corresponds to capital CARES reimbursementto General Fund departments, plus $4.5 million to Non-GF departments..
Type of Transfer Budget Amount Debt Service Payments (18,427,600)
Transfers to Other Funds (7,152,300)
Transfers into the GF 1,711,400
CARES Reimb. into the GF 51,276,200
Subtotal 45,835,300
Total Transfers 27,408,000
A - 52 FY 2020-2021 Final Revised Budget
FY 2020-2021 General Fund Overview and Five-Year Forecast
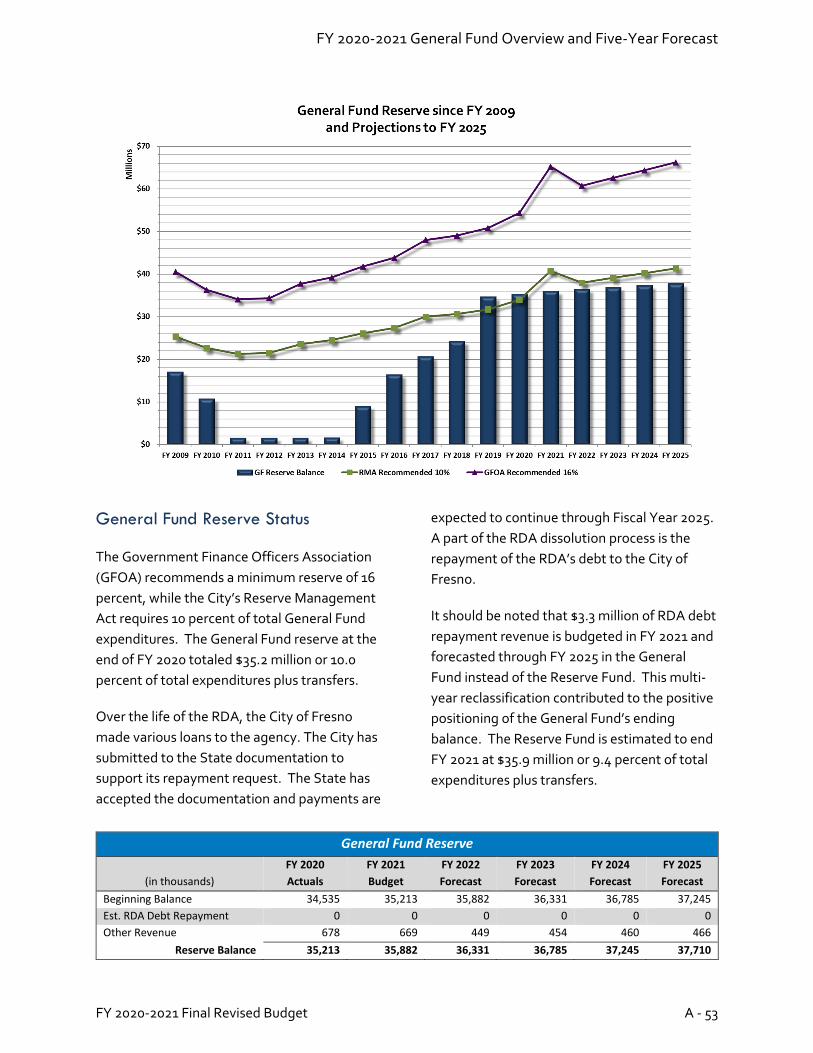
General Fund Reserve Status
The Government Finance Officers Association (GFOA) recommends a minimum reserve of 16 percent, while the City’s Reserve Management Act requires 10 percent of total General Fund expenditures. The General Fund reserve at the end of FY 2020 totaled $35.2 million or 10.0 percent of total expenditures plus transfers.
Over the life of the RDA, the City of Fresno made various loans to the agency. The City has submitted to the State documentation to support its repayment request. The State has accepted the documentation and payments are
expected to continue through Fiscal Year 2025. A part of the RDA dissolution process is the repayment of the RDA’s debt to the City of Fresno.
It should be noted that $3.3 million of RDA debt repayment revenue is budgeted in FY 2021 and forecasted through FY 2025 in the General Fund instead of the Reserve Fund. This multi-year reclassification contributed to the positive positioning of the General Fund’s ending balance. The Reserve Fund is estimated to end FY 2021 at $35.9 million or 9.4 percent of total expenditures plus transfers.
General Fund Reserve
(in thousands) FY 2020 Actuals
FY 2021 Budget
FY 2022 Forecast
FY 2023 Forecast
FY 2024 Forecast
FY 2025 Forecast
Beginning Balance 34,535 35,213 35,882 36,331 36,785 37,245 Est. RDA Debt Repayment 0 0 0 0 0 0 Other Revenue 678 669 449 454 460 466
Reserve Balance 35,213 35,882 36,331 36,785 37,245 37,710
FY 2020-2021 Final Revised Budget A - 53
FY 2020-2021 General Fund Overview and Five-Year Forecast

General Fund Debt Service
The General Fund currently pays debt service on an obligation bond, multiple lease revenue bonds, and a loan. Total aggregate General Fund debt service the City is currently obligated for is illustrated below. In addition to total General Fund debt service from FY 2021 through FY 2039, the chart and table provides the debt service percentage as compared to total General Fund appropriations in a given year. Starting in FY 2024, the year after the No Neighborhood Left Behind Lease Revenue Bonds are paid off, the required General Fund debt service payments begin to show a steady decline. After 2031 the only General Fund bond payments required pertain to the Public Safety Bonds and the Bonds originally issued under the 2004 Lease Revenue Bonds.
Year
General Fund Debt Service
Excluding Equipment
Leases
Total General Fund
Appropriations Percentage Year
General Fund Debt Service
Excluding Equipment
Leases
Total General Fund
Appropriations Percentage 2021 32,741,628 407,701,000 8.03% 2031 9,657,902 439,224,942 2.20%
2022 31,093,344 379,451,725 8.19% 2032 4,589,028 443,617,191 1.03%
2023 30,684,940 391,032,723 7.85% 2033 4,584,202 448,053,363 1.02%
2024 27,169,125 402,018,890 6.76% 2034 4,584,357 452,533,897 1.01%
2025 25,738,626 413,769,764 6.22% 2035 4,442,978 457,059,236 0.97%
2026 25,101,800 417,907,461 6.01% 2036 2,566,938 461,629,828 0.56%
2027 25,102,067 422,086,536 5.95% 2037 2,573,365 466,246,126 0.55%
2028 24,535,203 426,307,401 5.76% 2038 2,572,183 470,908,588 0.55%
2029 24,528,828 430,570,475 5.70% 2039 1,619,063 475,617,674 0.34%
2030 9,652,606 434,876,180 2.22%
Note 1: Total General Fund appropriations after FY 2025 include a one percent growth factor.
A - 54 FY 2020-2021 Final Revised Budget

Office of the Mayor and City Manager The City of Fresno operates under the strong mayor form of government. Under this system, the Mayor serves as the City’s Chief Executive Officer and is responsible for, among other things, the proper and efficient administration of all affairs of the City, appointing and overseeing the City Manager, promoting
economic development and preparing the annual budget. The City Manager Division of the Office of the Mayor houses
the administrative branch of the City of Fresno. The Division carries out policy directives of the Mayor and Council and oversees and directs the day-to-day activities and operations for all City departments, with the exception of offices provided for in the Charter.
The Mayor’s Vision for Fresno
The Mayor’s focus for Fresno includes four key initiatives: economic prosperity, public safety, quality of life and unifying the community, with economic prosperity being the cornerstone of his overall strategy.
Building on the City’s recent success in establishing a long-term fiscal policy that continues to reduce the debt, balances the budget and builds a reserve fund, the priority for the Mayor and City Manager are to make Fresno a better, safer and more prosperous place to live.
The Mayor’s FY 2021 Final Revised Budget is dedicated to funding core services, including police, fire, parks, streets, attracting thousands of new jobs and the restoration of existing neighborhoods.
The Mayor, City Manager and every member of our amazing team are committed to working collaboratively and transparently to ensure Fresno grows and advances.
Honorable MayorLee Brand
Office of the Mayor Office of the City Manager
Office of Independent Review
City Administration
FY 2020-2021 Final Revised Budget B - 1

OperatingFY 2020
AmendedFY 2021
Final Variance
General Fund 4,499,000 5,042,800 543,800
Capital 0 0 0
Total Operating 4,499,000 5,042,800 543,800
Capital
Capital 15,029,800 0 (15,029,800)
Total Capital 15,029,800 0 (15,029,800)
Grand Total 19,528,800 5,042,800 (14,486,000)
Operating and Capital Appropriations by Fund Type FY 2021 Appropriation Fund Type Chart
Office of the Mayor and CityManager Fund Type FTE
General Fund 28.45
Enterprise 0.95
Internal Service Fund 0.60
30.00
Debt Service
0 0 0
Total Debt Service 0 0 0
Office of the Mayor and City Manager Budget Snapshot
Department Total
Office of the Mayor and City Manager
B - 2 FY 2020-2021 Final Revised Budget
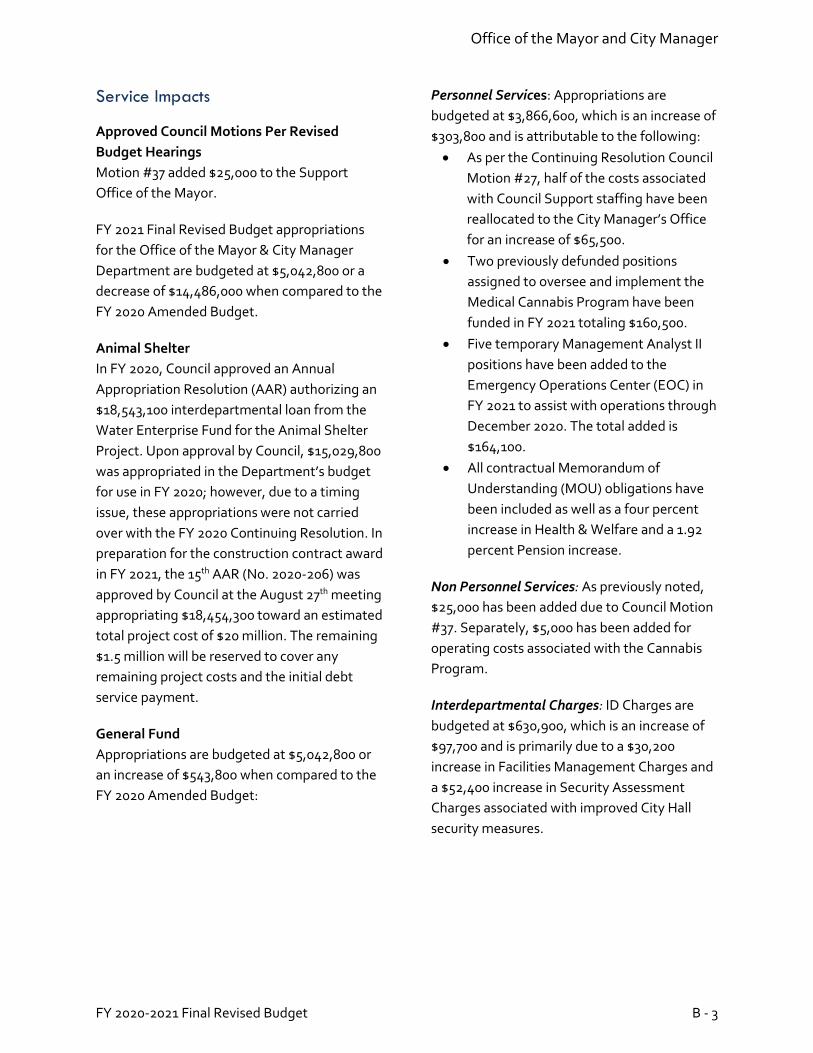
Service Impacts
Approved Council Motions Per Revised Budget Hearings Motion #37 added $25,000 to the Support Office of the Mayor.
FY 2021 Final Revised Budget appropriations for the Office of the Mayor & City Manager Department are budgeted at $5,042,800 or a decrease of $14,486,000 when compared to the FY 2020 Amended Budget.
Animal Shelter In FY 2020, Council approved an Annual Appropriation Resolution (AAR) authorizing an $18,543,100 interdepartmental loan from the Water Enterprise Fund for the Animal Shelter Project. Upon approval by Council, $15,029,800 was appropriated in the Department’s budget for use in FY 2020; however, due to a timing issue, these appropriations were not carried over with the FY 2020 Continuing Resolution. In preparation for the construction contract award in FY 2021, the 15th AAR (No. 2020-206) was approved by Council at the August 27th meeting appropriating $18,454,300 toward an estimated total project cost of $20 million. The remaining $1.5 million will be reserved to cover any remaining project costs and the initial debt service payment.
General Fund Appropriations are budgeted at $5,042,800 or an increase of $543,800 when compared to the FY 2020 Amended Budget:
Personnel Services: Appropriations are budgeted at $3,866,600, which is an increase of $303,800 and is attributable to the following: • As per the Continuing Resolution Council
Motion #27, half of the costs associatedwith Council Support staffing have beenreallocated to the City Manager’s Officefor an increase of $65,500.
• Two previously defunded positionsassigned to oversee and implement theMedical Cannabis Program have beenfunded in FY 2021 totaling $160,500.
• Five temporary Management Analyst IIpositions have been added to theEmergency Operations Center (EOC) inFY 2021 to assist with operations throughDecember 2020. The total added is$164,100.
• All contractual Memorandum ofUnderstanding (MOU) obligations havebeen included as well as a four percentincrease in Health & Welfare and a 1.92percent Pension increase.
Non Personnel Services: As previously noted, $25,000 has been added due to Council Motion #37. Separately, $5,000 has been added for operating costs associated with the Cannabis Program.
Interdepartmental Charges: ID Charges are budgeted at $630,900, which is an increase of $97,700 and is primarily due to a $30,200 increase in Facilities Management Charges and a $52,400 increase in Security Assessment Charges associated with improved City Hall security measures.
Office of the Mayor and City Manager
FY 2020-2021 Final Revised Budget B - 3

Staffing
Department Staffing Detail
Position Summary FY 2019 FY 2020 FY 2020 FY 2021 FY 2021
Division Adopted Adopted Amended Changes Final Office of the Mayor 10.00 10.00 10.00 0.00 10.00
City Manager's Division 8.50 9.00 9.00 0.00 9.00 Office of Independent Review 2.00 2.00 2.00 0.00 2.00
Economic Development 2.00 2.00 2.00 0.00 2.00 Budget Division 7.00 7.00 7.00 0.00 7.00
Total 29.50 30.00 30.00 0.00 30.00
Office of the Mayor and City Manager
B - 4 FY 2020-2021 Final Revised Budget
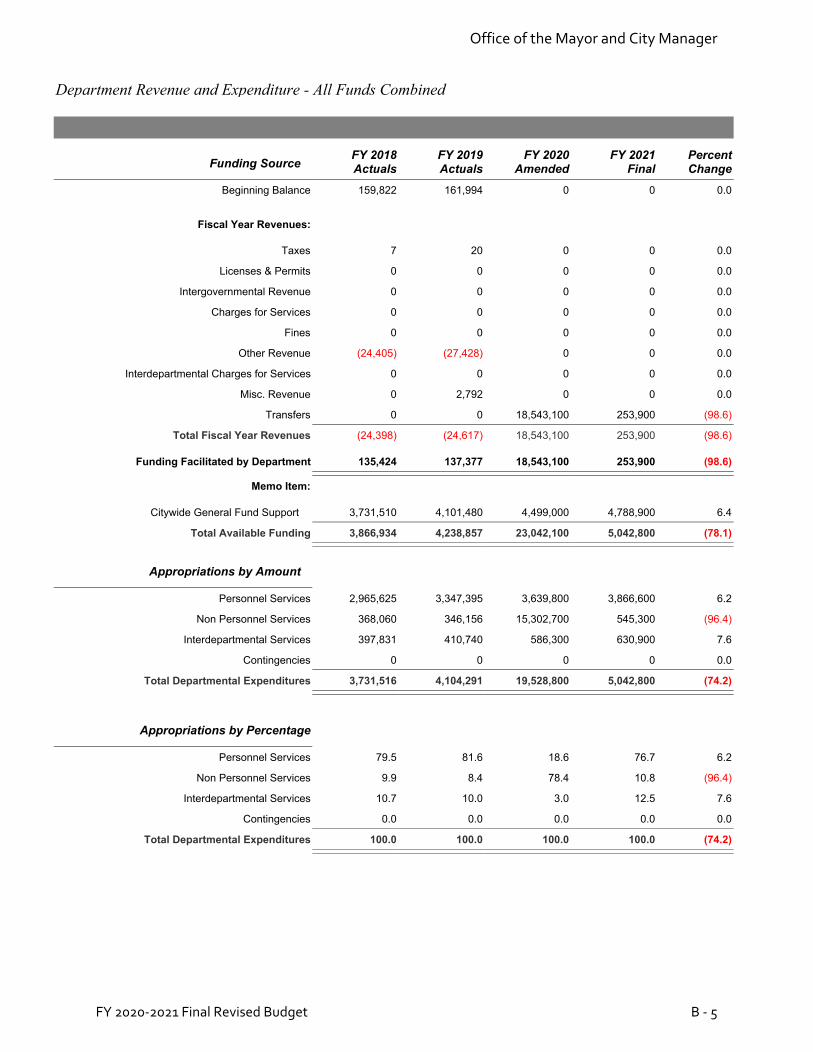
Department Revenue and Expenditure - All Funds Combined
Funding Source FY 2018Actuals
FY 2019Actuals
FY 2020Amended
FY 2021Final
PercentChange
Beginning Balance 159,822 161,994 0 0 0.0
Fiscal Year Revenues:
Taxes 7 20 0 0 0.0
Licenses & Permits 0 0 0 0 0.0
Intergovernmental Revenue 0 0 0 0 0.0
Charges for Services 0 0 0 0 0.0
Fines 0 0 0 0 0.0
Other Revenue (24,405) (27,428) 0 0 0.0
Interdepartmental Charges for Services 0 0 0 0 0.0
Misc. Revenue 0 2,792 0 0 0.0
Transfers 0 0 18,543,100 253,900 (98.6)
Total Fiscal Year Revenues (24,398) (24,617) 18,543,100 253,900 (98.6)
Funding Facilitated by Department 135,424 137,377 18,543,100 253,900 (98.6)
Memo Item:
Appropriations by Amount
Personnel Services 2,965,625 3,347,395 3,639,800 3,866,600 6.2
Non Personnel Services 368,060 346,156 15,302,700 545,300 (96.4)
Interdepartmental Services 397,831 410,740 586,300 630,900 7.6
Contingencies 0 0 0 0 0.0
Total Departmental Expenditures 3,731,516 4,104,291 19,528,800 5,042,800 (74.2)
Citywide General Fund Support 3,731,510 4,101,480 4,499,000 4,788,900 6.4
Total Available Funding 3,866,934 4,238,857 23,042,100 5,042,800 (78.1)
Appropriations by Percentage
Personnel Services 79.5 81.6 18.6 76.7 6.2
Non Personnel Services 9.9 8.4 78.4 10.8 (96.4)
Interdepartmental Services 10.7 10.0 3.0 12.5 7.6
Contingencies 0.0 0.0 0.0 0.0 0.0
Total Departmental Expenditures 100.0 100.0 100.0 100.0 (74.2)
Office of the Mayor and City Manager
FY 2020-2021 Final Revised Budget B - 5

Department Appropriations by Fund Classification - FY 2021 Only
Resources GeneralFund
SpecialRevenues Capital Enterprise Internal
ServiceDebt
Service Total
Beginning Balance 0 0 0 0 0 0 0
Fiscal Year Revenues:
Taxes 0 0 0 0 0 0 0
Licenses & Permits 0 0 0 0 0 0 0
Intergovernmental Revenue 0 0 0 0 0 0 0
Charges for Services 0 0 0 0 0 0 0
Fines 0 0 0 0 0 0 0
Other Revenue 0 0 0 0 0 0 0
Interdepartmental Charges for Services 0 0 0 0 0 0 0
Misc. Revenue 0 0 0 0 0 0 0
Transfers 253,900 0 0 0 0 0 253,900
Total Fiscal Year Revenues 253,900 0 0 0 0 0 253,900
Funding Facilitated by Department 253,900 0 0 0 0 0 253,900
Memo Item:
Appropriations
Personnel Services 3,866,600 0 0 0 0 0 3,866,600
Non Personnel Services 545,300 0 0 0 0 0 545,300
Interdepartmental Services 630,900 0 0 0 0 0 630,900
Contingencies 0 0 0 0 0 0 0
Total Appropriations 5,042,800 0 0 0 0 0 5,042,800
Citywide General Fund Support 4,788,900 0 0 0 0 0 4,788,900
Total Available Funding 5,042,800 0 0 0 0 0 5,042,800
Department Appropriations by Fund Type
FY 2018Actuals
FY 2019Actuals
FY 2020Amended
FY 2021Final
(Amount)
FY 2021Final
(Percent)Operating 3,731,516 4,104,291 4,499,000 5,042,800 100.0
Capital 0 0 15,029,800 0 0.0
Debt Service 0 0 0 0 0.0
Total 3,731,516 4,104,291 19,528,800 5,042,800 100.0
Office of the Mayor and City Manager
B - 6 FY 2020-2021 Final Revised Budget

Notes Department Revenue and Expenditures – All Funds Combined Table
1. This table reflects the consolidation of all funds that support operating and/or capital financialactivities.
2. The Citywide General Fund Support line-item reflects citywide General Fund revenues (i.e.,sales tax, property tax, etc.) captured in the General City Purpose Department and is utilized tocover the difference between General Fund revenues and expenditures facilitated by the abovedepartment.
3. Data may not add to the totals due to rounding.
Department Appropriations by Fund Classification – FY 2021 only Table 1. The Citywide General Fund Support line-item reflects citywide General Fund revenues (i.e.,
sales tax, property tax, etc.) captured in the General City Purpose Department and is utilized tocover the difference between General Fund revenues and expenditures facilitated by the abovedepartment.
Department Appropriations by Fund Type 1. Data may not add to the totals due to rounding.
Office of the Mayor and City Manager
FY 2020-2021 Final Revised Budget B - 7

THIS PAGE WAS INTENTIONALLY LEFT BLANK.
B - 8 FY 2020-2021 Final Revised Budget

City Council The City Council consists of seven Councilmembers who represent their respective districts. Each district’s Councilmember takes a turn, in consecutive order, serving a one-year term as Council President. Elected officials are bound by term limits consisting of 2 four-year terms. The City Council also appoints the City Attorney and City Clerk.
The role of the City Council is to establish policy direction for the City by enacting ordinances and resolutions to provide guidance to the public and city staff; reviewing and adopting the annual budget; levying taxes (when approved by a ballot election) or establishing other sources of revenue as may be necessary to fund approved appropriations. The Council also reviews and votes on recommendations presented by City Boards and Commissions; authorizes contracts and bond issuances; grants franchises; and establishes other policies and measures which promote the general welfare of the citizens of Fresno.
In collaboration with the Mayor, the City Council appoints members of the community to serve on the City’s various Boards and Commissions, ensuring that a wide cross-section of the community is represented in City government.
Goals of the Council include:
• Maintaining essential services such assafety, utilities, and land use.
• Continued focus on neighborhoodrestoration. Numerous City neighborhoodsbenefit from the multi-pronged strategy ofrehabilitated streets, code enforcement,and problem oriented policing.
• Representing the City on Boards andCommittees.
• Maintaining constituent communicationwith direct contact through personalservices, mail, and email.
• Long range neighborhood infrastructureplanning.
• Addressing the region’s unemploymentproblems.
• Promoting Downtown revitalization.• Preserving historic buildings.• Creation of affordable housing.• Supporting affordable housing and senior
facilities which serve the elder citizens ofour community.
FY 2020-2021 Final Revised Budget B - 9

ESMERALDA SORIA – DISTRICT 1
Phone: (559) 621-8000 Email FAX: (559) 457-1171 Email: [email protected]
MIKE KARBASSI – DISTRICT 2
Phone: (559) 621-8000 Email FAX: (559) 621-7892
Email: [email protected]
MIGUEL ARIAS – DISTRICT 3 COUNCIL PRESIDENT
Phone: (559) 621-8000 Email FAX: (559) 621-7893 Email: [email protected]
B - 10 FY 2020-2021 Final Revised Budget
City Council

PAUL CAPRIOGLIO – DISTRICT 4
Phone: (559) 621-8000 Email FAX: (559) 621-7848 Email: [email protected]
LUIS CHAVEZ – DISTRICT 5
Phone: (559) 621-8000 Email FAX: (559) 490-5395
Email: [email protected]
GARRY BREDEFELD – DISTRICT 6
Phone: (559) 621-8000 Email FAX: (559) 621-7896 Email: [email protected]
FY 2020-2021 Final Revised Budget B - 11
City Council
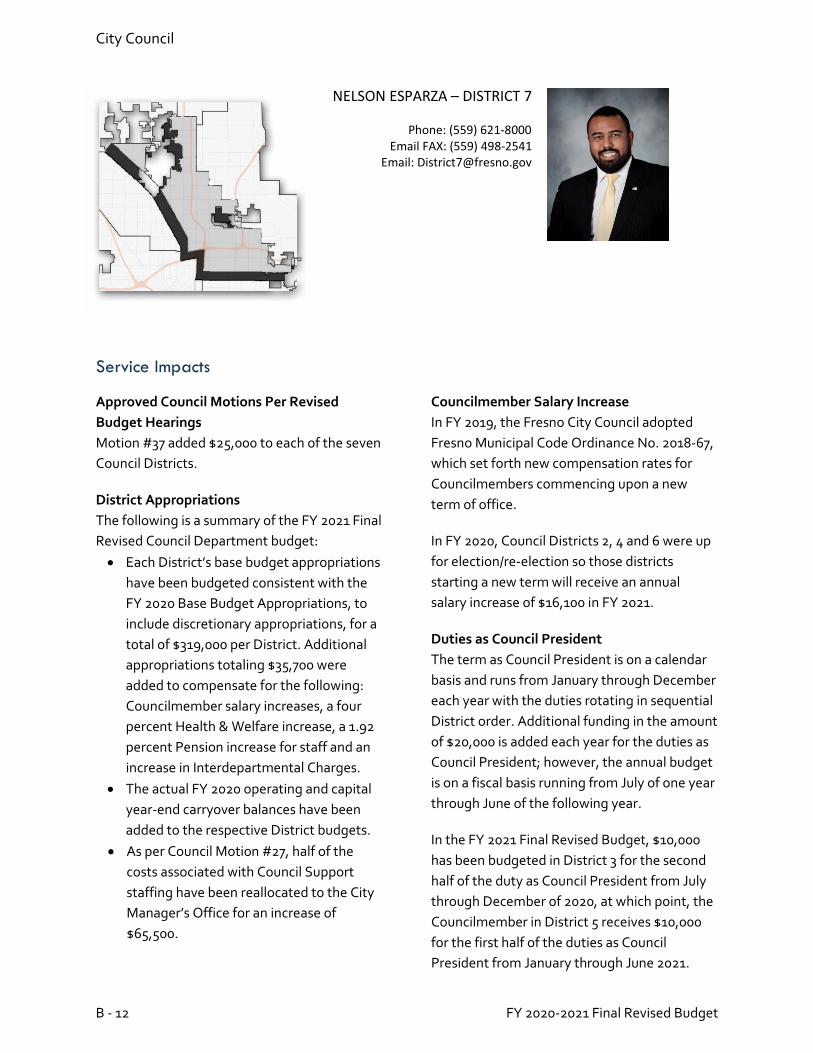
NELSON ESPARZA – DISTRICT 7
Phone: (559) 621-8000 Email FAX: (559) 498-2541 Email: [email protected]
Service Impacts
Approved Council Motions Per Revised Budget Hearings Motion #37 added $25,000 to each of the seven Council Districts.
District Appropriations The following is a summary of the FY 2021 Final Revised Council Department budget: • Each District’s base budget appropriations
have been budgeted consistent with the FY 2020 Base Budget Appropriations, to include discretionary appropriations, for a total of $319,000 per District. Additional appropriations totaling $35,700 were added to compensate for the following: Councilmember salary increases, a four percent Health & Welfare increase, a 1.92 percent Pension increase for staff and an increase in Interdepartmental Charges.
• The actual FY 2020 operating and capital year-end carryover balances have been added to the respective District budgets.
• As per Council Motion #27, half of the costs associated with Council Support staffing have been reallocated to the City Manager’s Office for an increase of $65,500.
Councilmember Salary Increase In FY 2019, the Fresno City Council adopted Fresno Municipal Code Ordinance No. 2018-67, which set forth new compensation rates for Councilmembers commencing upon a new term of office.
In FY 2020, Council Districts 2, 4 and 6 were up for election/re-election so those districts starting a new term will receive an annual salary increase of $16,100 in FY 2021.
Duties as Council President The term as Council President is on a calendar basis and runs from January through December each year with the duties rotating in sequential District order. Additional funding in the amount of $20,000 is added each year for the duties as Council President; however, the annual budget is on a fiscal basis running from July of one year through June of the following year.
In the FY 2021 Final Revised Budget, $10,000 has been budgeted in District 3 for the second half of the duty as Council President from July through December of 2020, at which point, the Councilmember in District 5 receives $10,000 for the first half of the duties as Council President from January through June 2021.
B - 12 FY 2020-2021 Final Revised Budget
City Council

OperatingFY 2020
AmendedFY 2021
Final Variance
General Fund 4,598,900 4,488,400 (110,500)
Total Operating 4,598,900 4,488,400 (110,500)
Capital
General Fund 922,300 682,000 (240,300)
Total Capital 922,300 682,000 (240,300)
Grand Total 5,521,200 5,170,400 (350,800)
Operating and Capital Appropriations by Fund Type FY 2021 Appropriation Fund Type Chart
Major Capital Projects by Appropriations
City Council Department Fund Type FTE
General Fund 28.00
28.00
Debt Service
0 0 0
Total Debt Service 0 0 0
Project Fund Type Amount
XC00001 - CNL Dist. 1 Infrastructure General Fund 122,900 ## 4
XC00002 - CNL Dist. 2 Infrastructure General Fund 159,100 ## 1
XC00003 - CNL Dist. 3 Infrastructure General Fund 7,800 ## 7
XC00004 - CNL Dist. 4 Infrastructure General Fund 131,700 ## 2
XC00005 - CNL Dist. 5 Infrastructure General Fund 86,700 ## 5
XC00006 - CNL Dist. 6 Infrastructure General Fund 50,300 ## 6
XC00007 - CNL Dist. 7 Infrastructure General Fund 123,500 ## 3
City Council Department Budget Snapshot
Department Total
FY 2020-2021 Final Revised Budget B - 13
City Council

City Council Operating Base Budget by Council District
Operating FY 2021 CM Salary H&W Pension ID Charge Council FY 2020 Motion FY 2021 Appropriations Base Increase Increase Increase Increase President Carryover No. 37 Final
District 1 319,000 16,100 900 3,000 15,700 0 66,700 25,000 446,400
District 2 319,000 16,100 900 3,000 15,700 0 245,900 25,000 625,600
District 3 319,000 16,100 900 3,000 15,700 10,000 47,500 25,000 437,200
District 4 319,000 16,100 900 3,000 15,700 0 462,600 25,000 842,300
District 5 319,000 16,100 900 3,000 15,700 10,000 157,600 25,000 547,300
District 6 319,000 16,100 900 3,000 15,700 0 124,300 25,000 504,000
District 7 319,000 16,100 900 3,000 15,700 0 145,100 25,000 524,800
Council Suppt. 560,800 . 560,800
Total Operating 2,793,800 112,700 6,300 21,000 109,900 20,000 1,249,700 175,000 4,488,400
City Council Operating Expenditures by Council District
FY 2018 FY 2019 FY 2020 FY 2021 Operating Appropriations Actuals Actuals Amended Final
Council District 1 344,146 367,666 510,800 446,400
Council District 2 310,796 267,720 512,900 625,600
Council District 3 322,270 338,095 491,300 437,200
Council District 4 274,446 293,164 796,600 842,300
Council District 5 318,768 345,003 536,200 547,300
Council District 6 341,385 315,590 465,500 504,000
Council District 7 330,011 335,808 593,200 524,800
Council City Support 594,247 592,386 692,100 560,800
Total Infrastructure 2,836,069 2,855,431 4,598,900 4,488,400
City Council Capital Expenditures by Council District
FY 2018 FY 2019 FY 2020 FY 2021 Capital Appropriations Actuals Actuals Amended Final
Council District 1 0 10,029 122,900 122,900
Council District 2 3,293 120,692 159,100 159,100
Council District 3 1,068 125,732 11,700 7,800
Council District 4 0 0 332,100 131,700
Council District 5 615 20,250 86,700 86,700
Council District 6 41,200 97,588 75,300 50,300
Council District 7 14,771 13,556 134,500 123,500
Total Capital 60,947 387,848 922,300 682,000
B - 14 FY 2020-2021 Final Revised Budget
City Council

Staffing
Department Staffing Detail
Position Summary FY 2019 FY 2020 FY 2020 FY 2021 FY 2021
Division Adopted Adopted Amended Changes Final District 1 3.00 3.00 4.00 0.00 4.00
District 2 3.00 3.00 3.00 0.00 3.00
District 3 3.00 3.00 4.00 0.00 4.00
District 4 3.00 3.00 4.00 0.00 4.00
District 5 3.00 3.00 4.00 0.00 4.00
District 6 3.00 3.00 3.00 0.00 3.00
District 7 3.00 4.00 4.00 0.00 4.00
City Council Support 2.00 2.00 2.00 0.00 2.00
Total 23.00 24.00 28.00 0.00 28.00
FY 2020-2021 Final Revised Budget B - 15
City Council
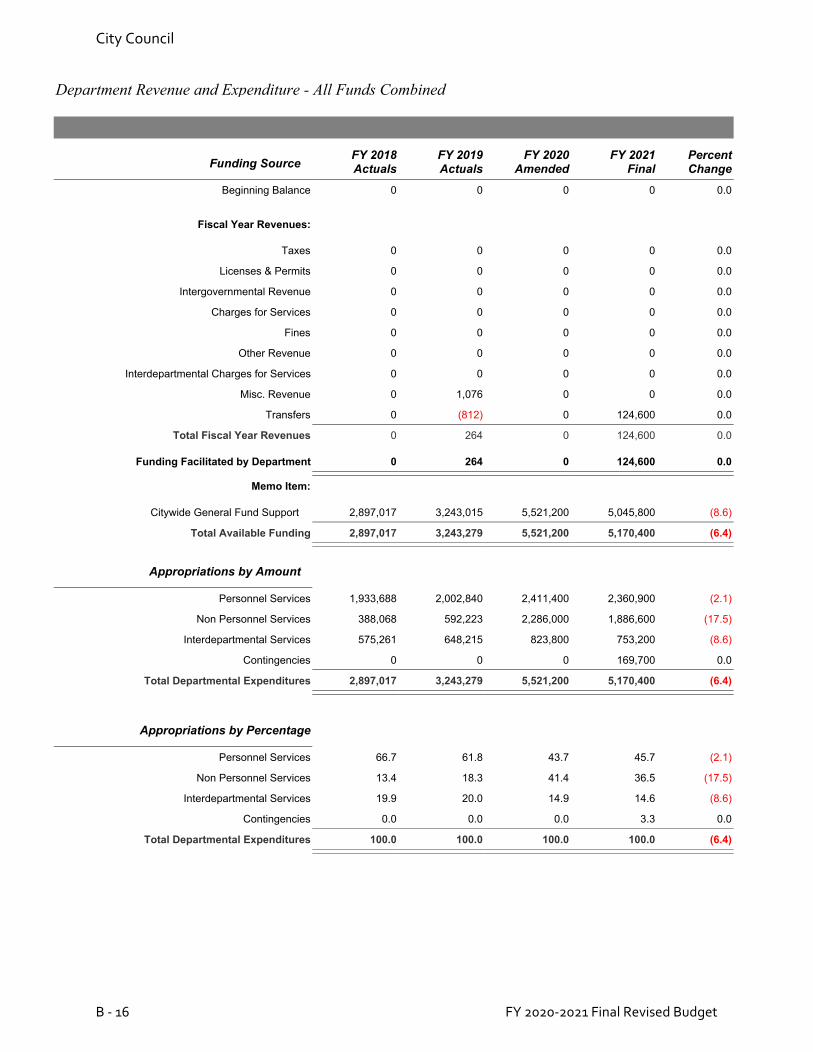
Department Revenue and Expenditure - All Funds Combined
Funding Source FY 2018Actuals
FY 2019Actuals
FY 2020Amended
FY 2021Final
PercentChange
Beginning Balance 0 0 0 0 0.0
Fiscal Year Revenues:
Taxes 0 0 0 0 0.0
Licenses & Permits 0 0 0 0 0.0
Intergovernmental Revenue 0 0 0 0 0.0
Charges for Services 0 0 0 0 0.0
Fines 0 0 0 0 0.0
Other Revenue 0 0 0 0 0.0
Interdepartmental Charges for Services 0 0 0 0 0.0
Misc. Revenue 0 1,076 0 0 0.0
Transfers 0 (812) 0 124,600 0.0
Total Fiscal Year Revenues 0 264 0 124,600 0.0
Funding Facilitated by Department 0 264 0 124,600 0.0
Memo Item:
Appropriations by Amount
Personnel Services 1,933,688 2,002,840 2,411,400 2,360,900 (2.1)
Non Personnel Services 388,068 592,223 2,286,000 1,886,600 (17.5)
Interdepartmental Services 575,261 648,215 823,800 753,200 (8.6)
Contingencies 0 0 0 169,700 0.0
Total Departmental Expenditures 2,897,017 3,243,279 5,521,200 5,170,400 (6.4)
Citywide General Fund Support 2,897,017 3,243,015 5,521,200 5,045,800 (8.6)
Total Available Funding 2,897,017 3,243,279 5,521,200 5,170,400 (6.4)
Appropriations by Percentage
Personnel Services 66.7 61.8 43.7 45.7 (2.1)
Non Personnel Services 13.4 18.3 41.4 36.5 (17.5)
Interdepartmental Services 19.9 20.0 14.9 14.6 (8.6)
Contingencies 0.0 0.0 0.0 3.3 0.0
Total Departmental Expenditures 100.0 100.0 100.0 100.0 (6.4)
B - 16 FY 2020-2021 Final Revised Budget
City Council

Department Appropriations by Fund Classification - FY 2021 Only
Resources GeneralFund
SpecialRevenues Capital Enterprise Internal
ServiceDebt
Service Total
Beginning Balance 0 0 0 0 0 0 0
Fiscal Year Revenues:
Taxes 0 0 0 0 0 0 0
Licenses & Permits 0 0 0 0 0 0 0
Intergovernmental Revenue 0 0 0 0 0 0 0
Charges for Services 0 0 0 0 0 0 0
Fines 0 0 0 0 0 0 0
Other Revenue 0 0 0 0 0 0 0
Interdepartmental Charges for Services 0 0 0 0 0 0 0
Misc. Revenue 0 0 0 0 0 0 0
Transfers 124,600 0 0 0 0 0 124,600
Total Fiscal Year Revenues 124,600 0 0 0 0 0 124,600
Funding Facilitated by Department 124,600 0 0 0 0 0 124,600
Memo Item:
Appropriations
Personnel Services 2,360,900 0 0 0 0 0 2,360,900
Non Personnel Services 1,886,600 0 0 0 0 0 1,886,600
Interdepartmental Services 753,200 0 0 0 0 0 753,200
Contingencies 169,700 0 0 0 0 0 169,700
Total Appropriations 5,170,400 0 0 0 0 0 5,170,400
Citywide General Fund Support 5,045,800 0 0 0 0 0 5,045,800
Total Available Funding 5,170,400 0 0 0 0 0 5,170,400
Department Appropriations by Fund Type
FY 2018Actuals
FY 2019Actuals
FY 2020Amended
FY 2021Final
(Amount)
FY 2021Final
(Percent)Operating 2,836,069 2,855,431 4,598,900 4,488,400 86.8
Capital 60,947 387,848 922,300 682,000 13.2
Debt Service 0 0 0 0 0.0
Total 2,897,017 3,243,279 5,521,200 5,170,400 100.0
FY 2020-2021 Final Revised Budget B - 17
City Council

Notes Department Revenue and Expenditures – All Funds Combined Table
1. This table reflects the consolidation of all funds that support operating and/or capital financialactivities.
2. The Citywide General Fund Support line-item reflects citywide General Fund revenues (i.e., salestax, property tax, etc.) captured in the General City Purpose Department and is utilized to coverthe difference between General Fund revenues and expenditures facilitated by the abovedepartment.
3. Data may not add to the totals due to rounding.
Department Appropriations by Fund Classification – FY 2021 only Table 1. The Citywide General Fund Support line item reflects General Fund revenues (i.e., sales tax,
property tax, etc.) captured in the General City Purpose Department and is utilized to cover thedifference between General Fund revenues and expenditures facilitated by the abovedepartment.
Department Appropriations by Fund Type 1. Data may not add to the totals due to rounding.
B - 18 FY 2020-2021 Final Revised Budget
City Council

Airports Department
The Airports Department (Airports) is charged with the development, maintenance and operation of Fresno Yosemite International Airport (FAT) and Fresno Chandler Executive Airport (FCH). FAT is the region’s primary airport for commercial passenger and cargo service. FCH serves the area’s general aviation community. These airports are vital components of the nation’s air transportation infrastructure, and are important engines of regional economic growth. Airports is dedicated to maintaining a high level of passenger satisfaction, to
growing air service, and to maintaining and expanding facilities that accommodate demand in a cost-effective manner. Moreover, Airports is committed to offering airline partners an attractive cost - environment within which to operate, an approach aligned with the City’s and region’s economic development goals. The number of arriving and departing passengers projected to use FAT in fiscal year 2021 is 1,264,000, 15.8 percent less than estimated passengers in fiscal year 2020 of 1,501,400, and 32.0 percent less than actual fiscal year 2019 passengers of 1,860,600, reflecting the negative impact of COVID-19 on aeronautical activity, and ending an eleven-years long passengers’ growth trend that started in fiscal year 2009. Exercising fiscal prudence, Airports has reduced fiscal year 2021 Non Personnel operating budget, and deferred non- essential capital work. Airports forecasts that activity will return to normalcy in the later months of fiscal year 2022.
Kevin Meikle Director of
Aviation
FY 2020-2021 Final Revised Budget B - 19

OperatingFY 2020
AmendedFY 2021
Final Variance
Enterprise 21,164,000 21,705,400 541,400
Total Operating 21,164,000 21,705,400 541,400
Capital
Enterprise 77,861,000 79,534,100 1,673,100
Total Capital 77,861,000 79,534,100 1,673,100
Grand Total 105,586,700 107,667,200 2,080,500
Operating and Capital Appropriations by Fund Type FY 2021 Appropriation Fund Type Chart
Major Capital Projects by Appropriations
Airports Department Fund Type FTE
Sworn Enterprise 14.20
Total Sworn 14.20
Civilian Capital Labor 4.90
Enterprise 99.30
Total Civilian 104.20
Department Total FTE 118.40
Debt Service
Enterprise 6,561,700 6,427,700 (134,000)
Total Debt Service 6,561,700 6,427,700 (134,000)
Project Fund Type Amount
AC00377 - Marine Base Demo (FED MCCA) Enterprise 1,300,000 ## 5
AC00398 - AIPxx Term E Apron (Env/Des) Enterprise 9,390,300 ## 3
AC00401 - Parking Garage (Env/Des/Con) Enterprise 38,835,000 ## 1
AC00403 - TSA OTA Bag MakeUp Inline CBIS Enterprise 17,689,100 ## 2
AC00413 - Terminal/FIS Expansion Enterprise 1,500,000 ## 4
Airports Department Budget Snapshot
Airports Department
B - 20 FY 2020-2021 Final Revised Budget

Service Impacts
Approved Council Motions Per Revised Budget Hearings • Motion #32, with limited exceptions,
removed positions requested as partof the Revised Budget submission. Asa result, the Airports Departmentrequest for a Senior Network SystemSpecialist working at 0.65 FTE at acost of $74,400 was removed fromthe FY 2021 Final Revised Budget.
Appropriations in the Airports Department total $107,667,200, which is an increase of $2,080,500, or 2.0 percent, when compared to the FY 2020 Amended Budget. This reflects an increase to operating appropriations of $541,400, an increase to capital appropriations of $1,673,100 and a decrease to Debt Service appropriations of $134, 000.
Operating The Airports operating funds, which include FAT Enterprise, Chandler Enterprise and Airports Project Administration, are budgeted at $21,705,400 in the FY 2021 Final Revised Budget, an increase of $541,400 above the FY 2020 Amended Budget of $21,164,000. The increase related to scheduled salary increases and obligations as discussed in the Staffing section on the following page.
Non Personnel appropriations for Operating are $7,188,500, which is a decrease of 5.0 percent or $381,200 below the FY 2020 Amended Budget. Material changes include: • $121,600 decrease for Public
Relations and Information,
• $106,800 decrease in special projectsappropriations,
• $70,000 decrease for non-consultingprofessional services,
• $22,000 decrease for training.
Interdepartmental Charges for Services are budgeted at $3,419,300 in the FY 2021 Final Revised Budget, a decrease of $29,000 compared to the FY 2020 Amended Budget. The decrease is primarily due to the following changes: • $181,400 decrease in vehicle acquisition
appropriations,• $114,200 decrease for variable charges for
services and materials furnished by GeneralFund activities,
• $189,400 increase for Information SystemsService and Equipment Charges,
• $70,900 increase for fixed InterdepartmentalReimbursements calculated as part of theCity’s Cost Allocation Plan.
Debt Service Debt service appropriations are budgeted at $6,427,700 in the FY 2021 Final Revised Budget, a decrease of $134,000 compared to the FY 2020 Amended Budget. Airports has funded an escrow fund to prepay FY 2021 debt service, and to ensure compliance with obligations to bondholders.
Capital Capital appropriations are budgeted at $79,534,100. This is an increase of $1,673,100, or 2.1 percent, over the FY 2020 Amended Budget of $77,861,000. The increase to Capital is primarily due to new and continuing projects in FY 2021 with offsets from projects that are winding down in FY 2021 or have been completed in FY 2020. The more significant FY 2021 Capital appropriations include: • $38,835,000 for the FATForward Parking
Garage Project funded with bond proceeds
Airports Department
FY 2020-2021 Final Revised Budget B - 21
(project number AC00401); • $17,689,100 for the Bag Make-up
Inline System funded with a TSAgrant (project number AC00403);
• $9,390,300 for Terminal East ApronDesign and Construction funded withan FAA grant (project numberAC00398);
• $1,500,000 for FATForwardTerminal/FIS Expansion funded withbond proceeds (project numberAC00413).
CARES Act Funding Under a preliminary plan, subject to change, the Department seeks to utilize $8.1 million of $13.0 million CARES Act funding in FY 2021 as follows: • $3.2 million as a FY 2021 reimbursement for
the portion of debt service prepaymentfunded with Airports’ cash.
• $4.9 million as a FY 2021 reimbursement forpersonnel costs.
The remaining $4.9 million will be banked for FY 2022.
Airports Department
B - 22 FY 2020-2021 Final Revised Budget

Staff ing Personnel Appropriations, including operating and capital are budgeted at $11,746,200, a decrease of $725,900 compared to the FY 2020 Amended Budget of $12,472,100. The main driver of this decrease is the remaining work planned to be completed for FY 2020 capital projects in FY 2021, which includes a $1,677,500 reduction in Personnel appropriations.
This capital decline was partially offset by the operational Personnel appropriations that includes an increase of $951,600 mainly due to contractual obligations and step advancements. The FY 2021 Final Revised Personnel Appropriations also include:
• Six Custodians approved at 1.00 FTE each aspart of the 1st Amendment to the FY 2021Position Authorization Resolution for a totalcost of $320,100.
• One Airports Operations Officer I approved at1.00 FTE as part of the 1st Amendment to theFY 2021 Position Authorization Resolution ata cost of $74,900.
• $22,100 increase for a full year of funding at1.00 FTE for the Airports Electrician approvedin FY 2020 at .75 FTE.
• $14,600 increase for a full year of funding at1.00 FTE for the Airports BuildingMaintenance Technician approved in FY 2020at .75 FTE.
• $12,100 increase for a full year of funding at1.00 FTE for the Custodian approved in FY2020 at .75 FTE.
Department Staffing Detail
Position Summary FY 2019 FY 2020 FY 2020 FY 2021 FY 2021
Division Adopted Adopted Amended Changes Final
Sworn Positions 13.80 14.20 14.20 - 14.20
Civilian Positions 87.20 90.45 96.45 7.75 104.20
Total 101.00 104.65 110.65 7.75 118.40
Note: The FY 2020 Amended includes 6.00 Civilian FTEs added by the 4th Amendment to the Position Authorization Resolution adopted December 12, 2019.
The FY 2021 Changes include 7.00 Civilian FTEs added by the 1st Amendment to the Position Authorization Resolution adopted August 27, 2020. The remaining .75 FTE are due to three Civilian positions added in FY 2020 at .75 FTE each that are at 1.00 FTE each in FY 2021.
Airports Department
FY 2020-2021 Final Revised Budget B - 23

Department Revenue and Expenditure - All Funds Combined
Funding Source FY 2018Actuals
FY 2019Actuals
FY 2020Amended
FY 2021Final
PercentChange
Beginning Balance 33,871,596 26,137,416 82,633,500 29,474,100 (64.3)
Fiscal Year Revenues:
Taxes 748,768 773,207 788,000 879,200 11.6
Licenses & Permits 0 0 0 0 0.0
Intergovernmental Revenue 3,255,400 14,777,324 15,874,900 42,245,300 166.1
Charges for Services 17,522,975 20,167,461 22,734,200 14,923,500 (34.4)
Fines 0 0 1,000 0 (100.0)
Other Revenue 11,700,105 12,045,609 11,705,500 10,218,500 (12.7)
Interdepartmental Charges for Services 0 0 0 0 0.0
Misc. Revenue 57,995 184,476 21,000 31,002,800 147,532.4
Transfers (0) (45) 0 0 0.0
Total Fiscal Year Revenues 33,285,244 47,948,032 51,124,600 99,269,300 94.2
Funding Facilitated by Department 67,156,840 74,085,448 133,758,100 128,743,400 (3.7)
Memo Item:
Appropriations by Amount
Personnel Services 8,439,649 9,398,441 12,472,100 11,746,200 (5.8)
Non Personnel Services 29,626,283 31,174,674 87,543,300 91,502,900 4.5
Interdepartmental Services 3,153,009 3,751,340 5,571,300 4,418,100 (20.7)
Contingencies 0 0 0 0 0.0
Total Departmental Expenditures 41,218,942 44,324,455 105,586,700 107,667,200 2.0
Citywide General Fund Support 0 0 0 0 0.0
Total Available Funding 67,156,840 74,085,448 133,758,100 128,743,400 (3.7)
Appropriations by Percentage
Personnel Services 20.5 21.2 11.8 10.9 (5.8)
Non Personnel Services 71.9 70.3 82.9 85.0 4.5
Interdepartmental Services 7.6 8.5 5.3 4.1 (20.7)
Contingencies 0.0 0.0 0.0 0.0 0.0
Total Departmental Expenditures 100.0 100.0 100.0 100.0 2.0
Airports Department
B - 24 FY 2020-2021 Final Revised Budget
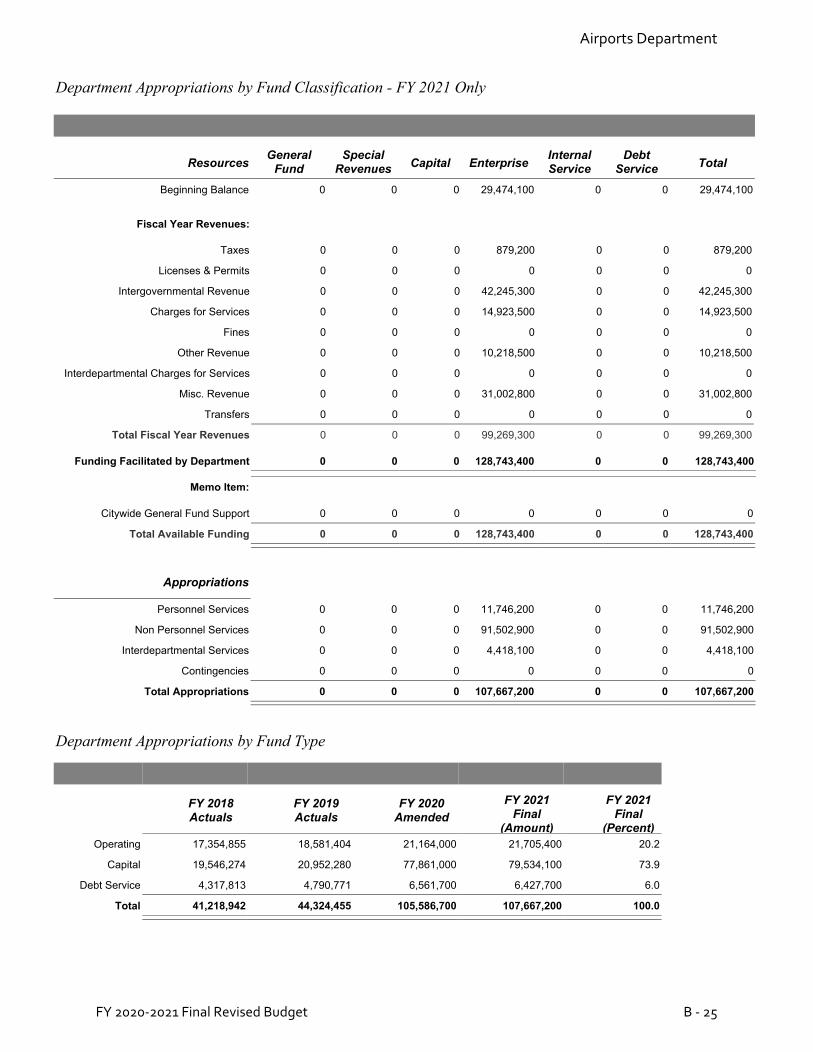
Department Appropriations by Fund Classification - FY 2021 Only
Resources GeneralFund
SpecialRevenues Capital Enterprise Internal
ServiceDebt
Service Total
Beginning Balance 0 0 0 29,474,100 0 0 29,474,100
Fiscal Year Revenues:
Taxes 0 0 0 879,200 0 0 879,200
Licenses & Permits 0 0 0 0 0 0 0
Intergovernmental Revenue 0 0 0 42,245,300 0 0 42,245,300
Charges for Services 0 0 0 14,923,500 0 0 14,923,500
Fines 0 0 0 0 0 0 0
Other Revenue 0 0 0 10,218,500 0 0 10,218,500
Interdepartmental Charges for Services 0 0 0 0 0 0 0
Misc. Revenue 0 0 0 31,002,800 0 0 31,002,800
Transfers 0 0 0 0 0 0 0
Total Fiscal Year Revenues 0 0 0 99,269,300 0 0 99,269,300
Funding Facilitated by Department 0 0 0 128,743,400 0 0 128,743,400
Memo Item:
Appropriations
Personnel Services 0 0 0 11,746,200 0 0 11,746,200
Non Personnel Services 0 0 0 91,502,900 0 0 91,502,900
Interdepartmental Services 0 0 0 4,418,100 0 0 4,418,100
Contingencies 0 0 0 0 0 0 0
Total Appropriations 0 0 0 107,667,200 0 0 107,667,200
Citywide General Fund Support 0 0 0 0 0 0 0
Total Available Funding 0 0 0 128,743,400 0 0 128,743,400
Department Appropriations by Fund Type
FY 2018Actuals
FY 2019Actuals
FY 2020Amended
FY 2021Final
(Amount)
FY 2021Final
(Percent)Operating 17,354,855 18,581,404 21,164,000 21,705,400 20.2
Capital 19,546,274 20,952,280 77,861,000 79,534,100 73.9
Debt Service 4,317,813 4,790,771 6,561,700 6,427,700 6.0
Total 41,218,942 44,324,455 105,586,700 107,667,200 100.0
Airports Department
FY 2020-2021 Final Revised Budget B - 25

Notes Department Revenue and Expenditures – All Funds Combined Table
1. This table reflects the consolidation of all funds that support operating and/or capital financialactivities.
2. The Citywide General Fund Support line-item reflects citywide General Fund revenues (i.e.,sales tax, property tax, etc.) captured in the General City Purpose Department and is utilized tocover the difference between General Fund revenues and expenditures facilitated by the abovedepartment.
3. Data may not add to the totals due to rounding.
Department Appropriations by Fund Classification – FY 2021 only Table 1. The Citywide General Fund Support line-item reflects citywide General Fund revenues (i.e.,
sales tax, property tax, etc.) captured in the General City Purpose Department and is utilized tocover the difference between General Fund revenues and expenditures facilitated by the abovedepartment.
Department Appropriations by Fund Type 1. Data may not add to the totals due to rounding.
Airports Department
B - 26 FY 2020-2021 Final Revised Budget

City Attorney’s Office The City Attorney’s Office serves as legal counsel and advocate for the City and related agencies and non-profits. The Office plays a key role in the City’s efforts to provide, expand, and improve services to its residents. The Office is managed by the City Attorney, who is appointed by the City Council and serves at its pleasure.
The Office strives to understand clients’ needs and effectively provide services to all City officials and departments. The services range from transactional work on economic development projects, large scale financings, contracts, land use, and personnel, to a full range of litigation, responses to Public Record Act Requests, and code enforcement.
The City Attorney’s Office works diligently to deliver quality and timely legal services to its clients. It also strives to offer its employees a challenging and fulfilling environment in which to work and enjoy personal growth. The City Attorney’s Office makes every effort to maximize efficiencies, including handling legal matters in-house and managing outside counsel to reduce the overall cost of legal services. All appropriations in the City Attorney’s Office are devoted to the delivery of core services in a professional, cost-efficient, and timely manner.
FY 2020-2021 Final Revised Budget B - 27

Douglas SloanCity Attorney
Code
ACA Code
Litigation
ACA Transactions
Chief ACA CodeChief ACA Litigation
Contracts
Chief ACA Transactions
ACA Personnel
Sup DCA Land Use
Prosecution
Transactions
Class Actions
Tort Defense
Council Projects
PRA’s
Real Estate
Conflicts
Collections
Police Advice
Grants
Special Teams
Response Team
Accounting
Community Compliance
Rental Housing
B - 28 FY 2020-2021 Final Revised Budget
City Attorney's Office

OperatingFY 2020
AmendedFY 2021
Final Variance
General Fund 16,510,500 20,089,700 3,579,200
Special Revenue 248,700 236,600 (12,100)
Total Operating 16,759,200 20,326,300 3,567,100
Grand Total 16,759,200 20,326,300 3,567,100
Operating and Debt Service by Fund Type FY 2021 Appropriation Fund Type Chart
City Attorney's Department Fund Type FTE
General Fund 131.40
Special Revenue 1.60
Department Total FTE 133.00
Debt Service
0 0 0
Total Debt Service 0 0 0
City Attorney's Department Budget Snapshot
FY 2020-2021 Final Revised Budget B - 29
City Attorney's Office

Service Impacts
Approved Council Motions Per Revised Budget Hearings • Motion #10 reduced appropriations for the
City Attorney’s Office by $60,000 andincreased appropriations for the City Clerk’sOffice by the same amount. Shifting theappropriations will allow the City Clerk’sOffice to utilize $10,000 to makeLaserFiche Document Portal improvementsand $50,000 to hire a Records ManagementConsultant to establish a Citywide RecordsManagement Program.
Final Revised FY 2021 appropriations for the City Attorney’s Office have increased 21.3 percent to $20,326,300, which includes $236,600 of tire grant funding.
Out of an abundance of caution, 10 positions were held open during FY 2020 due to budget uncertainty following the transfer of Code Enforcement to the City Attorney’s Office. Those positions will be filled.
Personnel appropriations are $14,648,500 which is $1,916,900 or 15.1 percent higher than the FY 2020 Amended Budget. Increases to Personnel appropriations include contractually required obligations and the following: • $800,000 increase based on FY 2020 and
FY 2021 estimated CARES Act salaryreimbursements to be received in FY 2021.
• $601,200 increase due to scheduled salaryincreases as well as the funding andconversion of two positions that weredefunded in FY 2020.
• $243,100 increase due to the addition offour Weed Abatement staff by the 9th
Amendment to the FY 2020 PAR. Resultingfrom bringing abatement services in-houseversus the budgeted contract amount of$350,000. The appropriations were in the
FY 2020 budget, but not in FY 2020 Personnel appropriations.
• $80,000 increase due to unspent FY 2020appropriations transferred to the GeneralCity Purpose Department by the 56th
Amendment to the AAR for the FresnoEnhanced Infrastructure Financing District.The appropriations are present in the FinalRevised FY 2021 Budget.
• $61,900 increase related to FY 2020 Motion23 for one Paralegal. In FY 2020appropriations for this position remained inNon-Personnel accounts.
Non Personnel appropriations have increased by 100.8 percent or $1,671,000 compared to the FY2020 Amended Budget. The increase is primarily due to following: • $1,500,000 additional appropriations
provided by Council Motion #52 during theContinuing Resolution Budget Hearingsheld in June.
• Accounting for the 41st Amendment to theFY 2020 AAR which transferred $250,000for the Save Our Small Business Programfrom the City Attorney’s Office to theGeneral City Purpose Department in FY2020. The appropriations have beenrestored in the City Attorney’s Office aspart of the FY 2021 Final Revised Budget.
• $60,000 reduction in appropriationspursuant to Motion #10 approved duringthe Final Revised Budget Hearings held inJune. The reduction was to freeappropriations to fund two projects in theCity Clerk’s Office.
Interdepartmental Services Charges have decreased $20,800 or 0.9 percent under the FY 2020 Amended Budget. The largest changes to Interdepartmental Charges include a $220,200 increase for Information System Service Charges and a $233,800 decrease for City Hall Rent.
B - 30 FY 2020-2021 Final Revised Budget
City Attorney's Office

Staffing Permanent staffing levels for the City Attorney’s Office in FY 2021 will remain consistent with FY 2020 Amended levels. FY 2020 Amended staffing includes two Laborers and two Light Equipment Operators that were added for weed and public nuisance abatement duties.
Also in FY 2021, two of the four defunded Senior Law Clerk positions approved by the 8th Amendment to the FY2019 Position Authorization have been funded and converted to a Deputy City Attorney II and a Housing and Neighborhood Revitalization Manager.
Department Staffing Detail
Position Summary FY 2019 FY 2020 FY 2020 FY 2021 FY 2021
Division Adopted Adopted Amended Changes Final Legal Proceedings 39.00 43.00 43.00 (2.00) 41.00
ASET & Code Enforcement 4.00 86.00 90.00 2.00 92.00
Total 43.00 129.00 133.00 0.00 133.00
Note: FY 2020 Amended includes 4.00 Code Enforcement FTEs added by the 9th Amendment to the Position Authorization Resolution adopted by
Council March 19, 2020.
FY 2020-2021 Final Revised Budget B - 31
City Attorney's Office

Department Revenue and Expenditure - All Funds Combined
Funding Source FY 2018Actuals
FY 2019Actuals
FY 2020Amended
FY 2021Final
PercentChange
Beginning Balance 0 0 0 (114,300) 0.0
Fiscal Year Revenues:
Taxes 10 0 0 0 0.0
Licenses & Permits 0 0 0 0 0.0
Intergovernmental Revenue 0 0 249,000 350,900 40.9
Charges for Services 26,700 16,893 1,980,700 1,506,800 (23.9)
Fines 0 0 9,200 800 (91.3)
Other Revenue 0 0 17,300 18,000 4.0
Interdepartmental Charges for Services 0 0 0 0 0.0
Misc. Revenue 9,202 5,407 381,900 319,500 (16.3)
Transfers 0 0 0 800,000 0.0
Total Fiscal Year Revenues 35,912 22,299 2,638,100 2,996,000 13.6
Funding Facilitated by Department 35,912 22,299 2,638,100 2,881,700 9.2
Memo Item:
Appropriations by Amount
Personnel Services 4,711,430 5,322,871 12,731,600 14,648,500 15.1
Non Personnel Services 353,567 429,163 1,658,100 3,329,100 100.8
Interdepartmental Services 554,870 587,600 2,369,500 2,348,700 (0.9)
Contingencies 0 0 0 0 0.0
Total Departmental Expenditures 5,619,867 6,339,634 16,759,200 20,326,300 21.3
Citywide General Fund Support 5,583,955 6,317,335 14,121,400 17,444,600 23.5
Total Available Funding 5,619,867 6,339,634 16,759,500 20,326,300 21.3
Appropriations by Percentage
Personnel Services 83.8 84.0 76.0 72.1 15.1
Non Personnel Services 6.3 6.8 9.9 16.4 100.8
Interdepartmental Services 9.9 9.3 14.1 11.6 (0.9)
Contingencies 0.0 0.0 0.0 0.0 0.0
Total Departmental Expenditures 100.0 100.0 100.0 100.0 21.3
B - 32 FY 2020-2021 Final Revised Budget
City Attorney's Office

Department Appropriations by Fund Classification - FY 2021 Only
Resources GeneralFund
SpecialRevenues Capital Enterprise Internal
ServiceDebt
Service Total
Beginning Balance 0 (114,300) 0 0 0 0 (114,300)
Fiscal Year Revenues:
Taxes 0 0 0 0 0 0 0
Licenses & Permits 0 0 0 0 0 0 0
Intergovernmental Revenue 0 350,900 0 0 0 0 350,900
Charges for Services 1,506,800 0 0 0 0 0 1,506,800
Fines 800 0 0 0 0 0 800
Other Revenue 18,000 0 0 0 0 0 18,000
Interdepartmental Charges for Services 0 0 0 0 0 0 0
Misc. Revenue 319,500 0 0 0 0 0 319,500
Transfers 800,000 0 0 0 0 0 800,000
Total Fiscal Year Revenues 2,645,100 350,900 0 0 0 0 2,996,000
Funding Facilitated by Department 2,645,100 236,600 0 0 0 0 2,881,700
Memo Item:
Appropriations
Personnel Services 14,516,600 131,900 0 0 0 0 14,648,500
Non Personnel Services 3,224,400 104,700 0 0 0 0 3,329,100
Interdepartmental Services 2,348,700 0 0 0 0 0 2,348,700
Contingencies 0 0 0 0 0 0 0
Total Appropriations 20,089,700 236,600 0 0 0 0 20,326,300
Citywide General Fund Support 17,444,600 0 0 0 0 0 17,444,600
Total Available Funding 20,089,700 236,600 0 0 0 0 20,326,300
Department Appropriations by Fund Type
FY 2018Actuals
FY 2019Actuals
FY 2020Amended
FY 2021Final
(Amount)
FY 2021Final
(Percent)Operating 5,619,867 6,339,634 16,759,200 20,326,300 100.0
Capital 0 0 0 0 0.0
Debt Service 0 0 0 0 0.0
Total 5,619,867 6,339,634 16,759,200 20,326,300 100.0
FY 2020-2021 Final Revised Budget B - 33
City Attorney's Office
Notes Department Revenue and Expenditures – All Funds Combined Table
1. This table reflects the consolidation of all fund that support operating and/or capital financialactivities.
2. The Citywide General Fund Support line-item reflects citywide General Fund revenues (i.e., salestax, property tax, etc.) captured in the General City Purpose Department and is utilized to coverthe difference between General Fund revenues and expenditures facilitated by the abovedepartment.
3. Data may not add to the totals due to rounding.
Department Appropriations by Fund Classification – FY 2021 only Table 1. The Citywide General Fund Support line-item reflects citywide General Fund revenues (i.e., sales
tax, property tax, etc.) captured in the General City Purpose Department and is utilized to coverthe difference between General Fund revenues and expenditures facilitated by the abovedepartment.
Department Appropriations by Fund Type 1. Data may not add to the totals due to rounding.
B - 34 FY 2020-2021 Final Revised Budget
City Attorney's Office

City Clerk’s Office The mission of the Office of the City Clerk is to provide quality public service and connect the public with the legislative process. We strive to ensure that the City’s legislative processes are transparent by providing easy access to information. The Office of the City Clerk is often the first department members of the public contact when seeking general information regarding the City. Through efficient use of City resources, we are able to ensure the preservation of the City of Fresno’s legislative history.
The Office of the City Clerk maintains the Municipal Code and Charter through the codification of adopted Ordinances. The Office certifies official legislative documents including ordinances, resolutions, agreements, deeds, bonds, and other documents as necessary. It also falls upon the Office of the City Clerk to ensure all public notices, hearings and agendas
are posted according to applicable statutes and regulations. Additionally, the City Clerk ensures the legislative policy of the City of Fresno is adhered to by attending and coordinating support for the City Council Meeting and producing the agendas and minutes. The City Clerk also serves as the Filing Officer for the Fair Political Practices Commission and the official custodian of the City Seal.
The City Clerk serves as the local Elections Official and works with the County Clerk on City elections, initiatives, referendums and recall petitions.
The Office serves as the Custodian of Records, responds to Public Records Act requests, registers lobbyists, and administers oaths of office. The Office also oversees the processing of appointments, resignations, and terminations for all official City boards, commissions and committees and ensures compliance with the Maddy Act.
As the official records keeper for the City, the Office of the City Clerk is responsible for the coordination and administration of all City records, documents, and public files pertaining to the legislative history.
FY 2020-2021 Final Revised Budget B - 35

City Council Support
Coordinate the PRIDE & Employee Service Award
Programs
City Council Packets
Transcription of Official Minutes
Certification of CouncilAdopted Documents
Administrate the Political Reform Act/Elections
Manage & Store Official Records for the City
Schedule Public HearingsPost Meeting Notices
Yvonne SpenceCity Clerk
Administration Division
Maintain Records Retention Schedule
Coordinate Records Management Program
Maintain Current Fresno Municipal Code
Records Management Division
Administer the Oath of Office
Manage the Electronic Document Repository
B - 36 FY 2020-2021 Final Revised Budget
City Clerk's Office
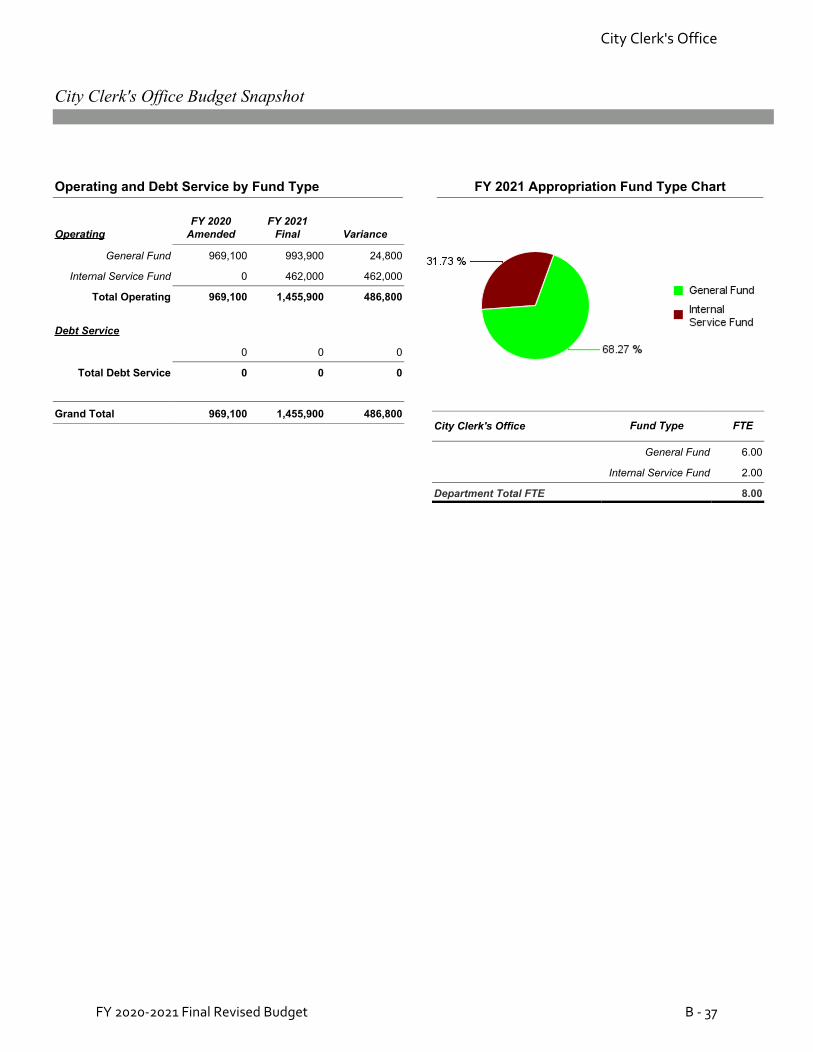
OperatingFY 2020
AmendedFY 2021
Final Variance
General Fund 969,100 993,900 24,800
Internal Service Fund 0 462,000 462,000
Total Operating 969,100 1,455,900 486,800
Grand Total 969,100 1,455,900 486,800
Operating and Debt Service by Fund Type FY 2021 Appropriation Fund Type Chart
City Clerk's Office Fund Type FTE
General Fund 6.00
Internal Service Fund 2.00
Department Total FTE 8.00
Debt Service
0 0 0
Total Debt Service 0 0 0
City Clerk's Office Budget Snapshot
FY 2020-2021 Final Revised Budget B - 37
City Clerk's Office

Service Impacts
Approved Council Motions Per Revised Budget Hearings • Motion #10 provided a total of $60,000 in
appropriations to the City Clerk’s Office.The motion included $10,000 forLaserFiche Document Portal improvementsand $50,000 for a Records ManagementConsultant to establish a Citywide RecordsManagement Program.
• Motion #11 relocated the Central PrintDivision of the Finance Department to theCity Clerk effective January 1, 2021. Themove placed the Central Service InternalService Fund under the City Clerk withappropriations in the amount of $462,000.
FY 2021 Final Revised Budget appropriations for the City Clerk’s Office are $1,455,900, which is an increase of 50.2 percent or $486,800 higher when compared to the FY 2020 Amended Budget. Of the total appropriations, $993,900 are in the General Fund and $462,000 are in the Central Service Internal Service Fund.
General Fund Personnel appropriations in the General Fund have increased by $41,000, which is 8.3 percent higher than the FY 2020 Amended Budget. The increase is primarily driven by: • $18,200 in unspent FY 2020
appropriations transferred to coverhigher than anticipated Non Personneland ID Charges,
• $13,500 increase to salaries,• $8,800 increase in pension obligations.
Non Personnel General Fund appropriations have increased by $107,300 which is 103.7 percent greater than the FY 2020 Amended Budget. The increase to Non Personnel appropriations is primarily due to:
• An increase of $45,000 for digitizing andmicrofilming projects provided by Motion#6 approved during the ContinuingResolution Budget Hearings in June,
• An increase of $7,000 for office doorscompliant with ADA accessibility standardsprovided by Motion #6 approved duringthe Continuing Resolution Budget Hearingsin June,
• Motion #10 approved during the FinalRevised Budget Hearing in Octoberprovided $60,000 total for LaserFicheDocument Portal improvements and aRecords Management Consultant.
Interdepartmental Charges have decreased by $123,500 which is 33.0 percent lower than the FY 2020 Amended Budget. The decrease is primarily due to: • $89,000 decrease for Information Systems
Equipment Charges,• $46,000 decrease for City Hall Rent,• $13,000 decrease for Central Print Charges,• $19,300 offset by increase for Security
Assessment Charges,• $11,300 offset by increase for Facilities
Management Charges.
Central Services Internal Service Fund The Central Print Division is new to the City Clerk’s Office after Revised Budget Hearing Motion #11 relocated it from the Finance Department. The Division is an Internal Service funded program that provides a wide range of support services including copying, printing, graphic design, as well as mail and messenger services. The addition of the Central Print Division brings $462,000 in appropriations to the City Clerk’s Office based on an effective date of January 1, 2021. Appropriations consist of $64,500 in Personnel appropriations to support two positions, $255,300 in Non Personnel appropriations and $142,200 in Interdepartmental Charges.
B - 38 FY 2020-2021 Final Revised Budget
City Clerk's Office

Staffing
Department Staffing Detail
Position Summary FY 2019 FY 2020 FY 2020 FY 2021 FY 2021
Division Adopted Adopted Amended Changes Final City Clerk 1.00 1.00 1.00 0.00 1.00
Staff 5.00 5.00 5.00 2.00 7.00
Total 6.00 6.00 6.00 2.00 8.00
Note: FY 2021 Final has increased by 2.0 positions due to Revised Budget Hearing Motion #11 which moved the Central Print Division from the
Finance Department into the City Clerk's Office effective January 1, 2021. The move includes a Central Printing Clerk and a Graphics Technician.
FY 2020-2021 Final Revised Budget B - 39
City Clerk's Office

Department Revenue and Expenditure - All Funds Combined
Funding Source FY 2018Actuals
FY 2019Actuals
FY 2020Amended
FY 2021Final
PercentChange
Beginning Balance 0 0 0 0 0.0
Fiscal Year Revenues:
Taxes 0 0 0 0 0.0
Licenses & Permits 0 0 0 0 0.0
Intergovernmental Revenue 0 0 0 0 0.0
Charges for Services 30 0 0 0 0.0
Fines 0 0 0 0 0.0
Other Revenue 0 0 0 0 0.0
Interdepartmental Charges for Services 0 0 0 500,000 0.0
Misc. Revenue 5,083 2,565 0 0 0.0
Transfers 0 0 0 0 0.0
Total Fiscal Year Revenues 5,113 2,565 0 500,000 0.0
Funding Facilitated by Department 5,113 2,565 0 500,000 0.0
Memo Item:
Appropriations by Amount
Personnel Services 456,696 470,360 491,300 596,800 21.5
Non Personnel Services 99,929 106,261 103,500 466,100 350.3
Interdepartmental Services 236,603 292,500 374,300 393,000 5.0
Contingencies 0 0 0 0 0.0
Total Departmental Expenditures 793,227 869,121 969,100 1,455,900 50.2
Citywide General Fund Support 788,114 866,557 969,100 993,900 2.6
Total Available Funding 793,227 869,121 969,100 1,493,900 54.2
Appropriations by Percentage
Personnel Services 57.6 54.1 50.7 41.0 21.5
Non Personnel Services 12.6 12.2 10.7 32.0 350.3
Interdepartmental Services 29.8 33.7 38.6 27.0 5.0
Contingencies 0.0 0.0 0.0 0.0 0.0
Total Departmental Expenditures 100.0 100.0 100.0 100.0 50.2
B - 40 FY 2020-2021 Final Revised Budget
City Clerk's Office

Department Appropriations by Fund Classification - FY 2021 Only
Resources GeneralFund
SpecialRevenues Capital Enterprise Internal
ServiceDebt
Service Total
Beginning Balance 0 0 0 0 0 0 0
Fiscal Year Revenues:
Taxes 0 0 0 0 0 0 0
Licenses & Permits 0 0 0 0 0 0 0
Intergovernmental Revenue 0 0 0 0 0 0 0
Charges for Services 0 0 0 0 0 0 0
Fines 0 0 0 0 0 0 0
Other Revenue 0 0 0 0 0 0 0
Interdepartmental Charges for Services 0 0 0 0 500,000 0 500,000
Misc. Revenue 0 0 0 0 0 0 0
Transfers 0 0 0 0 0 0 0
Total Fiscal Year Revenues 0 0 0 0 500,000 0 500,000
Funding Facilitated by Department 0 0 0 0 500,000 0 500,000
Memo Item:
Appropriations
Personnel Services 532,300 0 0 0 64,500 0 596,800
Non Personnel Services 210,800 0 0 0 255,300 0 466,100
Interdepartmental Services 250,800 0 0 0 142,200 0 393,000
Contingencies 0 0 0 0 0 0 0
Total Appropriations 993,900 0 0 0 462,000 0 1,455,900
Citywide General Fund Support 993,900 0 0 0 0 0 993,900
Total Available Funding 993,900 0 0 0 500,000 0 1,493,900
Department Appropriations by Fund Type
FY 2018Actuals
FY 2019Actuals
FY 2020Amended
FY 2021Final
(Amount)
FY 2021Final
(Percent)Operating 793,227 869,121 969,100 1,455,900 100.0
Capital 0 0 0 0 0.0
Debt Service 0 0 0 0 0.0
Total 793,227 869,121 969,100 1,455,900 100.0
FY 2020-2021 Final Revised Budget B - 41
City Clerk's Office

Notes Department Revenue and Expenditures – All Funds Combined Table
1. This table reflects the consolidation of all fund that support operating and/or capital financialactivities.
2. The Citywide General Fund Support line-item reflects citywide General Fund revenues (i.e.,sales tax, property tax, etc.) captured in the General City Purpose Department and is utilized tocover the difference between General Fund revenues and expenditures facilitated by the abovedepartment.
3. Data may not add to the totals due to rounding.
Department Appropriations by Fund Classification – FY 2021 only Table 1. The Citywide General Fund Support line-item reflects citywide General Fund revenues (i.e.,
sales tax, property tax, etc.) captured in the General City Purpose Department and is utilized tocover the difference between General Fund revenues and expenditures facilitated by the abovedepartment.
Department Appropriations by Fund Type 1. Data may not add to the totals due to rounding.
B - 42 FY 2020-2021 Final Revised Budget
City Clerk's Office

Convention Center and Stadium Department The Fresno Convention Center was opened in October of 1966. Originally, the complex consisted of three separate buildings that sat under one roof line and were separated by 90 foot mall ways. The three venues consisted of the William Saroyan Theatre, the 32,000 square foot Ernest Valdez Exhibit Hall with 12 meeting rooms, and the Selland Arena which seated 6,500.
The complex now spans over five city blocks and boasts four separate facilities. The expansion of Selland Arena in 1981 brought a seating capacity of 11,300. The exhibit hall was renamed Exhibit Hall South in December 1999 upon the completion of the new 77,000 square foot exhibit hall, which encompasses 25 meeting rooms in addition to housing the Center's Administration and Operation divisions.
In January 2004, the City contracted with SMG (now ASM Global) to operate and market the Fresno Convention Center. ASM Global is the largest facility operating company in the world and provides unprecedented marketing strength, expertise, and resources to the enterprise.
The Stadium was opened in May of 2002 and has a seating capacity of 10,500. In addition to hosting baseball games, the multi-use facility is also converted to host soccer games, music concerts and events. The Stadium features 33 luxury suites, a pool and spa, and a kids Fun Zone. It is currently the home to the Fresno Grizzlies Baseball club, a Triple A Minor League Baseball Franchise affiliated with the Pacific Coast League (PCL) of Professional Baseball Clubs.
In December of 2018, the City entered into a new ownership agreement with Fresno Sports and Events, LLC. As a result of the new ownership agreement and in an effort to enhance the experience of stadium guests, several improvements have been completed. These improvements include a Splash Zone, a new left field social gathering area, improvements to the concession areas, remodeling of The Club, improvements to the netting to protect fans, and improvements to the boiler and HVAC.
FY 2020-2021 Final Revised Budget B - 43

OperatingFY 2020
Amended
FY 2021Final
Budget Variance
Enterprise 6,716,600 3,374,200 (3,342,400)
Total Operating 6,716,600 3,374,200 (3,342,400)
Capital
0 0 0
Total Capital 0 0 0
Grand Total 11,863,900 8,521,000 (3,342,900)
Operating and Capital Appropriations by Fund Type FY 2021 Appropriation Fund Type Chart
Debt Service
Enterprise 5,147,300 5,146,800 (500)
Total Debt Service 5,147,300 5,146,800 (500)
FCEC Budget Snapshot
B - 44 FY 2020-2021 Final Revised Budget
Convention Center and Stadium Department

Service Impacts
Fresno Convention & Entertainment Center (FCEC) On June 11, 2020, Council approved the terms of the new management agreement with AMS Global. The FY 2021 Final Revised Budget has been updated to reflect the terms of this agreement.
The FY 2021 Final Revised Budget appropriations are budgeted at $8,521,000, $3,342,900 or 28.2 percent less than the FY 2020 Amended budget. The decline is mainly a reflection of the cessation of event activity that began in March 2020 driven by the COVID-19 pandemic. The FY 2021 Final Revised Budget assumes resuming event activity in February 2021 at substantially lower levels than in previous years. Due to
the precipitous decline in revenues, the anticipated FCEC operating deficit for FY 2021 is projected to be $1,678,300. The shortfall will be covered entirely by the City. Other contractual obligations that are covered by the City per the current terms of the agreement include the Management Fee, Annual Audit Fee, Co-Promotion Fund, Convention Center and Visitors Bureau Manager funding and pass-through parking revenues.
As in prior years, in addition to the FCEC subsidy and City contractual obligations, FY 2021 appropriations also reflect anticipated FCEC expenditures. This is a book entry only and the expenditures, like revenues, do not flow through the City’s financial system.
FY 2020-2021 Final Revised Budget B - 45
Convention Center and Stadium Department

FCEC Revenue and Expenditure - All Funds Combined
Funding Source FY 2018Actuals
FY 2019Actuals
FY 2020Amended
FY 2021Final
PercentChange
Beginning Balance 749,573 186,871 50,200 (54,500) (208.6)
Fiscal Year Revenues:
Taxes 0 0 0 0 0.0
Licenses & Permits 0 0 0 0 0.0
Intergovernmental Revenue 0 0 0 0 0.0
Charges for Services 108,350 202,079 400,000 400,000 0.0
Fines 0 0 0 0 0.0
Other Revenue 1,362 (7,438) 10,700 15,600 45.8
Interdepartmental Charges for Services 0 0 0 0 0.0
Misc. Revenue 0 0 5,409,800 1,176,500 (78.3)
Transfers 5,145,972 6,942,938 5,994,100 6,983,900 16.5
Total Fiscal Year Revenues 5,255,684 7,137,579 11,814,600 8,576,000 (27.4)
Funding Facilitated by Department 6,005,257 7,324,450 11,864,800 8,521,500 (28.2)
Memo Item:
Appropriations by Amount
Personnel Services 0 0 0 0 0.0
Non Personnel Services 5,817,923 6,757,021 11,846,600 8,521,000 (28.1)
Interdepartmental Services 0 0 17,300 0 (100.0)
Contingencies 0 0 0 0 0.0
Total Departmental Expenditures 5,817,923 6,757,021 11,863,900 8,521,000 (28.2)
Citywide General Fund Support 0 0 0 0 0.0
Total Available Funding 6,005,257 7,324,450 11,864,800 8,521,500 (28.2)
Appropriations by Percentage
Personnel Services 0.0 0.0 0.0 0.0 0.0
Non Personnel Services 100.0 100.0 99.9 100.0 (28.1)
Interdepartmental Services 0.0 0.0 0.1 0.0 (100.0)
Contingencies 0.0 0.0 0.0 0.0 0.0
Total Departmental Expenditures 100.0 100.0 100.0 100.0 (28.2)
B - 46 FY 2020-2021 Final Revised Budget
Convention Center and Stadium Department
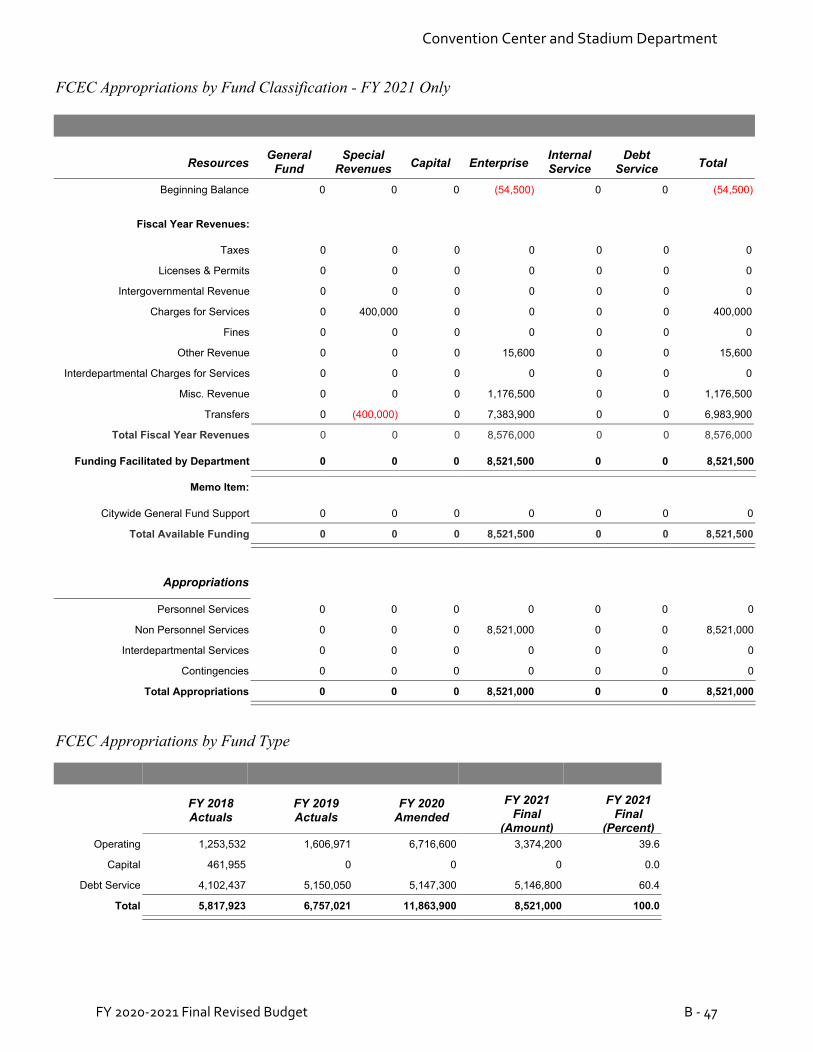
FCEC Appropriations by Fund Classification - FY 2021 Only
Resources GeneralFund
SpecialRevenues Capital Enterprise Internal
ServiceDebt
Service Total
Beginning Balance 0 0 0 (54,500) 0 0 (54,500)
Fiscal Year Revenues:
Taxes 0 0 0 0 0 0 0
Licenses & Permits 0 0 0 0 0 0 0
Intergovernmental Revenue 0 0 0 0 0 0 0
Charges for Services 0 400,000 0 0 0 0 400,000
Fines 0 0 0 0 0 0 0
Other Revenue 0 0 0 15,600 0 0 15,600
Interdepartmental Charges for Services 0 0 0 0 0 0 0
Misc. Revenue 0 0 0 1,176,500 0 0 1,176,500
Transfers 0 (400,000) 0 7,383,900 0 0 6,983,900
Total Fiscal Year Revenues 0 0 0 8,576,000 0 0 8,576,000
Funding Facilitated by Department 0 0 0 8,521,500 0 0 8,521,500
Memo Item:
Appropriations
Personnel Services 0 0 0 0 0 0 0
Non Personnel Services 0 0 0 8,521,000 0 0 8,521,000
Interdepartmental Services 0 0 0 0 0 0 0
Contingencies 0 0 0 0 0 0 0
Total Appropriations 0 0 0 8,521,000 0 0 8,521,000
Citywide General Fund Support 0 0 0 0 0 0 0
Total Available Funding 0 0 0 8,521,500 0 0 8,521,500
FCEC Appropriations by Fund Type
FY 2018Actuals
FY 2019Actuals
FY 2020Amended
FY 2021Final
(Amount)
FY 2021Final
(Percent)Operating 1,253,532 1,606,971 6,716,600 3,374,200 39.6
Capital 461,955 0 0 0 0.0
Debt Service 4,102,437 5,150,050 5,147,300 5,146,800 60.4
Total 5,817,923 6,757,021 11,863,900 8,521,000 100.0
FY 2020-2021 Final Revised Budget B - 47
Convention Center and Stadium Department

OperatingFY 2020
Amended
FY 2021Final
Budget Variance
Enterprise 338,700 170,100 (168,600)
Total Operating 338,700 170,100 (168,600)
Capital
Enterprise 3,787,100 3,667,600 (119,500)
Total Capital 3,787,100 3,667,600 (119,500)
Grand Total 7,322,700 7,035,400 (287,300)
Operating and Capital Appropriations by Fund Type FY 2021 Appropriation Fund Type Chart
Major Capital Projects by Appropriations
Debt Service
Enterprise 3,196,900 3,197,700 800
Total Debt Service 3,196,900 3,197,700 800
Project Fund Type Amount
CC00027 - Stadium Capital Improvements Enterprise 3,667,600 ## 1
Stadium Budget Snapshot
B - 48 FY 2020-2021 Final Revised Budget
Convention Center and Stadium Department

Stadium Stadium appropriations in the FY2021 Final Revised Budget are $7,035,400, $287,300 or 3.9 percent less than the FY 2020 Amended Budget. The majority of this decline is attributable to an anticipated decrease in pass-through parking revenues due to the
significant drop in event activity as a result of the COVID-19 pandemic in addition to a slight reduction in appropriations intended to align with available resources.
Appropriations include funding for ongoing debt service payments and capital upkeep and repairs on the 18 year old Chukchansi Stadium.
FY 2020-2021 Final Revised Budget B - 49
Convention Center and Stadium Department
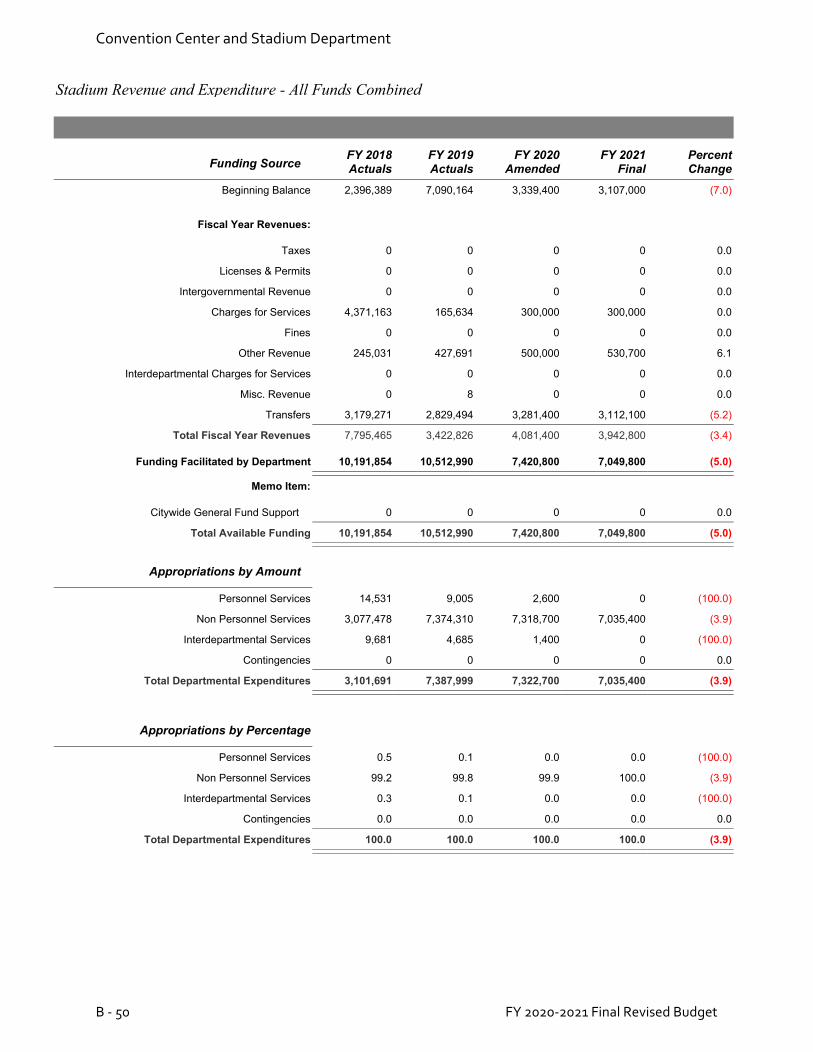
Stadium Revenue and Expenditure - All Funds Combined
Funding Source FY 2018Actuals
FY 2019Actuals
FY 2020Amended
FY 2021Final
PercentChange
Beginning Balance 2,396,389 7,090,164 3,339,400 3,107,000 (7.0)
Fiscal Year Revenues:
Taxes 0 0 0 0 0.0
Licenses & Permits 0 0 0 0 0.0
Intergovernmental Revenue 0 0 0 0 0.0
Charges for Services 4,371,163 165,634 300,000 300,000 0.0
Fines 0 0 0 0 0.0
Other Revenue 245,031 427,691 500,000 530,700 6.1
Interdepartmental Charges for Services 0 0 0 0 0.0
Misc. Revenue 0 8 0 0 0.0
Transfers 3,179,271 2,829,494 3,281,400 3,112,100 (5.2)
Total Fiscal Year Revenues 7,795,465 3,422,826 4,081,400 3,942,800 (3.4)
Funding Facilitated by Department 10,191,854 10,512,990 7,420,800 7,049,800 (5.0)
Memo Item:
Appropriations by Amount
Personnel Services 14,531 9,005 2,600 0 (100.0)
Non Personnel Services 3,077,478 7,374,310 7,318,700 7,035,400 (3.9)
Interdepartmental Services 9,681 4,685 1,400 0 (100.0)
Contingencies 0 0 0 0 0.0
Total Departmental Expenditures 3,101,691 7,387,999 7,322,700 7,035,400 (3.9)
Citywide General Fund Support 0 0 0 0 0.0
Total Available Funding 10,191,854 10,512,990 7,420,800 7,049,800 (5.0)
Appropriations by Percentage
Personnel Services 0.5 0.1 0.0 0.0 (100.0)
Non Personnel Services 99.2 99.8 99.9 100.0 (3.9)
Interdepartmental Services 0.3 0.1 0.0 0.0 (100.0)
Contingencies 0.0 0.0 0.0 0.0 0.0
Total Departmental Expenditures 100.0 100.0 100.0 100.0 (3.9)
B - 50 FY 2020-2021 Final Revised Budget
Convention Center and Stadium Department

Stadium Appropriations by Fund Classification - FY 2021 Only
Resources GeneralFund
SpecialRevenues Capital Enterprise Internal
ServiceDebt
Service Total
Beginning Balance 0 0 0 3,107,000 0 0 3,107,000
Fiscal Year Revenues:
Taxes 0 0 0 0 0 0 0
Licenses & Permits 0 0 0 0 0 0 0
Intergovernmental Revenue 0 0 0 0 0 0 0
Charges for Services 0 0 0 300,000 0 0 300,000
Fines 0 0 0 0 0 0 0
Other Revenue 0 0 0 530,700 0 0 530,700
Interdepartmental Charges for Services 0 0 0 0 0 0 0
Misc. Revenue 0 0 0 0 0 0 0
Transfers 0 0 0 3,112,100 0 0 3,112,100
Total Fiscal Year Revenues 0 0 0 3,942,800 0 0 3,942,800
Funding Facilitated by Department 0 0 0 7,049,800 0 0 7,049,800
Memo Item:
Appropriations
Personnel Services 0 0 0 0 0 0 0
Non Personnel Services 0 0 0 7,035,400 0 0 7,035,400
Interdepartmental Services 0 0 0 0 0 0 0
Contingencies 0 0 0 0 0 0 0
Total Appropriations 0 0 0 7,035,400 0 0 7,035,400
Citywide General Fund Support 0 0 0 0 0 0 0
Total Available Funding 0 0 0 7,049,800 0 0 7,049,800
Stadium Appropriations by Fund Type
FY 2018Actuals
FY 2019Actuals
FY 2020Amended
FY 2021Final
(Amount)
FY 2021Final
(Percent)Operating 0 0 338,700 170,100 2.4
Capital 27,938 4,188,615 3,787,100 3,667,600 52.1
Debt Service 3,073,752 3,199,384 3,196,900 3,197,700 45.5
Total 3,101,691 7,387,999 7,322,700 7,035,400 100.0
FY 2020-2021 Final Revised Budget B - 51
Convention Center and Stadium Department

Notes FCEC/Stadium Revenue and Expenditures – All Funds Combined Table
1. This table reflects the consolidation of all fund that support operating and/or capital financialactivities.
2. The Citywide General Fund Support line-item reflects citywide General Fund revenues (i.e., salestax, property tax, etc.) captured in the General City Purpose Department and is utilized to coverthe difference between General Fund revenues and expenditures facilitated by the abovedepartment.
3. Data may not add to the totals due to rounding.
FCEC/Stadium Appropriations by Fund Classification – FY 2021 only Table 1. This Citywide General Fund Support line-item reflects citywide General Fund revenues (i.e., sales
tax, property tax, etc.) captured in the General City Purpose Department and is utilized to coverthe difference between General Fund revenues and expenditures facilitated by the abovedepartment.
FCEC/Stadium Appropriations by Fund Type 1. Data may not add to the totals due to rounding.
B - 52 FY 2020-2021 Final Revised Budget
Convention Center and Stadium Department

Finance Department The Finance Department works to ensure the City’s financial integrity. The Department strives to be a model for good financial management and to assist other city departments in making the City a better place to live and work. The Department is responsible for the fiscal management and oversight of City operations. It accomplishes this duty by assisting with the receipt, collection, disbursement, and monitoring of city funds.
The Finance Department provides services through the following organizational units:
Administrative Unit The Administrative Unit provides management and strategic planning services to the other units in the Finance Department. It also serves as the conduit between Finance Department staff and the City’s administration.
Accounting Unit The Accounting Unit consists of General Accounting, Accounts Payable, Financial Reporting/Grants Management, and Asset Management functions. This Unit controls the City’s financial activities by: 1) making timely and appropriate vendor and contract payments; 2) developing and distributing reports and financial tools to departments to
enhance their oversight of expenditures and revenues; and 3) producing numerous financial reports including the Comprehensive Annual Financial Report (CAFR), the Single Audit, the State Controller’s Report, the National Transit Database Report, and the Monthly Financial Report.
Treasury Unit The Treasury Unit consists of Treasury Management and Debt Administration functions. The Unit records and manages all monies received by the City, invests all funds in the City’s custody that are not required for payment of current obligations in a manner that maximizes earnings while minimizing risk. The Unit also issues and manages the City’s debt obligations and provides low-cost, debt financing for large-scale capital projects and improvements.
Collections Unit The Collections Unit performs accounts receivable services on obligations that are owed to the City, including loans that were issued to Fresno’s citizens through various housing programs.
Payroll Unit The Payroll Unit provides payroll services and information to active, retired, and prospective city employees. The Unit also ensures organizational compliance with city, state and federal tax, wage, and hour regulations.
Business Tax Unit The Business Tax Unit bills, collects, records and reports business tax, transient occupancy tax, permitting, and dog license amounts. The Unit coordinates its dog license efforts with Central California SPCA.
FY 2020-2021 Final Revised Budget B - 53
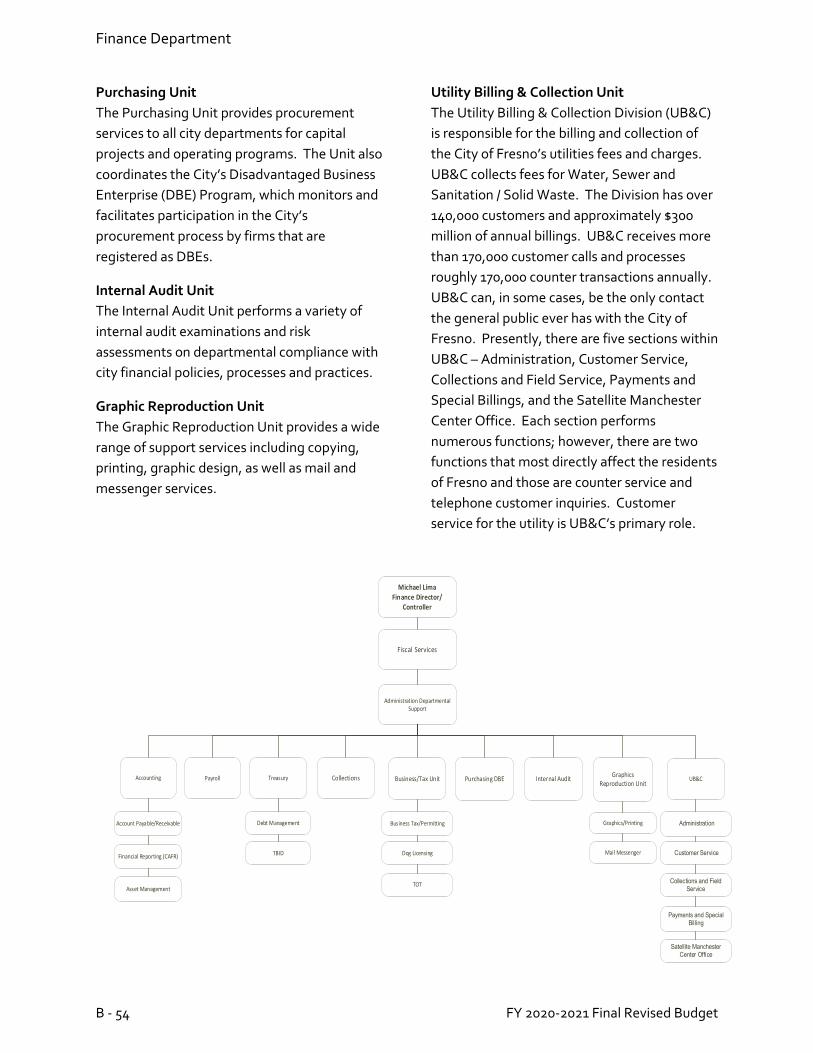
Purchasing Unit The Purchasing Unit provides procurement services to all city departments for capital projects and operating programs. The Unit also coordinates the City’s Disadvantaged Business Enterprise (DBE) Program, which monitors and facilitates participation in the City’s procurement process by firms that are registered as DBEs.
Internal Audit Unit The Internal Audit Unit performs a variety of internal audit examinations and risk assessments on departmental compliance with city financial policies, processes and practices.
Graphic Reproduction Unit The Graphic Reproduction Unit provides a wide range of support services including copying, printing, graphic design, as well as mail and messenger services.
Utility Billing & Collection Unit The Utility Billing & Collection Division (UB&C) is responsible for the billing and collection of the City of Fresno’s utilities fees and charges. UB&C collects fees for Water, Sewer and Sanitation / Solid Waste. The Division has over 140,000 customers and approximately $300 million of annual billings. UB&C receives more than 170,000 customer calls and processes roughly 170,000 counter transactions annually. UB&C can, in some cases, be the only contact the general public ever has with the City of Fresno. Presently, there are five sections within UB&C – Administration, Customer Service, Collections and Field Service, Payments and Special Billings, and the Satellite Manchester Center Office. Each section performs numerous functions; however, there are two functions that most directly affect the residents of Fresno and those are counter service and telephone customer inquiries. Customer service for the utility is UB&C’s primary role.
Treasury
TBID
Purchasing DBE Internal Audit
Michael LimaFinance Director/
Controller
Business Tax/Permitting
Business/Tax Unit PayrollAccounting
Debt ManagementAccount Payable/Receivable
Financial Reporting (CAFR)
Asset Management
Collections
Dog Licensing
Graphics Reproduction Unit
Graphics/Printing
Mail Messenger
TOT
Fiscal Services
UB&C
Administration Departmental Support
Administration
Customer Service
Collections and Field Service
Payments and Special Billing
Satellite Manchester Center Office
Finance Department
B - 54 FY 2020-2021 Final Revised Budget

OperatingFY 2020
AmendedFY 2021
Final Variance
General Fund 12,104,000 34,045,800 21,941,800
Internal Service Fund 9,656,000 8,970,900 (685,100)
Total Operating 21,760,000 43,016,700 21,256,700
Grand Total 21,760,000 43,016,700 21,256,700
Operating and Debt Service by Fund Type FY 2021 Appropriation Fund Type Chart
Finance Department Fund Type FTE
General Fund 53.00
Internal Service Fund 63.00
Department Total FTE 116.00
Debt Service
0 0 0
Total Debt Service 0 0 0
Finance Department Budget Snapshot
Finance Department
FY 2020-2021 Final Revised Budget B - 55

Service Impacts
Approved Council Motions Per Revised Budget Hearings Motion #11 relocated the Central Print Division of the Finance Department to the City Clerk’s Office effective January 1, 2021. The move placed the Central Service Internal Service Fund under the City Clerk’s Office. Finance’s appropriations in FY 2021 for this Division equates to $466,100.
Appropriations related to personnel services in the FY 2021 Final Revised Budget are budgeted at $9,753,200 and reflect an increase of $190,100 over the FY 2020 Amended Budget. Personnel services appropriations include Memorandum of Understanding provisions, as well as the renewal of temporary staff salaries in UB&C. Additional information can be found under the staffing section.
Non-Personnel Services Appropriations related to non-personnel services in the FY 2021 Final Revised Budget are budgeted at $30,550,800 and reflect an increase of $22,140,500 over the FY 2020
Amended Budget. This increase corresponds to the establishment of $27.0 million in appropriations for remaining CARES Act funding that is based on the fund’s FY 2021 beginning balance of $79.6 million less citywide departments’ budget submissions of $28.8 million less $23.8 million that has been approved by Council through the amendment to the Annual Appropriation Resolution process.
Interdepartmental Charges The Department’s interdepartmental services’ budget totals $2,712,700 or $1,073,900 less than the FY 2020 Amended Budget. The $1,073,900 decrease is primarily due to reductions in appropriations for city hall rent, variable interdepartmental reimbursements, computer equipment and cell phone charges, and non-recurring special project charges.
Additionally the FY 2021 Final Revised Budget includes $21,600 for the replacement of 18 computers that are at the end of their useful lives.
Finance Department
B - 56 FY 2020-2021 Final Revised Budget

Staffing Staffing changes for the Finance Department in FY 2021 include Motion #11 which moved the Central Printing Division and six months of its budget from the Finance Department to the City Clerk’s Office effective January 1, 2021. This equates to a decrease of 2.0 positions which includes a Central Printing Clerk and a Graphics Technician.
In FY 2021, the UB&C Division has included $150,000 for the renewal of five temporary Customer Service Clerks to maintain UB&C's high volume of customer calls at the same funding level as FY 2020.
Department Staffing Detail
Position Summary FY 2019 FY 2020 FY 2020 FY 2021 FY 2021
Division Adopted Adopted Amended Changes Final Fiscal Services Division 53.00 53.00 53.00 0.00 53.00
Graphic Reprod. Services Division 2.00 2.00 2.00 (2.00) 0.00
Utility Billing and Collection Division - 63.00 63.00 0.00 63.00
Total 55.00 118.00 118.00 (2.00) 116.00
Note:
Graphic Reprod. Services Division was reduced by 2.0 positions due to Revised Budget Hearing Motion #11, which moved this Division from the Finance Department into the City Clerk's Office effective January 1, 2021.
Finance Department
FY 2020-2021 Final Revised Budget B - 57

Department Revenue and Expenditure - All Funds Combined
Funding Source FY 2018Actuals
FY 2019Actuals
FY 2020Amended
FY 2021Final
PercentChange
Beginning Balance 12,436,764 25,517,693 2,211,900 2,145,600 (3.0)
Fiscal Year Revenues:
Taxes 18 24 0 0 0.0
Licenses & Permits 1,944 24 0 0 0.0
Intergovernmental Revenue 0 0 9,210,000 79,586,100 764.1
Charges for Services 544,185 565,822 483,100 546,200 13.1
Fines 0 0 2,411,600 1,003,500 (58.4)
Other Revenue 370,520 541,648 280,200 259,000 (7.6)
Interdepartmental Charges for Services 867,363 951,645 5,707,200 6,432,300 12.7
Misc. Revenue 81,250 86,087 59,300 57,200 (3.5)
Transfers 138,744 0 (4,210,000) (28,726,200) 582.3
Total Fiscal Year Revenues 2,004,023 2,145,251 13,941,400 59,158,100 324.3
Funding Facilitated by Department 14,440,787 27,662,944 16,153,300 61,303,700 279.5
Memo Item:
Appropriations by Amount
Personnel Services 4,287,054 4,277,685 9,563,100 9,753,200 2.0
Non Personnel Services 1,324,751 1,186,529 8,410,300 30,550,800 263.3
Interdepartmental Services 1,183,216 1,276,500 3,786,600 2,712,700 (28.4)
Contingencies 0 0 0 0 0.0
Total Departmental Expenditures 6,795,021 6,740,715 21,760,000 43,016,700 97.7
Citywide General Fund Support 5,298,386 5,133,818 5,726,300 5,507,600 (3.8)
Total Available Funding 19,739,174 32,796,762 21,879,600 66,811,300 205.4
Appropriations by Percentage
Personnel Services 63.1 63.5 43.9 22.7 2.0
Non Personnel Services 19.5 17.6 38.7 71.0 263.3
Interdepartmental Services 17.4 18.9 17.4 6.3 (28.4)
Contingencies 0.0 0.0 0.0 0.0 0.0
Total Departmental Expenditures 100.0 100.0 100.0 100.0 97.7
Finance Department
B - 58 FY 2020-2021 Final Revised Budget
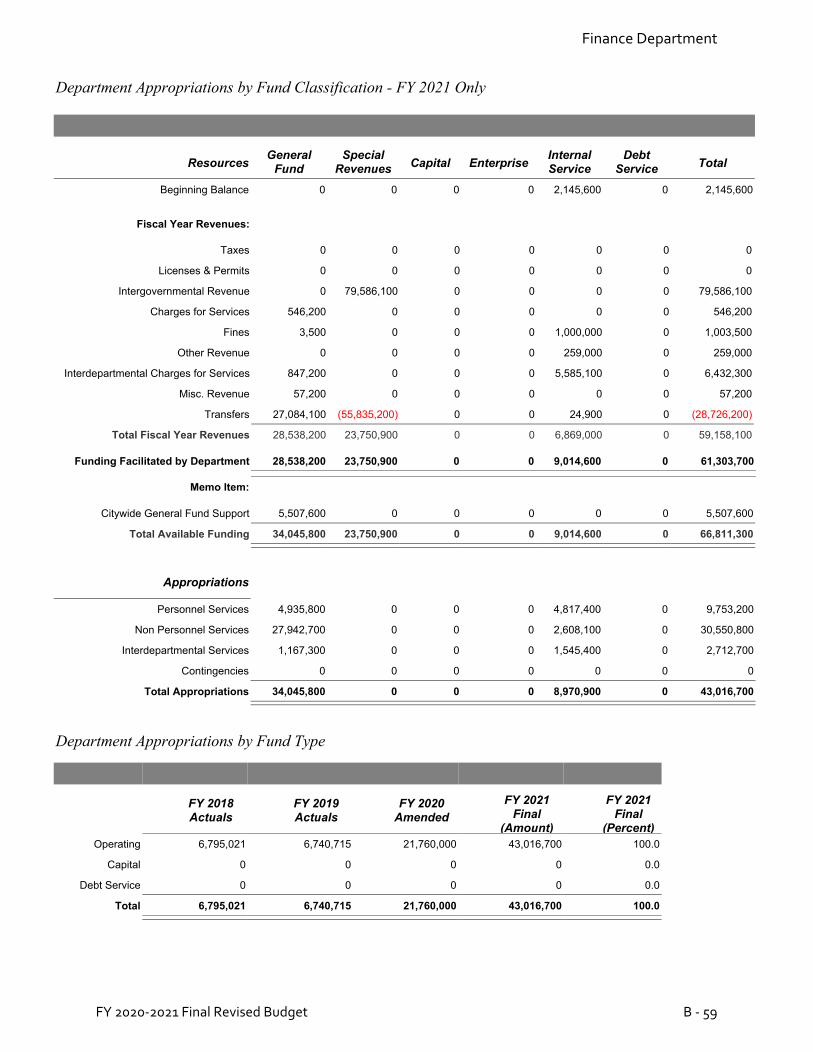
Department Appropriations by Fund Classification - FY 2021 Only
Resources GeneralFund
SpecialRevenues Capital Enterprise Internal
ServiceDebt
Service Total
Beginning Balance 0 0 0 0 2,145,600 0 2,145,600
Fiscal Year Revenues:
Taxes 0 0 0 0 0 0 0
Licenses & Permits 0 0 0 0 0 0 0
Intergovernmental Revenue 0 79,586,100 0 0 0 0 79,586,100
Charges for Services 546,200 0 0 0 0 0 546,200
Fines 3,500 0 0 0 1,000,000 0 1,003,500
Other Revenue 0 0 0 0 259,000 0 259,000
Interdepartmental Charges for Services 847,200 0 0 0 5,585,100 0 6,432,300
Misc. Revenue 57,200 0 0 0 0 0 57,200
Transfers 27,084,100 (55,835,200) 0 0 24,900 0 (28,726,200)
Total Fiscal Year Revenues 28,538,200 23,750,900 0 0 6,869,000 0 59,158,100
Funding Facilitated by Department 28,538,200 23,750,900 0 0 9,014,600 0 61,303,700
Memo Item:
Appropriations
Personnel Services 4,935,800 0 0 0 4,817,400 0 9,753,200
Non Personnel Services 27,942,700 0 0 0 2,608,100 0 30,550,800
Interdepartmental Services 1,167,300 0 0 0 1,545,400 0 2,712,700
Contingencies 0 0 0 0 0 0 0
Total Appropriations 34,045,800 0 0 0 8,970,900 0 43,016,700
Citywide General Fund Support 5,507,600 0 0 0 0 0 5,507,600
Total Available Funding 34,045,800 23,750,900 0 0 9,014,600 0 66,811,300
Department Appropriations by Fund Type
FY 2018Actuals
FY 2019Actuals
FY 2020Amended
FY 2021Final
(Amount)
FY 2021Final
(Percent)Operating 6,795,021 6,740,715 21,760,000 43,016,700 100.0
Capital 0 0 0 0 0.0
Debt Service 0 0 0 0 0.0
Total 6,795,021 6,740,715 21,760,000 43,016,700 100.0
Finance Department
FY 2020-2021 Final Revised Budget B - 59

Notes Department Revenue and Expenditures – All Funds Combined Table
1. This table reflects the consolidation of all fund that support operating and/or capital financialactivities.
2. The Citywide General Fund Support line-item reflects citywide General Fund revenues (i.e.,sales tax, property tax, etc.) captured in the General City Purpose Department and is utilized tocover the difference between General Fund revenues and expenditures facilitated by theFinance Department.
3. Data may not add to the totals due to rounding.4. Data in the columns prior to FY 2020 exclude UB&C results and are reported under the
Department of Public Utilities.
Department Appropriations by Fund Classification – FY 2021 only Table 1. The Citywide General Fund Support line item reflects General Fund revenues (i.e., sales tax,
property tax, etc.) captured in the General City Purpose Department and is utilized to cover thedifference between General Fund revenues and expenditures facilitated by the abovedepartment.
2. Data in the columns prior to FY 2020 exclude UB&C results and are reported under theDepartment of Public Utilities.
Department Appropriations by Fund Type 1. Data may not add to the totals due to rounding.2. Data in the columns prior to FY 2020 exclude UB&C results and are reported under the
Department of Public Utilities.
Finance Department
B - 60 FY 2020-2021 Final Revised Budget

Fire Department Established in 1877, 2021 marks the Fresno Fire Department’s 144th year of service, while serving the community with great pride and distinction. The Department’s mission, core values, and vision are reflective of the desire to create a culture of excellence in fire/emergency medical service delivery. The Department strives to be an innovative and progressive organization in order to meet the changing demands of the City of Fresno’s 525,000 residents spread out over 115.2 square miles.
The Department has continued its ongoing commitment to invest in training and improving firefighter safety by implementing the vast majority of the recommendations resulting from the Serious Accident Response Team (SART) Report following the March 29, 2015 Cortland Incident.
Additionally, the Department is under contract to provide services for the Fig Garden Fire Protection District (FGFPD) though 2035 and is in the second year of a three year automatic aid agreement with the North Central Fire Protection District (NCFPD) to provide services to district residents in the northwest corridor of the City. These two contracts provide an enhanced level of service for both the residents of the districts and the City.
Operations and Support Services Division The Department provides emergency response through its Operations and Support Services Division. Eighty (80) firefighters will be on-duty each day within the City and the FGFPD,
effective July 1, 2020. During fiscal year 2021, a Safety Officer will be added to each daily shift bringing the daily staffing total to eighty-one (81) members.
The Support Services Division provides services that support the effectiveness of all other divisions including facilities maintenance for 20 fire stations, as well as equipment and supplies management.
In calendar year 2019, the Department responded to over 44,978 calls for service from a total of 20 fire stations located throughout the City’s contract areas and Fresno Yosemite International Airport. Each station is staffed with a 3 or 4 person engine or truck company and provides all emergency response services including fire suppression, emergency medical care, urban search and rescue, water rescue, hazardous material response, and hydrant flow maintenance.
Prevention and Support Services Division Risk mitigation and compliance services are administered through the Prevention and Technical Services Division. This Division provides all-risk mitigation services, including inspection services, plan reviews, issuance of permits/licenses to all facilities where the public may be present, and provides fire safety education. In 2019, staff completed over 11,570 inspections (5,327 fire inspections, 3,639 plan reviews, and 1,590 sprinkler inspections).
The Geographical Information Systems Unit provides data analysis and statistical review in line with the Department’s objectives.
Training and Special Operations Division The Training and Special Operations Division provides mandated training and compliance tracking for all employees to ensure conformance to regulatory requirements and maintaining employee safety and wellness.
FY 2020-2021 Final Revised Budget B - 61

Additionally, Special Operations and management of entry-level drill schools for new recruit firefighters are under the purview of the Training Division.
The Business and Fiscal Services Division and the Personnel & Investigations Division The Business and Fiscal Services Division and the Personnel and Investigations Division provide essential core services to support all areas of the Department so that front-line
personnel may provide responsive and expert service to the public.
The Investigations Unit investigates incidents for the purposes of preventing future emergencies through criminal prosecution or administrative recourse. In 2019, the Unit conducted 583 investigations resulting in 40 arrests.
Each unit of the organization is essential to helping the Department realize one of its primary goals of establishing a safe living environment resulting in a high quality of life.
Kerri DonisFire Chief
Operations Division
Prevention
Support Services
Prevention and Support Services Division
• PIO• Emergency
Preparation Officer• CERT
Training, EMS, and Safety Division
Personnel and Investigations Division
Field Operations
Special Operations
Business and Fiscal Services Division
Training Academy
Executive AssistantFG District
B - 62 FY 2020-2021 Final Revised Budget
Fire Department

OperatingFY 2020
AmendedFY 2021
Final Variance
General Fund 68,354,500 73,512,700 5,158,200
Special Revenue 1,975,100 1,741,200 (233,900)
Total Operating 70,329,600 75,253,900 4,924,300
Capital
Capital 6,919,600 124,500 (6,795,100)
Total Capital 6,919,600 124,500 (6,795,100)
Grand Total 78,431,600 76,563,000 (1,868,600)
Operating and Capital Appropriations by Fund Type FY 2021 Appropriation Fund Type Chart
Major Capital Projects by Appropriations
Fire Department Fund Type FTE
Sworn General Fund 298.78
Special Revenue 6.22
Total Sworn 305.00
Civilian General Fund 45.30
Total Civilian 45.30
Department Total FTE 350.30
Debt Service
Debt Service 1,182,400 1,184,600 2,200
Total Debt Service 1,182,400 1,184,600 2,200
Project Fund Type Amount
XC00029 - Fire Station Renovations Phase I Capital 124,500 ## 1
Fire Department Budget Snapshot
FY 2020-2021 Final Revised Budget B - 63
Fire Department

Service Impacts
Approved Council Motions Per Revised Budget Hearings Per approved Council Motion #20, the FY 2021 Final Revised Budget includes $28,700 for the conversion of an Administrative Fire Captain to an Administrative Fire Battalion Chief.
Per approved Council Motion #21, the FY 2021 Final Revised Budget includes $47,700 for .65 FTE Accountant/Auditor and ancillary equipment.
Per approved Council Motion #22, the FY 2021 Final Revised Budget includes $64,000 for .65 FTE GIS Specialist.
Per approved Council Motion #37, the FY 2021 Final Revised Budget includes $220,000 for additional positions to be agreed upon by the City Manager and Fire Chief.
Approved Council Motions Per Continuing Resolution Per approved Council Motion #8, the FY 2021 Final Revised Budget includes three Fire Captains to serve as a Safety Officer, associated shift replacement and equipment totaling $542,600. The Safety Officer has been included in the Five-Year Forecast.
The Fire Department’s Final Revised Budget totals $76,563,000, which is a decrease of $1,868,600 or 2.4 percent from the FY 2020 Amended Budget. General Fund appropriations are increasing by $5,158,200, while the remaining funds are decreasing by $7,026,800.
General Fund increases of $5,158,200 over the FY 2020 Amended Budget are all associated with Operations. Appropriations increase can be attributed to Continuing Resolution Council Motion #8 adding a Safety Officer ($542,600)
and Final Revised Budget Council Motions #20 converting a an Administrative Fire Captain to an Administrative Fire Battalion Chief ($28,700), #21 .65 FTE Accountant/Auditor ($47,700), #22 .65 GIS Specialist ($64,000), and #37 adding staffing to be agreed upon by the City Manager and Fire Chief ($220,000). The remaining balance of $4,255,200 includes: • $1,176,900 for various personnel costs
which include increases due to MOU, stepadvancements, pension contributions,workers’ compensation as well as healthand welfare contributions.
• $1,439,200 for Shift Replacement to alignappropriations with actual usage.
• $301,500 for CARES Act fundedexpenditures:o $141,000 for Wildland Gear,o $25,000 for masks,o $36,000 for additional cleaning at Fire
Headquarters and Station #20,o $28,000 for washers and dryers at
stations,o $54,000 for curtains and partitions,o $17,500 for Bluebeam software.
• $335,200 increase to pay for theDepartment’s FY 2021 lease obligations.
• $666,000 net increase to InterdepartmentalCharges to support the revenues needed bythe various respective funds. Below issummary of significant ID charge variances:o $193,400 Information Systems Service
Charge,o $102,500 Information Systems
Equipment Charge,o $76,100 Charges for Telephone Service,o $228,700 Fleet Service Charge.
Apparatus Replacement FY 2022 is year two of the Department’s updated 8 year apparatus replacement program. As part of the Replacement Program, the Department will place an order to lease purchase one (1) truck, two (2) engines, one (1)
B - 64 FY 2020-2021 Final Revised Budget
Fire Department
urban search & rescue vehicles (USAR), one (1) rescue 219 vehicle, two (2) squad vehicles, and seven (7) light vehicles. Based on the anticipated lease schedule, lease payments for light duty and squad vehicle will be initiated in FY 2021 with half a lease payment due at a cost of $136,700 and a full lease payment will be due in FY 2022 costing $209,200. Half a lease payment for the two fire engines, USAR vehicle, Rescue 219 vehicles and two squad vehicles will be due in FY 2022 at cost of $159,300 and a full lease payment for these vehicles and fire truck will be due in FY 2023 costing $489,800. Lease payments have been accounted for in the General Fund Five-Year Forecast.
Overall, the remaining funds in the Fire Department are decreasing by $7,026,800 and the change is comprised of a reduction to Capital of $6,795,100, due mostly to the completion of Fire Station #18, and decreases to non-GF Operations of $233,900. Both the Operating and Capital components of these funds rely on incoming revenues from collected fees and or grant revenues to support the activities in the funds which include Federal and State Grants, Airport Public Safety, Impact Fees and Urban Growth Management Funds amongst others. It is important to note that expenses in these funds will only materialize if sufficient revenues are anticipated.
FY 2020-2021 Final Revised Budget B - 65
Fire Department

Staffing Consistent with Continuing Resolution Council Motion #8, the FY 2021 Final Revised Budget includes three (3) Fire Captains to serve as Safety Officer within the Fire Department. In addition, the Final Revised Budget includes Council Motions #20, 21 and 22, which provided the following:
• $28,700 for the conversion of anAdministrative Fire Captain to anAdministrative Fire Chief;
• $47,700 for one (1) .65 FTEAccountant/Auditor I;
• $64,000 for one (1) .65 FTE GIS Specialist
Department Staffing Detail
Position Summary FY 2019 FY 2020 FY 2020 FY 2021 FY 2021
Adopted Adopted Amended Changes Final Sworn Positions 334.00 302.00 302.00 3.00 305.00
Civilian Positions 42.50 43.50 43.50 1.80 45.30
Total 376.50 345.50 345.50 4.80 350.30
Note: The FY 2021 position changes are due to the following:
Sworn: 3.00 FY 2021 three authorized new Fire Captain positions @ 1.0 FTE
3.00 Subtotal Sworn Position Change
Civilian: (0.50) FY 2020 one authorized new Fire Prevention Inpsector II position @ 0.5 FTE
1.00 FY 2020 authorized Fire Prevention Inspector II position @1.0 FTE in FY 2021
0.65 FY 2021 one authorized Accountant/Auditor I @.65 FTE
0.65 FY 2021 one authorized GIS Specialist I @.65 FTE
1.80 Subtotal Civilian Position Change
4.80 Total FY 2021 Changes
The FY 2020 position changes are due to the following:
Sworn: (9.00) FY 2020 Firefighter positions deleted due to the termination of the North Central Fire Protection District Contract
(13.00) FY 2020 Firefighter Specialist positions deleted due to the termination of the North Central Fire Protection District Contract
(10.00) FY 2020 Firefighter Captain positions deleted due to the termination of the North Central Fire Protection District Contract
(32.00) Subtotal Sworn Position Change
The FY 2020 position changes are due to the following:
Civilian: (0.50) FY 2019 one authorized new Fire Prevention Inspector II position @ 0.5 FTE 1.00 FY 2019 authorized Fire Prevention Inspector II position @1.0 FTE in FY 2020 0.50 FY 2020 one authorized Fire Inspector II @.5 FTE 1.00 Subtotal Civilian Position Change 1.00 Total FY 2020 Changes
B - 66 FY 2020-2021 Final Revised Budget
Fire Department

Department Revenue and Expenditure - All Funds Combined
Funding Source FY 2018Actuals
FY 2019Actuals
FY 2020Amended
FY 2021Final
PercentChange
Beginning Balance (1,278,845) (1,516,812) (1,565,900) 1,286,500 (182.2)
Fiscal Year Revenues:
Taxes 30 76 0 0 0.0
Licenses & Permits 353,468 332,111 248,000 647,000 160.9
Intergovernmental Revenue 4,216,312 3,541,263 1,620,700 1,020,000 (37.1)
Charges for Services 10,971,958 12,123,469 5,827,900 7,930,200 36.1
Fines 37,461 40,601 41,600 60,000 44.2
Other Revenue (23,828) (26,200) 1,300 0 (100.0)
Interdepartmental Charges for Services 3,850 0 0 0 0.0
Misc. Revenue 258,342 145,898 160,500 255,500 59.2
Transfers 1,949,137 2,585,566 8,102,000 5,876,700 (27.5)
Total Fiscal Year Revenues 17,766,731 18,742,784 16,002,000 15,789,400 (1.3)
Funding Facilitated by Department 16,487,886 17,225,972 14,436,100 17,075,900 18.3
Memo Item:
Appropriations by Amount
Personnel Services 58,609,942 60,488,220 58,900,100 61,630,400 4.6
Non Personnel Services 9,688,406 8,465,430 14,384,800 9,217,200 (35.9)
Interdepartmental Services 1,865,729 2,167,734 5,146,700 5,715,400 11.0
Contingencies 0 0 0 0 0.0
Total Departmental Expenditures 70,164,076 71,121,384 78,431,600 76,563,000 (2.4)
Citywide General Fund Support 52,534,705 53,733,791 62,914,400 60,115,300 (4.4)
Total Available Funding 69,022,591 70,959,763 77,350,500 77,191,200 (0.2)
Appropriations by Percentage
Personnel Services 83.5 85.0 75.1 80.5 4.6
Non Personnel Services 13.8 11.9 18.3 12.0 (35.9)
Interdepartmental Services 2.7 3.0 6.6 7.5 11.0
Contingencies 0.0 0.0 0.0 0.0 0.0
Total Departmental Expenditures 100.0 100.0 100.0 100.0 (2.4)
FY 2020-2021 Final Revised Budget B - 67
Fire Department

Department Appropriations by Fund Classification - FY 2021 Only
Resources GeneralFund
SpecialRevenues Capital Enterprise Internal
ServiceDebt
Service Total
Beginning Balance 0 280,200 1,006,300 0 0 0 1,286,500
Fiscal Year Revenues:
Taxes 0 0 0 0 0 0 0
Licenses & Permits 647,000 0 0 0 0 0 647,000
Intergovernmental Revenue 970,000 50,000 0 0 0 0 1,020,000
Charges for Services 6,415,500 1,514,700 0 0 0 0 7,930,200
Fines 60,000 0 0 0 0 0 60,000
Other Revenue 0 0 0 0 0 0 0
Interdepartmental Charges for Services 0 0 0 0 0 0 0
Misc. Revenue 255,500 0 0 0 0 0 255,500
Transfers 5,049,400 0 (357,300) 0 0 1,184,600 5,876,700
Total Fiscal Year Revenues 13,397,400 1,564,700 (357,300) 0 0 1,184,600 15,789,400
Funding Facilitated by Department 13,397,400 1,844,900 649,000 0 0 1,184,600 17,075,900
Memo Item:
Appropriations
Personnel Services 60,211,400 1,419,000 0 0 0 0 61,630,400
Non Personnel Services 7,625,000 283,100 124,500 0 0 1,184,600 9,217,200
Interdepartmental Services 5,676,300 39,100 0 0 0 0 5,715,400
Contingencies 0 0 0 0 0 0 0
Total Appropriations 73,512,700 1,741,200 124,500 0 0 1,184,600 76,563,000
Citywide General Fund Support 60,115,300 0 0 0 0 0 60,115,300
Total Available Funding 73,512,700 1,844,900 649,000 0 0 1,184,600 77,191,200
Department Appropriations by Fund Type
FY 2018Actuals
FY 2019Actuals
FY 2020Amended
FY 2021Final
(Amount)
FY 2021Final
(Percent)Operating 69,260,987 69,333,699 70,329,600 75,253,900 98.3
Capital 527,693 605,092 6,919,600 124,500 0.2
Debt Service 375,396 1,182,593 1,182,400 1,184,600 1.5
Total 70,164,076 71,121,384 78,431,600 76,563,000 100.0
B - 68 FY 2020-2021 Final Revised Budget
Fire Department

Notes Department Revenue and Expenditures – All Funds Combined Table
1. This table reflects the consolidation of all funds that support operating and/or capital financialactivities.
2. The Citywide General Fund Support line-item reflects citywide General Fund revenues (i.e.,sales tax, property tax, etc.) captured in the General City Purpose Department and is utilized tocover the difference between General Fund revenues and expenditures facilitated by the abovedepartment.
3. Data may not add to the totals due to rounding.
Department Appropriations by Fund Classification – FY 2021 only Table 1. The Citywide General Fund Support line-item reflects citywide General Fund revenues (i.e.,
sales tax, property tax, etc.) captured in the General City Purpose Department and is utilized tocover the difference between General Fund revenues and expenditures facilitated by the abovedepartment.
Department Appropriations by Fund Type 1. Data may not add to the totals due to rounding.
FY 2020-2021 Final Revised Budget B - 69
Fire Department

THIS PAGE WAS INTENTIONALLY LEFT BLANK.
B - 70 FY 2020-2021 Final Revised Budget

General City Purpose Department The General City Purpose Department (GCP) is comprised of the Retirement Office, Fresno Revitalization Corporation Division, Intergovernmental Relations Division as well as the citywide Resources and Appropriations Division.
Retirement Office This Division houses city related personnel and interdepartmental costs of the City of Fresno Retirement Office.
The Retirement Office provides Retirement System members and the City with flexible, cost-effective, participant-oriented benefits through prudent investment management and superior member services.
The Board and staff are committed to carry out their mission through a competent, professional, impartial, and open decision-making process. The Retirement Division strives to: • Create an environment in which Board
Members can maximize their performanceas trustees.
• Improve the level of benefits and deliveryof services provided to members andemployees.
• Improve communication with membersand employer.
• Attract, develop and retain competent andprofessional staff.
• Achieve and maintain top quartileinvestment performance as measured bythe Public Fund universe.
Intergovernmental Relations Division This Division contains expense items which are of a citywide and/or interdepartmental nature. Some of the items budgeted in this Division include: citywide legal fees, citywide membership and dues, funding for Deferred Compensation Administration, elections costs, citywide travel, professional and lobby contracts.
Citywide Resources and Appropriations This Division contains General Fund revenues that are not associated with any operational department, including Property, Sales and Room Taxes, as well as Business License and Franchise Fees.
Also under this Division are debt service payments that are not specific to one department. These include the City Hall refinancing, Convention Center Garage bonds, Bee Building/Granite Park and the bond debt service for the No Neighborhood Left Behind project. Starting in FY 2015, the Division also includes the revenues and expenditures associated with the Pension Obligation Bond.
FY 2020-2021 Final Revised Budget B - 71
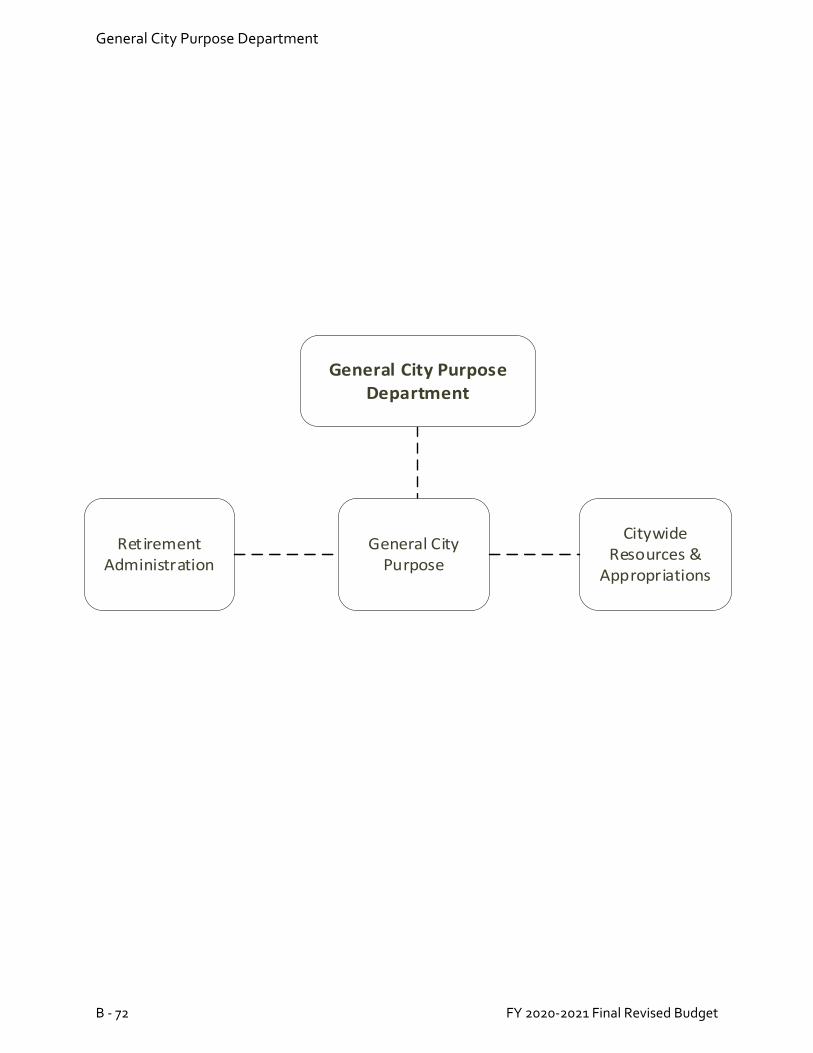
General City PurposeDepartment
Retirement Administration
General CityPurpose
Citywide Resources &
Appropriations
B - 72 FY 2020-2021 Final Revised Budget
General City Purpose Department

OperatingFY 2020
AmendedFY 2021
Final Variance
General Fund 14,620,400 10,431,600 (4,188,800)
Special Revenue 7,502,800 8,815,200 1,312,400
Internal Service Fund 5,247,900 5,181,200 (66,700)
Total Operating 27,371,100 24,428,000 (2,943,100)
Grand Total 57,627,700 53,645,100 (3,982,600)
Operating and Debt Service by Fund Type FY 2021 Appropriation Fund Type Chart
General City PurposeDepartment Fund Type FTE
Internal Service Fund 17.00
Department Total FTE 17.00
Debt Service
General Fund 2,419,400 1,210,000 (1,209,400)
Special Revenue 1,655,300 1,594,800 (60,500)
Debt Service 26,181,900 26,412,300 230,400
Total Debt Service 30,256,600 29,217,100 (1,039,500)
General City Purpose Department Budget Snapshot
FY 2020-2021 Final Revised Budget B - 73
General City Purpose Department

Service Impacts
Approved Council Motions Per Revised Budget Hearings Motion #19 reduced the Refund and Claims line-item by $778,700 to $1,500,000 under the Economic Development Incentives Fund.
Motion #24 added $500,000 under the General Fund towards funding the recommendations from the Commission on Police Reform.
Historic Preservation Mitigation Program This grant program was approved by Council on February 15, 2018, and incentivizes owners of historic structures to maintain and enhance historic features. Eligible properties are those on the national, state, or local registers of historic places, as well as local Heritage Properties. Certain repairs are commonly made to historic structures in a manner which is somewhat less expensive, but have a detrimental impact on the visual character of the structure as seen from the public street. Historic Preservation Mitigation Funds will be used to offset the additional cost of historically appropriate repairs, including: repairing original wood windows or replacing them when necessary with wood replicas; repairing original wood siding instead of replacing it with stucco; and, repairing damaged ornamental features such as rafter tails, window trim, and shutters. In order to improve as many properties as possible, grants are limited to $7,500. Funds will be awarded to eligible projects on a first-come, first-serve basis. Benefits of the Program are anticipated to include enhanced property values, neighborhood beautification and the stimulation of additional private investment. Total appropriations for FY 2021 are $50,000.
Granite Park Contract Funding for the contract with Central Valley Community Sports Foundation has been
reclassified to the PARCS Department and is budgeted at $150,000. This contract received Council approval on September 24, 2015.
Economic Development Corporation Funding for the contract with the Economic Development Corporation is budgeted at $114,700. This will be the fourth annual payment of the five year contract. This contract received Council approval on December 14, 2017.
Homeless Assistance A total of $50,000 has been budgeted in the Department’s appropriations for continued development and implementation of a multiagency comprehensive plan to reduce homelessness in the City of Fresno.
Animal Control Contract FY 2021 appropriations have been increased to fund Animal Control services and operations per Council’s approval on June 25, 2020 of the fourth amendment to the agreement between the City of Fresno and the Central California Society for the Prevention of Cruelty to Animals. The term of the agreement is for July 1, 2020 to June 30, 2021.The FY 2021 Budget includes a total of $5,345,000 per agreement.
Parades A total of $50,000 has been budgeted in the Department’s appropriations to help support historic parade sponsors by offsetting part of the costs related to traffic control for these events.
Summer Internship Funding for this Program has been reclassified to the PARCS Department per Motion #51. A total of $25,000 is budgeted to cover actual charges through October, with $75,000 to fund the Program’s activity under the PARCS Department for the remainder of the Fiscal
B - 74 FY 2020-2021 Final Revised Budget
General City Purpose Department
Year. The Program’s FY 2021 Budget totals $100,000.
Youth Leadership Institute (YLI) Funding at $100,000 has been included for the continued support of the City of Fresno’s Youth Leadership Institute (YLI). With assistance from a local community based non-profit, the City continues to develop a citywide YLI to advise the City of Fresno and the City Council on issues of concern to Fresno’s youth. The YLI will be supported by the Mayor/City Manager’s Office, City Council, the City Clerk, City Attorney and other city departments as needed.
The Blackstone McKinley Mixed Use Project A total of $1,100,000 has been re-appropriated in the Department’s budget in order to provide funding per Council’s approval of agenda item ID17-1603 on December 7, 2017. The City of Fresno is scheduled to provide a $600,000 inter-fund loan at the City’s pool investment rate with a term of five years, as well as a $500,000 contribution at no interest towards the Project’s funding.
The Blackstone McKinley Mixed Use Project is an important step in responding to the changing needs of its growing population and the challenges that come with it as well as the direction set forth in the General Plan through transit supportive infill development.
The Project, situated at two major intersections along high quality Bus Rapid Transit stops, will be a catalyst project within an infill area. The project will help achieve important public policy objectives of both the City and the San Joaquin Valley Air Pollution Control District (SJVAPCD).
Council Action During the June Budget Hearings regarding the review of the FY 2021 Continuing Resolution Budget submission, Council approved Motion #34 that re-appropriated $1,000,000 from the Darling Plant relocation project for the development across the West Fresno’s Neighborhood Initiative.
FY 2020-2021 Final Revised Budget B - 75
General City Purpose Department

Staffing The Retirement Office Authorized position count increased by 0.25 FTEs from the FY 2020 Amended Budget to the FY 2021 Final Revised Budget.
This increase corresponds to the addition of a 0.75 FTE Senior Administrative Clerk position per the FY 2020 Adopted Budget, which is budgeted for a full fiscal year at 1.0 FTE.
Department Staffing Detail Position Summary
FY 2019 FY 2020 FY 2020 FY 2021 FY 2021 Division Adopted Adopted Amended Changes Final
Retirement Administration Division 13.75 14.75 16.75 0.25 17.00
Total 13.75 14.75 16.75 0.25 17.00
Note: It should be noted that the FY 2020 Amended increased by 2.o FTEs. The increase is due to two Position Authorization Resolution (PAR) amendments approved by Council during FY 2020. The 1st amendment to the PAR added an Assistant Retirement Administrator effective July 29, 2019, and the 4th amendment to the PAR added one Retirement Accounting Manager position effective December 9, 2019.
B - 76 FY 2020-2021 Final Revised Budget
General City Purpose Department

Department Revenue and Expenditure - All Funds Combined
Funding Source FY 2018Actuals
FY 2019Actuals
FY 2020Amended
FY 2021Final
PercentChange
Beginning Balance 42,684,080 47,105,812 69,113,300 74,460,500 7.7
Fiscal Year Revenues:
Taxes 248,711,775 271,681,245 273,160,400 273,082,200 (0.0)
Licenses & Permits 20,637,027 21,286,168 21,385,800 19,764,800 (7.6)
Intergovernmental Revenue 5,236,642 8,077,960 7,252,900 4,769,700 (34.2)
Charges for Services 2,316,441 2,324,706 2,615,600 2,607,500 (0.3)
Fines 1,269,215 1,385,701 1,999,700 1,256,700 (37.2)
Other Revenue 1,207,299 1,819,272 1,548,000 941,200 (39.2)
Interdepartmental Charges for Services 14,026,924 16,213,000 15,823,300 12,438,500 (21.4)
Misc. Revenue 2,357,320 6,602,107 909,900 803,600 (11.7)
Transfers 3,107,835 361,222 1,207,800 2,399,800 98.7
Total Fiscal Year Revenues 298,870,477 329,751,380 325,903,400 318,064,000 (2.4)
Funding Facilitated by Department 341,554,558 376,857,192 395,016,700 392,524,500 (0.6)
Memo Item:
Appropriations by Amount
Personnel Services 3,920,030 5,115,508 6,000,100 4,798,000 (20.0)
Non Personnel Services 40,472,906 36,463,910 50,720,200 48,156,200 (5.1)
Interdepartmental Services 1,444,101 910,753 907,400 690,900 (23.9)
Contingencies 0 0 0 0 0.0
Total Departmental Expenditures 45,837,037 42,490,171 57,627,700 53,645,100 (6.9)
Citywide General Fund Support (293,238,628) (325,433,834) (335,875,600) (335,887,700) 0.0
Total Available Funding 48,315,930 51,423,358 59,141,100 56,636,800 (4.2)
Appropriations by Percentage
Personnel Services 8.6 12.0 10.4 8.9 (20.0)
Non Personnel Services 88.3 85.8 88.0 89.8 (5.1)
Interdepartmental Services 3.2 2.1 1.6 1.3 (23.9)
Contingencies 0.0 0.0 0.0 0.0 0.0
Total Departmental Expenditures 100.0 100.0 100.0 100.0 (6.9)
FY 2020-2021 Final Revised Budget B - 77
General City Purpose Department

Department Appropriations by Fund Classification - FY 2021 Only
Resources GeneralFund
SpecialRevenues Capital Enterprise Internal
ServiceDebt
Service Total
Beginning Balance 64,052,000 8,208,500 0 0 2,200,000 0 74,460,500
Fiscal Year Revenues:
Taxes 269,832,200 3,250,000 0 0 0 0 273,082,200
Licenses & Permits 19,764,800 0 0 0 0 0 19,764,800
Intergovernmental Revenue 4,469,700 300,000 0 0 0 0 4,769,700
Charges for Services 622,900 0 0 0 1,984,600 0 2,607,500
Fines 1,256,700 0 0 0 0 0 1,256,700
Other Revenue 931,000 200 0 0 10,000 0 941,200
Interdepartmental Charges for Services 9,500,900 0 0 0 2,800,000 137,600 12,438,500
Misc. Revenue 699,000 0 0 0 104,600 0 803,600
Transfers (23,599,900) 125,000 0 0 (400,000) 26,274,700 2,399,800
Total Fiscal Year Revenues 283,477,300 3,675,200 0 0 4,499,200 26,412,300 318,064,000
Funding Facilitated by Department 347,529,300 11,883,700 0 0 6,699,200 26,412,300 392,524,500
Memo Item:
Appropriations
Personnel Services 11,600 0 0 0 4,786,400 0 4,798,000
Non Personnel Services 11,334,100 10,409,800 0 0 0 26,412,300 48,156,200
Interdepartmental Services 295,900 200 0 0 394,800 0 690,900
Contingencies 0 0 0 0 0 0 0
Total Appropriations 11,641,600 10,410,000 0 0 5,181,200 26,412,300 53,645,100
Citywide General Fund Support (335,887,700) 0 0 0 0 0 (335,887,700)
Total Available Funding 11,641,600 11,883,700 0 0 6,699,200 26,412,300 56,636,800
Department Appropriations by Fund Type
FY 2018Actuals
FY 2019Actuals
FY 2020Amended
FY 2021Final
(Amount)
FY 2021Final
(Percent)Operating 16,653,159 13,525,027 27,371,100 24,428,000 45.5
Capital 0 0 0 0 0.0
Debt Service 29,183,878 28,965,144 30,256,600 29,217,100 54.5
Total 45,837,037 42,490,171 57,627,700 53,645,100 100.0
B - 78 FY 2020-2021 Final Revised Budget
General City Purpose Department

Division Final Revised Budget Revenue and Expenditure - All Funds Combined
Funding Source General City
Purpose
FresnoRevitalization
Corporation Retirement
CitywideResources &
Appropriations Total
Beginning Balance 7,030,700 0 381,700 67,048,100 74,460,500
Fiscal Year Revenues:
Taxes 0 0 0 273,082,200 273,082,200
Licenses & Permits 0 0 0 19,764,800 19,764,800
Intergovernmental Revenue 0 0 0 4,769,700 4,769,700
Charges for Services 0 0 1,984,600 622,900 2,607,500
Fines 0 0 0 1,256,700 1,256,700
Other Revenue 0 0 10,000 931,200 941,200
Interdepartmental Charges for Services 0 0 0 12,438,500 12,438,500
Misc. Revenue 0 0 104,600 699,000 803,600
Transfers 750,000 0 0 1,649,800 2,399,800
Total Fiscal Year Revenues 750,000 0 2,099,200 315,214,800 318,064,000
Funding Facilitated by Department 7,780,700 0 2,480,900 382,262,900 392,524,500
Memo Item:
Appropriations
Personnel Services 0 100 1,986,400 2,811,500 4,798,000
Non Personnel Services 17,444,600 0 0 30,711,600 48,156,200
Interdepartmental Services 0 1,200 394,800 294,900 690,900
Contingencies 0 0 0 0 0
Total Departmental Expenditures 17,444,600 1,300 2,381,200 33,818,000 53,645,100
Citywide General Fund Support 9,680,300 1,300 0 (345,569,300) (335,887,700)
Total Available Funding 17,461,000 1,300 2,480,900 36,693,600 56,636,800
FY 2020-2021 Final Revised Budget B - 79
General City Purpose Department

Notes Department Revenue and Expenditures – All Funds Combined Table
1. This table reflects the consolidation of all fund that support operating and/or capital financialactivities.
2. The Citywide General Fund Support line-item reflects citywide General Fund revenues (i.e.,sales tax, property tax, etc.) captured in the General City Purpose Department and is utilized tocover the difference between General Fund revenues and expenditures facilitated by the abovedepartment.
3. Data may not add to the totals due to rounding.
Department Appropriations by Fund Classification – FY 2021 only Table 1. The Citywide General Fund Support line-item reflects citywide General Fund revenues (i.e.,
sales tax, property tax, etc.) captured in the General City Purpose Department and is utilized tocover the difference between General Fund revenues and expenditures facilitated by the abovedepartment.
Department Appropriations by Fund Type 1. Data may not add to the totals due to rounding.
B - 80 FY 2020-2021 Final Revised Budget
General City Purpose Department

Information Services Department ISD’s mission is to provide both strategic vision, connectivity and enterprise solutions to fulfill the City’s information technology objectives in an efficient and effective manner. The department is responsible for enterprise technology solutions that provide information technology (IT) related services to the City of Fresno. These services assist the City and its departments to meet and manage the City’s strategic goals. ISD continues to collaborate and coordinate with outside agencies and City departments to develop operational economic efficiencies and to promote a unified regional technology vision. All regional and interoperability IT efforts are directly managed by ISD. Additionally, ISD is in charge of the IT strategy and the computer systems required to support the City’s enterprise objectives and goals.
The Administration Division performs budget preparation, contract administration, provides accounting, financial analysis, personnel, and policy administration support to all divisions within ISD. Additionally, the Division manages the 311 Call Center providing services for the public to connect with City leadership and departments, answer routine operational
questions and report issues that need City attention.
The Computer Services Division focuses on providing networking and infrastructure technology including servers, switching, security, cyber protection, internet connectivity, service desk, fiber optics, disaster recovery and other data communication technologies. Collaboration between the departments, including public safety, traffic operations and wireless connectivity, contributes to the improvement of overall safety and the quality of the community.
The Systems and Applications Division administers the implementation, development and maintenance of citywide applications including PeopleSoft, FresGO, Laserfiche, mobile applications, document imaging and other applications. The Division also performs database administration and continues to assist with technology procurements and evaluation of the viability of new systems and applications. The Division is also working with other departments to develop and maintain web and mobile applications to enhance City services to the community.
The Communications Division is responsible for the telecommunications for the City, including VOIP, enterprise phone switching, T-1’s, cell phones, and PDAs. The Regional Communications function focuses its efforts on the maintenance and expansion of the City’s video system including public safety, FAX, the Bus Rapid Transit camera network, two-way radio systems, the Fire Department’s regional fire radio system, which also serves the Fig Garden Fire Protection District, and other regional connectivity.
FY 2020-2021 Final Revised Budget B - 81

The Geographic Information Systems (GIS) Division acts as the main support resource for daily maintenance of many of the City’s GIS layers, and as the support unit for other GIS development within the City. GIS staff also act
as the primary liaison with the other regional GIS producers and users. GIS staff provide reports, maps and geospatial information to City Councilmembers, the City Manager’s Office and other city departments by request.
Assistant Director
Systems & Applications Division
Network Security & Support
Public Safety Support
Service Desk, Help Desk
Computer Services Division
Mobility
Communications
AdministrationDivision
Special Projects
Application Programming
Personnel
Finance
Contract Administration
Budget
Regional Communications
Division
Database Administration
Public SafetyCommunications
Bryon HornChief Information Officer Sr. Mgmt Analyst
Geographic Information
Systems Division
Mapping
GeospatialInformation
Special Projects
Cyber Security
Webmaster
311 Call Center
Mobile Applications
Fiber
B - 82 FY 2020-2021 Final Revised Budget
Information Services Department

OperatingFY 2020
AmendedFY 2021
Final Variance
General Fund 377,000 419,000 42,000
Internal Service Fund 23,140,300 29,475,200 6,334,900
Total Operating 23,517,300 29,894,200 6,376,900
Grand Total 23,517,300 29,894,200 6,376,900
Operating and Debt Service by Fund Type FY 2021 Appropriation Fund Type Chart
Information Services Dept Fund Type FTE
General Fund 5.00
Internal Service Fund 61.00
Department Total FTE 66.00
Debt Service
0 0 0
Total Debt Service 0 0 0
Information Services Dept Budget Snapshot
FY 2020-2021 Final Revised Budget B - 83
Information Services Department

Service Impacts
Appropriations for FY 2021 are budgeted at $29,894,200, an increase of $6,376,900 above the FY 2020 Amended Budget. Personnel Services appropriations are increasing by $914,300, Non Personnel appropriations are increasing by $5,441,300 and Interdepartmental Services appropriations are increasing by $21,300.
Non Personnel Appropriations Non Personnel Services is budgeted at
$20,766,500, an increase of 35.5 percent or $5,441,300 when compared to the FY 2020 Amended Budget. The Department’s Final Revised Budget includes various requests, which are offset by reductions for one-time appropriations approved in FY 2020. Some of the significant Department Final Revised Budget requests include: • $605,500 increase for maintenance and
support fees of previously acquiredsoftware as well as contractually obligatedfee increases.
• $4,555,000 increase to contribute towardslease financing the replacement of thePeopleSoft Financials and Human ResourcesManagement Systems. This project is at theend of the procurement process, and anaward is expected to be completed in earlyFY 2021. Over the last five years, ISD hasbeen accumulating reserve funds from thecontributions of all city departments inanticipation of this purchase.
• $560,900 to acquire customer technologyrequests including: hardware, software, andtelecommunications.
Interdepartmental Services Appropriations The Department’s Interdepartmental Services (ID) budget totals $1,403,500, which is a $21,300 increase from the FY 2020 Amended Budget. This increase is comprised of Purchasing – Variable charges, Facilities Management charges, and Security Assessment Charges, offset by decreases in the Cost Allocation Plan and City Hall Rent charges.
B - 84 FY 2020-2021 Final Revised Budget
Information Services Department

Staff ing Personnel Services Appropriations The Information Service Department’s Final Revised Personnel Budget totals $7,724,200, which is a 13.4 percent or $914,300 increase
from the FY 2020 Amended Budget. This increase includes Memoranda of Understanding salary provisions, step advancement, employee benefit costs, and a full year of funding for positions approved in FY 2020.
Department Staffing Detail
Position Summary FY 2019 FY 2020 FY 2020 FY 2021 FY 2021
Division Adopted Adopted Amended Changes Final
Administration Division 8.50 9.00 10.00 0.00 10.00
Systems Applications Division 12.75 14.00 14.00 0.00 14.00
Computer Services Division 28.00 27.75 27.75 0.25 28.00
Communications Division 5.75 6.75 6.75 0.25 7.00
GIS Division 6.00 6.75 6.75 0.25 7.00
Total 61.00 64.25 65.25 0.75 66.00
Note: It should be noted that the FY 2020 Amended increased by 1.0 FTE. This increase is due to the 7th Amendment to the Position Authorization Resolution (PAR) amendment approved by Council during FY 2020, which added a Senior Network System Specialist effective February 1, 2020.
The total FTE increase of .75 is to account for 3 positions approved in FY 2020 at .75 each that are fully funded at 1.00 in FY 2021.
FY 2020-2021 Final Revised Budget B - 85
Information Services Department
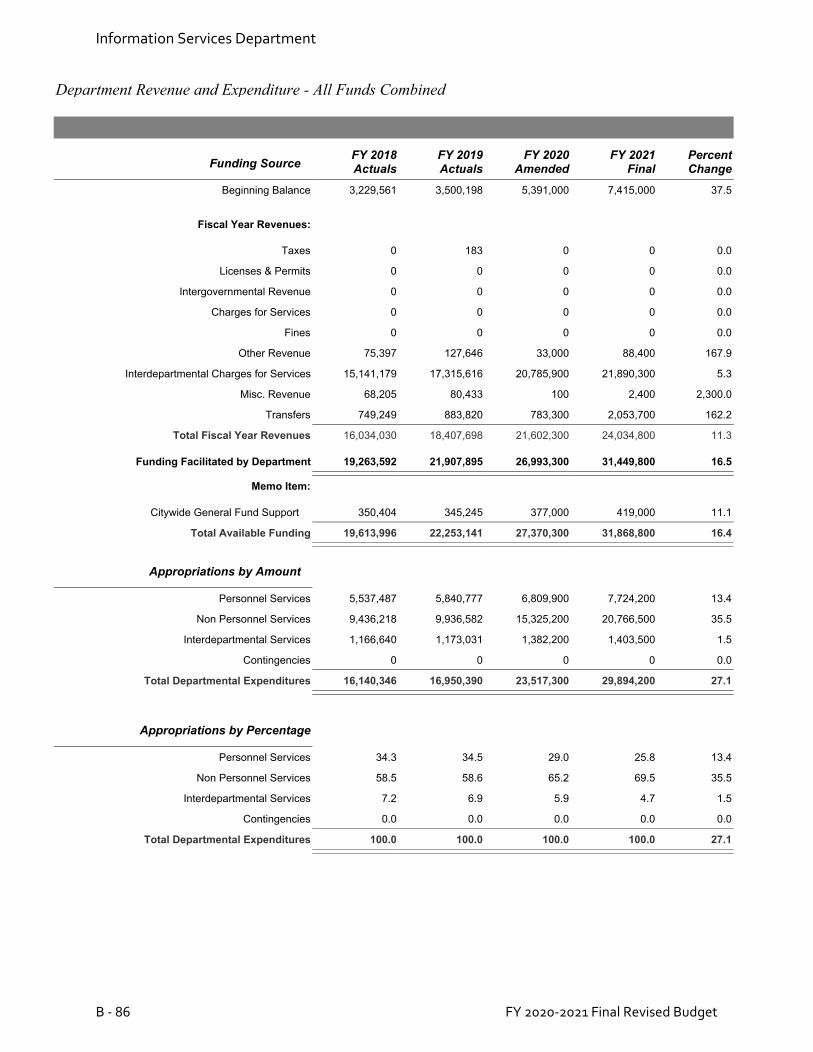
Department Revenue and Expenditure - All Funds Combined
Funding Source FY 2018Actuals
FY 2019Actuals
FY 2020Amended
FY 2021Final
PercentChange
Beginning Balance 3,229,561 3,500,198 5,391,000 7,415,000 37.5
Fiscal Year Revenues:
Taxes 0 183 0 0 0.0
Licenses & Permits 0 0 0 0 0.0
Intergovernmental Revenue 0 0 0 0 0.0
Charges for Services 0 0 0 0 0.0
Fines 0 0 0 0 0.0
Other Revenue 75,397 127,646 33,000 88,400 167.9
Interdepartmental Charges for Services 15,141,179 17,315,616 20,785,900 21,890,300 5.3
Misc. Revenue 68,205 80,433 100 2,400 2,300.0
Transfers 749,249 883,820 783,300 2,053,700 162.2
Total Fiscal Year Revenues 16,034,030 18,407,698 21,602,300 24,034,800 11.3
Funding Facilitated by Department 19,263,592 21,907,895 26,993,300 31,449,800 16.5
Memo Item:
Appropriations by Amount
Personnel Services 5,537,487 5,840,777 6,809,900 7,724,200 13.4
Non Personnel Services 9,436,218 9,936,582 15,325,200 20,766,500 35.5
Interdepartmental Services 1,166,640 1,173,031 1,382,200 1,403,500 1.5
Contingencies 0 0 0 0 0.0
Total Departmental Expenditures 16,140,346 16,950,390 23,517,300 29,894,200 27.1
Citywide General Fund Support 350,404 345,245 377,000 419,000 11.1
Total Available Funding 19,613,996 22,253,141 27,370,300 31,868,800 16.4
Appropriations by Percentage
Personnel Services 34.3 34.5 29.0 25.8 13.4
Non Personnel Services 58.5 58.6 65.2 69.5 35.5
Interdepartmental Services 7.2 6.9 5.9 4.7 1.5
Contingencies 0.0 0.0 0.0 0.0 0.0
Total Departmental Expenditures 100.0 100.0 100.0 100.0 27.1
B - 86 FY 2020-2021 Final Revised Budget
Information Services Department

Department Appropriations by Fund Classification - FY 2021 Only
Resources GeneralFund
SpecialRevenues Capital Enterprise Internal
ServiceDebt
Service Total
Beginning Balance 0 0 0 0 7,415,000 0 7,415,000
Fiscal Year Revenues:
Taxes 0 0 0 0 0 0 0
Licenses & Permits 0 0 0 0 0 0 0
Intergovernmental Revenue 0 0 0 0 0 0 0
Charges for Services 0 0 0 0 0 0 0
Fines 0 0 0 0 0 0 0
Other Revenue 0 0 0 0 88,400 0 88,400
Interdepartmental Charges for Services 0 0 0 0 21,890,300 0 21,890,300
Misc. Revenue 0 0 0 0 2,400 0 2,400
Transfers 0 0 0 0 2,053,700 0 2,053,700
Total Fiscal Year Revenues 0 0 0 0 24,034,800 0 24,034,800
Funding Facilitated by Department 0 0 0 0 31,449,800 0 31,449,800
Memo Item:
Appropriations
Personnel Services 354,700 0 0 0 7,369,500 0 7,724,200
Non Personnel Services 1,000 0 0 0 20,765,500 0 20,766,500
Interdepartmental Services 63,300 0 0 0 1,340,200 0 1,403,500
Contingencies 0 0 0 0 0 0 0
Total Appropriations 419,000 0 0 0 29,475,200 0 29,894,200
Citywide General Fund Support 419,000 0 0 0 0 0 419,000
Total Available Funding 419,000 0 0 0 31,449,800 0 31,868,800
Department Appropriations by Fund Type
FY 2018Actuals
FY 2019Actuals
FY 2020Amended
FY 2021Final
(Amount)
FY 2021Final
(Percent)Operating 16,140,346 16,950,390 23,517,300 29,894,200 100.0
Capital 0 0 0 0 0.0
Debt Service 0 0 0 0 0.0
Total 16,140,346 16,950,390 23,517,300 29,894,200 100.0
FY 2020-2021 Final Revised Budget B - 87
Information Services Department

Notes Department Revenue and Expenditures – All Funds Combined Table
1. This table reflects the consolidation of all funds that support operating and/or capital financialactivities.
2. The Citywide General Fund Support line-item reflects citywide General Fund revenues (i.e.,sales tax, property tax, etc.) captured in the General City Purpose Department and is utilized tocover the difference between General Fund revenues and expenditures facilitated by the abovedepartment.
3. Data may not add to the totals due to rounding.
Department Appropriations by Fund Classification – FY 2021 only Table 1. The Citywide General Fund Support line-item reflects citywide General Fund revenues (i.e.,
sales tax, property tax, etc.) captured in the General City Purpose Department and is utilized tocover the difference between General Fund revenues and expenditures facilitated by the abovedepartment.
Department Appropriations by Fund Type 1. Data may not add to the totals due to rounding.
B - 88 FY 2020-2021 Final Revised Budget
Information Services Department
Parks, After School, Recreation and Community Services Department The Parks, After School, Recreation, and Community Services (PARCS) Department provides a variety of comprehensive and diverse programs, activities, and services for youth through senior citizens. The Department’s focus and commitment is to provide quality recreation programs, clean and inviting parks, safe and fun playgrounds, as well as diverse community service opportunities to Fresno residents, surrounding communities, and visitors.
The PARCS Department, as of July 1, 2020, is comprised of four divisions: Administration, After School Recreation and Community Services and Parks Maintenance and through approved Council Motion #50.a, the reallocation of the Graffiti Division from the Police Department to PARCS. Each division is staffed with individuals committed to positively impact the Fresno community through their dedication to service and desire to make a difference in the lives of the residents and the neighborhoods in which they live, work and play. Each PARCS’ member brings a personalized set of skills, talents, and
enthusiasm that enhances and strengthens the team and the ability to meet the diverse needs of the community.
In January 2018, the City Council adopted the Parks Master Plan Update. The adoption marked the culmination of nearly 18 months of community outreach, stakeholder engagement, staff analysis, and a comprehensive evaluation of parks and amenities. The Plan serves as the visionary guide for improving Fresno’s parks, open space, and recreational services. The Plan provides recommendations, strategies, and highlights the community’s priorities for improvements. In Fiscal Year 2019, PARCS transitioned into the preliminary implementation phase of the Parks Master Plan’s recommendations, which include the main strategic goals of funding, standardizing maintenance practices, prioritizing park improvements and expansion, developing partnerships and collaboration for meeting programming needs, and formalizing advocacy for parks.
The Parks Maintenance Division oversees the maintenance of parks facilities, custodial services and irrigation of over 80 parks, representing about 1,200 acres of open space. The Division also assists in facilitating park improvement projects, playground equipment replacement and installation. They are responsible for the maintenance and upkeep of specialized amenities such as splash pads, sports courts, and ball fields.
In addition, through a combination of Federal, State and Local Grants, CDBG, General Fund, and support from local community groups, the following list of projects represents some, but not all of the various projects that have been funded - ADA improvements at Pinedale Community Center, California/Tupman Playground, Multi-generation community
FY 2020-2021 Final Revised Budget B - 89
center located at Large Park, irrigation improvements at Pilibos Park and ADA improvements at Romain Neighborhood Center.
The PARCS Department fosters partnerships and collaborates with multiple agencies and community groups to provide the community with diverse recreational opportunities. Despite the challenges with the Pandemic, PARCS continues its partnership with Fresno Unified School District with anticipation to utilize their High School pools to offer swim lessons and recreation swim opportunities and with the SPARK (Sports, Play, Active, Recreation for Kids) Program. The program is being provided virtually in collaboration with FUSD and provides a supervised venue for nearly 3,000 kids at 29 school sites where they learn and develop a healthy, productive lifestyle through recreation.
The After School Recreation and Community Service Division will be providing a virtual and in-person programming platform this fall. The programs will be flexible and sustainable and will be compliant with all Public Health guidelines. The programs are designed to flex with the current Blueprint for the State of California. PARCS programs offer fun, positive, healthy, sports, recreational, leisure programs, activities, and science programming all at low or no cost to the participants. One of the primary goals of these Divisions is to provide services that keep children and teens engaged in safe activities that provide enrichment opportunities.
The Empowerment Management Team (EMT) Program, first introduced in 2016 with 20 students, has grown to nearly 80. The Program serves as a leadership Program for at-risk teens and provides them with job training opportunities. As a group, participants have
provided nearly 8,000 hours of volunteer service to various programs offered during the summer. This program will be combined with the Summer Job Internship program which was transferred to PARCS in July of 2020. The program is currently being reengineered to provide a meaningful experience during the Pandemic.
Traditionally, youth and families benefit through the various After School Recreation Programs at 18 neighborhood centers. Programming is offered between 3pm and 8pm and activities include karate, Neighborhood Park sports leagues, tournaments, cooking classes, drama, and much more. Educational components are also regularly integrated year-round, with services such as homework centers, computer lab, teen leadership development, mentoring, and community services projects. Therapeutic recreational activities are offered at Inspiration Park. All of the Neighborhood programs offer a safe haven for families to congregate in a fun and social environment leading to a higher quality of life. PARCS is looking forward to the ability to offer these programs in the very near future when it is safe to do so. As PARCS navigates the current situation, some programs in the centers may be offered before others.
The youth sports program or “bitty sports” is a fee-based program offered to youth between the ages of 3 and 12. Over 1,000 youth participate in a variety of sports programs including soccer, rugby, indoor soccer, volleyball, t-ball, and basketball. These programs focus on building teamwork, skills development, and sportsmanship. Current guidelines present a challenge for this activity. A new style of program will be presented that will fall within the State’s guidance.
The fee-based adult sports program is offered year round to provide men and women a healthy outlet to enjoy organized, structured sport
B - 90 FY 2020-2021 Final Revised Budget
Parks, After School, Recreation and Community Services Department

activities. Currently, PARCS offers adult league play for baseball, softball, flag football, basketball, and soccer. These leagues are hosted in the evening hours to accommodate busy work schedules. This program is currently on hold as there has not been State Guidance provided. As guidance becomes available, the program will evolve to meet safety standards.
The Department provides programs and services to residents of all ages. The Senior Hot Meal Program, typically offered in partnership with Fresno-Madera Area Agency on Aging (FMAAA), provides nearly 40,000 meals on an annual basis for Fresno’s mature adult population. Due to the concern for the vulnerable population in congregate settings, FMAAA is not providing meals in this environment at this time. The Senior program in addition to providing a meal, also offers a variety of activities, field trips, and health and wellness opportunities year-round. At this time, PARCS is developing a virtual program to offer seniors in addition to modified non-congregate activity as can be approved through the Public Health Department.
PARCS also provides leadership and support to numerous community special events. Special Events staff oversees the logistics of all events taking place at seven different PARCS’ Department venues, including Woodward
Park, Roeding Park, Regional Sports Complex, Eaton Plaza, Chukchansi Stadium, Rotary Amphitheater, and Veterans Memorial Auditorium. Events include: concerts, walks/runs, weddings, festivals, and sporting events. Many of these events benefit non-profit charities within the community.
In addition to handling events at PARCS’ venues, Special Events staff also oversees the logistics of citywide events. Some of these include the Christmas Parade, California Classic Weekend and the Veteran’s and Martin Luther King Jr. Parades.
Each year, Special Events plans to coordinate an eight- week long Movies in the Park Program at Eaton Plaza as well as other various neighborhood parks. This is a family-friendly free event that draws thousands of community members throughout the summer season. Currently, gatherings and special events of the above described nature, are not permitted in the State of California.
As a reminder, all of the programs above are part of the PARCS Department’s core services, however, due to precautionary measures implemented in response to the COVID-19 pandemic, not all programs may be available and/or operational as typically scheduled.
FY 2020-2021 Final Revised Budget B - 91
Parks, After School, Recreation and Community Services Department

TJ MillerPARCS Director
Project Administration
Adult Sports / Field Use Agreements
Grants Management
ProgrammingSPARK / Youth Sports
Senior Programs
Community / Neighborhood Centers
Aquatics / Weekend Recreation Fitness ProgramPlanned Maintenance
Irrigation
Custodial Maintenance
Community Services Division
Capital Improvement Projects
Community Science
Action Sports / Bike Pedestrian Safety Program
Parks Maintenance
Division
Administrative Services Division
Assistant Director
Executive Assistant
Facility Management
Contract Management
Recreation Division
Facility Management
Finance
Budget
Contract Compliance
Personnel
Purchasing
Special EventsGraffiti
B - 92 FY 2020-2021 Final Revised Budget
Parks, After School, Recreation and Community Services Department
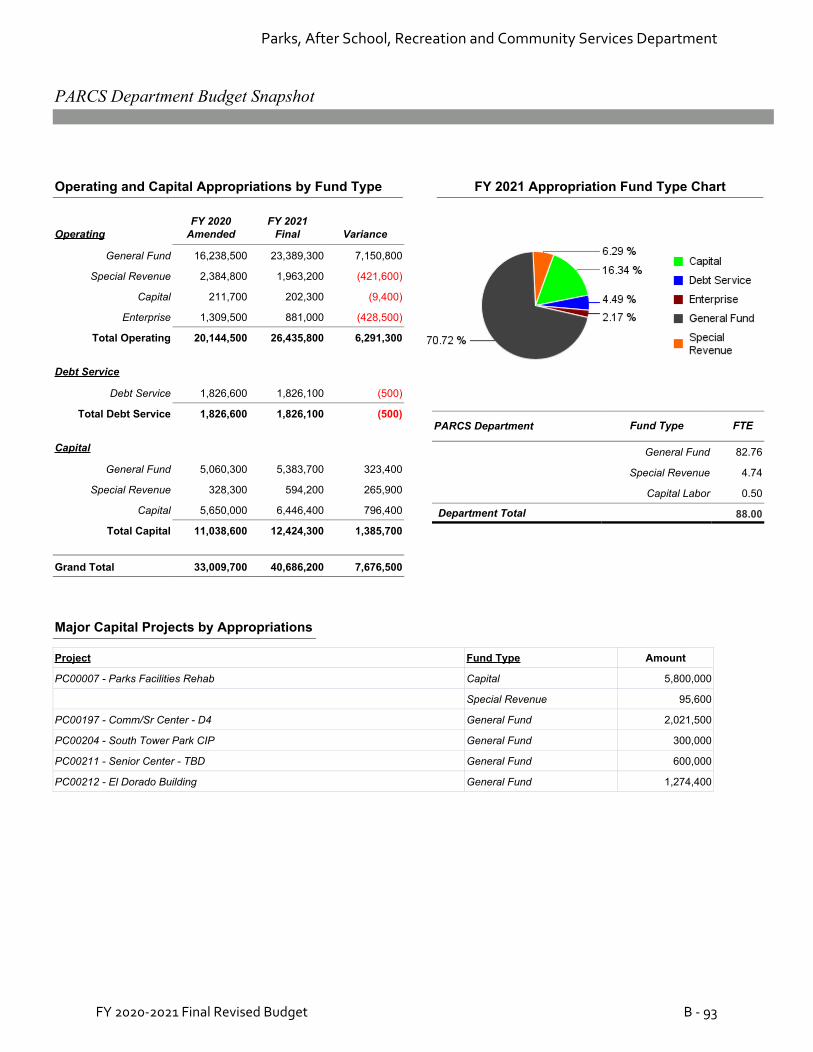
OperatingFY 2020
AmendedFY 2021
Final Variance
General Fund 16,238,500 23,389,300 7,150,800
Special Revenue 2,384,800 1,963,200 (421,600)
Capital 211,700 202,300 (9,400)
Enterprise 1,309,500 881,000 (428,500)
Total Operating 20,144,500 26,435,800 6,291,300
Capital
General Fund 5,060,300 5,383,700 323,400
Special Revenue 328,300 594,200 265,900
Capital 5,650,000 6,446,400 796,400
Total Capital 11,038,600 12,424,300 1,385,700
Grand Total 33,009,700 40,686,200 7,676,500
Operating and Capital Appropriations by Fund Type FY 2021 Appropriation Fund Type Chart
Major Capital Projects by Appropriations
PARCS Department Fund Type FTE
General Fund 82.76
Special Revenue 4.74
Capital Labor 0.50
88.00
Debt Service
Debt Service 1,826,600 1,826,100 (500)
Total Debt Service 1,826,600 1,826,100 (500)
Project Fund Type Amount
PC00007 - Parks Facilities Rehab Capital 5,800,000 ## 1
Special Revenue 95,600 ## 1
PC00197 - Comm/Sr Center - D4 General Fund 2,021,500 ## 2
PC00204 - South Tower Park CIP General Fund 300,000 ## 5
PC00211 - Senior Center - TBD General Fund 600,000 ## 4
PC00212 - El Dorado Building General Fund 1,274,400 ## 3
PARCS Department Budget Snapshot
Department Total
FY 2020-2021 Final Revised Budget B - 93
Parks, After School, Recreation and Community Services Department
Service Impacts
Approved Council Motions Per Revised Budget Hearings • Motion #4 directed staff to identify up to
$500,000 for the Maxie L. Parks Community Center to begin the contamination mitigation process. Motion #37 then stipulated that the funding should come from the Brownfield or other cleanup funding, and if these funds are not be available, then funding approved via Motion #13 is to be utilized.
• Motion #12 allocated $150,000 for furnishings and staff in the new neighborhood senior center in District 1. This motion is to be funded by the $5 million approved in Motion #13.
• Motion #13 added $5 million to the PARCS’ Department’s appropriations.
• Motion #16 allocated up to $100,000 toward rehabilitations efforts at 4403 E. Tulare Ave., Fresno Barrios Unidos. This motion is to be funded by the $5 million approved in Motion #13.
• Motion #31 allocated up to $250,000 towards improvements at Logan Park, including complete irrigation system upgrade and tot lot safety repairs. This motion is to be funded by the $5 million approved in Motion #13.
The Parks, After School, Recreation and Community Services Department (PARCS) FY 2021 Final Revised Budget is $40,686,200, an increase of $7,676,500 or 23.3 percent above the FY 2020 Amended Budget. General Fund appropriations are increasing by $7,474,200 while the remaining funds are increasing by $202,300.
General Fund increases of $7,474,200 over the FY 2020 Amended Budget include an increase of $7,150,800 to Operations of which $1,186,500 is attributable to Council Motion #50.a - reallocating the Graffiti Division from the Police Department to the PARCS Department. The remaining $5,964,300 include: • $5 million approved due to Council Motion
#13 in the Revised Budget Hearings. • $75,000 due to Council Motion #51
reallocating the unspent balance of the Youth Jobs Internship program funds.
• $150,000 for the reallocation of the Granite Park Contract to align with PARCS’ functions, which was previously budgeted under General City Purpose.
• $3,700 for Council Motion #21 to assist with the city fees for the reconstruction of the Calwa Park community pool.
• $287,400 to various personnel costs, which include increases due to MOU concessions, step advancements, pension contributions, and health and welfare contributions offset by slight reduction in Workers’ Compensation Charges.
• $330,400 for anticipated mandatory minimum wage increases for temporary staffing effective January 2, 2021.
• $104,900 net increase to Interdepartmental Charges to support the revenues needed by the various respective funds.
• $7,100 for the first year lease payment on a replacement vehicle in the Graffiti Division, which has outlived its useful life.
B - 94 FY 2020-2021 Final Revised Budget
Parks, After School, Recreation and Community Services Department

In addition to the increases in Operations, General Fund Capital increased by $323,400 above the FY 2020 Amended Budget. Significant factors contributing to this increase include: • $50,000 for Council Motion #24 for
the relocation of the Roeding DogPark.
• $70,000 due to Council Motion #25 forthe reseeding of JSK Soccer Field.
• $200,000 due to Motion #28 for theTollhouse Tot Lot and ADAimprovements.
• $100,000 due to Motion #29 to facilitate aplayground misting system at El DoradoPark.
• $200,000 due to Motion #30 to addadditional lighting on the northwestcorner of Vinland Park.
• $10,000 due to Motion #38 for upgradesto security at River Bottom Park.
• $100,000 due to Council Motion #39 fora shade structure at Logan Park.
• $600,000 for the Senior CenterProgramming. The total of these funds arecomprised of $100,000 approved throughCouncil Motion #11 during the FY 2019Budget Hearings as well as an additional$500,000 approved in FY 2020 via the 14th
Amendment to the Annual AppropriationsResolution 2019-133. Subsequent to theapproval of the 14th Amendment, the fundswere reallocated to fund the Save ourSmall Business Grant Program via the 41st
Amendment to the Annual AppropriationsResolution 2019-133 in response to theCOVID-19 pandemic. These one-timefunds are being restored to the PARCSDepartment in FY 2021.
• $1,006,600 reduction to Capital projectsspent and/or completed in FY 2020.
Overall, the remaining funds in the PARCS’ Department are increasing by $202,300 and the change is comprised of a reduction to Operating of $859,500 offset by an increase to Capital of $1,062,300. Both the Operating and Capital components of these funds rely on incoming revenues from collected fees and or grant revenues to support the activities in the funds, which include Japanese Gardens, Camp Fresno, State and Local Grants, and Urban Growth Management Funds amongst others. Due to the ongoing COVID-19 pandemic, some sites and or services have remained closed and the appropriations have been reduced by anticipated reductions in revenues. It is important to note that expenses in these funds will only materialize if sufficient revenues are anticipated.
In addition to the budget reflected in the PARCS Department, other appropriations approved in the Community Development Block Grant (CDBG) Annual Action Plan for PARCS projects are included in the Planning and Development Department section of this book.
PARCS’s FY 2021 comprehensive Capital Program is discussed in greater detail in the Capital Section of this Book. The top five highest funded projects in the FY 2021 revised budget are highlighted in the Department Snapshot.
FY 2020-2021 Final Revised Budget B - 95
Parks, After School, Recreation and Community Services Department

Staff ing
The FY 2021 Final Revised Budget does not include any new positions, although the PARCS Department’s staffing is increasing by 12 Full Time Equivalents (FTE) when compared
to the FY 2020 Amended Budget. This increase is a result of Council Motion #50.a - which reallocated 12 positions in the Graffiti Division from the Police Department to the PARCS Department.
Department Staffing Detail
Position Summary FY 2019 FY 2020 FY 2020 FY 2021 FY 2021
Division Adopted Adopted Amended Changes Final
Administration Division (1) 13.75 11.00 11.00 2.00 13.00
Recreation & Community Services Division (2) 26.00 29.00 29.00 (3.00) 26.00
Parks Division(1) 36.00 36.00 36.00 1.00 37.00
Graffiti Division (3) 0.00 0.00 0.00 12.00 12.00
Total 75.75 76.00 76.00 12.00 88.00
Note: (1) 3.0 FTE are being reallocated from the Recreation and Community Services Division(s) to the Administration Division (2.0 FTE) and Parks Division (1.0) FTE. (2) The FY 2021 Final FTE reflects the reorganization of the Recreation Division and Community Services Division into the Recreation and Community Services Division.
(3) Graffiti was previously housed in the Police Department, the Council Motion 50.a - moved 12.0 FTE in the Graffiti Division from the Police Department to the PARCS Department.
B - 96 FY 2020-2021 Final Revised Budget
Parks, After School, Recreation and Community Services Department

Department Revenue and Expenditure - All Funds Combined
Funding Source FY 2018Actuals
FY 2019Actuals
FY 2020Amended
FY 2021Final
PercentChange
Beginning Balance 165,078 530,083 441,900 572,800 29.6
Fiscal Year Revenues:
Taxes 111 1,143 0 0 0.0
Licenses & Permits 0 0 0 0 0.0
Intergovernmental Revenue 3,532,245 1,576,775 1,946,600 1,692,200 (13.1)
Charges for Services 2,755,449 2,622,193 2,788,900 2,246,700 (19.4)
Fines 0 0 0 0 0.0
Other Revenue 740,885 748,315 1,054,300 565,000 (46.4)
Interdepartmental Charges for Services 0 0 0 0 0.0
Misc. Revenue 314,998 307,603 210,700 280,000 32.9
Transfers 977,543 1,928,726 1,826,600 4,566,500 150.0
Total Fiscal Year Revenues 8,321,231 7,184,754 7,827,100 9,350,400 19.5
Funding Facilitated by Department 8,486,308 7,714,837 8,269,000 9,923,200 20.0
Memo Item:
Appropriations by Amount
Personnel Services 8,181,438 8,637,830 9,890,100 11,301,000 14.3
Non Personnel Services 9,154,401 8,631,803 20,256,900 26,754,000 32.1
Interdepartmental Services 4,296,813 4,099,553 2,862,700 2,631,200 (8.1)
Contingencies 0 0 0 0 0.0
Total Departmental Expenditures 21,632,651 21,369,186 33,009,700 40,686,200 23.3
Citywide General Fund Support 12,486,202 13,242,061 19,090,700 24,212,900 26.8
Total Available Funding 20,972,511 20,956,899 27,359,700 34,136,100 24.8
Appropriations by Percentage
Personnel Services 37.8 40.4 30.0 27.8 14.3
Non Personnel Services 42.3 40.4 61.4 65.8 32.1
Interdepartmental Services 19.9 19.2 8.7 6.5 (8.1)
Contingencies 0.0 0.0 0.0 0.0 0.0
Total Departmental Expenditures 100.0 100.0 100.0 100.0 23.3
FY 2020-2021 Final Revised Budget B - 97
Parks, After School, Recreation and Community Services Department

Department Appropriations by Fund Classification - FY 2021 Only
Resources GeneralFund
SpecialRevenues Capital Enterprise Internal
ServiceDebt
Service Total
Beginning Balance 0 52,500 138,000 382,300 0 0 572,800
Fiscal Year Revenues:
Taxes 0 0 0 0 0 0 0
Licenses & Permits 0 0 0 0 0 0 0
Intergovernmental Revenue 31,400 1,660,800 0 0 0 0 1,692,200
Charges for Services 1,458,400 706,600 62,400 19,300 0 0 2,246,700
Fines 0 0 0 0 0 0 0
Other Revenue 74,500 159,000 1,900 329,600 0 0 565,000
Interdepartmental Charges for Services 0 0 0 0 0 0 0
Misc. Revenue 255,400 24,600 0 0 0 0 280,000
Transfers 2,740,400 (46,100) 0 46,100 0 1,826,100 4,566,500
Total Fiscal Year Revenues 4,560,100 2,504,900 64,300 395,000 0 1,826,100 9,350,400
Funding Facilitated by Department 4,560,100 2,557,400 202,300 777,300 0 1,826,100 9,923,200
Memo Item:
Appropriations
Personnel Services 10,327,500 799,200 103,400 70,900 0 0 11,301,000
Non Personnel Services 15,881,000 1,700,000 6,542,800 804,100 0 1,826,100 26,754,000
Interdepartmental Services 2,564,500 58,200 2,500 6,000 0 0 2,631,200
Contingencies 0 0 0 0 0 0 0
Total Appropriations 28,773,000 2,557,400 6,648,700 881,000 0 1,826,100 40,686,200
Citywide General Fund Support 24,212,900 0 0 0 0 0 24,212,900
Total Available Funding 28,773,000 2,557,400 202,300 777,300 0 1,826,100 34,136,100
Department Appropriations by Fund Type
FY 2018Actuals
FY 2019Actuals
FY 2020Amended
FY 2021Final
(Amount)
FY 2021Final
(Percent)Operating 16,844,435 17,827,609 20,144,500 26,435,800 65.0
Capital 2,885,274 1,719,341 11,038,600 12,424,300 30.5
Debt Service 1,902,943 1,822,236 1,826,600 1,826,100 4.5
Total 21,632,651 21,369,186 33,009,700 40,686,200 100.0
B - 98 FY 2020-2021 Final Revised Budget
Parks, After School, Recreation and Community Services Department

Notes Department Revenue and Expenditures – All Funds Combined Table
1. This table reflects the consolidation of all funds that support operating and/or capital financialactivities.
2. The Citywide General Fund Support line-item reflects citywide General Fund revenues (i.e.,sales tax, property tax, etc.) captured in the General City Purpose Department and is utilized tocover the difference between General Fund revenues and expenditures facilitated by the abovedepartment.
3. Data may not add to the totals due to rounding.
Department Appropriations by Fund Classification – FY 2021 only Table 1. The Citywide General Fund Support line-item reflects citywide General Fund revenues (i.e.,
sales tax, property tax, etc.) captured in the General City Purpose Department and is utilized tocover the difference between General Fund revenues and expenditures facilitated by the abovedepartment.
Department Appropriations by Fund Type 1. Data may not add to the totals due to rounding.
FY 2020-2021 Final Revised Budget B - 99
Parks, After School, Recreation and Community Services Department

THIS PAGE WAS INTENTIONALLY LEFT BLANK.
B - 100 FY 2020-2021 Final Revised Budget

Personnel Services Department The Personnel Services Department’s mission is to provide and facilitate the delivery of effective customer service through collaborative and diplomatic efforts, employing the values of integrity, compassion, and respect.
The Department consults citywide with department management on personnel matters, negotiates and maintains Memoranda of Understanding (MOU) with city bargaining units, processes grievances, investigates employee concerns, serves as support staff to the Civil Service Board, and manages the interactive process. The Department also manages benefit plan enrollments; Unemployment Insurance claims; the
Employee Assistance Program; provides new employee training and ongoing staff development; develops and updates personnel policies; implements and manages data modules to improve employee access to training opportunities and online personnel information; recruits and tests applicants for city positions; administers bilingual skill examinations; and, maintains personnel data and employee files for the City’s workforce.
The Risk Management Division manages employee Workers’ Compensation; provides loss control services through citywide safety programs; ensures compliance with the City’s indemnification policy through contract review; and, processes property and liability claims through resolution and subrogation recovery.
The overall goal of the Department is to add value to the City by providing outstanding service while proactively identifying opportunities for streamlining, protecting the City’s assets and consolidating efforts. The Personnel Services Department strives to enhance working relationships at all levels to create a harmonious and efficient environment.
FY 2020-2021 Final Revised Budget B - 101

Jeffrey CardellPersonnel Services
Director
Operations
Employment Services
Classification and Compensation
Labor Relations
Labor Agreement Management
Employee Relations
Risk Management
Workers’ Compensation
Property Claims
Administration
Budget / Accounting
Payroll / HRMS
Organization Development &
Training
Career Development
Orientation / Mandated Training
Assistant Director
Risk Transfer
Loss Control/Safety
InvestigationsEmployee Benefits
Administration
Liability Claims
Unemployment
Personnel Records
Fingerprinting
Civil Service Board Support
B - 102 FY 2020-2021 Final Revised Budget
Personnel Services Department

OperatingFY 2020
AmendedFY 2021
Final Variance
General Fund 3,566,600 3,900,300 333,700
Internal Service Fund 35,633,400 40,091,000 4,457,600
Total Operating 39,200,000 43,991,300 4,791,300
Grand Total 39,200,000 43,991,300 4,791,300
Operating and Debt Service by Fund Type FY 2021 Appropriation Fund Type Chart
Personnel ServicesDepartment Fund Type FTE
General Fund 25.30
Internal Service Fund 12.70
Department Total FTE 38.00
Debt Service
0 0 0
Total Debt Service 0 0 0
Personnel Services Department Budget Snapshot
FY 2020-2021 Final Revised Budget B - 103
Personnel Services Department

Service Impacts
For the FY 2021 Final Revised Budget, the Personnel Services Department’s appropriations are budgeted at $43,991,300, an increase of 12.2 percent or $4,791,300 when compared to the FY 2020 Amended Budget. The total increase of $4,791,300 includes additional appropriations of $333,700 in Human Resources Operations, $5,086,100 in the Liability Fund offset by decreases of $549,900 in the Workers’ Compensation Program, $26,400 in the Property Fund, and $52,200 in the Unemployment Fund.
Human Resources Operations Appropriations in the FY2021 Final Revised Budget for Human Resources Operations are budgeted at $3,900,300, an increase of $333,700 or 9.3 percent above the FY 2020 Amended Budget. The increase amount is comprised of increases in Personnel costs due to contractual obligations driven by negotiated Memorandum of Understanding (MOU) agreements as well as the addition of a $246,800 increase in Interdepartmental Charges mainly due to Information Systems Services equipment and service charges, Facilities Management charges and City Hall Security Assessment charges offset by a decrease to City Hall Rent.
Workers’ Compensation Program Appropriations in the FY2021 Final Revised Budget for the Workers’ Compensation Program are established at $20,209,300 a decrease of 2.6 percent or $549,900 when compared to the FY 2020 Amended Budget. This overall decrease is due primarily to lower than anticipated claims and settlements expense activity in FY 2020, which was partially offset by increases in Personnel costs due to contractual obligations driven by negotiated MOU agreements in addition to:
• $395,400 as a result of contractual increasesencompassing an increase of $245,400 to theThird Party Administrator and $150,000 forannual state assessments required for Self-Insured Plans.
Liability
Appropriations in the FY 2021 Final Revised Budget for the Liability Program are established at $15,410,900, an increase of 49.2 percent or $5,086,100 above the FY 2020 Amended Budget. This amount is comprised of slight increases in Personnel costs due to contractual obligations driven by negotiated MOU agreements in addition to: • $4,912,200 due to delays in processing of
refunds and claims as result of pending casecourt trials and no processing of litigation inFY 2020 due to COVID-19. Personnelanticipates these cases will be decided in FY2021 and funding will be available to paythese claims.
• $145,000 due to increases to insurancepremium payments.
Interdepartmental Charge decrease of $22,400 are due to decreases in the Cost Allocation Plan offset by an increase to Information Systems Service charges.
Property In the FY 2021 Final Revised Budget, total appropriations in the Property section are budgeted at $3,682,200, a decrease of less than one percent or $26,400 below the FY 2020 Amended Budget. This amount mostly reflects a decrease of $250,000 in contingency reserves that were discontinued because of non-use.
Additionally, the FY2021 Final Revised Budget includes a $142,000 increase in insurance payments and a $50,000 increase in refunds and claims payments.
B - 104 FY 2020-2021 Final Revised Budget
Personnel Services Department

Unemployment Self-Insurance In the FY 2021 Final Revised Budget, total appropriations in the Unemployment Self-Insurance fund are budgeted at $788,600, a decrease of 6.2 percent or $52,200 below the FY 2020 Amended Budget. This decrease is intended to align expenditures with available resources.
Staff ing Combined Personnel costs for the FY2021 Final Revised Budget are $4,215,500; $205,400 above the FY 2020 Amended Budget. Significant changes impacting this increase are contractual obligations driven by negotiated MOU agreements.
Department Staffing Detail
Position Summary FY 2019 FY 2020 FY 2020 FY 2021 FY 2021
Division Adopted Adopted Amended Changes Final Human Resources Admin. Division 5.00 5.00 5.00 0.00 5.00
Organization Dev.& Training Division 1.00 1.00 1.00 0.00 1.00
Human Resources Operations Division 11.75 12.00 12.00 0.00 12.00
Labor Relations Division 3.00 3.00 3.00 0.00 3.00
Loss Control Division 2.00 2.00 2.00 1.00 3.00
Risk Management Division 10.00 10.00 10.00 0.00 10.00
Workers Compensation Division 2.50 3.00 3.00 0.00 3.00
HR Classification and Compensation 2.00 2.00 2.00 (1.00) 1.00
Total 37.25 38.00 38.00 0.00 38.00
FY 2020-2021 Final Revised Budget B - 105
Personnel Services Department

Department Revenue and Expenditure - All Funds Combined
Funding Source FY 2018Actuals
FY 2019Actuals
FY 2020Amended
FY 2021Final
PercentChange
Beginning Balance 10,070,719 8,716,522 1,836,300 8,593,600 368.0
Fiscal Year Revenues:
Taxes 19 13 0 0 0.0
Licenses & Permits 0 0 0 0 0.0
Intergovernmental Revenue 0 0 0 0 0.0
Charges for Services 8,986 7,066 6,500 0 (100.0)
Fines 0 0 375,000 375,000 0.0
Other Revenue 135,733 110,220 62,500 58,300 (6.7)
Interdepartmental Charges for Services 24,629,600 26,151,972 33,416,600 33,095,300 (1.0)
Misc. Revenue 24,530 19,868 0 0 0.0
Transfers 3,000,000 0 0 0 0.0
Total Fiscal Year Revenues 27,798,868 26,289,139 33,860,600 33,528,600 (1.0)
Funding Facilitated by Department 37,869,587 35,005,661 35,696,900 42,122,200 18.0
Memo Item:
Appropriations by Amount
Personnel Services 3,223,207 3,613,315 4,010,100 4,215,500 5.1
Non Personnel Services 5,173,791 5,092,632 6,457,700 7,108,800 10.1
Interdepartmental Services 858,286 992,257 1,210,700 1,433,300 18.4
Contingencies 22,901,255 24,091,815 27,521,500 31,233,700 13.5
Total Departmental Expenditures 32,156,539 33,790,019 39,200,000 43,991,300 12.2
Citywide General Fund Support 3,003,474 3,118,391 3,560,100 3,900,300 9.6
Total Available Funding 40,873,061 38,124,052 39,257,000 46,022,500 17.2
Appropriations by Percentage
Personnel Services 10.0 10.7 10.2 9.6 5.1
Non Personnel Services 16.1 15.1 16.5 16.2 10.1
Interdepartmental Services 2.7 2.9 3.1 3.3 18.4
Contingencies 71.2 71.3 70.2 71.0 13.5
Total Departmental Expenditures 100.0 100.0 100.0 100.0 12.2
B - 106 FY 2020-2021 Final Revised Budget
Personnel Services Department

Department Appropriations by Fund Classification - FY 2021 Only
Resources GeneralFund
SpecialRevenues Capital Enterprise Internal
ServiceDebt
Service Total
Beginning Balance 0 0 0 0 8,593,600 0 8,593,600
Fiscal Year Revenues:
Taxes 0 0 0 0 0 0 0
Licenses & Permits 0 0 0 0 0 0 0
Intergovernmental Revenue 0 0 0 0 0 0 0
Charges for Services 0 0 0 0 0 0 0
Fines 0 0 0 0 375,000 0 375,000
Other Revenue 0 0 0 0 58,300 0 58,300
Interdepartmental Charges for Services 0 0 0 0 33,095,300 0 33,095,300
Misc. Revenue 0 0 0 0 0 0 0
Transfers 0 0 0 0 0 0 0
Total Fiscal Year Revenues 0 0 0 0 33,528,600 0 33,528,600
Funding Facilitated by Department 0 0 0 0 42,122,200 0 42,122,200
Memo Item:
Appropriations
Personnel Services 2,898,300 0 0 0 1,317,200 0 4,215,500
Non Personnel Services 235,200 0 0 0 6,873,600 0 7,108,800
Interdepartmental Services 766,800 0 0 0 666,500 0 1,433,300
Contingencies 0 0 0 0 31,233,700 0 31,233,700
Total Appropriations 3,900,300 0 0 0 40,091,000 0 43,991,300
Citywide General Fund Support 3,900,300 0 0 0 0 0 3,900,300
Total Available Funding 3,900,300 0 0 0 42,122,200 0 46,022,500
Department Appropriations by Fund Type
FY 2018Actuals
FY 2019Actuals
FY 2020Amended
FY 2021Final
(Amount)
FY 2021Final
(Percent)Operating 32,156,539 33,790,019 39,200,000 43,991,300 100.0
Capital 0 0 0 0 0.0
Debt Service 0 0 0 0 0.0
Total 32,156,539 33,790,019 39,200,000 43,991,300 100.0
FY 2020-2021 Final Revised Budget B - 107
Personnel Services Department

Notes Department Revenue and Expenditures – All Funds Combined Table
1. This table reflects the consolidation of all funds that support operating and/or capitalfinancial activities.
2. The Citywide General Fund Support line-item reflects citywide General Fund revenues (i.e.,sales tax, property tax, etc.) captured in the General City Purpose Department and is utilized tocover the difference between General Fund revenues and expenditures facilitated by the abovedepartment.
3. Data may not add to the totals due to rounding.
Department Appropriations by Fund Classification – FY 2021 only Table
1. The Citywide General Fund Support line-item reflects citywide General Fund revenues (i.e.,sales tax, property tax, etc.) captured in the General City Purpose Department and is utilized tocover the difference between General Fund revenues and expenditures facilitated by the abovedepartment.
Department Appropriations by Fund Type
1. Data may not add to the totals due to rounding.
B - 108 FY 2020-2021 Final Revised Budget
Personnel Services Department
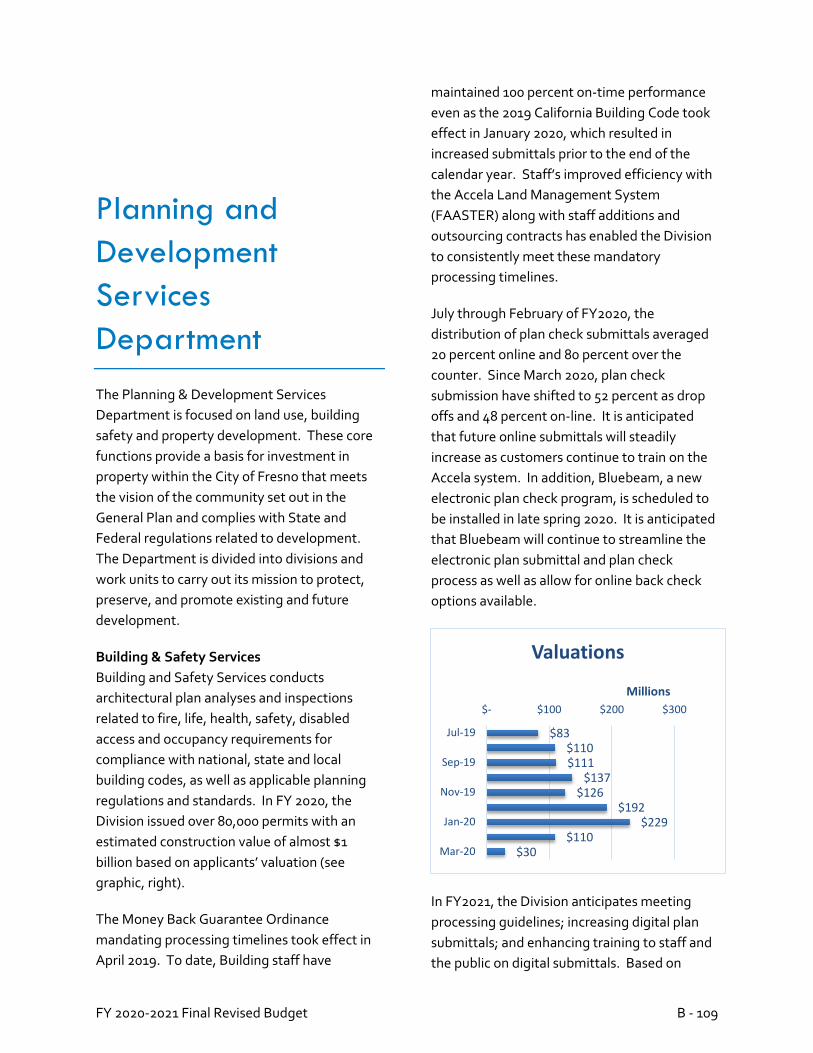
Planning and Development Services Department The Planning & Development Services Department is focused on land use, building safety and property development. These core functions provide a basis for investment in property within the City of Fresno that meets the vision of the community set out in the General Plan and complies with State and Federal regulations related to development. The Department is divided into divisions and work units to carry out its mission to protect, preserve, and promote existing and future development.
Building & Safety Services Building and Safety Services conducts architectural plan analyses and inspections related to fire, life, health, safety, disabled access and occupancy requirements for compliance with national, state and local building codes, as well as applicable planning regulations and standards. In FY 2020, the Division issued over 80,000 permits with an estimated construction value of almost $1 billion based on applicants’ valuation (see graphic, right).
The Money Back Guarantee Ordinance mandating processing timelines took effect in April 2019. To date, Building staff have
maintained 100 percent on-time performance even as the 2019 California Building Code took effect in January 2020, which resulted in increased submittals prior to the end of the calendar year. Staff’s improved efficiency with the Accela Land Management System (FAASTER) along with staff additions and outsourcing contracts has enabled the Division to consistently meet these mandatory processing timelines.
July through February of FY2020, the distribution of plan check submittals averaged 20 percent online and 80 percent over the counter. Since March 2020, plan check submission have shifted to 52 percent as drop offs and 48 percent on-line. It is anticipated that future online submittals will steadily increase as customers continue to train on the Accela system. In addition, Bluebeam, a new electronic plan check program, is scheduled to be installed in late spring 2020. It is anticipated that Bluebeam will continue to streamline the electronic plan submittal and plan check process as well as allow for online back check options available.
In FY2021, the Division anticipates meeting processing guidelines; increasing digital plan submittals; and enhancing training to staff and the public on digital submittals. Based on
$83 $110 $111
$137 $126
$192 $229
$110 $30
$- $100 $200 $300
Jul-19
Sep-19
Nov-19
Jan-20
Mar-20
Millions
Valuations
FY 2020-2021 Final Revised Budget B - 109

approved entitlements, building permit outlook remains strong.
Current Planning Current Planning functions as the primary entity through which development projects are processed and authorized. It acts as the liaison between the developer/public and the process, providing advisory and technical information. It also provides the majority of resources and support for the Fresno City Planning Commission.
FY2020 began as a banner year for the Current Planning Division. From July 2019 to February 2020, 3,711 entitlements were processed; during that time period, an average of 476 entitlement applications per month were received. This included a high of 592 applications in November and a low of 391 in January. Beginning March 2020 the Division saw a 20 percent reduction in application volumes which fell to 298. This represented a 25 percent decrease from February, and a 37 percent decrease from the July to February average. Current Planning assisted an average of 43 walk-in customers per day in the period prior to the closure of City Hall. On time performance remained at 100 percent since the beginning of the fiscal year.
The Current Planning Division has a continued positive outlook for the remainder of the fiscal year due to a pipeline of projects.
Long Range Planning Long Range Planning is responsible for the formulation and update of plans, including the General Plan, Specific Plans, and Community Plans that guide the City’s growth and change in both developed and undeveloped areas. These plans are utilized by the public, other city departments, the Planning Commission, as well as the City Council to plan and build public improvements that will guide private investment, and to improve the quality of life for community residents.
The Division is responsible for engaging the public in planning processes through a variety of events and activities.
Prior to March 2020, 35 public meetings reaching approximately 1,000 people had been conducted on a variety of topics including
B - 110 FY 2020-2021 Final Revised Budget
Planning and Development Services Department

revitalization of Central Southeast Fresno and the West Area, industrial compatibility, and anti-displacement, to name a few. The Division anticipates completing the update of the Fresno General Plan MEIR by the end of 2020 allowing for continued investment in Fresno.
For the upcoming budget year, approximately 30 public meetings will be conducted regarding specific plans, brownfields, and transit oriented development, among others, reaching a target population of approximately 1,500 people.
Parking Services The Parking Division’s responsibilities include management of City owned on and off street parking facilities, parking for events at City facilities, enforcement of parking related California Vehicle Code and Fresno Municipal Code via citations, parking meter operations, and towing of abandoned, hazardous, and inoperative vehicles left on City streets. A vendor is contracted by the Division to manage daily parking operations at each of the downtown staffed parking facilities.
Management functions include: customer service, parking permit management, collection and auditing of City revenue, and contract management. Parking Enforcement Officers are assigned to beats, patrol area in each of the City Council Districts, roving beats throughout the City, a swing beat, a weekend beat, and various beats in downtown Fresno. The Parking Division works closely with the various local school districts improving safety efforts surrounding their campuses. Parking Meter Attendants maintain downtown’s parking meters and manage the collection and deposit of revenue.
The Parking Enforcement Officers proactively patrol City streets while also responding to FresGO requests regarding issues such as abandoned and inoperable vehicles,
commercial vehicles in residential areas, semi-trucks and blocked sidewalks, roadways, and alleys. Parking Division field staff completed over 8,000 FresGO request from July to March 2020. A parking financial and operations study was completed with recommendations of technological and rate structure improvements. Implemented projects have had a positive impact on parking revenues and provide customers with new payment options.
From July 2019 through February 2020, the Parking Division implemented the ParkMobile smartphone app which allows customers to pay with credit card and extend time through their phones; provided an online tool for residents to apply for a residential district parking permits; began a pilot demonstration with solar powered credit card parking meters to eventually replace coin-only meters; and installed 8 parking pay-stations, which allow customers the option to pay with credit card, bills, and coin in City parking lots.
July through February showed a consistent increase in the growth in the number of transactions and revenue earnings from ParkMobile, averaging 7 percent before the decline in March. Total revenue projections for the Parking Division were also 5 percent higher in FY2020 than FY2019, prior to March. A two month review in February and March, of pay station payments confirmed higher revenue
FY 2020-2021 Final Revised Budget B - 111
Planning and Development Services Department

earnings from credit card users and overall customer acceptance of new payment methods; credit card and bill payments outnumbered coin only transactions.
Housing & Community Development The Housing Division implements the federal entitlement programs from the U. S. Department of Housing and Urban Development (HUD) and acts as the liaison to the City’s Housing and Community Development Commission. The Division works collaboratively with several City departments and divisions as well as area non-profits, and other local public and private agencies to further the efforts of housing revitalization and provision of essential public services.
Some notable accomplishments from the most current Consolidated Annual Performance Evaluation Report (CAPER) include: 1) Safe and Affordable Housing – 40 households benefited from construction, minor repair, and paint programs, while 11 rental units were constructed; 2) Homelessness – 795 persons provided overnight housing, 68 units of rapid re-housing, 19 units of homeless prevention, 53 persons benefited through the Housing Opportunities for Persons with Aids/HIV (HOPWA), and 17 families benefited from Tenant Based Rental Assistance ; 3) Community Services – 3,203 persons assisted (youth, seniors) through a combination of sub recipient and direct program delivery; 4) Public Facilities and Improvements - over $1.5 million in public facilities and public infrastructure was expended on activities/projects.
Since the CAPER, 13 facility improvements have begun, including the design of a new HVAC system at the Maxie L. Parks Community Center; and 8 Single-Family units and 220 Multi-Family units are underway. Additionally, 1,514 individuals have been served through
community service programs; 68 households benefited from minor repair, paint programs, or roof program; over 400 individuals received rapid rehousing or homeless prevention assistance; and 13 households have benefited through HOPWA.
Additionally, the Housing Division is in the process of applying for a CDBG Section 108 Loan for the City to design and construction of a multi-generational community center at Large Park. The multigenerational center will be designed based on community input and may include a multi-use concept meeting and recreation area with modular walls for small group activities, a kitchen for warming meals, an area to accommodate after-school activities and senior activities, a play area with playground and tot lot, two soccer fields, office space for staff and meetings, and an expansion of existing on-site parking.
As a part of the Five Year Consolidated Plan, the City conducted extensive outreach and engagement from October through February. As shown in the previous chart, the engagement sought input on community needs, priorities for funding and solutions to address fair housing disparities. This represented a significant effort to ensure residents were included in all phases of the plan’s development.
B - 112 FY 2020-2021 Final Revised Budget
Planning and Development Services Department

Historic Preservation Historic Preservation supports investment in the City of Fresno through evaluation of properties, support for owners and Section 106 reviews for publicly funded projects.
City Council adopted two economic incentive programs to assist owners of qualified historic properties - the Mills Act Program in 2016 and the Historic Preservation Mitigation Program in 2018. Promotional materials were created and made available to the public including an updated brochure and application packet for each program in January 2020. A mail-out promoting the City’s economic incentive programs available for qualified historic properties was sent to all owners of designated historic properties within city limits in January 2020.
The Mills Act Program is a property tax abatement program for qualified historic properties that enter into 10-year contracts with work plans for rehabilitation and maintenance. Contracts for 22 properties have been recorded with the Fresno County Recorder since the adoption of the program, eight of which were recorded for calendar year 2019. Three applications have been received so far for the 2020 Mills Act Program. Participation in this program is expected to remain steady.
The Historic Preservation Mitigation Program is a reimbursement grant program for projects that contribute to the historic character of qualified historic properties. The current maximum grant amount per property is $7,500 or 40 percent of project costs, whichever is less. Funding in the amount of $50,000 was approved for FY 2019 toward this program and again for FY 2020. Nine reimbursement grants have been awarded since the adoption of the program, six of which have been awarded so far
this year; an additional six applications have received initial approval to be awarded upon project completions.
In the FY2020 budget year, Historic Preservation supported 74 publicly funded projects through Section 106 review. These include: • Proposed Hinton Park Improvement
Project• Saints Rest Facility Improvement Project• Cary Park Field Lighting
Downtown & Bus Rapid Transit (BRT) Corridor Revitalization The Department supports the City’s Economic Development efforts including business development, attraction/retention, job creation, and promotional activities that increase economic opportunities, and improve the quality of life for the residents of Fresno. Revitalization efforts are primarily focused in Downtown, Tower District, and the BRT Corridors. Staff promotes these areas to potential investors, builders, and entrepreneurs, and helps them to identify potential sites for their projects. Assistance is provided to development applicants with the entitlement process to ensure that the process is streamlined and that any issues that arise are resolved quickly. Economic Development staff also provides design assistance for facade improvements and development concepts so that projects enhance the aesthetics of Downtown, promote economic activity, and are compliant with applicable regulations. Staff also works closely with the Council members, Fresno EDC, the local chambers, Downtown Fresno Partnership, Chinatown Fresno Foundation, Fresno Metro Ministry, Southeast Fresno Community Economic Development Association with fundraising, special events, marketing, outdoor dining installations, and other activities.
FY 2020-2021 Final Revised Budget B - 113
Planning and Development Services Department

Activities during FY 2019-2020 included outreach to investors, engagement of existing businesses and support for expansion and retention. Notable activities include: • Assisted 8 new or expanded businesses
including The Modernist, relocation of Val Paraiso, expansion of Kikku Japanese Restaurant, expansion of Chicken Shack, and relocation of Mabel’s Kitchen.
• Supported 20 businesses through development process
• Narrated the Fresno State’s First Annual Real Estate Tour of Downtown and LTA/Amazon (City of Fresno provided funding) hosted a PBID Seminar/Academy
to inform property owners about PBIDs in Chinatown, West Shaw, and the BRT corridors for 30 property owners
• Created the following to help business during crises: a Business Resilience Toolkit for small business; a Resource Directory; a Save Our Small Business Loan Program for business with 25 or fewer employees; a partnership with the Fresno Chamber, Fresno EDC to create a COVID-19 crises hotline for businesses. Work for this strategic unit continues to be a high priority for the Department.
Long Range Planning
Building & Safety
Current Planning CDBG
Parking Services
Jennifer ClarkDirector
Administration
HOME
ESG
HOPWA
Housing & Community DevelopmentAssistant Director Assistant Director
Downtown & Corridor Revitalization
Historic Preservation
B - 114 FY 2020-2021 Final Revised Budget
Planning and Development Services Department
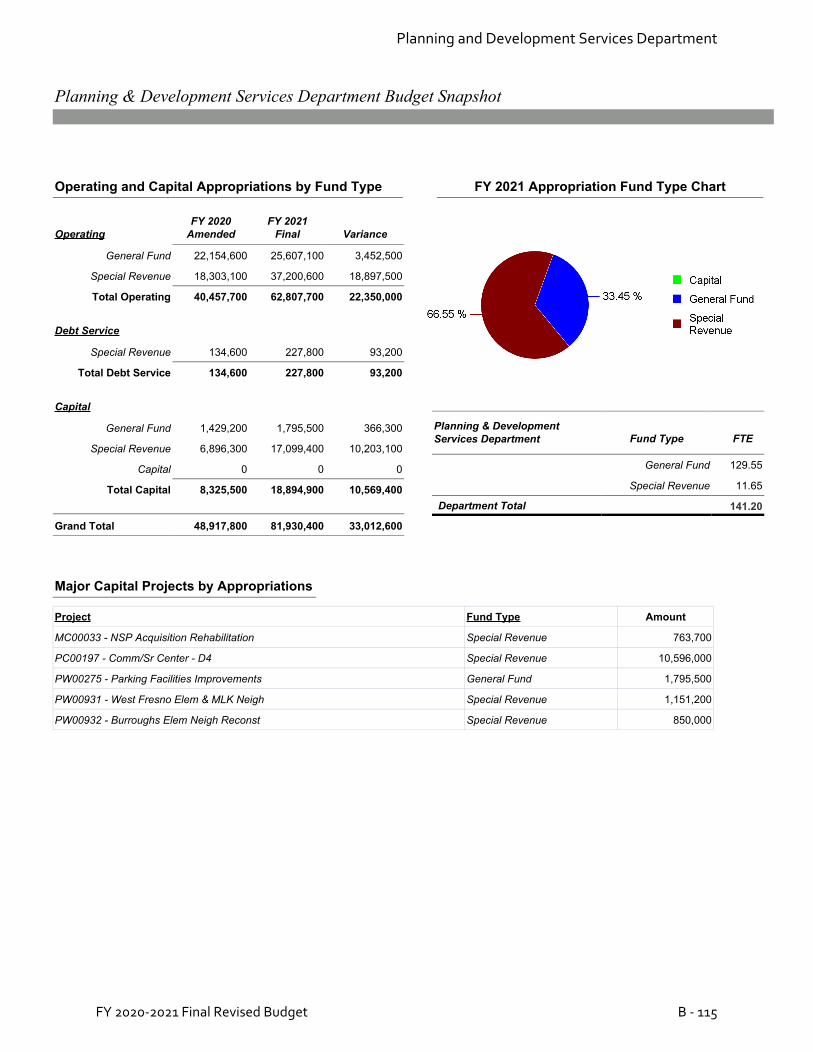
OperatingFY 2020
AmendedFY 2021
Final Variance
General Fund 22,154,600 25,607,100 3,452,500
Special Revenue 18,303,100 37,200,600 18,897,500
Total Operating 40,457,700 62,807,700 22,350,000
Capital
General Fund 1,429,200 1,795,500 366,300
Special Revenue 6,896,300 17,099,400 10,203,100
Capital 0 0 0
Total Capital 8,325,500 18,894,900 10,569,400
Grand Total 48,917,800 81,930,400 33,012,600
Operating and Capital Appropriations by Fund Type FY 2021 Appropriation Fund Type Chart
Major Capital Projects by Appropriations
Planning & DevelopmentServices Department Fund Type FTE
General Fund 129.55
Special Revenue 11.65
141.20
Debt Service
Special Revenue 134,600 227,800 93,200
Total Debt Service 134,600 227,800 93,200
Project Fund Type Amount
MC00033 - NSP Acquisition Rehabilitation Special Revenue 763,700 ## 5
PC00197 - Comm/Sr Center - D4 Special Revenue 10,596,000 ## 1
PW00275 - Parking Facilities Improvements General Fund 1,795,500 ## 2
PW00931 - West Fresno Elem & MLK Neigh Special Revenue 1,151,200 ## 3
PW00932 - Burroughs Elem Neigh Reconst Special Revenue 850,000 ## 4
Planning & Development Services Department Budget Snapshot
Department Total
FY 2020-2021 Final Revised Budget B - 115
Planning and Development Services Department

Service Impacts
Approved Council Motions Per Revised Budget Hearings Per approved Council Motion #32 new positions requests submitted in the FY 2021 Final Revised Budget were eliminated. The motion reduced the HUD Division’s Budget by $123,500. The positions eliminated include: • One (1) .65 FTE Contract compliance
Officer; • One (1) .65 FTE Housing and Rehabilitation
Specialist.
Per approved Council Motion #17, the FY 2021 Final Revised Budget includes $150,000 for a focused Environmental Impact Report to assess increasing the density in all mixed used districts.
Per approved Council Motion # 37 the following motions were approved with adjustments: • Per Council Motion #18 $200,000 is
budgeted to conduct a Comprehensive Fiscal Impact Analyses to measure the variable financial sustainability impacts of General Plan Land Use and Development Policies on General Plan Implementation.
• Per Council Motion #28, $50,000 is budgeted to pay for the Cottage Home Program startup costs.
• Per Council Motion #43 from the Continuing Resolution, $100,000 is budgeted in the General Fund to pay for Echo/Weldon Park feasibility.
Approved Council Motions Per Continuing Resolution Per approved Council Motion # 34, $1 million is budgeted in Housing Trust Fund.
Per approved Council Motion #45, $50,000 was added to the FY 2021 Budget for the development of a housing master plan at the
Blackstone and McKinley grade separation area.
Per approved Council Motions #47, $100,000 was added to the FY 2021 Budget for a façade improvement program for small businesses along the Kings Canyon corridor and the Tower District.
The Planning & Development Department’s FY 2021 Final Revised Budget totals $81,930,400, which is an increase of $33,012,600 or 67.5 percent from the FY 2020 Amended Budget. General Fund appropriations are increasing by $3,818,800, while the remaining funds are increasing by $29,193,800.
General Fund increase of $3,818,800 over the FY 2020 Amended Budget included an increase of $3,452,500 to Operations of which $1,150,000 is attributable to Council Motion No. 34, 45 and 47 from the Continuing Resolution and $500,000 to Motion No. 17, 18, 28 and 43 from the Revised Budget. The remaining $1,802,500 include: • $389,200 for CARES Act funded
expenditures: o $265,000 to fund the Emergency
Operation Center (EOC) , o $110,000 Contract Extra for labor
associated with the operation of the EOC,
o $4,200 SP+ COVID-19 related Parking activities,
o $10,000 for 10 iPads for COVID-19 related activities.
• $560,800 to fully fund the Planning & Development Administration. In FY 2020, Council organized the Code function from the Department to the City Attorney’s Office (CAO). Consistent with this direction, part of the Planning and Development Administration Division’s staff and operating appropriations were
B - 116 FY 2020-2021 Final Revised Budget
Planning and Development Services Department

moved to the CAO. These appropriations fully fund the Administration Division in FY 2021.
• $930,900 for various personnel costswhich include increases due to MOU, stepadvancements, pension contributions,workers’ compensation as well as healthand welfare contributions.
• $657,900 net increase toInterdepartmental Charges to support therevenues needed by the various respectivefunds. Below is summary of significant IDcharge variances:o $194,200 increase in Information
Systems Service Charge,o $110,800 increase in Information
Systems Equipment Charge,o $138,800 decrease in Liability Self-
Insurance Charge,o $82,000 increase in Facilities
Management,o $65,800 decrease in Non-recurring
Special Project Charges,o $423,500 increase in City Hall Rent,
• $724,500 is included for ParkingGarage #7 bond payment thatwas refinanced into City HallRent.
o $51,500 increase NetworkReplacement Charge,
o $106,000 decrease in 10X and 10CCharges,
o $129,900 increase in SecurityAssessment.
In addition to the increases in Operations, General Fund Capital increased by $366,300 above the FY 2020 Amended Budget. All of the increase is related to the Department’s Parking capital program. $1,248,800 was rebudgeted from FY 2020, while the FY 2021 Final Revised Budget includes an additional $546,700 that was included to address capital needs as outlined in the Walter P. Moore Study.
The FY 2021 Final Revised Budget excludes one-time FY 2020 expenditures, including capital. Below is a summary of one-time FY 2020 expenditures: • $250,000 for the completion of the General
Plan Master Environmental Impact Report.• $35,000 for Code Books.• $250,000 Money Back Guarantee
consultants.
Other Funds The Department is the recipient of multiple federal and state grants including: HUD Entitlements (a more thorough description of the program is available in the “Federal Entitlement Funding” section of this document), Housing Grants, and High Speed Rail Projects Grant. These funds are “use specific,” which requires the Department to budget grants according to grant guidelines. FY 2021 Final Revised Budget appropriations for these funds are $54,527,800 or an increase of $29,193,800. The increase is comprised of a $10,203,100 increase to capital, $93,200 to debt service and $18,897,500 to operating. Below are significant increases:
Housing The FY 2021 CalHome Budget (Housing Grant) is $3,190,000, or an increase of $3,190,000 from the FY 2020 Amended. The CalHome program includes $2,060,000 in grant funds for the repair, rehabilitation, or replacement of manufactured homes; and $1,130,000 in reuse funds for home buyer assistance.
HUD Funded Activity The FY 2021 Federal Entitlement Program was approved by Council in May, 2020. Within the Department’s FY 2021 program CDBG appropriations totaled $22,328,500, a $10,496,700 increase from the FY 2020 Amended. The CDBG Budget includes an FY 2021 Program Budget of $7,250,700, a Section
FY 2020-2021 Final Revised Budget B - 117
Planning and Development Services Department

108 loan of $7,500,000 and $2,407,900 of reprogrammed funds for a Multi-Generation Community Center and a projected carryover budget of $5,266,900.
Within the Department’s FY 2021 program HOME Fund appropriations totaled $12,545,300, a $5,883,200 increase from the FY2020 Amended. The HOME Budget includes an FY 2021 Program Budget of $3,460,200, $5,366,900 in prior year program income for affordable housing development and a projected carryover budget of $3,718,200.
Other FY 2021 HUD Entitlements are as follows: $763,100 for the Emergency Solutions Grant (ESG) Program, and $636,200 for the Housing Opportunities for Persons with AIDS (HOPWA) Program.
A more thorough description of the programs is available in the “Federal Entitlement Funding” section of this document.
CARES The FY 2021 CARES Fund Budget for CDBG-CV and, ESG-CV is $13,029,700, or an increase of $9,333,600 from the FY 2020 Amended Budget. The CDBG-CV and, ESG-CV programs will help the City prevent, prepare for, and respond to the coronavirus.
B - 118 FY 2020-2021 Final Revised Budget
Planning and Development Services Department

Staffing Permanent staffing levels for the Planning & Development Department in FY 2021 will remain consistent with FY 2020 Amended levels.
Department Staffing Detail
Position Summary FY 2019 FY 2020 FY 2020 FY 2021 FY 2021
Division Adopted Adopted Amended Changes Final Administration Division 9.00 17.00 17.00 0.00 17.00
Building & Safety Division 51.00 50.00 50.00 0.00 50.00
Planning Division 32.00 31.50 31.50 0.50 32.00
Rental Housing Division 23.00 0.00 0.00 0.00 0.00
Community Revitalization Division 47.00 0.00 0.00 0.00 0.00
Sustainable Fresno Division 2.00 0.00 0.00 0.00 0.00
Economic Development Division 15.00 2.00 2.00 1.00 3.00
Parking Operations Division 27.20 27.20 27.20 0.00 27.20
HUD Division 12.00 11.00 13.00 (1.00) 12.00
Total 218.20 138.70 140.70 0.50 141.20
The following table highlights the FY 2021 Position Transfer from Planning & Development Services to other Departments:
(1.50) FY 2020 two authorized new Planner III positions @ 1.5 FTE
2.00 FY 2021 two authorized Planner III positions @2.0 FTE in FY 2021
0.50 FY 2021 Changes
The following table highlights the FY 2020 Position Transfer from Planning & Development Services to other Departments:
(2.50) Position Adds - Business Friendly Fresno 2.0!
(80.00) Position Transfer to Neighborhood Services Department
(2.00) Position Transfers to Public Works Department
(79.50) FY 2020 Changes per Adopted
FY 2020-2021 Final Revised Budget B - 119
Planning and Development Services Department

Department Revenue and Expenditure - All Funds Combined
Funding Source FY 2018Actuals
FY 2019Actuals
FY 2020Amended
FY 2021Final
PercentChange
Beginning Balance (6,567,356) (4,813,264) 753,500 (1,147,800) (252.3)
Fiscal Year Revenues:
Taxes 113 497 0 0 0.0
Licenses & Permits 5,722,741 5,401,297 4,716,500 6,371,100 35.1
Intergovernmental Revenue 9,677,207 9,644,319 24,765,100 56,871,500 129.6
Charges for Services 11,174,177 13,380,738 11,552,200 11,312,800 (2.1)
Fines 2,478,010 2,205,046 2,422,900 1,616,600 (33.3)
Other Revenue 372,334 195,278 137,100 99,500 (27.4)
Interdepartmental Charges for Services 12,252 13,782 13,400 34,800 159.7
Misc. Revenue 2,965,203 1,303,657 53,300 85,700 60.8
Transfers (232,509) 729,513 1,329,400 1,289,200 (3.0)
Total Fiscal Year Revenues 32,169,529 32,874,128 44,989,900 77,681,200 72.7
Funding Facilitated by Department 25,602,173 28,060,864 45,743,400 76,533,400 67.3
Memo Item:
Appropriations by Amount
Personnel Services 17,615,534 18,783,263 15,164,400 17,891,400 18.0
Non Personnel Services 12,045,775 19,161,535 29,802,000 59,831,000 100.8
Interdepartmental Services 5,501,856 5,541,810 3,951,400 4,208,000 6.5
Contingencies 0 6 0 0 0.0
Total Departmental Expenditures 35,163,164 43,486,613 48,917,800 81,930,400 67.5
Citywide General Fund Support 6,675,083 6,218,131 3,869,400 5,573,300 44.0
Total Available Funding 32,277,256 34,278,995 49,612,800 82,106,700 65.5
Appropriations by Percentage
Personnel Services 50.1 43.2 31.0 21.8 18.0
Non Personnel Services 34.3 44.1 60.9 73.0 100.8
Interdepartmental Services 15.6 12.7 8.1 5.1 6.5
Contingencies 0.0 0.0 0.0 0.0 0.0
Total Departmental Expenditures 100.0 100.0 100.0 100.0 67.5
B - 120 FY 2020-2021 Final Revised Budget
Planning and Development Services Department

Department Appropriations by Fund Classification - FY 2021 Only
Resources GeneralFund
SpecialRevenues Capital Enterprise Internal
ServiceDebt
Service Total
Beginning Balance 1,019,600 (2,167,400) 0 0 0 0 (1,147,800)
Fiscal Year Revenues:
Taxes 0 0 0 0 0 0 0
Licenses & Permits 6,371,100 0 0 0 0 0 6,371,100
Intergovernmental Revenue 0 56,871,500 0 0 0 0 56,871,500
Charges for Services 11,312,800 0 0 0 0 0 11,312,800
Fines 1,616,600 0 0 0 0 0 1,616,600
Other Revenue 99,500 0 0 0 0 0 99,500
Interdepartmental Charges for Services 34,800 0 0 0 0 0 34,800
Misc. Revenue 85,700 0 0 0 0 0 85,700
Transfers 1,289,200 0 0 0 0 0 1,289,200
Total Fiscal Year Revenues 20,809,700 56,871,500 0 0 0 0 77,681,200
Funding Facilitated by Department 21,829,300 54,704,100 0 0 0 0 76,533,400
Memo Item:
Appropriations
Personnel Services 13,752,400 4,139,000 0 0 0 0 17,891,400
Non Personnel Services 10,025,400 49,805,600 0 0 0 0 59,831,000
Interdepartmental Services 3,624,800 583,200 0 0 0 0 4,208,000
Contingencies 0 0 0 0 0 0 0
Total Appropriations 27,402,600 54,527,800 0 0 0 0 81,930,400
Citywide General Fund Support 5,573,300 0 0 0 0 0 5,573,300
Total Available Funding 27,402,600 54,704,100 0 0 0 0 82,106,700
Department Appropriations by Fund Type
FY 2018Actuals
FY 2019Actuals
FY 2020Amended
FY 2021Final
(Amount)
FY 2021Final
(Percent)Operating 31,587,180 39,973,483 40,457,700 62,807,700 76.7
Capital 3,051,208 3,118,165 8,325,500 18,894,900 23.1
Debt Service 524,776 394,965 134,600 227,800 0.3
Total 35,163,164 43,486,613 48,917,800 81,930,400 100.0
FY 2020-2021 Final Revised Budget B - 121
Planning and Development Services Department
Notes Department Revenue and Expenditures – All Funds Combined Table
1. This table reflects the consolidation of all funds that support operating and/or capital financialactivities.
2. The Citywide General Fund Support line-item reflects citywide General Fund revenues (i.e.,sales tax, property tax, etc.) captured in the General City Purpose Department and is utilized tocover the difference between General Fund revenues and expenditures facilitated by the abovedepartment.
3. Data may not add to the totals due to rounding.
Department Appropriations by Fund Classification – FY 2021 only Table 1. This memo line-item reflects citywide General Fund revenues (i.e., sales tax, property tax, etc.)
captured in the General City Purpose Department and is utilized to cover the differencebetween General Fund revenues and expenditures facilitated by the above department.
Department Appropriations by Fund Type
1. Data may not add to the totals due to rounding.
B - 122 FY 2020-2021 Final Revised Budget
Planning and Development Services Department

Police Department The Fresno Police Department (FPD) is committed to increasing community support by establishing relationships of trust, implementing citywide community policing activities, improving the delivery of police services, and ensuring the safety of citizens and our employees.
In an effort to prevent crime, the Department identifies trends at an early stage through the analysis of crime data utilizing sophisticated technology and skilled Crime Analysts. Strategies are then developed and resources deployed in order to impact these trends quickly. Immediate investigative follow up is also conducted to apprehend those responsible. Problem Oriented Policing Officers identify and focus on locations responsible for the highest number of repeat calls for service and use creative, collaborative strategies to minimize these calls from occurring. In turn, officers are provided more time to handle emergency calls for service, engage in proactive enforcement and community policing activities.
In an effort to prevent traffic collisions, department members develop strategies to address collision trends while supervisors
deploy traffic officers to locations with the highest probability of collisions occurring.
The Police Department is a professional organization that prides itself on delivering the highest level of quality service possible. Department members and volunteers are dedicated public servants who care deeply about neighborhoods and serve with compassion, honesty, and sincerity. Each member is committed to the overall mission of enhancing safety, service, and trust with our community.
Department members strongly value and continually seek to establish partnerships with members of the community through programs such as Bringing Broken Neighborhoods Back to Life, Hope Coalition, Chiefs Advisory Board, Youth Advisory Forums, Teen Academy, Police Activities League, Crime Stoppers, Neighborhood Watch, and the Citizens Police Academy. Maintaining the confidence, support, and trust of our community is the foundation for our success.
The Police Department is committed to recruiting the most qualified candidates who are reflective of the community demographics and providing them with the training, technology, and equipment allowing them to do their job safely, effectively and efficiently.
The Fresno Police Department continues to explore evolving technology through the Department’s Real Time Crime Center, Shotspotter's gunshot detection system and Vigilant's license plate recognition data base.
FY 2020-2021 Final Revised Budget B - 123

In addition, over 615 Axon body worn cameras are being utilized by uniformed Patrol officers. Currently, every uniformed officer has been issued a body worn camera allowing for
additional evidence to be gathered for prosecution purposes and to provide a more accurate accounting of the interaction that occurs between officers and citizens.
Chief’s OfficeChief Hall
Patrol DivisionDC Salazar
Investigations DivisionDC Farmer
Support DivisionDC Reid
Admin Lt./PIOLt. Tucker
Sgt. LaBlue
Administrative DivisionDC Cooley
B - 124 FY 2020-2021 Final Revised Budget
Police Department

OperatingFY 2020
AmendedFY 2021
Final Variance
General Fund 184,896,900 196,356,400 11,459,500
Special Revenue 8,234,300 9,219,000 984,700
Capital 465,300 194,900 (270,400)
Enterprise 2,050,000 3,000,900 950,900
Total Operating 195,646,500 208,771,200 13,124,700
Capital
Capital 5,930,800 130,000 (5,800,800)
Total Capital 5,930,800 130,000 (5,800,800)
Grand Total 202,961,300 210,274,600 7,313,300
Operating and Capital Appropriations by Fund Type FY 2021 Appropriation Fund Type Chart
Major Capital Projects by Appropriations
Police Department Fund Type FTE
Sworn Enterprise 1.00
General Fund 825.30
Special Revenue 11.00
Total Sworn 837.30
Civilian General Fund 292.30
Special Revenue 6.00
Total Civilian 298.30
Department Total FTE 1,135.60
Debt Service
Debt Service 1,384,000 1,373,400 (10,600)
Total Debt Service 1,384,000 1,373,400 (10,600)
Project Fund Type Amount
DC00002 - Regional Training Facility Capital 130,000 ## 1
Police Department Budget Snapshot
FY 2020-2021 Final Revised Budget B - 125
Police Department

Service Impacts
Approved Council Motions Per Revised Budget Hearings Per approved Council Motion #37, the following Council Motions were approved with adjustments: • Per Council Motion #29 $274,900 is
budgeted to assist the Department ofPublic Utilities address illegal dumping inthe community. The following are thepositions that will support this program:o $101,400 is budgeted for two (2)
Community Services Officer at .65 FTEeach;
o $173,500 is budgeted for two (2) PoliceOfficers at.65 FTE each.
Approved Council Motions Per Continuing Resolution Per Approved Council Motion #50.a moved the Graffiti Program and $1,186,500 in associated funding from the Police Department to the PARCS Department.
The Police Department’s Final Revised Budget totals $210,274,600, which is an increase of $7,313,300 or 3.4 percent increase from the FY 2020 Amended Budget. General Fund appropriations are increasing by $11,459,500, while the remaining funds are decreasing by $4,146,200.
General Fund increases of $11,459,500 over the FY 2020 Amended Budget are all associated with Operations of which $274,900 is attributable to Council Motion #37 from the Final Revised Budget and a reduction of $1,186,500 for Council Motion #50.a from the Continuing Resolution. The remaining balance of $12,371,100 includes: • $9,997,300 for various personnel costs
which include increases due to MOU, stepadvancements, pension contributions,
workers’ compensation as well as health and welfare contributions.
• $66,600 to fund FPD’s body cameraagreements:o $32,100 for year 1 of the renewal of
FPD’s body camera agreements. Costfor years 2-5 would experience a$32,100 savings as compared to the FY2020 contract.
o $34,500 for the addition of cameras onthree (3) prisoner transport vehicles.On-going costs for years 2-5 willdecrease by $30,000 to $4,500.
• $123,200 for CARES Act fundedexpenditures:o $102,500 for additional janitorial
services,o $10,200 for Records remodel,o $10,500 for Records switch.
• $1,763,800 net increase toInterdepartmental Charges to support therevenues needed by the various respectivefunds. Below is summary of significant IDcharge variances:o $588,100 Information Systems Service
Charge,o $433,200 Information Systems
Equipment Charge,o $117,300 Property Self-Insurance
Charge,o $838,300 Liability Self-Insurance
Charge,o $247,900 Telephone Charges,o $381,000 Fleet Service Charge,o ($255,200) Fleet Lease/Purchase
Payment,o ($195,100) Fleet Fuel Charges.
The FY 2021 Final Revised Budget excludes one-time FY 2020 expenditures, including capital. Below is a summary of one-time FY 2020 expenditures: • $111,800 for the replacement of 115
ballistic vests,
B - 126 FY 2020-2021 Final Revised Budget
Police Department

• $207,000 for Skywatch mandatoryscheduled maintenance,
• $26,800 for Netmotion and Verizon cardsfor 30 new patrol vehicles,
• $337,000 to upgrade two (2) AREOHelicopter Computers, currently onWindows XP, with computers on Windows10,
• $309,800 for handgun acquisition funded inFY 2020 using Fleet fuel savings.
Overall, the remaining funds in the FPD are decreasing by $4,146,200. The change is comprised of a reduction to Capital of $5,800,800, due to the completion of the Southeast Police Station, and partially offset by an increase to Operations of $1,665,200. Both the Operating and Capital components of these funds rely on incoming revenues from collected fees and or grant revenues to support the activities in the funds which include Federal, State and Local Grants, Patrol Support, Contract Law Enforcement Services, and Urban Growth Management Funds amongst others. It is important to note that expenses in these funds will only materialize if sufficient revenues are anticipated.
FY 2020-2021 Final Revised Budget B - 127
Police Department

Staffing The FY 2021 Final Revised Budget includes four new positions consistent with Council Motion #29, which added two (2) Community Service Officers and two (2) Police Officers at .65 FTE each for a total FTE increase of 2.6 FTE.
The Department’s FY 2021 staffing is decreasing by 9.4 Full Time Equivalents (FTE) when compared to the FY 2020 Amended Budget. This decrease is a result of Council
Motion #50.a - which reallocated 12 positions in the Graffiti Division from the Police Department to the PARCS Department and offset by the 2.6 FTE added in the Revised Budget.
The FY 2021 Final Revised Budget fully funds 837.3 FTE sworn positions. Ten sworn positions were previously funded as Cadets underfilling Sworn Positions in the FY 2020 Adopted Budget.
Department Staff Detail
Position Summary FY 2019 FY 2020 FY 2020 FY 2021 FY 2021
Division Adopted Adopted Amended Changes Final
Sworn Positions
Sworn 821.00 825.00 826.00 11.30 837.30
Cadets underfilling Sworn Positions 9.00 10.00 10.00 (10.00) 0.00
Subtotal Sworn 830.00 835.00 836.00 1.30 837.30
Civilian Positions 278.75 292.00 309.00 (10.70) 298.30
Total 1,108.75 1,127.00 1,145.00 (9.40) 1,135.60
Note:
The FY 2020 position changes are due to the following: Sworn: 1.00 FY 2019 5th PAR Amendment adds one authorized Police Officer Position @ 1.0 FTE.
1.00 Subtotal Sworn Position Change
Civilian: 1.00 FY 2019 2nd PAR Amendment adds one authorized Staff Assistant Position @1.0 FTE.
2.00 FY 2019 6th PAR Amendment adds two authorized Background Investigator Positions @2.0 FTE.
4.00 FY 2019 6th PAR Amendment adds four authorized Emergency Services Dispatcher I Positions @4.0 FTE.
3.00 FY 2019 6th PAR Amendment adds three authorized Property and Evidence Technician Positions @3.0 FTE.
5.00 FY 2019 6th PAR Amendment adds five authorized Police Support Services Clerk Positions @5.0 FTE.
2.00 FY 2019 6th PAR Amendment adds two authorized Laborer Positions @2.0 FTE.
17.00 Subtotal Civilian Position Change
18.00 Total FY 2020 Changes
B - 128 FY 2020-2021 Final Revised Budget
Police Department
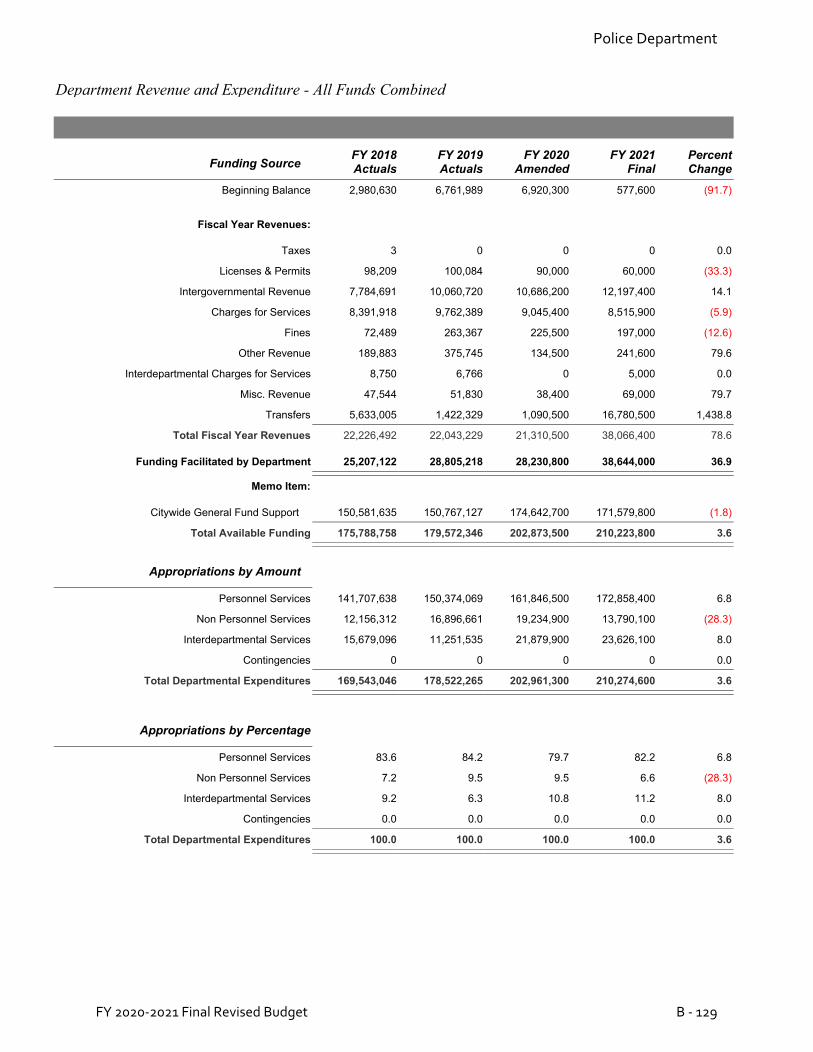
Department Revenue and Expenditure - All Funds Combined
Funding Source FY 2018Actuals
FY 2019Actuals
FY 2020Amended
FY 2021Final
PercentChange
Beginning Balance 2,980,630 6,761,989 6,920,300 577,600 (91.7)
Fiscal Year Revenues:
Taxes 3 0 0 0 0.0
Licenses & Permits 98,209 100,084 90,000 60,000 (33.3)
Intergovernmental Revenue 7,784,691 10,060,720 10,686,200 12,197,400 14.1
Charges for Services 8,391,918 9,762,389 9,045,400 8,515,900 (5.9)
Fines 72,489 263,367 225,500 197,000 (12.6)
Other Revenue 189,883 375,745 134,500 241,600 79.6
Interdepartmental Charges for Services 8,750 6,766 0 5,000 0.0
Misc. Revenue 47,544 51,830 38,400 69,000 79.7
Transfers 5,633,005 1,422,329 1,090,500 16,780,500 1,438.8
Total Fiscal Year Revenues 22,226,492 22,043,229 21,310,500 38,066,400 78.6
Funding Facilitated by Department 25,207,122 28,805,218 28,230,800 38,644,000 36.9
Memo Item:
Appropriations by Amount
Personnel Services 141,707,638 150,374,069 161,846,500 172,858,400 6.8
Non Personnel Services 12,156,312 16,896,661 19,234,900 13,790,100 (28.3)
Interdepartmental Services 15,679,096 11,251,535 21,879,900 23,626,100 8.0
Contingencies 0 0 0 0 0.0
Total Departmental Expenditures 169,543,046 178,522,265 202,961,300 210,274,600 3.6
Citywide General Fund Support 150,581,635 150,767,127 174,642,700 171,579,800 (1.8)
Total Available Funding 175,788,758 179,572,346 202,873,500 210,223,800 3.6
Appropriations by Percentage
Personnel Services 83.6 84.2 79.7 82.2 6.8
Non Personnel Services 7.2 9.5 9.5 6.6 (28.3)
Interdepartmental Services 9.2 6.3 10.8 11.2 8.0
Contingencies 0.0 0.0 0.0 0.0 0.0
Total Departmental Expenditures 100.0 100.0 100.0 100.0 3.6
FY 2020-2021 Final Revised Budget B - 129
Police Department

Department Appropriations by Fund Classification - FY 2021 Only
Resources GeneralFund
SpecialRevenues Capital Enterprise Internal
ServiceDebt
Service Total
Beginning Balance 0 1,672,900 (1,538,800) 443,500 0 0 577,600
Fiscal Year Revenues:
Taxes 0 0 0 0 0 0 0
Licenses & Permits 60,000 0 0 0 0 0 60,000
Intergovernmental Revenue 4,820,400 7,377,000 0 0 0 0 12,197,400
Charges for Services 5,748,500 210,000 0 2,557,400 0 0 8,515,900
Fines 47,000 150,000 0 0 0 0 197,000
Other Revenue 2,500 239,100 0 0 0 0 241,600
Interdepartmental Charges for Services 5,000 0 0 0 0 0 5,000
Misc. Revenue 69,000 0 0 0 0 0 69,000
Transfers 14,024,200 (330,000) 1,712,900 0 0 1,373,400 16,780,500
Total Fiscal Year Revenues 24,776,600 7,646,100 1,712,900 2,557,400 0 1,373,400 38,066,400
Funding Facilitated by Department 24,776,600 9,319,000 174,100 3,000,900 0 1,373,400 38,644,000
Memo Item:
Appropriations
Personnel Services 166,119,000 3,739,300 0 3,000,100 0 0 172,858,400
Non Personnel Services 6,843,300 5,247,700 324,900 800 0 1,373,400 13,790,100
Interdepartmental Services 23,394,100 232,000 0 0 0 0 23,626,100
Contingencies 0 0 0 0 0 0 0
Total Appropriations 196,356,400 9,219,000 324,900 3,000,900 0 1,373,400 210,274,600
Citywide General Fund Support 171,579,800 0 0 0 0 0 171,579,800
Total Available Funding 196,356,400 9,319,000 174,100 3,000,900 0 1,373,400 210,223,800
Department Appropriations by Fund Type
FY 2018Actuals
FY 2019Actuals
FY 2020Amended
FY 2021Final
(Amount)
FY 2021Final
(Percent)Operating 168,029,303 170,356,490 195,646,500 208,771,200 99.3
Capital 505,517 6,784,478 5,930,800 130,000 0.1
Debt Service 1,008,226 1,381,297 1,384,000 1,373,400 0.7
Total 169,543,046 178,522,265 202,961,300 210,274,600 100.0
B - 130 FY 2020-2021 Final Revised Budget
Police Department

Notes Department Revenue and Expenditures – All Funds Combined Table
1. This table reflects the consolidation of all fund that support operating and/or capital financialactivities.
2. The Citywide General Fund Support line-item reflects citywide General Fund revenues (i.e.,sales tax, property tax, etc.) captured in the General City Purpose Department and is utilized tocover the difference between General Fund revenues and expenditures facilitated by the abovedepartment.
3. Data may not add to the totals due to rounding.
Department Appropriations by Fund Classification – FY 2021 only Table 1. The Citywide General Fund Support line-item reflects citywide General Fund revenues (i.e.,
sales tax, property tax, etc.) captured in the General City Purpose Department and is utilized tocover the difference between General Fund revenues and expenditures facilitated by the abovedepartment.
Department Appropriations by Fund Type 1. Data may not add to the totals due to rounding.
FY 2020-2021 Final Revised Budget B - 131
Police Department

THIS PAGE WAS INTENTIONALLY LEFT BLANK.
B - 132 FY 2020-2021 Final Revised Budget

Public Utilities Department The Department of Public Utilities (DPU) provides reliable, efficient, low-cost water, wastewater and solid waste services. The DPU mission is to deliver high quality utility services professionally, efficiently and in an environmentally responsible manner to ensure the health and safety of our community.
The Administration Division coordinates all of the City’s utility services including oversight and support of its operating divisions in the areas of strategic business planning, performance improvement, resource management, organizational development, personnel and labor relations, fiscal management, project management, as well as utility planning and engineering.
The Water Division is responsible for delivering a reliable supply of safe, high quality and affordable water to both city and county residents in the Fresno metropolitan area for domestic, commercial, institutional and industrial use. More than 37.7 billion gallons were delivered in 2019 to 135,700 customer accounts through approximately 1,862 miles of water mains that met mandated state and federal drinking water standards. This consisted of 17.8 billion gallons of groundwater pumped from nearly 250 wells and 19.9 billion gallons of treated surface water from the Northeast Surface Water Treatment Facility (Behymer and Chestnut), the Southeast Surface Water Treatment Facility (Olive and
Fowler) and the T-3 Water Storage and Surface Water Treatment Facility (Dakota and Armstrong). Overall, this was an average of 102.9 million gallons each day (MGD).
Future water supply for treatment and recharge is assured through the purchase and utilization of surface water allocations from both the U.S. Bureau of Reclamation at Friant Dam and the Fresno Irrigation District from the Kings River, and an active conservation program. All capital components of the Recharge Fresno Program are complete and operational as of FY 2020. This will enable the City to meet the goals of the long-term planning to improve water supply reliability and replenish the groundwater by fully implementing a balanced conjunctive water management program.
In addition, the Division remains committed to outstanding customer service, extensive planning efforts, employee development, innovative use of technology, and keeping water rates among the most competitive in the state.
The Solid Waste Management Division is responsible for the collection of municipal solid waste, recyclables, green waste, and operation clean-up for 113,336 residential customers. The Division also has oversight of litter collection, and FresGO customer responses for 103 square miles within the Fresno city limits. These collection activities produce approximately 4,700 tons of material each week.
Community needs have resulted in the creation of various initiatives including: • The Homeless Task Force, a partnership of
Solid Waste staff along with the PoliceDepartment and other city personnel. Thistask force continues to manage wastematerials while respectfully handling and
FY 2020-2021 Final Revised Budget B - 133

storing the personal belongings of our community’s homeless population.
• Protect Blue initiatives including theaddition of Police Officers to Solid Wastestaffing. Recycling officers have effectivelycited or arrested over 970 recyclingsuspects for theft of recycling materials andhave cited over 38 illegal dumpers.
• CalRecycle also provided grant funding foroil and oil filter recycling. The Divisioncollected 11,660 gallons of oil and 17,850 ofoil filters for recycling at the curbside.
The Wastewater Management Division isresponsible for the collection, conveyance,treatment and reclamation of wastewatergenerated by the residential, commercial,and industrial sewer customers in theFresno-Clovis Metropolitan area.Wastewater from homes and businesses inthe Metropolitan area travels throughapproximately 1,600 miles of sanitarysewer lines maintained by the WastewaterManagement Division to the Fresno-ClovisRegional Wastewater Reclamation Facility(RWRF) located in southwest Fresno. TheDivision treats approximately 56 MGD ofwastewater at the North Fresno
Wastewater Reclamation Facility and the 91.5 MGD at the Fresno-Clovis RWRF. The North Fresno Wastewater Reclamation Facility provides recycled water for landscape irrigation at the Copper River Golf Course located in northeast Fresno. As of August 2017, with completion of construction of the first segment of a new recycled water distribution system, recycled water from the Fresno-Clovis RWRF became available to the first recycled water users for irrigation in southwest Fresno. As the remaining segments of the southwest recycled water distribution system are completed through June 2022, recycled water will become available to additional recycled water users.
Through the Industrial Pretreatment Program and the efficient and innovative operation and maintenance of the wastewater treatment and reclamation facilities as well as the collection system, the Division ensures compliance with federal and state regulations and permitting requirements while providing safe and reliable utility service consistent with customer, public health and ecological needs.
Public Utilities Department
B - 134 FY 2020-2021 Final Revised Budget

Solid Waste Management Division
Michael CarbajalDirector of
Public Utilities
Landfill
Field Services Conservation
DistributionRecycling
Wastewater Management Division
Water DivisionAdministrative Division
General AdministrativeServices
Utility Planning & Engineering (UP&E)
Utility Planning
Asset Management (Linear)
Asset Management (Vertical)
Capital Projects
Development Services
Operation
Maintenance
EnvironmentalServices
CollectionSystem
Recycled Water Treatment and Distribution
ProductionResidentialCollections
Litter Control
Operation Clean-up
Public Utilities Department
FY 2020-2021 Final Revised Budget B - 135

OperatingFY 2020
AmendedFY 2021
Final Variance
Enterprise 156,353,300 164,889,000 8,535,700
Internal Service Fund 4,662,700 4,760,600 97,900
Total Operating 161,016,000 169,649,600 8,633,600
Capital
Enterprise 115,499,000 105,556,400 (9,942,600)
Total Capital 115,499,000 105,556,400 (9,942,600)
Grand Total 341,979,200 323,701,400 (18,277,800)
Operating and Capital Appropriations by Fund Type FY 2021 Appropriation Fund Type Chart
Major Capital Projects by Appropriations
Department of PublicUtilities Fund Type FTE
Enterprise 541.10
Internal Service Fund 31.30
Capital Labor 16.60
589.00
Debt Service
Enterprise 65,464,200 48,495,400 (16,968,800)
Total Debt Service 65,464,200 48,495,400 (16,968,800)
Project Fund Type Amount
RC00177 - CollectionSystemRehabilitation Enterprise 7,106,800 ## 3
TC00154 - Renewable Gas Diversion Enterprise 9,334,500 ## 1
TC00159 - Flare Capacity Expansion Enterprise 7,467,900 ## 2
WC00020 - Granular Activated Carbon Enterprise 6,366,600 ## 4
WC00021 - Surface Water Treatment Plant Enterprise 5,192,100 ## 5
Department of Public Utilities Budget Snapshot
Department Total
Public Utilities Department
B - 136 FY 2020-2021 Final Revised Budget

Service Impacts
Approved Council Motions Per Revised Budget Hearings • Motion #2 established $2,713,600 for the
completion of the Convenience Center.• Motion #29 added two (2) additional
Community Service Officers to the PoliceDepartment at a cost of $101,400 toprovide illegal dumping support to theSolid Waste Division and two (2) additionalPolice Officers, subsequently, Motion #37identified illegal dumping as the primaryresponsibilities of the Police Officers,therefore $173,500 has been included toreimburse the Police Department for thesepositions.
• Motion #32 eliminated any new positionrequests submitted in the FY 2021 RevisedBudget. This motion reduced the RevisedBudget by $242,000 for the Fire HydrantRepair and Replacement crew in the WaterDivision and by $148,700 for the TrenchlessMainline Repair crew in the Waste WaterDivision. The positions eliminatedincluded:o One (1) .65 FTE Sr. Water Distribution
Operator,o Two (2) .65 FTE Laborers,o Two (2) .65 FTE Water
Distribution/Production Technicians,o One (1) .65 Collection System,
Maintenance Specialist,o Two (2) .65 FTE Collection System
Maintenance Technicians effective
The Department of Public Utilities’ (DPU) total FY 2021 Final Revised Budget is $323,701,400. Operating is budgeted at $169,649,600, an increase of $8,633,600 or 5.4 percent more than the FY 2020 Amended Budget; Debt Service is budgeted at $48,495,400, a decrease of $16,968,800 or 25.9 percent less than the FY
2020 Amended Budget and Capital is budgeted at $105,556,400, a decrease of $9,942,600 or 8.6 percent less than the FY 2020 Amended Budget.
DPU’s combined Operating budget increase of $8,633,600 include increases of $3,057,800 to Personnel Services, $2,462,700 to Non Personnel Services, and $3,113,100 to Interdepartmental Services.
Personnel Services increases of $3,057,800 include a department-wide combined increase of $213,000 to the Workers’ Compensation Charge. The remaining increase of $2,844,800 consists of various personnel costs which include increases due to negotiated Memorandum of Understanding salary provisions, full year costing of positions approved in FY 2020, step advancements, pension contributions and health and welfare contributions.
Interdepartmental Services Charge growth of $3,113,100 is mainly comprised of increases in Fleet Services due to labor rate adjustments, increases in reimbursements to the Utilities Billing and Collection Division (UB&C) due to a projected reduction in penalty fee revenues as a result of the City Council approved moratorium on shut-offs and charging late fees for non-payment in response to the COVID-19 pandemic in addition to increases to fire hydrant inspection fees paid to the Fire Department by the Water Division.
Debt Service decreases of $16,968,800 include full payoff of the Sewer Bond Debt and Central Valley Project contract deficit completed in FY 2020 offset by the inclusion of $25 million to pay off the 2010 Water Revenue Bonds A-1 in FY 2021. This early defeasance is anticipated to generate future interest savings of over $2.5 million.
Public Utilities Department
FY 2020-2021 Final Revised Budget B - 137

WATER DIVISION The Water Division’s FY 2021 Final Revised Budget for Operating is $69,124,800, an increase of $1,108,400 more than the FY 2020 Amended Budget. This change constitutes an increase of $885,900 to Personnel Services, a decrease of $690,600 to Non Personnel Services and an increase of $913,100 to Interdepartmental Services. Interdepartmental Services Charges are mainly attributable to greater reimbursements to the Fire Department for fire hydrant inspection fees, higher reimbursements to the Utilities Billing and Collection Division due to a projected reduction in penalty fee revenues as a result of the moratorium on shut-offs and charging late fees for non-payment in response to the COVID-19 pandemic. This is offset by smaller reductions in various other line items. Significant changes to the FY 2021 Final Revised Budget are detailed below and are offset by completion, elimination or reallocation of one time appropriations in FY 2020.
Vehicle Acquisition and Replacement The Water Division has included $823,500 for the acquisition, replacement, upgrade and operational costs of critical vehicles and equipment in FY 2021. Equipment to be acquired, replaced or upgraded includes: • $10,400 for a Dump Trailer for Leaky Acres
to be used for transporting material andequipment for the maintenance ofrecharge facilities. It will reduce the needfor multiple employees and vehicles tocomplete maintenance activities. Thistrailer is needed to transport a lawn mower,very large landscaping debris piles, dirt toand from basins and rip-rap betweenponds.
• $125,300 for a Two-Ton Service Truck witha utility bed to be used by a PowerGeneration/Operator Mechanic (PGOM).This vehicle will allow the PGOM toeffectively and safely perform all requireddaily tasks including towing a loadbank,rental gensets, transporting oil and coolantdrums; as well as carrying and lifting heavygenerator parts.
• $104,700 for the upgrade of One (1)Excavator to a Backhoe because the currentunit is too small and no longer meets theDivision’s needs; specifically, the amountand type of excavation that is performed ona daily basis. A backhoe does not need tobe hauled by a trailer to job sites like anexcavator does. This allows for moreflexibility and quicker responses toemergency situations.
• $302,700 to fully fund several scheduledvehicle replacements which have reachedthe end of their useful life and do not havesufficient depreciation monies available tocover the replacement costs.
SOLID WASTE MANAGEMENT DIVISION The Solid Waste’s Division FY 2021 Final Revised Operating Budget is $44,723,400, a growth of $2,317,000 more than the FY 2020 Amended Budget. This includes an increase of $814,900 to Personnel Services, and increase of $1,176,600 to Non Personnel Services and a decrease of $214,500 to Interdepartmental Service Charges. Interdepartmental Service Charges are cumulatively comprised of increases to Fleet Charges that reflect an increase to the labor rate offset by reductions to equipment replacement costs. Significant changes to the FY 2021 Final Revised Budget are detailed below and are offset by completion, elimination or reallocation of one time appropriations in FY 2020.
Public Utilities Department
B - 138 FY 2020-2021 Final Revised Budget

Landfill Tipping Fees $1,068,200 is included to cover price per ton recycling contract fee increases, in addition to an anticipated 2 percent growth in trash and a 43 percent increase in recycling residual. Much of this increase is due to the current market value of recyclables and is not expected to rebound any time soon.
Equipment Replacements The Division has included $5,535,300 in FY 2021 for the replacement of thirteen (13) side loader trucks and one (1) rear loader truck. These vehicles have reached the end of life and are included in the recurring annual replacement schedule.
Public Utilities Administrative Building Appropriations for the acquisition of a property that will house the administrative functions of the Department have been included in the capital section of this Department, Solid Waste will be funding its respective share of the acquisition through an intradepartmental loan from the Water Division. The first year’s annual payment of $685,600 has been included in this budget.
WASTEWATER MANAGEMENT DIVISION The Waste Water Management’s Division FY 2021 Final Revised Operating budget is $51,040,800, a growth of $5,110,300 more than the FY 2020 Amended Budget. This includes an increase of $1,021,000 to Personnel Services, an increase of $1,472,800 to Non Personnel Services and an increase of $2,616,500 to Interdepartmental Services. Significant changes to the FY 2021 Final Revised Budget are detailed below and are offset by completion, elimination or reallocation of one time appropriations in FY 2020.
Biosolids Hauling $828,600 has been included for hauling of biosolids for beneficial reuse based on an anticipated increase in pricing in FY 2021 and increases to actual total tonnage.
Laboratory’s Information System $310,800 has been included to migrate the Laboratory’s Information Management System (LIMS) database currently housed on an Oracle virtual server to a Cloud based server. Due to high licensing costs, Oracle is being phased out of the City’s system making this move necessary to continue maintaining critical data.
Electricity Costs In anticipation of proposed PG&E rate increases and implementation of Time of Use (TOU) cost adjustments the Division is budgeting for an additional $658,400 to cover the increase.
Polymer Polymers are used in waste water treatment to coagulate solids and help manage the process of drying and consolidating sludge. Due to anticipated increase in biosolids tonnage requiring additional polymer and contractual price increases effective September 1, 2020, $884,900 has been included.
Vehicle and Equipment Replacements The Wastewater Management Division has included $2,326,700 for the acquisition of new equipment and replacement vehicles which have reached the end of their useful life. This includes $75,300 for two (2) tow behind 14,000 watt solar light towers to facilitate the safe completion of repairs and maintenance extending beyond daylight hours. The remaining $2,251,400 will be used for up fitting vehicles and equipment being replaced as they have reached the end of their useful life and are aligned with the typical replacement schedule.
Public Utilities Department
FY 2020-2021 Final Revised Budget B - 139

Capital Program DPU’s combined capital appropriations are budgeted at $105,556,400, a reduction of $9,942,600 or 8.6 percent less than the FY 2020 Amended Budget. The largest contributor to the decrease include significant completion and reductions to project appropriations as compared to the to the FY 2020 Amended Budget. Some of the higher reductions to projects that are winding down in FY 2021 or were completed in FY 2020 and include: • $12.5 million reduction to WC00021-
Surface Water Treatment Plant.
• $11 million reduction to WC00005-WaterMain Renewals.
• $8 million reduction to WC00057-SE FresnoSurface Water Treatment plan.
These decreases were offset by increases to the FY 2021 Capital Program which is discussed in greater detail in the Capital Section of this book. The top five highest funded projects in the FY 2021 Final Revised Budget are highlighted under the Department Snapshot located prior to the start of the Service Impact section.
Public Utilities Department
B - 140 FY 2020-2021 Final Revised Budget

Staffing Motion #32 eliminated any new position requests submitted in the FY 2021 Final Revised Budget. This motion reduced the Final Revised Budget by $242,000 for the Fire Hydrant Repair and Replacement crew in the Water Division and by $148,700 for the Trenchless Mainline Repair crew in the Waste Water Division. The positions eliminated included: • One (1) .65 FTE Sr. Water Distribution
Operator,• Two (2) .65 FTE Laborers,
• Two (2) .65 FTE WaterDistribution/Production Technicians,
• One (1) .65 Collection System,Maintenance Specialist,
• Two (2) .65 FTE Collection SystemMaintenance Technicians effective
In FY 2021, the Department of Public Utilities total FTE is increasing by 1.25 FTE. The increase reflects the addition of 1.25 FTE for five (5) positions approved in FY 2020 which are initially budgeted at .75 FTE and increase by .25 FTE the following year.
Department Staffing Detail
Position Summary FY 2019 FY 2020 FY 2020 FY 2021 FY 2021
Division Adopted Adopted Amended Changes Final Administration Division 40.00 38.00 38.00 0.00 38.00
Utility Billing &Collection 1 63.00 0.00 0.00 0.00 0.00 Water Operations Division 2 192.00 194.00 194.00 1.00 195.00
Solid Waste Division 3 170.80 174.75 174.75 1.25 176.00 Wastewater Management Division 2 181.00 181.00 181.00 (1.00) 180.00
Total 646.80 587.75 587.75 1.25 589.00
Note: 1 In FY 2020 the UB&C Division moved to the Finance Department. 2 FY 2021 changes include the reallocation of 1.0 FTE from the Waste Water Division to the Water Division. 3 FY 2021 changes of 1.25 FTE are due to three (3) new positions approved at .75 FTE each in FY 2020.
Public Utilities Department
FY 2020-2021 Final Revised Budget B - 141

Department Revenue and Expenditure - All Funds Combined
Funding Source FY 2018Actuals
FY 2019Actuals
FY 2020Amended
FY 2021Final
PercentChange
Beginning Balance (4,717,741) 150,752,567 209,273,300 222,105,100 6.1
Fiscal Year Revenues:
Taxes 2,749 2,148 2,500 2,800 12.0
Licenses & Permits 0 0 0 0 0.0
Intergovernmental Revenue 4,477,841 3,394,785 4,636,800 8,254,800 78.0
Charges for Services 222,697,567 229,477,432 231,191,500 233,567,300 1.0
Fines 2,472,013 2,443,145 0 0 0.0
Other Revenue 4,932,388 6,795,245 3,854,900 6,532,900 69.5
Interdepartmental Charges for Services 7,554,358 7,966,800 3,517,300 3,743,100 6.4
Misc. Revenue 161,804,300 50,575,398 50,139,300 50,964,000 1.6
Transfers (401,950) 2,308,174 (15,511,300) 1,204,200 (107.8)
Total Fiscal Year Revenues 403,539,266 302,963,126 277,831,000 304,269,100 9.5
Funding Facilitated by Department 398,821,524 453,715,693 487,104,300 526,374,200 8.1
Memo Item:
Appropriations by Amount
Personnel Services 48,496,981 51,267,350 62,752,300 69,735,400 11.1
Non Personnel Services 169,557,938 166,381,542 238,694,400 210,169,600 (12.0)
Interdepartmental Services 34,723,125 35,421,591 40,532,500 43,796,400 8.1
Contingencies 0 0 0 0 0.0
Total Departmental Expenditures 252,778,044 253,070,483 341,979,200 323,701,400 (5.3)
Citywide General Fund Support 0 (4,278) 0 0 0.0
Total Available Funding 398,821,524 453,711,415 487,104,300 526,374,200 8.1
Appropriations by Percentage
Personnel Services 19.2 20.3 18.3 21.5 11.1
Non Personnel Services 67.1 65.7 69.8 64.9 (12.0)
Interdepartmental Services 13.7 14.0 11.9 13.5 8.1
Contingencies 0.0 0.0 0.0 0.0 0.0
Total Departmental Expenditures 100.0 100.0 100.0 100.0 (5.3)
Public Utilities Department
B - 142 FY 2020-2021 Final Revised Budget

Department Appropriations by Fund Classification - FY 2021 Only
Resources GeneralFund
SpecialRevenues Capital Enterprise Internal
ServiceDebt
Service Total
Beginning Balance 0 0 0 221,128,000 977,100 0 222,105,100
Fiscal Year Revenues:
Taxes 0 0 0 2,800 0 0 2,800
Licenses & Permits 0 0 0 0 0 0 0
Intergovernmental Revenue 0 0 0 8,254,800 0 0 8,254,800
Charges for Services 0 0 0 233,540,400 26,900 0 233,567,300
Fines 0 0 0 0 0 0 0
Other Revenue 0 0 0 6,514,800 18,100 0 6,532,900
Interdepartmental Charges for Services 0 0 0 0 3,743,100 0 3,743,100
Misc. Revenue 0 0 0 50,962,800 1,200 0 50,964,000
Transfers 0 0 0 1,115,500 88,700 0 1,204,200
Total Fiscal Year Revenues 0 0 0 300,391,100 3,878,000 0 304,269,100
Funding Facilitated by Department 0 0 0 521,519,100 4,855,100 0 526,374,200
Memo Item:
Appropriations
Personnel Services 0 0 0 65,869,700 3,865,700 0 69,735,400
Non Personnel Services 0 0 0 209,983,500 186,100 0 210,169,600
Interdepartmental Services 0 0 0 43,087,600 708,800 0 43,796,400
Contingencies 0 0 0 0 0 0 0
Total Appropriations 0 0 0 318,940,800 4,760,600 0 323,701,400
Citywide General Fund Support 0 0 0 0 0 0 0
Total Available Funding 0 0 0 521,519,100 4,855,100 0 526,374,200
Department Appropriations by Fund Type
FY 2018Actuals
FY 2019Actuals
FY 2020Amended
FY 2021Final
(Amount)
FY 2021Final
(Percent)Operating 138,907,397 145,506,273 161,016,000 169,649,600 52.4
Capital 74,834,384 65,932,417 115,499,000 105,556,400 32.6
Debt Service 39,036,263 41,631,793 65,464,200 48,495,400 15.0
Total 252,778,044 253,070,483 341,979,200 323,701,400 100.0
Public Utilities Department
FY 2020-2021 Final Revised Budget B - 143
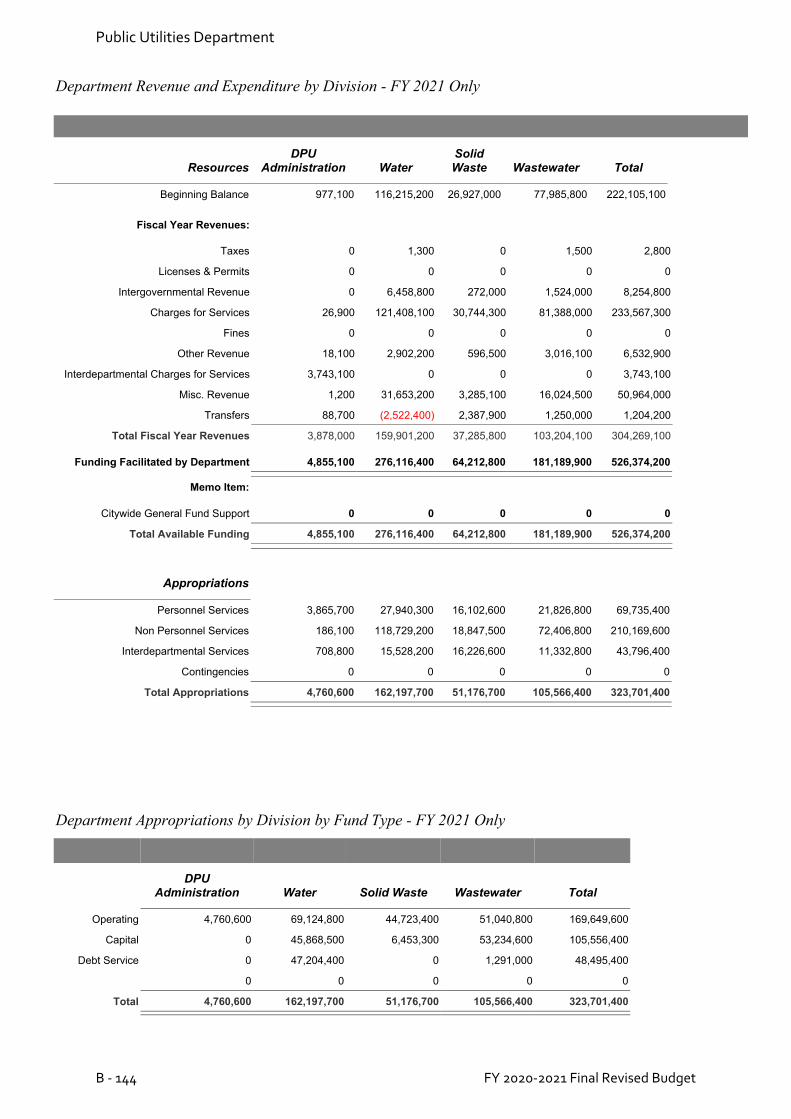
Department Revenue and Expenditure by Division - FY 2021 Only
ResourcesDPU
Administration WaterSolidWaste Wastewater Total
Beginning Balance 977,100 116,215,200 26,927,000 77,985,800 222,105,100
Fiscal Year Revenues:
Taxes 0 1,300 0 1,500 2,800
Licenses & Permits 0 0 0 0 0
Intergovernmental Revenue 0 6,458,800 272,000 1,524,000 8,254,800
Charges for Services 26,900 121,408,100 30,744,300 81,388,000 233,567,300
Fines 0 0 0 0 0
Other Revenue 18,100 2,902,200 596,500 3,016,100 6,532,900
Interdepartmental Charges for Services 3,743,100 0 0 0 3,743,100
Misc. Revenue 1,200 31,653,200 3,285,100 16,024,500 50,964,000
Transfers 88,700 (2,522,400) 2,387,900 1,250,000 1,204,200
Total Fiscal Year Revenues 3,878,000 159,901,200 37,285,800 103,204,100 304,269,100
Funding Facilitated by Department 4,855,100 276,116,400 64,212,800 181,189,900 526,374,200
Memo Item:
Appropriations
Personnel Services 3,865,700 27,940,300 16,102,600 21,826,800 69,735,400
Non Personnel Services 186,100 118,729,200 18,847,500 72,406,800 210,169,600
Interdepartmental Services 708,800 15,528,200 16,226,600 11,332,800 43,796,400
Contingencies 0 0 0 0 0
Total Appropriations 4,760,600 162,197,700 51,176,700 105,566,400 323,701,400
Citywide General Fund Support 0 0 0 0 0
Total Available Funding 4,855,100 276,116,400 64,212,800 181,189,900 526,374,200
Department Appropriations by Division by Fund Type - FY 2021 Only
DPUAdministration Water Solid Waste Wastewater Total
Operating 4,760,600 69,124,800 44,723,400 51,040,800 169,649,600
Capital 0 45,868,500 6,453,300 53,234,600 105,556,400
Debt Service 0 47,204,400 0 1,291,000 48,495,400
0 0 0 0 0
Total 4,760,600 162,197,700 51,176,700 105,566,400 323,701,400
Public Utilities Department
B - 144 FY 2020-2021 Final Revised Budget
Notes Department Revenue and Expenditures – All Funds Combined Table
1. This table reflects the consolidation of all funds that support operating and/or capital financialactivities.
2. The Citywide General Fund Support line-item reflects citywide General Fund revenues (i.e.,sales tax, property tax, etc.) captured in the General City Purpose Department and is utilized tocover the difference between General Fund revenues and expenditures facilitated by the abovedepartment.
3. Data may not add to the totals due to rounding.4. Negative beginning fund balance is the result of timing differences associated with state low
interest loans. Funds are first expended and then reimbursed from the loan proceeds. Basedon the timing of expenditures, reimbursement funds may be received in the following year.
5. Data in the columns prior to FY 2020 include UB&C results. In FY 2020 UB&C was reportedunder the Finance Department.
Department Appropriations by Fund Classification – FY 2021 only Table 1. The Citywide General Fund Support line-item reflects citywide General Fund Revenues (i.e.,
sales tax, property tax, etc.) captured in General City Purpose Department and is utilized tocover the difference between General Fund revenues and expenditures facilitated by the abovedepartment.
2. Data in the columns prior to FY 2020 include UB&C results. In FY 2020 UB&C was reportedunder the Finance Department.
Department Appropriations by Fund Type 1. Data may not add to the totals due to rounding.
Department Appropriations by Enterprise Division – FY 2021 only Table 1. The Citywide General Fund Support line-item reflects citywide General Fund revenues (i.e.,
sales tax, property tax, etc.) captured in the General City Purpose Department and is utilized tocover the difference between General Fund revenues and expenditures facilitated by the abovedepartment.
2. Data in the columns prior to FY 2020 include UB&C results. In FY 2020 UB&C was reportedunder the Finance Department.
Public Utilities Department
FY 2020-2021 Final Revised Budget B - 145
THIS PAGE WAS INTENTIONALLY LEFT BLANK.
B - 146 FY 2020-2021 Final Revised Budget
Public Works Department The Public Works Department focuses on building and maintaining the critical backbone infrastructure of the City such as streets, sidewalks, traffic signals, streetlights, median islands, street trees, landscaping, trails and public facilities to support the goals of neighborhood revitalization, economic development, public safety, sustainability and air quality.
The Department implements these goals through providing various services such as: • Transportation planning,• Infrastructure plan review and approval,• Permit inspections,• Impact fee administration,• Traffic operations,• Project management,• Design services,• Right-of-Way acquisition,• Construction management,• Facilities management,• Community Facilities Districts (CFD’s),• Street maintenance and,• Landscape maintenance
The Department’s mission of Building a Better Fresno summarizes these services and the commitment of its staff to serve the citizens of Fresno.
FY 2020-2021 Final Revised Budget B - 147

Scott L. MozierPublic Works Director
Administration Division
Finance/Budget
Construction Management
Division
Administration Division
Grant Administration
Clerical Support
Design Services
Right-of-Way Acquisition
Plan Check
Street Administration
Engineering Division
ADA Citywide Program
Traffic Signals & Streetlights
Paint Shop
Tree Trimming
Concrete Repair
Street Maintenance Median Island/LLMD/CFD
Street Maintenance
Division
Project Management
Survey
Facilities Management
Division
Reimbursable Capital
Contract & Maintenance Management
Administration
Park Maintenance
Street Sweeping
Landscape Maintenance
Division
Trails
Traffic Operations & Planning
Division
Special Districts/Projects
GIS/UGM Mapping
Traffic Planning
Intelligent Transportation Systems (ITS)
Sustainability Division
Traffic Operations
Parcel Maps & Subdivisions
Capital Inspection
Subdivision Inspection
Pavement Management
Fulton Street Maintenance
B - 148 FY 2020-2021 Final Revised Budget
Public Works Department

OperatingFY 2020
AmendedFY 2021
Final Variance
General Fund 9,089,600 9,556,300 466,700
Special Revenue 27,744,900 31,025,500 3,280,600
Capital 6,444,100 7,157,100 713,000
Enterprise 18,484,800 19,193,800 709,000
Internal Service Fund 14,418,300 18,132,000 3,713,700
Total Operating 76,181,700 85,064,700 8,883,000
Capital
General Fund 3,940,900 1,116,800 (2,824,100)
Special Revenue 138,117,900 172,238,900 34,121,000
Capital 13,849,200 16,942,600 3,093,400
Enterprise 4,695,500 2,970,700 (1,724,800)
Total Capital 160,603,500 193,269,000 32,665,500
Grand Total 236,924,400 278,472,600 41,548,200
Operating and Capital Appropriations by Fund Type FY 2021 Appropriation Fund Type Chart
Major Capital Projects by Appropriations
Public Works Department Fund Type FTE
General Fund 47.93
Special Revenue 101.70
Capital 26.55
Enterprise 81.05
Internal Service Fund 20.20
Capital Labor 80.57
358.00
Debt Service
Debt Service 139,200 138,900 (300)
Total Debt Service 139,200 138,900 (300)
Project Fund Type Amount
PW00783 - HSR "G"St Rlgnmnt CA -Snta Ana Special Revenue 6,967,900 ## 3
PW00862 - TCC Chinatown Project Special Revenue 10,807,400 ## 2
PW00883 - Veterans Blv Conn Shaw-Barstow Special Revenue 5,975,500 ## 5
PW00927 - Vets Pha3 SR99 Int & Grade Sep Capital 700,000 ## 1
Special Revenue 54,739,900 ## 1
PW00937 - Blackstone-McKinley Grade Separation Special Revenue 6,030,000 ## 4
Public Works Department Budget Snapshot
Department Total
FY 2020-2021 Final Revised Budget B - 149
Public Works Department

Service Impacts
Approved Council Motions Per Revised Budget Hearings Motion #25 added $250,000 to fund a Truck Study in partnership with the San Joaquin Valley Air Control District.
Motion #32 eliminated three new positions requested by the Department in FY 2021 as well as the transfer of the DBE Small Business Coordinator position from the Finance Department to the Public Works Department.
The Public Works Department is funded through a variety of sources such as the General Fund, various federal, state and local transportation related funds, and developer fees and charges. Total appropriations in FY 2021 are budgeted at $278,472,600, which is an increase of $41,548,200 when compared to the FY 2020 Amended Budget.
The Department’s operating appropriations are budgeted at $85,064,700, which is an increase of $8,883,000 and is primarily attributable to the following: realignment of expenditures with available resources; contractual salary increases; a four percent increase in Health & Welfare; a General Services Pension increase from 11.11 percent to 13.03 percent.
The Department’s capital projects are budgeted at $193,269,000, which is an increase of $32,665,500 and is attributable to the addition of new capital projects in FY 2021.
General Fund In FY 2021, General Fund appropriations are budgeted at $10,673,100, which is a decrease of $2,357,400 when compared to the FY 2020 Amended Budget. The decreased is primarily attributable to the completion of capital projects and one-time funding for projects in FY 2020, as well as a shift to other available
capital funding sources in FY 2021. Of the total appropriations, $9,556,300 is dedicated to operating programs and $1,116,800 is budgeted toward capital projects. Of the capital projects, $316,200 is dedicated to the ADA Compliance project at the Convention Center.
Gas Tax In FY 2021, Gas Tax appropriations across all funds are budgeted at $28,214,200 or an increase of $2,464,100 when compared to the FY 2020 Amended Budget. The increased appropriations are attributable to larger than anticipated prior year carryovers and increased state revenue due to regulation changes associated with the Road Repair and Accountability Act of 2017 (SB1 Beall). Of the total appropriations, $19,361,900 is dedicated to operating programs and $8,852,300 is dedicated to capital projects.
Special Gas Tax – This funding source is used exclusively for the Traffic Signal and Streetlight (TSSL) Program. In FY 2021, appropriations are budgeted at $5,088,800, which is a decrease of $505,500 as compared to the FY 2020 Amended Budget. The decrease is attributable to one-time vehicle purchases in FY 2020.
Proposition 111 – Prop 111 funds Street Maintenance, TSSL operations and serves as a capital grant match. In FY 2021, appropriations are budgeted at $3,183,800, which is an increase of $139,800. While capital grant match expenditures are decreasing by $598,700, TSSL appropriations are increasing by $713,100 which will primarily be used to replace a Digger Derrick Truck and two Bucket Trucks.
ABX8 6 Gas Tax – This funding source is used for Street Maintenance operations and capital projects. In FY 2021, appropriations are budgeted at $5,636,600, which is an increase of
B - 150 FY 2020-2021 Final Revised Budget
Public Works Department

$2,931,000. Street Maintenance operating appropriations are increasing by $1,540,600 and will be used in part to purchase/replace much needed equipment such as a Water Truck, Stencil Truck, two Half-Ton Trucks, a Skip Loader, a Trailer Mounted Air Compressor, and two LED Arrow Board Trailers.
SB1 Gas Tax – This funding source primarily supports Street Maintenance operations and capital projects. In FY 2021, appropriations are budgeted at $14,305,000, which is a decrease of $101,200. Street Maintenance operating appropriations are increasing by $2,148,000 and will be used in part to purchase/replace much needed equipment such as one Half-Ton Truck, two Concrete Finisher Trucks, a Water Truck, a Dump Truck, and four Backhoe Jackhammer attachments.
Measure C Extension Fund One of the Department’s major funding sources comes from the Measure C Extension, which is tied to sales tax so as consumers increase their purchasing, revenue increases. Revenue for the Program is distributed by the Fresno County Transportation Authority (FCTA) through five Sub-Programs: • Street Maintenance / Rehabilitation• Flexible Program• ADA Compliance• Pedestrian Trails• Bicycle Facilities
In FY 2021, Measure C Extension appropriations across all funds are budgeted at $14,678,300 or a decrease of $243,900 when compared to the FY 2020 Amended Budget. Of the total appropriations, $10,770,500 is dedicated to operating programs and $3,907,800 is dedicated to capital projects. As mentioned above, FY 2021 Measure C operating and capital appropriations are projected to decrease by $243,900 or 1.6 percent due to the COVID-19 pandemic. The slight decrease in
appropriations will mainly affect capital projects, which have been shifted to other available funding sources or delayed until additional Measure C appropriations become available.
Measure C Street Maintenance – This funding source primarily supports Street Maintenance operations and capital projects and in FY 2021, appropriations are budgeted at $5,418,400, which is a decrease of $552,900. The decrease is mainly due to the reallocation of operating costs to other funding sources as well as the completion of capital projects in FY 2020 and/or the reallocation of funding for projects in FY 2021. Street Maintenance operations will be purchasing a much needed Color Thermoplastic Pre-Melter for the Pavement Marking Truck.
Measure C Flexible – This funding source supports a number of traffic related services throughout the Department and in FY 2021, appropriations are budgeted at $5,712,600 with $5,352,100 dedicated to operations and $360,500 toward capital projects. The majority of the operating funding is budgeted in Engineering at $1,013,600 for design services, in Traffic Operations and Planning at $1,871,900 and in TSSL at $1,747,500 for utility payments. Construction Management and TSSL will be replacing two Half-Ton Trucks and one Cargo Van.
Measure C ADA Compliance – This funding source is dedicated to ADA compliance capital projects such as curb cuts and concrete repairs and in FY 2021, appropriations are budgeted at $451,000.
Measure C Pedestrian Trails – This funding source is dedicated to pedestrian trail capital projects and in FY 2021, appropriations are budgeted at $1,923,900. Projects of note include: $701,000 for the Fancher Creek Trail
FY 2020-2021 Final Revised Budget B - 151
Public Works Department
project; $770,000 for the McKinley Avenue Trail project; and, $114,700 is budgeted for the HAWK Trail project.
Measure C Bicycle Facilities – FY 2021 funding for bicycle capital projects is budgeted at $1,172,400. Projects of note include: $62,000 for the Maple Avenue Cycle Track and Pedestrian Trail; and, $597,500 for the First Street Cycle Track from Tulare to Ventura.
Vehicles/Equipment Leases The Street Maintenance Division is leasing two Street Sweepers in FY 2021. This requires $8,000 for the up-fit of the sweepers; however, this expense is separate and is not included in the lease amount. The first year lease payment is budgeted at $100,500.
Street Maintenance Operating Programs Funding for Street Maintenance operations is budgeted at $23,915,300 in FY 2021, which is an increase of $3,209,000 when compared with the FY 2020 Amended Budget. Of the increase, $1,368,200 is budgeted for new hire Cal APA Asphalt training classes, cubicle repairs and replacements, and vehicles and equipment. The following are the prominent Street Maintenance Operating Programs of note:
Overlay / Paving Operations: Funding for this Program is budgeted at $9,084,100, which is an increase of $1,726,000 in FY 2021. This budget estimates the projected number of lane miles to be paved at 52.6. The actual number of lane miles paved is dependent on the variable cost of materials as well as the degree of work involved such as paving shorter rough sections versus major street re-paving.
Slurry Seal: Slurry seal is the most cost-effective method to extend pavement life through preventive maintenance and at a fraction of the cost of repairing. Funding for
this Program is increasing by $647,900 to $1,656,800 in FY 2021.
Emergency Street Service Repairs: Similar in scope to Street Maintenance Repairs, the Emergency Street Service Program responds to weather related and after hour street emergencies. Funding for this Program is budgeted at $350,000 in FY 2021.
Concrete Strike Team: This Program consists of three concrete crews with two crews assigned to the SB1 Gas Tax Program and a third crew assigned to the 7-Week Concrete Program. The 7-Week Program dedicates one concrete crew for 7 weeks in each of the seven Council Districts. Funding for the Concrete Program is budgeted at $3,144,400 in FY 2021.
Crack Seal Program: Crack sealing provides a documented effective proactive treatment to extend pavement life. Funding for this Program is budgeted at $250,000 in FY 2021.
Street Maintenance Repairs: Unlike the larger scope of Overlay/Paving operations or the smaller scope of pothole repairs, Street Maintenance Repair operations perform smaller street patch and paving treatments. Funding for this Program is remaining consistent at $450,000 in FY 2021.
Pothole Repair Program: As with the Crack Seal Program, the Pothole Repair Program is designed to temporarily extend the life of the asphalt. Funding for this Program is remaining consistent at $725,000 in FY 2021.
Street Cleaning: This Program removes approximately 6,700 tons of particulate matter and sediment from the City’s 1,740 miles of roadway annually. This is particulate matter that would have otherwise found its way into our streams, ponds and air. Funding for this Program is budgeted at $3,673,000 in FY 2021.
B - 152 FY 2020-2021 Final Revised Budget
Public Works Department

Landscape Maintenance Funding for the Landscape Maintenance Program is budgeted at $17,108,000 in FY 2021, which is an increase of $772,700 when compared with the FY 2020 Amended Budget. The variance is primarily attributable to Personnel Services increases such as contractual salary increases, a four percent increase in Health & Welfare and a General Services Pension increase from 11.11 percent to 13.03 percent. The following are the prominent programs of note:
Street Tree Maintenance: Funding for this Program is budgeted at $1,269,300 or a decrease of $246,900. The decrease is attributable to a decrease in available Community Sanitation funding and will result in a significant reduction in proactive tree trimming and a reduction in tree replacements.
Median/Buffer Maintenance: Median Islands is budgeted at $4,346,400, which is a $41,600 decrease when compared to the FY 2020 Amended Budget. The decrease will reduce the number of irrigation improvements in FY 2021.
Landscape Lighting & Maintenance District/ Community Facilities District: LLMD/CFD Program appropriations are budgeted at $7,180,900 or an increase of $715,500. The increase is primarily driven by a $367,600 increase in Personnel Services costs as well as the replacement of needed vehicles and equipment totaling $315,500.
Park Maintenance: Appropriations for this Program are budgeted at $2,998,300 or an increase of $117,000. The increase is driven by increases in Personnel Services.
Traffic Signals & Streetlights (TSSL) Operating appropriations are budgeted at $8,844,200, which is an increase of $425,600 as compared to the FY 2020 Amended Budget.
The increase is attributable to the replacement of a Digger Derrick Truck and two Bucket Trucks totaling $627,900.
Facilities Maintenance In FY 2021, appropriations are budgeted at $18,873,400, of which, $18,255,800 is dedicated to operating and $617,600 is budgeted in non-operating appropriations. A total of $87,000 has been budgeted for citywide Form 10 requests. These requests include: $7,700 for ADA compliant doors in the City Clerk’s Office; $10,200 for a remodel in the Records Section of the Fire Department; a total of $44,100 in Public Works requests for cubicle replacements, a conference room projector, and the installation of a counter and buzzer in Landscape Maintenance; and, $25,000 in Water Enterprise requests.
Community Sanitation Community Sanitation primarily funds the Street Sweeping, Street Tree Trimming and Median Island Programs. Appropriations are budgeted at $9,188,200 in FY 2021, which is a decrease of $499,400.
Additionally, $737,700 is budgeted in the Public Utilities Solid Waste Division to support the Litter Control Program.
Community Sanitation appropriations are limited due to the legal restriction of a fixed service rate as established by voter approval of Proposition 218. Due to increases in the cost of services and therefore a decrease in the services provided, the Department plans to research the possibility of seeking a rate increase through the Proposition 218 process.
FY 2020-2021 Final Revised Budget B - 153
Public Works Department

Staffing Council Motion #32 eliminated three new Non-General Fund positions requested by the Department in FY 2021 as well as the transfer of the DBE Small Business Coordinator position from the Finance Department to the Public Works Department. The following is a summary of the positions impacted:
DBE/Small Business Coordinator: This position is funded by the Public Works Department, but currently resides in the Finance Department. This cost neutral request to transfer the position from Finance to Public Works would have provided efficiencies and improved customer service.
Senior Engineering Technician: Concrete operations requested a position to develop, maintain, administer and manage a concrete
and project selection program. The partial year cost to SB1 Gas Tax was projected at $57,100.
Staff Assistant: A new CFD Staff Assistant was requested to assist with public outreach relating to tract acceptances, special taxes, and projects. The partial year cost to the CFD Program was projected at $45,100
Electrician: The Traffic Signal and Streetlight Program requested a new Electrician position that would have been fully funded through flash request fees. The position would have administered the Traffic Signal Flash Program and, in coordination with Traffic Engineering and Construction Management, placed traffic signals into and out of flash mode. Flash request work is primarily performed by TSSL Electricians on overtime. Cost: $64,500
Department Staffing Detail
Position Summary FY 2019 FY 2020 FY 2020 FY 2021 FY 2021
Division Adopted Adopted Amended Changes Final Administration Division 14.00 12.75 12.75 0.25 13.00
Engineering Services Division 32.50 36.00 36.00 0.00 36.00
Capital Management Division 42.00 41.75 41.75 2.25 44.00
Traffic Engineering & Parking Division 27.00 29.00 29.00 0.00 29.00
Facilities Management Division 22.75 25.50 25.50 (1.50) 24.00
Sustainable Fresno Division 0.00 2.00 2.00 0.00 2.00
Street Maintenance Division 99.25 106.75 106.75 1.25 108.00
Landscape Maintenance Division 84.00 86.00 86.00 (1.00) 85.00
Traffic Signal & Streetlights Division 18.00 17.00 17.00 0.00 17.00 Total 339.50 356.75 356.75 1.25 358.00
B - 154 FY 2020-2021 Final Revised Budget
Public Works Department

Department Revenue and Expenditure - All Funds Combined
Funding Source FY 2018Actuals
FY 2019Actuals
FY 2020Amended
FY 2021Final
PercentChange
Beginning Balance 65,352,050 83,168,761 70,820,100 63,321,800 (10.6)
Fiscal Year Revenues:
Taxes 13,404,110 15,330,568 17,433,900 19,890,200 14.1
Licenses & Permits 968,539 1,217,735 1,014,900 1,570,700 54.8
Intergovernmental Revenue 41,471,878 44,342,238 78,636,100 73,260,600 (6.8)
Charges for Services 31,708,469 31,931,237 32,191,700 32,296,200 0.3
Fines 0 0 0 0 0.0
Other Revenue 1,343,743 1,993,409 953,300 1,631,300 71.1
Interdepartmental Charges for Services 10,010,178 7,767,524 11,469,300 12,036,300 4.9
Misc. Revenue 1,162,256 851,805 1,032,400 869,400 (15.8)
Transfers (6,409,627) (3,062,188) (6,227,000) 1,490,900 (123.9)
Total Fiscal Year Revenues 93,659,544 100,372,328 136,504,600 143,045,600 4.8
Funding Facilitated by Department 159,011,594 183,541,089 207,324,700 206,367,400 (0.5)
Memo Item:
Appropriations by Amount
Personnel Services 24,031,608 25,802,427 33,148,700 36,596,000 10.4
Non Personnel Services 37,611,265 53,576,694 173,282,100 213,900,700 23.4
Interdepartmental Services 20,857,942 24,742,169 30,493,600 27,975,900 (8.3)
Contingencies 0 0 0 0 0.0
Total Departmental Expenditures 82,500,815 104,121,289 236,924,400 278,472,600 17.5
Citywide General Fund Support 4,832,024 4,543,427 9,280,800 5,798,900 (37.5)
Total Available Funding 163,843,617 188,084,516 216,605,500 212,166,300 (2.0)
Appropriations by Percentage
Personnel Services 29.1 24.8 14.0 13.1 10.4
Non Personnel Services 45.6 51.5 73.1 76.8 23.4
Interdepartmental Services 25.3 23.8 12.9 10.0 (8.3)
Contingencies 0.0 0.0 0.0 0.0 0.0
Total Departmental Expenditures 100.0 100.0 100.0 100.0 17.5
FY 2020-2021 Final Revised Budget B - 155
Public Works Department

Department Appropriations by Fund Classification - FY 2021 Only
Resources GeneralFund
SpecialRevenues Capital Enterprise Internal
ServiceDebt
Service Total
Beginning Balance 0 364,500 36,126,000 23,068,100 3,763,200 0 63,321,800
Fiscal Year Revenues:
Taxes 0 19,889,000 0 100 1,100 0 19,890,200
Licenses & Permits 1,270,500 150,200 0 150,000 0 0 1,570,700
Intergovernmental Revenue 80,000 67,090,500 5,902,900 187,200 0 0 73,260,600
Charges for Services 3,397,100 716,000 9,200,400 18,982,100 600 0 32,296,200
Fines 0 0 0 0 0 0 0
Other Revenue 65,000 563,200 556,500 393,500 53,100 0 1,631,300
Interdepartmental Charges for Services 0 0 0 0 12,036,300 0 12,036,300
Misc. Revenue 1,200 117,700 260,000 323,500 167,000 0 869,400
Transfers 60,400 574,400 (1,774,700) 187,400 2,304,500 138,900 1,490,900
Total Fiscal Year Revenues 4,874,200 89,101,000 14,145,100 20,223,800 14,562,600 138,900 143,045,600
Funding Facilitated by Department 4,874,200 89,465,500 50,271,100 43,291,900 18,325,800 138,900 206,367,400
Memo Item:
Appropriations
Personnel Services 5,250,200 18,020,900 2,981,600 8,105,500 2,237,800 0 36,596,000
Non Personnel Services 2,156,800 172,128,600 19,088,300 5,834,300 14,553,800 138,900 213,900,700
Interdepartmental Services 3,266,100 13,114,900 2,029,800 8,224,700 1,340,400 0 27,975,900
Contingencies 0 0 0 0 0 0 0
Total Appropriations 10,673,100 203,264,400 24,099,700 22,164,500 18,132,000 138,900 278,472,600
Citywide General Fund Support 5,798,900 0 0 0 0 0 5,798,900
Total Available Funding 10,673,100 89,465,500 50,271,100 43,291,900 18,325,800 138,900 212,166,300
Department Appropriations by Fund Type
FY 2018Actuals
FY 2019Actuals
FY 2020Amended
FY 2021Final
(Amount)
FY 2021Final
(Percent)Operating 58,030,333 64,149,046 76,181,700 85,064,700 30.5
Capital 24,330,824 39,832,858 160,603,500 193,269,000 69.4
Debt Service 139,658 139,385 139,200 138,900 0.0
Total 82,500,815 104,121,289 236,924,400 278,472,600 100.0
B - 156 FY 2020-2021 Final Revised Budget
Public Works Department
Notes Department Revenue and Expenditures – All Funds Combined Table
1. This table reflects the consolidation of all fund that support operating and/or capital financialactivities.
2. The Citywide General Fund Support line-item reflects citywide General Fund revenues (i.e.,sales tax, property tax, etc.) captured in the General City Purpose Department and is utilized tocover the difference between General Fund revenues and expenditures facilitated by the abovedepartment.
3. Data may not add to the totals due to rounding.
Department Appropriations by Fund Classification – FY 2021 Only Table 1. The Citywide General Fund Support line item reflects General Fund revenues (i.e., sales tax,
property tax, etc.) captured in the General City Purpose Department and is utilized to cover thedifference between General Fund revenues and expenditures facilitated by the abovedepartment.
Department Appropriations by Fund Type 1. Data may not add to the totals due to rounding.
FY 2020-2021 Final Revised Budget B - 157
Public Works Department

THIS PAGE WAS INTENTIONALLY LEFT BLANK.
B - 158 FY 2020-2021 Final Revised Budget

Transportation (FAX) Department
The Department of Transportation provides fixed-route and paratransit demand-response service 363 days a year throughout the City of Fresno. Routes also serve some areas of the City of Clovis, as well as the County of Fresno. The Transportation Department includes the City’s Municipal Fleet Management and Public Safety Fleet Management Divisions, which provide comprehensive vehicle, equipment and supply services to client city departments, as well as outside customers. The focus of the Public Safety Fleet Maintenance Division is to support and maintain Police and Fire vehicles and equipment.
In FY 2021, the Department of Transportation plans to enhance the customer experience. Utilizing the mission statement, “Serving our community through safe, sustainable, and reliable transportation,” Transportation plans to focus on improving internal and external customer-centric efforts and activities.
The FAX Division fixed-route service provides 17 different routes, including one Bus Rapid Transit (BRT) route, operating seven days a week and utilizing a fleet of 114 buses. Of those buses, 113 run on compressed natural gas (CNG) fuel, which is a hybrid fuel that provides a cleaner air alternative and significant fuel savings.
Each bus is equipped with wheelchair lifts and bicycle racks and normally carries an average of 26 passengers per hour. In FY2020, the fixed-route system provided more than 9 million trips, operated 410,510 hours and traveled more than 4.7 million miles.
The Department also provides paratransit demand-response service, known as Handy Ride. Handy Ride operates seven days a week with service levels comparable to the fixed-route system. Residents who are unable to utilize fixed-route service due to a qualifying condition under the Americans with Disabilities Act (ADA), use Handy Ride services. Traveling nearly 1 million miles and utilizing 55 vehicles, Handy Ride service provided over 170,000 trips last year.
Beginning in March 2020, the Department has realized a decrease in ridership of approximately 50 percent due to COVID-19. The Department has implemented numerous safety measures to try and prevent the spread of COVID-19, including limiting the capacity in each bus to 10 passengers. This limitation, along with the closures of high schools, colleges, government offices and businesses have all contributed to the loss in ridership. As these sectors begin to open up, the Department projects ridership will steadily return to normal levels. The Department projects a 36 percent decrease in ridership for FY 2021 compared to last year.
A comprehensive capital asset and facilities assessment study is guiding the Department through a maintenance and replacement plan to maximize the life of assets and prioritize facility repairs and upgrades. Transportation divisions continue to build asset maintenance, grant match, and bus/equipment reserves. These reserves provide the Department with resources needed to maintain and repair existing assets, implement study recommendations and leverage
FY 2020-2021 Final Revised Budget B - 159

local, state, and federal grant funds for the acquisition of new or replacement equipment, the purchase of zero emission buses and facilities and passenger stations and amenities.
The Fleet Maintenance Division provides clients with a full range of fleet services to ensure the City fleet operates at optimum levels. These services include vehicle and equipment acquisition and disposal, maintenance repairs, and fuel.
The Fleet Management Division maintains more than 2,300 units, ranging from utility carts to large refuse trucks, motor graders, bulldozers, and backhoes. The division is also responsible for all on and off road emissions
reporting to the Environmental Protection Agency, California Air Resources Board, and the local air district.
The Fleet Management Division, for the 19th consecutive year, has been awarded the Automotive Service Excellence Blue Seal of Excellence. This designates more than 75 percent of the technicians have passed multiple certification exams.
The Public Safety Maintenance Division provides a dedicated shop for fire and police vehicles. The Public Safety Maintenance Division is expected to provide cost-effective maintenance service, while maintaining public safety customers as the top priority.
Gregory A. BarfieldDepartment of
Transportation Director
Assistant Director Assistant Director
Municipal Fleet Division Capital Projects Information Services/
TechnologyPublic Safety Fleet
Division
Police Fleet
Fire Fleet
Fleet Operations
Fleet Equipment Acquisition
Fare Collection
Administrative Support
Service Planning / Scheduling
Public Outreach
Personnel Activities
Administrative Division
Bus Repair / Maintenance
Customer ServiceFinancial Management
Grant Management
Compliance
Payroll
Maintenance Division Planning Division Operations Division Support Services Division
Paratransit
Field Supervision
Training
Dispatch
Bus Service
Safety
Facility / Bus Stop Maintenance
B - 160 FY 2020-2021 Final Revised Budget
Transportation (FAX) Department
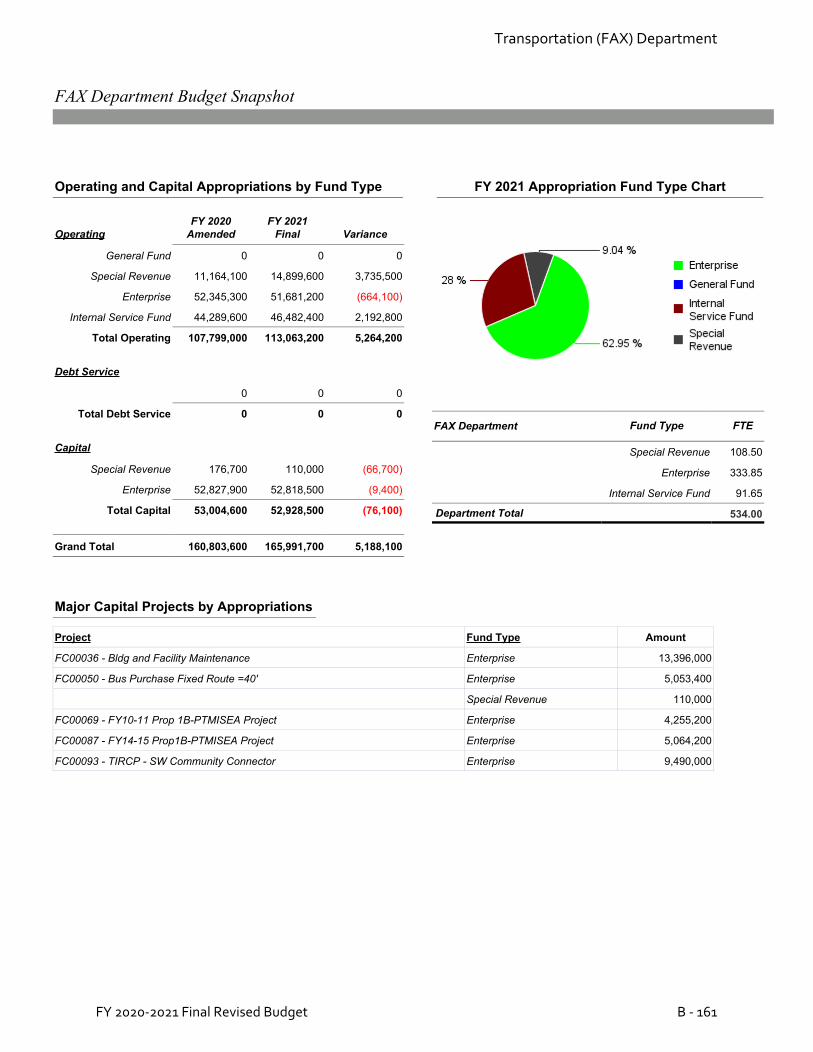
OperatingFY 2020
AmendedFY 2021
Final Variance
General Fund 0 0 0
Special Revenue 11,164,100 14,899,600 3,735,500
Enterprise 52,345,300 51,681,200 (664,100)
Internal Service Fund 44,289,600 46,482,400 2,192,800
Total Operating 107,799,000 113,063,200 5,264,200
Capital
Special Revenue 176,700 110,000 (66,700)
Enterprise 52,827,900 52,818,500 (9,400)
Total Capital 53,004,600 52,928,500 (76,100)
Grand Total 160,803,600 165,991,700 5,188,100
Operating and Capital Appropriations by Fund Type FY 2021 Appropriation Fund Type Chart
Major Capital Projects by Appropriations
FAX Department Fund Type FTE
Special Revenue 108.50
Enterprise 333.85
Internal Service Fund 91.65
534.00
Debt Service
0 0 0
Total Debt Service 0 0 0
Project Fund Type Amount
FC00036 - Bldg and Facility Maintenance Enterprise 13,396,000 ## 1
FC00050 - Bus Purchase Fixed Route =40' Enterprise 5,053,400 ## 3
Special Revenue 110,000 ## 3
FC00069 - FY10-11 Prop 1B-PTMISEA Project Enterprise 4,255,200 ## 5
FC00087 - FY14-15 Prop1B-PTMISEA Project Enterprise 5,064,200 ## 4
FC00093 - TIRCP - SW Community Connector Enterprise 9,490,000 ## 2
FAX Department Budget Snapshot
Department Total
FY 2020-2021 Final Revised Budget B - 161
Transportation (FAX) Department

Service Impacts
Approved Council Motions Per Revised Budget Hearings • Motion #32, with limited exceptions,
removed positions requested as part of theRevised Budget submission. As a result,the Transportation Department’s requestfor 15 Bus Drivers at a cost of $744,200 andone Network System Specialist at a cost of$67,600 were removed from the FY 2021Final Revised Budget.
Total appropriations in the Transportation Department are budgeted at $165,991,700, an increase of $5,188,100 or 3.2 percent over the FY 2020 Amended Budget. This includes $1,995,000 in Measure C New Technology grant funds in the Transit Operation Divisions for an advanced propulsion systems training center. The funds for the center will be passed through to Fresno City College in FY 2021. Without the pass through grant, the Transportation Department is budgeted at $163,996,700 which is an increase of $3,193,100 or 2.0 percent over the FY2020 Amended Budget. The remainder of the Transportation budget discussion will be without consideration of the pass-through appropriations. Transit Operating and Capital Divisions make up $117,514,300 of the total appropriations while Internal Service Fund Fleet Service Divisions account for the remaining $46,482,400.
Transit Operations Divisions Transit Divisions are enterprise funded. FY 2021 Final Revised appropriations for these Divisions are budgeted at $64,585,800, an increase of $1,076,400 compared to the FY 2020 Amended Budget. FY 2021 Final Revised appropriations include an increase of $2,914,800 for Personnel appropriations, a decrease of $1,093,400 for Non-Personnel
appropriations and a decrease of $745,000 for Interdepartmental Charges.
Personnel appropriation increases of $2,914,800 are comprised of salary increases due to step advancements and contractual obligations in addition to: • $805,700 increase for Bus Driver overtime
which has been impacted by the effects ofCOVID-19.
• $563,500 increase for pension obligations.• $279,900 increase in Workers’ Compensation
costs.• $16,200 increase for a full year of funding at
1.00 FTE for a Utility Lead Worker approved inFY 2020 at .75 FTE.
Non-Personnel appropriations have decreased by $1,093,400. Significant changes to the FY 2021 Final Revised Budget are detailed below and were offset by reallocations and the removal of $1,445,500 in FY 2020 one time appropriations: • $222,700 increase to purchase transportation
for paratransit services.• $200,000 increase for inventory to cover the
rising price parts for specialized, technicalequipment such as state of the art camerasand lenses and Ticket Vending Machines thatmay be vandalized at BRT stations.
Interdepartmental Charges overall have decreased of $745,000. These changes primarily consist of: • $601,300 decrease for the charge by the
Police Department to patrol FAX routes dueto the decrease of assigned personnel to theunit.
• $233,100 decrease in Fleet Fuel Charges.• $210,200 increase in Liability Self-Insurance.
Capital Division FY 2021 Final Revised appropriations for Transit Capital are budgeted at $52,928,500, which is a
B - 162 FY 2020-2021 Final Revised Budget
Transportation (FAX) Department

decrease of $76,100 compared to the FY 2020 Amended Budget of $53,004,600. Capital project details can be found in the Capital Improvement Summary section of this book.
Internal Service Fleet Service Divisions
Public Safety Fleet Maintenance FY 2021 Final Revised appropriations for the Public Safety Maintenance Division (PSF) are budgeted at $10,942,700, which is an increase of $119,700 compared to the FY 2020 Amended Budget.
Personnel appropriations are $2,873,300, which is an increase of $127,400 over the FY 2020 Amended Budget. The increases due to step advancements, pension contributions, Workers’ Compensation Charges and health and welfare contributions in addition to the following: • $16,100 increase for a full year of funding at
1.00 FTE for an Equipment Service WorkerII approved in FY 2020 at .75 FTE.
• $14,700 increase for a full year of funding at1.00 FTE for an Auto Parts Specialistapproved in FY 2020 at .75 FTE.
Non-Personnel appropriations are budgeted for $7,568,000, which is a decrease of $162,000 or 2.1 percent less than the FY 2020 Amended Budget. Decreases include $673,300 due to a lack of new vehicle leases and acquisitions for the Police Department and a decrease of $490,500 in vehicle accident repair appropriations which are generated by insurance proceeds. Offsets include increases of $95,000 for the outside repair of Fire apparatus and equipment and an increase of $951,400 to align expenditures with available resources.
Interdepartmental Charge appropriations are $501,400 which is an increase of $154,300 when
compared to the FY 2020 Amended Budget. This increase is primarily due to a $68,800 increase for Facility Repair and Replacement Projects and a combined increase of $63,900 for Information Systems Service and Equipment Charges.
Municipal Fleet Maintenance & Fleet Equipment Acquisitions Appropriations in the Municipal Fleet Management Operations Equipment and Fleet Equipment Acquisitions Divisions are budgeted at $35,539,700, which is an increase of $2,073,100 or 6.2 percent higher when compared to the FY 2020 Amended Budget. The increase is composed of $168,000 additional Personnel appropriations, $2,031,700 additional Non-Personnel appropriations, and a decrease of $126,600 in Interdepartmental Charge appropriations.
The $168,000 rise in Personnel appropriations is comprised of step advancements, pension contributions, and health and welfare contributions with slight offsets from Workers’ Compensation Charges and HRA Payments in addition to the following: • $16,100 increase for a full year of funding at
1.00 FTE for an Equipment Service Worker IIapproved in FY 2020 at .75 FTE.
Non-Personnel appropriations are budgeted at $27,302,600 which is an increase of $2,031,700 compared to the FY 2020 Amended Budget. FY 2021 vehicle replacements account for an increase of $2,440,700 in the FY 2021 Final Revised Budget. A $200,000 decrease in vehicle accident repair appropriations offsets the increase.
The $126,600 Interdepartmental Charge decrease is primarily due to decreases for the Cost Allocation Plan, ISD service charges and Liability Self-Insurance Charges with offsetting increases for Facility Repair and Replacement Projects and charges for purchasing services.
FY 2020-2021 Final Revised Budget B - 163
Transportation (FAX) Department

CARES Act Funding The Department was awarded $32,479,800 of CARES Act funding. The eligible project list to utilize this funding source is summarized below: • $28,526,000 towards FAX operating
support.• $67,000 towards Hand Ride operating
support.
• $2,783,500 COVID-19 related expenditures.• $1,103,300 towards FAX bus purchases.
It should be noted $18,244,400 of the above list corresponds to FY 2020 expenditures incurred, while $14,235,400 is anticipated by FY 2021 expenditures.
B - 164 FY 2020-2021 Final Revised Budget
Transportation (FAX) Department

Staff ing Staffing levels for the Transportation Department have increased by 1.00 FTE. After accounting for transfers and adjustments for FY 2020 additions allocated at a full FTE in FY 2021, the Operating and Capital Division have increased by 1.25 FTE and the ISF Divisions have decreased by .25 FTE.
Transit Operating and Capital Divisions Positions within the Transit Operation and Capital Divisions have increased by 1.25 FTE when compared to FY 2020 Amended staffing levels. This increase is due to Operating and Capital Divisions receiving 1.00 FTE transferred from Municipal Fleet Maintenance and Fleet Equipment Acquisitions Divisions as well as a .25 FTE increase from a Utility Lead Worker
position approved in FY 2020 at .75 FTE now allocated at 1.00 FTE.
Municipal Fleet Maintenance & Fleet Equipment Acquisitions Municipal Fleet Maintenance and Fleet Equipment Acquisitions positions have decreased by .75 FTE when compared to FY 2020 Amended staffing levels. The decrease is the net result from reallocating 1.00 FTE to Transit Operating against an increase of .25 FTE for the Equipment Service Worker II approved in FY 2020 at .75 FTE now allocated at 1.00 FTE.
Public Safety Maintenance Division Public Safety Maintenance Division positions have increased by.50 FTE when compared to FY 2020 Amended staffing levels. The increase is due to the Auto Parts Specialist and Equipment Service Worker II that were approved in FY 2020 at .75 FTE each now allocated at 1.00 FTE.
Department Staffing Detail
Position Summary FY 2019 FY 2020 FY 2020 FY 2021 FY 2021
Division Adopted Adopted Amended Changes Final Transportation Operating 324.00 327.00 327.00 (2.00) 325.00
Transportation Maintenance 77.00 83.75 83.75 (0.75) 83.00 Transportation Administration 18.00 22.00 22.00 3.00 25.00
Transportation Support Services 6.00 7.00 7.00 0.00 7.00 Transportation Planning 2.00 2.00 2.00 1.00 3.00
Fleet Public Safety Maintenance 29.75 31.50 31.50 0.50 32.00 Fleet Management 54.75 54.75 54.75 1.25 56.00
Fleet Equipment Acquisition 4.00 5.00 5.00 (2.00) 3.00
Total 515.50 533.00 533.00 1.00 534.00
Note: The 1.00 FTE increase to FY 2021 Changes consists of a Utility Lead Worker, an Auto Parts Specialist and two Equipment Service Worker II's
approved in FY 2020 at .75 FTE now allocated at 1.00 FTE each in FY 2021.
FY 2020-2021 Final Revised Budget B - 165
Transportation (FAX) Department

Department Revenue and Expenditure - All Funds Combined
Funding Source FY 2018Actuals
FY 2019Actuals
FY 2020Amended
FY 2021Final
PercentChange
Beginning Balance 9,434,849 32,430,929 61,102,500 35,373,300 (42.1)
Fiscal Year Revenues:
Taxes 10,352,657 10,601,393 11,380,200 12,135,000 6.6
Licenses & Permits 0 0 0 0 0.0
Intergovernmental Revenue 67,159,599 38,879,150 74,927,700 104,779,600 39.8
Charges for Services 6,594,193 6,568,945 6,264,100 4,379,300 (30.1)
Fines 0 0 0 0 0.0
Other Revenue 482,660 850,512 755,200 1,088,300 44.1
Interdepartmental Charges for Services 29,880,341 28,393,174 50,143,400 42,410,300 (15.4)
Misc. Revenue 2,198,066 854,176 1,269,000 1,173,100 (7.6)
Transfers (641,671) (755,464) (651,400) 0 (100.0)
Total Fiscal Year Revenues 116,025,846 85,391,887 144,088,200 165,965,600 15.2
Funding Facilitated by Department 125,460,695 117,822,816 205,190,700 201,338,900 (1.9)
Memo Item:
Appropriations by Amount
Personnel Services 38,460,314 41,630,904 46,859,300 49,936,900 6.6
Non Personnel Services 44,152,103 49,003,424 103,106,200 105,798,100 2.6
Interdepartmental Services 8,124,894 8,219,203 10,338,100 9,756,700 (5.6)
Contingencies 0 (3,500) 500,000 500,000 0.0
Total Departmental Expenditures 90,737,311 98,850,031 160,803,600 165,991,700 3.2
Citywide General Fund Support 0 8,733,617 0 0 0.0
Total Available Funding 125,460,695 126,556,433 205,190,700 201,338,900 (1.9)
Appropriations by Percentage
Personnel Services 42.4 42.1 29.1 30.1 6.6
Non Personnel Services 48.7 49.6 64.1 63.7 2.6
Interdepartmental Services 9.0 8.3 6.4 5.9 (5.6)
Contingencies 0.0 (0.0) 0.3 0.3 0.0
Total Departmental Expenditures 100.0 100.0 100.0 100.0 3.2
B - 166 FY 2020-2021 Final Revised Budget
Transportation (FAX) Department

Department Appropriations by Fund Classification - FY 2021 Only
Resources GeneralFund
SpecialRevenues Capital Enterprise Internal
ServiceDebt
Service Total
Beginning Balance 0 6,007,600 0 19,141,400 10,224,300 0 35,373,300
Fiscal Year Revenues:
Taxes 0 12,135,000 0 0 0 0 12,135,000
Licenses & Permits 0 0 0 0 0 0 0
Intergovernmental Revenue 0 0 0 104,392,500 387,100 0 104,779,600
Charges for Services 0 0 0 4,379,300 0 0 4,379,300
Fines 0 0 0 0 0 0 0
Other Revenue 0 150,000 0 626,500 311,800 0 1,088,300
Interdepartmental Charges for Services 0 0 0 0 42,410,300 0 42,410,300
Misc. Revenue 0 0 0 270,000 903,100 0 1,173,100
Transfers 0 9,702,300 0 (9,702,300) 0 0 0
Total Fiscal Year Revenues 0 21,987,300 0 99,966,000 44,012,300 0 165,965,600
Funding Facilitated by Department 0 27,994,900 0 119,107,400 54,236,600 0 201,338,900
Memo Item:
Appropriations
Personnel Services 0 9,885,000 0 31,347,900 8,704,000 0 49,936,900
Non Personnel Services 0 3,177,200 0 67,750,300 34,870,600 0 105,798,100
Interdepartmental Services 0 1,947,400 0 5,401,500 2,407,800 0 9,756,700
Contingencies 0 0 0 0 500,000 0 500,000
Total Appropriations 0 15,009,600 0 104,499,700 46,482,400 0 165,991,700
Citywide General Fund Support 0 0 0 0 0 0 0
Total Available Funding 0 27,994,900 0 119,107,400 54,236,600 0 201,338,900
Department Appropriations by Fund Type
FY 2018Actuals
FY 2019Actuals
FY 2020Amended
FY 2021Final
(Amount)
FY 2021Final
(Percent)Operating 85,338,332 91,356,102 107,799,000 113,063,200 68.1
Capital 5,398,979 7,493,929 53,004,600 52,928,500 31.9
Debt Service 0 0 0 0 0.0
Total 90,737,311 98,850,031 160,803,600 165,991,700 100.0
FY 2020-2021 Final Revised Budget B - 167
Transportation (FAX) Department

Notes Department Revenue and Expenditures – All Funds Combined Table
1. This table reflects the consolidation of all funds that support operating and/or capital financialactivities.
2. The Citywide General Fund Support line-item reflects citywide General Fund revenues (i.e.,sales tax, property tax, etc.) captured in the General City Purpose Department and is utilized tocover the difference between General Fund revenues and expenditures facilitated by the abovedepartment.
3. Data may not add to the totals due to rounding.
Department Appropriations by Fund Classification – FY 2021 only Table 1. The Citywide General Fund Support line-item reflects citywide General Fund revenues (i.e.,
sales tax, property tax, etc.) captured in the General City Purpose Department and is utilized tocover the difference between General Fund revenues and expenditures facilitated by the abovedepartment.
Department Appropriations by Fund Type 1. Data may not add to the totals due to rounding.
B - 168 FY 2020-2021 Final Revised Budget
Transportation (FAX) Department

FY 2021-2025 Capital Improvement Program
Introduction
Development of the FY 2021-2025 Capital Improvement Program (CIP) is an intensive, ongoing process, involving a comprehensive review of the goals and direction of the City’s future infrastructure needs. The overriding mission of this review is to determine specific
priorities, starting with the vital work being done to revitalize and reinvigorate the Downtown area; then to sequence those priorities to enable the City to effectively concentrate its capital investment.
Any capital plan must take into consideration the financial impact to its citizens, balancing the ever changing needs of the City with the capacity of the population to finance those improvements and the maintenance that comes with them. This is especially true of capital funded through utility rates. Critical decisions will be made concerning the pace and timing of the utility capital program using the dollars available.
Overview
The total FY 2021-2025 CIP is budgeted at $898.1 million for projects that range from the construction of new facilities to the updating of existing structures, street improvements, sidewalk repairs and utility infrastructure maintenance. The FY 2021 Capital Program contains new and ongoing projects with a combined approximate cost of $467.3 million.
Capital Funding Sources
Federal support consists largely of Federal Aviation Authority grants for Fresno Yosemite International Airport, Federal Transportation Agency grants for FAX and the Public Works Grant allocation. The support component from the state is made up of Gas Tax which is used for street and road improvements and other infrastructure needs, High Speed Rail, Proposition 1B for transit and Proposition 84 funding for parks. Enterprise revenue will be used
primarily to fund water well and sewer line construction and rehabilitation. CDBG is primarily used for neighborhood street improvements and reconstruction.
FY 2020-2021 Final Revised Budget C - 1

DEPARTMENT DETAILS
PLANNING & DEVELOPMENT SERVICES
Planning & Development Services’ FY 2021 Non-CDBG CIP totals $2.6 million. The key projects within the Department’s budget include:
Parking Garage Improvements A total of $1.8 million of appropriations is budgeted in the General Fund for repairs at various City of Fresno parking garages and lots.
The Capital Improvement Program will address parking facility needs as outlined in the Parking Facilities assessment that was presented to Council in January 2016. The estimated costs for parking improvements of City owned parking assets, including Garage 7, is $9.5 million based on 2016 costing.
Neighborhood Stabilization Program (NSP) Terminated HUD Program funds can be used for CDBG eligible housing rehabilitation activities. A total of $763,700 is available from the NSP Program income.
Rental Rehabilitation Program (RRP) Terminated HUD Program funds can be used for CDBG eligible housing rehabilitation. A total of $44,900 is available from RRP Program income.
CDBG Capital Improvements The previously approved FY 2021 Annual Action Plan includes $2.1 million in CDBG Capital. Below is a list of CDBG previously approved capital projects:
Street and Sidewalk Improvements Yosemite Middle School Complete Streets: In FY 2021, $300,000 is budgeted for year one of a multi-year project with an estimated total cost of $1.5 million.
Highway City Neighborhood Street Reconstruction: In FY 2021, $615,000 is budgeted for year one of a multi-year project with an estimated total cost of $3.6 million.
West Fresno Elementary & MLK Neighborhood Street Improvements: A total of $1.2 million is budgeted in FY 2021.
Burroughs Elementary Neighborhood Street Reconstruction: A total of $801,100 is budgeted in FY 2021.
Ericson Elementary Neighborhood Street Reconstruction: In FY 2021, $179,000 is budgeted for year one of a multi-year project with an estimated total cost of $1.2 million.
Parks/Public Facilities Multi-Generational Community Center: A total of $9.9 million is budgeted in FY 2021 toward a total project cost estimated at $10.8 million.
THE DEPARTMENT OF PUBLIC UTILITIES
Approved Council Motions Per the Revised Budget Hearings
Motion #2 established $2,713,600 for the completion of the Convenience Center.
Many of the Department’s capital projects are necessary to support current and future economic development needs and to maximize water resources. The following are highlights from their FY 2021 Capital Budget of $105.6 million:
Administration and Maintenance Facility – Increased demand for City services has caused various departments to outgrow existing facilities. To efficiently meet current and future service needs, The Department is considering the acquisition of property for a new Administration and Maintenance Facility for shared use by the Department’s Water, Wastewater and Solid Waste Divisions. The
C - 2 FY 2020-2021 Final Revised Budget
FY 2021-2025 Capital Improvement Program

facility would be approximately 15-acres and would contain administration, staff space, and yards for the Water and Solid Waste Divisions. The facility would also accommodate a vehicle maintenance facility for use by all of the Department’s Divisions. Funding of $5.1 million from the Water Enterprise Fund and $2.9 million from the Solid Waste Enterprise Fund for a total $8 million is included in FY 2021 to support property acquisition.
Water System Rehabilitation and Replacement The City of Fresno has approximately 260 wells that pump groundwater and over 1,860 miles of water distribution pipelines. Much of this infrastructure is past or nearing the end of its useful life and needs to be replaced or rehabilitated. As wells age or near the end of their useful life they can slow or stop producing as much water as they should, which increases the energy cost of operating old wells. As pipelines age, they become susceptible to leaking and complete failures, which can cause significant damage and service interruptions. Rehabilitation and replacement of aging wells and mains will help to assure a continued safe and reliable water supply, reduce water system failures and minimize water service costs. Major projects for FY 2021 include:
• Water Main Renewal – Replacement of water main in Fig Garden West; Maroa Heights Phase II; Armstrong Avenue: Kings Canyon to Butler; Polk Avenue: Herndon to Palo Alto; Central Avenue and other miscellaneous projects. The total budgeted
amount is $4.5 million. • Water Well Construction – Nine sites are
planned for replacement throughout the water service area for a total budgeted amount of $2.3 million.
• Water Well Rehabilitation – Rehabilitation of water wells is required when production output is diminished due to mineral build-up on the well casing and in the gravel pack. Rehabilitation also includes redevelopment to reduce sand production (i.e. installation of well screens to prevent sand intrusion in older open bottom wells), repairs to failure of the casing and chemical treatments for bacteriological conditions. A total of $2.1 million is budgeted.
• Water Telemetry System – The Supervisory Control and Data Acquisition (SCADA) System is a wireless communication system that allows staff to remotely monitor and control the water system. Replacement and upgrade of SCADA system control components and software will increase operational efficiencies and reduce power and maintenance costs. The total amount budgeted is $1.5 million.
Polyethylene (PE) Replacement – Pipes and fittings made with PE are one type of material that have been installed throughout the water distribution system for service connections to customers. Unfortunately, these pipes have been experiencing higher than normal rates of bursts and leaks. The demand for repairing or replacing these premature failures have put a strain on existing Water Division O&M resources including increased costs due to the frequent need for overtime to get the customer back on service and the inability to focus on
FY 2020-2021 Final Revised Budget C - 3
FY 2021-2025 Capital Improvement Program

preventative maintenance activities. This project will use outside contractors to proactively replace existing PE water services in targeted neighborhoods. All replacements will be made with copper materials, which are proven the most durable. In FY 2021, $1 million is budgeted in the Water Enterprise Fund. The five-year capital plan includes a total of $5 million through FY 2025.
Granular Activated Carbon (GAC): GAC is made from organic materials with high carbon contents such as wood, lignite and coal and is used to adsorb and filter out natural organic compounds, taste and odor compounds, and synthetic organic chemicals in drinking water treatment. This project is for the construction of granular activated carbon (GAC) wellhead treatment systems (tanks, plumbing, electrical, SCADA, site improvements, etc.) at potable water well sites throughout the City. This will assist the City in insuring overall water quality and meeting federal requirements for water delivered to customers. The specific sites will be determined by feasibility studies, considering all engineering, economic, energy and environmental factors. The total budgeted amount is $1.7 million for FY 2021.
Groundwater Recharge: These projects provide for intentional groundwater recharge basins to enhance replenishing the aquifer, thereby raising the water table. Funding is anticipated in FY 2021 for acquisition of property, engineering and design services, and construction of a recharge facility at a site that is yet to be determined ($1.0 million).
Northeast Surface Water Treatment Facility Storage Tank (NESWTF): During FY 2020, the Safe Drinking Water State Revolving Fund Low-Interest Loan funding agreement with the state was approved for $14 million to construct a 4.5 million gallon water storage tank at the
Northeast Surface Water Treatment Facility. The project will increase the treated water storage capacity from 1.5 million gallons to 4.5 million gallons from the NESWTF. The total estimated cost of the project is $19.4 million. The additional funding will be covered by the Water Enterprise Fund if additional SRF loan funding is not made available. The construction contract was awarded during FY 2020. A total of $2.8 million is budgeted for FY 2021 in the state loan fund ($2.5 million) and Water Enterprise Fund ($309,100) for on-going support and closeout costs.
Transmission Grid Mains: The Transmission Grid Main (TGM) system is composed of large diameter (16-inch) pipelines that convey potable water from the Regional Transmission Mains to the smaller distribution system pipes. The TGM system may be expanded in new developments in the City where there are currently no TGM pipelines. Existing smaller diameter transmission grid mains are creating hydraulic restrictions that should be alleviated through replacement or parallel larger pipelines. In older parts of the City, additional analysis is required to identify specific segments of existing TGM pipeline to be addressed. In FY 2021, $1.9 million is budgeted for this on-going project.
Perchloroethylene (PCE) Wellhead Treatment: Carbon treatment vessels are required at PS 117 (Del Mar and Bullard) to reduce the PCE to allowable levels in compliance with drinking water regulations. In FY 2021, a total of $4.2 million is budgeted. This project is funded through a Proposition 1 Groundwater Sustainability Grant Program grant from the State Water Resources Control Board ($3.8 million) and local match funding from the Water Enterprise Fund ($400K). A total of $2.4 million in grant funding was obtained in FY 2019 and a request for additional monies has
C - 4 FY 2020-2021 Final Revised Budget
FY 2021-2025 Capital Improvement Program

been submitted. If this funding is not made available from the state, continuation of this project will be reconsidered. In FY 2021, $4.1 million is budgeted.
Water Main Extension & Dead-End Elimination: Water main extensions provide for enhancement of water flow and pressure for varying demands throughout the City's service area. Dead-end elimination (or gap closure) results in looping of inefficient distribution areas; redundancy of water supply in the event of main breaks or shut down for numerous reasons; improved water quality and fire flow capacity and reduced need for flushing and maintenance. It also enhances compliance with the Coliform Compliance Rule, improves the level of customer service and reduces on-going costs. In FY 2021, funds are allocated for completing the Veterans Blvd. ($1.2 Million) and Central Ave ($496,600) water mains and unanticipated extensions ($50,000) for a total request of $1.8 million.
Southwest Quadrant Recycled Water Distribution System: This project will provide the recycled water infrastructure to distribute recycled water to potential recycled water customers and offset existing potable water use. The Southwest Quadrant Recycled Water pipeline will connect the Tertiary Treatment facility located at Jensen and Cornelia Avenues with users such as cemeteries, parks,
schools, industrial users and other urban users in the area. Construction of the Southwest Quadrant Recycled Water pipeline began in FY 2016. The FY 2021 budget includes $4.0 million in FY 2021 to complete construction of this project.
Recycled Water Distribution: This project will further extend the Southwest Quadrant Recycled Water Distribution System to provide recycled water to areas such as the Martin Luther King Activity Center and the industrial area in Southeast Fresno. The FY 2021 budget includes $3.5 million in FY 2021 and $1.0 million in FY 2022 through FY 2024 for construction of this project.
RWRF Secondary Treatment: This project provides funding to repair, enhance, or replace components of the secondary treatment processes at the wastewater treatment facility. These processes provide secondary level treatment including oxidation and solids removal. The ability to meet current and future Waste Discharge Requirements are achieved predominantly through the secondary treatment process trains. A critical component of this project will include identifying appropriate treatment processes and equipment needed to remove contaminants such as struvite and ammonia from the dewatering process discharge which will reduce maintenance and repair costs and increase the stability of the wastewater treatment process. The five year capital plan includes $3.6 million in FY 2021 and an additional $25.9 million between FY 2022 through FY 2025 for this project.
Renewable Gas Diversion: This project provides funding to confirm the financial and engineering feasibility to clean digester gas and inject it back into the state’s natural gas distribution pipe system. If financially viable,
FY 2020-2021 Final Revised Budget C - 5
FY 2021-2025 Capital Improvement Program

the necessary infrastructure will then be designed and constructed. The five year plan includes $9.3 million in FY 2021 for this project.
Flare Capacity Expansion: In the wastewater treatment process digester gas, a byproduct of wastewater treatment, is produced. The digester gas produced is burned through a gas flare unit. The current unit is undersized. This project provides the funds to build a larger capacity waste gas flare unit. The five year capital plan includes $7.5 million in FY 2021 for construction of this project.
Collection System Rehabilitation: This project provides funding to repair or replace wastewater collection system infrastructure conditions that pose a current or future threat to sewage conveyance and restore the affected facilities to an acceptable state. Key components of this project for FY 2021 include rehabilitation of the North Avenue Trunk Line as well as rehabilitation of several other sewer mains. The five year capital plan includes $7.1 million in FY 2021 and an additional $50.1 million between FY 2022 through FY 2025 for this project.
THE PUBLIC WORKS DEPARTMENT
Approved Council Motions Per the Revised Budget Hearings
Motion #25 added $250,000 to fund a Truck Study in partnership with the San Joaquin Valley Air Control District.
Neighborhood Street Improvements 7-Week Concrete Repair Program: The seven-week concrete crew repairs damaged curbs, gutters, and sidewalks throughout Fresno. This crew will be assigned to work for 7 weeks in each of the 7 Council Districts, in locations that are pre-selected by the Council Member with input from the Street Maintenance team.
Appropriations for this program in FY 2021 are $1.6 million, of which $446,000 is carryover from FY 2020.
Veterans/UPRR/HSR Overpass: Veterans Boulevard Project is being delivered under seven project numbers. Design and right-of-way acquisition is nearly complete. The first construction package (PW00683) with the Bullard extension was completed in the Fall of 2019, while the second contract for the Veterans/Union Pacific Railroad Grade Separation was awarded for $20 million in FY
2020. The third contract will be for Veterans Boulevard construction from Shaw Avenue to Barstow Avenue, utilizing state and Local Partnership Program funding and Regional Street Impact Fees, with total appropriations of $6.7 million. The Veterans Trail from Hayes to Polk construction contract was awarded in FY 2020, with appropriations of $1.2 million. The final project will be the freeway interchange project and completion of the roadway from Shaw to Herndon Avenue, with project construction planned in FY 2021 utilizing the Federal BUILD grant, State Transportation Improvement Program (STIP) funds, Measure C, RMTF, and local developer fees that have been secured for construction. The five-year capital submission reflects $80.6 million in Measure C, RTMF, state transportation funds and local developer fees that have been secured for project construction. Appropriations are budgeted at $65.7 million in FY 2021.
C - 6 FY 2020-2021 Final Revised Budget
FY 2021-2025 Capital Improvement Program

SB1 Projects: Senate Bill 1 (SB1) revenues for FY 2021 are estimated at $9.6 million, which will be utilized for numerous street repaving, concrete repair and traffic signal projects throughout the City. The 2020-21 SB1 project list was approved by Council on June 11, 2020.
High Speed Rail: The project budgets includes Public Works and the Department of Public Utilities completing the plan review and permitting process for thirteen grade separations, five miles of realigned streets, more than thirty traffic signals, twenty miles of realigned sewer and water, as well as providing construction oversight services for city facilities being relocated or constructed by the High Speed Rail project. Appropriations are budgeted at $10.2 million in FY 2021.
Intelligent Transportation System (ITS): The Department will install traffic synchronization technology on traffic signals for major corridors of the City of Fresno. As these projects are
completed, additional personnel for signal timing, the physical maintenance of the equipment and information technology will be necessary along with replacement equipment as the original equipment ages and no longer functions. $5.3 million is budgeted for FY 2021.
Traffic Signals: The budget includes the construction of four new traffic signals and one signal left turn phasing upgrade, along with the design of ten additional traffic signals to improve safety and relieve congestion. The primary funding sources are federal and state grant funding such as the Highway Safety Improvement Program and Active Transportation Program.
Industrial Economic Development: Funding has been budgeted for Central Avenue reconstruction between East Avenue and Orange Avenue, as well as the widening of the intersection at Central and Orange Avenues. The projects include curb, gutter, street lighting and bridge replacement to accommodate traffic from trucks and employees. These improvements will make several large parcels more viable for industrial development and will connect to the new railroad overcrossing to be built by High Speed Rail.
West Area Projects: The FY 2021 budget includes $13.5 million for projects west of State Route 99, including projects to address bottlenecks and lack of sidewalks on Ashlan Avenue, Clinton Avenue, McKinley Avenue and Polk Avenue; the installation of a traffic signals at Clinton Avenue and Valentine Avenue, Hughes Avenue and Shields Avenue, Marks and Nielsen and California and Walnut, plus an interchange feasibility study
at Shaw Avenue and State Route 99. Polk Avenue (Gettysburg to Shaw) and McKinley Avenue (Marks to Hughes) have both received federal grant funding for construction in FY 2022.
FY 2020-2021 Final Revised Budget C - 7
FY 2021-2025 Capital Improvement Program

Bike & Trail Master Plan and Bankside Trail: The 2017 Active Transportation Plan (ATP) established a vision for investment in infrastructure to improve facilities for walking, biking and active travel. A key connector between east and west Fresno, the Midtown Trail project will install of 7.1 miles of trail in the heart of the City. The Midtown trail is comprised of five segments and is a key project to bring the plan from paper to pavement. A Master Trails Agreement was approved by the Council and Fresno Irrigation District Board in December 2018, allowing the project to proceed into the final design and construction phases: • Midtown Trail – FY 2021 appropriations of
$12.9 million are budgeted for the fivesegments, including Measure C Trails,federal CMAQ and state ATP grant funding.Segment 2, Fresno to First, is scheduled tobegin in the first half of the fiscal year.
• Fancher Creek Trail, Clovis to Fowler –Design is underway with constructionscheduled for FY 2021 utilizing $701,000 inappropriations. The City has committed tofunding the construction, contingent uponthe developer forming a CFD formaintenance.
• Fancher Creek Parkway TransportationPlanning Grant – The Fancher Creek TrailPlan will produce a conceptual study fortrail feasibility and enhancement alongFancher Creek from Jensen to Temperance(approximately 5.3 miles). The completedplan will include potential funding sourcesfor the facility and an implementation planto move rapidly to secure grant funding forengineering, acquisition and construction.The planning process will bring togetherpartnering agencies and the community topresent a unified vision for trail facilities.
Martin Luther King Center Active Transportation and Park Infrastructure: The Martin Luther King Activity Center project is part of a catalytic transformation underway to improve air quality and overall quality of life in Southwest Fresno. Through funding from the Transformative Climate Communities Program, investment from State Center Community College District and collaboration with the City of Fresno, Southwest Fresno will soon be home to a new community college campus. This project will install trails, sidewalks and bike paths to support and encourage active travel to and from the campus and around southwest Fresno. The boundaries of the project are Martin Luther King Jr. Boulevard, Church, Jensen and Walnut Avenues. Preliminary engineering work is funded in FY 2020. The estimated total project cost is $17.2 million for all phases.
Olive Avenue Tower District Project: A total of $1.1 million is budgeted for the Olive Avenue Tower District project, which will reconstruct the street to address deferred pavement maintenance, but will also provide a more pedestrian-friendly, walkable district with bulb-outs and streetscape improvements.
Transformative Climates Communities Program (TCC): As part of the Transformative Climate Communities (TCC) Program, the Strategic Growth Council has awarded $70 million to the City of Fresno. Key components of the TCC project are transformative public infrastructure investments, including: complete streets that will improve High Speed Rail Connectivity in Downtown Fresno, urban greening elements in Chinatown, and a Class I trail in Southwest Fresno. Preliminary design work began in FY 2020.
Highway Litter Control: Through a joint effort with Caltrans and the Fresno County
C - 8 FY 2020-2021 Final Revised Budget
FY 2021-2025 Capital Improvement Program
Transportation Authority (FCTA), the City of Fresno awarded a contract in FY 2020 for litter abatement along the Highway system throughout Fresno.
Blackstone and McKinley Grade Separation: The Fresno County Transportation Authority awarded (FCTA) $6 million of Measure C funding to the City of Fresno to begin design and environmental studies to build two railroad grade separations at Blackstone and McKinley Avenues just east of Fresno City College. This project will help to relieve traffic congestion, improve air quality, increase transit reliability, and improve public safety.
THE PARKS, AFTER SCHOOL, RECREATION &
COMMUNITY SERVICES (PARCS) DEPARTMENT
Approved Council Motions Per the Revised Budget Hearings
Motion #4 directed staff to identify up to$500,000 for the Maxie L. Parks Community Center to begin the contamination mitigation process. Motion #37 then stipulated that the funding should come from the Brownfield or other cleanup funding, and if these funds are not be available, then funding approved via Motion #13 is to be utilized.
Motion #31 allocated up to $250,000 towards improvements at Logan Park, including complete irrigation system upgrade and tot lot safety repairs. This motion is to be funded by the $5 million approved in Motion #13.
The Department’s focus in FY 2021 will concentrate on several multi-year projects including the following:
New Multi-Generational Community Center In FY 2020, the site for this center was changed to be constructed within Large Park, located at 4424 N. Millbrook and funded primarily
through a Section 108 loan through CDBG HUD funding. Current phase with community engagement and design is scheduled to be completed in FY 2021.
CDBG Multi-year Capital Improvements Maxie L Park HVACs: A total of $900,000 has been identified for this multi-year project through CDBG grant funding. The project scope will include replacing existing swamp coolers with HVAC system. Phase I will continue in FY 2021, which includes design and environmental assessment.
Fink-White Splash Pad: $900,000, has been identified for this multi-year project through CDBG grant funding for the design and construction of a Splash Pad. Phase II construction is expected to occur in FY 2021.
Frank H Ball: $300,000 has been allocated to address ADA action plan relating to removing barriers and upgrading restrooms and access.
While the CDBG capital improvements will occur under PARCS’ oversight, the accounting will be managed by Planning and Development in order to strengthen financial compliance with the U.S. Department of Housing and Urban Development’s eligibility requirements. Additional detail can be found in the Planning and Development Department’s section in this book.
New Project funded through General Fund El Dorado Neighborhood Community Center: $1.3 million has been allocated for the purchase of a former Pharmacy located at 5191 N. 6th Street for the purpose of converting into a neighborhood community center with the intent of providing programming for youth through Senior.
FY 2020-2021 Final Revised Budget C - 9
FY 2021-2025 Capital Improvement Program

Carryover Projects • $200,000 for playground replacement and
irrigation improvements at Pilibos Park.• $75,000 for electrical and lighting
improvements at Granny’s Park.
Projects Funded through Continuing Resolution Council Motions • Council Motion #24 – $50,000 for the
relocation of the Roeding Dog Park.• Council Motion #25 – $70,000 for the
reseeding of JSK Soccer Field.• Council Motion #28 – $200,000 for the
Tollhouse Tot Lot and ADA improvements.• Council Motion #29 – $100,000 to add a
playground misting system at El DoradoPark.
• Council Motion #30 – $200,000 to addadditional lighting on the northwest cornerof Vinland Park.
• Council Motion #38 – $10,000 for upgradesto security at River Bottom Park.
• Council Motion #39 – $100,000 for a shadestructure at Logan Park.
THE AIRPORTS DEPARTMENT
Airports’ FY 2021 Capital Improvement Program totals $79.5 million. Project costs will be funded with California Infrastructure and Economic Development Bank (IBank) bond proceeds, Airport Improvement Program (AIP) Grants, Passenger Facility Charges, Measure C local transportation funds, and Airports’ cash from users of airport facilities. The FY 2021 budget is made up of the following:
(a) Projects defined in the Master PlanUpdate, branded FATForward, and needed to accommodate future passenger growth; and,
(b) Projects required to maintain Airports’physical plant collectively create employment, stimulate the regional economy, and have no City General Fund cost impact.
C - 10 FY 2020-2021 Final Revised Budget
FY 2021-2025 Capital Improvement Program

FATForward – Parking Garage Construction As recommended by the Master Plan, Airports will complete design and begin construction of a parking garage that will feature three parking levels with 300 stalls each, for a total of 900 stalls. The project will include roadway, utility infrastructure, circulation and way-finding improvements. The FY 2021 budget provides $38.8 million for this project, which will be funded with IBank bond proceeds and Airports’ cash.
FATForward – Terminal East Apron Design & Construction The FY 2021 budget provides $9.4 million for the Terminal East Apron Design and Construction project, which will be funded with a federal grant. This project is an element of the Terminal Expansion recommended in the Master Plan, which includes a new Domestic/ International concourse, two additional hold rooms with passenger loading bridges, a new Federal Inspection Station with a larger reception hall sized to accommodate multiple concurrent international arrivals, and an expanded security checkpoint and screening area.
FATForward – Baggage Make-Up The FY 2021 budget provides $17.7 million for the Baggage Make-up Area and Inline System, which will be funded with a federal grant. This project is also part of the overall Terminal Expansion recommended in the Master Plan, and will modernize the screening and processing of baggage.
Airfield and Terminal Improvements These projects reflect Airports’ commitment to provide safe, state-of-the-art, and operationally efficient airside facilities, and a positive terminal passenger experience. Airside improvements include rehabilitating sections of the runway to extend its useful life. Terminal
improvements include rest room renovations, roof rehabilitation, and the upgrade of the public address system. The FY 2021 budget provides $4 million for these projects, which will be funded with Passenger Facility Charges and Airports’ cash reserves.
THE POLICE DEPARTMENT
The Department has budgeted $130,000 bond debt service payment in FY 2021 for the Regional Training Center, which is in accordance with the multi-year lease purchase agreement with the Wastewater Treatment Division. Funding to offset the debt service payments, as well as overall operations and maintenance costs, is generated from fees charged to other agencies for use of the facility.
THE FIRE DEPARTMENT
The Department has budgeted $124,500 to reimburse the General Fund for work previously performed during the Fig Garden Renovation.
THE DEPARTMENT OF TRANSPORTATION (FAX)
The Department’s Capital Improvement Program for FY 2021 focuses heavily on improving all aspects of the customer
experience. Many upcoming projects are designed to
enhance passenger amenities, convenience, and service, and will improve air quality, safety, and transportation options for our community.
The Department’s FY 2021 capital budget of $53 million includes $13 million for the purchase of fixed-route buses, $1.7 million for the purchase of Handy Ride paratransit buses, and $800,000 to replace shop vehicles and other transit support vehicles.
FY 2020-2021 Final Revised Budget C - 11
FY 2021-2025 Capital Improvement Program

Consistent with the Federal Transit Administration (FTA) current focus on a State of Good Repair and Transit Asset Management (TAM), the Department will continue a $20.9 million series of asset maintenance projects in FY 2021. These projects include improvements such as upgrading the bus wash facility, construction of a new vault room, restructure of the employee parking lot, electric bus and vehicle charging infrastructure, new HVAC systems, new solar parking structures, and security features including fire alarm modernization, entry gate improvements, and improved lighting. Another $7.9 million will be utilized to improve infrastructure and accessibility at bus stops along key transit routes, including those along Shaw Avenue, Cedar Avenue, and into Southwest Fresno.
An additional $2.1 million is budgeted to complete signature projects that the Department has been working on over the past few years, including Bus Rapid Transit (BRT) and remodel of the Manchester and Downtown transit centers. Technology improvements valued at $4.2 million will include Transit Signal Priority, a bus Wi-Fi pilot program, and improving the FAX Computer Aided Dispatch/ Automated Vehicle Location system. The Department’s remaining capital budget of $2.6 million includes funds for planning and compliance studies, design-only phases, and service demonstration projects.
C - 12 FY 2020-2021 Final Revised Budget
FY 2021-2025 Capital Improvement Program

FY 2020-2021 Final Revised Budget C - 13
FY 2021-2025 Capital Improvement Program

USER’S GUIDE
Program Scope This section includes the capital projects for all City departments reporting directly to the City Manager. It does not include Redevelopment Agency/FRC projects.
How to use the Capital Improvement
Program Section (CIP) The CIP Section includes a short introductory section which summarizes the CIP; a users’ guide section; a City Capital Summary Section and Department Capital Detail Sections, in which each capital project is described. The contents of each section are discussed briefly below:
The Users’ Guide This section contains information to help the reader use this document. A Glossary is included that contains definitions of terms most frequently used in Capital Budgeting. This is followed by a listing that details the various types of funding resources identified within the summary sections.
Citywide Capital Summary Section This section includes a City roll-up by department for the CIP for FY 2021 through FY 2025.
GLOSSARY
Capital Improvement Program The plan of the City to receive and expend funds for capital projects during the fiscal year covered by the capital budget and the succeeding four fiscal years thereafter.
Capital Budget The plan of the City to receive and expend funds for capital projects scheduled to begin during the first fiscal year included in the capital program.
Capital Project (a) Any physical public betterment or
improvement;
(b) The acquisition of property of apermanent nature for public use; or,
(c) The purchase of equipment for any publicbetterment or improvement when firstconstructed.
Project Authorization The total amount included in an approved CIP for a specific project in the fiscal year the project is included in the Capital Budget (i.e., the Budget Year of an Approved CIP). The amount authorized is the total amount included in the CIP.
Appropriation The amount not previously included in an Approved Capital Budget for a specific project. The amount so included limits the amount which can be spent on that project in the Budget Year unless: (1) prior unexpended or unencumbered appropriations exist; and/or (2) the Capital Budget is amended by Council.
Budget Year Fiscal Year 2021 begins on July 1, 2020 and ends on June 30, 2021. Each subsequent fiscal year is indicated in relation to the budget year.
C - 14 FY 2020-2021 Final Revised Budget
FY 2021-2025 Capital Improvement Program
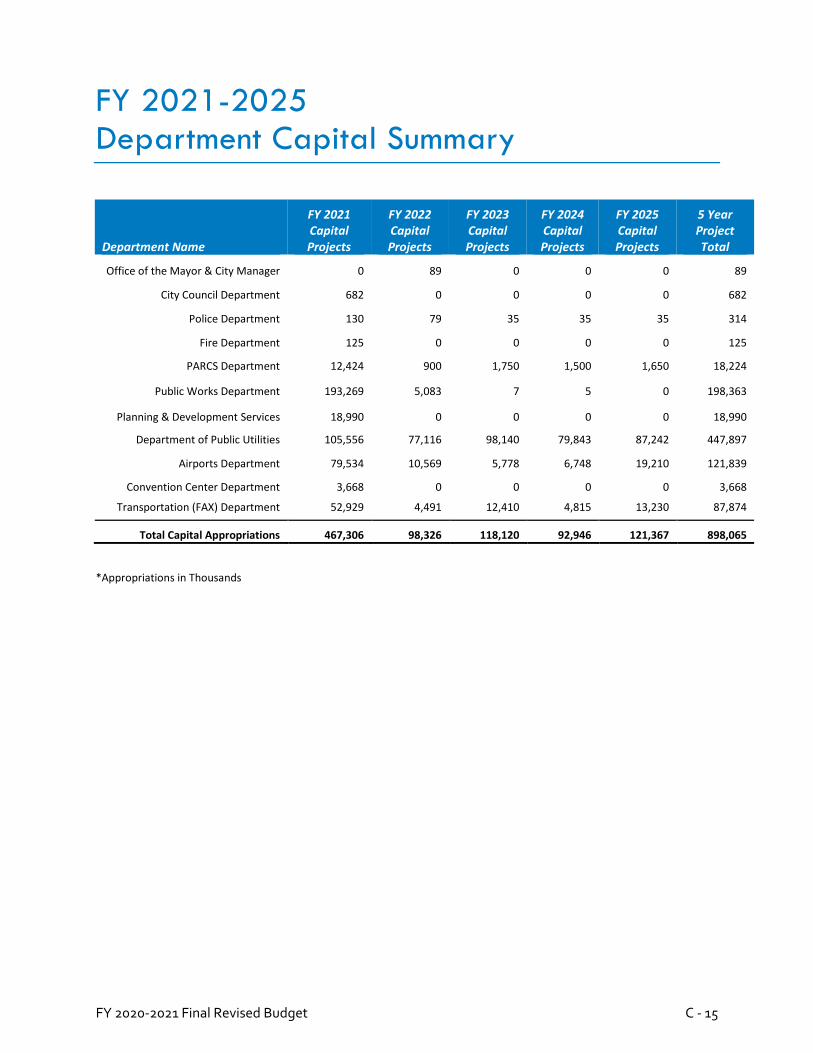
FY 2021-2025 Department Capital Summary
Department Name
FY 2021 Capital Projects
FY 2022 Capital Projects
FY 2023 Capital Projects
FY 2024 Capital Projects
FY 2025 Capital Projects
5 Year Project Total
Office of the Mayor & City Manager 0 89 0 0 0 89
City Council Department 682 0 0 0 0 682
Police Department 130 79 35 35 35 314
Fire Department 125 0 0 0 0 125
PARCS Department 12,424 900 1,750 1,500 1,650 18,224
Public Works Department 193,269 5,083 7 5 0 198,363
Planning & Development Services 18,990 0 0 0 0 18,990
Department of Public Utilities 105,556 77,116 98,140 79,843 87,242 447,897
Airports Department 79,534 10,569 5,778 6,748 19,210 121,839
Convention Center Department 3,668 0 0 0 0 3,668
Transportation (FAX) Department 52,929 4,491 12,410 4,815 13,230 87,874
Total Capital Appropriations 467,306 98,326 118,120 92,946 121,367 898,065
*Appropriations in Thousands
FY 2020-2021 Final Revised Budget C - 15

THIS PAGE WAS INTENTIONALLY LEFT BLANK.
C - 16 FY 2020-2021 Final Revised Budget

Capital Improvement Projects Fund Legend for FY 2020-2021
Fund Fund
Number Title Restrictions
Fund Type: General Fund The general fund is the chief operating fund of a local government. GAAP prescribes that the fund be used "to account for all financial resources except those required to be accounted for in another fund."
10101 General Fund No restrictions other than for public purpose.
Fund Type: Special Revenue Funds Special revenue funds are revenue sources set aside for a specific purpose. For example, a government may levy a tax on gasoline with the express purpose of using the proceeds to finance road maintenance and repair. GAAP provides that special revenue funds may be used to account for the proceeds for specific revenue sources that are legally restricted to expenditure for specified purposes. In practice, this definition encompasses legal restrictions imposed by parties outside government as well as those imposed by the governing body.
20102 Prop. 111 - Special Gas Tax Can only be used for public street purposes both maintenance and improvement.
20103 ABX8 6 Gas Tax (Formerly TCRP) Can only be used for public street purposes both maintenance and improvement.
20104 SB1 Road Repair Gas Tax Can only be used for public street purposes both maintenance and improvement.
20501 Community Dev Block Grant Can only be used for programs to benefit lower income, elderly and/or handicapped persons. Also has a location restriction.
20505 Rehab Loan And Grant Trust Limited to uses designated by the Grant.
20503 Revolving Loans - RRP Limited to uses designed by the lending agency.
20515 Neighborhood Stabilization Program Limited to uses designed by the Grant.
21501 Disposition Of Real Property Limited to activities related to the disposition of Real Property.
22003 Pedestrian & Bicycle Facility The funds must be used for bicycle and pedestrian facilities in accordance with the Transit Development Act of 1971 (SB325).
22031 Miscellaneous State Grants - Parks Limited to Parks uses designated by the various grants.
22048 Federal Grants Public Works Limited to uses designated by the Grant.
22056 State Grants Public Works Limited to uses designated by the Grant.
22063 Transformative Climate Communities (TCC) Limited to uses designated by the Grant.
22094 Prop 84 II - PARCS Limited to PARCS Activity.
22095 EDA Grant Limited to uses designated by the Grant.
22096 Housing Related Parks Programs Part of Prop 1C, for the creation, development or rehabilitation of parks and recreation facilities.
22504 Measure C Tier 1 Capital Projects Can only be used for public street purposes both maintenance and improvement as approved by FCTA.
22505 Measure C Transit Can only be used for public street purposes both maintenance and improvement as approved by FCTA.
22506 Measure C-PW Allocation Street Maintenance Can only be used for public street purposes both maintenance and improvement.
22507 Measure C-PW Allocation ADA Compliance Limited to public street purposes connected with ADA compliance.
22508 Measure C-PW Allocation Flexible Fund Limited to public street maintenance and improvement purposes.
22509 Measure C-PW Allocation Pedestrian Trails Limited to street purposes connected with pedestrian trails.
22510 Measure C-PW Allocation Bike Facilities Limited to public street purposes connected with Bike lanes.
22511 Original Measure C - Regional Hwy Program Limited to Public street improvement as approved by FCTA.
FY 2020-2021 Final Revised Budget C - 17

Fund Fund
Number Title Restrictions
Fund Type: Special Revenue Funds – continued
22512 Measure C-Transit (TOD) Programs Limited to street improvements and to increase transit ridership. 22513 Measure "C" Trail Advancement Limited to public trail creation and improvement as approved by FCTA. 22514 Measure C Reimbursement Agreements Limited to projects approved by FCTA. 22515 Measure C New Technology Limited to transportation technology as approved by FCTA.
22516 Measure C Litter Abatement Limited to litter abatement projects approved by FCTA.
22517 Measure C Grade Separation Limited to grade separation projects approved by FCTA.
22601 Regional Trans Mitigation Fee-RTMF Limited to approved regional transportation fee projects.
24001 Street Tree Fees Limited to median island and street landscape tree maintenance. 24009 UGM General Administration Tracks UGM admin costs and is funded by UGM interest revenue. 24017 Parks Special Projects Limited to PARCS capital activity. 24042 Citywide Regional Street Impact Fee To be used for improvements to streets citywide. 24043 Interior Streets & Roundabouts Street Impact Fee To be used for improvements to streets citywide. 24045 Housing Trust Earmark Land banking activities throughout the City. 24052 Regional Street Impact Fee - Copper River To be used for improvements to Copper River.
24053 New Growth Area Street Impact Fees To be used for improvements to streets in new areas. 24054 Sewer Backbone Fee - Copper River Limited to Assessment District Activity. 24055 CFD #9 Comm/Ind Feature Maintenance Limited to Assessment District Activity. 24061 State Contracted Services For public street purposes both maintenance and improvements.
24064 Public Private Partnerships Limited to projects which have been mutually agreed upon.
26001 High Speed Rail Projects Limited to projects connected to High Speed Rail.
26002 High Speed Rail Services Limited to services connected to High Speed Rail.
Fund Type: Capital Funds
GAAP provides for the use of capital projects funds "to account for financial resources to be used for the acquisition or construction of major capital facilities (other than those financed by proprietary funds and trust funds)".
30102 Developer Cash-In-Lieu Improvement Limited to projects/areas for which funds have been collected. 30140 2008 PD Revenue Bonds-Phase I Limited to Central and South East District – RTF.
30142 Convention Center Improvements - Falcons ADA Improvements at the Convention Center. 30144 Local Agency Project Funding-Public Works Funding from Other Local Agencies for improvements.
30149 Police Dept./Natl Air Guard RTC Fund Limited to activities related to the Regional Training Facility. 30152 Parking Garage 7 Improvement 2010 Limited to Improvements at Parking Garage 7. 30154 Cash in Lieu - Loan Limited to projects/areas for which funds have been collected. 30156 Fig Garden Renovation Project Limited to Fig Garden renovation projects. 30157 Southeast Police Station Limited to construction of the Southeast Police Station.
30158 PG&E turnkey LED Retrofit Limited to retrofitting citywide HPS streetlights to LED.
30159 Fire Station #18 Construction Limited to the construction of Fire Station #18.
30160 Animal Shelter Limited to the Animal Shelter construction and operations.
30501 AD 131-Const-Herndon/Milburn Limited to Assessment District Activity.
30502 AD 133-Const-Shaw/Marty Limited to Assessment District Activity.
30503 AD 137-Const-Figarden Park Limited to Assessment District Activity.
30504 AD154-CALCOT Construction Limited to Assessment District Activity.
30506 Landscape Maintenance District No.1 Limited to Assessment District Activity.
30509 Community Facilities District No. 2 Limited to Assessment District Activity.
30510 Community Facilities District No. 4 Limited to Assessment District Activity.
30511 Community Facilities District No. 5 Limited to Assessment District Activity.
30513 Community Facilities District No. 7 Limited to Assessment District Activity.
30514 Community Facilities District No. 8 Limited to Assessment District Activity.
30517 Community Facility District No. 11 Limited to Assessment District Activity.
C - 18 FY 2020-2021 Final Revised Budget
Capital Improvement Projects Fund Legend for FY 2020-2021

Fund Fund
Number Title Restrictions
Fund Type: Capital Funds - continued
30518 CFD #12 Copper River Ranch Limited to Assessment District Activity.
30520 Community Facility District No. 14 Limited to Assessment District Activity.
31501 UGM Neigh Park Service Area 1 For developing new park sites within the service area.
31502 UGM Neigh Park Service Area 2 For developing new park sites within the service area.
31503 UGM Neigh Park Service Area 3 For developing new park sites within the service area.
31504 UGM Neigh Park Service Area 4 For developing new park sites within the service area.
31505 UGM Neigh Park Service Area 5 For developing new park sites within the service area.
31507 UGM Neigh Park Service Area 7 For developing new park sites within the service area. 31509 UGM Parks Citywide Facility Fees Impact fees to be used for the development of new park sites.
31510 UGM Parkland (Quimby) Ded Fee Impact fees to be used for the improvement of existing park sites.
31504 UGM Neigh Park Service Area 4 For developing new park sites within the service area.
31505 UGM Neigh Park Service Area 5 For developing new park sites within the service area.
31507 UGM Neigh Park Service Area 7 For developing new park sites within the service area.
31509 UGM Parks Citywide Facility Fees Impact fees to be used for the development of new park sites.
31510 UGM Parkland (Quimby) Ded Fee Impact fees to be used for the improvement of existing park sites.
31516 UGM Major Street Zone A Limited to UGM Activity.
31517 UGM Major Street Zone B Limited to UGM Activity.
31518 UGM Major Street Zone C Limited to UGM Activity.
31519 UGM Major Street Zone D Limited to UGM Activity.
31520 UGM Major Street Zone E Limited to UGM Activity. 30521 CFD#15 EAST Copper River District Limited to Assessment District Activity. 30522 CFD No. 2 - Reserve Limited to Assessment District Activity. 30523 CFD No. 11 - Reserve Limited to Assessment District Activity. 30524 CFD No. 17 - Sewer Limited to Assessment District Activity. 30522 CFD No. 2 - Reserve Limited to Assessment District Activity. 30523 CFD No. 11 - Reserve Limited to Assessment District Activity. 31521 UGM Major Street Zone E-3 Limited to UGM Activity.
31522 UGM Major Street Zone E-4 Limited to UGM Activity.
31533 UGM Major Bridge Fee Zone C/D2 Limited to UGM Activity.
31534 UGM Major Bridge Fee Zone D-1/E-2 Limited to UGM Activity.
31535 UGM Major Bridge Fee Zone E-1 Limited to UGM Activity.
31536 UGM Maj Bridge Fee Zone E-3 Limited to UGM Activity.
31537 UGM Major Bridge Fee Zone E-4 Limited to UGM Activity.
31538 UGM Major Bridge Fee Zone F Limited to UGM Activity.
31553 UGM Fire Station Service Area 15 Limited to developing fire stations within the service area. 31555 UGM Fire Station #19 Limited to UGM Activity.
31556 UGM Fire Citywide Facility Fees Impact fees to be used for the development of new Fire facilities.
31561 UGM R/R Crossing Audubon & SP Limited to UGM Activity.
31562 UGM RR Cross/At Grade Zone A/B Limited to UGM Activity.
31563 UGM RR Cross at Grade Zone A/C Limited to UGM Activity.
31564 UGM RR Cross Grade Zone A/D Limited to UGM Activity.
31565 UGM RR Cross/AG Zone E/1-A Limited to UGM Activity.
31566 UGM RR Cross at Grade Zone C/D1 Limited to UGM Activity.
31567 UGM at Grade Railroad Crossing Limited to UGM Activity.
31577 UGM Grade Separation Zone E/4A Limited to UGM Activity.
FY 2020-2021 Final Revised Budget C - 19
Capital Improvement Projects Fund Legend for FY 2020-2021

Fund Fund Number Title Restrictions Fund Type: Capital Funds - continued
31578 UGM Traffic Signal Limited to UGM Activity.
31585 Community Facilities District No. 2005-01 Limited to Assessment District Activity.
31586 UGM Police Citywide Facility Impact Fee Impact fees to be used for the development of new Police facilities.
31588 Fancher Creek Project Fin District Limited to UGM Activity.
31620 Major Street Const. Friant Rd Widen Friant Road Widening.
31625 R/W Acquisition Tract 5206 Limited to Tract 5206 Right of Way Activity.
31633 R/W Acquisition-Tract 5237 Limited to Tract 5237 Right of Way Activity. 31641 R/W Acquisition - Tract 5232 Limited to Tract 5232 Right of Way Activity. 31643 AD #131 UGM Reimbursements Limited to UGM Activity.
31649 R/W Acquisition - Tract 5273 Limited to Tract 5273 Right of Way Activity.
31650 R/W Acquisition – Plan Map 2008-13 Limited to Plan Map 2008-13 Right of Way Activity.
31651 R/W Acquisition-T5770 & T5567 Limited to Tract 5770 & 5567 Right of Way Activity.
31652 R/W Acquisition – T5531 Limited to Tract 5531 Right of Way Activity.
31653 R/W Acquisition - T6095 Limited to Tract 6095 Right of Way Activity.
31654 R/W Acquisition – T6124 Limited to Tract 6124 Right of Way Activity. 31655 R/W Acquisition – T5341, T5424, T5501 Limited to Tract 5341, 5424, 5501 Right of Way Activity. 31656 R/W Acquisition – T6163 Limited to Tract 6163 Right of Way Activity. 31657 R/W Acquisition - T6052 Limited to Tract 6052 Right of Way Activity.
31658 R/W Acquisition – T6139 Limited to Tract 6139 Right of Way Activity. 31659 R/W Acquisition – T6056 Limited to Tract 6056 Right of Way Activity. 31660 UGM Fire Station 10 Relocation Limited to UGM Activity. 31662 UGM Fire Station 12 Improvements Limited to UGM Activity. 31663 UGM Fire Station 24 Limited to UGM Activity. 31664 UGM Fire Station 25 Limited to UGM Activity. 31670 R/W Acquisition-Tract 5538 Limited to Tract 5538 Right of Way Activity.
31671 R/W Acquisition-Tract 6215 Limited to Tract 6215 Right of Way Activity.
31672 R/W Acquisition - T6210 Limited to Tract 6210 Right of Way Activity.
31673 R/W Acquisition - Tract 6214 Limited to Tract 6214 Right of Way Activity.
Fund Type: Enterprise Funds
An enterprise fund may be used to report any activity for which a fee is charged to external users for goods or services. GAAP requires the use of an enterprise fund whose principal revenue source is (1) debt backed solely by fees and charges; (2) legal requirement to cover costs; (3) policy decision to recover costs.
40101 Water Enterprise Fund Limited to Water Enterprise Activity.
40103 Water Connection Charge Fund Limited to Water Enterprise Activity.
40110 DBCP Recovery Fund Limited to Water Enterprise Activity.
40116 SE Fresno Project Bond Fund Limited to Water Enterprise Activity.
40120 Woodward Park Plan Service Recharge Limited to Water Enterprise Activity.
40121 UGM Well Development Service Area 142 Limited to UGM Activity.
40122 UGM Water Area 201S-Single Well Limited to UGM Activity.
40123 UGM Water Area 301S-Single Well Limited to UGM Activity.
40124 UGM Water Area 101S-Single Well Limited to UGM Activity.
40127 Wellhead Treatment Area 101-S Limited to UGM Activity.
40128 UGM Well Development Service Area 11-A Limited to UGM Activity.
40129 UGM Well Development Service Area 86 Limited to UGM Activity.
40130 UGM Well Development Service Area 90 Limited to UGM Activity.
C - 20 FY 2020-2021 Final Revised Budget
Capital Improvement Projects Fund Legend for FY 2020-2021

Fund Fund Number Title Restrictions Fund Type: Enterprise Funds - continued
40131 UGM Well Division Service Area 91 Limited to UGM Activity.
40132 UGM Well Development Service Area 102 Limited to UGM Activity.
40133 UGM Well Develop Service Area 107 Limited to UGM Activity. 40134 UGM Well Develop Service Area 132 Limited to UGM Activity. 40135 UGM Well Development Service Area 141 Limited to UGM Activity.
40136 UGM Well Development Service Area 153 Limited to UGM Activity.
40138 UGM Well Develop Service Area 310 Limited to UGM Activity.
40140 UGM Trans Grid Service Area A Limited to UGM Activity.
40141 UGM Trans Grid Service Area B Limited to UGM Activity.
40142 UGM Trans Grid Service Area C Limited to UGM Activity.
40143 UGM Trans Grid Service Area D Limited to UGM Activity.
40144 UGM Trans Grid Service Area E Limited to UGM Activity.
40147 Orange Center School District Loan Limited to Water Enterprise Activity.
40148 UGM Bond Debt Service Area 101 Limited to UGM Activity.
40150 UGM Bond Service Area 305S Limited to UGM Activity.
40152 UGM Bond Debt Service Area 501s Limited to UGM Activity.
40156 Recharge Area 301-S Limited to UGM Activity.
40158 Recharge Area 501s Limited to UGM Activity.
40159 UGM NE Recharge Site Limited to UGM Activity.
40161 SRF Kings River Pipeline Loan Limited to Water Enterprise Activity. 40162 SRF Regional Transmission Mains Loan Limited to Water Enterprise Activity. 40163 Wellhead Treatment Area 201S Limited to UGM Activity.
40164 Wellhead Treatment Area 301 S Limited to UGM Activity.
40165 Wellhead Treatment Area 401-S Limited to UGM Activity.
40166 Wellhead Treatment Area 501S Limited to UGM Activity.
40168 Copper River Ranch Water Infrastructure Limited to Water Enterprise Activity. 40169 SRF Corrosion Inhibitor Feed Sys. Line Limited to Water Enterprise Activity.
40173 UGM Water Supply Area 401-S Multi Limited to UGM Activity.
40174 UGM Water Supply Area 501 S Single Limited to UGM Activity.
40178 UGM Well Develop Service Area 136 Limited to UGM Activity. 40179 UGM Well Develop Service Area 137 Limited to UGM Activity. 40184 SRF Loan-Friant Kern Canal Pipeline Limited to Water Enterprise Activity.
40188 Low Interest SRF Loan Limited to Water Enterprise Activity.
40195 USDA Dale Ville Water Line Grant Limited to Water Enterprise Activity.
40197 TCP Settlement Fund Limited to Water Enterprise Activity.
40198 SRF NEWTF 6MG TANK CLWL2 LN Limited to Water Enterprise Activity.
40201 WTRSMT GRNT FRIANT KERN CNL PL Limited to Water Enterprise Activity.
40202 Water Capacity Fee Fund Limited to Water Enterprise Activity.
40203 Prop1 GW 123-TCP Planning Grant Limited to Water Enterprise Activity.
40209 Prop1 P117 P284 PCE Contra Grant Limited to Water Enterprise Activity.
40501 Wastewater Enterprise Limited to Wastewater/Sewer Activity.
40513 Cornelia Sewer Trunk Fee Limited to Wastewater/Sewer Activity.
40514 Grantland Sewer Trunk Fee Limited to Wastewater/Sewer Activity.
40515 Herndon Sewer Trunk Fee Limited to Wastewater/Sewer Activity.
40516 Fowler Sewer Trunk Fee Limited to Wastewater/Sewer Activity.
FY 2020-2021 Final Revised Budget C - 21
Capital Improvement Projects Fund Legend for FY 2020-2021

Fund Fund Number Title Restrictions Fund Type: Enterprise Funds - continued
40526 WW/SW Phase II Bond Capital Limited to Wastewater/Sewer Activity.
40528 State Revolving Loan Fund 2016 Limited to Wastewater/Sewer Activity.
40536 Biomethane Generation Limited to Wastewater/Sewer Activity.
40540 UGM Area-wide Oversize Sewer Limited to Wastewater/Sewer Activity.
40591 UGM Lift Station / APU Service Area Limited to Wastewater/Sewer Activity.
40592 UGM Millbrook Olay Sewer Fee Limited to Wastewater/Sewer Activity.
40595 Sewer Lateral Revolving Fund Limited to Wastewater/Sewer Activity.
41001 Solid Waste Enterprise Limited to Solid Waste Activity.
41003 City Landfill Closure Limited to Solid Waste Activity.
41501 Community Sanitation Operating Limited to Activities related to Community Sanitation.
42005 IBank Private Placement Bond Limited to Airport Activity.
42025 Airways Golf Course Capital Limited to Airport Activity.
42040 Airport Federal Grants Limited to Airport Activity.
42042 Airport Capital Limited to Airport Activity.
42045 Airports Consolidated Rental Car Facility For Consolidated Rental Car Facility construction related activity.
42048 CRCF Reserve Fund For Consolidated Rental Car Facility related activity.
42049 PFC Capital Fund Limited to Airport Activity.
42051 Terminal/FIS Project Limited to Airport Activity.
43006 Convention Center Capital Limited to Convention Center Activity.
43524 Miscellaneous Clean Air Grants Limited to Transit Activity.
43525 FAX Capital Limited to Transit Activity.
43532 Transportation CMAQ Capital Limited to Transit Activity.
43538 Prop 1B-CTSGP Transit Sec Grant Limited to Transit Activity.
43539 FTA 5310 Grants (FY07-08 Forward) Limited to Transit Activity.
43542 Prop 1B - PTMISEA Transit Grant Limited to Transit Activity.
43543 5316 JARC Grants Limited to Transit Activity.
43544 5317 New Freedom Grants Limited to Transit Activity.
43546 FY10 FTA 5307 Grant CA-90-YXXX Limited to Transit Activity.
43547 FY2011 FTA 5309 Grant CA-04-0213 Limited to Transit Activity.
43548 FTA Small Starts Grant Limited to Transit Activity.
43550 FY 2011 FTA 5907 Grant CA-90-Yxxx Limited to Transit Activity.
43551 FY10-FY12 CMAQ Grants Limited to Transit Activity.
43552 FY10 FTA 5308 Grant CA-58-0007 Limited to Transit Activity.
43553 FY2012 FTA 5307 Grant CA-90-Y947 Limited to Transit Activity.
43554 FY2011 FTA CMAQ Grant CA-95-X181 Limited to Transit Activity.
43555 FY2013 FTA 5307 Grant CA-90-Yxxx Limited to Transit Activity.
43558 TIRCP Grants-State Cap & Trade Limited to Transit Activity.
43559 FY14 FTA 5307 Grant CA Limited to Transit Activity.
43560 FY13 5339 Grant CA-2016-## Limited to Transit Activity.
43561 FY12 FTA 5309 Grant CA-04-0280 Limited to Transit Activity.
43562 FY15 FTA 5307 Grant CA-90-Z### Limited to Transit Activity.
43563 FY16 FTA 5307 Grant CA – 90 – Z### Limited to Transit Activity.
43564 State Cap & Trade - LCTOP Limited to Transit Activity.
43565 FY17 FTA 5307 Grant CA-2017-## Limited to Transit Activity.
43566 FY17 FTA CMAQ Grant CA-2017-## Limited to Transit Activity.
C - 22 FY 2020-2021 Final Revised Budget
Capital Improvement Projects Fund Legend for FY 2020-2021

Fund Fund Number Title Restrictions Fund Type: Enterprise Funds - continued
43567 FY17 FTA 5307 Grant CA-2018-## Limited to Transit Activity.
43568 FY19 FTA 5307 Grant CA-2019-## Limited to Transit Activity. 43569 SB-1 SGR Grants Limited to Transit Activity. 43570 FY18 FTA 5339 Grant CA-2019-## Limited to Transit Activity. 43571 FY20 FTA 5307 Grant CA-2020-## Limited to Transit Activity. 43572 FY21 FTA 5307 Grant CA-2021-## Limited to Transit Activity. 43573 FTA CARES Act Grant CA-2021-## Limited to Transit Activity. 43574 CCI-Clean Mobility Program Funding Limited to Transit Activity. 43592 Transit Asset Maintenance Limited to Transit Activity.
46501 PW Special Project Revolving Fund Limited to street maintenance or improvement requested by outside agencies as well as neighboring cities.
47003 Stadium Capital For improvements at the Stadium.
47004 Stadium Capital Reserve For improvements at the Stadium.
FY 2020-2021 Final Revised Budget C - 23
Capital Improvement Projects Fund Legend for FY 2020-2021

THIS PAGE WAS INTENTIONALLY LEFT BLANK.
C - 24 FY 2020-2021 Final Revised Budget

FISC
AL
YEA
R 2020-
20
21
CA
PIT
AL
IMPRO
VEM
ENT
PRO
GRA
M
BY
DEP
ARTM
ENT
/ P
RO
JEC
T
FY 2020-2021 Final Revised Budget C - 25

City
of F
resn
oR
un D
ate:
11/3
0/20
FY 2
021
- FY
2025
Cap
ital I
mpr
ovem
ent P
rogr
amR
un T
ime:
9:50
:35
AM
Dep
artm
ent /
Pro
ject
0100
00 -
City
Cou
ncil
Dep
artm
ent
XC00
001
CN
L D
ist.
1 In
frast
ruct
ure
10
122,
900
00
00
122,
900
XC00
002
CN
L D
ist.
2 In
frast
ruct
ure
20
159,
100
00
00
159,
100
XC00
003
CN
L D
ist.
3 In
frast
ruct
ure
35,
200
7,80
00
00
07,
800
XC00
004
CN
L D
ist.
4 In
frast
ruct
ure
40
131,
700
00
00
131,
700
XC00
005
CN
L D
ist.
5 In
frast
ruct
ure
50
86,7
000
00
086
,700
XC00
006
CN
L D
ist.
6 In
frast
ruct
ure
620
,000
50,3
000
00
050
,300
XC00
007
CN
L D
ist.
7 In
frast
ruct
ure
710
,900
123,
500
00
00
123,
500
Tota
l for
: 010
000
- City
Cou
ncil
Dep
artm
ent
36,1
0068
2,00
00
00
068
2,00
0
1000
00 -
Offi
ce o
f the
May
or a
nd C
ity M
anag
er
PW00
935
Anim
al S
helte
rM
5,50
00
88,8
000
00
88,8
00
Tota
l for
: 100
000
- Offi
ce o
f the
May
or a
nd C
ity M
anag
er5,
500
088
,800
00
088
,800
1500
00 -
Polic
e D
epar
tmen
t
DC
0000
2R
egio
nal T
rain
ing
Faci
lity
327
,000
130,
000
79,1
0035
,000
35,0
0035
,000
314,
100
DC
0000
5SE
Dis
trct P
olic
e St
atio
n5
1,03
9,60
00
00
00
0
Tota
l for
: 150
000
- Pol
ice
Dep
artm
ent
1,06
6,60
013
0,00
079
,100
35,0
0035
,000
35,0
0031
4,10
0
1600
00 -
Fire
Dep
artm
ent
XC00
029
Fire
Sta
tion
Ren
ovat
ions
Pha
se I
M0
124,
500
00
00
124,
500
XC00
036
UG
M F
ire S
tatio
n 18
243
8,10
00
00
00
0
Tota
l for
: 160
000
- Fire
Dep
artm
ent
438,
100
124,
500
00
00
124,
500
Proj
ect
Proj
ect N
ame
Dis
tric
t
Cap
ital
Proj
ects
FY
2020
Estim
ate
2021
Cap
ital
Proj
ects
2022
Cap
ital
Proj
ects
2023
Cap
ital
Proj
ects
2024
Cap
ital
Proj
ects
2025
Cap
ital
Proj
ects
5 Ye
arPr
ojec
tTo
tal
FY 2020-2021 Capital Improvement Program by Department / Project
C - 26 FY 2020-2021 Final Revised Budget

City
of F
resn
oR
un D
ate:
11/3
0/20
FY 2
021
- FY
2025
Cap
ital I
mpr
ovem
ent P
rogr
amR
un T
ime:
9:50
:35
AM
Dep
artm
ent /
Pro
ject
1700
00 -
PAR
CS
Dep
artm
ent
PC00
007
Park
s Fa
cilit
ies
Reh
abM
44,9
005,
895,
600
900,
000
1,75
0,00
01,
500,
000
1,65
0,00
011
,695
,600
PC00
128
Slur
ry S
eal V
ario
us P
arks
M0
146,
400
00
00
146,
400
PC00
165
Eins
tein
Par
k Im
prov
emen
ts7
025
,000
00
00
25,0
00
PC00
169
Mel
ody
Park
Lig
ht In
stal
latio
n3
24,9
000
00
00
0
PC00
181
Max
ie Im
prov
emen
ts -
Cal
Fire
33,
800
249,
500
00
00
249,
500
PC00
182
Hin
ton
Impr
ovem
ents
30
48,6
000
00
048
,600
PC00
183
Rom
ain
Futs
al C
ourt
70
54,1
000
00
054
,100
PC00
184
Mel
ody
Spla
sh P
ad -
D4
414
5,90
00
00
00
0
PC00
185
Pilib
os Im
prov
emen
ts5
020
0,00
00
00
020
0,00
0
PC00
188
D1
Impr
ovem
ents
-UG
M1
400
89,4
000
00
089
,400
PC00
189
D2
Impr
ovem
ents
-UG
M2
8,40
056
,200
00
00
56,2
00
PC00
190
D3
Impr
ovem
ents
-UG
M3
60,3
0099
,000
00
00
99,0
00
PC00
191
D4
Impr
ovem
ents
-UG
M4
010
9,90
00
00
010
9,90
0
PC00
192
D5
Impr
ovem
ents
-UG
M5
3,60
066
,300
00
00
66,3
00
PC00
193
D6
Impr
ovem
ents
-UG
M6
18,4
0090
,900
00
00
90,9
00
PC00
194
D7
Impr
ovem
ents
-UG
M7
044
,700
00
00
44,7
00
PC00
197
Com
m/S
r Cen
ter -
D4
40
2,02
1,50
00
00
02,
021,
500
PC00
201
Gra
nny’
s Se
curit
y Li
ght U
pgra
de7
075
,000
00
00
75,0
00
PC00
202
Milb
urn/
Dak
ota
Mas
ter P
lan
190
,300
99,8
000
00
099
,800
PC00
203
Mos
qued
a C
IP5
75,4
000
00
00
0
PC00
204
Sout
h To
wer
Par
k C
IP3
030
0,00
00
00
030
0,00
0
PC00
205
St R
est L
ands
capi
ng3
058
,000
00
00
58,0
00
PC00
211
Seni
or C
ente
r - T
BD3
060
0,00
00
00
060
0,00
0
PC00
212
El D
orad
o Bu
ildin
g3
01,
274,
400
00
00
1,27
4,40
0
PC00
213
SEFC
EDA
Park
Con
stru
ct S
uppo
rt3
090
,000
00
00
90,0
00
Proj
ect
Proj
ect N
ame
Dis
tric
t
Cap
ital
Proj
ects
FY
2020
Estim
ate
2021
Cap
ital
Proj
ects
2022
Cap
ital
Proj
ects
2023
Cap
ital
Proj
ects
2024
Cap
ital
Proj
ects
2025
Cap
ital
Proj
ects
5 Ye
arPr
ojec
tTo
tal
FY 2020-2021 Capital Improvement Program by Department / Project
FY 2020-2021 Final Revised Budget C - 27

City
of F
resn
oR
un D
ate:
11/3
0/20
FY 2
021
- FY
2025
Cap
ital I
mpr
ovem
ent P
rogr
amR
un T
ime:
9:50
:35
AM
Dep
artm
ent /
Pro
ject
1700
00 -
PAR
CS
Dep
artm
ent
PC00
214
Roe
ding
Dog
Par
k R
eloc
atio
n3
050
,000
00
00
50,0
00
PC00
215
Khal
ra S
occe
r Fie
ld R
e-Se
ed3
070
,000
00
00
70,0
00
PC00
216
Tollh
ouse
Tot
Lot
/AD
A Im
prov
30
200,
000
00
00
200,
000
PC00
217
ElD
orad
o To
t Lot
Mis
ting
Sys
30
100,
000
00
00
100,
000
PC00
218
Vinl
and
Addi
tiona
l Lig
htin
g3
020
0,00
00
00
020
0,00
0
PC00
219
Riv
er B
otto
m S
ecur
ity U
pgra
des
30
10,0
000
00
010
,000
PC00
220
Loga
n Pa
rk S
hade
Stru
ctur
e3
010
0,00
00
00
010
0,00
0
Tota
l for
: 170
000
- PA
RC
S D
epar
tmen
t47
6,30
012
,424
,300
900,
000
1,75
0,00
01,
500,
000
1,65
0,00
018
,224
,300
1800
00 -
Publ
ic W
orks
Dep
artm
ent
PW00
044
Min
or P
ublic
Impr
ovem
ents
M0
1,44
0,50
00
00
01,
440,
500
PW00
080
Mis
cella
neou
s Bi
ke R
oute
sM
051
2,90
00
00
051
2,90
0
PW00
085
Sale
/Pur
chse
-Rea
l Pro
prty
M2,
000
22,2
005,
000
5,00
05,
000
037
,200
PW00
086
UG
M G
ener
al A
dmin
istra
tion
M0
469,
800
00
00
469,
800
PW00
093
Land
scap
e Li
ghtin
g D
istri
ctM
014
,400
00
00
14,4
00
PW00
095
Asse
ssm
ent D
ist 1
312
048
,900
00
00
48,9
00
PW00
096
Asse
ssm
ent D
ist 1
54 C
alco
t2
020
6,90
00
00
020
6,90
0
PW00
097
Com
mun
ity F
acilit
ies
2M
035
,800
00
00
35,8
00
PW00
098
Com
mun
ity F
acilit
ies
46
071
0,40
00
00
071
0,40
0
PW00
240
Com
mun
ity F
acilit
ies
Dis
t. 5
30
1,60
00
00
01,
600
PW00
254
CFD
#7
60
237,
600
00
00
237,
600
PW00
260
CFD
#8 -
The
Zone
40
2,10
00
00
02,
100
PW00
261
UG
M B
iann
ual R
eim
burs
emen
tM
011
,108
,400
00
00
11,1
08,4
00
PW00
268
ADA
Infra
stru
ctur
e C
ompl
ianc
eM
01,
139,
400
00
00
1,13
9,40
0
PW00
287
UG
M R
/W T
ract
520
63
09,
900
00
00
9,90
0
Proj
ect
Proj
ect N
ame
Dis
tric
t
Cap
ital
Proj
ects
FY
2020
Estim
ate
2021
Cap
ital
Proj
ects
2022
Cap
ital
Proj
ects
2023
Cap
ital
Proj
ects
2024
Cap
ital
Proj
ects
2025
Cap
ital
Proj
ects
5 Ye
arPr
ojec
tTo
tal
FY 2020-2021 Capital Improvement Program by Department / Project
C - 28 FY 2020-2021 Final Revised Budget

City
of F
resn
oR
un D
ate:
11/3
0/20
FY 2
021
- FY
2025
Cap
ital I
mpr
ovem
ent P
rogr
amR
un T
ime:
9:50
:35
AM
Dep
artm
ent /
Pro
ject
1800
00 -
Publ
ic W
orks
Dep
artm
ent
PW00
322
CFD
200
5-01
TR
535
0 R
un H
orse
30
500
00
00
500
PW00
338
Vetrn
s Bl
vd/H
wy
99 &
UPR
R P
ass
27,
900
523,
800
00
00
523,
800
PW00
348
CFD
#14
Run
ning
Hor
se3
083
,700
00
00
83,7
00
PW00
353
R/W
Acq
uisi
tion
Trac
t 523
74
082
,200
00
00
82,2
00
PW00
355
CFD
#11
Fea
ture
Mai
nten
ance
M0
223,
100
00
00
223,
100
PW00
364
Bicy
cle
Publ
ic S
ervi
ce A
nnou
nce
M0
20,0
000
00
020
,000
PW00
447
CFD
12
Cop
per R
iver
Mai
nt D
ist
60
589,
000
00
00
589,
000
PW00
461
ADA
Infra
stru
ctur
e - M
inor
Cap
M0
51,0
000
00
051
,000
PW00
490
Asse
ssm
ent D
istri
ct #
137
- C
onst
ruct
ion
20
300,
600
00
00
300,
600
PW00
518
Com
m F
acilit
ies
Dis
t #9
M0
87,8
000
00
087
,800
PW00
526
TS C
edar
& W
oodw
ard
50
693,
100
00
00
693,
100
PW00
534
Peac
h Av
e Je
nsen
to B
utle
r5
04,
399,
800
00
00
4,39
9,80
0
PW00
536
CFD
#2 R
eser
veM
021
2,40
00
00
021
2,40
0
PW00
539
CFD
#11
Res
erve
M0
482,
700
00
00
482,
700
PW00
540
CFD
#9 R
eser
veM
02,
600
00
00
2,60
0
PW00
567
Fanc
her C
reek
Fin
anci
ng C
FD5
01,
200
00
00
1,20
0
PW00
585
Suga
r Pin
e Tr
ail P
k &
Rid
e W
il6
042
,100
00
00
42,1
00
PW00
596
TS B
utle
r & W
illow
540
09,
900
00
00
9,90
0
PW00
619
Offi
cal P
lan
Line
s: T
empe
ranc
e, N
orth
M0
2,00
00
00
02,
000
PW00
639
Min
or T
rail
Impr
ovem
ents
M0
62,4
000
00
062
,400
PW00
659
CFD
15
EAST
Cop
per R
iver
Mai
nt D
istri
ctM
01,
200
00
00
1,20
0
PW00
661
Fulto
n M
all I
mpr
ovem
ents
30
256,
900
00
00
256,
900
PW00
663
HSR
Mas
ter C
oope
rativ
e Ag
reem
ent
M0
426,
000
00
00
426,
000
PW00
669
Vete
rans
Blv
d R
ight
-Of-W
ay2
1,20
01,
390,
400
00
00
1,39
0,40
0
PW00
676
TS S
hiel
ds &
Web
er1
06,
000
00
00
6,00
0
Proj
ect
Proj
ect N
ame
Dis
tric
t
Cap
ital
Proj
ects
FY
2020
Estim
ate
2021
Cap
ital
Proj
ects
2022
Cap
ital
Proj
ects
2023
Cap
ital
Proj
ects
2024
Cap
ital
Proj
ects
2025
Cap
ital
Proj
ects
5 Ye
arPr
ojec
tTo
tal
FY 2020-2021 Capital Improvement Program by Department / Project
FY 2020-2021 Final Revised Budget C - 29

City
of F
resn
oR
un D
ate:
11/3
0/20
FY 2
021
- FY
2025
Cap
ital I
mpr
ovem
ent P
rogr
amR
un T
ime:
9:50
:35
AM
Dep
artm
ent /
Pro
ject
1800
00 -
Publ
ic W
orks
Dep
artm
ent
PW00
678
TS C
linto
n &
Vale
ntin
e3
1,00
01,
135,
500
00
00
1,13
5,50
0
PW00
679
Her
ndon
Wid
enin
g Po
lk to
Milb
urn
20
313,
300
00
00
313,
300
PW00
683
Vete
rans
/UPR
R/H
SR O
verp
ass
290
02,
368,
500
00
00
2,36
8,50
0
PW00
686
R/W
Acq
uisi
tion
- Tra
ct 5
352
60
1,60
00
00
01,
600
PW00
688
ITS
Free
way
Cro
ssin
gs C
ityw
ide
M10
00
00
00
0
PW00
696
Hig
h Sp
eed
Rai
l Dev
elop
men
t Ser
vice
sM
350,
000
00
00
00
PW00
704
Gol
den
Stat
e Br
idge
Rep
air
52,
500
00
00
00
PW00
706
Vete
rans
Tra
il H
ayes
to P
olk
250
1,90
03,
600
00
00
3,60
0
PW00
710
Inte
r Im
prov
Cen
tral &
Ora
nge
30
1,57
0,70
00
00
01,
570,
700
PW00
719
R/W
Acq
uisi
tion
- Tra
ct 5
531
50
9,50
00
00
09,
500
PW00
720
Pede
stria
n &
Bike
Tra
il D
evel
oper
Rei
mbu
rsem
ents
M0
150,
000
00
00
150,
000
PW00
721
R/W
Acq
- T5
341
T542
4 T5
501
40
5,50
00
00
05,
500
PW00
725
Shie
lds
Bank
side
Tra
il Fr
esno
to F
irst
70
1,89
5,20
00
00
01,
895,
200
PW00
737
CFD
Irrig
atio
n C
ontro
l Upg
rade
M0
217,
400
00
00
217,
400
PW00
740
BPM
P Br
idge
Mai
nt D
eck
Reh
ab 1
M0
8,00
00
00
08,
000
PW00
743
Her
ndon
ITS
GSB
-Willo
w A
dapt
ivM
044
,500
00
00
44,5
00
PW00
744
BPM
P Br
idge
Mai
nt D
eck
Reh
ab 2
M0
5,20
00
00
05,
200
PW00
745
Fanc
her C
rk T
rail
Clo
vis-
Fow
l5
070
1,00
00
00
070
1,00
0
PW00
747
Blac
ksto
ne S
treet
Lig
htin
g D
ivM
04,
600
00
00
4,60
0
PW00
754
Trac
t 523
2 Be
lmon
t Ave
Wid
e5
053
9,50
00
00
053
9,50
0
PW00
762
Her
ndon
Can
alTr
ail-S
hiel
ds/M
cKi
70
3,15
0,10
00
00
03,
150,
100
PW00
763
McK
inle
yAve
Trai
l-Millb
r/Clo
vis
M0
4,62
4,00
00
00
04,
624,
000
PW00
764
Clo
visA
veTr
ail-M
cKin
to D
ayto
n4
01,
284,
100
00
00
1,28
4,10
0
PW00
767
Ashl
an-E
ffie
to S
R41
Sid
ewal
k7
076
,000
00
00
76,0
00
PW00
768
TS C
hest
nut &
Shi
elds
41,
000
85,4
000
00
085
,400
Proj
ect
Proj
ect N
ame
Dis
tric
t
Cap
ital
Proj
ects
FY
2020
Estim
ate
2021
Cap
ital
Proj
ects
2022
Cap
ital
Proj
ects
2023
Cap
ital
Proj
ects
2024
Cap
ital
Proj
ects
2025
Cap
ital
Proj
ects
5 Ye
arPr
ojec
tTo
tal
FY 2020-2021 Capital Improvement Program by Department / Project
C - 30 FY 2020-2021 Final Revised Budget

City
of F
resn
oR
un D
ate:
11/3
0/20
FY 2
021
- FY
2025
Cap
ital I
mpr
ovem
ent P
rogr
amR
un T
ime:
9:50
:35
AM
Dep
artm
ent /
Pro
ject
1800
00 -
Publ
ic W
orks
Dep
artm
ent
PW00
771
BPM
P Br
idge
Dec
k R
ehab
Pha
se 2
M0
18,2
000
00
018
,200
PW00
774
Shie
lds
Av T
rail-
Blck
stn
Frsn
o7
01,
494,
800
00
00
1,49
4,80
0
PW00
780
TS D
akot
a &
Wes
t LT
Phas
ing
10
10,3
000
00
010
,300
PW00
781
TS B
ulla
rd &
Gra
ntla
nd2
012
5,10
00
00
012
5,10
0
PW00
782
StLi
ghtin
g M
aj R
epai
r Pro
ject
sM
035
0,00
00
00
035
0,00
0
PW00
783
HSR
"G"S
t Rlg
nmnt
CA
-Snt
a An
a3
06,
967,
900
00
00
6,96
7,90
0
PW00
784
Abby
Ove
rlay
Div
isad
ero-
Oliv
e7
01,
369,
100
00
00
1,36
9,10
0
PW00
785
Firs
t Ove
rlay
Allu
vial
-Her
ndon
62,
300
94,0
000
00
094
,000
PW00
786
Jens
en O
vrla
y C
orne
lia-C
hate
au3
04,
074,
100
00
00
4,07
4,10
0
PW00
787
Fria
nt S
B O
vrly
Cha
mpl
ain-
Shep
60
172,
700
00
00
172,
700
PW00
788
Inyo
Ove
rlay
Fulto
n to
O S
t.3
017
7,70
00
00
017
7,70
0
PW00
789
Ashl
an O
verla
y Va
lent
ine-
Wes
t1
042
,000
00
00
42,0
00
PW00
790
Jens
en O
verla
y SR
41-M
LK3
01,
614,
000
00
00
1,61
4,00
0
PW00
791
Blac
ksto
ne O
vrly
Dak
ota-
Ashl
an7
1,50
019
9,10
00
00
019
9,10
0
PW00
792
Belm
ont O
verla
y C
edar
-Che
stnu
t7
031
,100
00
00
31,1
00
PW00
793
Ashl
an A
C O
vrla
y Fi
rst-M
illbro
41,
300
90,7
000
00
090
,700
PW00
794
R/W
Acq
uisi
tion
- Tra
ct 6
095
50
400
00
00
400
PW00
795
Oliv
e Av
e Im
pv Y
osem
ite-R
osvl
tM
01,
184,
100
00
00
1,18
4,10
0
PW00
796
Polk
Ave
Wid
enin
g Sh
aw-G
etty
sb1
01,
117,
200
00
00
1,11
7,20
0
PW00
797
Van
Nes
s In
dust
rial S
treet
Imp
30
415,
200
00
00
415,
200
PW00
799
R/W
Acq
uisi
tion
- Tra
ct 6
124
50
116,
600
00
00
116,
600
PW00
801
Sect
130
RR
McK
inle
y an
d BN
SF7
016
8,20
00
00
016
8,20
0
PW00
802
Sout
h St
adiu
m D
evel
opm
ent
30
291,
500
00
00
291,
500
PW00
803
City
wid
e St
reet
Lig
ht L
ED R
etro
fit -
Phas
e 2
M0
997,
600
00
00
997,
600
PW00
806
LT P
hasi
ng A
udub
on a
nd N
ees
20
505,
000
00
00
505,
000
Proj
ect
Proj
ect N
ame
Dis
tric
t
Cap
ital
Proj
ects
FY
2020
Estim
ate
2021
Cap
ital
Proj
ects
2022
Cap
ital
Proj
ects
2023
Cap
ital
Proj
ects
2024
Cap
ital
Proj
ects
2025
Cap
ital
Proj
ects
5 Ye
arPr
ojec
tTo
tal
FY 2020-2021 Capital Improvement Program by Department / Project
FY 2020-2021 Final Revised Budget C - 31

City
of F
resn
oR
un D
ate:
11/3
0/20
FY 2
021
- FY
2025
Cap
ital I
mpr
ovem
ent P
rogr
amR
un T
ime:
9:50
:35
AM
Dep
artm
ent /
Pro
ject
1800
00 -
Publ
ic W
orks
Dep
artm
ent
PW00
807
TS G
ates
and
San
Jos
e2
069
,600
00
00
69,6
00
PW00
808
TS D
ivis
ader
o an
d M
arip
osa
M2,
800
50,6
000
00
050
,600
PW00
809
ITS
Adap
tive
Blac
ksto
ne_A
bby
M0
1,46
6,00
00
00
01,
466,
000
PW00
810
ITS
Adap
tiveB
lack
ston
e_Fr
iant
M0
232,
100
00
00
232,
100
PW00
811
ITS
Ada
ptiv
e Ve
ntur
a/KC
M0
1,70
9,50
00
00
01,
709,
500
PW00
812
TS T
ular
e an
d "Q
" Stre
et3
078
5,10
00
00
078
5,10
0
PW00
814
Urb
an F
ores
t Tre
e In
vent
ory
M0
462,
900
00
00
462,
900
PW00
815
Cen
tral A
ve S
treet
Impr
ovem
ent
30
1,52
1,70
00
00
01,
521,
700
PW00
818
R/W
Acq
uisi
tion
- Tra
ct 6
163
40
5,60
00
00
05,
600
PW00
819
R/W
Acq
uisi
tion
- Tra
ct 6
052
20
24,8
000
00
024
,800
PW00
820
R/W
Acq
uisi
tion
- Tra
ct 6
139
40
300
00
00
300
PW00
821
R/W
Acq
uisi
tion
- Tra
ct 6
056
10
1,40
00
00
01,
400
PW00
822
R/W
Acq
uisi
tion
- CU
P-17
-057
20
3,30
00
00
03,
300
PW00
824
ADA
Com
plia
nce
Con
vent
ion
Ctr
30
316,
200
00
00
316,
200
PW00
825
TS L
St.
and
Fres
no/T
ular
e St
s3
5,70
014
4,90
00
00
014
4,90
0
PW00
826
R/W
Acq
uisi
tion
- Tra
ct 5
538
30
4,10
00
00
04,
100
PW00
827
Her
ndon
-GSB
to W
illow
Ped
CSH
M0
14,3
000
00
014
,300
PW00
828
Shaw
-Wes
t to
Che
stnu
t Ped
CSH
M0
12,1
000
00
012
,100
PW00
829
BRT-
ATP
Inte
rsec
tion
Impr
ovem
eM
015
5,20
00
00
015
5,20
0
PW00
830
TS: M
arks
& N
iels
en A
venu
es3
1,30
057
,000
00
00
57,0
00
PW00
831
Syst
emic
Saf
ety
Anal
ysis
Rpt
M0
9,30
00
00
09,
300
PW00
833
TS: H
arris
on &
Shi
elds
Ave
nues
10
60,6
000
00
060
,600
PW00
834
Mar
ks O
verla
y As
hlan
to D
akot
a1
057
6,50
00
00
057
6,50
0
PW00
836
TS: B
arst
ow &
Pal
m A
venu
es2
065
1,60
00
00
065
1,60
0
PW00
837
TS: C
alifo
rnia
& W
alnu
t3
010
5,70
00
00
010
5,70
0
Proj
ect
Proj
ect N
ame
Dis
tric
t
Cap
ital
Proj
ects
FY
2020
Estim
ate
2021
Cap
ital
Proj
ects
2022
Cap
ital
Proj
ects
2023
Cap
ital
Proj
ects
2024
Cap
ital
Proj
ects
2025
Cap
ital
Proj
ects
5 Ye
arPr
ojec
tTo
tal
FY 2020-2021 Capital Improvement Program by Department / Project
C - 32 FY 2020-2021 Final Revised Budget

City
of F
resn
oR
un D
ate:
11/3
0/20
FY 2
021
- FY
2025
Cap
ital I
mpr
ovem
ent P
rogr
amR
un T
ime:
9:50
:35
AM
Dep
artm
ent /
Pro
ject
1800
00 -
Publ
ic W
orks
Dep
artm
ent
PW00
838
Ced
ar O
vrly
Bar
stow
to B
ulla
rd4
012
,200
00
00
12,2
00
PW00
839
TS: A
rmst
rong
& L
ane
50
523,
200
00
00
523,
200
PW00
840
Nee
s O
vrly
Fre
sno
to M
illbro
ok6
035
,300
00
00
35,3
00
PW00
842
MLK
Cnt
Act
ive
Tran
s In
frast
r3
072
4,50
00
00
072
4,50
0
PW00
843
McK
inle
y W
iden
Mar
ks to
Hug
hes
30
1,73
2,50
00
00
01,
732,
500
PW00
844
Chi
nato
wn
UG
P - P
roje
ct 1
30
43,4
000
00
043
,400
PW00
845
Chi
nato
wn
UG
P -
Proj
ect 6
30
776,
900
00
00
776,
900
PW00
846
Mar
ipos
a Pl
aza
30
98,6
003,
135,
800
00
03,
234,
400
PW00
849
SW F
resn
o G
reen
Tra
ils &
Cyc
le3
036
1,60
00
00
036
1,60
0
PW00
850
Blac
ksto
ne/M
cKin
ley/
BNSF
FS
M0
25,0
000
00
025
,000
PW00
853
Che
stnu
t OVL
Y Bu
llard
to H
ernd
40
37,5
000
00
037
,500
PW00
854
Bulla
rd O
verla
y C
edar
to F
irst
40
1,45
1,50
00
00
01,
451,
500
PW00
856
TS: C
linto
n &
Angu
s1
064
4,60
00
00
064
4,60
0
PW00
857
MLK
Mag
net C
ore
Park
348
4,80
01,
165,
300
1,33
5,20
00
00
2,50
0,50
0
PW00
858
TCC
Com
mun
ity E
ngag
emen
t Pla
n3
021
1,70
00
00
021
1,70
0
PW00
859
Blac
ksto
ne U
nder
grou
nd E
asem
ent
M0
25,3
000
00
025
,300
PW00
860
Map
le A
ve C
ycle
Tra
ck &
Ped
estri
an4
032
8,60
00
00
032
8,60
0
PW00
861
TCC
Gra
nt A
dmin
istra
tion
30
220,
800
1,50
01,
500
00
223,
800
PW00
862
TCC
Chi
nato
wn
Proj
ect
30
10,8
07,4
000
00
010
,807
,400
PW00
863
TCC
EO
C P
artn
ersh
ip3
01,
081,
800
00
00
1,08
1,80
0
PW00
864
TCC
GR
ID S
olar
Sin
gle-
Fam
ily3
018
4,20
00
00
018
4,20
0
PW00
865
TCC
GR
ID S
olar
Mul
ti-Fa
mily
30
195,
000
00
00
195,
000
PW00
866
TCC
Cle
an S
hare
d M
obilit
y3
05,
212,
600
00
00
5,21
2,60
0
PW00
867
TCC
Ann
adel
e M
ode
Shift
30
85,8
000
00
085
,800
PW00
869
TCC
Yos
emite
Villa
ge3
011
8,90
00
00
011
8,90
0
Proj
ect
Proj
ect N
ame
Dis
tric
t
Cap
ital
Proj
ects
FY
2020
Estim
ate
2021
Cap
ital
Proj
ects
2022
Cap
ital
Proj
ects
2023
Cap
ital
Proj
ects
2024
Cap
ital
Proj
ects
2025
Cap
ital
Proj
ects
5 Ye
arPr
ojec
tTo
tal
FY 2020-2021 Capital Improvement Program by Department / Project
FY 2020-2021 Final Revised Budget C - 33

City
of F
resn
oR
un D
ate:
11/3
0/20
FY 2
021
- FY
2025
Cap
ital I
mpr
ovem
ent P
rogr
amR
un T
ime:
9:50
:35
AM
Dep
artm
ent /
Pro
ject
1800
00 -
Publ
ic W
orks
Dep
artm
ent
PW00
870
TCC
Insi
de O
ut C
omm
Gar
den
30
24,7
000
00
024
,700
PW00
874
TCC
Wor
korc
e D
evel
opm
ent P
lan
30
275,
500
00
00
275,
500
PW00
876
TCC
Wes
t Fre
sno
Sate
llite
Cam
pus
30
5,02
8,00
00
00
05,
028,
000
PW00
877
TCC
Com
m E
ng P
lan
SW T
rails
30
86,1
000
00
086
,100
PW00
878
Mid
tow
n Sc
hool
Are
a In
terc
onn
M0
112,
000
00
00
112,
000
PW00
879
ITS
Dyn
amic
Dow
ntow
n3
01,
667,
800
00
00
1,66
7,80
0
PW00
880
Sout
h Fr
esno
Ped
Cou
ntdo
wn
M0
144,
900
00
00
144,
900
PW00
881
Firs
t St C
orrid
or Im
prov
emen
tsM
2,30
030
,800
00
00
30,8
00
PW00
882
Fres
no S
t Cor
ridor
Impr
ovem
ent
M0
1,60
0,20
00
00
01,
600,
200
PW00
883
Vete
rans
Blv
Con
n Sh
aw-B
arst
ow2
05,
975,
500
00
00
5,97
5,50
0
PW00
884
FY20
Slu
rry S
eal P
roje
cts
M0
92,5
000
00
092
,500
PW00
885
TS L
T Ph
asin
g Bu
tler a
nd C
edar
50
40,0
000
00
040
,000
PW00
886
TS L
T Ph
asin
g Tu
lare
and
U S
t3
038
,700
00
00
38,7
00
PW00
887
Shaw
-SR
99 In
chg
Feas
Stu
dyM
3,00
086
,000
00
00
86,0
00
PW00
888
Fanc
her C
reek
Par
kway
Pla
n5
026
5,40
00
00
026
5,40
0
PW00
889
Free
way
Litt
er A
bate
men
tM
022
0,00
00
00
022
0,00
0
PW00
890
Clin
ton
Wid
enin
g M
arks
-Bra
wle
y3
037
9,00
00
00
037
9,00
0
PW00
891
Ashl
an W
iden
ing
Polk
-Cor
nelia
10
538,
300
00
00
538,
300
PW00
892
Flor
ador
a/Yo
sem
ite S
afe
Rou
tes
07,
400
00
00
00
PW00
893
Mui
r Ele
m S
afe
Rou
tes
to S
ch3
049
0,90
00
00
049
0,90
0
PW00
894
McK
inle
y El
em S
afe
Rou
tes
30
100,
300
00
00
100,
300
PW00
896
FY20
Nei
ghbo
rhoo
d St
reet
Impr
vM
044
6,00
00
00
044
6,00
0
PW00
898
ITS
Ashl
an C
orne
lia-B
lack
ston
eM
012
6,70
00
00
012
6,70
0
PW00
901
TOD
Tow
er a
t Van
Nes
s &
Oliv
eM
028
9,60
00
00
028
9,60
0
PW00
902
Mer
ced
Stre
et R
econ
nect
ion
30
19,5
000
00
019
,500
Proj
ect
Proj
ect N
ame
Dis
tric
t
Cap
ital
Proj
ects
FY
2020
Estim
ate
2021
Cap
ital
Proj
ects
2022
Cap
ital
Proj
ects
2023
Cap
ital
Proj
ects
2024
Cap
ital
Proj
ects
2025
Cap
ital
Proj
ects
5 Ye
arPr
ojec
tTo
tal
FY 2020-2021 Capital Improvement Program by Department / Project
C - 34 FY 2020-2021 Final Revised Budget

City
of F
resn
oR
un D
ate:
11/3
0/20
FY 2
021
- FY
2025
Cap
ital I
mpr
ovem
ent P
rogr
amR
un T
ime:
9:50
:35
AM
Dep
artm
ent /
Pro
ject
1800
00 -
Publ
ic W
orks
Dep
artm
ent
PW00
903
TS B
utle
r/8th
and
Ora
nge/
Low
e5
014
5,60
00
00
014
5,60
0
PW00
904
Hig
h Sp
eed
Rai
l Dev
elop
men
t Svc
sM
039
6,90
00
00
039
6,90
0
PW00
905
TS G
etty
sbur
g/Po
lk &
Sid
ewal
k1
074
2,70
00
00
074
2,70
0
PW00
906
Firs
t St C
ycle
Trk
Tul
are-
Vent
50
802,
500
00
00
802,
500
PW00
907
Barto
n/Fl
oren
ce S
idew
alks
50
416,
000
00
00
416,
000
PW00
908
TS F
resn
o an
d Br
owin
ing
40
86,7
000
00
086
,700
PW00
909
HAW
K Pe
ach-
McK
enzi
e Tr
ail
70
408,
500
00
00
408,
500
PW00
910
Tula
re 6
th-C
edar
Cm
plt S
treet
M0
205,
800
00
00
205,
800
PW00
911
Che
stnu
t AC
Ove
rlay
KC-B
utle
r5
045
,300
00
00
45,3
00
PW00
914
El D
orad
o N
eigh
Alle
y Pa
ving
40
375,
000
00
00
375,
000
PW00
915
TCC
Tec
hnic
al A
ssis
tanc
e G
rant
30
54,3
000
00
054
,300
PW00
916
Trai
l Net
wor
k W
ayfin
ding
Pla
nM
011
1,00
00
00
011
1,00
0
PW00
917
TS W
est &
Sie
rra L
T Ph
asin
g2
061
3,80
00
00
061
3,80
0
PW00
919
TS L
T H
ughe
s &
Shie
lds
10
119,
100
5,20
00
00
124,
300
PW00
920
TS B
lyth
e &
Gat
es2
063
0,00
00
00
063
0,00
0
PW00
922
ITS
Jens
en A
veM
013
4,50
00
00
013
4,50
0
PW00
923
Vets
4b-
Riv
ersi
de to
Her
nd C
on2
040
,000
00
00
40,0
00
PW00
924
FY21
Nei
ghbo
rhoo
d St
reet
Impr
oM
01,
108,
000
00
00
1,10
8,00
0
PW00
926
TOD
Bla
ckst
one
& M
cKin
ley
M0
3,84
4,70
00
00
03,
844,
700
PW00
927
Vets
Pha
3 SR
99 In
t & G
rade
Sep
20
55,4
39,9
000
00
055
,439
,900
PW00
928
Ced
ar A
ve A
C O
vrly
Jen
to H
ami
50
129,
000
00
00
129,
000
PW00
929
Blck
stn
AC O
vrly
Mnr
ts to
Nee
sM
022
6,70
00
00
022
6,70
0
PW00
930
Shaw
St L
ghtn
g, C
edar
to C
hest
40
71,2
000
00
071
,200
PW00
934
Mas
ter T
rails
and
Bik
e Pl
anM
035
,000
00
00
35,0
00
PW00
936
R/W
Acq
uisi
tion
- Tra
ct 6
215
M6,
000
234,
500
00
00
234,
500
Proj
ect
Proj
ect N
ame
Dis
tric
t
Cap
ital
Proj
ects
FY
2020
Estim
ate
2021
Cap
ital
Proj
ects
2022
Cap
ital
Proj
ects
2023
Cap
ital
Proj
ects
2024
Cap
ital
Proj
ects
2025
Cap
ital
Proj
ects
5 Ye
arPr
ojec
tTo
tal
FY 2020-2021 Capital Improvement Program by Department / Project
FY 2020-2021 Final Revised Budget C - 35

City
of F
resn
oR
un D
ate:
11/3
0/20
FY 2
021
- FY
2025
Cap
ital I
mpr
ovem
ent P
rogr
amR
un T
ime:
9:50
:35
AM
Dep
artm
ent /
Pro
ject
1800
00 -
Publ
ic W
orks
Dep
artm
ent
PW00
937
Blac
ksto
ne-M
cKin
ley
Gra
de S
epar
atio
n M
06,
030,
000
00
00
6,03
0,00
0
PW00
938
FY21
Nei
gh C
oncr
ete
Rep
airs
M0
700,
000
00
00
700,
000
PW00
939
NB
Polk
Wid
en S
haw
-Get
tysb
urg
10
800,
000
00
00
800,
000
PW00
940
Arm
stro
ng &
Ham
ilton
Tot
Lot
50
200,
000
00
00
200,
000
PW00
941
R/W
Acq
uisi
tion
- Tra
ct 6
210
40
36,1
000
00
036
,100
PW00
942
R/W
Acq
uisi
tion
- Tra
ct 6
214
40
157,
000
00
00
157,
000
PW00
944
SD C
linto
n Av
e W
O V
alen
tine
30
305,
200
00
00
305,
200
PW00
945
TS: F
owle
r and
Oliv
e 0
020
,000
00
00
20,0
00
PW00
947
Sout
h Fr
esno
AB6
17 T
ruck
Rer
ou0
025
0,00
00
00
025
0,00
0
PW00
948
Ced
ar P
avin
g S
haw
-Bar
stow
00
060
0,00
00
00
600,
000
Tota
l for
: 180
000
- Pub
lic W
orks
Dep
artm
ent
1,38
7,30
019
3,26
9,00
05,
082,
700
6,50
05,
000
019
8,36
3,20
0
4000
00 -
Plan
ning
& D
evel
opm
ent S
ervi
ces
Dep
artm
ent
HC
0001
1H
ousi
ng T
rust
Fun
dM
06,
100
00
00
6,10
0
MC
0001
0Se
c. 1
08 L
oan
Rep
aym
ent
M0
94,6
000
00
094
,600
MC
0001
9M
isce
llane
ous
Proj
ects
M0
44,9
000
00
044
,900
MC
0003
3N
SP A
cqui
sitio
n R
ehab
ilitat
ion
M44
,900
763,
700
00
00
763,
700
PC00
115
Rom
ain
Impr
ovem
ents
70
2,30
00
00
02,
300
PC00
153
Tot L
ot R
epla
cem
ent -
Var
Pks
M30
9,60
032
9,80
00
00
032
9,80
0
PC00
166
Fink
Whi
te P
ark
Impr
ovem
ents
321
,600
387,
800
00
00
387,
800
PC00
176
Lear
ner P
ools
201
7M
15,0
0018
5,60
00
00
018
5,60
0
PC00
178
Pine
dale
AD
A Pr
ojec
ts -
CD
BG2
4,20
042
,500
00
00
42,5
00
PC00
179
Rom
ain
Impr
ovem
ents
- C
DBG
72,
200
22,2
000
00
022
,200
PC00
180
Ted
C W
ills Im
prov
emen
ts -
CD
BG3
02,
200
00
00
2,20
0
PC00
182
Hin
ton
Impr
ovem
ents
30
250,
000
00
00
250,
000
Proj
ect
Proj
ect N
ame
Dis
tric
t
Cap
ital
Proj
ects
FY
2020
Estim
ate
2021
Cap
ital
Proj
ects
2022
Cap
ital
Proj
ects
2023
Cap
ital
Proj
ects
2024
Cap
ital
Proj
ects
2025
Cap
ital
Proj
ects
5 Ye
arPr
ojec
tTo
tal
FY 2020-2021 Capital Improvement Program by Department / Project
C - 36 FY 2020-2021 Final Revised Budget

City
of F
resn
oR
un D
ate:
11/3
0/20
FY 2
021
- FY
2025
Cap
ital I
mpr
ovem
ent P
rogr
amR
un T
ime:
9:50
:35
AM
Dep
artm
ent /
Pro
ject
4000
00 -
Plan
ning
& D
evel
opm
ent S
ervi
ces
Dep
artm
ent
PC00
195
Gra
nny'
s Pa
rk -
CD
BG7
2,30
024
7,80
00
00
024
7,80
0
PC00
196
CA/
Tupm
an Im
p - C
DBG
360
,700
91,6
000
00
091
,600
PC00
197
Com
m/S
r Cen
ter -
D4
46,
200
10,5
96,0
000
00
010
,596
,000
PC00
199
ADA
Tot L
ot C
ompl
ianc
e - C
DBG
M0
160,
000
00
00
160,
000
PC00
200
ADA
Res
troom
s - C
DBG
M0
200,
000
00
00
200,
000
PC00
208
F H
Bal
l AD
A Im
prov
emen
ts3
5,20
029
4,80
00
00
029
4,80
0
PC00
209
Max
ie P
arks
HVA
C D
esig
n3
800
49,3
000
00
049
,300
PC00
210
El D
orad
o M
odul
ar U
nit R
epla
ce3
2,50
024
7,60
00
00
024
7,60
0
PW00
275
Park
ing
Faci
litie
s Im
prov
emen
ts3
1,42
8,80
01,
795,
500
00
00
1,79
5,50
0
PW00
816
FY18
Nei
ghbo
rhoo
d St
reet
Impr
vM
2,22
2,40
080
,000
00
00
80,0
00
PW00
892
Flor
ador
a/Yo
sem
ite S
afe
Rou
tes
00
300,
000
00
00
300,
000
PW00
925
Hig
hway
City
Ngh
brhd
Stre
et R
eM
061
5,00
00
00
061
5,00
0
PW00
931
Wes
t Fre
sno
Elem
& M
LK N
eigh
30
1,15
1,20
00
00
01,
151,
200
PW00
932
Burro
ughs
Ele
m N
eigh
Rec
onst
70
850,
000
00
00
850,
000
PW00
933
Eric
son
Elem
Nei
gh R
econ
st4
017
9,00
00
00
017
9,00
0
Tota
l for
: 400
000
- Pla
nnin
g &
Dev
elop
men
t Ser
vice
s D
epar
tmen
t4,
126,
400
18,9
89,5
000
00
018
,989
,500
4100
00 -
Dep
artm
ent o
f Pub
lic U
tiliti
es
GC
0001
0Ac
quis
ition
M53
8,90
055
0,30
055
0,80
055
6,70
056
2,20
056
7,90
02,
787,
900
GC
0001
6B-
Zone
Wel
ls3
289,
100
289,
800
289,
800
289,
800
289,
800
289,
800
1,44
9,00
0
GC
0001
9D
PU F
leet
Fac
ilitie
s0
02,
899,
600
374,
500
00
03,
274,
100
GC
0002
0C
onve
nien
ce C
ente
rs0
2,10
0,00
02,
713,
600
00
00
2,71
3,60
0
RC
0000
5Em
erge
ncy
Rep
airs
- Sh
ort E
xten
sion
M0
200,
000
200,
000
200,
000
200,
000
200,
000
1,00
0,00
0
RC
0013
0Se
wer
Lat
eral
Rev
olvi
ng P
roj
M30
0,00
030
0,00
030
0,00
030
0,00
030
0,00
030
0,00
01,
500,
000
RC
0013
1M
erce
d (G
lenn
-Tho
rne)
Reh
abM
87,6
0050
0,00
00
00
050
0,00
0
Proj
ect
Proj
ect N
ame
Dis
tric
t
Cap
ital
Proj
ects
FY
2020
Estim
ate
2021
Cap
ital
Proj
ects
2022
Cap
ital
Proj
ects
2023
Cap
ital
Proj
ects
2024
Cap
ital
Proj
ects
2025
Cap
ital
Proj
ects
5 Ye
arPr
ojec
tTo
tal
FY 2020-2021 Capital Improvement Program by Department / Project
FY 2020-2021 Final Revised Budget C - 37

City
of F
resn
oR
un D
ate:
11/3
0/20
FY 2
021
- FY
2025
Cap
ital I
mpr
ovem
ent P
rogr
amR
un T
ime:
9:50
:35
AM
Dep
artm
ent /
Pro
ject
4100
00 -
Dep
artm
ent o
f Pub
lic U
tiliti
esR
C00
133
S. In
d. A
rea
Col
l. Sy
stem
Infra
stru
ctur
e3
100
00
00
00
RC
0014
1Ve
tera
n's
Boul
evar
d Se
wer
239
0,00
021
6,40
08,
500
3,50
090
00
229,
300
RC
0016
7Sh
ield
s Fr
onta
ge S
ewer
Reh
ab7
149,
000
198,
400
1,30
00
00
199,
700
RC
0016
8Sh
erm
an F
irst &
Sag
inaw
Sew
er R
ehab
722
7,00
016
1,50
05,
300
00
016
6,80
0
RC
0016
9M
LK/J
ense
n/Ba
rdel
l/Dor
othy
Sw
r Reh
ab3
1,26
1,00
029
1,60
03,
200
00
029
4,80
0
RC
0017
0Fr
esno
/HSt
Sew
erSi
phon
Rem
oval
33,
000
250,
000
8,20
03,
500
00
261,
700
RC
0017
1Li
ft St
atio
n#LS
1 R
ehab
357
4,00
011
4,50
03,
900
00
011
8,40
0
RC
0017
2R
WR
F Se
wer
Impr
ovem
ents
33,
000
00
00
00
RC
0017
4H
ernd
on M
ilbur
n Ju
nctio
n St
ruc
224
4,00
03,
000
00
00
3,00
0
RC
0017
5O
dor C
ontro
l for
Col
lect
ion
SyM
59,0
0049
7,60
062
5,50
02,
416,
200
2,90
00
3,54
2,20
0
RC
0017
6C
MM
S En
hanc
emen
ts3
330,
000
18,0
000
00
018
,000
RC
0017
7C
olle
ctio
nSys
tem
Reh
abilit
atio
nM
4,70
9,00
07,
106,
800
14,0
81,3
0010
,064
,300
12,0
00,2
0014
,000
,000
57,2
52,6
00
RC
0017
8C
olle
ctio
n Sy
stem
Ext
ensi
onM
966,
400
939,
100
874,
600
1,86
3,60
04,
959,
000
5,01
6,00
013
,652
,300
RC
0017
9C
olle
ctio
n Sy
stem
Exp
ansi
onM
01,
431,
900
2,54
8,30
015
,200
00
3,99
5,40
0
RC
0018
0Li
ft St
atio
n R
ehab
ilitat
ion
M69
6,00
030
0,40
076
,300
75,0
0075
,000
75,0
0060
1,70
0
RC
0018
1C
olle
ctio
nSys
Acc
essS
truct
ures
M17
7,00
040
1,90
037
5,50
037
5,00
037
5,00
037
5,00
01,
902,
400
RC
0018
2Sa
nita
ry S
ewer
Mas
ter P
lan
30
00
400,
000
00
400,
000
RC
0018
3C
ollS
ysLa
rgeD
iam
eter
Trun
kLin
esM
075
0,00
075
0,00
075
0,00
075
0,00
075
0,00
03,
750,
000
TC00
014
RW
RF
Emer
genc
y La
rge
Scal
e R
epai
rsM
132,
000
750,
000
750,
000
750,
000
750,
000
750,
000
3,75
0,00
0
TC00
079
Cen
traliz
ed O
dor C
ontro
l Sys
for P
lant
Pro
cess
316
4,00
075
,700
00
00
75,7
00
TC00
096
Sout
hwes
t Qua
dran
t Rec
ycle
d W
ater
Dis
t Sys
tem
31,
777,
000
3,99
3,70
061
,500
6,70
00
04,
061,
900
TC00
112
WW
Sys
tem
Enh
ance
men
ts/U
pgra
des
30
01,
200,
000
6,50
0,00
07,
500,
000
7,50
0,00
022
,700
,000
TC00
142
Rec
ycle
d W
ater
Sys
tem
Use
r Con
nect
ions
- So
uthw
est
M15
1,00
015
0,00
00
00
015
0,00
0
TC00
154
Ren
ewab
le G
as D
iver
sion
320
0,00
09,
334,
500
18,3
000
00
9,35
2,80
0
TC00
158
Wat
er S
uppl
y R
elia
bilit
y Im
pro
358
,100
30,0
000
00
030
,000
Proj
ect
Proj
ect N
ame
Dis
tric
t
Cap
ital
Proj
ects
FY
2020
Estim
ate
2021
Cap
ital
Proj
ects
2022
Cap
ital
Proj
ects
2023
Cap
ital
Proj
ects
2024
Cap
ital
Proj
ects
2025
Cap
ital
Proj
ects
5 Ye
arPr
ojec
tTo
tal
FY 2020-2021 Capital Improvement Program by Department / Project
C - 38 FY 2020-2021 Final Revised Budget

City
of F
resn
oR
un D
ate:
11/3
0/20
FY 2
021
- FY
2025
Cap
ital I
mpr
ovem
ent P
rogr
amR
un T
ime:
9:50
:35
AM
Dep
artm
ent /
Pro
ject
4100
00 -
Dep
artm
ent o
f Pub
lic U
tiliti
esTC
0015
9Fl
are
Cap
acity
Exp
ansi
on3
113,
000
7,46
7,90
017
7,70
08,
500
00
7,65
4,10
0
TC00
160
RW
RF
Con
ditio
ned
Dig
este
r Gas
322
,000
00
00
00
TC00
164
Hea
dwor
ks B
arsc
reen
31,
000
00
00
00
TC00
165
Res
idua
ls M
aste
r Pla
nM
44,0
000
00
00
0
TC00
168
Boile
r Rep
lace
men
t PG
F3
2,36
8,00
017
3,30
07,
500
00
018
0,80
0
TC00
169
Subs
tatio
n Ex
pans
ion
312
7,00
02,
946,
600
17,3
001,
100
00
2,96
5,00
0
TC00
171
RW
RF
Rec
ycle
d W
ater
Pip
elin
e3
4,00
00
00
00
0
TC00
172
RW
RF
Prop
erty
Gas
Pip
elin
e3
30,0
000
00
00
0
TC00
174
Rec
lam
atio
n W
ell S
yste
m In
terti
e to
Ter
tiary
Tre
atm
ent
M0
4,30
05,
000
5,00
05,
937,
100
355,
800
6,30
7,20
0
TC00
176
RW
RF
Hea
dwor
ksM
494,
000
779,
200
500,
000
500,
000
500,
000
02,
279,
200
TC00
177
RW
RF
Seco
ndar
y Tr
eatm
ent
385
,000
3,62
4,30
056
4,80
021
,890
,400
3,39
6,20
050
,600
29,5
26,3
00
TC00
178
RW
RF
Solid
s Tr
eatm
ent
31,
446,
500
2,31
0,10
01,
871,
800
1,81
7,40
01,
816,
100
23,4
84,0
0031
,299
,400
TC00
179
RW
RF
Efflu
ent H
andl
ing
333
4,00
01,
146,
400
393,
500
310,
900
2,99
7,80
087
6,30
05,
724,
900
TC00
180
RW
RF
Build
ings
/Gro
unds
338
8,00
089
1,80
041
1,00
020
0,00
020
0,00
020
0,00
01,
902,
800
TC00
182
Rec
ycle
d W
ater
Dis
tribu
tion
M20
3,00
03,
510,
300
300,
400
671,
000
3,00
00
4,48
4,70
0
TC00
183
Plan
ning
& P
roje
ct M
anag
emen
tM
1,06
7,00
031
0,50
012
0,00
02,
620,
000
20,0
0020
,000
3,09
0,50
0
TC00
184
Gas
Con
ditio
ning
Sys
tem
Impr
ov3
01,
250,
000
100,
000
100,
000
100,
000
100,
000
1,65
0,00
0
TC00
185
RW
RF
Elec
trica
l3
1,59
0,50
080
4,90
04,
828,
600
3,60
00
05,
637,
100
WC
0000
1Fi
re H
ydra
nt In
stal
latio
nsM
015
,000
15,0
0015
,000
15,0
0015
,000
75,0
00
WC
0000
2Se
rv/M
eter
Inst
alla
tions
2"o
r Les
sM
01,
091,
400
1,12
4,10
01,
157,
800
1,19
2,50
01,
228,
300
5,79
4,10
0
WC
0000
4W
ater
Mai
n Ex
tens
ions
M0
2,76
1,40
01,
068,
000
2,00
1,60
01,
999,
800
2,00
0,00
09,
830,
800
WC
0000
5W
ater
Mai
n R
enew
alM
04,
513,
900
11,8
79,3
007,
728,
200
11,5
43,1
009,
021,
600
44,6
86,1
00
WC
0000
6Se
rv/M
eter
Inst
all A
bove
M
01,
012,
100
493,
000
508,
000
521,
000
541,
100
3,07
5,20
0
WC
0001
4C
ombi
ned/
Mul
tiple
Inst
alla
tion
M0
375,
800
716,
000
752,
100
747,
100
775,
400
3,36
6,40
0
WC
0001
5W
ater
Wel
l Eva
luat
ion
and
Dev
eM
01,
143,
300
403,
200
400,
000
400,
000
400,
000
2,74
6,50
0
Proj
ect
Proj
ect N
ame
Dis
tric
t
Cap
ital
Proj
ects
FY
2020
Estim
ate
2021
Cap
ital
Proj
ects
2022
Cap
ital
Proj
ects
2023
Cap
ital
Proj
ects
2024
Cap
ital
Proj
ects
2025
Cap
ital
Proj
ects
5 Ye
arPr
ojec
tTo
tal
FY 2020-2021 Capital Improvement Program by Department / Project
FY 2020-2021 Final Revised Budget C - 39

City
of F
resn
oR
un D
ate:
11/3
0/20
FY 2
021
- FY
2025
Cap
ital I
mpr
ovem
ent P
rogr
amR
un T
ime:
9:50
:35
AM
Dep
artm
ent /
Pro
ject
4100
00 -
Dep
artm
ent o
f Pub
lic U
tiliti
esW
C00
016
Wat
er W
ell C
onst
ruct
ion
M0
2,87
4,20
03,
264,
700
4,10
7,30
03,
002,
000
3,00
0,00
016
,248
,200
WC
0001
7W
ell R
ehab
ilitat
ion
M0
2,09
5,70
02,
001,
800
2,00
0,00
02,
000,
000
2,00
0,00
010
,097
,500
WC
0001
8Pu
mp
Reh
abilit
atio
nM
093
3,00
031
2,60
030
0,20
030
0,00
030
0,00
02,
145,
800
WC
0002
0G
ranu
lar A
ctiv
ated
Car
bon
M0
6,36
6,60
03,
951,
400
1,17
6,00
03,
000
011
,497
,000
WC
0002
1Su
rface
Wat
er T
reat
men
t Pla
nt6
05,
192,
100
2,68
1,30
02,
300,
000
1,00
0,00
01,
000,
000
12,1
73,4
00
WC
0002
2Le
aky
Acre
s4
025
0,30
025
0,00
025
0,00
010
0,00
010
0,00
095
0,30
0
WC
0002
3W
ater
Tel
emet
ry S
yste
mM
01,
530,
000
600,
000
600,
000
600,
000
600,
000
3,93
0,00
0
WC
0002
4W
ater
Yar
d-Ex
pans
ion/
Impr
ovem
ent
70
50,0
006,
250,
000
6,25
0,00
06,
250,
000
6,25
0,00
025
,050
,000
WC
0002
7In
vent
ory
- Mat
eria
lsM
020
0,00
020
0,00
020
0,00
020
0,00
020
0,00
01,
000,
000
WC
0003
2Bo
oste
r Pum
pM
069
,700
302,
200
500
00
372,
400
WC
0003
3R
echa
rge
Faci
litie
s - B
asin
sM
017
5,00
017
5,00
017
5,00
017
5,00
017
5,00
087
5,00
0
WC
0003
8SW
TP/F
riant
Ker
n C
anal
Pip
elin
e6
035
2,00
014
,000
1,00
00
036
7,00
0
WC
0005
0C
ity R
echa
rge
Basi
nsM
01,
000,
000
1,00
0,00
01,
000,
000
1,00
0,00
01,
000,
000
5,00
0,00
0
WC
0005
1M
etro
Res
ourc
es P
lan
Upd
ate
M0
422,
500
1,86
5,50
024
6,00
010
0,00
010
0,00
02,
734,
000
WC
0005
3Em
erge
ncy
Gen
erat
or S
ets
M0
886,
400
800
00
088
7,20
0
WC
0005
4T-
3 (3
MG
Tan
k in
SE
Fres
no)
50
015
8,60
010
,788
,300
2,47
3,10
013
8,30
013
,558
,300
WC
0005
7SE
Fre
sno
Surfa
ce W
tr Tr
eatm
ent
50
150,
000
00
00
150,
000
WC
0005
8U
GM
101S
Wel
lhea
d Tr
eatm
ent P
rj0
01,
000,
000
00
00
1,00
0,00
0
WC
0006
5SE
/SW
TP T
rans
mis
sion
Pip
elin
es5
078
,600
00
00
78,6
00
WC
0007
4W
ater
Fac
ilitie
s Se
curit
y Im
prM
042
2,20
030
0,00
030
0,00
030
0,00
030
0,00
01,
622,
200
WC
0008
3Pr
ogra
m M
anag
emen
tM
020
,000
20,0
0020
,000
20,0
0020
,000
100,
000
WC
0008
5Tr
ansm
issi
on G
rid M
ains
M0
1,90
0,00
02,
500,
000
00
04,
400,
000
WC
0008
7C
MM
S En
hanc
emen
tsM
026
,500
00
00
26,5
00
WC
0008
9L-
T H
ydra
ulic
& W
Q M
odel
ing
00
150,
000
150,
000
150,
000
150,
000
150,
000
750,
000
WC
0009
1Fl
eet M
aint
enan
ce C
onst
n W
W0
05,
100,
400
00
00
5,10
0,40
0
Proj
ect
Proj
ect N
ame
Dis
tric
t
Cap
ital
Proj
ects
FY
2020
Estim
ate
2021
Cap
ital
Proj
ects
2022
Cap
ital
Proj
ects
2023
Cap
ital
Proj
ects
2024
Cap
ital
Proj
ects
2025
Cap
ital
Proj
ects
5 Ye
arPr
ojec
tTo
tal
FY 2020-2021 Capital Improvement Program by Department / Project
C - 40 FY 2020-2021 Final Revised Budget

City
of F
resn
oR
un D
ate:
11/3
0/20
FY 2
021
- FY
2025
Cap
ital I
mpr
ovem
ent P
rogr
amR
un T
ime:
9:50
:35
AM
Dep
artm
ent /
Pro
ject
4100
00 -
Dep
artm
ent o
f Pub
lic U
tiliti
esW
C00
092
TCP
Rem
edia
tion
00
2,00
0,00
02,
000,
000
2,00
0,00
02,
000,
000
2,00
0,00
010
,000
,000
WC
0009
3W
ater
Ser
vice
Con
nect
ion
Loan
s0
014
,800
15,2
0015
,700
16,2
0016
,700
78,6
00
WC
0009
412
3-TC
P M
itiga
tion
Feas
ibilit
y0
069
5,60
00
00
069
5,60
0
WC
0009
5Po
lyet
hyle
ne R
epla
cem
ent
00
1,00
0,00
01,
000,
000
1,00
0,00
01,
000,
000
1,00
0,00
05,
000,
000
Tota
l for
: 410
000
- Dep
artm
ent o
f Pub
lic U
tiliti
es23
,903
,200
105,
556,
400
77,1
16,1
0098
,140
,100
79,8
43,0
0087
,241
,800
447,
897,
400
4300
00 -
Airp
orts
Dep
artm
ent
AC00
045
Airw
ays
Gol
f Cou
rse
Cap
ital
435
,300
659,
800
00
00
659,
800
AC00
301
Secu
rity
Upg
rade
s4
67,1
0050
,000
75,0
0075
,000
75,0
0075
,000
350,
000
AC00
326
Adm
in B
ldg
HVA
C4
1,00
00
00
00
0
AC00
328
Term
inal
HVA
C R
epla
cem
ent
422
2,70
037
8,30
00
00
037
8,30
0
AC00
329
Park
Lot
-EV
Cha
rgin
g St
atio
ns D
es4
010
,000
00
00
10,0
00
AC00
336
IT P
M/R
epai
rs/U
pgra
des
42,
300
580,
000
100,
000
100,
000
100,
000
100,
000
980,
000
AC00
337
FCH
Ter
m C
ompl
ex Im
pr3
55,9
000
50,0
0050
,000
50,0
0050
,000
200,
000
AC00
342
Term
inal
Res
troom
s (D
es/C
onst
)4
010
,000
00
00
10,0
00
AC00
345
AIPx
x FF
18 R
ehab
Tw
y C
Ph1
(Con
st)
41,
553,
500
275,
800
00
00
275,
800
AC00
346
AIPx
x FF
17 F
CH
Mas
ter P
lan
Upd
ate
311
7,50
026
,900
00
00
26,9
00
AC00
347
AIP7
9 FF
16 F
AT M
aste
r Pla
n U
pdat
e4
7,90
015
2,00
00
00
015
2,00
0
AC00
350
Park
ing
Equi
pmen
t4
35,7
005,
000
00
00
5,00
0
AC00
354
Bag
Cla
im W
alk
Rem
odel
40
50,5
000
00
050
,500
AC00
355
Term
inal
Gat
e 8
Hol
droo
m/B
ridge
431
7,10
026
1,30
00
00
026
1,30
0
AC00
357
11R
/29L
End
of R
unw
ay R
epai
r4
4,00
00
00
00
0
AC00
358
AIPx
x FF
18 A
irfie
ld L
ight
ing
Sys
436
6,70
034
,600
00
00
34,6
00
AC00
364
Term
inal
Boi
lers
Rep
lace
men
t4
1,10
0,00
050
,000
00
00
50,0
00
AC00
366
Airfi
eld
Perim
Fen
ce P
h14
56,6
0088
,300
00
00
88,3
00
Proj
ect
Proj
ect N
ame
Dis
tric
t
Cap
ital
Proj
ects
FY
2020
Estim
ate
2021
Cap
ital
Proj
ects
2022
Cap
ital
Proj
ects
2023
Cap
ital
Proj
ects
2024
Cap
ital
Proj
ects
2025
Cap
ital
Proj
ects
5 Ye
arPr
ojec
tTo
tal
FY 2020-2021 Capital Improvement Program by Department / Project
FY 2020-2021 Final Revised Budget C - 41

City
of F
resn
oR
un D
ate:
11/3
0/20
FY 2
021
- FY
2025
Cap
ital I
mpr
ovem
ent P
rogr
amR
un T
ime:
9:50
:35
AM
Dep
artm
ent /
Pro
ject
4300
00 -
Airp
orts
Dep
artm
ent
AC00
367
CR
CF
Faci
lity
Mai
nten
ance
40
318,
100
00
00
318,
100
AC00
368
Pass
enge
r Fac
ility
Cha
rge
(PFC
) Adm
inis
tratio
n4
200
83,0
000
00
083
,000
AC00
369
Term
Pub
lic A
ddre
ss S
yste
m4
057
5,00
00
00
057
5,00
0
AC00
370
Term
inal
Cnt
rs M
onito
rs4
069
,000
00
00
69,0
00
AC00
371
Com
m A
viat
ion
Ligh
ting
428
8,60
053
,000
00
00
53,0
00
AC00
372
Term
inal
Roo
f Ren
ovat
ion
496
4,80
053
5,00
00
00
053
5,00
0
AC00
373
Air C
argo
Tax
ilane
Reh
ab4
5,00
010
,000
00
00
10,0
00
AC00
377
Mar
ine
Base
Dem
o (F
ED M
CC
A)4
01,
300,
000
00
00
1,30
0,00
0
AC00
378
RAC
QTA
Dra
inag
e C
onst
ruct
ion
40
73,2
000
00
073
,200
AC00
380
11R
/29L
End
of R
unw
ay R
epai
r4
146,
300
00
00
00
AC00
382
AIPx
x FF
18 N
oise
Hom
es P
art1
504
849,
200
315,
600
00
00
315,
600
AC00
385
AIPx
x FF
19 N
oise
Hom
es P
art1
504
01,
111,
200
00
00
1,11
1,20
0
AC00
386
AIPx
x FF
19 A
RFF
Stn
(+EO
C) D
es4
00
00
140,
000
014
0,00
0
AC00
388
Serv
ice
Anim
al A
rea
FAT
Term
43,
400
00
00
00
AC00
389
Park
ing
Expa
nsio
n (F
AT)
41,
909,
500
50,0
000
00
050
,000
AC00
390
Air S
ervi
ce P
lann
ing
440
0,00
050
0,00
040
0,00
040
0,00
040
0,00
040
0,00
02,
100,
000
AC00
392
Term
inal
Fro
ntag
e Li
ghtin
g4
32,4
000
00
00
0
AC00
395
AIPx
x FF
18 T
wy
C C
onst
Ph2
44,
969,
200
411,
200
00
00
411,
200
AC00
398
AIPx
x Te
rm E
Apr
on (E
nv/D
es)
41,
207,
200
9,39
0,30
00
00
09,
390,
300
AC00
399
AIPx
x Te
rm Im
prv
(Env
/Des
)4
64,7
000
00
00
0
AC00
400
PFC
4 A
dmin
istra
tion
Cos
ts4
45,3
007,
000
00
00
7,00
0
AC00
401
Park
ing
Gar
age
(Env
/Des
/Con
)4
1,70
4,50
038
,835
,000
00
00
38,8
35,0
00
AC00
402
AIPx
x Tw
y B6
,4,3
Rem
ove
(Env
Des
Con
)4
119,
900
551,
300
00
00
551,
300
AC00
403
TSA
OTA
Bag
Mak
eUp
Inlin
e C
BIS
41,
066,
100
17,6
89,1
000
00
017
,689
,100
AC00
404
AIPx
x FF
20 N
oise
Hom
es P
rt 15
0 4
010
3,00
01,
103,
000
00
01,
206,
000
Proj
ect
Proj
ect N
ame
Dis
tric
t
Cap
ital
Proj
ects
FY
2020
Estim
ate
2021
Cap
ital
Proj
ects
2022
Cap
ital
Proj
ects
2023
Cap
ital
Proj
ects
2024
Cap
ital
Proj
ects
2025
Cap
ital
Proj
ects
5 Ye
arPr
ojec
tTo
tal
FY 2020-2021 Capital Improvement Program by Department / Project
C - 42 FY 2020-2021 Final Revised Budget

City
of F
resn
oR
un D
ate:
11/3
0/20
FY 2
021
- FY
2025
Cap
ital I
mpr
ovem
ent P
rogr
amR
un T
ime:
9:50
:35
AM
Dep
artm
ent /
Pro
ject
4300
00 -
Airp
orts
Dep
artm
ent
AC00
407
AIP
xx F
F20
Term
E A
pron
40
06,
562,
700
00
06,
562,
700
AC00
408
PFC
Adm
inis
tratio
n C
osts
40
150,
000
00
00
150,
000
AC00
409
Airfi
eld
Rep
airs
/ R
epl
41,
159,
500
1,23
0,00
010
0,00
010
0,00
010
0,00
010
0,00
01,
630,
000
AC00
410
Term
inal
Rep
airs
/ R
epl
457
1,70
040
0,00
050
0,00
050
0,00
050
0,00
050
0,00
02,
400,
000
AC00
411
Equi
pt S
mal
l Cap
ital
40
202,
600
200,
000
200,
000
200,
000
200,
000
1,00
2,60
0
AC00
412
Term
inal
Impr
ovem
ents
413
8,00
026
4,00
070
0,00
070
0,00
070
0,00
070
0,00
03,
064,
000
AC00
413
Term
inal
/FIS
Exp
ansi
on4
8,53
1,60
01,
500,
000
00
00
1,50
0,00
0
AC00
414
Park
ing
Rep
airs
/ R
epla
cem
ents
4
2,50
010
0,00
050
,000
50,0
0050
,000
50,0
0030
0,00
0
AC00
415
Term
Gat
e 5/
7 Im
pr D
es/C
on
457
0,70
025
,000
00
00
25,0
00
AC00
416
Broo
m S
wee
per
40
450,
000
00
00
450,
000
AC20
013
Airfi
eld
Perim
Fen
ce P
h24
00
01,
600,
000
00
1,60
0,00
0
AC20
015
AIPx
x FF
20 R
econ
Rw
y 11
L/29
R D
es4
00
023
0,00
02,
270,
000
02,
500,
000
AC21
001
AIPx
x FF
21 R
econ
Rw
y 11
L/29
R C
onst
40
00
00
15,0
00,0
0015
,000
,000
AC21
003
AIPx
x FF
21 F
CH
Tw
r Rem
oval
Des
30
00
15,0
0013
5,00
00
150,
000
AC21
006
AIPx
x FF
21 N
oise
Hom
es P
art 1
504
00
103,
000
1,00
0,00
00
01,
103,
000
AC22
001
AIPx
x FF
22 N
oise
Hom
es P
art 1
504
00
010
3,00
01,
000,
000
01,
103,
000
AC22
002
AIPx
x FF
22 F
CH
Tw
r Reh
ab (C
onst
)3
00
030
,000
300,
000
300,
000
630,
000
AC23
002
AIPx
x FF
23 N
oise
Hom
es P
art 1
50
40
00
010
3,00
01,
000,
000
1,10
3,00
0
AC24
001
AIPx
x FF
24 N
oise
Hom
es P
art 1
50 T
otal
40
00
00
110,
300
110,
300
AM00
103
Envi
ronm
enta
l Site
-Old
Ham
mer
Fie
ld4
66,3
0010
0,00
012
5,00
012
5,00
012
5,00
012
5,00
060
0,00
0
AM00
106
Faci
litie
s R
epai
r/Rep
l Res
erve
450
0,00
050
0,00
050
0,00
050
0,00
050
0,00
050
0,00
02,
500,
000
Tota
l for
: 430
000
- Airp
orts
Dep
artm
ent
29,2
59,9
0079
,534
,100
10,5
68,7
005,
778,
000
6,74
8,00
019
,210
,300
121,
839,
100
4400
00 -
Con
vent
ion
Cnt
r & S
tadi
um D
ept
CC
0002
7St
adiu
m C
apita
l Im
prov
emen
ts3
206,
200
3,66
7,60
00
00
03,
667,
600
Proj
ect
Proj
ect N
ame
Dis
tric
t
Cap
ital
Proj
ects
FY
2020
Estim
ate
2021
Cap
ital
Proj
ects
2022
Cap
ital
Proj
ects
2023
Cap
ital
Proj
ects
2024
Cap
ital
Proj
ects
2025
Cap
ital
Proj
ects
5 Ye
arPr
ojec
tTo
tal
FY 2020-2021 Capital Improvement Program by Department / Project
FY 2020-2021 Final Revised Budget C - 43

City
of F
resn
oR
un D
ate:
11/3
0/20
FY 2
021
- FY
2025
Cap
ital I
mpr
ovem
ent P
rogr
amR
un T
ime:
9:50
:35
AM
Dep
artm
ent /
Pro
ject
4400
00 -
Con
vent
ion
Cnt
r & S
tadi
um D
ept
Tota
l for
: 440
000
- Con
vent
ion
Cnt
r & S
tadi
um D
ept
206,
200
3,66
7,60
00
00
03,
667,
600
4500
00 -
FAX
Dep
artm
ent
FC00
001
Non
-Rev
enue
Sup
port
Vehi
cles
M98
,200
181,
000
50,0
000
50,0
000
281,
000
FC00
019
Pass
enge
r Am
eniti
esM
362,
200
3,54
2,60
045
0,00
045
0,00
045
0,00
045
0,00
05,
342,
600
FC00
024
FAX
Rad
io S
yste
m3
01,
044,
700
00
00
1,04
4,70
0
FC00
026
Plan
ning
M24
5,50
01,
705,
700
200,
000
200,
000
200,
000
200,
000
2,50
5,70
0
FC00
030
CN
G B
us R
ehab
3
065
2,00
00
00
065
2,00
0
FC00
036
Bldg
and
Fac
ility
Mai
nten
ance
363
,700
13,3
96,0
003,
791,
000
310,
000
3,41
4,90
031
0,00
021
,221
,900
FC00
050
Bus
Purc
hase
Fix
ed R
oute
=40
'M
2,50
8,00
05,
163,
400
02,
600,
000
700,
000
3,42
0,00
011
,883
,400
FC00
053
Para
trans
it Ve
hicl
es &
Equ
ipM
01,
212,
000
085
0,00
00
850,
000
2,91
2,00
0
FC00
057
Tran
sit F
ac/S
tatio
nM
187,
400
146,
800
00
00
146,
800
FC00
059
Circ
ulat
or3
010
0,00
00
00
010
0,00
0
FC00
068
FY09
-10
Prop
1B-P
TMIS
EA P
roje
ctM
433,
100
760,
000
00
00
760,
000
FC00
069
FY10
-11
Prop
1B-
PTM
ISEA
Pro
ject
M0
4,25
5,20
00
00
04,
255,
200
FC00
070
BRT-
Bus
Rap
id T
rans
it Ph
ase
1M
579,
800
800,
000
00
00
800,
000
FC00
075
NF-
Bus
Stop
Impr
ovem
ents
M60
2,10
00
00
00
0
FC00
076
NF-
Bus
Stop
Num
b Br
aille
Sig
nsM
1,10
00
00
00
0
FC00
078
Tran
sit S
igna
l Prio
ritiz
atio
nM
712,
200
840,
000
00
00
840,
000
FC00
085
FY16
-17
Prop
1B-C
TSG
P Se
c Pr
jct
00
34,9
000
00
034
,900
FC00
087
FY14
-15
Prop
1B-P
TMIS
EA P
roje
ctM
3,66
3,20
05,
064,
200
00
00
5,06
4,20
0
FC00
090
Tran
sit A
sset
Man
agem
ent
M0
300,
000
00
00
300,
000
FC00
091
TIR
CP
- TVM
s &
Vehi
cs0
060
,000
00
00
60,0
00
FC00
092
TIR
CP
- HFN
Impr
vmnt
s &
Vehi
cs0
04,
180,
000
04,
000,
000
04,
000,
000
12,1
80,0
00
FC00
093
TIR
CP
- SW
Com
mun
ity C
onne
ctor
0
09,
490,
000
04,
000,
000
04,
000,
000
17,4
90,0
00
Proj
ect
Proj
ect N
ame
Dis
tric
t
Cap
ital
Proj
ects
FY
2020
Estim
ate
2021
Cap
ital
Proj
ects
2022
Cap
ital
Proj
ects
2023
Cap
ital
Proj
ects
2024
Cap
ital
Proj
ects
2025
Cap
ital
Proj
ects
5 Ye
arPr
ojec
tTo
tal
FY 2020-2021 Capital Improvement Program by Department / Project
C - 44 FY 2020-2021 Final Revised Budget
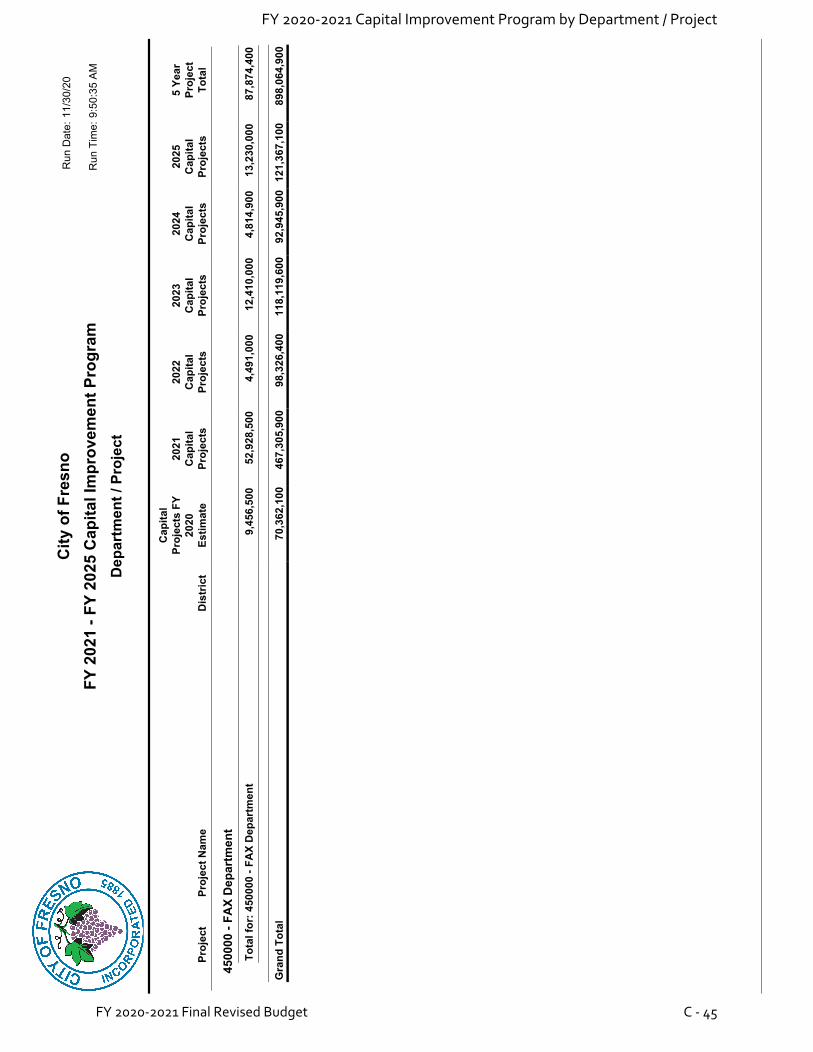
City
of F
resn
oR
un D
ate:
11/3
0/20
FY 2
021
- FY
2025
Cap
ital I
mpr
ovem
ent P
rogr
amR
un T
ime:
9:50
:35
AM
Dep
artm
ent /
Pro
ject
Gra
nd T
otal
70,3
62,1
0046
7,30
5,90
098
,326
,400
118,
119,
600
92,9
45,9
0012
1,36
7,10
089
8,06
4,90
0
4500
00 -
FAX
Dep
artm
ent
Tota
l for
: 450
000
- FA
X D
epar
tmen
t9,
456,
500
52,9
28,5
004,
491,
000
12,4
10,0
004,
814,
900
13,2
30,0
0087
,874
,400
Proj
ect
Proj
ect N
ame
Dis
tric
t
Cap
ital
Proj
ects
FY
2020
Estim
ate
2021
Cap
ital
Proj
ects
2022
Cap
ital
Proj
ects
2023
Cap
ital
Proj
ects
2024
Cap
ital
Proj
ects
2025
Cap
ital
Proj
ects
5 Ye
arPr
ojec
tTo
tal
FY 2020-2021 Capital Improvement Program by Department / Project
FY 2020-2021 Final Revised Budget C - 45

TH
IS P
AG
E W
AS
INT
EN
TIO
NA
LL
Y L
EF
T B
LA
NK
.
C - 46 FY 2020-2021 Final Revised Budget

FISC
AL
YEA
R 2020-
20
21
CA
PIT
AL
IMPRO
VEM
ENT
PRO
GRA
M
BY
DEP
ARTM
ENT
/ F
UN
D /
PRO
JEC
T
FY 2020-2021 Final Revised Budget C - 47
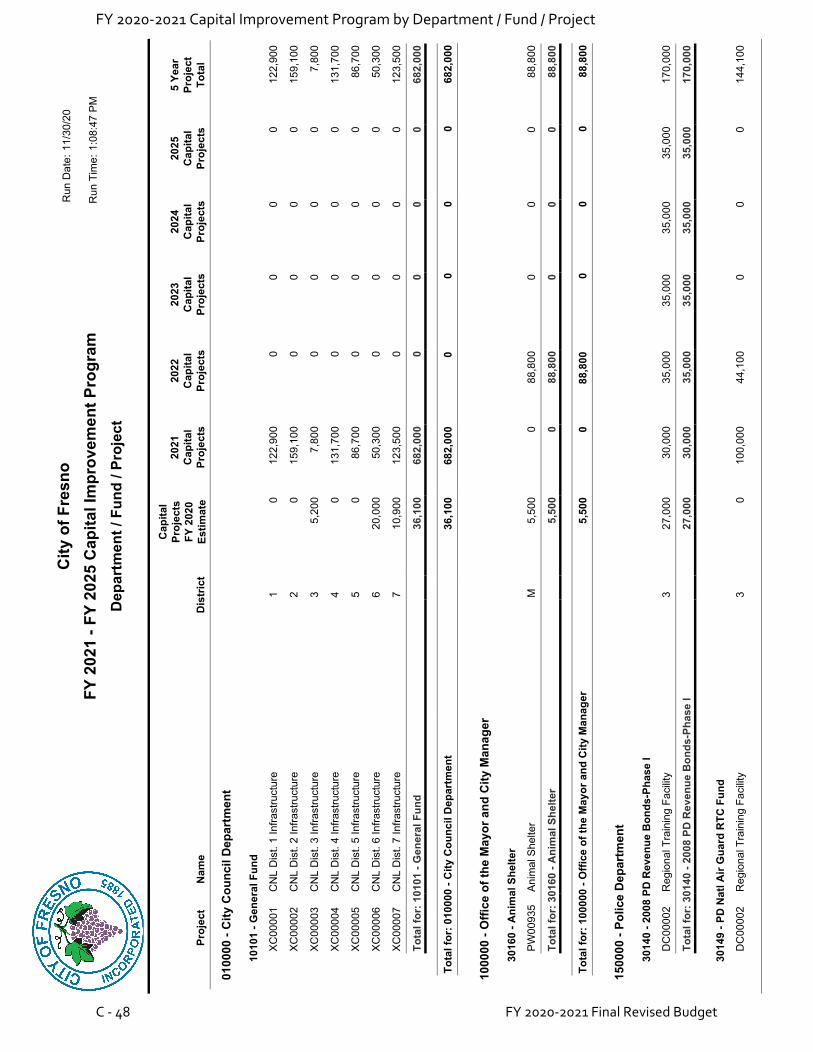
City
of F
resn
oR
un D
ate:
11/3
0/20
FY 2
021
- FY
2025
Cap
ital I
mpr
ovem
ent P
rogr
amR
un T
ime:
1:08
:47
PM
Dep
artm
ent /
Fun
d / P
roje
ct
0100
00 -
City
Cou
ncil
Dep
artm
ent
1010
1 - G
ener
al F
und
XC00
001
CN
L D
ist.
1 In
frast
ruct
ure
10
122,
900
00
00
122,
900
XC00
002
CN
L D
ist.
2 In
frast
ruct
ure
20
159,
100
00
00
159,
100
XC00
003
CN
L D
ist.
3 In
frast
ruct
ure
35,
200
7,80
00
00
07,
800
XC00
004
CN
L D
ist.
4 In
frast
ruct
ure
40
131,
700
00
00
131,
700
XC00
005
CN
L D
ist.
5 In
frast
ruct
ure
50
86,7
000
00
086
,700
XC00
006
CN
L D
ist.
6 In
frast
ruct
ure
620
,000
50,3
000
00
050
,300
XC00
007
CN
L D
ist.
7 In
frast
ruct
ure
710
,900
123,
500
00
00
123,
500
Tota
l for
: 101
01 -
Gen
eral
Fun
d36
,100
682,
000
00
00
682,
000
Tota
l for
: 010
000
- City
Cou
ncil
Dep
artm
ent
36,1
0068
2,00
00
00
068
2,00
0
1000
00 -
Offi
ce o
f the
May
or a
nd C
ity M
anag
er
3016
0 - A
nim
al S
helte
r
PW00
935
Anim
al S
helte
rM
5,50
00
88,8
000
00
88,8
00
Tota
l for
: 301
60 -
Ani
mal
She
lter
5,50
00
88,8
000
00
88,8
00
Tota
l for
: 100
000
- Offi
ce o
f the
May
or a
nd C
ity M
anag
er5,
500
088
,800
00
088
,800
1500
00 -
Polic
e D
epar
tmen
t
3014
0 - 2
008
PD R
even
ue B
onds
-Pha
se I
DC
0000
2R
egio
nal T
rain
ing
Faci
lity
327
,000
30,0
0035
,000
35,0
0035
,000
35,0
0017
0,00
0
Tota
l for
: 301
40 -
2008
PD
Rev
enue
Bon
ds-P
hase
I27
,000
30,0
0035
,000
35,0
0035
,000
35,0
0017
0,00
0
3014
9 - P
D N
atl A
ir G
uard
RTC
Fun
d
DC
0000
2R
egio
nal T
rain
ing
Faci
lity
30
100,
000
44,1
000
00
144,
100
Pro
ject
N
ame
Dis
tric
t
Cap
ital
Proj
ects
FY 2
020
Estim
ate
2021
Cap
ital
Proj
ects
2022
Cap
ital
Proj
ects
2023
Cap
ital
Proj
ects
2024
Cap
ital
Proj
ects
2025
Cap
ital
Proj
ects
5 Ye
arPr
ojec
tTo
tal
FY 2020-2021 Capital Improvement Program by Department / Fund / Project
C - 48 FY 2020-2021 Final Revised Budget

City
of F
resn
oR
un D
ate:
11/3
0/20
FY 2
021
- FY
2025
Cap
ital I
mpr
ovem
ent P
rogr
amR
un T
ime:
1:08
:47
PM
Dep
artm
ent /
Fun
d / P
roje
ct
1500
00 -
Polic
e D
epar
tmen
t
3014
9 - P
D N
atl A
ir G
uard
RTC
Fun
d
Tota
l for
: 301
49 -
PD N
atl A
ir G
uard
RTC
Fun
d0
100,
000
44,1
000
00
144,
100
3015
7 - S
outh
east
Pol
ice
Stat
ion
DC
0000
5SE
Dis
trct P
olic
e St
atio
n5
1,03
9,60
00
00
00
0
Tota
l for
: 301
57 -
Sout
heas
t Pol
ice
Stat
ion
1,03
9,60
00
00
00
0
Tota
l for
: 150
000
- Pol
ice
Dep
artm
ent
1,06
6,60
013
0,00
079
,100
35,0
0035
,000
35,0
0031
4,10
0
1600
00 -
Fire
Dep
artm
ent
3015
6 - F
ig G
arde
n R
enov
atio
n Pr
ojec
t
XC00
029
Fire
Sta
tion
Ren
ovat
ions
Pha
se I
M0
124,
500
00
00
124,
500
Tota
l for
: 301
56 -
Fig
Gar
den
Ren
ovat
ion
Proj
ect
012
4,50
00
00
012
4,50
0
3015
9 - F
ire S
tatio
n #1
8 C
onst
ruct
ion
XC00
036
UG
M F
ire S
tatio
n 18
243
8,10
00
00
00
0
Tota
l for
: 301
59 -
Fire
Sta
tion
#18
Con
stru
ctio
n43
8,10
00
00
00
0
Tota
l for
: 160
000
- Fire
Dep
artm
ent
438,
100
124,
500
00
00
124,
500
1700
00 -
PAR
CS
Dep
artm
ent
1010
1 - G
ener
al F
und
PC00
165
Eins
tein
Par
k Im
prov
emen
ts7
025
,000
00
00
25,0
00
PC00
169
Mel
ody
Park
Lig
ht In
stal
latio
n3
24,9
000
00
00
0
PC00
185
Pilib
os Im
prov
emen
ts5
020
0,00
00
00
020
0,00
0
PC00
197
Com
m/S
r Cen
ter -
D4
40
2,02
1,50
00
00
02,
021,
500
PC00
201
Gra
nny’
s Se
curit
y Li
ght U
pgra
de7
075
,000
00
00
75,0
00
Pro
ject
N
ame
Dis
tric
t
Cap
ital
Proj
ects
FY 2
020
Estim
ate
2021
Cap
ital
Proj
ects
2022
Cap
ital
Proj
ects
2023
Cap
ital
Proj
ects
2024
Cap
ital
Proj
ects
2025
Cap
ital
Proj
ects
5 Ye
arPr
ojec
tTo
tal
FY 2020-2021 Capital Improvement Program by Department / Fund / Project
FY 2020-2021 Final Revised Budget C - 49

City
of F
resn
oR
un D
ate:
11/3
0/20
FY 2
021
- FY
2025
Cap
ital I
mpr
ovem
ent P
rogr
amR
un T
ime:
1:08
:47
PM
Dep
artm
ent /
Fun
d / P
roje
ct
1700
00 -
PAR
CS
Dep
artm
ent
1010
1 - G
ener
al F
und
PC00
202
Milb
urn/
Dak
ota
Mas
ter P
lan
190
,300
99,8
000
00
099
,800
PC00
203
Mos
qued
a C
IP5
75,4
000
00
00
0
PC00
204
Sout
h To
wer
Par
k C
IP3
030
0,00
00
00
030
0,00
0
PC00
205
St R
est L
ands
capi
ng3
058
,000
00
00
58,0
00
PC00
211
Seni
or C
ente
r - T
BD3
060
0,00
00
00
060
0,00
0
PC00
212
El D
orad
o Bu
ildin
g3
01,
274,
400
00
00
1,27
4,40
0
PC00
214
Roe
ding
Dog
Par
k R
eloc
atio
n3
050
,000
00
00
50,0
00
PC00
215
Khal
ra S
occe
r Fie
ld R
e-Se
ed3
070
,000
00
00
70,0
00
PC00
216
Tollh
ouse
Tot
Lot
/AD
A Im
prov
30
200,
000
00
00
200,
000
PC00
217
ElD
orad
o To
t Lot
Mis
ting
Sys
30
100,
000
00
00
100,
000
PC00
218
Vinl
and
Addi
tiona
l Lig
htin
g3
020
0,00
00
00
020
0,00
0
PC00
219
Riv
er B
otto
m S
ecur
ity U
pgra
des
30
10,0
000
00
010
,000
PC00
220
Loga
n Pa
rk S
hade
Stru
ctur
e3
010
0,00
00
00
010
0,00
0
Tota
l for
: 101
01 -
Gen
eral
Fun
d19
0,60
05,
383,
700
00
00
5,38
3,70
0
2203
1 - M
isc
Stat
e G
rant
s - P
arks
PC00
181
Max
ie Im
prov
emen
ts -
Cal
Fire
33,
800
249,
500
00
00
249,
500
PC00
182
Hin
ton
Impr
ovem
ents
30
48,6
000
00
048
,600
PC00
183
Rom
ain
Futs
al C
ourt
70
54,1
000
00
054
,100
Tota
l for
: 220
31 -
Mis
c St
ate
Gra
nts
- Par
ks3,
800
352,
200
00
00
352,
200
2209
4 - P
rop
84 II
- PA
RC
S
PC00
007
Park
s Fa
cilit
ies
Reh
abM
024
,100
00
00
24,1
00
Tota
l for
: 220
94 -
Prop
84
II - P
AR
CS
024
,100
00
00
24,1
00
Pro
ject
N
ame
Dis
tric
t
Cap
ital
Proj
ects
FY 2
020
Estim
ate
2021
Cap
ital
Proj
ects
2022
Cap
ital
Proj
ects
2023
Cap
ital
Proj
ects
2024
Cap
ital
Proj
ects
2025
Cap
ital
Proj
ects
5 Ye
arPr
ojec
tTo
tal
FY 2020-2021 Capital Improvement Program by Department / Fund / Project
C - 50 FY 2020-2021 Final Revised Budget

City
of F
resn
oR
un D
ate:
11/3
0/20
FY 2
021
- FY
2025
Cap
ital I
mpr
ovem
ent P
rogr
amR
un T
ime:
1:08
:47
PM
Dep
artm
ent /
Fun
d / P
roje
ct
1700
00 -
PAR
CS
Dep
artm
ent
2209
6 - H
ousi
ng R
elat
ed P
arks
Pro
gram
s
PC00
007
Park
s Fa
cilit
ies
Reh
abM
071
,500
00
00
71,5
00
Tota
l for
: 220
96 -
Hou
sing
Rel
ated
Par
ks P
rogr
ams
071
,500
00
00
71,5
00
2401
7 - P
arks
Spe
cial
Pro
ject
s
PC00
007
Park
s Fa
cilit
ies
Reh
abM
44,9
000
00
00
0
PC00
128
Slur
ry S
eal V
ario
us P
arks
M0
146,
400
00
00
146,
400
Tota
l for
: 240
17 -
Park
s Sp
ecia
l Pro
ject
s44
,900
146,
400
00
00
146,
400
3150
2 - U
GM
Nei
gh P
ark
Serv
ice
Are
a 2
PC00
007
Park
s Fa
cilit
ies
Reh
abM
040
0,00
00
00
040
0,00
0
Tota
l for
: 315
02 -
UG
M N
eigh
Par
k Se
rvic
e A
rea
20
400,
000
00
00
400,
000
3150
9 - U
GM
par
ks C
ityw
ide
Faci
l Fee
s
PC00
007
Park
s Fa
cilit
ies
Reh
abM
03,
000,
000
500,
000
1,25
0,00
01,
000,
000
1,25
0,00
07,
000,
000
PC00
184
Mel
ody
Spla
sh P
ad -
D4
414
5,90
00
00
00
0
PC00
188
D1
Impr
ovem
ents
-UG
M1
400
89,4
000
00
089
,400
PC00
189
D2
Impr
ovem
ents
-UG
M2
8,40
056
,200
00
00
56,2
00
PC00
190
D3
Impr
ovem
ents
-UG
M3
60,3
0099
,000
00
00
99,0
00
PC00
191
D4
Impr
ovem
ents
-UG
M4
010
9,90
00
00
010
9,90
0
PC00
192
D5
Impr
ovem
ents
-UG
M5
3,60
066
,300
00
00
66,3
00
PC00
193
D6
Impr
ovem
ents
-UG
M6
18,4
0090
,900
00
00
90,9
00
PC00
194
D7
Impr
ovem
ents
-UG
M7
044
,700
00
00
44,7
00
PC00
213
SEFC
EDA
Park
Con
stru
ct S
uppo
rt3
090
,000
00
00
90,0
00
Tota
l for
: 315
09 -
UG
M p
arks
City
wid
e Fa
cil F
ees
237,
000
3,64
6,40
050
0,00
01,
250,
000
1,00
0,00
01,
250,
000
7,64
6,40
0
Pro
ject
N
ame
Dis
tric
t
Cap
ital
Proj
ects
FY 2
020
Estim
ate
2021
Cap
ital
Proj
ects
2022
Cap
ital
Proj
ects
2023
Cap
ital
Proj
ects
2024
Cap
ital
Proj
ects
2025
Cap
ital
Proj
ects
5 Ye
arPr
ojec
tTo
tal
FY 2020-2021 Capital Improvement Program by Department / Fund / Project
FY 2020-2021 Final Revised Budget C - 51

City
of F
resn
oR
un D
ate:
11/3
0/20
FY 2
021
- FY
2025
Cap
ital I
mpr
ovem
ent P
rogr
amR
un T
ime:
1:08
:47
PM
Dep
artm
ent /
Fun
d / P
roje
ct
1700
00 -
PAR
CS
Dep
artm
ent
3151
0 - U
GM
Par
klan
d(Q
uim
by) D
ed F
ee
PC00
007
Park
s Fa
cilit
ies
Reh
abM
02,
400,
000
400,
000
500,
000
500,
000
400,
000
4,20
0,00
0
Tota
l for
: 315
10 -
UG
M P
arkl
and(
Qui
mby
) Ded
Fee
02,
400,
000
400,
000
500,
000
500,
000
400,
000
4,20
0,00
0
Tota
l for
: 170
000
- PA
RC
S D
epar
tmen
t47
6,30
012
,424
,300
900,
000
1,75
0,00
01,
500,
000
1,65
0,00
018
,224
,300
1800
00 -
Publ
ic W
orks
Dep
artm
ent
1010
1 - G
ener
al F
und
PW00
044
Min
or P
ublic
Impr
ovem
ents
M0
6,80
00
00
06,
800
PW00
824
ADA
Com
plia
nce
Con
vent
ion
Ctr
30
316,
200
00
00
316,
200
PW00
896
FY20
Nei
ghbo
rhoo
d St
reet
Impr
vM
021
8,80
00
00
021
8,80
0
PW00
914
El D
orad
o N
eigh
Alle
y Pa
ving
40
375,
000
00
00
375,
000
PW00
940
Arm
stro
ng &
Ham
ilton
Tot
Lot
50
200,
000
00
00
200,
000
Tota
l for
: 101
01 -
Gen
eral
Fun
d0
1,11
6,80
00
00
01,
116,
800
2010
2 - P
rop.
111
- Sp
ecia
l Gas
Tax
PW00
044
Min
or P
ublic
Impr
ovem
ents
M0
10,0
000
00
010
,000
PW00
268
ADA
Infra
stru
ctur
e C
ompl
ianc
eM
030
0,00
00
00
030
0,00
0
PW00
661
Fulto
n M
all I
mpr
ovem
ents
30
125,
000
00
00
125,
000
PW00
782
StLi
ghtin
g M
aj R
epai
r Pro
ject
sM
035
0,00
00
00
035
0,00
0
PW00
896
FY20
Nei
ghbo
rhoo
d St
reet
Impr
vM
099
,800
00
00
99,8
00
PW00
924
FY21
Nei
ghbo
rhoo
d St
reet
Impr
oM
040
0,00
00
00
040
0,00
0
Tota
l for
: 201
02 -
Prop
. 111
- Sp
ecia
l Gas
Tax
01,
284,
800
00
00
1,28
4,80
0
2010
3 - A
BX8
6 G
as T
ax (f
orm
erly
TC
RP)
PW00
044
Min
or P
ublic
Impr
ovem
ents
M0
300,
000
00
00
300,
000
Pro
ject
N
ame
Dis
tric
t
Cap
ital
Proj
ects
FY 2
020
Estim
ate
2021
Cap
ital
Proj
ects
2022
Cap
ital
Proj
ects
2023
Cap
ital
Proj
ects
2024
Cap
ital
Proj
ects
2025
Cap
ital
Proj
ects
5 Ye
arPr
ojec
tTo
tal
FY 2020-2021 Capital Improvement Program by Department / Fund / Project
C - 52 FY 2020-2021 Final Revised Budget

City
of F
resn
oR
un D
ate:
11/3
0/20
FY 2
021
- FY
2025
Cap
ital I
mpr
ovem
ent P
rogr
amR
un T
ime:
1:08
:47
PM
Dep
artm
ent /
Fun
d / P
roje
ct
1800
00 -
Publ
ic W
orks
Dep
artm
ent
2010
3 - A
BX8
6 G
as T
ax (f
orm
erly
TC
RP)
PW00
896
FY20
Nei
ghbo
rhoo
d St
reet
Impr
vM
012
7,40
00
00
012
7,40
0
PW00
924
FY21
Nei
ghbo
rhoo
d St
reet
Impr
oM
070
8,00
00
00
070
8,00
0
PW00
938
FY21
Nei
gh C
oncr
ete
Rep
airs
M0
700,
000
00
00
700,
000
Tota
l for
: 201
03 -
AB
X8 6
Gas
Tax
(for
mer
ly T
CR
P)0
1,83
5,40
00
00
01,
835,
400
2010
4 - S
B1
Roa
d R
epai
r Gas
Tax
PW00
526
TS C
edar
& W
oodw
ard
50
159,
600
00
00
159,
600
PW00
812
TS T
ular
e an
d "Q
" Stre
et3
072
1,40
00
00
072
1,40
0
PW00
833
TS: H
arris
on &
Shi
elds
Ave
nues
10
60,6
000
00
060
,600
PW00
834
Mar
ks O
verla
y As
hlan
to D
akot
a1
057
6,50
00
00
057
6,50
0
PW00
836
TS: B
arst
ow &
Pal
m A
venu
es2
065
1,60
00
00
065
1,60
0
PW00
837
TS: C
alifo
rnia
& W
alnu
t3
010
5,70
00
00
010
5,70
0
PW00
838
Ced
ar O
vrly
Bar
stow
to B
ulla
rd4
012
,200
00
00
12,2
00
PW00
839
TS: A
rmst
rong
& L
ane
50
523,
200
00
00
523,
200
PW00
840
Nee
s O
vrly
Fre
sno
to M
illbro
ok6
035
,300
00
00
35,3
00
PW00
853
Che
stnu
t OVL
Y Bu
llard
to H
ernd
40
37,5
000
00
037
,500
PW00
854
Bulla
rd O
verla
y C
edar
to F
irst
40
29,9
000
00
029
,900
PW00
856
TS: C
linto
n &
Angu
s1
032
4,60
00
00
032
4,60
0
PW00
860
Map
le A
ve C
ycle
Tra
ck &
Ped
estri
an4
075
,000
00
00
75,0
00
PW00
882
Fres
no S
t Cor
ridor
Impr
ovem
ent
M0
39,6
000
00
039
,600
PW00
884
FY20
Slu
rry S
eal P
roje
cts
M0
92,5
000
00
092
,500
PW00
885
TS L
T Ph
asin
g Bu
tler a
nd C
edar
50
40,0
000
00
040
,000
PW00
886
TS L
T Ph
asin
g Tu
lare
and
U S
t3
038
,700
00
00
38,7
00
PW00
892
Flor
ador
a/Yo
sem
ite S
afe
Rou
tes
07,
400
00
00
00
Pro
ject
N
ame
Dis
tric
t
Cap
ital
Proj
ects
FY 2
020
Estim
ate
2021
Cap
ital
Proj
ects
2022
Cap
ital
Proj
ects
2023
Cap
ital
Proj
ects
2024
Cap
ital
Proj
ects
2025
Cap
ital
Proj
ects
5 Ye
arPr
ojec
tTo
tal
FY 2020-2021 Capital Improvement Program by Department / Fund / Project
FY 2020-2021 Final Revised Budget C - 53

City
of F
resn
oR
un D
ate:
11/3
0/20
FY 2
021
- FY
2025
Cap
ital I
mpr
ovem
ent P
rogr
amR
un T
ime:
1:08
:47
PM
Dep
artm
ent /
Fun
d / P
roje
ct
1800
00 -
Publ
ic W
orks
Dep
artm
ent
2010
4 - S
B1
Roa
d R
epai
r Gas
Tax
PW00
893
Mui
r Ele
m S
afe
Rou
tes
to S
ch3
049
0,90
00
00
049
0,90
0
PW00
894
McK
inle
y El
em S
afe
Rou
tes
30
100,
300
00
00
100,
300
PW00
907
Barto
n/Fl
oren
ce S
idew
alks
50
254,
100
00
00
254,
100
PW00
917
TS W
est &
Sie
rra L
T Ph
asin
g2
061
3,80
00
00
061
3,80
0
PW00
919
TS L
T H
ughe
s &
Shie
lds
10
119,
100
5,20
00
00
124,
300
PW00
920
TS B
lyth
e &
Gat
es2
063
0,00
00
00
063
0,00
0
PW00
948
Ced
ar P
avin
g S
haw
-Bar
stow
00
060
0,00
00
00
600,
000
Tota
l for
: 201
04 -
SB1
Roa
d R
epai
r Gas
Tax
7,40
05,
732,
100
605,
200
00
06,
337,
300
2150
1 - D
ispo
sitio
n O
f Rea
l Pro
pert
y
PW00
085
Sale
/Pur
chse
-Rea
l Pro
prty
M2,
000
22,2
005,
000
5,00
05,
000
037
,200
Tota
l for
: 215
01 -
Dis
posi
tion
Of R
eal P
rope
rty
2,00
022
,200
5,00
05,
000
5,00
00
37,2
00
2200
3 - P
edes
tria
n &
Bic
ycle
Fac
ility
PW00
044
Min
or P
ublic
Impr
ovem
ents
M0
20,0
000
00
020
,000
PW00
268
ADA
Infra
stru
ctur
e C
ompl
ianc
eM
043
9,40
00
00
043
9,40
0
PW00
364
Bicy
cle
Publ
ic S
ervi
ce A
nnou
nce
M0
20,0
000
00
020
,000
PW00
526
TS C
edar
& W
oodw
ard
50
61,1
000
00
061
,100
PW00
812
TS T
ular
e an
d "Q
" Stre
et3
063
,700
00
00
63,7
00
Tota
l for
: 220
03 -
Pede
stria
n &
Bic
ycle
Fac
ility
060
4,20
00
00
060
4,20
0
2204
8 - F
eder
al G
rant
s Pu
blic
Wor
ks
PW00
526
TS C
edar
& W
oodw
ard
50
341,
600
00
00
341,
600
PW00
585
Suga
r Pin
e Tr
ail P
k &
Rid
e W
il6
042
,100
00
00
42,1
00
PW00
596
TS B
utle
r & W
illow
540
09,
300
00
00
9,30
0
Pro
ject
N
ame
Dis
tric
t
Cap
ital
Proj
ects
FY 2
020
Estim
ate
2021
Cap
ital
Proj
ects
2022
Cap
ital
Proj
ects
2023
Cap
ital
Proj
ects
2024
Cap
ital
Proj
ects
2025
Cap
ital
Proj
ects
5 Ye
arPr
ojec
tTo
tal
FY 2020-2021 Capital Improvement Program by Department / Fund / Project
C - 54 FY 2020-2021 Final Revised Budget

City
of F
resn
oR
un D
ate:
11/3
0/20
FY 2
021
- FY
2025
Cap
ital I
mpr
ovem
ent P
rogr
amR
un T
ime:
1:08
:47
PM
Dep
artm
ent /
Fun
d / P
roje
ct
1800
00 -
Publ
ic W
orks
Dep
artm
ent
2204
8 - F
eder
al G
rant
s Pu
blic
Wor
ks
PW00
619
Offi
cal P
lan
Line
s: T
empe
ranc
e, N
orth
M0
2,00
00
00
02,
000
PW00
676
TS S
hiel
ds &
Web
er1
06,
000
00
00
6,00
0
PW00
678
TS C
linto
n &
Vale
ntin
e3
1,00
054
1,20
00
00
054
1,20
0
PW00
688
ITS
Free
way
Cro
ssin
gs C
ityw
ide
M10
00
00
00
0
PW00
710
Inte
r Im
prov
Cen
tral &
Ora
nge
30
1,52
3,30
00
00
01,
523,
300
PW00
725
Shie
lds
Bank
side
Tra
il Fr
esno
to F
irst
70
1,73
5,80
00
00
01,
735,
800
PW00
740
BPM
P Br
idge
Mai
nt D
eck
Reh
ab 1
M0
8,00
00
00
08,
000
PW00
743
Her
ndon
ITS
GSB
-Willo
w A
dapt
ivM
044
,500
00
00
44,5
00
PW00
744
BPM
P Br
idge
Mai
nt D
eck
Reh
ab 2
M0
5,20
00
00
05,
200
PW00
747
Blac
ksto
ne S
treet
Lig
htin
g D
ivM
04,
600
00
00
4,60
0
PW00
762
Her
ndon
Can
alTr
ail-S
hiel
ds/M
cKi
70
3,00
4,50
00
00
03,
004,
500
PW00
763
McK
inle
yAve
Trai
l-Millb
r/Clo
vis
M0
1,55
6,50
00
00
01,
556,
500
PW00
764
Clo
visA
veTr
ail-M
cKin
to D
ayto
n4
01,
284,
100
00
00
1,28
4,10
0
PW00
768
TS C
hest
nut &
Shi
elds
41,
000
85,4
000
00
085
,400
PW00
771
BPM
P Br
idge
Dec
k R
ehab
Pha
se 2
M0
18,2
000
00
018
,200
PW00
780
TS D
akot
a &
Wes
t LT
Phas
ing
10
10,3
000
00
010
,300
PW00
784
Abby
Ove
rlay
Div
isad
ero-
Oliv
e7
01,
369,
100
00
00
1,36
9,10
0
PW00
785
Firs
t Ove
rlay
Allu
vial
-Her
ndon
62,
300
94,0
000
00
094
,000
PW00
786
Jens
en O
vrla
y C
orne
lia-C
hate
au3
02,
810,
700
00
00
2,81
0,70
0
PW00
787
Fria
nt S
B O
vrly
Cha
mpl
ain-
Shep
60
172,
700
00
00
172,
700
PW00
788
Inyo
Ove
rlay
Fulto
n to
O S
t.3
017
7,70
00
00
017
7,70
0
PW00
789
Ashl
an O
verla
y Va
lent
ine-
Wes
t1
042
,000
00
00
42,0
00
PW00
790
Jens
en O
verla
y SR
41-M
LK3
01,
614,
000
00
00
1,61
4,00
0
PW00
791
Blac
ksto
ne O
vrly
Dak
ota-
Ashl
an7
1,50
019
9,10
00
00
019
9,10
0
Pro
ject
N
ame
Dis
tric
t
Cap
ital
Proj
ects
FY 2
020
Estim
ate
2021
Cap
ital
Proj
ects
2022
Cap
ital
Proj
ects
2023
Cap
ital
Proj
ects
2024
Cap
ital
Proj
ects
2025
Cap
ital
Proj
ects
5 Ye
arPr
ojec
tTo
tal
FY 2020-2021 Capital Improvement Program by Department / Fund / Project
FY 2020-2021 Final Revised Budget C - 55

City
of F
resn
oR
un D
ate:
11/3
0/20
FY 2
021
- FY
2025
Cap
ital I
mpr
ovem
ent P
rogr
amR
un T
ime:
1:08
:47
PM
Dep
artm
ent /
Fun
d / P
roje
ct
1800
00 -
Publ
ic W
orks
Dep
artm
ent
2204
8 - F
eder
al G
rant
s Pu
blic
Wor
ks
PW00
792
Belm
ont O
verla
y C
edar
-Che
stnu
t7
031
,100
00
00
31,1
00
PW00
793
Ashl
an A
C O
vrla
y Fi
rst-M
illbro
41,
300
90,7
000
00
090
,700
PW00
795
Oliv
e Av
e Im
pv Y
osem
ite-R
osvl
tM
01,
184,
100
00
00
1,18
4,10
0
PW00
803
City
wid
e St
reet
Lig
ht L
ED R
etro
fit -
Phas
e 2
M0
997,
600
00
00
997,
600
PW00
807
TS G
ates
and
San
Jos
e2
069
,600
00
00
69,6
00
PW00
808
TS D
ivis
ader
o an
d M
arip
osa
M2,
800
50,6
000
00
050
,600
PW00
809
ITS
Adap
tive
Blac
ksto
ne_A
bby
M0
1,25
2,10
00
00
01,
252,
100
PW00
810
ITS
Adap
tiveB
lack
ston
e_Fr
iant
M0
232,
100
00
00
232,
100
PW00
811
ITS
Ada
ptiv
e Ve
ntur
a/KC
M0
1,66
2,50
00
00
01,
662,
500
PW00
825
TS L
St.
and
Fres
no/T
ular
e St
s3
5,70
014
4,90
00
00
014
4,90
0
PW00
827
Her
ndon
-GSB
to W
illow
Ped
CSH
M0
14,3
000
00
014
,300
PW00
828
Shaw
-Wes
t to
Che
stnu
t Ped
CSH
M0
12,1
000
00
012
,100
PW00
829
BRT-
ATP
Inte
rsec
tion
Impr
ovem
eM
015
5,20
00
00
015
5,20
0
PW00
830
TS: M
arks
& N
iels
en A
venu
es3
1,30
057
,000
00
00
57,0
00
PW00
842
MLK
Cnt
Act
ive
Tran
s In
frast
r3
072
4,50
00
00
072
4,50
0
PW00
843
McK
inle
y W
iden
Mar
ks to
Hug
hes
30
1,73
2,50
00
00
01,
732,
500
PW00
854
Bulla
rd O
verla
y C
edar
to F
irst
40
1,42
1,60
00
00
01,
421,
600
PW00
878
Mid
tow
n Sc
hool
Are
a In
terc
onn
M0
112,
000
00
00
112,
000
PW00
880
Sout
h Fr
esno
Ped
Cou
ntdo
wn
M0
144,
900
00
00
144,
900
PW00
881
Firs
t St C
orrid
or Im
prov
emen
tsM
2,30
030
,800
00
00
30,8
00
PW00
882
Fres
no S
t Cor
ridor
Impr
ovem
ent
M0
1,56
0,60
00
00
01,
560,
600
PW00
891
Ashl
an W
iden
ing
Polk
-Cor
nelia
10
483,
500
00
00
483,
500
PW00
898
ITS
Ashl
an C
orne
lia-B
lack
ston
eM
012
6,70
00
00
012
6,70
0
PW00
905
TS G
etty
sbur
g/Po
lk &
Sid
ewal
k1
047
3,40
00
00
047
3,40
0
Pro
ject
N
ame
Dis
tric
t
Cap
ital
Proj
ects
FY 2
020
Estim
ate
2021
Cap
ital
Proj
ects
2022
Cap
ital
Proj
ects
2023
Cap
ital
Proj
ects
2024
Cap
ital
Proj
ects
2025
Cap
ital
Proj
ects
5 Ye
arPr
ojec
tTo
tal
FY 2020-2021 Capital Improvement Program by Department / Fund / Project
C - 56 FY 2020-2021 Final Revised Budget
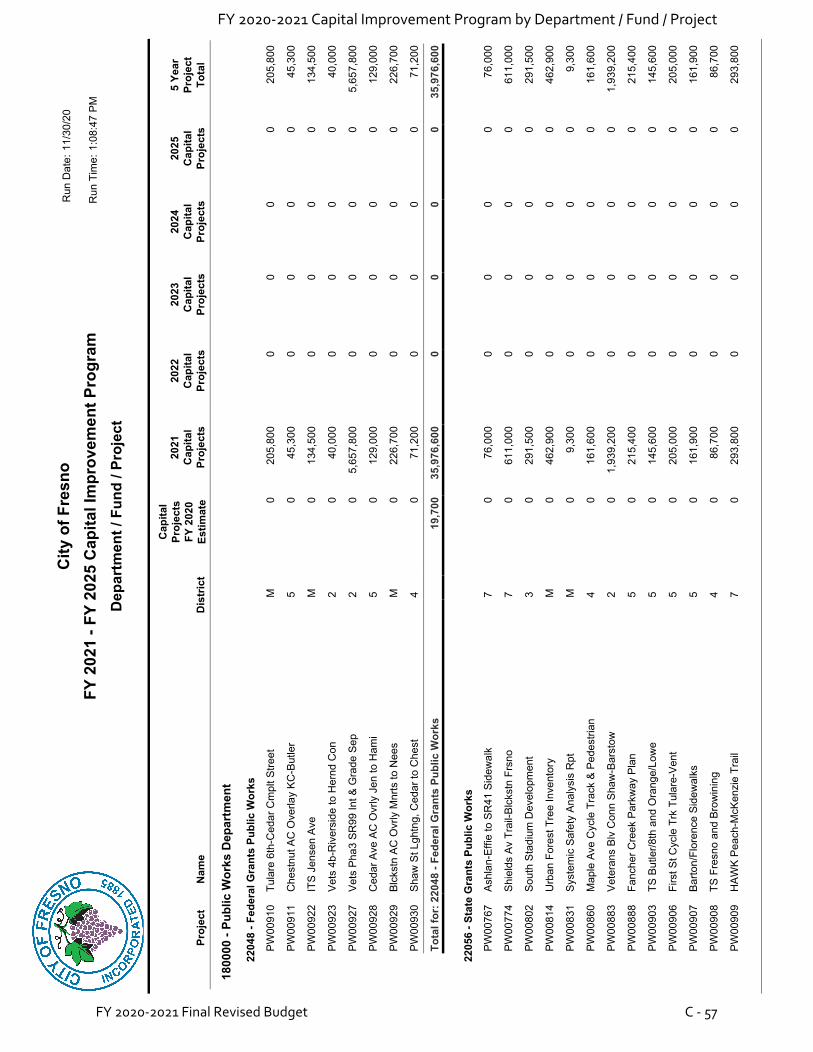
City
of F
resn
oR
un D
ate:
11/3
0/20
FY 2
021
- FY
2025
Cap
ital I
mpr
ovem
ent P
rogr
amR
un T
ime:
1:08
:47
PM
Dep
artm
ent /
Fun
d / P
roje
ct
1800
00 -
Publ
ic W
orks
Dep
artm
ent
2204
8 - F
eder
al G
rant
s Pu
blic
Wor
ks
PW00
910
Tula
re 6
th-C
edar
Cm
plt S
treet
M0
205,
800
00
00
205,
800
PW00
911
Che
stnu
t AC
Ove
rlay
KC-B
utle
r5
045
,300
00
00
45,3
00
PW00
922
ITS
Jens
en A
veM
013
4,50
00
00
013
4,50
0
PW00
923
Vets
4b-
Riv
ersi
de to
Her
nd C
on2
040
,000
00
00
40,0
00
PW00
927
Vets
Pha
3 SR
99 In
t & G
rade
Sep
20
5,65
7,80
00
00
05,
657,
800
PW00
928
Ced
ar A
ve A
C O
vrly
Jen
to H
ami
50
129,
000
00
00
129,
000
PW00
929
Blck
stn
AC O
vrly
Mnr
ts to
Nee
sM
022
6,70
00
00
022
6,70
0
PW00
930
Shaw
St L
ghtn
g, C
edar
to C
hest
40
71,2
000
00
071
,200
Tota
l for
: 220
48 -
Fede
ral G
rant
s Pu
blic
Wor
ks19
,700
35,9
76,6
000
00
035
,976
,600
2205
6 - S
tate
Gra
nts
Publ
ic W
orks
PW00
767
Ashl
an-E
ffie
to S
R41
Sid
ewal
k7
076
,000
00
00
76,0
00
PW00
774
Shie
lds
Av T
rail-
Blck
stn
Frsn
o7
061
1,00
00
00
061
1,00
0
PW00
802
Sout
h St
adiu
m D
evel
opm
ent
30
291,
500
00
00
291,
500
PW00
814
Urb
an F
ores
t Tre
e In
vent
ory
M0
462,
900
00
00
462,
900
PW00
831
Syst
emic
Saf
ety
Anal
ysis
Rpt
M0
9,30
00
00
09,
300
PW00
860
Map
le A
ve C
ycle
Tra
ck &
Ped
estri
an4
016
1,60
00
00
016
1,60
0
PW00
883
Vete
rans
Blv
Con
n Sh
aw-B
arst
ow2
01,
939,
200
00
00
1,93
9,20
0
PW00
888
Fanc
her C
reek
Par
kway
Pla
n5
021
5,40
00
00
021
5,40
0
PW00
903
TS B
utle
r/8th
and
Ora
nge/
Low
e5
014
5,60
00
00
014
5,60
0
PW00
906
Firs
t St C
ycle
Trk
Tul
are-
Vent
50
205,
000
00
00
205,
000
PW00
907
Barto
n/Fl
oren
ce S
idew
alks
50
161,
900
00
00
161,
900
PW00
908
TS F
resn
o an
d Br
owin
ing
40
86,7
000
00
086
,700
PW00
909
HAW
K Pe
ach-
McK
enzi
e Tr
ail
70
293,
800
00
00
293,
800
Pro
ject
N
ame
Dis
tric
t
Cap
ital
Proj
ects
FY 2
020
Estim
ate
2021
Cap
ital
Proj
ects
2022
Cap
ital
Proj
ects
2023
Cap
ital
Proj
ects
2024
Cap
ital
Proj
ects
2025
Cap
ital
Proj
ects
5 Ye
arPr
ojec
tTo
tal
FY 2020-2021 Capital Improvement Program by Department / Fund / Project
FY 2020-2021 Final Revised Budget C - 57

City
of F
resn
oR
un D
ate:
11/3
0/20
FY 2
021
- FY
2025
Cap
ital I
mpr
ovem
ent P
rogr
amR
un T
ime:
1:08
:47
PM
Dep
artm
ent /
Fun
d / P
roje
ct
1800
00 -
Publ
ic W
orks
Dep
artm
ent
2205
6 - S
tate
Gra
nts
Publ
ic W
orks
PW00
916
Trai
l Net
wor
k W
ayfin
ding
Pla
nM
011
1,00
00
00
011
1,00
0
PW00
926
TOD
Bla
ckst
one
& M
cKin
ley
M0
3,36
6,70
00
00
03,
366,
700
PW00
927
Vets
Pha
3 SR
99 In
t & G
rade
Sep
20
14,6
15,0
000
00
014
,615
,000
Tota
l for
: 220
56 -
Stat
e G
rant
s Pu
blic
Wor
ks0
22,7
52,6
000
00
022
,752
,600
2206
3 - T
rans
form
ativ
e C
limat
e C
omm
PW00
844
Chi
nato
wn
UG
P - P
roje
ct 1
30
43,4
000
00
043
,400
PW00
845
Chi
nato
wn
UG
P -
Proj
ect 6
30
776,
900
00
00
776,
900
PW00
846
Mar
ipos
a Pl
aza
30
98,6
003,
135,
800
00
03,
234,
400
PW00
849
SW F
resn
o G
reen
Tra
ils &
Cyc
le3
036
1,60
00
00
036
1,60
0
PW00
857
MLK
Mag
net C
ore
Park
30
681,
300
00
00
681,
300
PW00
858
TCC
Com
mun
ity E
ngag
emen
t Pla
n3
021
1,70
00
00
021
1,70
0
PW00
861
TCC
Gra
nt A
dmin
istra
tion
30
220,
800
1,50
01,
500
00
223,
800
PW00
862
TCC
Chi
nato
wn
Proj
ect
30
10,8
07,4
000
00
010
,807
,400
PW00
863
TCC
EO
C P
artn
ersh
ip3
01,
081,
800
00
00
1,08
1,80
0
PW00
864
TCC
GR
ID S
olar
Sin
gle-
Fam
ily3
018
4,20
00
00
018
4,20
0
PW00
865
TCC
GR
ID S
olar
Mul
ti-Fa
mily
30
195,
000
00
00
195,
000
PW00
866
TCC
Cle
an S
hare
d M
obilit
y3
05,
212,
600
00
00
5,21
2,60
0
PW00
867
TCC
Ann
adel
e M
ode
Shift
30
85,8
000
00
085
,800
PW00
869
TCC
Yos
emite
Villa
ge3
011
8,90
00
00
011
8,90
0
PW00
870
TCC
Insi
de O
ut C
omm
Gar
den
30
24,7
000
00
024
,700
PW00
874
TCC
Wor
korc
e D
evel
opm
ent P
lan
30
275,
500
00
00
275,
500
PW00
876
TCC
Wes
t Fre
sno
Sate
llite
Cam
pus
30
5,02
8,00
00
00
05,
028,
000
PW00
877
TCC
Com
m E
ng P
lan
SW T
rails
30
86,1
000
00
086
,100
Pro
ject
N
ame
Dis
tric
t
Cap
ital
Proj
ects
FY 2
020
Estim
ate
2021
Cap
ital
Proj
ects
2022
Cap
ital
Proj
ects
2023
Cap
ital
Proj
ects
2024
Cap
ital
Proj
ects
2025
Cap
ital
Proj
ects
5 Ye
arPr
ojec
tTo
tal
FY 2020-2021 Capital Improvement Program by Department / Fund / Project
C - 58 FY 2020-2021 Final Revised Budget

City
of F
resn
oR
un D
ate:
11/3
0/20
FY 2
021
- FY
2025
Cap
ital I
mpr
ovem
ent P
rogr
amR
un T
ime:
1:08
:47
PM
Dep
artm
ent /
Fun
d / P
roje
ct
1800
00 -
Publ
ic W
orks
Dep
artm
ent
2206
3 - T
rans
form
ativ
e C
limat
e C
omm
PW00
915
TCC
Tec
hnic
al A
ssis
tanc
e G
rant
30
54,3
000
00
054
,300
Tota
l for
: 220
63 -
Tran
sfor
mat
ive
Clim
ate
Com
m0
25,5
48,6
003,
137,
300
1,50
00
028
,687
,400
2209
5 - E
DA
Gra
nt
PW00
797
Van
Nes
s In
dust
rial S
treet
Imp
30
415,
200
00
00
415,
200
Tota
l for
: 220
95 -
EDA
Gra
nt0
415,
200
00
00
415,
200
2250
4 - M
easu
re C
Tie
r 1 C
apita
l Pro
ject
s
PW00
534
Peac
h Av
e Je
nsen
to B
utle
r5
01,
430,
700
00
00
1,43
0,70
0
PW00
669
Vete
rans
Blv
d R
ight
-Of-W
ay2
1,20
090
,400
00
00
90,4
00
PW00
679
Her
ndon
Wid
enin
g Po
lk to
Milb
urn
20
313,
300
00
00
313,
300
PW00
927
Vets
Pha
3 SR
99 In
t & G
rade
Sep
20
8,19
6,10
00
00
08,
196,
100
Tota
l for
: 225
04 -
Mea
sure
C T
ier 1
Cap
ital P
roje
cts
1,20
010
,030
,500
00
00
10,0
30,5
00
2250
6 - M
eas
C-P
W A
lloc
Stre
et M
aint
2250
7 - M
eas
C-P
W A
lloc
AD
A C
ompl
ianc
e
PW00
268
ADA
Infra
stru
ctur
e C
ompl
ianc
eM
040
0,00
00
00
040
0,00
0
PW00
461
ADA
Infra
stru
ctur
e - M
inor
Cap
M0
51,0
000
00
051
,000
Tota
l for
: 225
07 -
Mea
s C
-PW
Allo
c A
DA
Com
plia
nce
045
1,00
00
00
045
1,00
0
2250
8 - M
eas
C-P
W A
lloc
Flex
ible
Fun
d
PW00
044
Min
or P
ublic
Impr
ovem
ents
M0
25,0
000
00
025
,000
PW00
809
ITS
Adap
tive
Blac
ksto
ne_A
bby
M0
213,
900
00
00
213,
900
PW00
811
ITS
Ada
ptiv
e Ve
ntur
a/KC
M0
47,0
000
00
047
,000
Pro
ject
N
ame
Dis
tric
t
Cap
ital
Proj
ects
FY 2
020
Estim
ate
2021
Cap
ital
Proj
ects
2022
Cap
ital
Proj
ects
2023
Cap
ital
Proj
ects
2024
Cap
ital
Proj
ects
2025
Cap
ital
Proj
ects
5 Ye
arPr
ojec
tTo
tal
FY 2020-2021 Capital Improvement Program by Department / Fund / Project
FY 2020-2021 Final Revised Budget C - 59
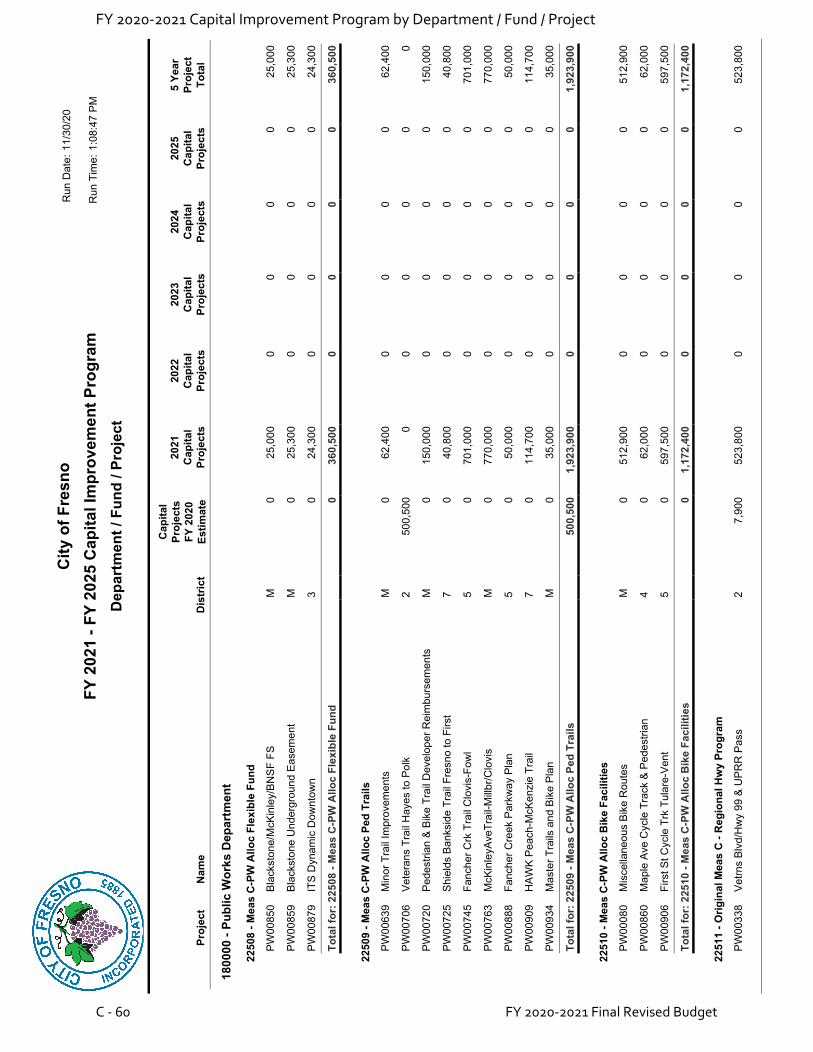
City
of F
resn
oR
un D
ate:
11/3
0/20
FY 2
021
- FY
2025
Cap
ital I
mpr
ovem
ent P
rogr
amR
un T
ime:
1:08
:47
PM
Dep
artm
ent /
Fun
d / P
roje
ct
1800
00 -
Publ
ic W
orks
Dep
artm
ent
2250
8 - M
eas
C-P
W A
lloc
Flex
ible
Fun
d
PW00
850
Blac
ksto
ne/M
cKin
ley/
BNSF
FS
M0
25,0
000
00
025
,000
PW00
859
Blac
ksto
ne U
nder
grou
nd E
asem
ent
M0
25,3
000
00
025
,300
PW00
879
ITS
Dyn
amic
Dow
ntow
n3
024
,300
00
00
24,3
00
Tota
l for
: 225
08 -
Mea
s C
-PW
Allo
c Fl
exib
le F
und
036
0,50
00
00
036
0,50
0
2250
9 - M
eas
C-P
W A
lloc
Ped
Trai
ls
PW00
639
Min
or T
rail
Impr
ovem
ents
M0
62,4
000
00
062
,400
PW00
706
Vete
rans
Tra
il H
ayes
to P
olk
250
0,50
00
00
00
0
PW00
720
Pede
stria
n &
Bike
Tra
il D
evel
oper
Rei
mbu
rsem
ents
M0
150,
000
00
00
150,
000
PW00
725
Shie
lds
Bank
side
Tra
il Fr
esno
to F
irst
70
40,8
000
00
040
,800
PW00
745
Fanc
her C
rk T
rail
Clo
vis-
Fow
l5
070
1,00
00
00
070
1,00
0
PW00
763
McK
inle
yAve
Trai
l-Millb
r/Clo
vis
M0
770,
000
00
00
770,
000
PW00
888
Fanc
her C
reek
Par
kway
Pla
n5
050
,000
00
00
50,0
00
PW00
909
HAW
K Pe
ach-
McK
enzi
e Tr
ail
70
114,
700
00
00
114,
700
PW00
934
Mas
ter T
rails
and
Bik
e Pl
anM
035
,000
00
00
35,0
00
Tota
l for
: 225
09 -
Mea
s C
-PW
Allo
c Pe
d Tr
ails
500,
500
1,92
3,90
00
00
01,
923,
900
2251
0 - M
eas
C-P
W A
lloc
Bik
e Fa
cilit
ies
PW00
080
Mis
cella
neou
s Bi
ke R
oute
sM
051
2,90
00
00
051
2,90
0
PW00
860
Map
le A
ve C
ycle
Tra
ck &
Ped
estri
an4
062
,000
00
00
62,0
00
PW00
906
Firs
t St C
ycle
Trk
Tul
are-
Vent
50
597,
500
00
00
597,
500
Tota
l for
: 225
10 -
Mea
s C
-PW
Allo
c B
ike
Faci
litie
s0
1,17
2,40
00
00
01,
172,
400
2251
1 - O
rigin
al M
eas
C -
Reg
iona
l Hw
y Pr
ogra
m
PW00
338
Vetrn
s Bl
vd/H
wy
99 &
UPR
R P
ass
27,
900
523,
800
00
00
523,
800
Pro
ject
N
ame
Dis
tric
t
Cap
ital
Proj
ects
FY 2
020
Estim
ate
2021
Cap
ital
Proj
ects
2022
Cap
ital
Proj
ects
2023
Cap
ital
Proj
ects
2024
Cap
ital
Proj
ects
2025
Cap
ital
Proj
ects
5 Ye
arPr
ojec
tTo
tal
FY 2020-2021 Capital Improvement Program by Department / Fund / Project
C - 60 FY 2020-2021 Final Revised Budget

City
of F
resn
oR
un D
ate:
11/3
0/20
FY 2
021
- FY
2025
Cap
ital I
mpr
ovem
ent P
rogr
amR
un T
ime:
1:08
:47
PM
Dep
artm
ent /
Fun
d / P
roje
ct
1800
00 -
Publ
ic W
orks
Dep
artm
ent
2251
1 - O
rigin
al M
eas
C -
Reg
iona
l Hw
y Pr
ogra
m
PW00
669
Vete
rans
Blv
d R
ight
-Of-W
ay2
090
0,00
00
00
090
0,00
0
PW00
883
Vete
rans
Blv
Con
n Sh
aw-B
arst
ow2
01,
017,
000
00
00
1,01
7,00
0
Tota
l for
: 225
11 -
Orig
inal
Mea
s C
- R
egio
nal H
wy
Prog
ram
7,90
02,
440,
800
00
00
2,44
0,80
0
2251
2 - M
eas
C-T
rans
it (T
OD
) Pro
gram
s
PW00
901
TOD
Tow
er a
t Van
Nes
s &
Oliv
eM
028
9,60
00
00
028
9,60
0
PW00
902
Mer
ced
Stre
et R
econ
nect
ion
30
19,5
000
00
019
,500
PW00
926
TOD
Bla
ckst
one
& M
cKin
ley
M0
478,
000
00
00
478,
000
Tota
l for
: 225
12 -
Mea
s C
-Tra
nsit
(TO
D) P
rogr
ams
078
7,10
00
00
078
7,10
0
2251
3 - M
easu
re "
C"
Trai
l Adv
ance
men
t
PW00
725
Shie
lds
Bank
side
Tra
il Fr
esno
to F
irst
70
118,
600
00
00
118,
600
PW00
762
Her
ndon
Can
alTr
ail-S
hiel
ds/M
cKi
70
145,
600
00
00
145,
600
PW00
763
McK
inle
yAve
Trai
l-Millb
r/Clo
vis
M0
2,29
7,50
00
00
02,
297,
500
PW00
774
Shie
lds
Av T
rail-
Blck
stn
Frsn
o7
038
3,80
00
00
038
3,80
0
Tota
l for
: 225
13 -
Mea
sure
"C
" Tr
ail A
dvan
cem
ent
02,
945,
500
00
00
2,94
5,50
0
2251
5 - M
easu
re C
New
Tec
hnol
ogy
PW00
879
ITS
Dyn
amic
Dow
ntow
n3
01,
643,
500
00
00
1,64
3,50
0
Tota
l for
: 225
15 -
Mea
sure
C N
ew T
echn
olog
y0
1,64
3,50
00
00
01,
643,
500
2251
6 - M
easu
re C
Litt
er A
bate
men
t
PW00
889
Free
way
Litt
er A
bate
men
tM
075
,000
00
00
75,0
00
Tota
l for
: 225
16 -
Mea
sure
C L
itter
Aba
tem
ent
075
,000
00
00
75,0
00
Pro
ject
N
ame
Dis
tric
t
Cap
ital
Proj
ects
FY 2
020
Estim
ate
2021
Cap
ital
Proj
ects
2022
Cap
ital
Proj
ects
2023
Cap
ital
Proj
ects
2024
Cap
ital
Proj
ects
2025
Cap
ital
Proj
ects
5 Ye
arPr
ojec
tTo
tal
FY 2020-2021 Capital Improvement Program by Department / Fund / Project
FY 2020-2021 Final Revised Budget C - 61

City
of F
resn
oR
un D
ate:
11/3
0/20
FY 2
021
- FY
2025
Cap
ital I
mpr
ovem
ent P
rogr
amR
un T
ime:
1:08
:47
PM
Dep
artm
ent /
Fun
d / P
roje
ct
1800
00 -
Publ
ic W
orks
Dep
artm
ent
2251
7 - M
easu
re C
Gra
de S
epar
atio
n
PW00
937
Blac
ksto
ne-M
cKin
ley
Gra
de S
epar
atio
n M
06,
030,
000
00
00
6,03
0,00
0
Tota
l for
: 225
17 -
Mea
sure
C G
rade
Sep
arat
ion
06,
030,
000
00
00
6,03
0,00
0
2260
1 - R
eg T
rans
Miti
gatio
n Fe
e-R
TMF
PW00
669
Vete
rans
Blv
d R
ight
-Of-W
ay2
040
0,00
00
00
040
0,00
0
PW00
927
Vets
Pha
3 SR
99 In
t & G
rade
Sep
20
25,9
71,0
000
00
025
,971
,000
Tota
l for
: 226
01 -
Reg
Tra
ns M
itiga
tion
Fee-
RTM
F0
26,3
71,0
000
00
026
,371
,000
2400
9 - U
GM
Gen
eral
Adm
inis
trat
ion
PW00
086
UG
M G
ener
al A
dmin
istra
tion
M0
469,
800
00
00
469,
800
Tota
l for
: 240
09 -
UG
M G
ener
al A
dmin
istr
atio
n0
469,
800
00
00
469,
800
2404
2 - C
ityw
ide
Reg
iona
l Str
eet I
mpa
ct F
ee
PW00
261
UG
M B
iann
ual R
eim
burs
emen
tM
063
1,50
00
00
063
1,50
0
PW00
883
Vete
rans
Blv
Con
n Sh
aw-B
arst
ow2
03,
019,
300
00
00
3,01
9,30
0
PW00
887
Shaw
-SR
99 In
chg
Feas
Stu
dyM
3,00
086
,000
00
00
86,0
00
Tota
l for
: 240
42 -
City
wid
e R
egio
nal S
tree
t Im
pact
Fee
3,00
03,
736,
800
00
00
3,73
6,80
0
2404
3 - I
nter
ior S
tree
ts &
Rou
ndab
outs
Str
eet I
mpa
ct F
ee
PW00
261
UG
M B
iann
ual R
eim
burs
emen
tM
021
5,00
00
00
021
5,00
0
Tota
l for
: 240
43 -
Inte
rior S
tree
ts &
Rou
ndab
outs
Str
eet I
mpa
ct F
ee0
215,
000
00
00
215,
000
2405
2 - R
egio
nal S
tree
t Im
pact
Fee
- C
oppe
r Riv
er
PW00
261
UG
M B
iann
ual R
eim
burs
emen
tM
01,
806,
500
00
00
1,80
6,50
0
Tota
l for
: 240
52 -
Reg
iona
l Str
eet I
mpa
ct F
ee -
Cop
per R
iver
01,
806,
500
00
00
1,80
6,50
0
Pro
ject
N
ame
Dis
tric
t
Cap
ital
Proj
ects
FY 2
020
Estim
ate
2021
Cap
ital
Proj
ects
2022
Cap
ital
Proj
ects
2023
Cap
ital
Proj
ects
2024
Cap
ital
Proj
ects
2025
Cap
ital
Proj
ects
5 Ye
arPr
ojec
tTo
tal
FY 2020-2021 Capital Improvement Program by Department / Fund / Project
C - 62 FY 2020-2021 Final Revised Budget

City
of F
resn
oR
un D
ate:
11/3
0/20
FY 2
021
- FY
2025
Cap
ital I
mpr
ovem
ent P
rogr
amR
un T
ime:
1:08
:47
PM
Dep
artm
ent /
Fun
d / P
roje
ct
1800
00 -
Publ
ic W
orks
Dep
artm
ent
2405
3 - N
ew G
row
th A
rea
Stre
et Im
pact
Fee
s
PW00
261
UG
M B
iann
ual R
eim
burs
emen
tM
01,
502,
000
00
00
1,50
2,00
0
PW00
534
Peac
h Av
e Je
nsen
to B
utle
r5
02,
539,
100
00
00
2,53
9,10
0
PW00
678
TS C
linto
n &
Vale
ntin
e3
032
0,50
00
00
032
0,50
0
PW00
710
Inte
r Im
prov
Cen
tral &
Ora
nge
30
47,4
000
00
047
,400
PW00
796
Polk
Ave
Wid
enin
g Sh
aw-G
etty
sb1
01,
117,
200
00
00
1,11
7,20
0
PW00
890
Clin
ton
Wid
enin
g M
arks
-Bra
wle
y3
037
9,00
00
00
037
9,00
0
PW00
891
Ashl
an W
iden
ing
Polk
-Cor
nelia
10
54,8
000
00
054
,800
PW00
927
Vets
Pha
3 SR
99 In
t & G
rade
Sep
20
300,
000
00
00
300,
000
PW00
939
NB
Polk
Wid
en S
haw
-Get
tysb
urg
10
800,
000
00
00
800,
000
Tota
l for
: 240
53 -
New
Gro
wth
Are
a St
reet
Impa
ct F
ees
07,
060,
000
00
00
7,06
0,00
0
2405
4 - S
ewer
Bac
kbon
e Fe
e - C
oppe
r Riv
er
PW00
261
UG
M B
iann
ual R
eim
burs
emen
tM
010
,600
00
00
10,6
00
Tota
l for
: 240
54 -
Sew
er B
ackb
one
Fee
- Cop
per R
iver
010
,600
00
00
10,6
00
2405
5 - C
FD #
9 C
omm
/Ind
Feat
ure
Mai
nte
PW00
518
Com
m F
acilit
ies
Dis
t #9
M0
87,8
000
00
087
,800
PW00
540
CFD
#9 R
eser
veM
02,
600
00
00
2,60
0
Tota
l for
: 240
55 -
CFD
#9
Com
m/In
d Fe
atur
e M
aint
e0
90,4
000
00
090
,400
2406
1 - S
tate
Con
trac
ted
Serv
ices
PW00
801
Sect
130
RR
McK
inle
y an
d BN
SF7
016
8,20
00
00
016
8,20
0
PW00
889
Free
way
Litt
er A
bate
men
tM
010
0,00
00
00
010
0,00
0
Tota
l for
: 240
61 -
Stat
e C
ontr
acte
d Se
rvic
es0
268,
200
00
00
268,
200
Pro
ject
N
ame
Dis
tric
t
Cap
ital
Proj
ects
FY 2
020
Estim
ate
2021
Cap
ital
Proj
ects
2022
Cap
ital
Proj
ects
2023
Cap
ital
Proj
ects
2024
Cap
ital
Proj
ects
2025
Cap
ital
Proj
ects
5 Ye
arPr
ojec
tTo
tal
FY 2020-2021 Capital Improvement Program by Department / Fund / Project
FY 2020-2021 Final Revised Budget C - 63

City
of F
resn
oR
un D
ate:
11/3
0/20
FY 2
021
- FY
2025
Cap
ital I
mpr
ovem
ent P
rogr
amR
un T
ime:
1:08
:47
PM
Dep
artm
ent /
Fun
d / P
roje
ct
1800
00 -
Publ
ic W
orks
Dep
artm
ent
2406
4 - P
ublic
Priv
ate
Part
ners
hips
PW00
661
Fulto
n M
all I
mpr
ovem
ents
30
19,4
000
00
019
,400
Tota
l for
: 240
64 -
Publ
ic P
rivat
e Pa
rtne
rshi
ps0
19,4
000
00
019
,400
2600
1 - H
igh
Spee
d R
ail P
roje
cts
PW00
663
HSR
Mas
ter C
oope
rativ
e Ag
reem
ent
M0
426,
000
00
00
426,
000
PW00
683
Vete
rans
/UPR
R/H
SR O
verp
ass
290
02,
368,
500
00
00
2,36
8,50
0
PW00
783
HSR
"G"S
t Rlg
nmnt
CA
-Snt
a An
a3
06,
967,
900
00
00
6,96
7,90
0
Tota
l for
: 260
01 -
Hig
h Sp
eed
Rai
l Pro
ject
s90
09,
762,
400
00
00
9,76
2,40
0
2600
2 - H
igh
Spee
d R
ail S
ervi
ces
PW00
696
Hig
h Sp
eed
Rai
l Dev
elop
men
t Ser
vice
sM
350,
000
00
00
00
PW00
904
Hig
h Sp
eed
Rai
l Dev
elop
men
t Svc
sM
039
6,90
00
00
039
6,90
0
Tota
l for
: 260
02 -
Hig
h Sp
eed
Rai
l Ser
vice
s35
0,00
039
6,90
00
00
039
6,90
0
3010
2 - D
evel
oper
Cas
h-In
-Lie
u Im
prov
emen
t
PW00
044
Min
or P
ublic
Impr
ovem
ents
M0
267,
500
00
00
267,
500
PW00
261
UG
M B
iann
ual R
eim
burs
emen
tM
05,
500
00
00
5,50
0
PW00
706
Vete
rans
Tra
il H
ayes
to P
olk
21,
400
3,60
00
00
03,
600
Tota
l for
: 301
02 -
Dev
elop
er C
ash-
In-L
ieu
Impr
ovem
ent
1,40
027
6,60
00
00
027
6,60
0
3014
4 - L
cal A
gncy
Prj
Fndn
g-Pu
b W
orks
PW00
534
Peac
h Av
e Je
nsen
to B
utle
r5
030
,000
00
00
30,0
00
PW00
661
Fulto
n M
all I
mpr
ovem
ents
30
112,
500
00
00
112,
500
PW00
774
Shie
lds
Av T
rail-
Blck
stn
Frsn
o7
050
0,00
00
00
050
0,00
0
PW00
786
Jens
en O
vrla
y C
orne
lia-C
hate
au3
01,
263,
400
00
00
1,26
3,40
0
PW00
815
Cen
tral A
ve S
treet
Impr
ovem
ent
30
314,
600
00
00
314,
600
Pro
ject
N
ame
Dis
tric
t
Cap
ital
Proj
ects
FY 2
020
Estim
ate
2021
Cap
ital
Proj
ects
2022
Cap
ital
Proj
ects
2023
Cap
ital
Proj
ects
2024
Cap
ital
Proj
ects
2025
Cap
ital
Proj
ects
5 Ye
arPr
ojec
tTo
tal
FY 2020-2021 Capital Improvement Program by Department / Fund / Project
C - 64 FY 2020-2021 Final Revised Budget

City
of F
resn
oR
un D
ate:
11/3
0/20
FY 2
021
- FY
2025
Cap
ital I
mpr
ovem
ent P
rogr
amR
un T
ime:
1:08
:47
PM
Dep
artm
ent /
Fun
d / P
roje
ct
1800
00 -
Publ
ic W
orks
Dep
artm
ent
3014
4 - L
cal A
gncy
Prj
Fndn
g-Pu
b W
orks
PW00
856
TS: C
linto
n &
Angu
s1
032
0,00
00
00
032
0,00
0
PW00
860
Map
le A
ve C
ycle
Tra
ck &
Ped
estri
an4
030
,000
00
00
30,0
00
PW00
947
Sout
h Fr
esno
AB6
17 T
ruck
Rer
ou0
025
0,00
00
00
025
0,00
0
Tota
l for
: 301
44 -
Lcal
Agn
cy P
rj Fn
dng-
Pub
Wor
ks0
2,82
0,50
00
00
02,
820,
500
3015
4 - C
ash
in L
ieu
- Loa
n
PW00
781
TS B
ulla
rd &
Gra
ntla
nd2
012
5,10
00
00
012
5,10
0
PW00
815
Cen
tral A
ve S
treet
Impr
ovem
ent
30
1,20
7,10
00
00
01,
207,
100
PW00
944
SD C
linto
n Av
e W
O V
alen
tine
30
305,
200
00
00
305,
200
Tota
l for
: 301
54 -
Cas
h in
Lie
u - L
oan
01,
637,
400
00
00
1,63
7,40
0
3016
0 - A
nim
al S
helte
r
3050
1 - A
D 1
31-C
onst
-Her
ndon
/Milb
urn
PW00
095
Asse
ssm
ent D
ist 1
312
048
,900
00
00
48,9
00
Tota
l for
: 305
01 -
AD
131
-Con
st-H
ernd
on/M
ilbur
n0
48,9
000
00
048
,900
3050
3 - A
D 1
37-C
onst
-Fig
arde
n Pa
rk
PW00
490
Asse
ssm
ent D
istri
ct #
137
- C
onst
ruct
ion
20
300,
600
00
00
300,
600
Tota
l for
: 305
03 -
AD
137
-Con
st-F
igar
den
Park
030
0,60
00
00
030
0,60
0
3050
4 - A
D15
4-C
ALC
OT
Con
stru
ctio
n
PW00
096
Asse
ssm
ent D
ist 1
54 C
alco
t2
020
6,90
00
00
020
6,90
0
Tota
l for
: 305
04 -
AD
154-
CA
LCO
T C
onst
ruct
ion
020
6,90
00
00
020
6,90
0
Pro
ject
N
ame
Dis
tric
t
Cap
ital
Proj
ects
FY 2
020
Estim
ate
2021
Cap
ital
Proj
ects
2022
Cap
ital
Proj
ects
2023
Cap
ital
Proj
ects
2024
Cap
ital
Proj
ects
2025
Cap
ital
Proj
ects
5 Ye
arPr
ojec
tTo
tal
FY 2020-2021 Capital Improvement Program by Department / Fund / Project
FY 2020-2021 Final Revised Budget C - 65

City
of F
resn
oR
un D
ate:
11/3
0/20
FY 2
021
- FY
2025
Cap
ital I
mpr
ovem
ent P
rogr
amR
un T
ime:
1:08
:47
PM
Dep
artm
ent /
Fun
d / P
roje
ct
1800
00 -
Publ
ic W
orks
Dep
artm
ent
3050
6 - L
ands
cape
Mai
nten
ance
Dis
t #1
PW00
093
Land
scap
e Li
ghtin
g D
istri
ctM
014
,400
00
00
14,4
00
Tota
l for
: 305
06 -
Land
scap
e M
aint
enan
ce D
ist #
10
14,4
000
00
014
,400
3050
9 - C
omm
unity
Fac
ilitie
s D
ist N
o 2
PW00
097
Com
mun
ity F
acilit
ies
2M
035
,800
00
00
35,8
00
PW00
737
CFD
Irrig
atio
n C
ontro
l Upg
rade
M0
117,
400
00
00
117,
400
Tota
l for
: 305
09 -
Com
mun
ity F
acili
ties
Dis
t No
20
153,
200
00
00
153,
200
3051
0 - C
omm
unity
Fac
ilitie
s D
ist N
o 4
PW00
098
Com
mun
ity F
acilit
ies
46
071
0,40
00
00
071
0,40
0
Tota
l for
: 305
10 -
Com
mun
ity F
acili
ties
Dis
t No
40
710,
400
00
00
710,
400
3051
1 - C
omm
unity
Fac
ilitie
s D
ist N
o 5
PW00
240
Com
mun
ity F
acilit
ies
Dis
t. 5
30
1,60
00
00
01,
600
Tota
l for
: 305
11 -
Com
mun
ity F
acili
ties
Dis
t No
50
1,60
00
00
01,
600
3051
3 - C
omm
unity
Fac
ilitie
s D
ist N
o 7
PW00
254
CFD
#7
60
237,
600
00
00
237,
600
Tota
l for
: 305
13 -
Com
mun
ity F
acili
ties
Dis
t No
70
237,
600
00
00
237,
600
3051
4 - C
omm
unity
Fac
ilitie
s D
istr
ict N
o 8
PW00
260
CFD
#8 -
The
Zone
40
2,10
00
00
02,
100
Tota
l for
: 305
14 -
Com
mun
ity F
acili
ties
Dis
tric
t No
80
2,10
00
00
02,
100
3051
7 - C
omm
unity
Fac
ility
Dis
t No.
11
PW00
355
CFD
#11
Fea
ture
Mai
nten
ance
M0
223,
100
00
00
223,
100
Pro
ject
N
ame
Dis
tric
t
Cap
ital
Proj
ects
FY 2
020
Estim
ate
2021
Cap
ital
Proj
ects
2022
Cap
ital
Proj
ects
2023
Cap
ital
Proj
ects
2024
Cap
ital
Proj
ects
2025
Cap
ital
Proj
ects
5 Ye
arPr
ojec
tTo
tal
FY 2020-2021 Capital Improvement Program by Department / Fund / Project
C - 66 FY 2020-2021 Final Revised Budget

City
of F
resn
oR
un D
ate:
11/3
0/20
FY 2
021
- FY
2025
Cap
ital I
mpr
ovem
ent P
rogr
amR
un T
ime:
1:08
:47
PM
Dep
artm
ent /
Fun
d / P
roje
ct
1800
00 -
Publ
ic W
orks
Dep
artm
ent
3051
7 - C
omm
unity
Fac
ility
Dis
t No.
11
PW00
737
CFD
Irrig
atio
n C
ontro
l Upg
rade
M0
100,
000
00
00
100,
000
Tota
l for
: 305
17 -
Com
mun
ity F
acili
ty D
ist N
o. 1
10
323,
100
00
00
323,
100
3051
8 - C
omm
unity
Fac
ility
Dis
t N
o 12
PW00
447
CFD
12
Cop
per R
iver
Mai
nt D
ist
60
589,
000
00
00
589,
000
Tota
l for
: 305
18 -
Com
mun
ity F
acili
ty D
ist
No
120
589,
000
00
00
589,
000
3052
0 - C
omm
unity
Fac
ility
Dis
t No.
14
PW00
348
CFD
#14
Run
ning
Hor
se3
083
,700
00
00
83,7
00
Tota
l for
: 305
20 -
Com
mun
ity F
acili
ty D
ist N
o. 1
40
83,7
000
00
083
,700
3052
1 - C
FD#1
5 EA
ST C
oppe
r Riv
er D
ist
PW00
659
CFD
15
EAST
Cop
per R
iver
Mai
nt D
istri
ctM
01,
200
00
00
1,20
0
Tota
l for
: 305
21 -
CFD
#15
EAST
Cop
per R
iver
Dis
t0
1,20
00
00
01,
200
3052
2 - C
FD N
o. 2
- R
eser
ve
PW00
536
CFD
#2 R
eser
veM
021
2,40
00
00
021
2,40
0
Tota
l for
: 305
22 -
CFD
No.
2 -
Res
erve
021
2,40
00
00
021
2,40
0
3052
3 - C
FD N
o. 1
1 - R
eser
ve
PW00
539
CFD
#11
Res
erve
M0
482,
700
00
00
482,
700
Tota
l for
: 305
23 -
CFD
No.
11
- Res
erve
048
2,70
00
00
048
2,70
0
3150
1 - U
GM
Nei
gh P
ark
Serv
ice
Are
a 1
PW00
261
UG
M B
iann
ual R
eim
burs
emen
tM
080
00
00
080
0
Tota
l for
: 315
01 -
UG
M N
eigh
Par
k Se
rvic
e A
rea
10
800
00
00
800
Pro
ject
N
ame
Dis
tric
t
Cap
ital
Proj
ects
FY 2
020
Estim
ate
2021
Cap
ital
Proj
ects
2022
Cap
ital
Proj
ects
2023
Cap
ital
Proj
ects
2024
Cap
ital
Proj
ects
2025
Cap
ital
Proj
ects
5 Ye
arPr
ojec
tTo
tal
FY 2020-2021 Capital Improvement Program by Department / Fund / Project
FY 2020-2021 Final Revised Budget C - 67
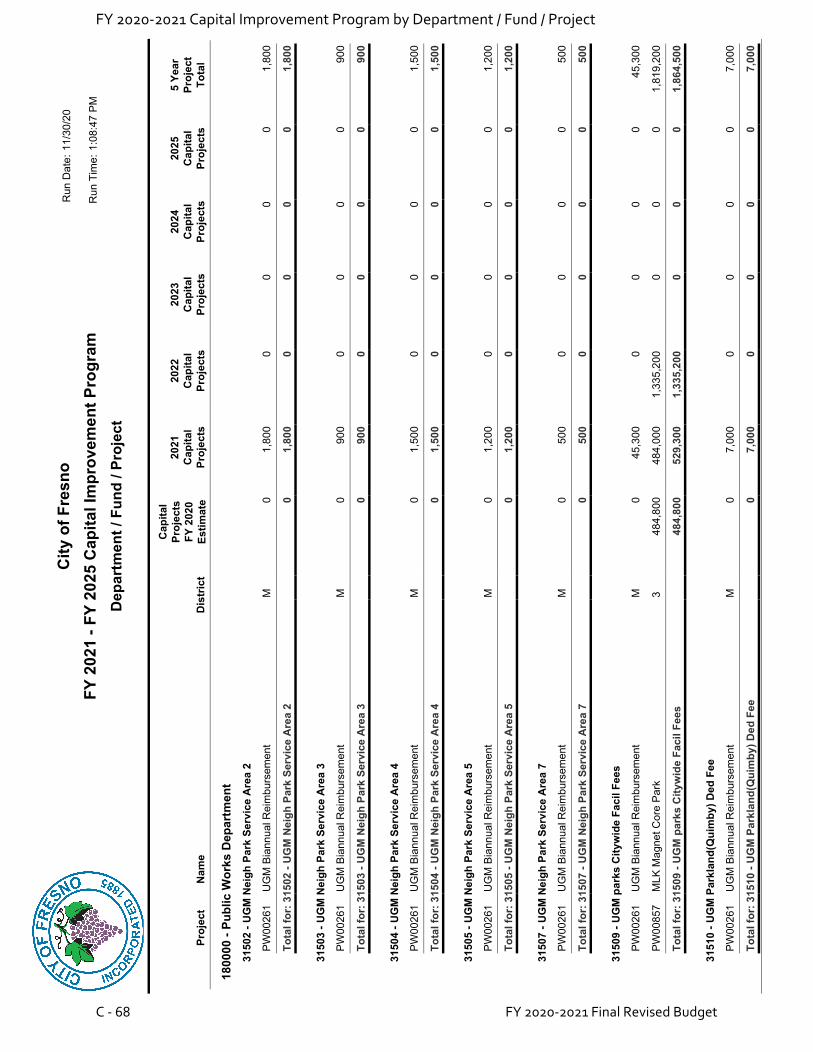
City
of F
resn
oR
un D
ate:
11/3
0/20
FY 2
021
- FY
2025
Cap
ital I
mpr
ovem
ent P
rogr
amR
un T
ime:
1:08
:47
PM
Dep
artm
ent /
Fun
d / P
roje
ct
1800
00 -
Publ
ic W
orks
Dep
artm
ent
3150
2 - U
GM
Nei
gh P
ark
Serv
ice
Are
a 2
PW00
261
UG
M B
iann
ual R
eim
burs
emen
tM
01,
800
00
00
1,80
0
Tota
l for
: 315
02 -
UG
M N
eigh
Par
k Se
rvic
e A
rea
20
1,80
00
00
01,
800
3150
3 - U
GM
Nei
gh P
ark
Serv
ice
Are
a 3
PW00
261
UG
M B
iann
ual R
eim
burs
emen
tM
090
00
00
090
0
Tota
l for
: 315
03 -
UG
M N
eigh
Par
k Se
rvic
e A
rea
30
900
00
00
900
3150
4 - U
GM
Nei
gh P
ark
Serv
ice
Are
a 4
PW00
261
UG
M B
iann
ual R
eim
burs
emen
tM
01,
500
00
00
1,50
0
Tota
l for
: 315
04 -
UG
M N
eigh
Par
k Se
rvic
e A
rea
40
1,50
00
00
01,
500
3150
5 - U
GM
Nei
gh P
ark
Serv
ice
Are
a 5
PW00
261
UG
M B
iann
ual R
eim
burs
emen
tM
01,
200
00
00
1,20
0
Tota
l for
: 315
05 -
UG
M N
eigh
Par
k Se
rvic
e A
rea
50
1,20
00
00
01,
200
3150
7 - U
GM
Nei
gh P
ark
Serv
ice
Are
a 7
PW00
261
UG
M B
iann
ual R
eim
burs
emen
tM
050
00
00
050
0
Tota
l for
: 315
07 -
UG
M N
eigh
Par
k Se
rvic
e A
rea
70
500
00
00
500
3150
9 - U
GM
par
ks C
ityw
ide
Faci
l Fee
s
PW00
261
UG
M B
iann
ual R
eim
burs
emen
tM
045
,300
00
00
45,3
00
PW00
857
MLK
Mag
net C
ore
Park
348
4,80
048
4,00
01,
335,
200
00
01,
819,
200
Tota
l for
: 315
09 -
UG
M p
arks
City
wid
e Fa
cil F
ees
484,
800
529,
300
1,33
5,20
00
00
1,86
4,50
0
3151
0 - U
GM
Par
klan
d(Q
uim
by) D
ed F
ee
PW00
261
UG
M B
iann
ual R
eim
burs
emen
tM
07,
000
00
00
7,00
0
Tota
l for
: 315
10 -
UG
M P
arkl
and(
Qui
mby
) Ded
Fee
07,
000
00
00
7,00
0
Pro
ject
N
ame
Dis
tric
t
Cap
ital
Proj
ects
FY 2
020
Estim
ate
2021
Cap
ital
Proj
ects
2022
Cap
ital
Proj
ects
2023
Cap
ital
Proj
ects
2024
Cap
ital
Proj
ects
2025
Cap
ital
Proj
ects
5 Ye
arPr
ojec
tTo
tal
FY 2020-2021 Capital Improvement Program by Department / Fund / Project
C - 68 FY 2020-2021 Final Revised Budget

City
of F
resn
oR
un D
ate:
11/3
0/20
FY 2
021
- FY
2025
Cap
ital I
mpr
ovem
ent P
rogr
amR
un T
ime:
1:08
:47
PM
Dep
artm
ent /
Fun
d / P
roje
ct
1800
00 -
Publ
ic W
orks
Dep
artm
ent
3151
0 - U
GM
Par
klan
d(Q
uim
by) D
ed F
ee
3151
6 - U
GM
Maj
or S
tree
t Zon
a A
PW00
044
Min
or P
ublic
Impr
ovem
ents
M0
555,
000
00
00
555,
000
PW00
261
UG
M B
iann
ual R
eim
burs
emen
tM
02,
000
00
00
2,00
0
Tota
l for
: 315
16 -
UG
M M
ajor
Str
eet Z
ona
A0
557,
000
00
00
557,
000
3151
7 - U
GM
Maj
or S
tree
t Zon
e B
PW00
044
Min
or P
ublic
Impr
ovem
ents
M0
256,
200
00
00
256,
200
PW00
261
UG
M B
iann
ual R
eim
burs
emen
tM
01,
200
00
00
1,20
0
Tota
l for
: 315
17 -
UG
M M
ajor
Str
eet Z
one
B0
257,
400
00
00
257,
400
3151
8 - U
GM
Maj
or S
tree
t Zon
e C
/D-2
PW00
261
UG
M B
iann
ual R
eim
burs
emen
tM
02,
000
00
00
2,00
0
Tota
l for
: 315
18 -
UG
M M
ajor
Str
eet Z
one
C/D
-20
2,00
00
00
02,
000
3151
9 - U
GM
Maj
or S
tree
t Zon
e D
-1/E
-2
PW00
261
UG
M B
iann
ual R
eim
burs
emen
tM
016
2,20
00
00
016
2,20
0
Tota
l for
: 315
19 -
UG
M M
ajor
Str
eet Z
one
D-1
/E-2
016
2,20
00
00
016
2,20
0
3152
0 - U
GM
Maj
or S
tree
t Zon
e E
PW00
261
UG
M B
iann
ual R
eim
burs
emen
tM
011
,700
00
00
11,7
00
Tota
l for
: 315
20 -
UG
M M
ajor
Str
eet Z
one
E0
11,7
000
00
011
,700
3152
1 - U
GM
Maj
or S
tree
t Zon
e E-
3
PW00
261
UG
M B
iann
ual R
eim
burs
emen
tM
020
00
00
020
0
Tota
l for
: 315
21 -
UG
M M
ajor
Str
eet Z
one
E-3
020
00
00
020
0
Pro
ject
N
ame
Dis
tric
t
Cap
ital
Proj
ects
FY 2
020
Estim
ate
2021
Cap
ital
Proj
ects
2022
Cap
ital
Proj
ects
2023
Cap
ital
Proj
ects
2024
Cap
ital
Proj
ects
2025
Cap
ital
Proj
ects
5 Ye
arPr
ojec
tTo
tal
FY 2020-2021 Capital Improvement Program by Department / Fund / Project
FY 2020-2021 Final Revised Budget C - 69

City
of F
resn
oR
un D
ate:
11/3
0/20
FY 2
021
- FY
2025
Cap
ital I
mpr
ovem
ent P
rogr
amR
un T
ime:
1:08
:47
PM
Dep
artm
ent /
Fun
d / P
roje
ct
1800
00 -
Publ
ic W
orks
Dep
artm
ent
3152
2 - U
GM
Maj
or S
tree
t Zon
e E-
4
PW00
261
UG
M B
iann
ual R
eim
burs
emen
tM
026
,000
00
00
26,0
00
Tota
l for
: 315
22 -
UG
M M
ajor
Str
eet Z
one
E-4
026
,000
00
00
26,0
00
3152
4 - U
GM
Maj
or S
tree
t Zon
e F
PW00
261
UG
M B
iann
ual R
eim
burs
emen
tM
01,
200
00
00
1,20
0
Tota
l for
: 315
24 -
UG
M M
ajor
Str
eet Z
one
F0
1,20
00
00
01,
200
3153
2 - U
GM
Maj
Brid
ge F
ee Z
one
B
PW00
261
UG
M B
iann
ual R
eim
burs
emen
tM
050
00
00
050
0
Tota
l for
: 315
32 -
UG
M M
aj B
ridge
Fee
Zon
e B
050
00
00
050
0
3153
3 - U
GM
Maj
Brid
ge F
ee Z
one
C/D
2
PW00
261
UG
M B
iann
ual R
eim
burs
emen
tM
01,
200
00
00
1,20
0
Tota
l for
: 315
33 -
UG
M M
aj B
ridge
Fee
Zon
e C
/D2
01,
200
00
00
1,20
0
3153
4 - U
GM
Maj
Brid
ge F
ee Z
one
D-1
/E-2
PW00
261
UG
M B
iann
ual R
eim
burs
emen
tM
051
,200
00
00
51,2
00
Tota
l for
: 315
34 -
UG
M M
aj B
ridge
Fee
Zon
e D
-1/E
-20
51,2
000
00
051
,200
3153
5 - U
GM
Maj
Brid
ge F
ee Z
one
E-1
PW00
261
UG
M B
iann
ual R
eim
burs
emen
tM
093
,100
00
00
93,1
00
Tota
l for
: 315
35 -
UG
M M
aj B
ridge
Fee
Zon
e E-
10
93,1
000
00
093
,100
3153
6 - U
GM
Maj
Brid
ge F
ee Z
one
E-3
PW00
261
UG
M B
iann
ual R
eim
burs
emen
tM
080
00
00
080
0
Tota
l for
: 315
36 -
UG
M M
aj B
ridge
Fee
Zon
e E-
30
800
00
00
800
Pro
ject
N
ame
Dis
tric
t
Cap
ital
Proj
ects
FY 2
020
Estim
ate
2021
Cap
ital
Proj
ects
2022
Cap
ital
Proj
ects
2023
Cap
ital
Proj
ects
2024
Cap
ital
Proj
ects
2025
Cap
ital
Proj
ects
5 Ye
arPr
ojec
tTo
tal
FY 2020-2021 Capital Improvement Program by Department / Fund / Project
C - 70 FY 2020-2021 Final Revised Budget

City
of F
resn
oR
un D
ate:
11/3
0/20
FY 2
021
- FY
2025
Cap
ital I
mpr
ovem
ent P
rogr
amR
un T
ime:
1:08
:47
PM
Dep
artm
ent /
Fun
d / P
roje
ct
1800
00 -
Publ
ic W
orks
Dep
artm
ent
3153
7 - U
GM
Maj
Brid
ge F
ee Z
one
E-4
PW00
261
UG
M B
iann
ual R
eim
burs
emen
tM
01,
000
00
00
1,00
0
Tota
l for
: 315
37 -
UG
M M
aj B
ridge
Fee
Zon
e E-
40
1,00
00
00
01,
000
3153
8 - U
GM
Maj
Brid
ge F
ee Z
one
F
PW00
261
UG
M B
iann
ual R
eim
burs
emen
tM
08,
800
00
00
8,80
0
Tota
l for
: 315
38 -
UG
M M
aj B
ridge
Fee
Zon
e F
08,
800
00
00
8,80
0
3155
3 - U
GM
Fire
Sta
tion
Serv
Are
a 15
PW00
261
UG
M B
iann
ual R
eim
burs
emen
tM
050
00
00
050
0
Tota
l for
: 315
53 -
UG
M F
ire S
tatio
n Se
rv A
rea
150
500
00
00
500
3155
5 - U
GM
Fire
Sta
tion
#19
3155
6 - U
GM
Fire
City
wid
e Fa
cil F
ees
PW00
261
UG
M B
iann
ual R
eim
burs
emen
tM
020
,400
00
00
20,4
00
Tota
l for
: 315
56 -
UG
M F
ire C
ityw
ide
Faci
l Fee
s0
20,4
000
00
020
,400
3156
1 - U
GM
R/R
Cro
ssin
g A
udub
on &
SP
PW00
261
UG
M B
iann
ual R
eim
burs
emen
tM
030
00
00
030
0
Tota
l for
: 315
61 -
UG
M R
/R C
ross
ing
Aud
ubon
& S
P0
300
00
00
300
3156
2 - U
GM
RR
Cro
ss/A
t Gra
de Z
one
A/B
PW00
261
UG
M B
iann
ual R
eim
burs
emen
tM
017
,400
00
00
17,4
00
Tota
l for
: 315
62 -
UG
M R
R C
ross
/At G
rade
Zon
e A
/B0
17,4
000
00
017
,400
Pro
ject
N
ame
Dis
tric
t
Cap
ital
Proj
ects
FY 2
020
Estim
ate
2021
Cap
ital
Proj
ects
2022
Cap
ital
Proj
ects
2023
Cap
ital
Proj
ects
2024
Cap
ital
Proj
ects
2025
Cap
ital
Proj
ects
5 Ye
arPr
ojec
tTo
tal
FY 2020-2021 Capital Improvement Program by Department / Fund / Project
FY 2020-2021 Final Revised Budget C - 71

City
of F
resn
oR
un D
ate:
11/3
0/20
FY 2
021
- FY
2025
Cap
ital I
mpr
ovem
ent P
rogr
amR
un T
ime:
1:08
:47
PM
Dep
artm
ent /
Fun
d / P
roje
ct
1800
00 -
Publ
ic W
orks
Dep
artm
ent
3156
3 - U
GM
RR
Cro
ss a
t Gra
de Z
one
A/C
PW00
261
UG
M B
iann
ual R
eim
burs
emen
tM
014
,500
00
00
14,5
00
Tota
l for
: 315
63 -
UG
M R
R C
ross
at G
rade
Zon
e A
/C0
14,5
000
00
014
,500
3156
4 - U
GM
RR
Cro
ss/A
t Gra
de Z
one
A/D
PW00
261
UG
M B
iann
ual R
eim
burs
emen
tM
058
,900
00
00
58,9
00
Tota
l for
: 315
64 -
UG
M R
R C
ross
/At G
rade
Zon
e A
/D0
58,9
000
00
058
,900
3156
5 - U
GM
RR
Cro
ss/A
G Z
one
E/1-
A
PW00
261
UG
M B
iann
ual R
eim
burs
emen
tM
013
1,90
00
00
013
1,90
0
Tota
l for
: 315
65 -
UG
M R
R C
ross
/AG
Zon
e E/
1-A
013
1,90
00
00
013
1,90
0
3156
6 - U
GM
RR
Cro
ss/G
rade
Zon
e C
/D1
PW00
261
UG
M B
iann
ual R
eim
burs
emen
tM
050
4,90
00
00
050
4,90
0
Tota
l for
: 315
66 -
UG
M R
R C
ross
/Gra
de Z
one
C/D
10
504,
900
00
00
504,
900
3156
7 - U
GM
RR
Cro
ss/A
t Gra
de Z
one
A/E
PW00
261
UG
M B
iann
ual R
eim
burs
emen
tM
04,
900
00
00
4,90
0
Tota
l for
: 315
67 -
UG
M R
R C
ross
/At G
rade
Zon
e A
/E0
4,90
00
00
04,
900
3157
7 - U
GM
Gra
de S
epar
atio
n Zo
ne E
/4A
PW00
261
UG
M B
iann
ual R
eim
burs
emen
tM
04,
500
00
00
4,50
0
Tota
l for
: 315
77 -
UG
M G
rade
Sep
arat
ion
Zone
E/4
A0
4,50
00
00
04,
500
3157
8 - U
GM
Tra
f Sig
nal/M
itiga
Imp
Fee
PW00
261
UG
M B
iann
ual R
eim
burs
emen
tM
01,
003,
400
00
00
1,00
3,40
0
PW00
526
TS C
edar
& W
oodw
ard
50
130,
800
00
00
130,
800
Pro
ject
N
ame
Dis
tric
t
Cap
ital
Proj
ects
FY 2
020
Estim
ate
2021
Cap
ital
Proj
ects
2022
Cap
ital
Proj
ects
2023
Cap
ital
Proj
ects
2024
Cap
ital
Proj
ects
2025
Cap
ital
Proj
ects
5 Ye
arPr
ojec
tTo
tal
FY 2020-2021 Capital Improvement Program by Department / Fund / Project
C - 72 FY 2020-2021 Final Revised Budget

City
of F
resn
oR
un D
ate:
11/3
0/20
FY 2
021
- FY
2025
Cap
ital I
mpr
ovem
ent P
rogr
amR
un T
ime:
1:08
:47
PM
Dep
artm
ent /
Fun
d / P
roje
ct
1800
00 -
Publ
ic W
orks
Dep
artm
ent
3157
8 - U
GM
Tra
f Sig
nal/M
itiga
Imp
Fee
PW00
534
Peac
h Av
e Je
nsen
to B
utle
r5
040
0,00
00
00
040
0,00
0
PW00
596
TS B
utle
r & W
illow
50
600
00
00
600
PW00
678
TS C
linto
n &
Vale
ntin
e3
027
3,80
00
00
027
3,80
0
PW00
806
LT P
hasi
ng A
udub
on a
nd N
ees
20
505,
000
00
00
505,
000
PW00
905
TS G
etty
sbur
g/Po
lk &
Sid
ewal
k1
026
9,30
00
00
026
9,30
0
PW00
927
Vets
Pha
3 SR
99 In
t & G
rade
Sep
20
700,
000
00
00
700,
000
PW00
945
TS: F
owle
r and
Oliv
e 0
020
,000
00
00
20,0
00
Tota
l for
: 315
78 -
UG
M T
raf S
igna
l/Miti
ga Im
p Fe
e0
3,30
2,90
00
00
03,
302,
900
3158
5 - C
omm
unity
Fac
ilitie
s D
istr
ict N
o. 2
005-
01
PW00
322
CFD
200
5-01
TR
535
0 R
un H
orse
30
500
00
00
500
Tota
l for
: 315
85 -
Com
mun
ity F
acili
ties
Dis
tric
t No.
200
5-01
050
00
00
050
0
3158
6 - U
GM
Pol
ice
City
wid
e Fa
cil F
ees
PW00
261
UG
M B
iann
ual R
eim
burs
emen
tM
027
,000
00
00
27,0
00
Tota
l for
: 315
86 -
UG
M P
olic
e C
ityw
ide
Faci
l Fee
s0
27,0
000
00
027
,000
3158
8 - F
ranc
her C
reek
Pro
j Fin
Dis
tric
PW00
567
Fanc
her C
reek
Fin
anci
ng C
FD5
01,
200
00
00
1,20
0
Tota
l for
: 315
88 -
Fran
cher
Cre
ek P
roj F
in D
istr
ic0
1,20
00
00
01,
200
3162
0 - M
ajor
Str
eet C
onst
Fria
nt R
d W
iden
PW00
261
UG
M B
iann
ual R
eim
burs
emen
tM
020
00
00
020
0
Tota
l for
: 316
20 -
Maj
or S
tree
t Con
st F
riant
Rd
Wid
en0
200
00
00
200
Pro
ject
N
ame
Dis
tric
t
Cap
ital
Proj
ects
FY 2
020
Estim
ate
2021
Cap
ital
Proj
ects
2022
Cap
ital
Proj
ects
2023
Cap
ital
Proj
ects
2024
Cap
ital
Proj
ects
2025
Cap
ital
Proj
ects
5 Ye
arPr
ojec
tTo
tal
FY 2020-2021 Capital Improvement Program by Department / Fund / Project
FY 2020-2021 Final Revised Budget C - 73

City
of F
resn
oR
un D
ate:
11/3
0/20
FY 2
021
- FY
2025
Cap
ital I
mpr
ovem
ent P
rogr
amR
un T
ime:
1:08
:47
PM
Dep
artm
ent /
Fun
d / P
roje
ct
1800
00 -
Publ
ic W
orks
Dep
artm
ent
3162
5 - R
/W A
cqui
sitio
n Tr
act 5
206
PW00
287
UG
M R
/W T
ract
520
63
09,
900
00
00
9,90
0
Tota
l for
: 316
25 -
R/W
Acq
uisi
tion
Trac
t 520
60
9,90
00
00
09,
900
3163
3 - R
/W A
cqui
sitio
n-Tr
act 5
237
PW00
353
R/W
Acq
uisi
tion
Trac
t 523
74
082
,200
00
00
82,2
00
Tota
l for
: 316
33 -
R/W
Acq
uisi
tion-
Trac
t 523
70
82,2
000
00
082
,200
3164
1 - R
/W A
cqui
sitio
n - T
ract
523
2
PW00
754
Trac
t 523
2 Be
lmon
t Ave
Wid
e5
053
9,50
00
00
053
9,50
0
Tota
l for
: 316
41 -
R/W
Acq
uisi
tion
- Tra
ct 5
232
053
9,50
00
00
053
9,50
0
3164
3 - A
D #
131
UG
M R
eim
burs
emen
ts
PW00
261
UG
M B
iann
ual R
eim
burs
emen
tM
01,
789,
600
00
00
1,78
9,60
0
Tota
l for
: 316
43 -
AD
#13
1 U
GM
Rei
mbu
rsem
ents
01,
789,
600
00
00
1,78
9,60
0
3164
9 - R
/W A
cqui
sitio
n - T
ract
527
3
PW00
686
R/W
Acq
uisi
tion
- Tra
ct 5
352
60
1,60
00
00
01,
600
Tota
l for
: 316
49 -
R/W
Acq
uisi
tion
- Tra
ct 5
273
01,
600
00
00
1,60
0
3165
0 - R
/W A
cqui
sitio
n - P
Map
200
8-13
PW00
822
R/W
Acq
uisi
tion
- CU
P-17
-057
20
3,30
00
00
03,
300
Tota
l for
: 316
50 -
R/W
Acq
uisi
tion
- PM
ap 2
008-
130
3,30
00
00
03,
300
3165
1 - R
AIV
Acq
uisi
tion-
T577
0 &
T55
67
Pro
ject
N
ame
Dis
tric
t
Cap
ital
Proj
ects
FY 2
020
Estim
ate
2021
Cap
ital
Proj
ects
2022
Cap
ital
Proj
ects
2023
Cap
ital
Proj
ects
2024
Cap
ital
Proj
ects
2025
Cap
ital
Proj
ects
5 Ye
arPr
ojec
tTo
tal
FY 2020-2021 Capital Improvement Program by Department / Fund / Project
C - 74 FY 2020-2021 Final Revised Budget

City
of F
resn
oR
un D
ate:
11/3
0/20
FY 2
021
- FY
2025
Cap
ital I
mpr
ovem
ent P
rogr
amR
un T
ime:
1:08
:47
PM
Dep
artm
ent /
Fun
d / P
roje
ct
1800
00 -
Publ
ic W
orks
Dep
artm
ent
3165
2 - R
/W A
cqui
sitio
n - T
5531
PW00
719
R/W
Acq
uisi
tion
- Tra
ct 5
531
50
9,50
00
00
09,
500
Tota
l for
: 316
52 -
R/W
Acq
uisi
tion
- T55
310
9,50
00
00
09,
500
3165
3 - R
/W A
cqui
sitio
n - T
6095
PW00
794
R/W
Acq
uisi
tion
- Tra
ct 6
095
50
400
00
00
400
Tota
l for
: 316
53 -
R/W
Acq
uisi
tion
- T60
950
400
00
00
400
3165
4 - R
/W A
cqui
sitio
n - T
6124
PW00
799
R/W
Acq
uisi
tion
- Tra
ct 6
124
50
116,
600
00
00
116,
600
Tota
l for
: 316
54 -
R/W
Acq
uisi
tion
- T61
240
116,
600
00
00
116,
600
3165
5 - R
/W A
cqui
sitio
n T5
341
T542
4 T5
501
PW00
721
R/W
Acq
- T5
341
T542
4 T5
501
40
5,50
00
00
05,
500
Tota
l for
: 316
55 -
R/W
Acq
uisi
tion
T534
1 T5
424
T550
10
5,50
00
00
05,
500
3165
6 - R
W A
cqui
sitio
n - T
6163
PW00
818
R/W
Acq
uisi
tion
- Tra
ct 6
163
40
5,60
00
00
05,
600
Tota
l for
: 316
56 -
RW
Acq
uisi
tion
- T61
630
5,60
00
00
05,
600
3165
7 - R
/W A
cqui
sitio
n - T
6052
PW00
819
R/W
Acq
uisi
tion
- Tra
ct 6
052
20
24,8
000
00
024
,800
Tota
l for
: 316
57 -
R/W
Acq
uisi
tion
- T60
520
24,8
000
00
024
,800
3165
8 - R
W A
cqui
sitio
n -
T613
9
PW00
820
R/W
Acq
uisi
tion
- Tra
ct 6
139
40
300
00
00
300
Tota
l for
: 316
58 -
RW
Acq
uisi
tion
- T6
139
030
00
00
030
0
Pro
ject
N
ame
Dis
tric
t
Cap
ital
Proj
ects
FY 2
020
Estim
ate
2021
Cap
ital
Proj
ects
2022
Cap
ital
Proj
ects
2023
Cap
ital
Proj
ects
2024
Cap
ital
Proj
ects
2025
Cap
ital
Proj
ects
5 Ye
arPr
ojec
tTo
tal
FY 2020-2021 Capital Improvement Program by Department / Fund / Project
FY 2020-2021 Final Revised Budget C - 75
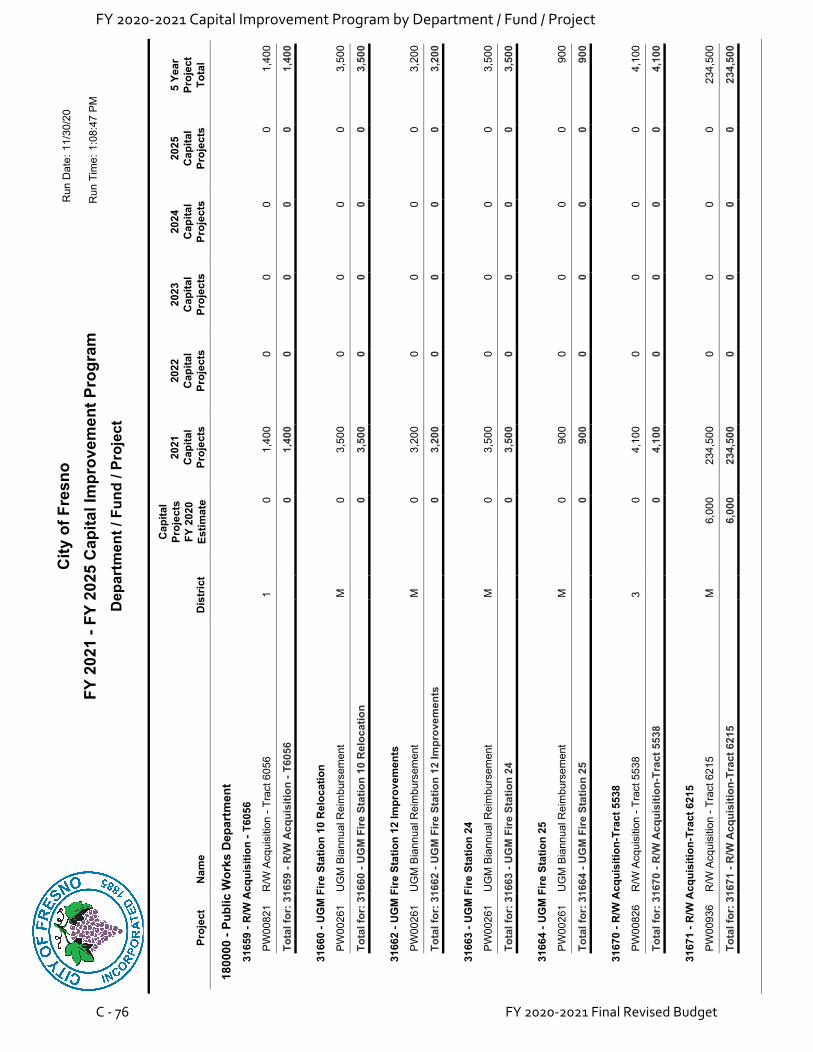
City
of F
resn
oR
un D
ate:
11/3
0/20
FY 2
021
- FY
2025
Cap
ital I
mpr
ovem
ent P
rogr
amR
un T
ime:
1:08
:47
PM
Dep
artm
ent /
Fun
d / P
roje
ct
1800
00 -
Publ
ic W
orks
Dep
artm
ent
3165
9 - R
/W A
cqui
sitio
n - T
6056
PW00
821
R/W
Acq
uisi
tion
- Tra
ct 6
056
10
1,40
00
00
01,
400
Tota
l for
: 316
59 -
R/W
Acq
uisi
tion
- T60
560
1,40
00
00
01,
400
3166
0 - U
GM
Fire
Sta
tion
10 R
eloc
atio
n
PW00
261
UG
M B
iann
ual R
eim
burs
emen
tM
03,
500
00
00
3,50
0
Tota
l for
: 316
60 -
UG
M F
ire S
tatio
n 10
Rel
ocat
ion
03,
500
00
00
3,50
0
3166
2 - U
GM
Fire
Sta
tion
12 Im
prov
emen
ts
PW00
261
UG
M B
iann
ual R
eim
burs
emen
tM
03,
200
00
00
3,20
0
Tota
l for
: 316
62 -
UG
M F
ire S
tatio
n 12
Impr
ovem
ents
03,
200
00
00
3,20
0
3166
3 - U
GM
Fire
Sta
tion
24
PW00
261
UG
M B
iann
ual R
eim
burs
emen
tM
03,
500
00
00
3,50
0
Tota
l for
: 316
63 -
UG
M F
ire S
tatio
n 24
03,
500
00
00
3,50
0
3166
4 - U
GM
Fire
Sta
tion
25
PW00
261
UG
M B
iann
ual R
eim
burs
emen
tM
090
00
00
090
0
Tota
l for
: 316
64 -
UG
M F
ire S
tatio
n 25
090
00
00
090
0
3167
0 - R
/W A
cqui
sitio
n-Tr
act 5
538
PW00
826
R/W
Acq
uisi
tion
- Tra
ct 5
538
30
4,10
00
00
04,
100
Tota
l for
: 316
70 -
R/W
Acq
uisi
tion-
Trac
t 553
80
4,10
00
00
04,
100
3167
1 - R
/W A
cqui
sitio
n-Tr
act 6
215
PW00
936
R/W
Acq
uisi
tion
- Tra
ct 6
215
M6,
000
234,
500
00
00
234,
500
Tota
l for
: 316
71 -
R/W
Acq
uisi
tion-
Trac
t 621
56,
000
234,
500
00
00
234,
500
Pro
ject
N
ame
Dis
tric
t
Cap
ital
Proj
ects
FY 2
020
Estim
ate
2021
Cap
ital
Proj
ects
2022
Cap
ital
Proj
ects
2023
Cap
ital
Proj
ects
2024
Cap
ital
Proj
ects
2025
Cap
ital
Proj
ects
5 Ye
arPr
ojec
tTo
tal
FY 2020-2021 Capital Improvement Program by Department / Fund / Project
C - 76 FY 2020-2021 Final Revised Budget
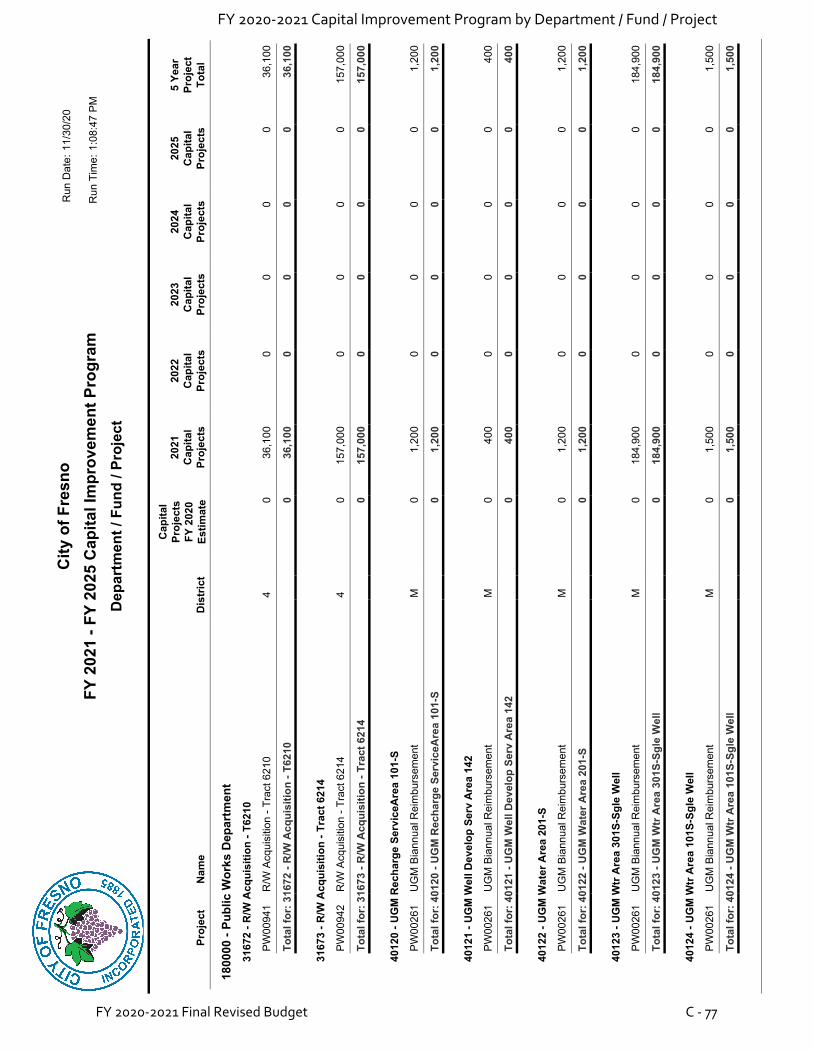
City
of F
resn
oR
un D
ate:
11/3
0/20
FY 2
021
- FY
2025
Cap
ital I
mpr
ovem
ent P
rogr
amR
un T
ime:
1:08
:47
PM
Dep
artm
ent /
Fun
d / P
roje
ct
1800
00 -
Publ
ic W
orks
Dep
artm
ent
3167
2 - R
/W A
cqui
sitio
n - T
6210
PW00
941
R/W
Acq
uisi
tion
- Tra
ct 6
210
40
36,1
000
00
036
,100
Tota
l for
: 316
72 -
R/W
Acq
uisi
tion
- T62
100
36,1
000
00
036
,100
3167
3 - R
/W A
cqui
sitio
n - T
ract
621
4
PW00
942
R/W
Acq
uisi
tion
- Tra
ct 6
214
40
157,
000
00
00
157,
000
Tota
l for
: 316
73 -
R/W
Acq
uisi
tion
- Tra
ct 6
214
015
7,00
00
00
015
7,00
0
4012
0 - U
GM
Rec
harg
e Se
rvic
eAre
a 10
1-S
PW00
261
UG
M B
iann
ual R
eim
burs
emen
tM
01,
200
00
00
1,20
0
Tota
l for
: 401
20 -
UG
M R
echa
rge
Serv
iceA
rea
101-
S0
1,20
00
00
01,
200
4012
1 - U
GM
Wel
l Dev
elop
Ser
v A
rea
142
PW00
261
UG
M B
iann
ual R
eim
burs
emen
tM
040
00
00
040
0
Tota
l for
: 401
21 -
UG
M W
ell D
evel
op S
erv
Are
a 14
20
400
00
00
400
4012
2 - U
GM
Wat
er A
rea
201-
S
PW00
261
UG
M B
iann
ual R
eim
burs
emen
tM
01,
200
00
00
1,20
0
Tota
l for
: 401
22 -
UG
M W
ater
Are
a 20
1-S
01,
200
00
00
1,20
0
4012
3 - U
GM
Wtr
Are
a 30
1S-S
gle
Wel
l
PW00
261
UG
M B
iann
ual R
eim
burs
emen
tM
018
4,90
00
00
018
4,90
0
Tota
l for
: 401
23 -
UG
M W
tr A
rea
301S
-Sgl
e W
ell
018
4,90
00
00
018
4,90
0
4012
4 - U
GM
Wtr
Are
a 10
1S-S
gle
Wel
l
PW00
261
UG
M B
iann
ual R
eim
burs
emen
tM
01,
500
00
00
1,50
0
Tota
l for
: 401
24 -
UG
M W
tr A
rea
101S
-Sgl
e W
ell
01,
500
00
00
1,50
0
Pro
ject
N
ame
Dis
tric
t
Cap
ital
Proj
ects
FY 2
020
Estim
ate
2021
Cap
ital
Proj
ects
2022
Cap
ital
Proj
ects
2023
Cap
ital
Proj
ects
2024
Cap
ital
Proj
ects
2025
Cap
ital
Proj
ects
5 Ye
arPr
ojec
tTo
tal
FY 2020-2021 Capital Improvement Program by Department / Fund / Project
FY 2020-2021 Final Revised Budget C - 77
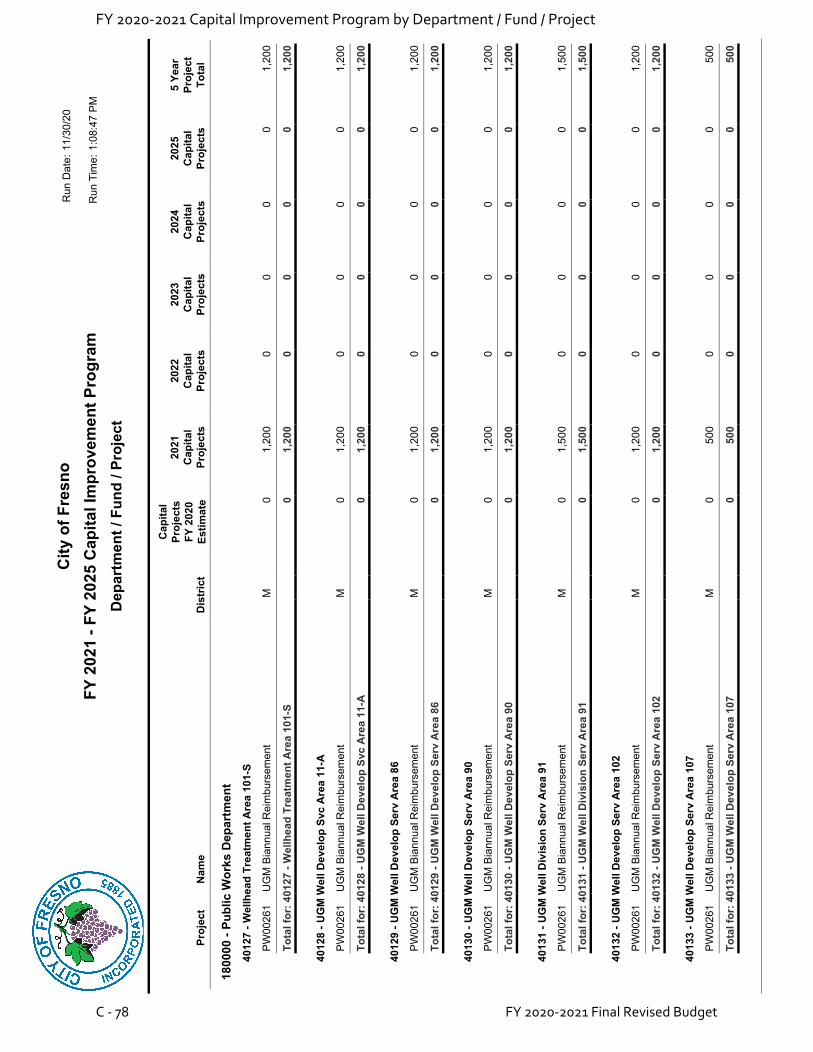
City
of F
resn
oR
un D
ate:
11/3
0/20
FY 2
021
- FY
2025
Cap
ital I
mpr
ovem
ent P
rogr
amR
un T
ime:
1:08
:47
PM
Dep
artm
ent /
Fun
d / P
roje
ct
1800
00 -
Publ
ic W
orks
Dep
artm
ent
4012
7 - W
ellh
ead
Trea
tmen
t Are
a 10
1-S
PW00
261
UG
M B
iann
ual R
eim
burs
emen
tM
01,
200
00
00
1,20
0
Tota
l for
: 401
27 -
Wel
lhea
d Tr
eatm
ent A
rea
101-
S0
1,20
00
00
01,
200
4012
8 - U
GM
Wel
l Dev
elop
Svc
Are
a 11
-A
PW00
261
UG
M B
iann
ual R
eim
burs
emen
tM
01,
200
00
00
1,20
0
Tota
l for
: 401
28 -
UG
M W
ell D
evel
op S
vc A
rea
11-A
01,
200
00
00
1,20
0
4012
9 - U
GM
Wel
l Dev
elop
Ser
v A
rea
86
PW00
261
UG
M B
iann
ual R
eim
burs
emen
tM
01,
200
00
00
1,20
0
Tota
l for
: 401
29 -
UG
M W
ell D
evel
op S
erv
Are
a 86
01,
200
00
00
1,20
0
4013
0 - U
GM
Wel
l Dev
elop
Ser
v A
rea
90
PW00
261
UG
M B
iann
ual R
eim
burs
emen
tM
01,
200
00
00
1,20
0
Tota
l for
: 401
30 -
UG
M W
ell D
evel
op S
erv
Are
a 90
01,
200
00
00
1,20
0
4013
1 - U
GM
Wel
l Div
isio
n Se
rv A
rea
91
PW00
261
UG
M B
iann
ual R
eim
burs
emen
tM
01,
500
00
00
1,50
0
Tota
l for
: 401
31 -
UG
M W
ell D
ivis
ion
Serv
Are
a 91
01,
500
00
00
1,50
0
4013
2 - U
GM
Wel
l Dev
elop
Ser
v A
rea
102
PW00
261
UG
M B
iann
ual R
eim
burs
emen
tM
01,
200
00
00
1,20
0
Tota
l for
: 401
32 -
UG
M W
ell D
evel
op S
erv
Are
a 10
20
1,20
00
00
01,
200
4013
3 - U
GM
Wel
l Dev
elop
Ser
v A
rea
107
PW00
261
UG
M B
iann
ual R
eim
burs
emen
tM
050
00
00
050
0
Tota
l for
: 401
33 -
UG
M W
ell D
evel
op S
erv
Are
a 10
70
500
00
00
500
Pro
ject
N
ame
Dis
tric
t
Cap
ital
Proj
ects
FY 2
020
Estim
ate
2021
Cap
ital
Proj
ects
2022
Cap
ital
Proj
ects
2023
Cap
ital
Proj
ects
2024
Cap
ital
Proj
ects
2025
Cap
ital
Proj
ects
5 Ye
arPr
ojec
tTo
tal
FY 2020-2021 Capital Improvement Program by Department / Fund / Project
C - 78 FY 2020-2021 Final Revised Budget
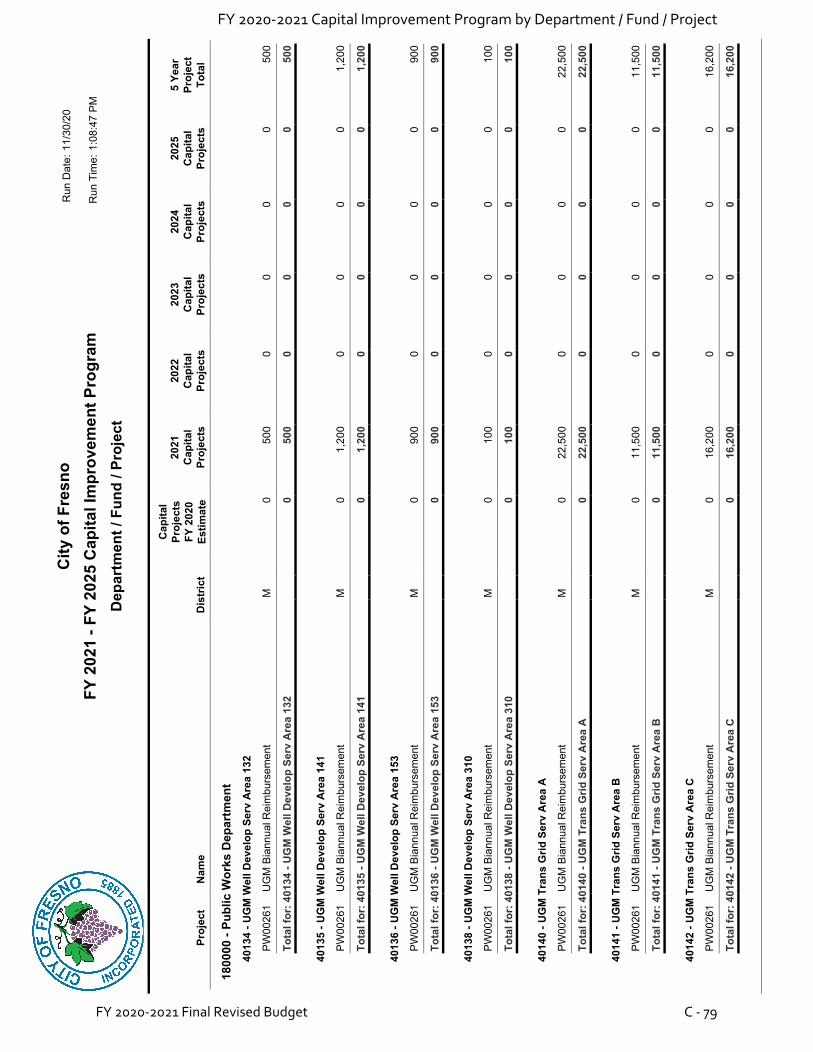
City
of F
resn
oR
un D
ate:
11/3
0/20
FY 2
021
- FY
2025
Cap
ital I
mpr
ovem
ent P
rogr
amR
un T
ime:
1:08
:47
PM
Dep
artm
ent /
Fun
d / P
roje
ct
1800
00 -
Publ
ic W
orks
Dep
artm
ent
4013
4 - U
GM
Wel
l Dev
elop
Ser
v A
rea
132
PW00
261
UG
M B
iann
ual R
eim
burs
emen
tM
050
00
00
050
0
Tota
l for
: 401
34 -
UG
M W
ell D
evel
op S
erv
Are
a 13
20
500
00
00
500
4013
5 - U
GM
Wel
l Dev
elop
Ser
v A
rea
141
PW00
261
UG
M B
iann
ual R
eim
burs
emen
tM
01,
200
00
00
1,20
0
Tota
l for
: 401
35 -
UG
M W
ell D
evel
op S
erv
Are
a 14
10
1,20
00
00
01,
200
4013
6 - U
GM
Wel
l Dev
elop
Ser
v A
rea
153
PW00
261
UG
M B
iann
ual R
eim
burs
emen
tM
090
00
00
090
0
Tota
l for
: 401
36 -
UG
M W
ell D
evel
op S
erv
Are
a 15
30
900
00
00
900
4013
8 - U
GM
Wel
l Dev
elop
Ser
v A
rea
310
PW00
261
UG
M B
iann
ual R
eim
burs
emen
tM
010
00
00
010
0
Tota
l for
: 401
38 -
UG
M W
ell D
evel
op S
erv
Are
a 31
00
100
00
00
100
4014
0 - U
GM
Tra
ns G
rid S
erv
Are
a A
PW00
261
UG
M B
iann
ual R
eim
burs
emen
tM
022
,500
00
00
22,5
00
Tota
l for
: 401
40 -
UG
M T
rans
Grid
Ser
v A
rea
A0
22,5
000
00
022
,500
4014
1 - U
GM
Tra
ns G
rid S
erv
Are
a B
PW00
261
UG
M B
iann
ual R
eim
burs
emen
tM
011
,500
00
00
11,5
00
Tota
l for
: 401
41 -
UG
M T
rans
Grid
Ser
v A
rea
B0
11,5
000
00
011
,500
4014
2 - U
GM
Tra
ns G
rid S
erv
Are
a C
PW00
261
UG
M B
iann
ual R
eim
burs
emen
tM
016
,200
00
00
16,2
00
Tota
l for
: 401
42 -
UG
M T
rans
Grid
Ser
v A
rea
C0
16,2
000
00
016
,200
Pro
ject
N
ame
Dis
tric
t
Cap
ital
Proj
ects
FY 2
020
Estim
ate
2021
Cap
ital
Proj
ects
2022
Cap
ital
Proj
ects
2023
Cap
ital
Proj
ects
2024
Cap
ital
Proj
ects
2025
Cap
ital
Proj
ects
5 Ye
arPr
ojec
tTo
tal
FY 2020-2021 Capital Improvement Program by Department / Fund / Project
FY 2020-2021 Final Revised Budget C - 79
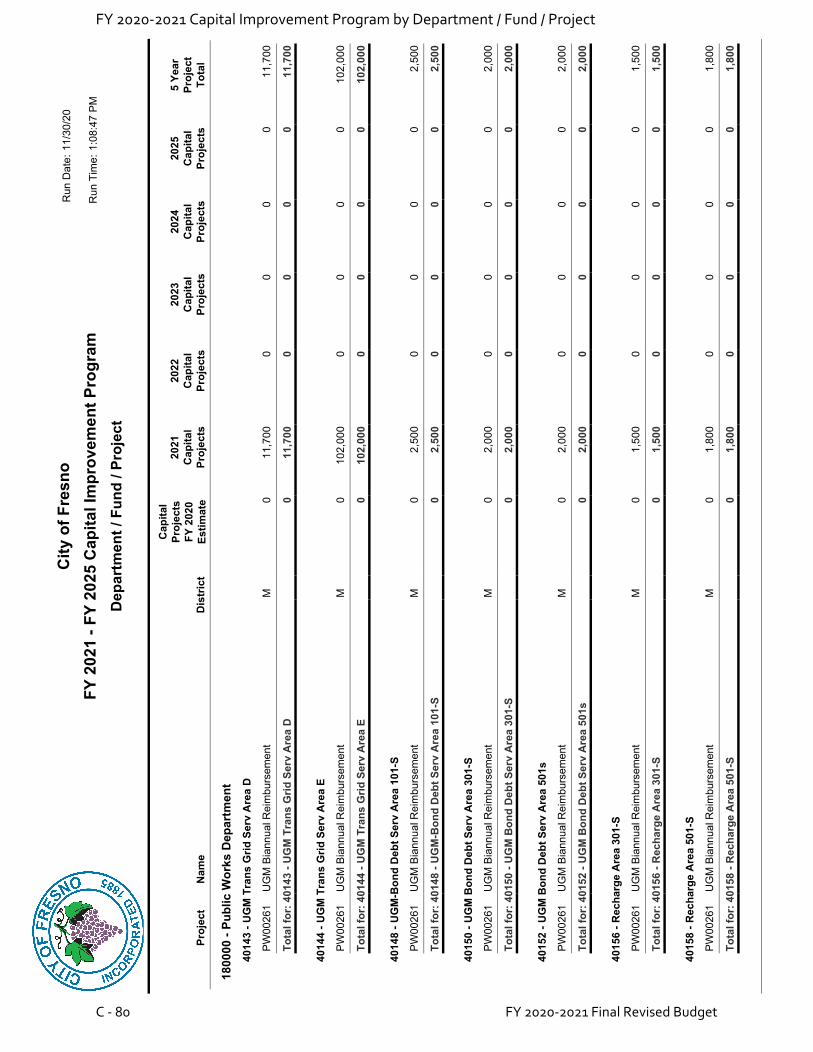
City
of F
resn
oR
un D
ate:
11/3
0/20
FY 2
021
- FY
2025
Cap
ital I
mpr
ovem
ent P
rogr
amR
un T
ime:
1:08
:47
PM
Dep
artm
ent /
Fun
d / P
roje
ct
1800
00 -
Publ
ic W
orks
Dep
artm
ent
4014
3 - U
GM
Tra
ns G
rid S
erv
Are
a D
PW00
261
UG
M B
iann
ual R
eim
burs
emen
tM
011
,700
00
00
11,7
00
Tota
l for
: 401
43 -
UG
M T
rans
Grid
Ser
v A
rea
D0
11,7
000
00
011
,700
4014
4 - U
GM
Tra
ns G
rid S
erv
Are
a E
PW00
261
UG
M B
iann
ual R
eim
burs
emen
tM
010
2,00
00
00
010
2,00
0
Tota
l for
: 401
44 -
UG
M T
rans
Grid
Ser
v A
rea
E0
102,
000
00
00
102,
000
4014
8 - U
GM
-Bon
d D
ebt S
erv
Are
a 10
1-S
PW00
261
UG
M B
iann
ual R
eim
burs
emen
tM
02,
500
00
00
2,50
0
Tota
l for
: 401
48 -
UG
M-B
ond
Deb
t Ser
v A
rea
101-
S0
2,50
00
00
02,
500
4015
0 - U
GM
Bon
d D
ebt S
erv
Are
a 30
1-S
PW00
261
UG
M B
iann
ual R
eim
burs
emen
tM
02,
000
00
00
2,00
0
Tota
l for
: 401
50 -
UG
M B
ond
Deb
t Ser
v A
rea
301-
S0
2,00
00
00
02,
000
4015
2 - U
GM
Bon
d D
ebt S
erv
Are
a 50
1s
PW00
261
UG
M B
iann
ual R
eim
burs
emen
tM
02,
000
00
00
2,00
0
Tota
l for
: 401
52 -
UG
M B
ond
Deb
t Ser
v A
rea
501s
02,
000
00
00
2,00
0
4015
6 - R
echa
rge
Are
a 30
1-S
PW00
261
UG
M B
iann
ual R
eim
burs
emen
tM
01,
500
00
00
1,50
0
Tota
l for
: 401
56 -
Rec
harg
e A
rea
301-
S0
1,50
00
00
01,
500
4015
8 - R
echa
rge
Are
a 50
1-S
PW00
261
UG
M B
iann
ual R
eim
burs
emen
tM
01,
800
00
00
1,80
0
Tota
l for
: 401
58 -
Rec
harg
e A
rea
501-
S0
1,80
00
00
01,
800
Pro
ject
N
ame
Dis
tric
t
Cap
ital
Proj
ects
FY 2
020
Estim
ate
2021
Cap
ital
Proj
ects
2022
Cap
ital
Proj
ects
2023
Cap
ital
Proj
ects
2024
Cap
ital
Proj
ects
2025
Cap
ital
Proj
ects
5 Ye
arPr
ojec
tTo
tal
FY 2020-2021 Capital Improvement Program by Department / Fund / Project
C - 80 FY 2020-2021 Final Revised Budget

City
of F
resn
oR
un D
ate:
11/3
0/20
FY 2
021
- FY
2025
Cap
ital I
mpr
ovem
ent P
rogr
amR
un T
ime:
1:08
:47
PM
Dep
artm
ent /
Fun
d / P
roje
ct
1800
00 -
Publ
ic W
orks
Dep
artm
ent
4015
9 - U
GM
NE
Rec
harg
e Fa
cilit
y Fe
e
PW00
261
UG
M B
iann
ual R
eim
burs
emen
tM
01,
200
00
00
1,20
0
Tota
l for
: 401
59 -
UG
M N
E R
echa
rge
Faci
lity
Fee
01,
200
00
00
1,20
0
4016
3 - U
GM
Wel
lhea
d Tr
tmnt
Are
a 20
1-S
PW00
261
UG
M B
iann
ual R
eim
burs
emen
tM
01,
700
00
00
1,70
0
Tota
l for
: 401
63 -
UG
M W
ellh
ead
Trtm
nt A
rea
201-
S0
1,70
00
00
01,
700
4016
4 - U
GM
Wel
lhea
d Tr
tmnt
Are
a 30
1-S
PW00
261
UG
M B
iann
ual R
eim
burs
emen
tM
01,
301,
800
00
00
1,30
1,80
0
Tota
l for
: 401
64 -
UG
M W
ellh
ead
Trtm
nt A
rea
301-
S0
1,30
1,80
00
00
01,
301,
800
4016
5 - W
ellh
ead
Trea
tmen
t Are
a 40
1-S
PW00
261
UG
M B
iann
ual R
eim
burs
emen
tM
01,
200
00
00
1,20
0
Tota
l for
: 401
65 -
Wel
lhea
d Tr
eatm
ent A
rea
401-
S0
1,20
00
00
01,
200
4016
6 - W
ellh
ead
Trea
tmen
t Are
a 50
1-S
PW00
261
UG
M B
iann
ual R
eim
burs
emen
tM
01,
200
00
00
1,20
0
Tota
l for
: 401
66 -
Wel
lhea
d Tr
eatm
ent A
rea
501-
S0
1,20
00
00
01,
200
4017
3 - U
GM
Wat
er A
rea
401-
S
PW00
261
UG
M B
iann
ual R
eim
burs
emen
tM
061
,200
00
00
61,2
00
Tota
l for
: 401
73 -
UG
M W
ater
Are
a 40
1-S
061
,200
00
00
61,2
00
4017
4 - U
GM
Wat
er A
rea
501-
S
PW00
261
UG
M B
iann
ual R
eim
burs
emen
tM
055
5,20
00
00
055
5,20
0
Tota
l for
: 401
74 -
UG
M W
ater
Are
a 50
1-S
055
5,20
00
00
055
5,20
0
Pro
ject
N
ame
Dis
tric
t
Cap
ital
Proj
ects
FY 2
020
Estim
ate
2021
Cap
ital
Proj
ects
2022
Cap
ital
Proj
ects
2023
Cap
ital
Proj
ects
2024
Cap
ital
Proj
ects
2025
Cap
ital
Proj
ects
5 Ye
arPr
ojec
tTo
tal
FY 2020-2021 Capital Improvement Program by Department / Fund / Project
FY 2020-2021 Final Revised Budget C - 81

City
of F
resn
oR
un D
ate:
11/3
0/20
FY 2
021
- FY
2025
Cap
ital I
mpr
ovem
ent P
rogr
amR
un T
ime:
1:08
:47
PM
Dep
artm
ent /
Fun
d / P
roje
ct
1800
00 -
Publ
ic W
orks
Dep
artm
ent
4017
8 - U
GM
Wel
l Dev
elop
Ser
v A
rea
136
PW00
261
UG
M B
iann
ual R
eim
burs
emen
tM
01,
700
00
00
1,70
0
Tota
l for
: 401
78 -
UG
M W
ell D
evel
op S
erv
Are
a 13
60
1,70
00
00
01,
700
4017
9 - U
GM
Wel
l Dev
elop
Ser
v A
rea
137
PW00
261
UG
M B
iann
ual R
eim
burs
emen
tM
02,
200
00
00
2,20
0
Tota
l for
: 401
79 -
UG
M W
ell D
evel
op S
erv
Are
a 13
70
2,20
00
00
02,
200
4020
2 - W
ater
Cap
acity
Fee
Fun
d
PW00
261
UG
M B
iann
ual R
eim
burs
emen
tM
050
7,00
00
00
050
7,00
0
Tota
l for
: 402
02 -
Wat
er C
apac
ity F
ee F
und
050
7,00
00
00
050
7,00
0
4051
3 - C
orne
lia S
ewer
Tru
nk F
ee
PW00
261
UG
M B
iann
ual R
eim
burs
emen
tM
01,
200
00
00
1,20
0
Tota
l for
: 405
13 -
Cor
nelia
Sew
er T
runk
Fee
01,
200
00
00
1,20
0
4051
4 - G
rant
land
Sew
er T
runk
Fee
PW00
261
UG
M B
iann
ual R
eim
burs
emen
tM
02,
800
00
00
2,80
0
Tota
l for
: 405
14 -
Gra
ntla
nd S
ewer
Tru
nk F
ee0
2,80
00
00
02,
800
4051
5 - H
ernd
on S
ewer
Tru
nk F
ee
PW00
261
UG
M B
iann
ual R
eim
burs
emen
tM
02,
300
00
00
2,30
0
Tota
l for
: 405
15 -
Her
ndon
Sew
er T
runk
Fee
02,
300
00
00
2,30
0
4051
6 - F
owle
r Sew
er T
runk
Fee
PW00
261
UG
M B
iann
ual R
eim
burs
emen
tM
05,
500
00
00
5,50
0
Tota
l for
: 405
16 -
Fow
ler S
ewer
Tru
nk F
ee0
5,50
00
00
05,
500
Pro
ject
N
ame
Dis
tric
t
Cap
ital
Proj
ects
FY 2
020
Estim
ate
2021
Cap
ital
Proj
ects
2022
Cap
ital
Proj
ects
2023
Cap
ital
Proj
ects
2024
Cap
ital
Proj
ects
2025
Cap
ital
Proj
ects
5 Ye
arPr
ojec
tTo
tal
FY 2020-2021 Capital Improvement Program by Department / Fund / Project
C - 82 FY 2020-2021 Final Revised Budget

City
of F
resn
oR
un D
ate:
11/3
0/20
FY 2
021
- FY
2025
Cap
ital I
mpr
ovem
ent P
rogr
amR
un T
ime:
1:08
:47
PM
Dep
artm
ent /
Fun
d / P
roje
ct
1800
00 -
Publ
ic W
orks
Dep
artm
ent
4054
0 - U
GM
Are
a-w
ide
Ove
rsiz
e Se
wer
PW00
261
UG
M B
iann
ual R
eim
burs
emen
tM
010
3,50
00
00
010
3,50
0
Tota
l for
: 405
40 -
UG
M A
rea-
wid
e O
vers
ize
Sew
er0
103,
500
00
00
103,
500
4059
1 - U
GM
Lift
Sta
tion
/ APU
Svc
Are
a
PW00
261
UG
M B
iann
ual R
eim
burs
emen
tM
01,
200
00
00
1,20
0
Tota
l for
: 405
91 -
UG
M L
ift S
tatio
n / A
PU S
vc A
rea
01,
200
00
00
1,20
0
4059
2 - U
GM
Mill
broo
k O
lay
Sew
er F
ee
PW00
261
UG
M B
iann
ual R
eim
burs
emen
tM
01,
200
00
00
1,20
0
Tota
l for
: 405
92 -
UG
M M
illbr
ook
Ola
y Se
wer
Fee
01,
200
00
00
1,20
0
4150
1 - C
omm
unity
San
itatio
n O
pera
ting
PW00
889
Free
way
Litt
er A
bate
men
tM
045
,000
00
00
45,0
00
Tota
l for
: 415
01 -
Com
mun
ity S
anita
tion
Ope
ratin
g0
45,0
000
00
045
,000
4650
1 - P
W S
peci
al P
roje
ct R
evol
ving
Fun
d
PW00
704
Gol
den
Stat
e Br
idge
Rep
air
52,
500
00
00
00
Tota
l for
: 465
01 -
PW S
peci
al P
roje
ct R
evol
ving
Fun
d2,
500
00
00
00
Tota
l for
: 180
000
- Pub
lic W
orks
Dep
artm
ent
1,38
7,30
019
3,26
9,00
05,
082,
700
6,50
05,
000
019
8,36
3,20
0
4000
00 -
Plan
ning
& D
evel
opm
ent S
ervi
ces
Dep
artm
ent
1010
1 - G
ener
al F
und
PW00
275
Park
ing
Faci
litie
s Im
prov
emen
ts3
1,42
8,80
01,
795,
500
00
00
1,79
5,50
0
Tota
l for
: 101
01 -
Gen
eral
Fun
d1,
428,
800
1,79
5,50
00
00
01,
795,
500
Pro
ject
N
ame
Dis
tric
t
Cap
ital
Proj
ects
FY 2
020
Estim
ate
2021
Cap
ital
Proj
ects
2022
Cap
ital
Proj
ects
2023
Cap
ital
Proj
ects
2024
Cap
ital
Proj
ects
2025
Cap
ital
Proj
ects
5 Ye
arPr
ojec
tTo
tal
FY 2020-2021 Capital Improvement Program by Department / Fund / Project
FY 2020-2021 Final Revised Budget C - 83

City
of F
resn
oR
un D
ate:
11/3
0/20
FY 2
021
- FY
2025
Cap
ital I
mpr
ovem
ent P
rogr
amR
un T
ime:
1:08
:47
PM
Dep
artm
ent /
Fun
d / P
roje
ct
4000
00 -
Plan
ning
& D
evel
opm
ent S
ervi
ces
Dep
artm
ent
2050
1 - C
omm
unity
Dev
Blo
ck G
rant
MC
0001
0Se
c. 1
08 L
oan
Rep
aym
ent
M0
94,6
000
00
094
,600
PC00
115
Rom
ain
Impr
ovem
ents
70
2,30
00
00
02,
300
PC00
153
Tot L
ot R
epla
cem
ent -
Var
Pks
M30
9,60
032
9,80
00
00
032
9,80
0
PC00
166
Fink
Whi
te P
ark
Impr
ovem
ents
321
,600
387,
800
00
00
387,
800
PC00
176
Lear
ner P
ools
201
7M
15,0
0018
5,60
00
00
018
5,60
0
PC00
178
Pine
dale
AD
A Pr
ojec
ts -
CD
BG2
4,20
042
,500
00
00
42,5
00
PC00
179
Rom
ain
Impr
ovem
ents
- C
DBG
72,
200
22,2
000
00
022
,200
PC00
180
Ted
C W
ills Im
prov
emen
ts -
CD
BG3
02,
200
00
00
2,20
0
PC00
182
Hin
ton
Impr
ovem
ents
30
250,
000
00
00
250,
000
PC00
195
Gra
nny'
s Pa
rk -
CD
BG7
2,30
024
7,80
00
00
024
7,80
0
PC00
196
CA/
Tupm
an Im
p - C
DBG
360
,700
91,6
000
00
091
,600
PC00
197
Com
m/S
r Cen
ter -
D4
46,
200
10,5
96,0
000
00
010
,596
,000
PC00
199
ADA
Tot L
ot C
ompl
ianc
e - C
DBG
M0
160,
000
00
00
160,
000
PC00
200
ADA
Res
troom
s - C
DBG
M0
200,
000
00
00
200,
000
PC00
208
F H
Bal
l AD
A Im
prov
emen
ts3
5,20
029
4,80
00
00
029
4,80
0
PC00
209
Max
ie P
arks
HVA
C D
esig
n3
800
49,3
000
00
049
,300
PC00
210
El D
orad
o M
odul
ar U
nit R
epla
ce3
2,50
024
7,60
00
00
024
7,60
0
PW00
816
FY18
Nei
ghbo
rhoo
d St
reet
Impr
vM
2,22
2,40
080
,000
00
00
80,0
00
PW00
892
Flor
ador
a/Yo
sem
ite S
afe
Rou
tes
00
300,
000
00
00
300,
000
PW00
925
Hig
hway
City
Ngh
brhd
Stre
et R
eM
061
5,00
00
00
061
5,00
0
PW00
931
Wes
t Fre
sno
Elem
& M
LK N
eigh
30
1,15
1,20
00
00
01,
151,
200
PW00
932
Burro
ughs
Ele
m N
eigh
Rec
onst
70
850,
000
00
00
850,
000
PW00
933
Eric
son
Elem
Nei
gh R
econ
st4
017
9,00
00
00
017
9,00
0
Tota
l for
: 205
01 -
Com
mun
ity D
ev B
lock
Gra
nt2,
652,
700
16,3
79,3
000
00
016
,379
,300
Pro
ject
N
ame
Dis
tric
t
Cap
ital
Proj
ects
FY 2
020
Estim
ate
2021
Cap
ital
Proj
ects
2022
Cap
ital
Proj
ects
2023
Cap
ital
Proj
ects
2024
Cap
ital
Proj
ects
2025
Cap
ital
Proj
ects
5 Ye
arPr
ojec
tTo
tal
FY 2020-2021 Capital Improvement Program by Department / Fund / Project
C - 84 FY 2020-2021 Final Revised Budget

City
of F
resn
oR
un D
ate:
11/3
0/20
FY 2
021
- FY
2025
Cap
ital I
mpr
ovem
ent P
rogr
amR
un T
ime:
1:08
:47
PM
Dep
artm
ent /
Fun
d / P
roje
ct
4000
00 -
Plan
ning
& D
evel
opm
ent S
ervi
ces
Dep
artm
ent
2050
1 - C
omm
unity
Dev
Blo
ck G
rant
2050
3 - R
evol
ving
Loa
ns -
RR
P
MC
0001
9M
isce
llane
ous
Proj
ects
M0
44,9
000
00
044
,900
Tota
l for
: 205
03 -
Rev
olvi
ng L
oans
- R
RP
044
,900
00
00
44,9
00
2051
5 - N
eigh
borh
ood
Stab
iliza
tion
Prog
MC
0003
3N
SP A
cqui
sitio
n R
ehab
ilitat
ion
M44
,900
763,
700
00
00
763,
700
Tota
l for
: 205
15 -
Nei
ghbo
rhoo
d St
abili
zatio
n Pr
og44
,900
763,
700
00
00
763,
700
2404
5 - H
ousi
ng T
rust
Ear
mar
k
HC
0001
1H
ousi
ng T
rust
Fun
dM
06,
100
00
00
6,10
0
Tota
l for
: 240
45 -
Hou
sing
Tru
st E
arm
ark
06,
100
00
00
6,10
0
Tota
l for
: 400
000
- Pla
nnin
g &
Dev
elop
men
t Ser
vice
s D
epar
tmen
t4,
126,
400
18,9
89,5
000
00
018
,989
,500
4100
00 -
Dep
artm
ent o
f Pub
lic U
tiliti
es
4010
1 - W
ater
Ent
erpr
ise
Fund
WC
0000
1Fi
re H
ydra
nt In
stal
latio
nsM
015
,000
15,0
0015
,000
15,0
0015
,000
75,0
00
WC
0000
4W
ater
Mai
n Ex
tens
ions
M0
1,76
0,40
068
,000
1,00
1,60
099
9,80
01,
000,
000
4,82
9,80
0
WC
0000
5W
ater
Mai
n R
enew
alM
04,
513,
900
11,8
79,3
007,
728,
200
11,5
43,1
009,
021,
600
44,6
86,1
00
WC
0001
5W
ater
Wel
l Eva
luat
ion
and
Dev
eM
01,
143,
300
403,
200
400,
000
400,
000
400,
000
2,74
6,50
0
WC
0001
6W
ater
Wel
l Con
stru
ctio
nM
02,
307,
400
3,26
3,40
04,
107,
300
3,00
2,00
03,
000,
000
15,6
80,1
00
WC
0001
7W
ell R
ehab
ilitat
ion
M0
2,09
5,70
02,
001,
800
2,00
0,00
02,
000,
000
2,00
0,00
010
,097
,500
WC
0001
8Pu
mp
Reh
abilit
atio
nM
093
3,00
031
2,60
030
0,20
030
0,00
030
0,00
02,
145,
800
WC
0002
0G
ranu
lar A
ctiv
ated
Car
bon
M0
1,67
4,00
00
00
01,
674,
000
WC
0002
1Su
rface
Wat
er T
reat
men
t Pla
nt6
056
8,70
01,
054,
600
1,00
0,00
01,
000,
000
1,00
0,00
04,
623,
300
Pro
ject
N
ame
Dis
tric
t
Cap
ital
Proj
ects
FY 2
020
Estim
ate
2021
Cap
ital
Proj
ects
2022
Cap
ital
Proj
ects
2023
Cap
ital
Proj
ects
2024
Cap
ital
Proj
ects
2025
Cap
ital
Proj
ects
5 Ye
arPr
ojec
tTo
tal
FY 2020-2021 Capital Improvement Program by Department / Fund / Project
FY 2020-2021 Final Revised Budget C - 85
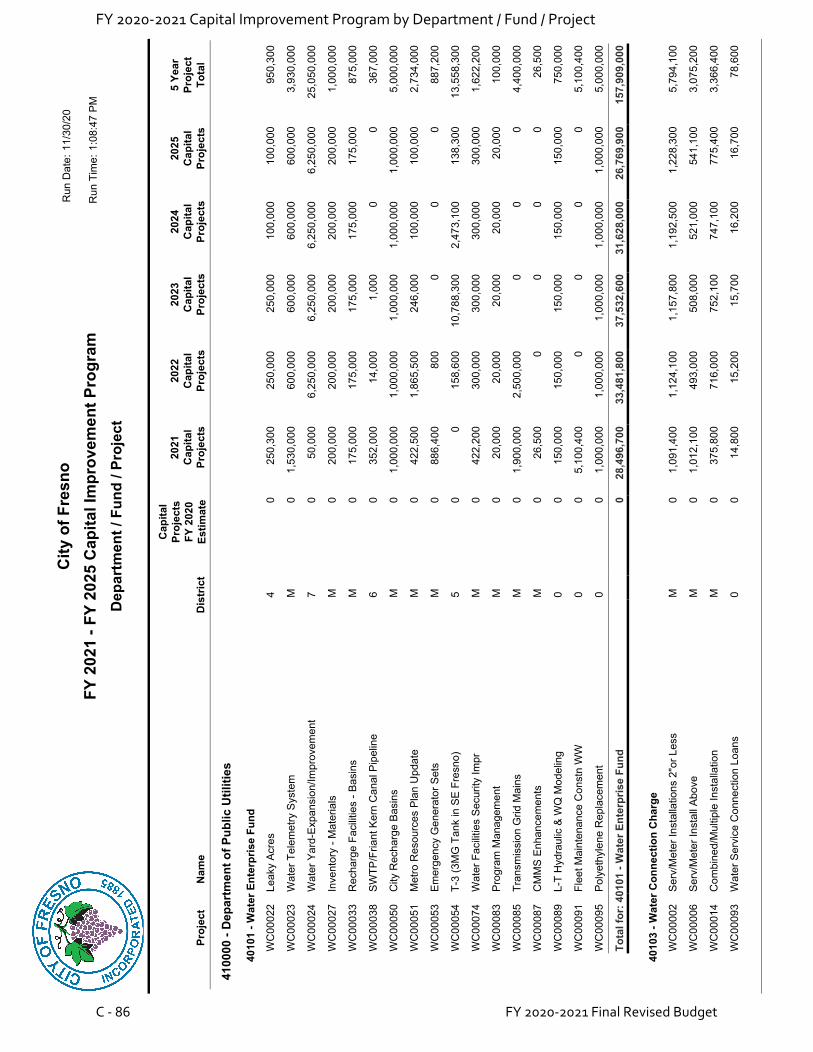
City
of F
resn
oR
un D
ate:
11/3
0/20
FY 2
021
- FY
2025
Cap
ital I
mpr
ovem
ent P
rogr
amR
un T
ime:
1:08
:47
PM
Dep
artm
ent /
Fun
d / P
roje
ct
4100
00 -
Dep
artm
ent o
f Pub
lic U
tiliti
es
4010
1 - W
ater
Ent
erpr
ise
Fund
WC
0002
2Le
aky
Acre
s4
025
0,30
025
0,00
025
0,00
010
0,00
010
0,00
095
0,30
0
WC
0002
3W
ater
Tel
emet
ry S
yste
mM
01,
530,
000
600,
000
600,
000
600,
000
600,
000
3,93
0,00
0
WC
0002
4W
ater
Yar
d-Ex
pans
ion/
Impr
ovem
ent
70
50,0
006,
250,
000
6,25
0,00
06,
250,
000
6,25
0,00
025
,050
,000
WC
0002
7In
vent
ory
- Mat
eria
lsM
020
0,00
020
0,00
020
0,00
020
0,00
020
0,00
01,
000,
000
WC
0003
3R
echa
rge
Faci
litie
s - B
asin
sM
017
5,00
017
5,00
017
5,00
017
5,00
017
5,00
087
5,00
0
WC
0003
8SW
TP/F
riant
Ker
n C
anal
Pip
elin
e6
035
2,00
014
,000
1,00
00
036
7,00
0
WC
0005
0C
ity R
echa
rge
Basi
nsM
01,
000,
000
1,00
0,00
01,
000,
000
1,00
0,00
01,
000,
000
5,00
0,00
0
WC
0005
1M
etro
Res
ourc
es P
lan
Upd
ate
M0
422,
500
1,86
5,50
024
6,00
010
0,00
010
0,00
02,
734,
000
WC
0005
3Em
erge
ncy
Gen
erat
or S
ets
M0
886,
400
800
00
088
7,20
0
WC
0005
4T-
3 (3
MG
Tan
k in
SE
Fres
no)
50
015
8,60
010
,788
,300
2,47
3,10
013
8,30
013
,558
,300
WC
0007
4W
ater
Fac
ilitie
s Se
curit
y Im
prM
042
2,20
030
0,00
030
0,00
030
0,00
030
0,00
01,
622,
200
WC
0008
3Pr
ogra
m M
anag
emen
tM
020
,000
20,0
0020
,000
20,0
0020
,000
100,
000
WC
0008
5Tr
ansm
issi
on G
rid M
ains
M0
1,90
0,00
02,
500,
000
00
04,
400,
000
WC
0008
7C
MM
S En
hanc
emen
tsM
026
,500
00
00
26,5
00
WC
0008
9L-
T H
ydra
ulic
& W
Q M
odel
ing
00
150,
000
150,
000
150,
000
150,
000
150,
000
750,
000
WC
0009
1Fl
eet M
aint
enan
ce C
onst
n W
W0
05,
100,
400
00
00
5,10
0,40
0
WC
0009
5Po
lyet
hyle
ne R
epla
cem
ent
00
1,00
0,00
01,
000,
000
1,00
0,00
01,
000,
000
1,00
0,00
05,
000,
000
Tota
l for
: 401
01 -
Wat
er E
nter
pris
e Fu
nd0
28,4
96,7
0033
,481
,800
37,5
32,6
0031
,628
,000
26,7
69,9
0015
7,90
9,00
0
4010
3 - W
ater
Con
nect
ion
Cha
rge
WC
0000
2Se
rv/M
eter
Inst
alla
tions
2"o
r Les
sM
01,
091,
400
1,12
4,10
01,
157,
800
1,19
2,50
01,
228,
300
5,79
4,10
0
WC
0000
6Se
rv/M
eter
Inst
all A
bove
M
01,
012,
100
493,
000
508,
000
521,
000
541,
100
3,07
5,20
0
WC
0001
4C
ombi
ned/
Mul
tiple
Inst
alla
tion
M0
375,
800
716,
000
752,
100
747,
100
775,
400
3,36
6,40
0
WC
0009
3W
ater
Ser
vice
Con
nect
ion
Loan
s0
014
,800
15,2
0015
,700
16,2
0016
,700
78,6
00
Pro
ject
N
ame
Dis
tric
t
Cap
ital
Proj
ects
FY 2
020
Estim
ate
2021
Cap
ital
Proj
ects
2022
Cap
ital
Proj
ects
2023
Cap
ital
Proj
ects
2024
Cap
ital
Proj
ects
2025
Cap
ital
Proj
ects
5 Ye
arPr
ojec
tTo
tal
FY 2020-2021 Capital Improvement Program by Department / Fund / Project
C - 86 FY 2020-2021 Final Revised Budget

City
of F
resn
oR
un D
ate:
11/3
0/20
FY 2
021
- FY
2025
Cap
ital I
mpr
ovem
ent P
rogr
amR
un T
ime:
1:08
:47
PM
Dep
artm
ent /
Fun
d / P
roje
ct
4100
00 -
Dep
artm
ent o
f Pub
lic U
tiliti
es
4010
3 - W
ater
Con
nect
ion
Cha
rge
Tota
l for
: 401
03 -
Wat
er C
onne
ctio
n C
harg
e 0
2,49
4,10
02,
348,
300
2,43
3,60
02,
476,
800
2,56
1,50
012
,314
,300
4011
0 - D
BC
P R
ecov
ery
Fund
WC
0002
1Su
rface
Wat
er T
reat
men
t Pla
nt6
01,
216,
600
1,50
0,70
01,
300,
000
00
4,01
7,30
0
Tota
l for
: 401
10 -
DB
CP
Rec
over
y Fu
nd0
1,21
6,60
01,
500,
700
1,30
0,00
00
04,
017,
300
4011
6 - S
E Fr
esno
Pro
ject
Bon
d Fu
nd
WC
0002
0G
ranu
lar A
ctiv
ated
Car
bon
M0
563,
000
3,92
9,30
01,
175,
800
3,00
00
5,67
1,10
0
WC
0003
2Bo
oste
r Pum
pM
069
,700
302,
200
500
00
372,
400
Tota
l for
: 401
16 -
SE F
resn
o Pr
ojec
t Bon
d Fu
nd0
632,
700
4,23
1,50
01,
176,
300
3,00
00
6,04
3,50
0
4012
2 - U
GM
Wat
er A
rea
201-
S
WC
0001
6W
ater
Wel
l Con
stru
ctio
nM
056
6,80
01,
300
00
056
8,10
0
Tota
l for
: 401
22 -
UG
M W
ater
Are
a 20
1-S
056
6,80
01,
300
00
056
8,10
0
4012
7 - W
ellh
ead
Trea
tmen
t Are
a 10
1-S
WC
0005
8U
GM
101S
Wel
lhea
d Tr
eatm
ent P
rj0
01,
000,
000
00
00
1,00
0,00
0
Tota
l for
: 401
27 -
Wel
lhea
d Tr
eatm
ent A
rea
101-
S0
1,00
0,00
00
00
01,
000,
000
4016
1 - S
RF
Kin
gsR
iver
Pip
elin
e Lo
an
WC
0005
7SE
Fre
sno
Surfa
ce W
tr Tr
eatm
ent
50
150,
000
00
00
150,
000
Tota
l for
: 401
61 -
SRF
Kin
gsR
iver
Pip
elin
e Lo
an0
150,
000
00
00
150,
000
4016
2 - S
RF
Reg
nl T
rans
mss
n M
ains
Loa
n
WC
0006
5SE
/SW
TP T
rans
mis
sion
Pip
elin
es5
078
,600
00
00
78,6
00
Tota
l for
: 401
62 -
SRF
Reg
nl T
rans
mss
n M
ains
Loa
n0
78,6
000
00
078
,600
Pro
ject
N
ame
Dis
tric
t
Cap
ital
Proj
ects
FY 2
020
Estim
ate
2021
Cap
ital
Proj
ects
2022
Cap
ital
Proj
ects
2023
Cap
ital
Proj
ects
2024
Cap
ital
Proj
ects
2025
Cap
ital
Proj
ects
5 Ye
arPr
ojec
tTo
tal
FY 2020-2021 Capital Improvement Program by Department / Fund / Project
FY 2020-2021 Final Revised Budget C - 87

City
of F
resn
oR
un D
ate:
11/3
0/20
FY 2
021
- FY
2025
Cap
ital I
mpr
ovem
ent P
rogr
amR
un T
ime:
1:08
:47
PM
Dep
artm
ent /
Fun
d / P
roje
ct
4100
00 -
Dep
artm
ent o
f Pub
lic U
tiliti
es40
168
- Cop
per R
iver
Ran
ch W
ater
Infr
a
WC
0002
1Su
rface
Wat
er T
reat
men
t Pla
nt6
088
1,70
00
00
088
1,70
0
Tota
l for
: 401
68 -
Cop
per R
iver
Ran
ch W
ater
Infr
a0
881,
700
00
00
881,
700
4018
4 - F
riant
Ker
n C
anl P
ipe
SRF
Loan
4018
8 - S
RF
SEW
TF D
15-0
2012
Loa
n
4019
7 - T
CP
Settl
emen
t Fun
d
WC
0009
2TC
P R
emed
iatio
n0
02,
000,
000
2,00
0,00
02,
000,
000
2,00
0,00
02,
000,
000
10,0
00,0
00
Tota
l for
: 401
97 -
TCP
Settl
emen
t Fun
d0
2,00
0,00
02,
000,
000
2,00
0,00
02,
000,
000
2,00
0,00
010
,000
,000
4019
8 - S
RF
NEW
TF 6
MG
TA
NK
CLW
L2 L
N
WC
0002
1Su
rface
Wat
er T
reat
men
t Pla
nt6
02,
525,
100
126,
000
00
02,
651,
100
Tota
l for
: 401
98 -
SRF
NEW
TF 6
MG
TA
NK
CLW
L2 L
N0
2,52
5,10
012
6,00
00
00
2,65
1,10
0
4020
2 - W
ater
Cap
acity
Fee
Fun
d
WC
0000
4W
ater
Mai
n Ex
tens
ions
M0
1,00
1,00
01,
000,
000
1,00
0,00
01,
000,
000
1,00
0,00
05,
001,
000
Tota
l for
: 402
02 -
Wat
er C
apac
ity F
ee F
und
01,
001,
000
1,00
0,00
01,
000,
000
1,00
0,00
01,
000,
000
5,00
1,00
0
4020
3 - P
rop1
GW
123
-TC
P Pl
anni
ng G
rnt
WC
0009
412
3-TC
P M
itiga
tion
Feas
ibilit
y0
069
5,60
00
00
069
5,60
0
Tota
l for
: 402
03 -
Prop
1 G
W 1
23-T
CP
Plan
ning
Grn
t0
695,
600
00
00
695,
600
4020
9 - P
rop1
P11
7 P2
84 P
CE
Con
ta G
rnt
WC
0002
0G
ranu
lar A
ctiv
ated
Car
bon
M0
4,12
9,60
022
,100
200
00
4,15
1,90
0
Pro
ject
N
ame
Dis
tric
t
Cap
ital
Proj
ects
FY 2
020
Estim
ate
2021
Cap
ital
Proj
ects
2022
Cap
ital
Proj
ects
2023
Cap
ital
Proj
ects
2024
Cap
ital
Proj
ects
2025
Cap
ital
Proj
ects
5 Ye
arPr
ojec
tTo
tal
FY 2020-2021 Capital Improvement Program by Department / Fund / Project
C - 88 FY 2020-2021 Final Revised Budget
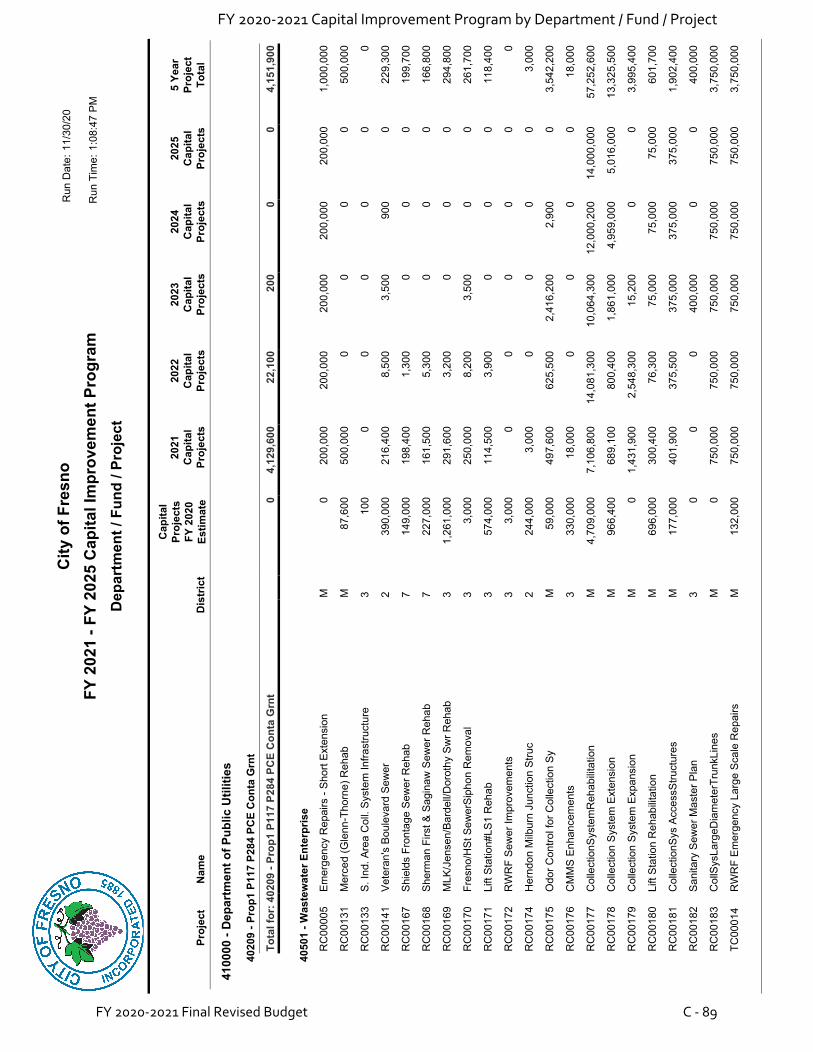
City
of F
resn
oR
un D
ate:
11/3
0/20
FY 2
021
- FY
2025
Cap
ital I
mpr
ovem
ent P
rogr
amR
un T
ime:
1:08
:47
PM
Dep
artm
ent /
Fun
d / P
roje
ct
4100
00 -
Dep
artm
ent o
f Pub
lic U
tiliti
es
4020
9 - P
rop1
P11
7 P2
84 P
CE
Con
ta G
rnt
Tota
l for
: 402
09 -
Prop
1 P1
17 P
284
PCE
Con
ta G
rnt
04,
129,
600
22,1
0020
00
04,
151,
900
4050
1 - W
aste
wat
er E
nter
pris
e
RC
0000
5Em
erge
ncy
Rep
airs
- Sh
ort E
xten
sion
M0
200,
000
200,
000
200,
000
200,
000
200,
000
1,00
0,00
0
RC
0013
1M
erce
d (G
lenn
-Tho
rne)
Reh
abM
87,6
0050
0,00
00
00
050
0,00
0
RC
0013
3S.
Ind.
Are
a C
oll.
Syst
em In
frast
ruct
ure
310
00
00
00
0
RC
0014
1Ve
tera
n's
Boul
evar
d Se
wer
239
0,00
021
6,40
08,
500
3,50
090
00
229,
300
RC
0016
7Sh
ield
s Fr
onta
ge S
ewer
Reh
ab7
149,
000
198,
400
1,30
00
00
199,
700
RC
0016
8Sh
erm
an F
irst &
Sag
inaw
Sew
er R
ehab
722
7,00
016
1,50
05,
300
00
016
6,80
0
RC
0016
9M
LK/J
ense
n/Ba
rdel
l/Dor
othy
Sw
r Reh
ab3
1,26
1,00
029
1,60
03,
200
00
029
4,80
0
RC
0017
0Fr
esno
/HSt
Sew
erSi
phon
Rem
oval
33,
000
250,
000
8,20
03,
500
00
261,
700
RC
0017
1Li
ft St
atio
n#LS
1 R
ehab
357
4,00
011
4,50
03,
900
00
011
8,40
0
RC
0017
2R
WR
F Se
wer
Impr
ovem
ents
33,
000
00
00
00
RC
0017
4H
ernd
on M
ilbur
n Ju
nctio
n St
ruc
224
4,00
03,
000
00
00
3,00
0
RC
0017
5O
dor C
ontro
l for
Col
lect
ion
SyM
59,0
0049
7,60
062
5,50
02,
416,
200
2,90
00
3,54
2,20
0
RC
0017
6C
MM
S En
hanc
emen
ts3
330,
000
18,0
000
00
018
,000
RC
0017
7C
olle
ctio
nSys
tem
Reh
abilit
atio
nM
4,70
9,00
07,
106,
800
14,0
81,3
0010
,064
,300
12,0
00,2
0014
,000
,000
57,2
52,6
00
RC
0017
8C
olle
ctio
n Sy
stem
Ext
ensi
onM
966,
400
689,
100
800,
400
1,86
1,00
04,
959,
000
5,01
6,00
013
,325
,500
RC
0017
9C
olle
ctio
n Sy
stem
Exp
ansi
onM
01,
431,
900
2,54
8,30
015
,200
00
3,99
5,40
0
RC
0018
0Li
ft St
atio
n R
ehab
ilitat
ion
M69
6,00
030
0,40
076
,300
75,0
0075
,000
75,0
0060
1,70
0
RC
0018
1C
olle
ctio
nSys
Acc
essS
truct
ures
M17
7,00
040
1,90
037
5,50
037
5,00
037
5,00
037
5,00
01,
902,
400
RC
0018
2Sa
nita
ry S
ewer
Mas
ter P
lan
30
00
400,
000
00
400,
000
RC
0018
3C
ollS
ysLa
rgeD
iam
eter
Trun
kLin
esM
075
0,00
075
0,00
075
0,00
075
0,00
075
0,00
03,
750,
000
TC00
014
RW
RF
Emer
genc
y La
rge
Scal
e R
epai
rsM
132,
000
750,
000
750,
000
750,
000
750,
000
750,
000
3,75
0,00
0
Pro
ject
N
ame
Dis
tric
t
Cap
ital
Proj
ects
FY 2
020
Estim
ate
2021
Cap
ital
Proj
ects
2022
Cap
ital
Proj
ects
2023
Cap
ital
Proj
ects
2024
Cap
ital
Proj
ects
2025
Cap
ital
Proj
ects
5 Ye
arPr
ojec
tTo
tal
FY 2020-2021 Capital Improvement Program by Department / Fund / Project
FY 2020-2021 Final Revised Budget C - 89

City
of F
resn
oR
un D
ate:
11/3
0/20
FY 2
021
- FY
2025
Cap
ital I
mpr
ovem
ent P
rogr
amR
un T
ime:
1:08
:47
PM
Dep
artm
ent /
Fun
d / P
roje
ct
4100
00 -
Dep
artm
ent o
f Pub
lic U
tiliti
es
4050
1 - W
aste
wat
er E
nter
pris
e
TC00
079
Cen
traliz
ed O
dor C
ontro
l Sys
for P
lant
Pro
cess
316
4,00
075
,700
00
00
75,7
00
TC00
096
Sout
hwes
t Qua
dran
t Rec
ycle
d W
ater
Dis
t Sys
tem
320
2,00
092
0,80
030
00
00
921,
100
TC00
112
WW
Sys
tem
Enh
ance
men
ts/U
pgra
des
30
01,
200,
000
6,50
0,00
07,
500,
000
7,50
0,00
022
,700
,000
TC00
142
Rec
ycle
d W
ater
Sys
tem
Use
r Con
nect
ions
- So
uthw
est
M15
1,00
015
0,00
00
00
015
0,00
0
TC00
154
Ren
ewab
le G
as D
iver
sion
320
0,00
09,
334,
500
18,3
000
00
9,35
2,80
0
TC00
158
Wat
er S
uppl
y R
elia
bilit
y Im
pro
358
,100
30,0
000
00
030
,000
TC00
159
Flar
e C
apac
ity E
xpan
sion
311
3,00
07,
467,
900
177,
700
8,50
00
07,
654,
100
TC00
160
RW
RF
Con
ditio
ned
Dig
este
r Gas
322
,000
00
00
00
TC00
164
Hea
dwor
ks B
arsc
reen
31,
000
00
00
00
TC00
165
Res
idua
ls M
aste
r Pla
nM
44,0
000
00
00
0
TC00
168
Boile
r Rep
lace
men
t PG
F3
2,36
8,00
017
3,30
07,
500
00
018
0,80
0
TC00
169
Subs
tatio
n Ex
pans
ion
312
7,00
02,
946,
600
17,3
001,
100
00
2,96
5,00
0
TC00
171
RW
RF
Rec
ycle
d W
ater
Pip
elin
e3
4,00
00
00
00
0
TC00
172
RW
RF
Prop
erty
Gas
Pip
elin
e3
30,0
000
00
00
0
TC00
174
Rec
lam
atio
n W
ell S
yste
m In
terti
e to
Ter
tiary
Tre
atm
ent
M0
4,30
05,
000
5,00
05,
937,
100
355,
800
6,30
7,20
0
TC00
176
RW
RF
Hea
dwor
ksM
494,
000
779,
200
500,
000
500,
000
500,
000
02,
279,
200
TC00
177
RW
RF
Seco
ndar
y Tr
eatm
ent
385
,000
3,62
4,30
056
4,80
021
,890
,400
3,39
6,20
050
,600
29,5
26,3
00
TC00
178
RW
RF
Solid
s Tr
eatm
ent
31,
446,
500
2,31
0,10
01,
871,
800
1,81
7,40
01,
816,
100
1,81
6,00
09,
631,
400
TC00
179
RW
RF
Efflu
ent H
andl
ing
333
4,00
01,
146,
400
393,
500
310,
900
2,99
7,80
087
6,30
05,
724,
900
TC00
180
RW
RF
Build
ings
/Gro
unds
338
8,00
089
1,80
041
1,00
020
0,00
020
0,00
020
0,00
01,
902,
800
TC00
182
Rec
ycle
d W
ater
Dis
tribu
tion
M20
3,00
03,
510,
300
300,
400
671,
000
3,00
00
4,48
4,70
0
TC00
183
Plan
ning
& P
roje
ct M
anag
emen
tM
1,06
7,00
031
0,50
012
0,00
02,
620,
000
20,0
0020
,000
3,09
0,50
0
TC00
185
RW
RF
Elec
trica
l3
1,59
0,50
080
4,90
04,
828,
600
3,60
00
05,
637,
100
Tota
l for
: 405
01 -
Was
tew
ater
Ent
erpr
ise
19,1
00,2
0048
,361
,700
30,6
53,9
0051
,441
,600
41,4
83,2
0031
,984
,700
203,
925,
100
Pro
ject
N
ame
Dis
tric
t
Cap
ital
Proj
ects
FY 2
020
Estim
ate
2021
Cap
ital
Proj
ects
2022
Cap
ital
Proj
ects
2023
Cap
ital
Proj
ects
2024
Cap
ital
Proj
ects
2025
Cap
ital
Proj
ects
5 Ye
arPr
ojec
tTo
tal
FY 2020-2021 Capital Improvement Program by Department / Fund / Project
C - 90 FY 2020-2021 Final Revised Budget
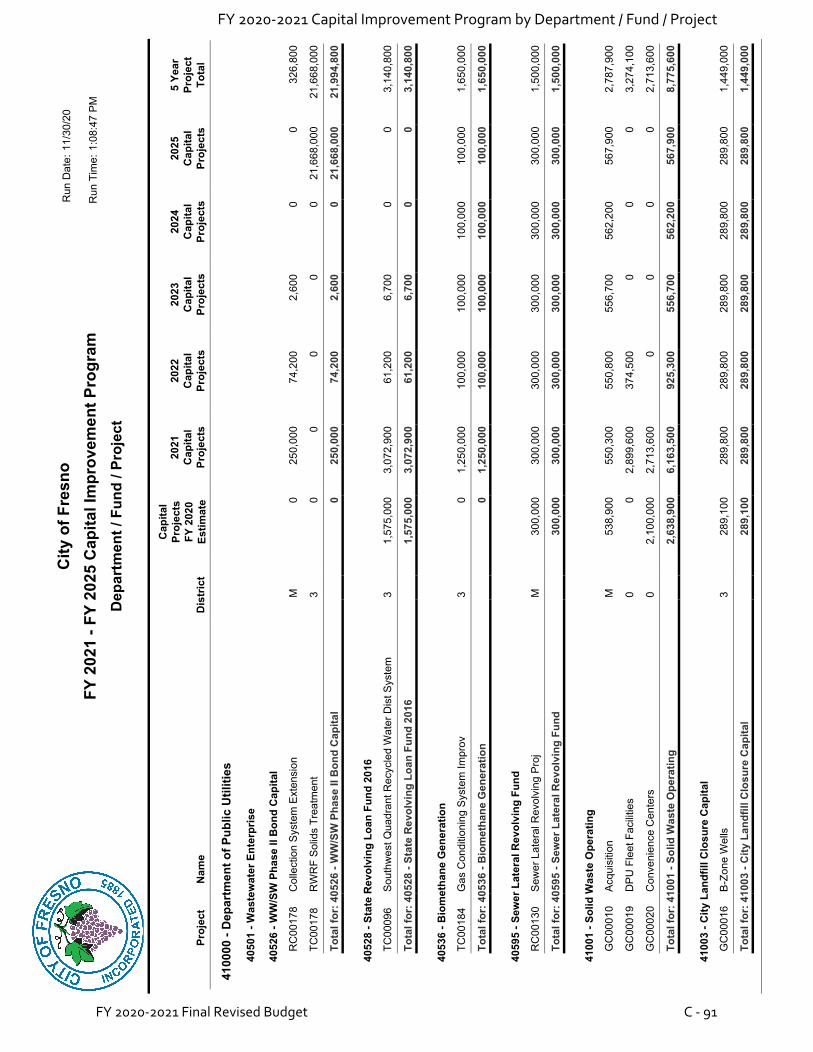
City
of F
resn
oR
un D
ate:
11/3
0/20
FY 2
021
- FY
2025
Cap
ital I
mpr
ovem
ent P
rogr
amR
un T
ime:
1:08
:47
PM
Dep
artm
ent /
Fun
d / P
roje
ct
4100
00 -
Dep
artm
ent o
f Pub
lic U
tiliti
es
4050
1 - W
aste
wat
er E
nter
pris
e
4052
6 - W
W/S
W P
hase
II B
ond
Cap
ital
RC
0017
8C
olle
ctio
n Sy
stem
Ext
ensi
onM
025
0,00
074
,200
2,60
00
032
6,80
0
TC00
178
RW
RF
Solid
s Tr
eatm
ent
30
00
00
21,6
68,0
0021
,668
,000
Tota
l for
: 405
26 -
WW
/SW
Pha
se II
Bon
d C
apita
l0
250,
000
74,2
002,
600
021
,668
,000
21,9
94,8
00
4052
8 - S
tate
Rev
olvi
ng L
oan
Fund
201
6
TC00
096
Sout
hwes
t Qua
dran
t Rec
ycle
d W
ater
Dis
t Sys
tem
31,
575,
000
3,07
2,90
061
,200
6,70
00
03,
140,
800
Tota
l for
: 405
28 -
Stat
e R
evol
ving
Loa
n Fu
nd 2
016
1,57
5,00
03,
072,
900
61,2
006,
700
00
3,14
0,80
0
4053
6 - B
iom
etha
ne G
ener
atio
n
TC00
184
Gas
Con
ditio
ning
Sys
tem
Impr
ov3
01,
250,
000
100,
000
100,
000
100,
000
100,
000
1,65
0,00
0
Tota
l for
: 405
36 -
Bio
met
hane
Gen
erat
ion
01,
250,
000
100,
000
100,
000
100,
000
100,
000
1,65
0,00
0
4059
5 - S
ewer
Lat
eral
Rev
olvi
ng F
und
RC
0013
0Se
wer
Lat
eral
Rev
olvi
ng P
roj
M30
0,00
030
0,00
030
0,00
030
0,00
030
0,00
030
0,00
01,
500,
000
Tota
l for
: 405
95 -
Sew
er L
ater
al R
evol
ving
Fun
d30
0,00
030
0,00
030
0,00
030
0,00
030
0,00
030
0,00
01,
500,
000
4100
1 - S
olid
Was
te O
pera
ting
GC
0001
0Ac
quis
ition
M53
8,90
055
0,30
055
0,80
055
6,70
056
2,20
056
7,90
02,
787,
900
GC
0001
9D
PU F
leet
Fac
ilitie
s0
02,
899,
600
374,
500
00
03,
274,
100
GC
0002
0C
onve
nien
ce C
ente
rs0
2,10
0,00
02,
713,
600
00
00
2,71
3,60
0
Tota
l for
: 410
01 -
Solid
Was
te O
pera
ting
2,63
8,90
06,
163,
500
925,
300
556,
700
562,
200
567,
900
8,77
5,60
0
4100
3 - C
ity L
andf
ill C
losu
re C
apita
l
GC
0001
6B-
Zone
Wel
ls3
289,
100
289,
800
289,
800
289,
800
289,
800
289,
800
1,44
9,00
0
Tota
l for
: 410
03 -
City
Lan
dfill
Clo
sure
Cap
ital
289,
100
289,
800
289,
800
289,
800
289,
800
289,
800
1,44
9,00
0
Pro
ject
N
ame
Dis
tric
t
Cap
ital
Proj
ects
FY 2
020
Estim
ate
2021
Cap
ital
Proj
ects
2022
Cap
ital
Proj
ects
2023
Cap
ital
Proj
ects
2024
Cap
ital
Proj
ects
2025
Cap
ital
Proj
ects
5 Ye
arPr
ojec
tTo
tal
FY 2020-2021 Capital Improvement Program by Department / Fund / Project
FY 2020-2021 Final Revised Budget C - 91

City
of F
resn
oR
un D
ate:
11/3
0/20
FY 2
021
- FY
2025
Cap
ital I
mpr
ovem
ent P
rogr
amR
un T
ime:
1:08
:47
PM
Dep
artm
ent /
Fun
d / P
roje
ct
4100
00 -
Dep
artm
ent o
f Pub
lic U
tiliti
es
4100
3 - C
ity L
andf
ill C
losu
re C
apita
l
Tota
l for
: 410
000
- Dep
artm
ent o
f Pub
lic U
tiliti
es23
,903
,200
105,
556,
400
77,1
16,1
0098
,140
,100
79,8
43,0
0087
,241
,800
447,
897,
400
4300
00 -
Airp
orts
Dep
artm
ent
4200
5 - I
Ban
k Pr
ivat
e Pl
acem
ent B
ond
4202
5 - A
irway
s G
olf C
ours
e C
apita
l
AC00
045
Airw
ays
Gol
f Cou
rse
Cap
ital
435
,300
659,
800
00
00
659,
800
Tota
l for
: 420
25 -
Airw
ays
Gol
f Cou
rse
Cap
ital
35,3
0065
9,80
00
00
065
9,80
0
4204
0 - A
irpor
t Fed
eral
Gra
nts
AC00
345
AIPx
x FF
18 R
ehab
Tw
y C
Ph1
(Con
st)
41,
553,
500
275,
800
00
00
275,
800
AC00
346
AIPx
x FF
17 F
CH
Mas
ter P
lan
Upd
ate
311
7,50
026
,900
00
00
26,9
00
AC00
347
AIP7
9 FF
16 F
AT M
aste
r Pla
n U
pdat
e4
7,90
015
2,00
00
00
015
2,00
0
AC00
355
Term
inal
Gat
e 8
Hol
droo
m/B
ridge
431
7,10
026
1,30
00
00
026
1,30
0
AC00
358
AIPx
x FF
18 A
irfie
ld L
ight
ing
Sys
436
6,70
034
,600
00
00
34,6
00
AC00
377
Mar
ine
Base
Dem
o (F
ED M
CC
A)4
01,
300,
000
00
00
1,30
0,00
0
AC00
380
11R
/29L
End
of R
unw
ay R
epai
r4
146,
300
00
00
00
AC00
382
AIPx
x FF
18 N
oise
Hom
es P
art1
504
849,
200
315,
600
00
00
315,
600
AC00
385
AIPx
x FF
19 N
oise
Hom
es P
art1
504
01,
111,
200
00
00
1,11
1,20
0
AC00
386
AIPx
x FF
19 A
RFF
Stn
(+EO
C) D
es4
00
00
140,
000
014
0,00
0
AC00
395
AIPx
x FF
18 T
wy
C C
onst
Ph2
44,
969,
200
411,
200
00
00
411,
200
AC00
398
AIPx
x Te
rm E
Apr
on (E
nv/D
es)
41,
207,
200
9,39
0,30
00
00
09,
390,
300
AC00
399
AIPx
x Te
rm Im
prv
(Env
/Des
)4
64,7
000
00
00
0
AC00
402
AIPx
x Tw
y B6
,4,3
Rem
ove
(Env
Des
Con
)4
119,
900
00
00
00
Pro
ject
N
ame
Dis
tric
t
Cap
ital
Proj
ects
FY 2
020
Estim
ate
2021
Cap
ital
Proj
ects
2022
Cap
ital
Proj
ects
2023
Cap
ital
Proj
ects
2024
Cap
ital
Proj
ects
2025
Cap
ital
Proj
ects
5 Ye
arPr
ojec
tTo
tal
FY 2020-2021 Capital Improvement Program by Department / Fund / Project
C - 92 FY 2020-2021 Final Revised Budget
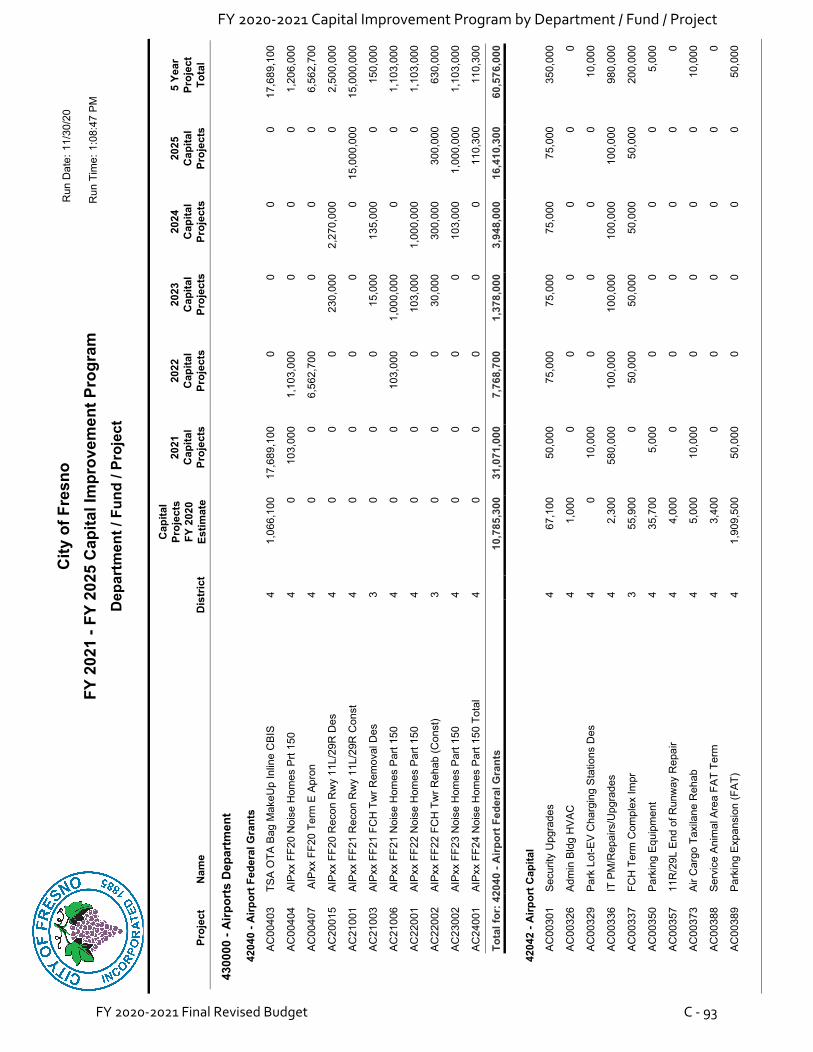
City
of F
resn
oR
un D
ate:
11/3
0/20
FY 2
021
- FY
2025
Cap
ital I
mpr
ovem
ent P
rogr
amR
un T
ime:
1:08
:47
PM
Dep
artm
ent /
Fun
d / P
roje
ct
4300
00 -
Airp
orts
Dep
artm
ent
4204
0 - A
irpor
t Fed
eral
Gra
nts
AC00
403
TSA
OTA
Bag
Mak
eUp
Inlin
e C
BIS
41,
066,
100
17,6
89,1
000
00
017
,689
,100
AC00
404
AIPx
x FF
20 N
oise
Hom
es P
rt 15
0 4
010
3,00
01,
103,
000
00
01,
206,
000
AC00
407
AIP
xx F
F20
Term
E A
pron
40
06,
562,
700
00
06,
562,
700
AC20
015
AIPx
x FF
20 R
econ
Rw
y 11
L/29
R D
es4
00
023
0,00
02,
270,
000
02,
500,
000
AC21
001
AIPx
x FF
21 R
econ
Rw
y 11
L/29
R C
onst
40
00
00
15,0
00,0
0015
,000
,000
AC21
003
AIPx
x FF
21 F
CH
Tw
r Rem
oval
Des
30
00
15,0
0013
5,00
00
150,
000
AC21
006
AIPx
x FF
21 N
oise
Hom
es P
art 1
504
00
103,
000
1,00
0,00
00
01,
103,
000
AC22
001
AIPx
x FF
22 N
oise
Hom
es P
art 1
504
00
010
3,00
01,
000,
000
01,
103,
000
AC22
002
AIPx
x FF
22 F
CH
Tw
r Reh
ab (C
onst
)3
00
030
,000
300,
000
300,
000
630,
000
AC23
002
AIPx
x FF
23 N
oise
Hom
es P
art 1
50
40
00
010
3,00
01,
000,
000
1,10
3,00
0
AC24
001
AIPx
x FF
24 N
oise
Hom
es P
art 1
50 T
otal
40
00
00
110,
300
110,
300
Tota
l for
: 420
40 -
Airp
ort F
eder
al G
rant
s10
,785
,300
31,0
71,0
007,
768,
700
1,37
8,00
03,
948,
000
16,4
10,3
0060
,576
,000
4204
2 - A
irpor
t Cap
ital
AC00
301
Secu
rity
Upg
rade
s4
67,1
0050
,000
75,0
0075
,000
75,0
0075
,000
350,
000
AC00
326
Adm
in B
ldg
HVA
C4
1,00
00
00
00
0
AC00
329
Park
Lot
-EV
Cha
rgin
g St
atio
ns D
es4
010
,000
00
00
10,0
00
AC00
336
IT P
M/R
epai
rs/U
pgra
des
42,
300
580,
000
100,
000
100,
000
100,
000
100,
000
980,
000
AC00
337
FCH
Ter
m C
ompl
ex Im
pr3
55,9
000
50,0
0050
,000
50,0
0050
,000
200,
000
AC00
350
Park
ing
Equi
pmen
t4
35,7
005,
000
00
00
5,00
0
AC00
357
11R
/29L
End
of R
unw
ay R
epai
r4
4,00
00
00
00
0
AC00
373
Air C
argo
Tax
ilane
Reh
ab4
5,00
010
,000
00
00
10,0
00
AC00
388
Serv
ice
Anim
al A
rea
FAT
Term
43,
400
00
00
00
AC00
389
Park
ing
Expa
nsio
n (F
AT)
41,
909,
500
50,0
000
00
050
,000
Pro
ject
N
ame
Dis
tric
t
Cap
ital
Proj
ects
FY 2
020
Estim
ate
2021
Cap
ital
Proj
ects
2022
Cap
ital
Proj
ects
2023
Cap
ital
Proj
ects
2024
Cap
ital
Proj
ects
2025
Cap
ital
Proj
ects
5 Ye
arPr
ojec
tTo
tal
FY 2020-2021 Capital Improvement Program by Department / Fund / Project
FY 2020-2021 Final Revised Budget C - 93

City
of F
resn
oR
un D
ate:
11/3
0/20
FY 2
021
- FY
2025
Cap
ital I
mpr
ovem
ent P
rogr
amR
un T
ime:
1:08
:47
PM
Dep
artm
ent /
Fun
d / P
roje
ct
4300
00 -
Airp
orts
Dep
artm
ent
4204
2 - A
irpor
t Cap
ital
AC00
390
Air S
ervi
ce P
lann
ing
440
0,00
050
0,00
040
0,00
040
0,00
040
0,00
040
0,00
02,
100,
000
AC00
392
Term
inal
Fro
ntag
e Li
ghtin
g4
32,4
000
00
00
0
AC00
401
Park
ing
Gar
age
(Env
/Des
/Con
)4
1,70
4,50
038
,835
,000
00
00
38,8
35,0
00
AC00
402
AIPx
x Tw
y B6
,4,3
Rem
ove
(Env
Des
Con
)4
055
1,30
00
00
055
1,30
0
AC00
409
Airfi
eld
Rep
airs
/ R
epl
41,
159,
500
1,23
0,00
010
0,00
010
0,00
010
0,00
010
0,00
01,
630,
000
AC00
410
Term
inal
Rep
airs
/ R
epl
457
1,70
040
0,00
050
0,00
050
0,00
050
0,00
050
0,00
02,
400,
000
AC00
411
Equi
pt S
mal
l Cap
ital
40
202,
600
200,
000
200,
000
200,
000
200,
000
1,00
2,60
0
AC00
412
Term
inal
Impr
ovem
ents
413
8,00
026
4,00
070
0,00
070
0,00
070
0,00
070
0,00
03,
064,
000
AC00
413
Term
inal
/FIS
Exp
ansi
on4
331,
600
00
00
00
AC00
414
Park
ing
Rep
airs
/ R
epla
cem
ents
4
2,50
010
0,00
050
,000
50,0
0050
,000
50,0
0030
0,00
0
AC00
415
Term
Gat
e 5/
7 Im
pr D
es/C
on
457
0,70
025
,000
00
00
25,0
00
AM00
103
Envi
ronm
enta
l Site
-Old
Ham
mer
Fie
ld4
66,3
0010
0,00
012
5,00
012
5,00
012
5,00
012
5,00
060
0,00
0
AM00
106
Faci
litie
s R
epai
r/Rep
l Res
erve
450
0,00
050
0,00
050
0,00
050
0,00
050
0,00
050
0,00
02,
500,
000
Tota
l for
: 420
42 -
Airp
ort C
apita
l7,
561,
100
43,4
12,9
002,
800,
000
2,80
0,00
02,
800,
000
2,80
0,00
054
,612
,900
4204
5 - C
onso
lidat
ed F
acili
ty C
hg F
d.
AC00
378
RAC
QTA
Dra
inag
e C
onst
ruct
ion
40
73,2
000
00
073
,200
Tota
l for
: 420
45 -
Con
solid
ated
Fac
ility
Chg
Fd.
073
,200
00
00
73,2
00
4204
8 - C
RC
F R
eser
ve F
und
AC00
367
CR
CF
Faci
lity
Mai
nten
ance
40
318,
100
00
00
318,
100
Tota
l for
: 420
48 -
CR
CF
Res
erve
Fun
d0
318,
100
00
00
318,
100
4204
9 - P
FC C
apita
l Fun
d
AC00
328
Term
inal
HVA
C R
epla
cem
ent
422
2,70
037
8,30
00
00
037
8,30
0
Pro
ject
N
ame
Dis
tric
t
Cap
ital
Proj
ects
FY 2
020
Estim
ate
2021
Cap
ital
Proj
ects
2022
Cap
ital
Proj
ects
2023
Cap
ital
Proj
ects
2024
Cap
ital
Proj
ects
2025
Cap
ital
Proj
ects
5 Ye
arPr
ojec
tTo
tal
FY 2020-2021 Capital Improvement Program by Department / Fund / Project
C - 94 FY 2020-2021 Final Revised Budget

City
of F
resn
oR
un D
ate:
11/3
0/20
FY 2
021
- FY
2025
Cap
ital I
mpr
ovem
ent P
rogr
amR
un T
ime:
1:08
:47
PM
Dep
artm
ent /
Fun
d / P
roje
ct
4300
00 -
Airp
orts
Dep
artm
ent
4204
9 - P
FC C
apita
l Fun
d
AC00
342
Term
inal
Res
troom
s (D
es/C
onst
)4
010
,000
00
00
10,0
00
AC00
354
Bag
Cla
im W
alk
Rem
odel
40
50,5
000
00
050
,500
AC00
364
Term
inal
Boi
lers
Rep
lace
men
t4
1,10
0,00
050
,000
00
00
50,0
00
AC00
366
Airfi
eld
Perim
Fen
ce P
h14
56,6
0088
,300
00
00
88,3
00
AC00
368
Pass
enge
r Fac
ility
Cha
rge
(PFC
) Adm
inis
tratio
n4
200
83,0
000
00
083
,000
AC00
369
Term
Pub
lic A
ddre
ss S
yste
m4
057
5,00
00
00
057
5,00
0
AC00
370
Term
inal
Cnt
rs M
onito
rs4
069
,000
00
00
69,0
00
AC00
371
Com
m A
viat
ion
Ligh
ting
428
8,60
053
,000
00
00
53,0
00
AC00
372
Term
inal
Roo
f Ren
ovat
ion
496
4,80
053
5,00
00
00
053
5,00
0
AC00
400
PFC
4 A
dmin
istra
tion
Cos
ts4
45,3
007,
000
00
00
7,00
0
AC00
408
PFC
Adm
inis
tratio
n C
osts
40
150,
000
00
00
150,
000
AC00
416
Broo
m S
wee
per
40
450,
000
00
00
450,
000
AC20
013
Airfi
eld
Perim
Fen
ce P
h24
00
01,
600,
000
00
1,60
0,00
0
Tota
l for
: 420
49 -
PFC
Cap
ital F
und
2,67
8,20
02,
499,
100
01,
600,
000
00
4,09
9,10
0
4205
1 - T
erm
inal
/FIS
Pro
ject
AC00
413
Term
inal
/FIS
Exp
ansi
on4
8,20
0,00
01,
500,
000
00
00
1,50
0,00
0
Tota
l for
: 420
51 -
Term
inal
/FIS
Pro
ject
8,20
0,00
01,
500,
000
00
00
1,50
0,00
0
Tota
l for
: 430
000
- Airp
orts
Dep
artm
ent
29,2
59,9
0079
,534
,100
10,5
68,7
005,
778,
000
6,74
8,00
019
,210
,300
121,
839,
100
4400
00 -
Con
vent
ion
Cnt
r & S
tadi
um D
ept
4700
3 - S
tadi
um C
apita
l
CC
0002
7St
adiu
m C
apita
l Im
prov
emen
ts3
01,
619,
200
00
00
1,61
9,20
0
Tota
l for
: 470
03 -
Stad
ium
Cap
ital
01,
619,
200
00
00
1,61
9,20
0
Pro
ject
N
ame
Dis
tric
t
Cap
ital
Proj
ects
FY 2
020
Estim
ate
2021
Cap
ital
Proj
ects
2022
Cap
ital
Proj
ects
2023
Cap
ital
Proj
ects
2024
Cap
ital
Proj
ects
2025
Cap
ital
Proj
ects
5 Ye
arPr
ojec
tTo
tal
FY 2020-2021 Capital Improvement Program by Department / Fund / Project
FY 2020-2021 Final Revised Budget C - 95

City
of F
resn
oR
un D
ate:
11/3
0/20
FY 2
021
- FY
2025
Cap
ital I
mpr
ovem
ent P
rogr
amR
un T
ime:
1:08
:47
PM
Dep
artm
ent /
Fun
d / P
roje
ct
4400
00 -
Con
vent
ion
Cnt
r & S
tadi
um D
ept
4700
3 - S
tadi
um C
apita
l
4700
4 - S
tadi
um C
apita
l Res
erve
CC
0002
7St
adiu
m C
apita
l Im
prov
emen
ts3
206,
200
2,04
8,40
00
00
02,
048,
400
Tota
l for
: 470
04 -
Stad
ium
Cap
ital R
eser
ve20
6,20
02,
048,
400
00
00
2,04
8,40
0
Tota
l for
: 440
000
- Con
vent
ion
Cnt
r & S
tadi
um D
ept
206,
200
3,66
7,60
00
00
03,
667,
600
4500
00 -
FAX
Dep
artm
ent
2250
5 - M
easu
re C
Tra
nsit
FC00
050
Bus
Purc
hase
Fix
ed R
oute
=40
'M
93,1
0011
0,00
00
00
011
0,00
0
Tota
l for
: 225
05 -
Mea
sure
C T
rans
it93
,100
110,
000
00
00
110,
000
4352
4 - M
isce
llane
ous
Cle
an A
ir G
rant
s
4352
5 - F
AX
Cap
ital
FC00
001
Non
-Rev
enue
Sup
port
Vehi
cles
M8,
000
100,
000
50,0
000
50,0
000
200,
000
FC00
019
Pass
enge
r Am
eniti
esM
27,1
0015
0,00
050
,000
50,0
0050
,000
50,0
0035
0,00
0
FC00
026
Plan
ning
M15
,000
300,
000
50,0
0050
,000
50,0
0050
,000
500,
000
FC00
036
Bldg
and
Fac
ility
Mai
nten
ance
337
,700
200,
000
10,0
0010
,000
10,0
0010
,000
240,
000
Tota
l for
: 435
25 -
FAX
Cap
ital
87,8
0075
0,00
016
0,00
011
0,00
016
0,00
011
0,00
01,
290,
000
4353
8 - P
rop
1B-C
TSG
P Tr
ansi
t Sec
Grn
t
FC00
085
FY16
-17
Prop
1B-C
TSG
P Se
c Pr
jct
00
34,9
000
00
034
,900
Tota
l for
: 435
38 -
Prop
1B
-CTS
GP
Tran
sit S
ec G
rnt
034
,900
00
00
34,9
00
Pro
ject
N
ame
Dis
tric
t
Cap
ital
Proj
ects
FY 2
020
Estim
ate
2021
Cap
ital
Proj
ects
2022
Cap
ital
Proj
ects
2023
Cap
ital
Proj
ects
2024
Cap
ital
Proj
ects
2025
Cap
ital
Proj
ects
5 Ye
arPr
ojec
tTo
tal
FY 2020-2021 Capital Improvement Program by Department / Fund / Project
C - 96 FY 2020-2021 Final Revised Budget

City
of F
resn
oR
un D
ate:
11/3
0/20
FY 2
021
- FY
2025
Cap
ital I
mpr
ovem
ent P
rogr
amR
un T
ime:
1:08
:47
PM
Dep
artm
ent /
Fun
d / P
roje
ct
4500
00 -
FAX
Dep
artm
ent
4353
9 - F
TA 5
310
Gra
nts
(FY0
7-08
fwd)
FC00
053
Para
trans
it Ve
hicl
es &
Equ
ipM
091
2,00
00
500,
000
050
0,00
01,
912,
000
Tota
l for
: 435
39 -
FTA
531
0 G
rant
s (F
Y07-
08 fw
d)0
912,
000
050
0,00
00
500,
000
1,91
2,00
0
4354
2 - P
rop
1B-P
TMIS
EA T
rans
it Se
c G
rant
FC00
068
FY09
-10
Prop
1B-P
TMIS
EA P
roje
ctM
433,
100
760,
000
00
00
760,
000
FC00
069
FY10
-11
Prop
1B-
PTM
ISEA
Pro
ject
M0
4,25
5,20
00
00
04,
255,
200
FC00
087
FY14
-15
Prop
1B-P
TMIS
EA P
roje
ctM
3,66
3,20
05,
064,
200
00
00
5,06
4,20
0
Tota
l for
: 435
42 -
Prop
1B
-PTM
ISEA
Tra
nsit
Sec
Gra
nt4,
096,
300
10,0
79,4
000
00
010
,079
,400
4354
4 - 5
317
New
Fre
edom
Gra
nts
FC00
075
NF-
Bus
Stop
Impr
ovem
ents
M60
2,10
00
00
00
0
FC00
076
NF-
Bus
Stop
Num
b Br
aille
Sig
nsM
1,10
00
00
00
0
Tota
l for
: 435
44 -
5317
New
Fre
edom
Gra
nts
603,
200
00
00
00
4354
8 - F
TA S
mal
l Sta
rts
Gra
nt
FC00
070
BRT-
Bus
Rap
id T
rans
it Ph
ase
1M
579,
800
800,
000
00
00
800,
000
Tota
l for
: 435
48 -
FTA
Sm
all S
tart
s G
rant
579,
800
800,
000
00
00
800,
000
4355
0 - F
Y11
FTA
530
7 G
rant
CA
-90-
Y843
FC00
019
Pass
enge
r Am
eniti
esM
073
,300
00
00
73,3
00
Tota
l for
: 435
50 -
FY11
FTA
530
7 G
rant
CA
-90-
Y843
073
,300
00
00
73,3
00
4355
1 - F
Y10-
FY12
Fed
eral
CM
AQ
FC00
078
Tran
sit S
igna
l Prio
ritiz
atio
nM
712,
200
840,
000
00
00
840,
000
Tota
l for
: 435
51 -
FY10
-FY1
2 Fe
dera
l CM
AQ
712,
200
840,
000
00
00
840,
000
Pro
ject
N
ame
Dis
tric
t
Cap
ital
Proj
ects
FY 2
020
Estim
ate
2021
Cap
ital
Proj
ects
2022
Cap
ital
Proj
ects
2023
Cap
ital
Proj
ects
2024
Cap
ital
Proj
ects
2025
Cap
ital
Proj
ects
5 Ye
arPr
ojec
tTo
tal
FY 2020-2021 Capital Improvement Program by Department / Fund / Project
FY 2020-2021 Final Revised Budget C - 97
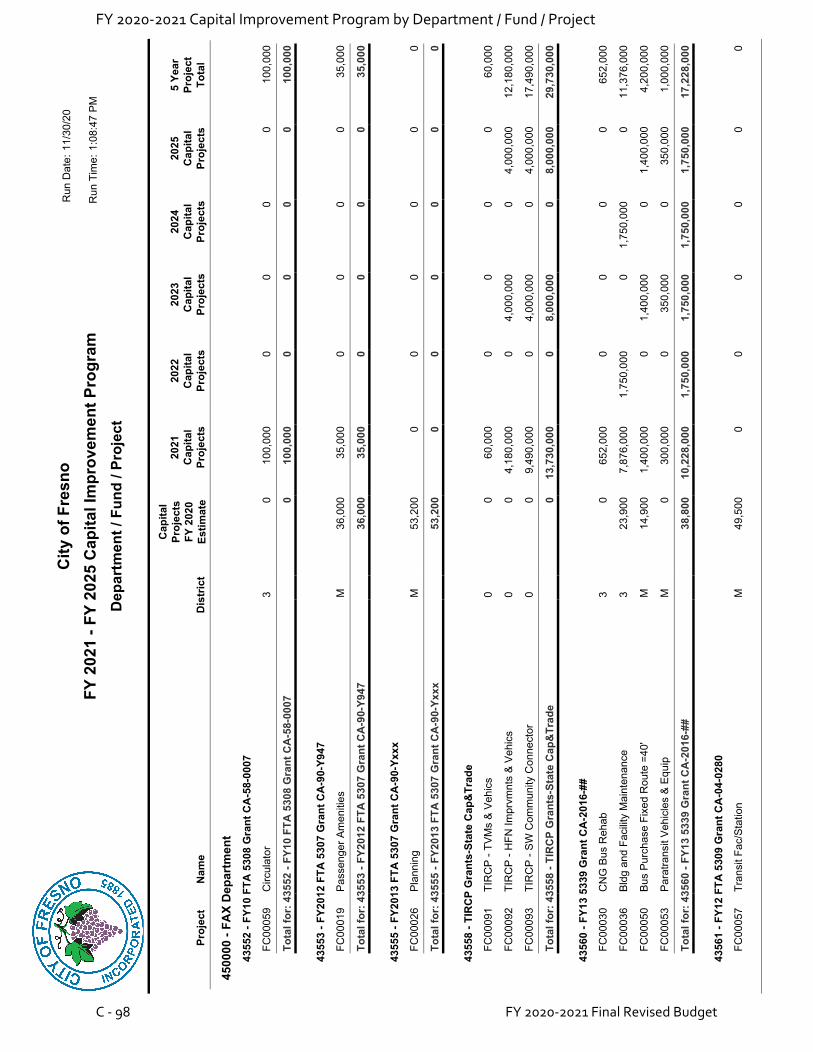
City
of F
resn
oR
un D
ate:
11/3
0/20
FY 2
021
- FY
2025
Cap
ital I
mpr
ovem
ent P
rogr
amR
un T
ime:
1:08
:47
PM
Dep
artm
ent /
Fun
d / P
roje
ct
4500
00 -
FAX
Dep
artm
ent
4355
2 - F
Y10
FTA
530
8 G
rant
CA
-58-
0007
FC00
059
Circ
ulat
or3
010
0,00
00
00
010
0,00
0
Tota
l for
: 435
52 -
FY10
FTA
530
8 G
rant
CA
-58-
0007
010
0,00
00
00
010
0,00
0
4355
3 - F
Y201
2 FT
A 5
307
Gra
nt C
A-9
0-Y9
47
FC00
019
Pass
enge
r Am
eniti
esM
36,0
0035
,000
00
00
35,0
00
Tota
l for
: 435
53 -
FY20
12 F
TA 5
307
Gra
nt C
A-9
0-Y9
4736
,000
35,0
000
00
035
,000
4355
5 - F
Y201
3 FT
A 5
307
Gra
nt C
A-9
0-Yx
xx
FC00
026
Plan
ning
M53
,200
00
00
00
Tota
l for
: 435
55 -
FY20
13 F
TA 5
307
Gra
nt C
A-9
0-Yx
xx53
,200
00
00
00
4355
8 - T
IRC
P G
rant
s-St
ate
Cap
&Tr
ade
FC00
091
TIR
CP
- TVM
s &
Vehi
cs0
060
,000
00
00
60,0
00
FC00
092
TIR
CP
- HFN
Impr
vmnt
s &
Vehi
cs0
04,
180,
000
04,
000,
000
04,
000,
000
12,1
80,0
00
FC00
093
TIR
CP
- SW
Com
mun
ity C
onne
ctor
0
09,
490,
000
04,
000,
000
04,
000,
000
17,4
90,0
00
Tota
l for
: 435
58 -
TIR
CP
Gra
nts-
Stat
e C
ap&
Trad
e0
13,7
30,0
000
8,00
0,00
00
8,00
0,00
029
,730
,000
4356
0 - F
Y13
5339
Gra
nt C
A-2
016-
##
FC00
030
CN
G B
us R
ehab
3
065
2,00
00
00
065
2,00
0
FC00
036
Bldg
and
Fac
ility
Mai
nten
ance
323
,900
7,87
6,00
01,
750,
000
01,
750,
000
011
,376
,000
FC00
050
Bus
Purc
hase
Fix
ed R
oute
=40
'M
14,9
001,
400,
000
01,
400,
000
01,
400,
000
4,20
0,00
0
FC00
053
Para
trans
it Ve
hicl
es &
Equ
ipM
030
0,00
00
350,
000
035
0,00
01,
000,
000
Tota
l for
: 435
60 -
FY13
533
9 G
rant
CA
-201
6-##
38,8
0010
,228
,000
1,75
0,00
01,
750,
000
1,75
0,00
01,
750,
000
17,2
28,0
00
4356
1 - F
Y12
FTA
530
9 G
rant
CA
-04-
0280
FC00
057
Tran
sit F
ac/S
tatio
nM
49,5
000
00
00
0
Pro
ject
N
ame
Dis
tric
t
Cap
ital
Proj
ects
FY 2
020
Estim
ate
2021
Cap
ital
Proj
ects
2022
Cap
ital
Proj
ects
2023
Cap
ital
Proj
ects
2024
Cap
ital
Proj
ects
2025
Cap
ital
Proj
ects
5 Ye
arPr
ojec
tTo
tal
FY 2020-2021 Capital Improvement Program by Department / Fund / Project
C - 98 FY 2020-2021 Final Revised Budget

City
of F
resn
oR
un D
ate:
11/3
0/20
FY 2
021
- FY
2025
Cap
ital I
mpr
ovem
ent P
rogr
amR
un T
ime:
1:08
:47
PM
Dep
artm
ent /
Fun
d / P
roje
ct
4500
00 -
FAX
Dep
artm
ent
4356
1 - F
Y12
FTA
530
9 G
rant
CA
-04-
0280
Tota
l for
: 435
61 -
FY12
FTA
530
9 G
rant
CA
-04-
0280
49,5
000
00
00
0
4356
2 - F
Y15
FTA
530
7 G
rant
CA
-90-
Z###
FC00
001
Non
-Rev
enue
Sup
port
Vehi
cles
M90
,200
81,0
000
00
081
,000
FC00
026
Plan
ning
M0
42,9
000
00
042
,900
FC00
057
Tran
sit F
ac/S
tatio
nM
137,
900
146,
800
00
00
146,
800
FC00
090
Tran
sit A
sset
Man
agem
ent
M0
300,
000
00
00
300,
000
Tota
l for
: 435
62 -
FY15
FTA
530
7 G
rant
CA
-90-
Z###
228,
100
570,
700
00
00
570,
700
4356
3 - F
Y16
FTA
530
7 G
rant
CA
-201
8-00
2
FC00
019
Pass
enge
r Am
eniti
esM
6,70
033
5,40
00
00
033
5,40
0
FC00
026
Plan
ning
M17
6,80
015
0,00
00
00
015
0,00
0
Tota
l for
: 435
63 -
FY16
FTA
530
7 G
rant
CA
-201
8-00
218
3,50
048
5,40
00
00
048
5,40
0
4356
4 - S
tate
Cap
& T
rade
- LC
TOP
FC00
019
Pass
enge
r Am
eniti
esM
094
7,20
025
0,00
025
0,00
025
0,00
025
0,00
01,
947,
200
Tota
l for
: 435
64 -
Stat
e C
ap &
Tra
de -
LCTO
P0
947,
200
250,
000
250,
000
250,
000
250,
000
1,94
7,20
0
4356
5 - F
Y17
FTA
530
7 G
rant
CA
-201
7-##
FC00
019
Pass
enge
r Am
eniti
esM
159,
800
185,
000
00
00
185,
000
FC00
026
Plan
ning
M50
026
4,30
00
00
026
4,30
0
Tota
l for
: 435
65 -
FY17
FTA
530
7 G
rant
CA
-201
7-##
160,
300
449,
300
00
00
449,
300
4356
6 - F
Y17
FTA
CM
AQ
Gra
nt C
A-2
017-
##
FC00
019
Pass
enge
r Am
eniti
esM
061
8,00
00
00
061
8,00
0
Tota
l for
: 435
66 -
FY17
FTA
CM
AQ
Gra
nt C
A-2
017-
##0
618,
000
00
00
618,
000
Pro
ject
N
ame
Dis
tric
t
Cap
ital
Proj
ects
FY 2
020
Estim
ate
2021
Cap
ital
Proj
ects
2022
Cap
ital
Proj
ects
2023
Cap
ital
Proj
ects
2024
Cap
ital
Proj
ects
2025
Cap
ital
Proj
ects
5 Ye
arPr
ojec
tTo
tal
FY 2020-2021 Capital Improvement Program by Department / Fund / Project
FY 2020-2021 Final Revised Budget C - 99

City
of F
resn
oR
un D
ate:
11/3
0/20
FY 2
021
- FY
2025
Cap
ital I
mpr
ovem
ent P
rogr
amR
un T
ime:
1:08
:47
PM
Dep
artm
ent /
Fun
d / P
roje
ct
4500
00 -
FAX
Dep
artm
ent
4356
6 - F
Y17
FTA
CM
AQ
Gra
nt C
A-2
017-
##
4356
7 - F
Y17
FTA
530
7 G
rant
CA
-201
8-##
FC00
019
Pass
enge
r Am
eniti
esM
4,60
049
8,70
00
00
049
8,70
0
FC00
036
Bldg
and
Fac
ility
Mai
nten
ance
32,
100
475,
000
00
00
475,
000
Tota
l for
: 435
67 -
FY17
FTA
530
7 G
rant
CA
-201
8-##
6,70
097
3,70
00
00
097
3,70
0
4356
8 - F
Y19
FTA
530
7 G
rant
CA
-201
9-##
FC00
019
Pass
enge
r Am
eniti
esM
128,
000
250,
000
00
00
250,
000
FC00
026
Plan
ning
M0
100,
000
00
00
100,
000
FC00
036
Bldg
and
Fac
ility
Mai
nten
ance
30
500,
000
00
00
500,
000
FC00
050
Bus
Purc
hase
Fix
ed R
oute
=40
'M
1,25
0,00
00
00
00
0
Tota
l for
: 435
68 -
FY19
FTA
530
7 G
rant
CA
-201
9-##
1,37
8,00
085
0,00
00
00
085
0,00
0
4356
9 - S
B-1
SG
R G
rant
s
FC00
024
FAX
Rad
io S
yste
m3
01,
044,
700
00
00
1,04
4,70
0
FC00
036
Bldg
and
Fac
ility
Mai
nten
ance
30
1,14
0,00
01,
031,
000
065
4,90
00
2,82
5,90
0
FC00
050
Bus
Purc
hase
Fix
ed R
oute
=40
'M
1,15
0,00
01,
150,
000
01,
200,
000
700,
000
2,02
0,00
05,
070,
000
Tota
l for
: 435
69 -
SB-1
SG
R G
rant
s1,
150,
000
3,33
4,70
01,
031,
000
1,20
0,00
01,
354,
900
2,02
0,00
08,
940,
600
4357
0 - F
Y18
FTA
533
9 G
rant
CA
-201
9-##
FC00
036
Bldg
and
Fac
ility
Mai
nten
ance
30
1,00
5,00
00
00
01,
005,
000
Tota
l for
: 435
70 -
FY18
FTA
533
9 G
rant
CA
-201
9-##
01,
005,
000
00
00
1,00
5,00
0
4357
1 - F
Y20
FTA
530
7 G
rant
CA
-202
0-##
FC00
019
Pass
enge
r Am
eniti
esM
025
0,00
00
00
025
0,00
0
FC00
026
Plan
ning
M0
500,
000
00
00
500,
000
Pro
ject
N
ame
Dis
tric
t
Cap
ital
Proj
ects
FY 2
020
Estim
ate
2021
Cap
ital
Proj
ects
2022
Cap
ital
Proj
ects
2023
Cap
ital
Proj
ects
2024
Cap
ital
Proj
ects
2025
Cap
ital
Proj
ects
5 Ye
arPr
ojec
tTo
tal
FY 2020-2021 Capital Improvement Program by Department / Fund / Project
C - 100 FY 2020-2021 Final Revised Budget

City
of F
resn
oR
un D
ate:
11/3
0/20
FY 2
021
- FY
2025
Cap
ital I
mpr
ovem
ent P
rogr
amR
un T
ime:
1:08
:47
PM
Dep
artm
ent /
Fun
d / P
roje
ct
Gra
nd T
otal
70,3
62,1
0046
7,30
5,90
098
,326
,400
118,
119,
600
92,9
45,9
0012
1,36
7,10
089
8,06
4,90
0
4500
00 -
FAX
Dep
artm
ent
4357
1 - F
Y20
FTA
530
7 G
rant
CA
-202
0-##
FC00
036
Bldg
and
Fac
ility
Mai
nten
ance
30
600,
000
00
00
600,
000
FC00
050
Bus
Purc
hase
Fix
ed R
oute
=40
'M
01,
400,
000
00
00
1,40
0,00
0
Tota
l for
: 435
71 -
FY20
FTA
530
7 G
rant
CA
-202
0-##
02,
750,
000
00
00
2,75
0,00
0
4357
2 - F
Y21
FTA
530
7 G
rant
CA
-202
1-##
FC00
019
Pass
enge
r Am
eniti
esM
020
0,00
015
0,00
015
0,00
015
0,00
015
0,00
080
0,00
0
FC00
026
Plan
ning
M0
300,
000
150,
000
150,
000
150,
000
150,
000
900,
000
FC00
036
Bldg
and
Fac
ility
Mai
nten
ance
30
600,
000
030
0,00
00
300,
000
1,20
0,00
0
Tota
l for
: 435
72 -
FY21
FTA
530
7 G
rant
CA
-202
1-##
01,
100,
000
300,
000
600,
000
300,
000
600,
000
2,90
0,00
0
4357
3 - F
TA C
AR
ES A
ct G
rant
CA
-202
1-##
FC00
050
Bus
Purc
hase
Fix
ed R
oute
=40
'M
01,
103,
400
00
00
1,10
3,40
0
Tota
l for
: 435
73 -
FTA
CA
RES
Act
Gra
nt C
A-2
021-
##0
1,10
3,40
00
00
01,
103,
400
4357
4 - C
CI-C
lean
Mob
ility
Pro
gFun
ding
FC00
026
Plan
ning
M0
48,5
000
00
048
,500
Tota
l for
: 435
74 -
CC
I-Cle
an M
obili
ty P
rogF
undi
ng0
48,5
000
00
048
,500
4359
2 - T
rans
it A
sset
Mai
nten
ance
FC00
036
Bldg
and
Fac
ility
Mai
nten
ance
30
1,00
0,00
01,
000,
000
01,
000,
000
03,
000,
000
Tota
l for
: 435
92 -
Tran
sit A
sset
Mai
nten
ance
01,
000,
000
1,00
0,00
00
1,00
0,00
00
3,00
0,00
0
Tota
l for
: 450
000
- FA
X D
epar
tmen
t9,
456,
500
52,9
28,5
004,
491,
000
12,4
10,0
004,
814,
900
13,2
30,0
0087
,874
,400
Pro
ject
N
ame
Dis
tric
t
Cap
ital
Proj
ects
FY 2
020
Estim
ate
2021
Cap
ital
Proj
ects
2022
Cap
ital
Proj
ects
2023
Cap
ital
Proj
ects
2024
Cap
ital
Proj
ects
2025
Cap
ital
Proj
ects
5 Ye
arPr
ojec
tTo
tal
FY 2020-2021 Capital Improvement Program by Department / Fund / Project
FY 2020-2021 Final Revised Budget C - 101

TH
IS P
AG
E W
AS
INT
EN
TIO
NA
LL
Y L
EF
T B
LA
NK
.
C - 102 FY 2020-2021 Final Revised Budget