Embed Size (px)
Citation preview

FISCAL YEAR MARCH 2018 THIRD QUARTER FINANCIAL RESULTS
1 Mazda Motor Corporation
Highlights
Fiscal Year March 2018 Nine Month Results
Fiscal Year March 2018 Full Year Forecast
Progress of Key Initiatives
PRESENTATION OUTLINE
2 Mazda Motor Corporation
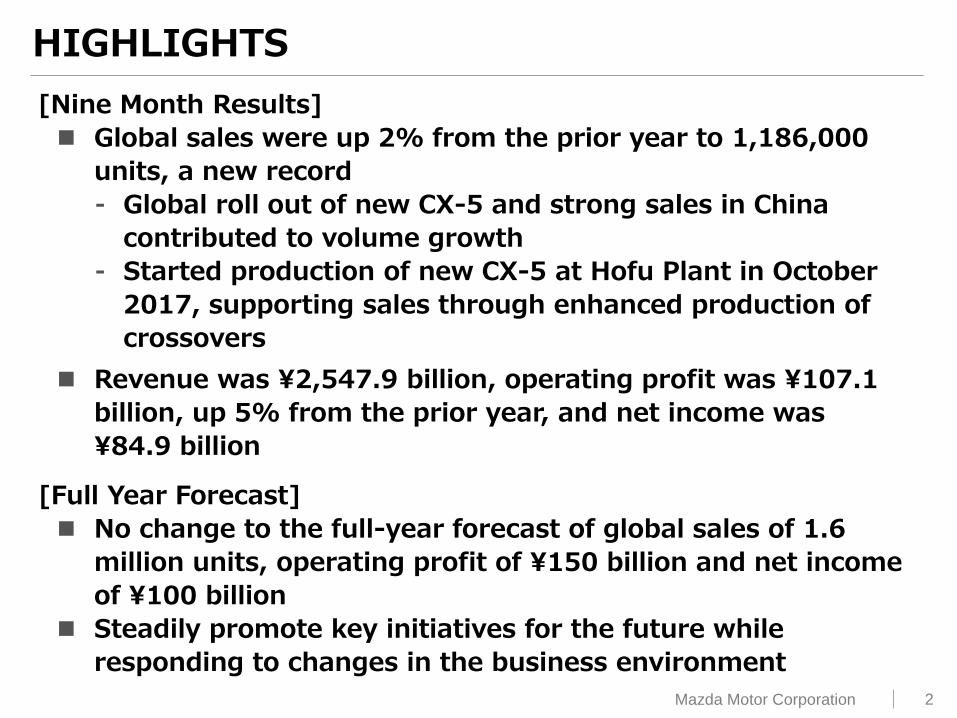
[Nine Month Results]
Global sales were up 2% from the prior year to 1,186,000
units, a new record
⁃ Global roll out of new CX-5 and strong sales in China
contributed to volume growth
⁃ Started production of new CX-5 at Hofu Plant in October
2017, supporting sales through enhanced production of
crossovers
Revenue was ¥2,547.9 billion, operating profit was ¥107.1
billion, up 5% from the prior year, and net income was
¥84.9 billion
[Full Year Forecast]
No change to the full-year forecast of global sales of 1.6
million units, operating profit of ¥150 billion and net income
of ¥100 billion
Steadily promote key initiatives for the future while
responding to changes in the business environment
HIGHLIGHTS
3 Mazda Motor Corporation
FISCAL YEAR MARCH 2018 NINE MONTH RESULTS
4 Mazda Motor Corporation
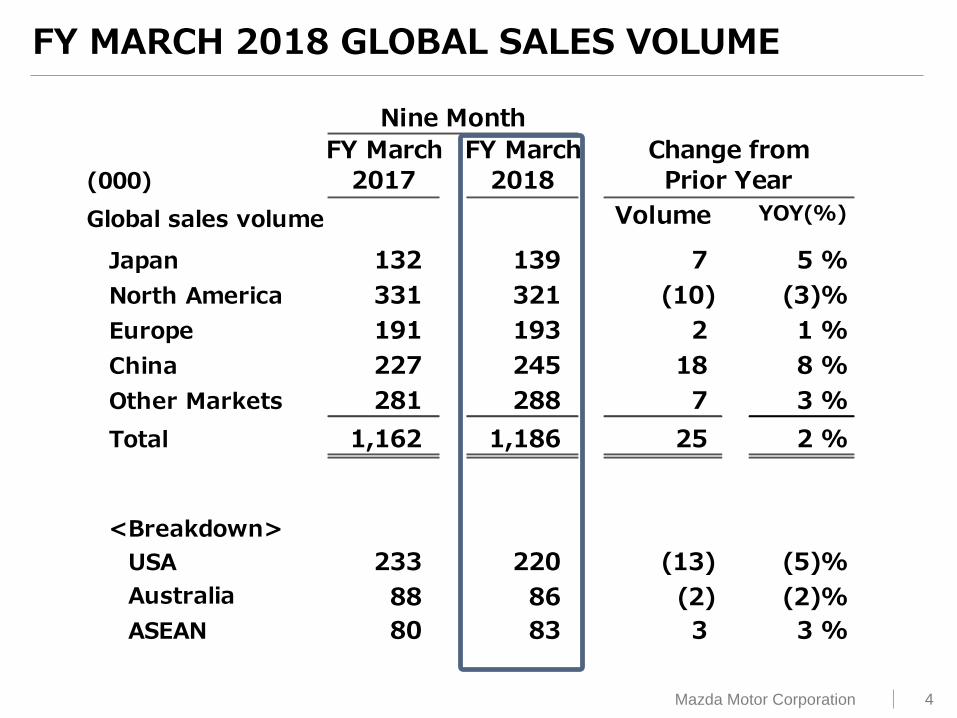
Nine Month
FY March FY March Change from
(000) 2017 2018 Prior Year
Global sales volume Volume YOY(%)
Japan 132 139 7 5 %
North America 331 321 (10) (3)%
Europe 191 193 2 1 %
China 227 245 18 8 %
Other Markets 281 288 7 3 %
Total 1,162 1,186 25 2 %
<Breakdown>
USA 233 220 (13) (5)%
Australia 88 86 (2) (2)%
ASEAN 80 83 3 3 %
FY MARCH 2018 GLOBAL SALES VOLUME
5 Mazda Motor Corporation
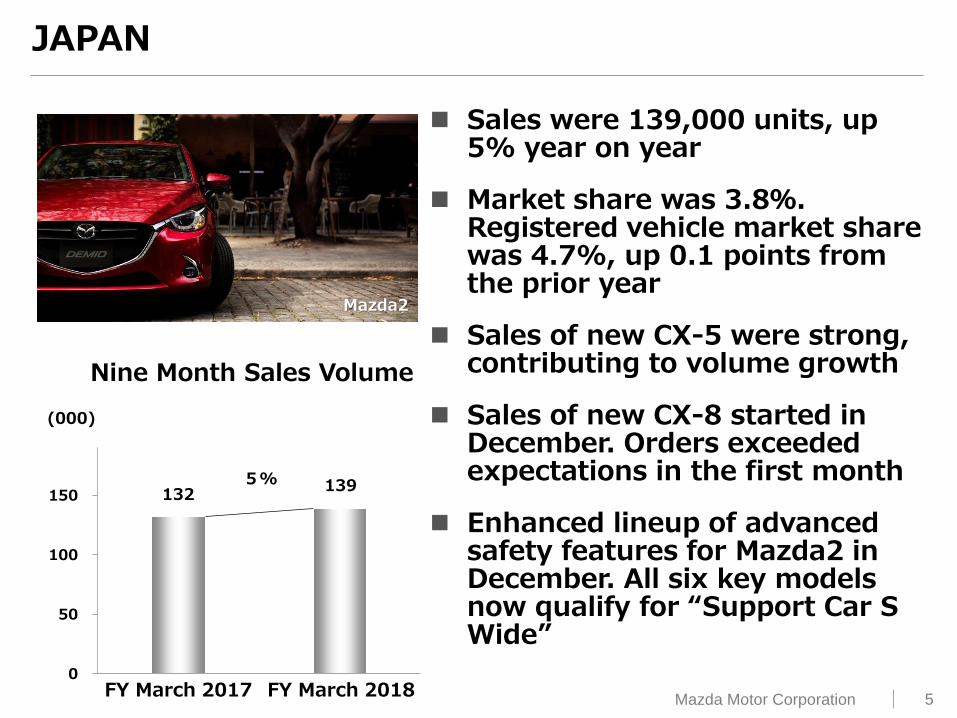
Nine Month Sales Volume
132 139
0
50
100
150
(000)
5%
FY March 2017 FY March 2018
Mazda2
JAPAN
Sales were 139,000 units, up 5% year on year
Market share was 3.8%. Registered vehicle market share was 4.7%, up 0.1 points from the prior year
Sales of new CX-5 were strong, contributing to volume growth
Sales of new CX-8 started in December. Orders exceeded expectations in the first month
Enhanced lineup of advanced safety features for Mazda2 in December. All six key models now qualify for “Support Car S Wide”
6 Mazda Motor Corporation
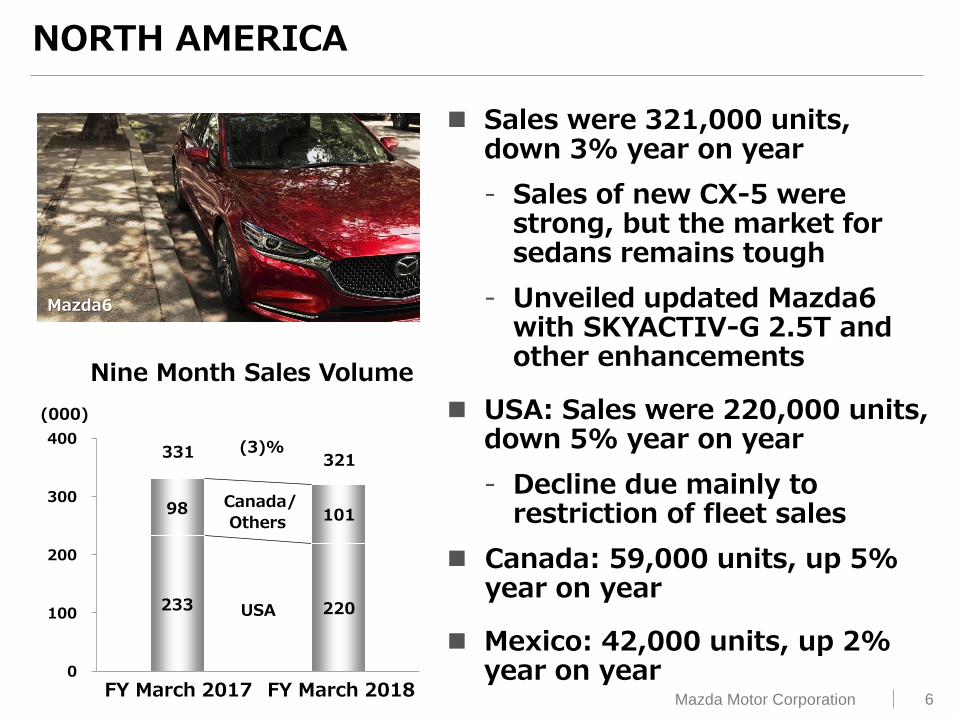
233 220
98 101
0
100
200
300
400(3)% 331
321
Canada/
Others
USA
Mazda6
Nine Month Sales Volume
(000)
FY March 2017 FY March 2018
NORTH AMERICA
Sales were 321,000 units, down 3% year on year
- Sales of new CX-5 were strong, but the market for sedans remains tough
- Unveiled updated Mazda6 with SKYACTIV-G 2.5T and other enhancements
USA: Sales were 220,000 units, down 5% year on year
- Decline due mainly to restriction of fleet sales
Canada: 59,000 units, up 5% year on year
Mexico: 42,000 units, up 2% year on year
7 Mazda Motor Corporation
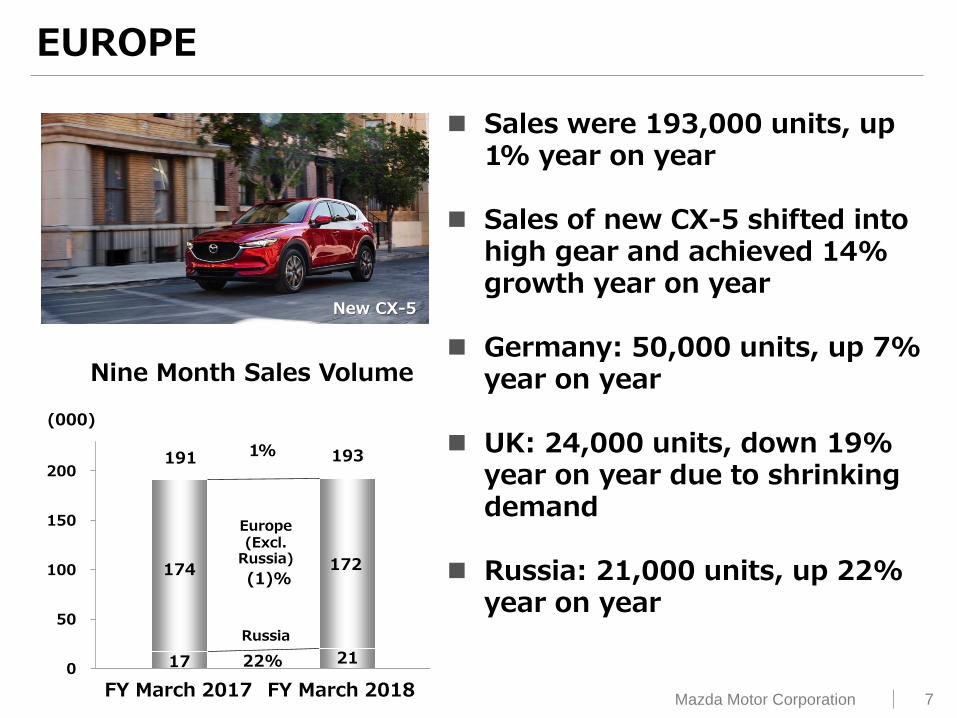
17 21
174 172
0
50
100
150
200191 193 1%
(1)%
22%
Europe (Excl.
Russia)
Russia
Nine Month Sales Volume
(000)
FY March 2017 FY March 2018
EUROPE
New CX-5
Sales were 193,000 units, up 1% year on year
Sales of new CX-5 shifted into high gear and achieved 14% growth year on year
Germany: 50,000 units, up 7% year on year
UK: 24,000 units, down 19% year on year due to shrinking demand
Russia: 21,000 units, up 22% year on year
8 Mazda Motor Corporation
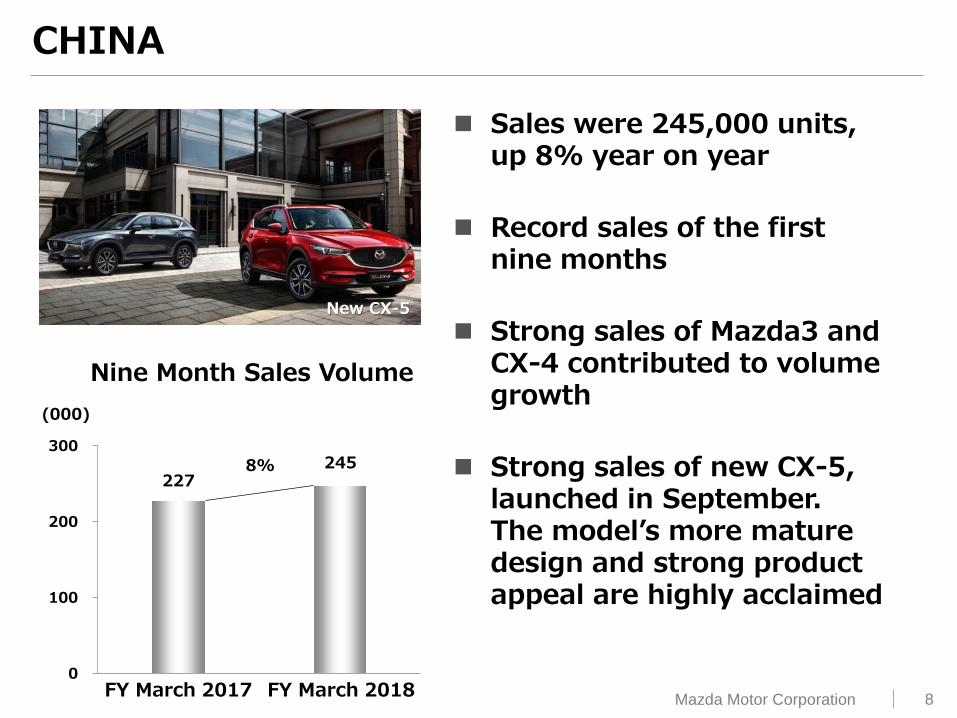
227 245
0
100
200
300
8%
Nine Month Sales Volume
(000)
FY March 2017 FY March 2018
CHINA
New CX-5
Sales were 245,000 units, up 8% year on year
Record sales of the first nine months
Strong sales of Mazda3 and CX-4 contributed to volume growth
Strong sales of new CX-5, launched in September. The model’s more mature design and strong product appeal are highly acclaimed
9 Mazda Motor Corporation
Mazda3
80 83
88 86
113 119
0
100
200
300281
288 3%
Other
Australia
ASEAN
Nine Month Sales Volume
(000)
FY March 2017 FY March 2018
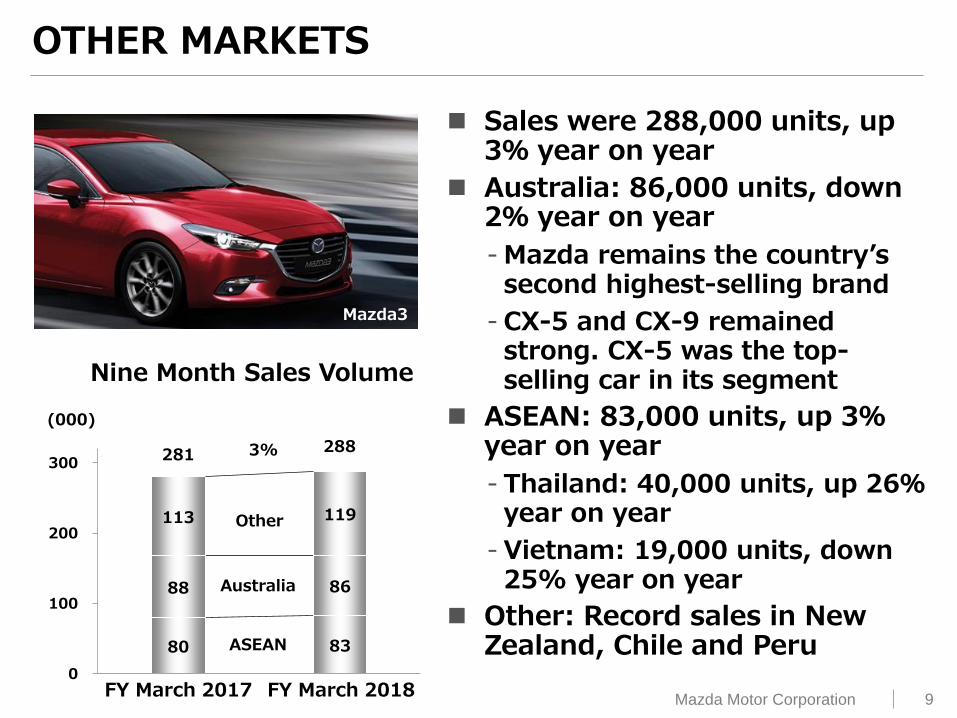
OTHER MARKETS
Sales were 288,000 units, up 3% year on year
Australia: 86,000 units, down 2% year on year
- Mazda remains the country’s second highest-selling brand
- CX-5 and CX-9 remained strong. CX-5 was the top-selling car in its segment
ASEAN: 83,000 units, up 3% year on year
- Thailand: 40,000 units, up 26% year on year
- Vietnam: 19,000 units, down 25% year on year
Other: Record sales in New Zealand, Chile and Peru

10 Mazda Motor Corporation
Nine Month
FY March FY March Change from
(Billion yen) 2017 2018 Prior Year
Amount YOY(%)
Revenue 2,348.6 2,547.9 199.3 8 %
Operating profit 102.0 107.1 5.1 5 %
Ordinary profit 117.9 134.8 16.9 14 %
Profit before tax 110.7 124.8 14.1 13 %
Net income 79.9 84.9 5.0 6 %0
4.3% 4.2% (0.1)pts
EPS (Yen) 133.7 139.8 6.1
Exchange rate (Yen)
US Dollar 107 112 5
Euro 118 129 11
Operating ROS
*
FY MARCH 2018 FINANCIAL METRICS
*Reflecting the increase in the number of shares issued due to the issuance of new shares by way of third-party allotment that payment was completed on Oct. 2, 2017.
11 Mazda Motor Corporation
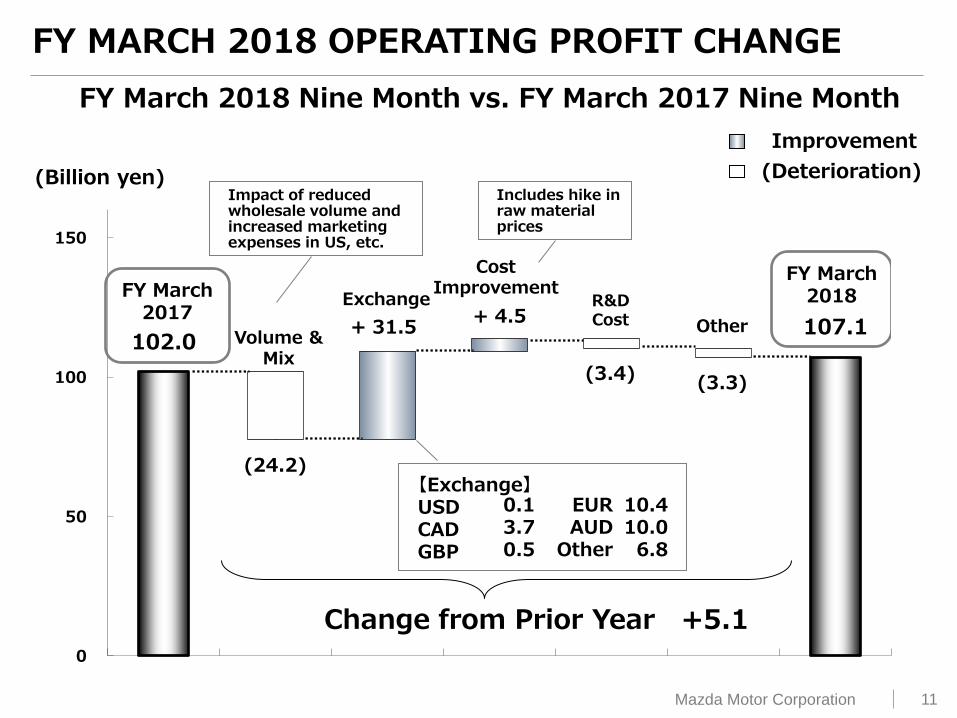
102.0
(24.2)
+ 31.5 + 4.5
(3.4) (3.3)
107.1
0
50
100
150
FY March 2018
Volume &
Mix
Exchange
Cost Improvement
Other
(Billion yen)
Change from Prior Year +5.1
(Deterioration)
Improvement
【Exchange】 USD CAD GBP
0.1 3.7 0.5
EUR AUD
Other
10.4 10.0
6.8
FY March 2017
R&D Cost
Impact of reduced wholesale volume and increased marketing expenses in US, etc.
Includes hike in raw material prices
FY MARCH 2018 OPERATING PROFIT CHANGE
FY March 2018 Nine Month vs. FY March 2017 Nine Month

12 Mazda Motor Corporation
FISCAL YEAR MARCH 2018 FULL YEAR FORECAST
13 Mazda Motor Corporation
11月公表
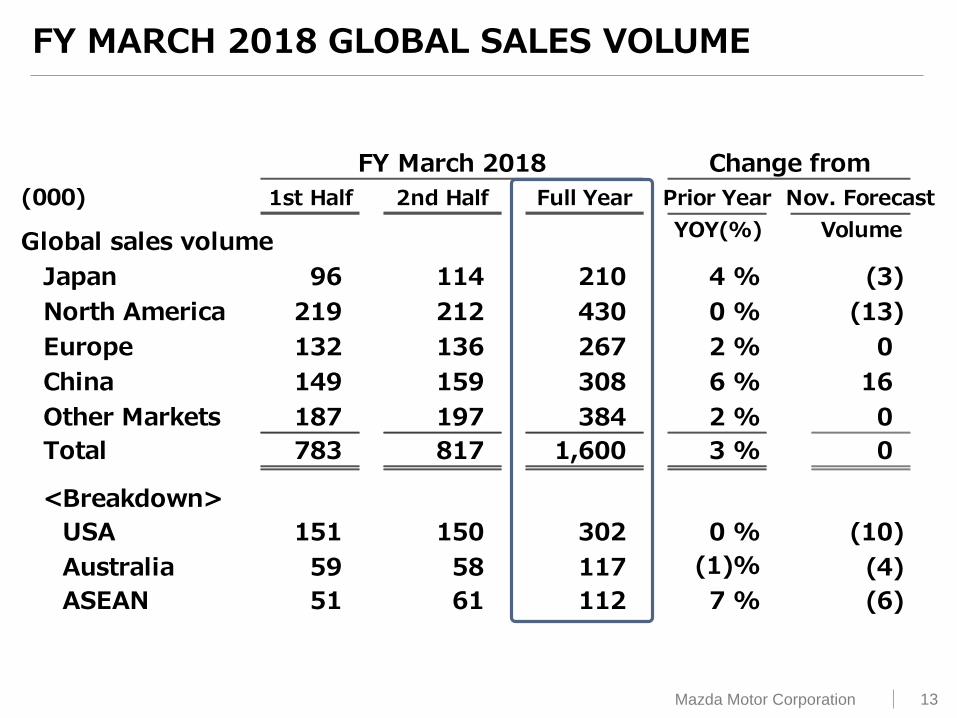
FY March 2018 2018年3月期
(000) 1st Half 2nd Half Full Year Prior Year Nov. Forecast
Global sales volumeYOY(%) Volume
Japan 96 114 210 4 % (3)
North America 219 212 430 0 % (13)
Europe 132 136 267 2 % 0
China 149 159 308 6 % 16
Other Markets 187 197 384 2 % 0
Total 783 817 1,600 3 % 0
<Breakdown>
USA 151 150 302 0 % (10)
Australia 59 58 117 (1)% (4)
ASEAN 51 61 112 7 % (6)
Change from
FY MARCH 2018 GLOBAL SALES VOLUME
14 Mazda Motor Corporation
7月公表
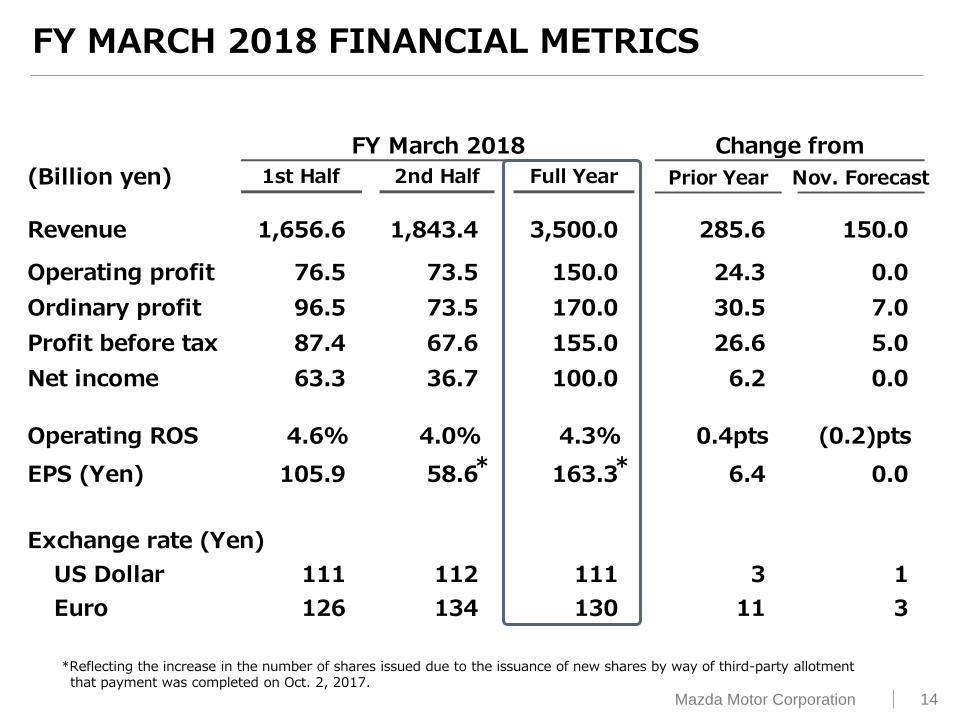
FY March 2018 Change from 2017年3月期
(Billion yen) 1st Half 2nd Half Full Year Prior Year Nov. Forecast
Revenue 1,656.6 1,843.4 3,500.0 285.6 150.0
Operating profit 76.5 73.5 150.0 24.3 0.0
Ordinary profit 96.5 73.5 170.0 30.5 7.0
Profit before tax 87.4 67.6 155.0 26.6 5.0
Net income 63.3 36.7 100.0 6.2 0.0
Operating ROS 4.6% 4.0% 4.3% 0.4pts (0.2)pts
EPS (Yen) 105.9 58.6 163.3 6.4 0.0
Exchange rate (Yen)
US Dollar 111 112 111 3 1
Euro 126 134 130 11 3
* *
FY MARCH 2018 FINANCIAL METRICS
*Reflecting the increase in the number of shares issued due to the issuance of new shares by way of third-party allotment that payment was completed on Oct. 2, 2017.

15 Mazda Motor Corporation
150.0
(2.0)
+ 5.0 + 0.0 + 0.0
(3.0)
150.0
100
150
Nov. Forecast
Feb. Forecast
【Exchange】 USD CAD GBP
0.9 1.5
1.7
2.5 1.2 (2.8)
EUR AUD
Other
(Billion yen)
Change from November Forecast 0.0
(Deterioration)
Improvement
Volume & Mix
Exchange
Cost Improvement
R&D Cost
Other
Impact of reduced wholesale volume and increased marketing expenses in US, etc.
FY MARCH 2018 OPERATING PROFIT CHANGE
FY March 2018 Full Year vs. November Forecast
16 Mazda Motor Corporation
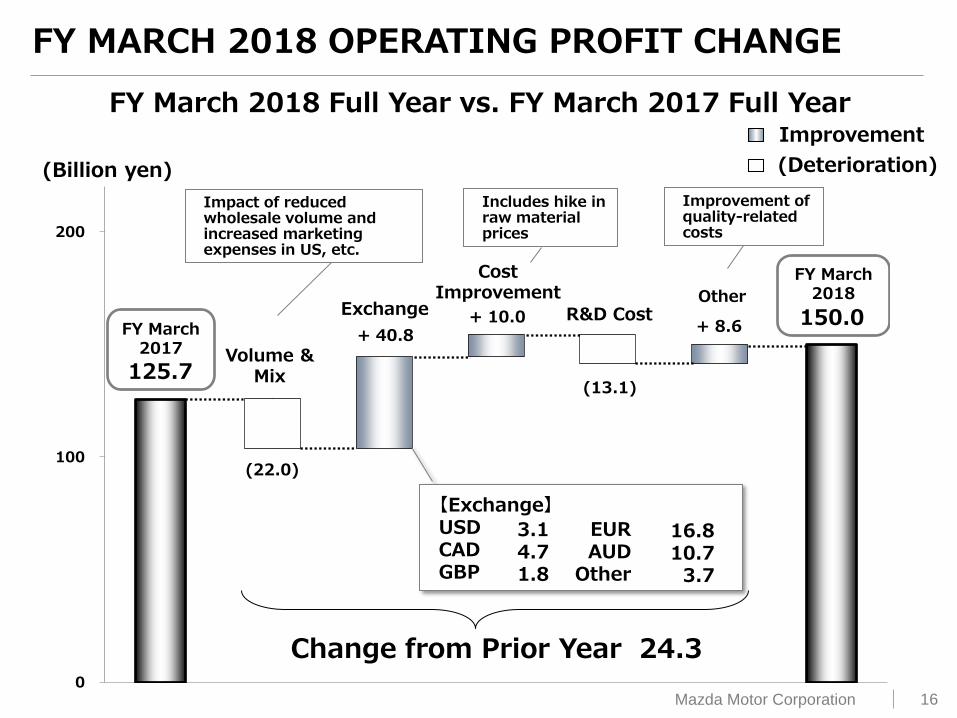
125.7
(22.0)
+ 40.8 + 10.0
(13.1)
+ 8.6 150.0
0
100
200
FY March 2017
FY March 2018
【Exchange】 USD CAD GBP
16.8 10.7
3.7
3.1 4.7 1.8
EUR AUD
Other
(Billion yen)
Change from Prior Year 24.3
(Deterioration)
Improvement
FY MARCH 2018 OPERATING PROFIT CHANGE
FY March 2018 Full Year vs. FY March 2017 Full Year
Volume & Mix
Exchange
Cost Improvement
R&D Cost Other
Impact of reduced wholesale volume and increased marketing expenses in US, etc.
Includes hike in raw material prices
Improvement of quality-related costs
17 Mazda Motor Corporation
PROGRESS OF KEY INITIATIVES
18 Mazda Motor Corporation
PROGRESS OF KEY INITIATIVES
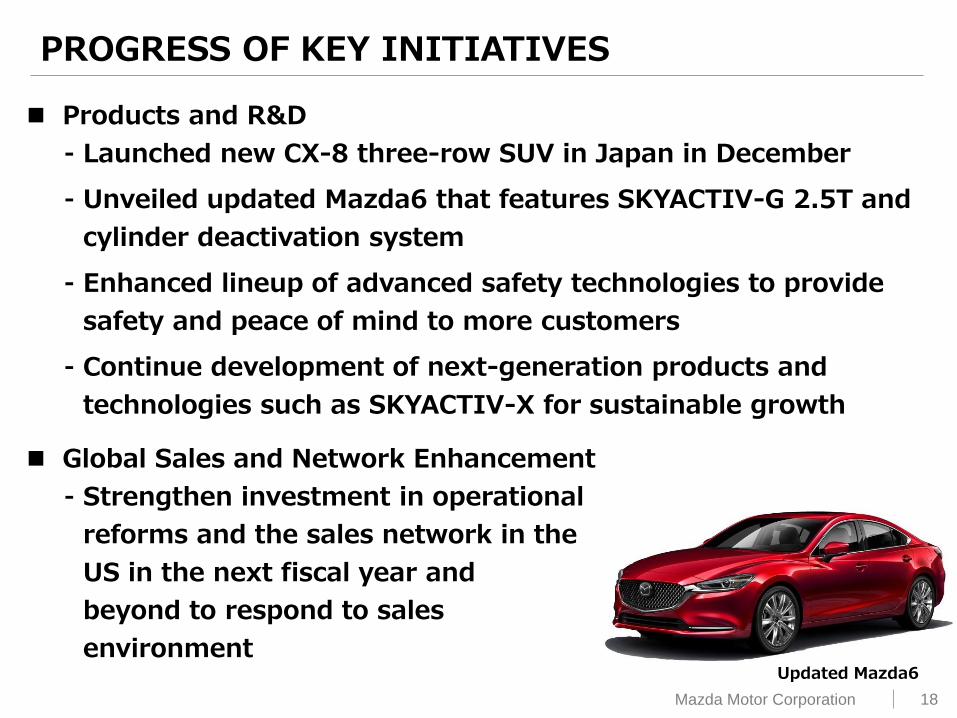
Updated Mazda6
Products and R&D
⁃ Launched new CX-8 three-row SUV in Japan in December
⁃ Unveiled updated Mazda6 that features SKYACTIV-G 2.5T and
cylinder deactivation system
⁃ Enhanced lineup of advanced safety technologies to provide
safety and peace of mind to more customers
⁃ Continue development of next-generation products and
technologies such as SKYACTIV-X for sustainable growth
Global Sales and Network Enhancement
⁃ Strengthen investment in operational
reforms and the sales network in the
US in the next fiscal year and
beyond to respond to sales
environment
19 Mazda Motor Corporation
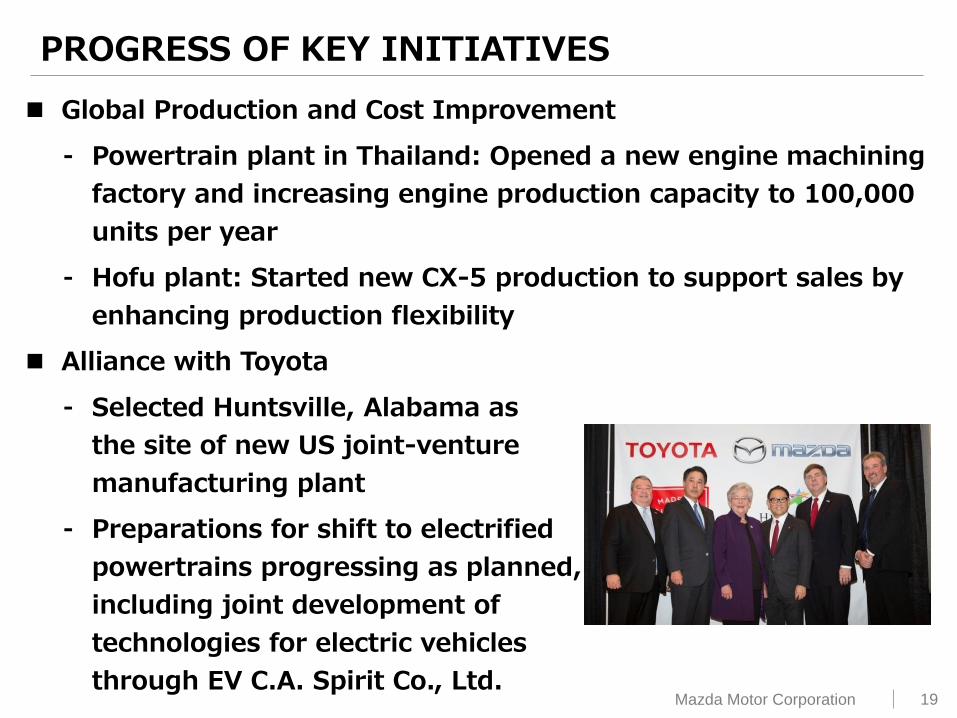
Global Production and Cost Improvement
⁃ Powertrain plant in Thailand: Opened a new engine machining
factory and increasing engine production capacity to 100,000
units per year
⁃ Hofu plant: Started new CX-5 production to support sales by
enhancing production flexibility
Alliance with Toyota
⁃ Selected Huntsville, Alabama as
the site of new US joint-venture
manufacturing plant
⁃ Preparations for shift to electrified
powertrains progressing as planned,
including joint development of
technologies for electric vehicles
through EV C.A. Spirit Co., Ltd.
PROGRESS OF KEY INITIATIVES
20 Mazda Motor Corporation
21 Mazda Motor Corporation
APPENDIX
22 Mazda Motor Corporation
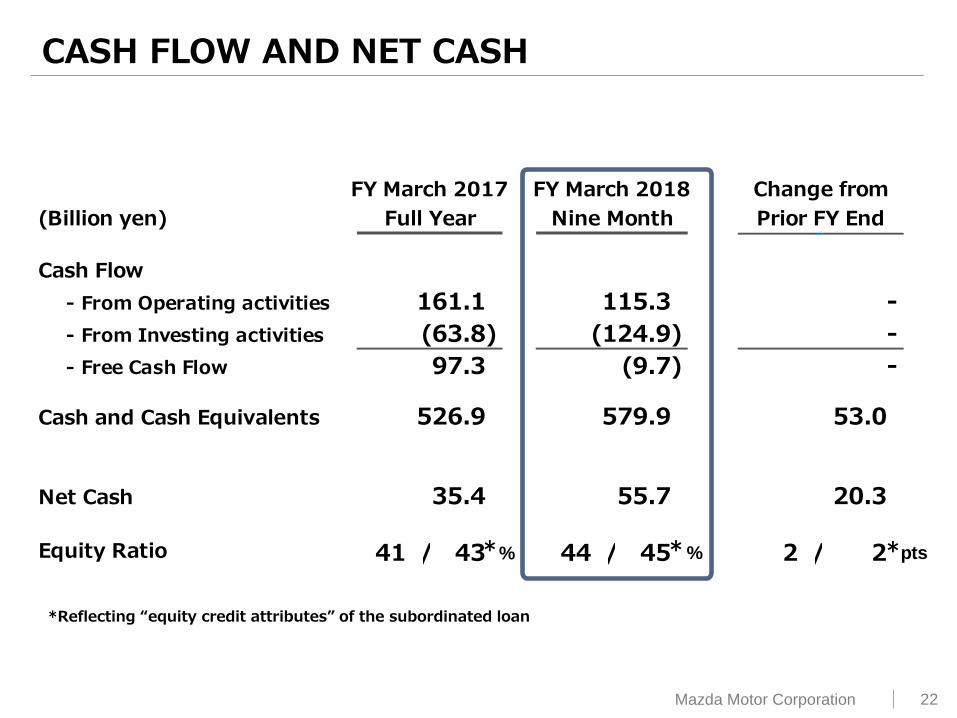
FY March 2017 FY March 2018 Change from
(Billion yen) Full Year Nine Month Prior FY End
Cash Flow
- From Operating activities
- From Investing activities
- Free Cash Flow
Cash and Cash Equivalents
Net Cash
41 / 43 44 / 45 2 / 2Equity Ratio
579.9
55.7
161.1
(63.8)
97.3
526.9
35.4
53.0
20.3
115.3
(124.9)
(9.7)
-
-
-
% % pts* * *
CASH FLOW AND NET CASH
*Reflecting “equity credit attributes” of the subordinated loan
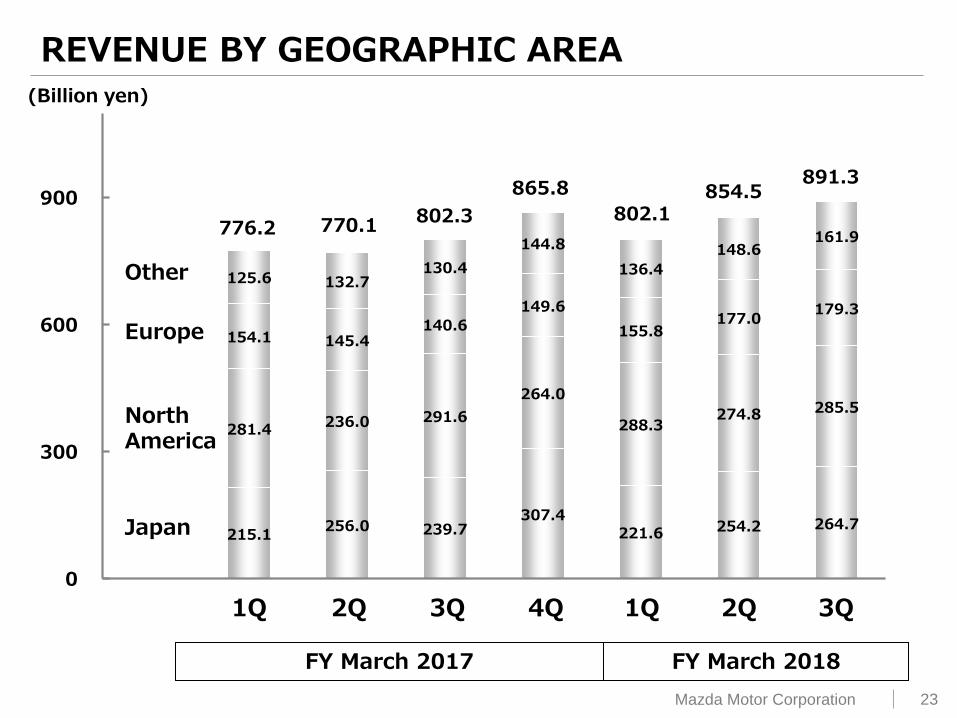
23 Mazda Motor Corporation
215.1 256.0 239.7
307.4 221.6 254.2 264.7
281.4 236.0 291.6
264.0
288.3 274.8 285.5
154.1 145.4 140.6
149.6
155.8 177.0
179.3
125.6 132.7 130.4
144.8
136.4
148.6 161.9
0
300
600
900802.3
770.1 776.2 802.1
854.5 891.3
Japan
North America
Europe
Other
865.8
1Q 2Q 3Q 4Q 1Q 2Q 3Q
REVENUE BY GEOGRAPHIC AREA
FY March 2018 FY March 2017
(Billion yen)
24 Mazda Motor Corporation
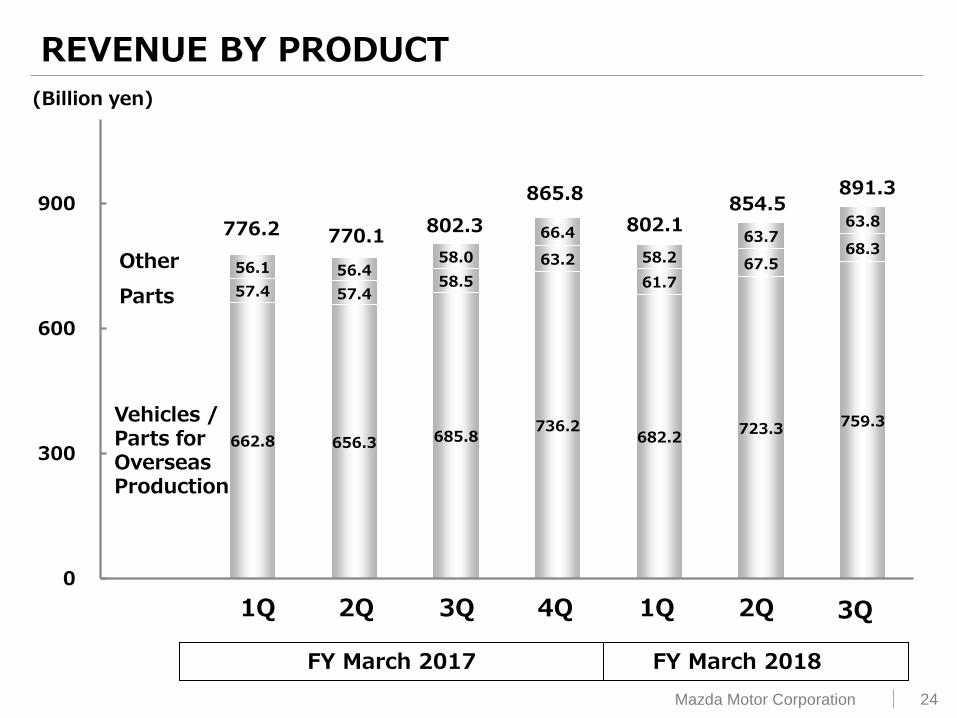
662.8 656.3 685.8 736.2
682.2 723.3
759.3
57.4 57.4 58.5
63.2
61.7 67.5
68.3
56.1 56.4 58.0
66.4
58.2
63.7 63.8
0
300
600
900
776.2 770.1
Parts
Other
Vehicles / Parts for Overseas Production
1Q 2Q 3Q 4Q 1Q
802.3
865.8
802.1 854.5
2Q
891.3
3Q
REVENUE BY PRODUCT
FY March 2018 FY March 2017
(Billion yen)
25 Mazda Motor Corporation
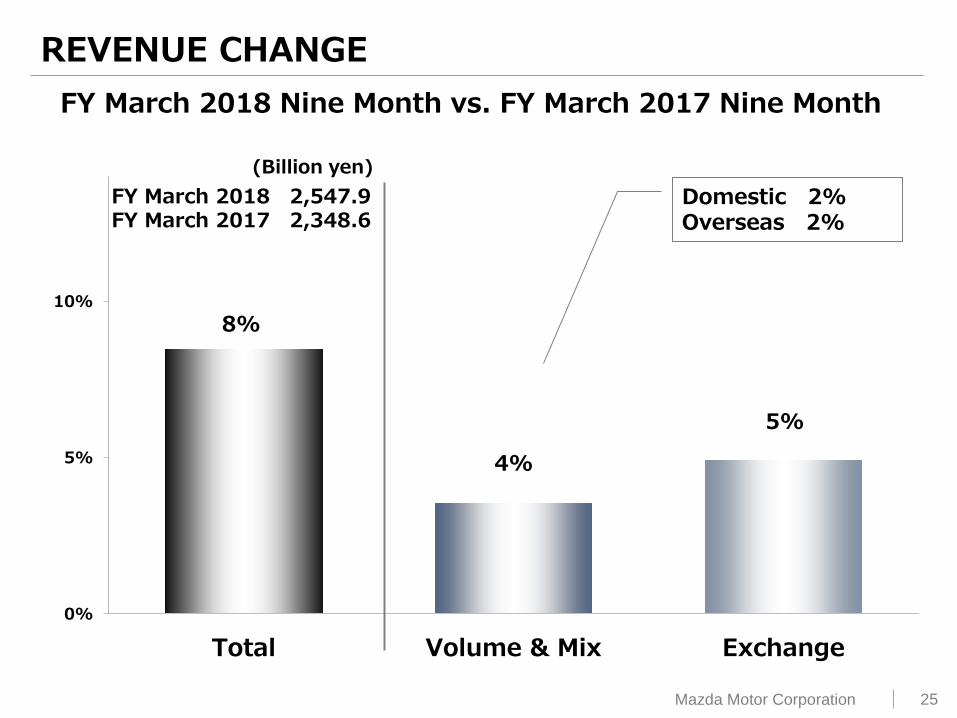
8%
4%
5%
0%
5%
10%
Total Volume & Mix Exchange
FY March 2018 2,547.9 FY March 2017 2,348.6
(Billion yen)
REVENUE CHANGE
FY March 2018 Nine Month vs. FY March 2017 Nine Month
Domestic 2% Overseas 2%
26 Mazda Motor Corporation
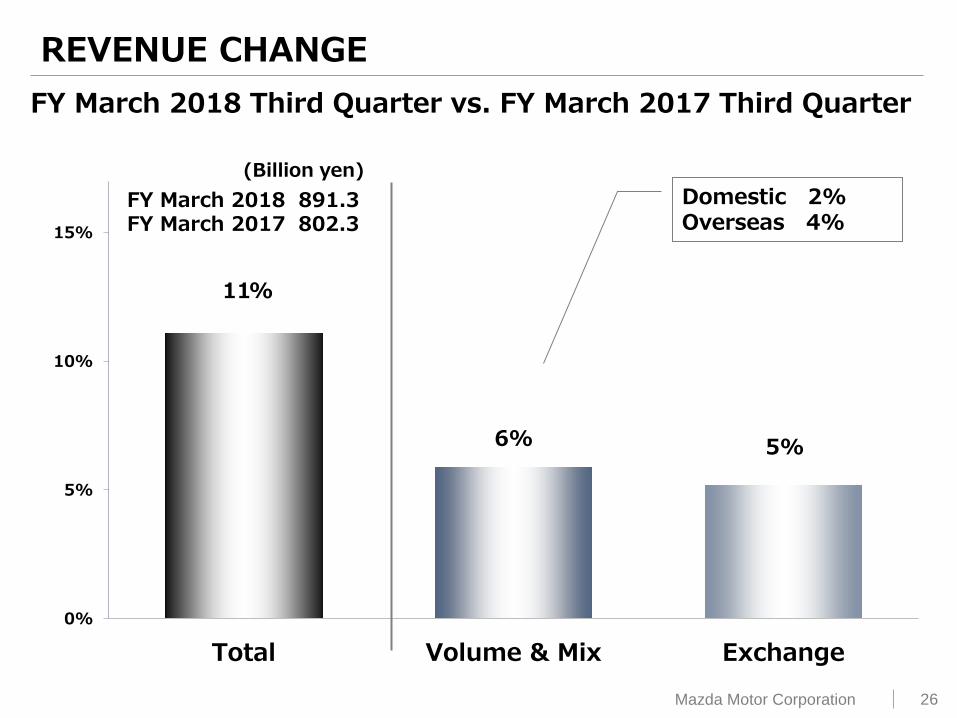
11%
6% 5%
0%
5%
10%
15%
Total Volume & Mix Exchange
(Billion yen)
FY March 2018 891.3 FY March 2017 802.3
REVENUE CHANGE
FY March 2018 Third Quarter vs. FY March 2017 Third Quarter
Domestic 2% Overseas 4%
27 Mazda Motor Corporation
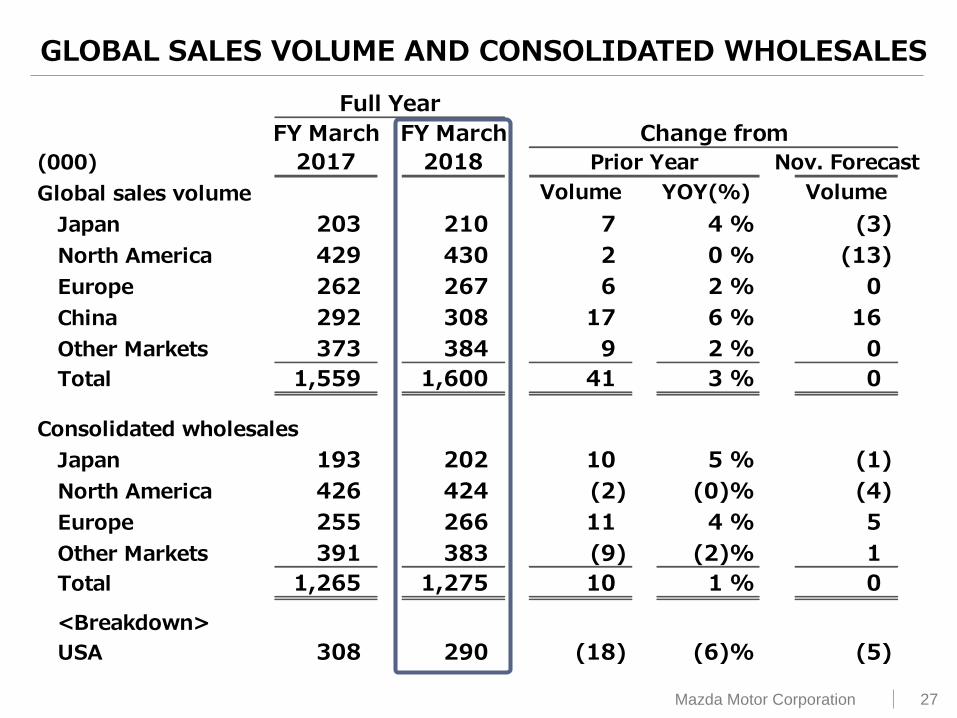
11月公表
FY March FY March 2018年3月期
(000) 2017 2018 Prior Year Nov. Forecast
Global sales volume Volume YOY(%) Volume
Japan 203 210 7 4 % (3)
North America 429 430 2 0 % (13)
Europe 262 267 6 2 % 0
China 292 308 17 6 % 16
Other Markets 373 384 9 2 % 0
Total 1,559 1,600 41 3 % 0
Consolidated wholesales
Japan 193 202 10 5 % (1)
North America 426 424 (2) (0)% (4)
Europe 255 266 11 4 % 5
Other Markets 391 383 (9) (2)% 1
Total 1,265 1,275 10 1 % 0
<Breakdown>
USA 308 290 (18) (6)% (5)
Full Year
Change from
GLOBAL SALES VOLUME AND CONSOLIDATED WHOLESALES
28 Mazda Motor Corporation
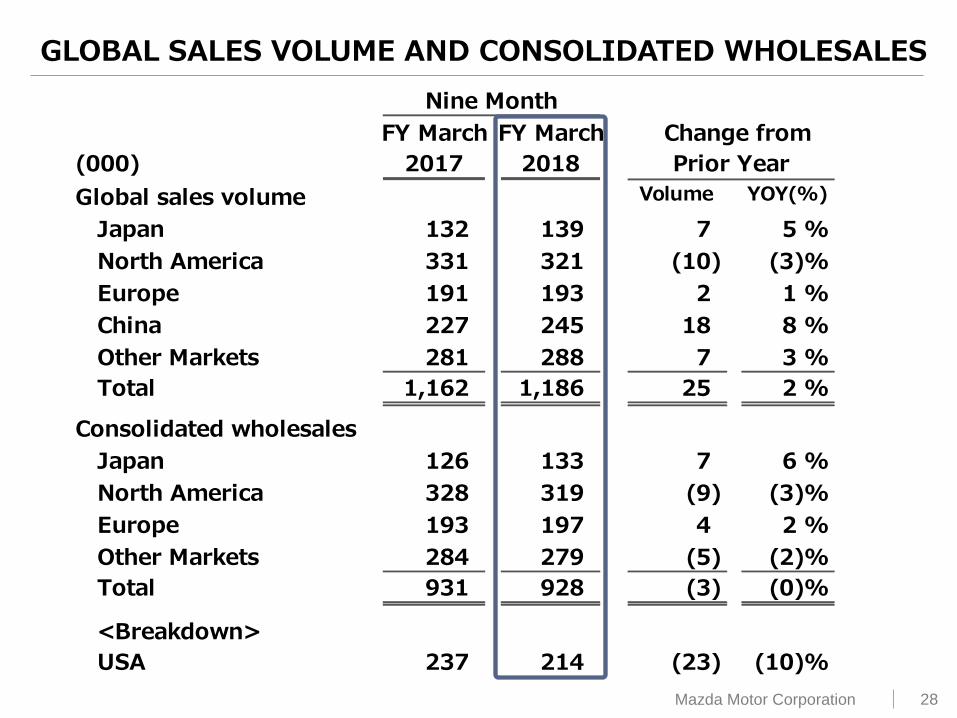
GLOBAL SALES VOLUME AND CONSOLIDATED WHOLESALES
Nine Month
FY March FY March Change from
(000) 2017 2018 Prior Year
Global sales volume Volume YOY(%)
Japan 132 139 7 5 %
North America 331 321 (10) (3)%
Europe 191 193 2 1 %
China 227 245 18 8 %
Other Markets 281 288 7 3 %
Total 1,162 1,186 25 2 %
Consolidated wholesales
Japan 126 133 7 6 %
North America 328 319 (9) (3)%
Europe 193 197 4 2 %
Other Markets 284 279 (5) (2)%
Total 931 928 (3) (0)%
<Breakdown>
USA 237 214 (23) (10)%
29 Mazda Motor Corporation
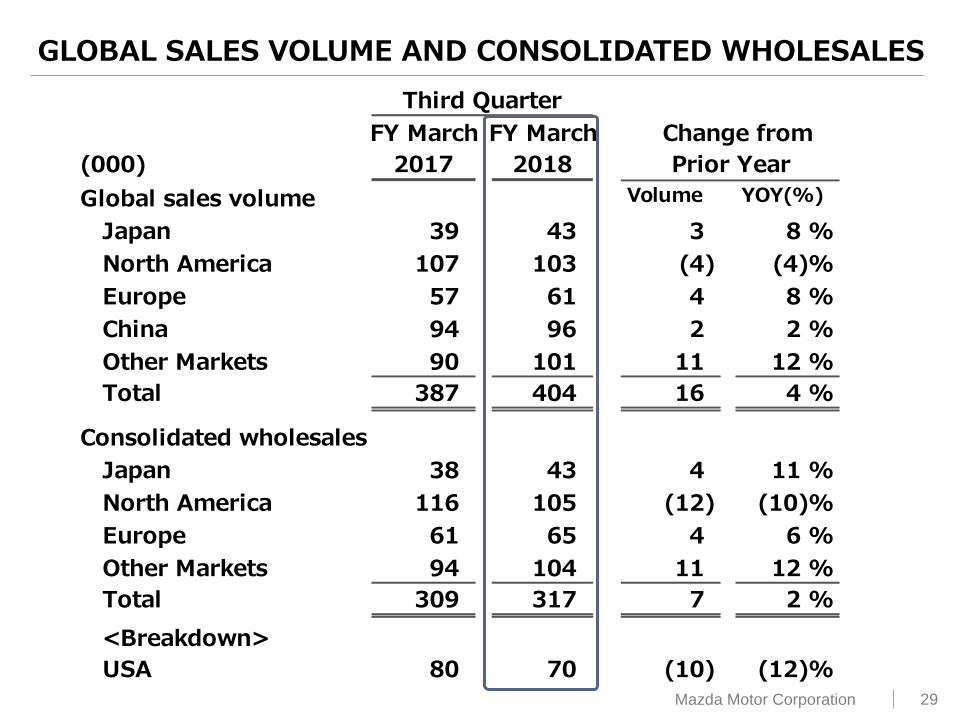
GLOBAL SALES VOLUME AND CONSOLIDATED WHOLESALES
Third Quarter
FY March FY March Change from
(000) 2017 2018 Prior Year
Global sales volume Volume YOY(%)
Japan 39 43 3 8 %
North America 107 103 (4) (4)%
Europe 57 61 4 8 %
China 94 96 2 2 %
Other Markets 90 101 11 12 %
Total 387 404 16 4 %
Consolidated wholesales
Japan 38 43 4 11 %
North America 116 105 (12) (10)%
Europe 61 65 4 6 %
Other Markets 94 104 11 12 %
Total 309 317 7 2 %
<Breakdown>
USA 80 70 (10) (12)%
30 Mazda Motor Corporation
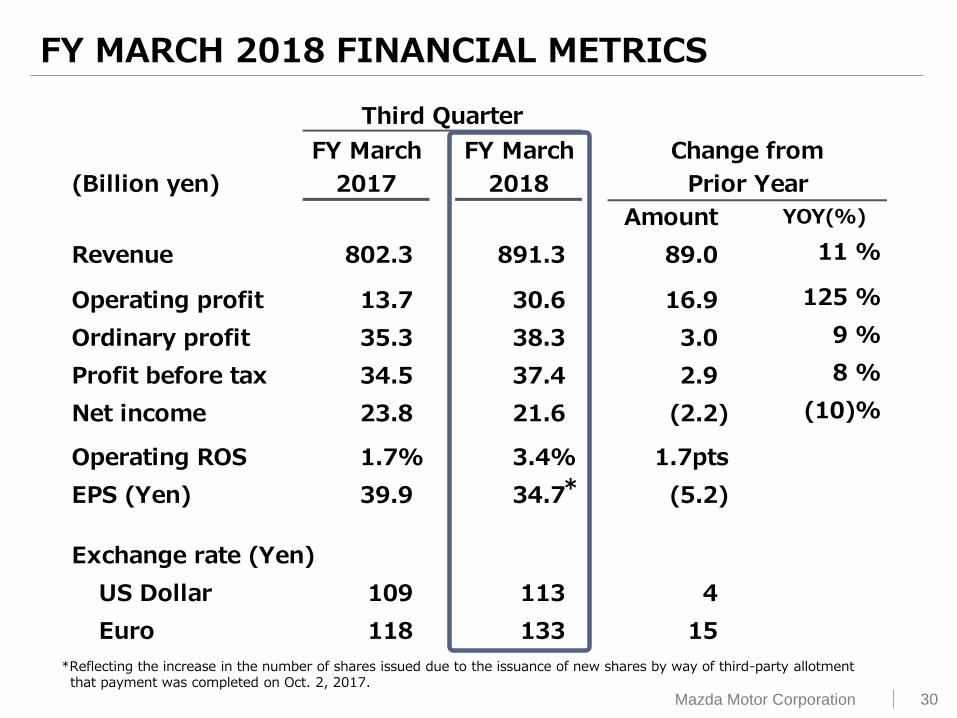
Third Quarter
FY March FY March Change from
(Billion yen) 2017 2018 Prior Year
Amount YOY(%)
Revenue 802.3 891.3 89.0 11 %
Operating profit 13.7 30.6 16.9 125 %
Ordinary profit 35.3 38.3 3.0 9 %
Profit before tax 34.5 37.4 2.9 8 %
Net income 23.8 21.6 (2.2) (10)%0
1.7% 3.4% 1.7pts
EPS (Yen) 39.9 34.7 (5.2)
Exchange rate (Yen)
US Dollar 109 113 4
Euro 118 133 15
Operating ROS
*
FY MARCH 2018 FINANCIAL METRICS
*Reflecting the increase in the number of shares issued due to the issuance of new shares by way of third-party allotment that payment was completed on Oct. 2, 2017.
31 Mazda Motor Corporation
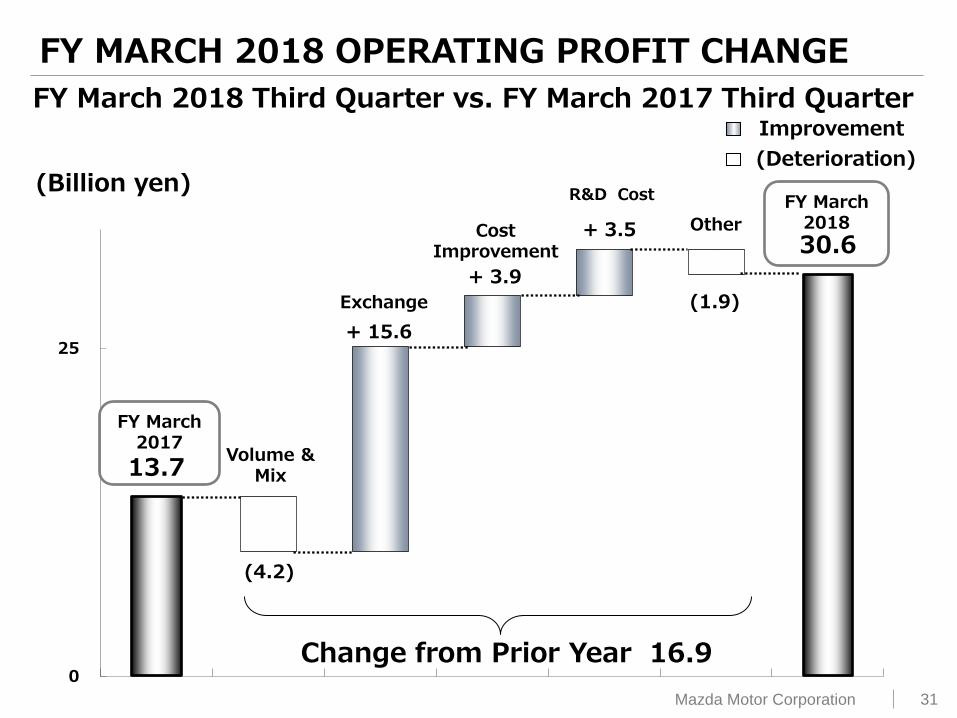
13.7
(4.2)
+ 15.6
+ 3.9
+ 3.5
(1.9)
30.6
0
25
FY March 2017
R&D Cost (Billion yen)
Change from Prior Year 16.9
(Deterioration)
Improvement
FY MARCH 2018 OPERATING PROFIT CHANGE
FY March 2018 Third Quarter vs. FY March 2017 Third Quarter
Volume & Mix
Exchange
Cost Improvement
Other
FY March 2018

32 Mazda Motor Corporation
FY March 2017 FY March 2018Prior
Year
Nov.
Forecast
(Yen) 1st Half 2nd Half Full Year 1st Half 2nd Half Full Year Full Year Full Year
US Dollar 105 112 108 111 112 111 3 1
Euro 118 119 119 126 134 130 11 3
Canadian Dollar 81 84 83 86 88 87 4 1
Australian Dollar 79 84 82 86 87 86 4 0
British Pound 144 138 142 144 151 147 5 5
Change from
EXCHANGE RATES
33 Mazda Motor Corporation
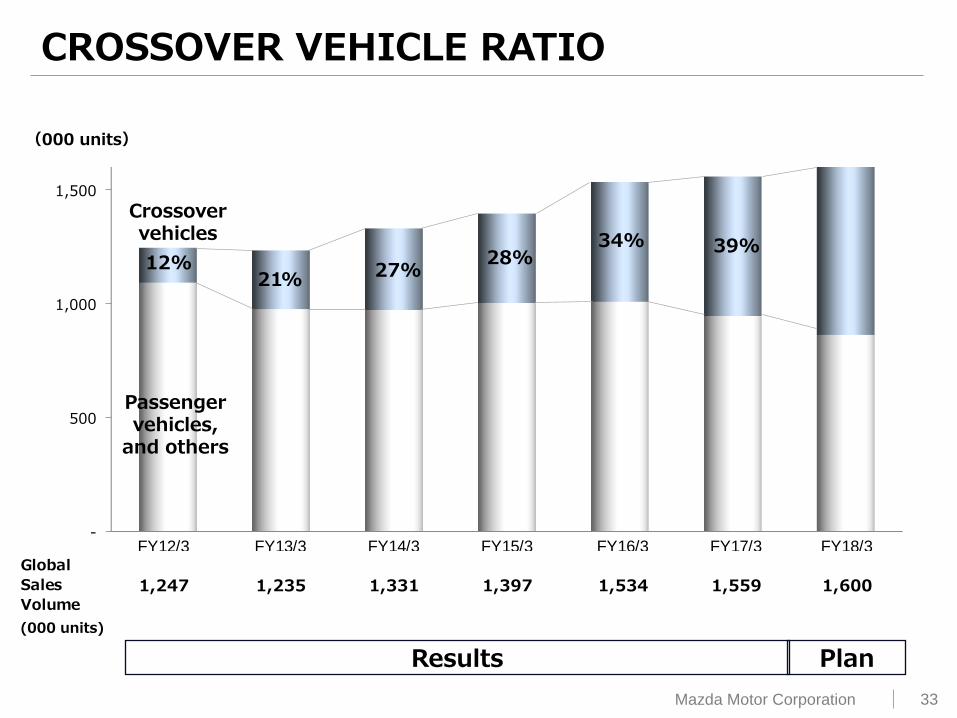
-
500
1,000
1,500
12%
Plan Results
27% 21%
28% 34% 39%
FY12/3 FY13/3 FY14/3 FY15/3 FY16/3 FY17/3 FY18/3Global
Sales
Volume
1,247 1,235 1,331 1,397 1,534 1,559 1,600
CROSSOVER VEHICLE RATIO
(000 units)
Crossover vehicles
Passenger vehicles,
and others
(000 units)
34 Mazda Motor Corporation
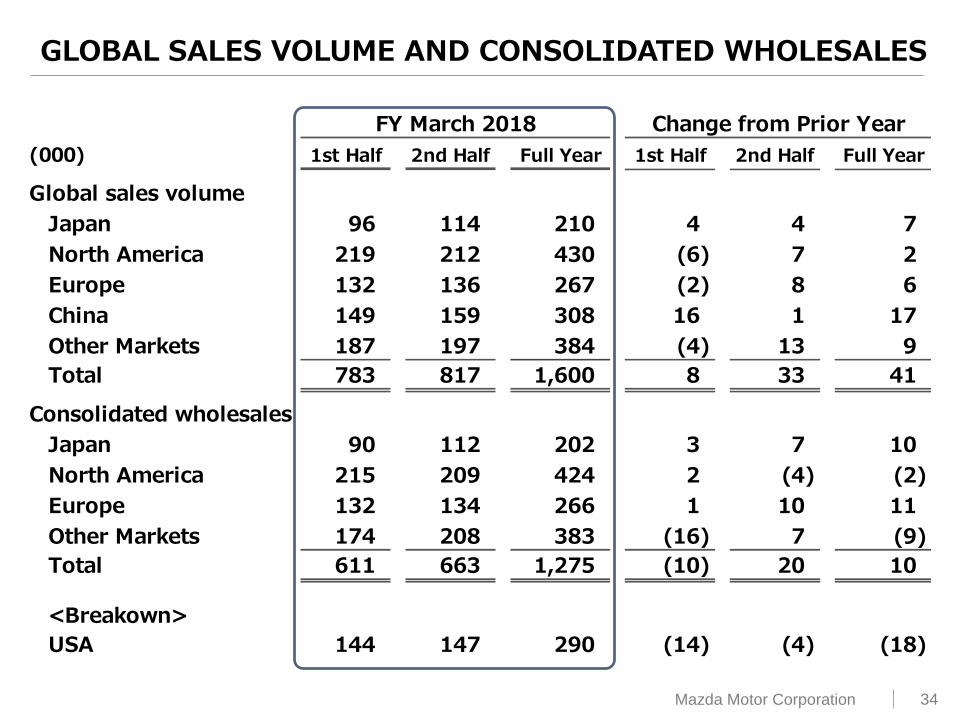
FY March 2018 Change from Prior Year
(000) 1st Half 2nd Half Full Year 1st Half 2nd Half Full Year
Global sales volume
Japan 96 114 210 4 4 7
North America 219 212 430 (6) 7 2
Europe 132 136 267 (2) 8 6
China 149 159 308 16 1 17
Other Markets 187 197 384 (4) 13 9
Total 783 817 1,600 8 33 41
Consolidated wholesales
Japan 90 112 202 3 7 10
North America 215 209 424 2 (4) (2)
Europe 132 134 266 1 10 11
Other Markets 174 208 383 (16) 7 (9)
Total 611 663 1,275 (10) 20 10
<Breakown>
USA 144 147 290 (14) (4) (18)
GLOBAL SALES VOLUME AND CONSOLIDATED WHOLESALES

35 Mazda Motor Corporation
60.4 66.4 60.1 64.8
93.8 97.2
0
50
100
150
(Billion yen)
120.0
82.4 87.0
126.9
140.0
94.4
KEY DATA
Full Year
Nine Month
Full Year
Nine Month
Full Year
Nine Month
FY March 2017
FY March 2018
FY March 2017
FY March 2018
FY March 2017
FY March 2018
Capital Expenditures
Depreciation Cost
R&D Cost

36 Mazda Motor Corporation
DIVIDEND PAYMENT
FY March 2014 FY March 2015 FY March 2016 FY March 2017 FY March 2018
15 15 15 10
15 20 20
Trend of dividends per share
Interim dividendsYear-end dividends
35
30
10
1
(Plan)
35
Plan Results
Note) A share consolidation was implemented on common stock with a ratio of five shares to one share on August 1, 2014. Dividends per share represent actual amounts applicable to the respective years.

37 Mazda Motor Corporation
DISCLAIMER
The projections and future strategies shown in this presentation are based on various uncertainties including without limitation the conditions of the world economy in the future, the trend of the automotive industry and the risk of exchange-rate fluctuations. So, please be aware that Mazda's actual performance may differ substantially from the projections.
If you are interested in investing in Mazda, you are requested to make a final investment decision at your own risk, taking the foregoing into consideration. Please note that neither Mazda nor any third party providing information shall be responsible for any damage you may suffer due to investment in Mazda based on the information shown in this presentation.