Embed Size (px)
Citation preview

SCOTTISH ENVIRONMENT PROTECTION AGENCY Section No.: Fish Farm-AH Page no: 1 of 140
Regulation and Monitoring of Marine Cage Fish Farming in Scotland Issue No: 2.3 Annex H Issue date: 18 May 2005
Methods for Modelling In-feed Anti-parasitics and Benthic effects Originators: Alan Hills/Jeremy Spurway /Susan Brown/Chris Cromey
Issued by: Quality Manager Authorised by: Aquaculture Project
Management Group
UNCONTROLLED COPY IF PRINTED Printed: 7 June, 2005
CONTENTS
CONTENTS 1
H:1 SCOPE 7
H:2 INTRODUCTION 8
H:2.1 Background 8 H:2.1.1 Sea lice and Anti-parasitic Chemicals 8 H:2.1.2 Particulate material 9 H:2.1.3 Prediction of Impact – Sea lice and Anti-parasitic Chemicals 9 H:2.1.4 Prediction of Impact – Particulate material 10 H:2.1.5 Model Development - Anti-parasitic Chemicals 11 H:2.1.6 Model Development – Particulate waste material and benthic effects 12
H:2.2 Modelled component characteristics 13 H:2.2.1 Calicide 13 H:2.2.2 SLICE 13 H:2.2.3 Particulate waste material and benthic effects 14
H:2.3 Model Software 15
H:2.4 Assessment and Consent Strategy 15 H:2.4.1 Anti-parasitic Chemicals 15 H:2.4.2 Particulate material and benthic effects 15
H:2.5 Feed Load Profiles 19 H:2.5.1 Anti-parasitic chemicals 19 H:2.5.2 Particulate material and benthic effects 19
H:2.6 Environmental Quality Standards and Allowable Zones of Effect – Anti-parasitic chemicals 19
H:2.6.1 Near-field and far-field AZE 20
H:2.7 Data Preparation Tools 21
H:3 METHOD OVERVIEW – ANTI-PARASITIC CHEMICALS 23
H:3.1 Determination of model domain 23
H:3.2 Determination of model resolution 23

SCOTTISH ENVIRONMENT PROTECTION AGENCY Section No.: Fish Farm-AH Page no: 2 of 140
Regulation and Monitoring of Marine Cage Fish Farming in Scotland Issue No: 2.3 Annex H Issue date: 18 May 2005
Methods for Modelling In-feed Anti-parasitics and Benthic effects Originators: Alan Hills/Jeremy Spurway /Susan Brown/Chris Cromey
Issued by: Quality Manager Authorised by: Aquaculture Project
Management Group
UNCONTROLLED COPY IF PRINTED Printed: 7 June, 2005
H:3.3 Preparation of Cage Positions 23
H:3.4 Preparation of Bathymetry 24 H:3.4.1 C-MAP 24 H:3.4.2 CM93-Extract 24 H:3.4.3 Surfer 24 H:3.4.4 Procedure 24
H:3.5 Preparation of Hydrographic Data 25
H:3.6 Calculation of Chemical Loads 25 H:3.6.1 Calicide 26 H:3.6.2 SLICE 27
H:3.7 Testing Model Results 30 H:3.7.1 Compliance testing 30 H:3.7.2 Establishing “worst case” tidal conditions 31 H:3.7.3 Mass balance 31
H:3.8 Reported Model Output 31
H:3.9 Report structure 32 H:3.9.1 Method Report 33 H:3.9.2 Technical Summary 33
H:3.10 Summary of Required Information 33
H:4 AUTODEPOMOD – ALL METHODS 34
H:4.1 Structure of the Following Sections 34
H:4.2 The Principles of AUTODEPOMOD 34
H:4.3 Recommended Installation Requirements (Please Read Closely) 35
H:4.4 Recommended Installation Location (Please Read Closely) 36
H:4.5 Interfacing AUTODEPOMOD with Cm93Extract 36
H:4.6 Computer Performance Requirements 37
H:5 USING AUTODEPOMOD TO ESTIMATE CONSENT LIMITS FOR ANTI-PARASITIC CHEMICALS 38
H:5.1 Overview of AUTODEPOMOD File Structure 38

SCOTTISH ENVIRONMENT PROTECTION AGENCY Section No.: Fish Farm-AH Page no: 3 of 140
Regulation and Monitoring of Marine Cage Fish Farming in Scotland Issue No: 2.3 Annex H Issue date: 18 May 2005
Methods for Modelling In-feed Anti-parasitics and Benthic effects Originators: Alan Hills/Jeremy Spurway /Susan Brown/Chris Cromey
Issued by: Quality Manager Authorised by: Aquaculture Project
Management Group
UNCONTROLLED COPY IF PRINTED Printed: 7 June, 2005
H:5.2 Model Grid Generation 42
H:5.3 Key Modelling Concepts Relating to AUTODEPOMOD 58 H:5.3.1 Particle Numbers 58 H:5.3.2 The Principle of Running AUTODEPOMOD to Achieve EQS Compliance 59 H:5.3.3 The Binary Search Method for Slice and Calicide 59 H:5.3.4 The Binary Search, with Accuracy Offset, Method. 60
H:5.4 Slice Consent Limit Assessment 61
H:5.5 Calicide Consent Limit Assessment 70
H:5.6 Blanking File Use 72
H:5.7 Surfer Grid Results File Naming Convention 75
H:6 REPORTING OF CONSENT LIMIT ASSESSMENT RESULTS – ANTI-PARASITIC CHEMICALS 76
H:6.1 Summary of Application Procedure 76
H:6.2 Consideration of Mass Balance 78 H:6.2.1 Mass Balance Calculation for Slice 78 H:6.2.2 Mass Balance Calculation for Calicide 78 H:6.2.3 Brief Guidance on Fate Assessment 79
H:6.3 Blanking File Use - Reporting 79
H:6.4 The Collation of Modelling Results 79
H:6.5 Submission of Information for Assessment of Modelling Work 82
H:7 USING AUTODEPOMOD TO ESTIMATE BIOMASS CONSENT LIMITS 83
H:7.1 Creating a new project and getting started 83
H:7.2 Grid and Cage Setup page 84
H:7.3 Model parameters page 85 H:7.3.1 Summary of dialog settings described previously 85 H:7.3.2 Benthic parameters page 86 H:7.3.3 Site Defaults 91 H:7.3.4 Faecal and feed properties 96
SCOTTISH ENVIRONMENT PROTECTION AGENCY Section No.: Fish Farm-AH Page no: 4 of 140
Regulation and Monitoring of Marine Cage Fish Farming in Scotland Issue No: 2.3 Annex H Issue date: 18 May 2005
Methods for Modelling In-feed Anti-parasitics and Benthic effects Originators: Alan Hills/Jeremy Spurway /Susan Brown/Chris Cromey
Issued by: Quality Manager Authorised by: Aquaculture Project
Management Group
UNCONTROLLED COPY IF PRINTED Printed: 7 June, 2005
H:7.3.5 DEPOMOD resuspension model 97 H:7.3.6 EQS Benthic criteria 99 H:7.3.7 The log file 104 H:7.3.8 Mapping module 110
H:7.4 Reporting of Consent Limit Assessment Results – Consent Biomass 115 H:7.4.1 Reported model output 115 H:7.4.2 Sampling stations 116 H:7.4.3 Contour plots 116 H:7.4.4 Report structure 116 H:7.4.5 Summary of Required Information for benthic modelling 116
H:8 REFERENCES 117
APPENDIX 1 FORMAT OF BATHYMETRIC, LAND BOUNDARY AND ASSOCIATED DATA FILES 119
APPENDIX 2 THE PREPARATION AND FORMATTING OF CURRENT METER DATA FOR USE WITH AUTODEPOMOD 125
APPENDIX 3 INPUT DATA FOR TEST SITE - “SITENAME” 129
APPENDIX 4 MAXIMUM BIOMASS MODELLING - APPLICATION OF EQS WITHIN THE MODELLING METHODOLOGY 132
General description of the steps in compliance assessment 133
TABLES, FIGURES AND PLATES Figure 2.1 New strategy in determining site specific AZE for biomass modelling 16 Figure 2.2 The shaded areas show site–specific AZEs for a) dispersive, b) intermediate
and c) depositional site. The dots show sampling stations in the direction of residual current and are at cage edge and three other sampling stations close to AZE boundary. These stations near the boundary assist in determining the organic gradient and associated impact at the boundary 18
Figure 2.3 Relation of near and far-field AZE to cage area for anti-parasitic chemical modelling. Note, fixed areas are used in this method as near-field and far-field EQS chemical criteria relate to these areas 21

SCOTTISH ENVIRONMENT PROTECTION AGENCY Section No.: Fish Farm-AH Page no: 5 of 140
Regulation and Monitoring of Marine Cage Fish Farming in Scotland Issue No: 2.3 Annex H Issue date: 18 May 2005
Methods for Modelling In-feed Anti-parasitics and Benthic effects Originators: Alan Hills/Jeremy Spurway /Susan Brown/Chris Cromey
Issued by: Quality Manager Authorised by: Aquaculture Project
Management Group
UNCONTROLLED COPY IF PRINTED Printed: 7 June, 2005
Figure 7.1 Particle numbers are important in flux predictions. Increasing particle numbers by an order of magnitude eliminates footprint shape artefacts 96
Figure 7.2 DEPOMOD benthic module - Modelled solids accumulation (Savail) plotted against observed Infaunal Trophic Index. Circles demonstrate the variation in the benthic composition of duplicate grabs and the Envelope of Acceptable Precision is defined to take account of this natural variation (88% in EAP, n = 42 stations) 102
Figure 7.3 Contour map of deposition footprint of ‘sitename’ (run 15) showing three important contours, A, B and C. Cage centres are shown as squares and the 5 cages in the NE line are used in the simulation 109
Figure 8.1. A deposition footprint showing a) solids flux at the sea bed (g m-2 yr-1) and b) the predicted ITI for 10 and 405 g m-2 yr-1 is 58 and 22 respectively. The 405 g m-2 yr-1 contour encloses 70 % of the footprint mass (C = 405 g m-2 yr-1, M = 70 %, I = 22) 132
Figure 8.2 A site tested at 706 tonnes which has a predicted impact higher than the EQS criteria. As a result, this test will be defined as FAIL (HIGH) and in the next iteration biomass will be decreased. The shaded area contains the mass, MEQS (Figure 8.1) 136
Figure 8.3 The site retested at 353 tonnes has a predicted impact lower than the EQS criteria. As a result, this test will be defined as PASS (LOW) and in the next iteration biomass will be increased 138
Figure 8.4 Compliance is achieved at 680 tonnes as the predicted impact is the same as the EQS criteria. Sampling stations are shown as dots 140
Plate 1: The AUTODEPOMOD File Structure 39
Plate 2: AUTODEPOMOD Site Input Dialog 42
Plate 3. Grid and Cage Set up 43
Plate 4: FF-in-sitename Information Critical to Modelling 45
Plate 5: sitename-FFMTv3.0.xls - Data Input Section 47
Plate 6: sitename-FFMTv3.0.xls - Cage Layout Display and Model Grid Limits Locator 50
Plate 7: CM93Extract - Grid Generation Dialogs 1 52
Plate 8: CM93Extract - Grid Generation Dialogs 2 53
Plate 9: CM93Extract - Grid Generation Dialogs 3 55

SCOTTISH ENVIRONMENT PROTECTION AGENCY Section No.: Fish Farm-AH Page no: 6 of 140
Regulation and Monitoring of Marine Cage Fish Farming in Scotland Issue No: 2.3 Annex H Issue date: 18 May 2005
Methods for Modelling In-feed Anti-parasitics and Benthic effects Originators: Alan Hills/Jeremy Spurway /Susan Brown/Chris Cromey
Issued by: Quality Manager Authorised by: Aquaculture Project
Management Group
UNCONTROLLED COPY IF PRINTED Printed: 7 June, 2005
Plate 10: AUTODEPOMOD Main Dialog - Slice Consent Limit Assessment (this dialog shows version 1 of the model and so does not show the Benthic modelling radio button). Chemical modelling features are the same between version 1 and 2. 61
Plate 11: Run Log Dialog 66 Plate 12: Changes to Plate 10 During Calicide Assessment 71 Plate 13. On start up of AUTODEPOMOD, the Create New Project and Global Default
buttons are shown 84 Plate 14: AUTODEPOMOD Model Parameters page showing Benthic modelling selected 89
Plate 15: Constant Feed input dialog used for specifying stocking density, CVA and SFR 90
Plate 16: Dialog used for specifying feed input distribution between cages when AutoDistribute is switched OFF 91
Plate 17: Program locations of DEPOMOD executable files 92
Plate 18: Hydrographic input data, trajectory evaluation, dispersion coefficients and maximum site biomass default settings 93
Plate 19: Particle number, refining step size, tidal sequence, feed attributes resuspension and G-model settings 94
Plate 20: Food and faecal particle settling velocity default settings 99
Plate 21: EQS benthic criteria default data 103
Plate 22: Log file displaying columns Run no. to ITIflag 105
Plate 23: Log file displaying columns Benthic cage group to Benthic cage params 107
Plate 24: Log file displaying columns Sampling Area to Grid file 108
Plate 25: Using the filter button, failed runs can be eliminated from the log file 110
Table 2.1 In-feed chemical sediment EQSs 20 Table 3.1 EmBZ excretion profile 29 Table 7.1 PASS/FAIL options taken from Plate 22 106

SCOTTISH ENVIRONMENT PROTECTION AGENCY Section No.: Fish Farm-AH Page no: 7 of 140
Regulation and Monitoring of Marine Cage Fish Farming in Scotland Issue No: 3.0 Annex H Issue date: 18 May, 2005
Methods for Modelling In-feed Anti-parasitics and Benthic effects Originator: Alan Hills/Jeremy Spurway/Susan Brown/Chris Cromey
Issued by: Quality Manager Authorised by: Aquaculture Project
Management Group
H:1 SCOPE This document details the modelling methodology, currently used by SEPA, to assess:
1. appropriate consent limits for In-Feed Sea Lice treatment medicines,
2. appropriate consent limits for farm maximum biomass.
When used in conjunction with other documents relating to Fish Farm Modelling (Attachment XIII et al), and with appropriate software tools, it will allow parties outside SEPA to assess site-specific limits for medicine use and maximum biomass. However, please note that any limits obtained must be evaluated with regard to the capabilities and limitations of the method. There may be occasions when the method cannot adequately predict the impact on receiving waters. In some cases, subjective judgement may be needed to justify model results. In other cases a precautionary approach may be taken. Some guidance in this area is included within this document. The final consent limit set by SEPA may not simply be the answer arrived at via the methods presented here.
N.B.(1) SEPA strongly recommends the use of the following method to aid the assessment of consent limits for medicines Calicide and Slice and maximum farm biomass. Any proposed amendment of the method or alternative approaches must be raised, in the first instance, with SEPA.
UNCONTROLLED COPY IF PRINTED Printed: 7 June, 2005

SCOTTISH ENVIRONMENT PROTECTION AGENCY Section No.: Fish Farm-AH Page no: 8 of 140
Regulation and Monitoring of Marine Cage Fish Farming in Scotland Issue No: 3.0 Annex H Issue date: 18 May, 2005
Methods for Modelling In-feed Anti-parasitics and Benthic effects Originator: Alan Hills/Jeremy Spurway/Susan Brown/Chris Cromey
Issued by: Quality Manager Authorised by: Aquaculture Project
Management Group
H:2 INTRODUCTION
The following document has three main components. These are:
• Background and modelling of anti-parasitic chemicals for determination of consent (sections H:3, H:5, H:6)
• Background to AUTODEPOMOD (section H:4)
• Background and modelling of particulate material and benthic effects for determination of farm maximum biomass (section H:7)
As the method for modelling anti-parasitic chemicals was developed first and documented in the original Annex H, the sections which deal with these chemicals contain much of the detail for setting up the model and implementing data. This is particularly the case for setting up bathymetry grids and cage layouts. The section dedicated to modelling of particulate material and benthic effects concentrates mostly on the new features of the revised software and refers to previous sections where necessary.
A recent Scottish Executive review and synthesis of the environmental impacts of aquaculture provides useful background information (SECRU, 2002), as well as the consultation document used in the public consultation process of this method. If an applicant wishes to model both the benthic effect and anti-parasitic chemicals then it is recommended that the benthic effect is modelled first. The cage layout, feed input and stocking density from this modelling exercise can then be used in determining the consent recommendations for anti-parasitic chemicals.
H:2.1 Background
H:2.1.1 Sea lice and Anti-parasitic Chemicals One of the major difficulties facing the aquaculture industry in Scotland is the proliferation of sea lice in marine cage fish farms (MCFFs). Ectoparasitic sea lice (Lepeophtheirus salmonis Kroyer and Caligus elongatus Nordmann) browse on the skin of farmed Atlantic salmon (Salmo salar). The resulting lesions cause stress and increase susceptibility of the fish to secondary infections. In extreme infestations, fish can suffer from osmoregulatory failure and death.
The most immediate treatment for the relief of sea lice infestations at fish farms is the use of chemo-therapeutants. A number of different medicines have been developed which are capable of controlling sea lice and reducing their numbers to acceptable levels. However, the most
UNCONTROLLED COPY IF PRINTED Printed: 7 June, 2005

SCOTTISH ENVIRONMENT PROTECTION AGENCY Section No.: Fish Farm-AH Page no: 9 of 140
Regulation and Monitoring of Marine Cage Fish Farming in Scotland Issue No: 3.0 Annex H Issue date: 18 May, 2005
Methods for Modelling In-feed Anti-parasitics and Benthic effects Originator: Alan Hills/Jeremy Spurway/Susan Brown/Chris Cromey
Issued by: Quality Manager Authorised by: Aquaculture Project
Management Group
efficacious, and therefore popular, treatments currently available are identified as List II chemicals under the European Dangerous Substances Directive. As such, their discharge to the environment requires to be controlled and, where possible, reduced. In Scotland this is achieved by regulation by a discharge consent issued in accordance with the Control of Pollution Act (as amended) 1974 (CoPA’74).
H:2.1.2 Particulate material Animals burrowing in sediments that receive normal detrital inputs have a diverse fauna with many species and include a wide range of higher taxa, body sizes and functional types. As organic inputs increase, this diversity also initially increases as the enhanced food supply provides opportunities for the expansion of existing populations and the immigration of new species. However, deterioration of the physical and chemical conditions in the sediments progressively eliminates the larger, deeper-burrowing and longer-lived forms favouring smaller, rapidly growing opportunist species. With increasing inputs, the surface sediments become anoxic and only a small number of specialist taxa can survive, mainly small annelid and nematode worms, which may flourish in huge numbers. Where anaerobic processes occur close to the sediment surface, this may become covered in dense white mats of sulphide oxidising bacteria Beggiatoa sp. High flow rates, bringing a continuous supply of oxygen to the sediment surface, do allow the survival of infauna even when the sedimentary surface layer is anoxic but, where sediments suffer oxygen deficiency for even relatively short periods of a few hours, e.g. caused by slack water, large sections of the benthic macrofauna are eliminated. Ultimately, increasing levels of sedimentary oxygen demand bring about anoxia in the lower levels of the overlying water column leading to the elimination of all higher life.
The organic load discharged by cage fish farms consists of faeces and uneaten food which settle to the seabed in the vicinity of the cages. In highly energetic areas this material may be dispersed and assimilated by the benthic fauna with relatively little detectable accumulation or effects. In lower energy areas the sea bed may become organically enriched and anoxic causing distortions in the structure of the benthic fauna and development of microbial films of Beggiatoa on the sediment surface. In these more quiescent situations the effects may be more intense but cover a smaller surface area.
H:2.1.3 Prediction of Impact – Sea lice and Anti-parasitic Chemicals There is the potential that these medicines are capable of damaging other marine organisms if their use is unregulated and they are permitted to exceed safe environmental concentrations. Some of the residues of the treatments are relatively long-lived and may accumulate in sediments close to the cages or further afield, depending on method of application, their nature and their rate of degradation.
This document sets out the rationale behind, and the requirements of, SEPA’s methods for the modelling of licensed in-feed sea lice chemicals at marine cage fish farms. At present there are two in-feed sea lice treatments licensed by SEPA for use at MCFFs. These are:
UNCONTROLLED COPY IF PRINTED Printed: 7 June, 2005

SCOTTISH ENVIRONMENT PROTECTION AGENCY Section No.: Fish Farm-AH Page no: 10 of 140
Regulation and Monitoring of Marine Cage Fish Farming in Scotland Issue No: 3.0 Annex H Issue date: 18 May, 2005
Methods for Modelling In-feed Anti-parasitics and Benthic effects Originator: Alan Hills/Jeremy Spurway/Susan Brown/Chris Cromey
Issued by: Quality Manager Authorised by: Aquaculture Project
Management Group
• Calicide® (within which the active compound is Teflubenzuron (TFBZ)) – manufactured by Nutreco.
• SLICE® (within which the active compound is Emamectin Benzoate (EmBZ)) – manufactured by Schering Plough.
N.B.(2) Although both the product names and active compound names are used in this document, they are NOT interchangeable. Furthermore the product names are acknowledged as Registered Trademarks here. For brevity, this notation shall not be repeated in the rest of this document.
As these chemo-therapeutants are administered in the fish feed, their fate and behaviour in the environment is primarily associated with the final resting point of faecal matter, and any waste feed, in the sediments beneath and around the farm site. It is considered that the spatial distribution and concentration of the chemicals on the seabed can satisfactorily be predicted by modelling techniques that simulate their excretion characteristics, subsequent transport and degradation. The required final output of these models is a “footprint of deposition” on the seabed illustrating the predicted aerial coverage and concentration of the chemical.
An iterative approach is adopted to attain compliance with required standards from which the consented discharge quantities are derived.
All SEPA methodologies rely on the chemicals being used in accordance with the version of the manufacturers’ product data sheet current at the time of treatment or as otherwise specified by a qualified veterinary surgeon.
H:2.1.4 Prediction of Impact – Particulate material The waste faecal and food material emanating from cage farms consist of a range of particle sizes and densities, with a range of settling velocities. These particles are affected by water currents that usually vary with depth. The resulting dispersion causes settlement at different distances from the farm, but usually the highest deposition rates are in the immediate vicinity of the farm. The eventual location of deposition on the seabed will primarily depend on local bathymetry, water current and settling velocity. On reaching the seabed, these particles may become incorporated into the sediment (bioturbation) or may be resuspended by near-bed currents, thus further dispersing them away from the cages.
SEPA’s objective is to minimise accumulation of organic matter on the seabed which would otherwise cause sediments to become anoxic and sulphidic or impact the invertebrate fauna adversely and so prevent the necessary aeration and reworking of sediment. Some deposition in the allowable zone of effects is acceptable as long as sediment reworking animals remain in sufficient diversity and density to maintain a turn over of carbon in the system. Gross effects such as accumulations of food pellets and bacterial mats are not acceptable outwith the allowable zone of effects, and should be minimised even below the cages.
UNCONTROLLED COPY IF PRINTED Printed: 7 June, 2005

SCOTTISH ENVIRONMENT PROTECTION AGENCY Section No.: Fish Farm-AH Page no: 11 of 140
Regulation and Monitoring of Marine Cage Fish Farming in Scotland Issue No: 3.0 Annex H Issue date: 18 May, 2005
Methods for Modelling In-feed Anti-parasitics and Benthic effects Originator: Alan Hills/Jeremy Spurway/Susan Brown/Chris Cromey
Issued by: Quality Manager Authorised by: Aquaculture Project
Management Group
The rate at which solids deposition occurs at the seabed (flux – g solids m-2 yr-1) and the subsequent availability of this material to the benthic community can be linked with an effect via a predictive model (Cromey et al, 1998, 2002). Solids flux decreases at increasing distance from the farm as finer particles taking longer to settle are dispersed more widely. It is the outer boundary of the deposition footprint (the AZE boundary) which is of primary interest from a modelling viewpoint as site specific information can be used in a model to determine the shape and extent of the footprint. This has the effect of allowing farms experiencing ambient currents of highly predictable direction to utilise the AZE area more effectively and inserts the site specific logic into AZE setting.
H:2.1.5 Model Development - Anti-parasitic Chemicals Over the last 5 years SEPA has, in conjunction with the Scottish Association for Marine Science (SAMS), developed and refined a method for predicting concentrations of in-feed medicine residues in the sediments beneath fish farm sites. The comparison of predicted residual concentrations with Environmental Quality Standards (EQS), for the compound in question, over an Allowable Zone of Effects (AZE), is used to drive the consent setting process for each medicine currently available (i.e. Calicide and Slice). The keystone of the method is the particle tracking model DEPOMOD, developed at the Scottish Association for Marine Science (SAMS), with funding from NERC MAFF Link Aquaculture, Marine Harvest McConnell (now Marine Harvest (Scotland)), SNIFFER, Scottish Environment Protection Agency and the Scottish Salmon Growers Association (now Scottish Quality Salmon). Information on the development of DEPOMOD can be found in Cromey et al. (2000, 2002).
There are currently four versions of DEPOMOD available:
• DEPOMOD V1.5: This version is capable of predicting solids impact and Calicide residues. Slice residues can be simulated, but this process is complex and time consuming. The model is comprised of a series of modules which are driven from accompanying dialog menus. This version was used by SEPA to set Calicide consent limits.
• DEPOMOD V2.0: As v1.5 but with the capability to simulate a, linear or non-linear, time varying medicine discharge. The decay of medicine residues can also be simulated. Both of these features are necessary to simulate Slice residues correctly. This version of DEPOMOD is the most flexible of the versions available. Until February 2002 this version was used by SEPA to set Calicide and Slice consent limits.
• AUTODEPOMOD 1.0.1 (Incorporating DEPOMOD V3.0): In an effort to streamline the modelling process, SEPA contracted SAMS to develop AUTODEPOMOD. In this version, DEPOMOD, and the other ancillary components required for the method, are controlled from one single application. This application is controlled via a small amount of dialog input. AUTODEPOMOD has the capability to automatically iterate towards a solution which assesses the amount of medicine that may be discharged at a site. In addition it is less flexible than DEPOMOD V2.0 and is very much driven by the current consent limit
UNCONTROLLED COPY IF PRINTED Printed: 7 June, 2005

SCOTTISH ENVIRONMENT PROTECTION AGENCY Section No.: Fish Farm-AH Page no: 12 of 140
Regulation and Monitoring of Marine Cage Fish Farming in Scotland Issue No: 3.0 Annex H Issue date: 18 May, 2005
Methods for Modelling In-feed Anti-parasitics and Benthic effects Originator: Alan Hills/Jeremy Spurway/Susan Brown/Chris Cromey
Issued by: Quality Manager Authorised by: Aquaculture Project
Management Group
assessment method. Since February 2002 this version has been used by SEPA to set Calicide and Slice consent limits.
• AUTODEPOMOD 2.0.1 (Incorporating DEPOMOD v3.0): This is a further development of AUTODEPOMOD 1.0.1 and incorporates both capability to set consents for sea lice treatment chemicals and maximum biomass. With respect to sea lice treatment chemicals, capability of version 2.0.1 of AUTODEPOMOD is exactly the same as version 1.0.1.
The method detailed in this document with regards to sea lice chemicals should only be used in conjunction with AUTODEPOMOD 1.0.1 or the newer version AUTODEPOMOD v 2. The use of AUTODEPOMOD is strongly recommended by SEPA (see N.B.(1) above), in particular the newest version 2.
N.B.(3) AUTODEPOMOD has been designed around 3 ancillary software packages, which are detailed in the next section. Two of these are critical to the operation of AUTODEPOMOD, however, these are popular and commonly used. SEPA acknowledges that these are not the only packages which perform the functions for which they are used. The specific packages chosen, represent the tools which SEPA had at its disposal prior to the development of AUTODEPOMOD.
H:2.1.6 Model Development – Particulate waste material and benthic effects The DEPOMOD model was initially designed and validated for prediction of flux of particulate material and associated benthic effects. Information on the development of DEPOMOD can be found in Cromey et al. (2000, 2002). With regards to prediction of benthic effects, there are three versions of the model available:
• DEPOMOD V1.5, V2.0: These versions of the model are capable of predicting solids flux and benthic effects. However, similar to the sea lice chemical modules, the benthic effects module is comprised of a series of modules which are driven from accompanying dialog menus. To undertake the method presented in this document, use of these versions of the model is cumbersome and time consuming.
• AUTODEPOMOD 2.0.1: (Incorporating DEPOMOD v3.0): This most recent version of AUTODEPOMOD has capability for consenting of maximum biomass and sea lice treatment chemicals. Most of the development work of AUTODEPOMOD 2.0.1 has been focussed on consenting maximum biomass using the benthic effects module. AUTODEPOMOD 1.0.1 cannot be used to predict maximum biomass.
The method detailed in this document with regards to prediction of particulate material flux and benthic effect should only be used in conjunction with the newer version of AUTODEPOMOD, version 2.0.1 The use of AUTODEPOMOD is strongly recommended by SEPA (see N.B.(1) above) and users should also note the package has been designed around three ancillary software
UNCONTROLLED COPY IF PRINTED Printed: 7 June, 2005

SCOTTISH ENVIRONMENT PROTECTION AGENCY Section No.: Fish Farm-AH Page no: 13 of 140
Regulation and Monitoring of Marine Cage Fish Farming in Scotland Issue No: 3.0 Annex H Issue date: 18 May, 2005
Methods for Modelling In-feed Anti-parasitics and Benthic effects Originator: Alan Hills/Jeremy Spurway/Susan Brown/Chris Cromey
Issued by: Quality Manager Authorised by: Aquaculture Project
Management Group
packages (see N.B.(3)). Some more background information on AUTODEPOMOD is available in H:4.
H:2.2 Modelled component characteristics
H:2.2.1 Calicide The active compound in Calicide, teflubenzuron (TFBZ), is a “chitinase inhibitor”. It acts by inhibiting the formation of chitin in the exoskeleton of insects and crustacea. It affects the moulting 1stages of these organisms, and therefore, it is particularly effective in treating sea lice when they are progressing through the various juvenile growth stages.
TFBZ has a moderate octanol:water partition coefficient and relatively low water solubility. Consequently, when in the environment it tends to remain largely bound to sediment and organic material.
TFBZ is effective against sea lice when salmon are dosed at 10 mg kg-1 body weight per day for 7 consecutive days. Calicide is prepared by coating commercial feed pellets with TFBZ as a powder to a level of 2g TFBZ kg-1 feed (0.2% w/w).
The walls of the fish intestinal system absorb TFBZ poorly, and consequently, the fish does not readily take up the chemical. It has been calculated that 90% of the dose is excreted during the treatment period. The release of the remaining 10% is sufficiently slow to render its impact on the surrounding environment negligible.
The chemical released over the treatment period (90% dose excreted + waste feed) is considered in the modelling and consent procedures.
A degradation half-life in the marine environment of 115 days has been determined for TFBZ. For more information please see SEPA Policy 29, which can be found at the following location:
http://www.sepa.org.uk/policies/pdf/29.pdf
H:2.2.2 SLICE The active compound in Slice is emamectin benzoate (EmBZ), which acts on the lice by binding to specific high-affinity binding sites. This results in increased membrane permeability to chloride ions and disruption of physiological processes, most notably nerve impulses.
1 SLICE Technical Monograph. Schering-Plough Animal Health.
UNCONTROLLED COPY IF PRINTED Printed: 7 June, 2005

SCOTTISH ENVIRONMENT PROTECTION AGENCY Section No.: Fish Farm-AH Page no: 14 of 140
Regulation and Monitoring of Marine Cage Fish Farming in Scotland Issue No: 3.0 Annex H Issue date: 18 May, 2005
Methods for Modelling In-feed Anti-parasitics and Benthic effects Originator: Alan Hills/Jeremy Spurway/Susan Brown/Chris Cromey
Issued by: Quality Manager Authorised by: Aquaculture Project
Management Group
Slice is supplied as a premix in 2.5 kg sachets, each containing 5 g of emamectin benzoate (EmBZ) in an inert matrix. Each sachet of premix is wet or dry coated onto sufficient quantity of pelletised fish feed to produce 500 kg of medicated feed. The recommended dose rate is 50 µg per kg of fish biomass per day for seven consecutive days. It therefore follows that for effective treatment each tonne of biomass will require 5 kg of medicated feed per day for the seven days of the treatment1.
It has been determined that 10% of the dose is excreted during the treatment period. Of the remaining 90% of the chemical, approximately 99% is excreted over the subsequent 216 days. This excretion has an exponential decay profile such that 50% of the chemical remaining in the fish is released, on average, over every 36–37 day period, i.e. approximately 2.5 Spring/Neap cycles, although this varies with water temperature.
SEPA has determined that EmBZ breaks down into “non-toxic” sub-compounds within a defined half-life period.
H:2.2.3 Particulate waste material and benthic effects The impact of particulate material on benthic communities and the macrofaunal response to enrichment is well known. The effect of particulate waste material from aquaculture on benthic habitats is also reasonably well established, generally following the same pattern seen from impact by other organic pollutant sources (see Pearson and Black, 2001 for overview). The particulate waste material being discharged from marine cages can be conveniently divided into two components: waste faecal material voided from the fish and uneaten feed pellets. Early modelling studies concentrated on the waste feed pellets and their gross effects underneath the cages, but improvement in husbandry practices have resulted in feed loss being minimised. As a result, the properties of the faecal material have received more emphasis in scientific research (see Magill et al. In Press for review), as it is this waste type that is determining the extent to which the effect of the farm can be measured (i.e. the AZE boundary). Simple mass balance calculations also confirm that faecal material is the larger component of the total waste particulate material released (approximately 83% faeces, 17 % uneaten feed).
The primary feed properties in the model are percentage of feed lost as uneaten pellets, feed digestibility and water content and settling velocity. These variables have been assigned default values in the method and are not commonly changed during model runs, achieving consistency between sites. The primary faecal particle properties in the model are settling velocities of the particles and although a difficult property to measure, there is an increasing amount of data in the literature.
The amount of particulate material released as feed particles in the model is determined by the percentage of feed pellets lost with an adjustment for water content. The amount of feed consumed is then adjusted for digestibility and water content, so that the amount of faecal material released as faecal particle can be determined. No adjustment is made to the particulate material to model the carbon component and no decay of the solids is modelled. This is due to the benthic module being validated using total particulate material and associated benthic effects (i.e. solids not carbon).
UNCONTROLLED COPY IF PRINTED Printed: 7 June, 2005

SCOTTISH ENVIRONMENT PROTECTION AGENCY Section No.: Fish Farm-AH Page no: 15 of 140
Regulation and Monitoring of Marine Cage Fish Farming in Scotland Issue No: 3.0 Annex H Issue date: 18 May, 2005
Methods for Modelling In-feed Anti-parasitics and Benthic effects Originator: Alan Hills/Jeremy Spurway/Susan Brown/Chris Cromey
Issued by: Quality Manager Authorised by: Aquaculture Project
Management Group
H:2.3 Model Software SEPA has been pivotally involved in the development of the modelling tool AUTODEPOMOD. This is capable of delivering the site-specific assessment of solid-bound chemical distribution post-treatment as well as maximum biomass via assessment of particulate deposition and benthic impact. The software has been devised and enhanced by staff at the Scottish Association for Marine Science (SAMS) and is based upon the BenOSS model of Cromey et al. (1998).
DEPOMOD, a Lagrangian particle-tracking benthic impact model specifically configured for the definition of releases of materials from marine cage fish farms (Cromey et al, 2002), has undergone its fourth major incarnation, AUTODEPOMOD V2, incorporating DEPOMOD v3.0. AUTODEPOMOD integrates SEPA’s data preparation tools, and DEPOMOD’s benthic deposition prediction capabilities, into a single package that automatically configures discharge loads and runs to iterate towards a treatment quantity that meets a user-defined test condition. A mapping module developed by SAMS included in AUTODEPOMOD allows analysis of the deposition footprint shape and quantification of predictions along user defined sampling transects.
H:2.4 Assessment and Consent Strategy
H:2.4.1 Anti-parasitic Chemicals SEPA’s approach to consenting the use of these in-feed therapeutants is based on limiting the maximum concentration of chemical within the surficial layer of the seabed. The maximum quantity of chemical allowable in a single growth cycle determined by the maximum quantity of chemical applied in a single dose that does not exceed SEPA’s standards (EQS values) within particular areas of the seabed (AZEs). This presents a worst-case scenario of the maximum amount of chemical being applied in one single treatment. SEPA has set an “upper limit” on the quantity of chemical that may be applied to a site in a growth cycle. These are 1 times peak biomass for TFBZ and 5 times peak biomass for EmBZ. In certain circumstances where a large amount of material is lost from the model grid, these upper limits may be reduced by the conditions imposed in the final consent documentation.
For both EmBZ and TFBZ the timing and allowable quantity chemical of retreatments is controlled by calculations of the quantity of chemical still remaining on the seabed. Details of how to make these calculations are issued with discharge consents.
H:2.4.2 Particulate material and benthic effects The ADRIS report (ADRIS, 1991) recommended an AZE for the seabed of some 25 metres extending outward in all directions from the cage edge. This concept, whilst adequate for fixed pipe discharges, is acknowledged to be simplistic in respect of cage farms due to: the (often) elliptical nature of the actual zone of effects; cage relocation; hydrographic features; cages with single point moorings; and the fact that the area of the mixing zone increases as the area of the cage group increases. An improvement on this strategy would be to retain the 25 m equivalent area, but allow this to be an elliptical shape. Where enough information exists on local currents, an elliptical zone
UNCONTROLLED COPY IF PRINTED Printed: 7 June, 2005

SCOTTISH ENVIRONMENT PROTECTION AGENCY Section No.: Fish Farm-AH Page no: 16 of 140
Regulation and Monitoring of Marine Cage Fish Farming in Scotland Issue No: 3.0 Annex H Issue date: 18 May, 2005
Methods for Modelling In-feed Anti-parasitics and Benthic effects Originator: Alan Hills/Jeremy Spurway/Susan Brown/Chris Cromey
Issued by: Quality Manager Authorised by: Aquaculture Project
Management Group
of effects can be set of area equal to the area obtained if the zone of effects extended for 25m in all directions. Thus impact would be allowed out to 50m or 75m in one direction, but no detectable impact would be allowed in any other direction. However, the strategy described in this document has been developed primarily to determine a site-specific AZE which reflects the size of the farm and dispersive properties of the site (Figure 2.1). It does not use an equivalent AZE area (e.g. 25 m fixed distance around the cages).
Using results from modelling tests, physical aspects of the environment (hydrography and depth) result in the main differences between site AZE’s. Other model variables such as settling velocity of waste particles also determine the AZE shape as these variables determine the time for a particle to settle and its subsequent advection. However, settling data are constant between sites and so do not play a part in determining the site specific AZE. The size of the farm and subsequent amounts of waste material released from the farm does change the size of the AZE, as larger farms will release more waste material. However, to make more transparent the shape of the AZE as a result of physical (dispersive) characteristics of the site and not the farm biomass, several EQS criteria are required to determine the site-specific AZE detailed later.
Figure 2.1 New strategy in determining site specific AZE for biomass modelling
L
L
New AZE boundary(site specific shape which may be elongated in one direction)
Old AZE boudary (fixed distance from cages in all directions)
L'
0 50
Scale (m)
UNCONTROLLED COPY IF PRINTED Printed: 7 June, 2005

SCOTTISH ENVIRONMENT PROTECTION AGENCY Section No.: Fish Farm-AH Page no: 17 of 140
Regulation and Monitoring of Marine Cage Fish Farming in Scotland Issue No: 3.0 Annex H Issue date: 18 May, 2005
Methods for Modelling In-feed Anti-parasitics and Benthic effects Originator: Alan Hills/Jeremy Spurway/Susan Brown/Chris Cromey
Issued by: Quality Manager Authorised by: Aquaculture Project
Management Group
The old AZE boundary had a fixed distance from the cages of 25 m (L). The new strategy makes use of site specific information so that the new AZE boundary is better adapted to the dispersive qualities of the site. L’ is the distance of the new AZE boundary from the cages.
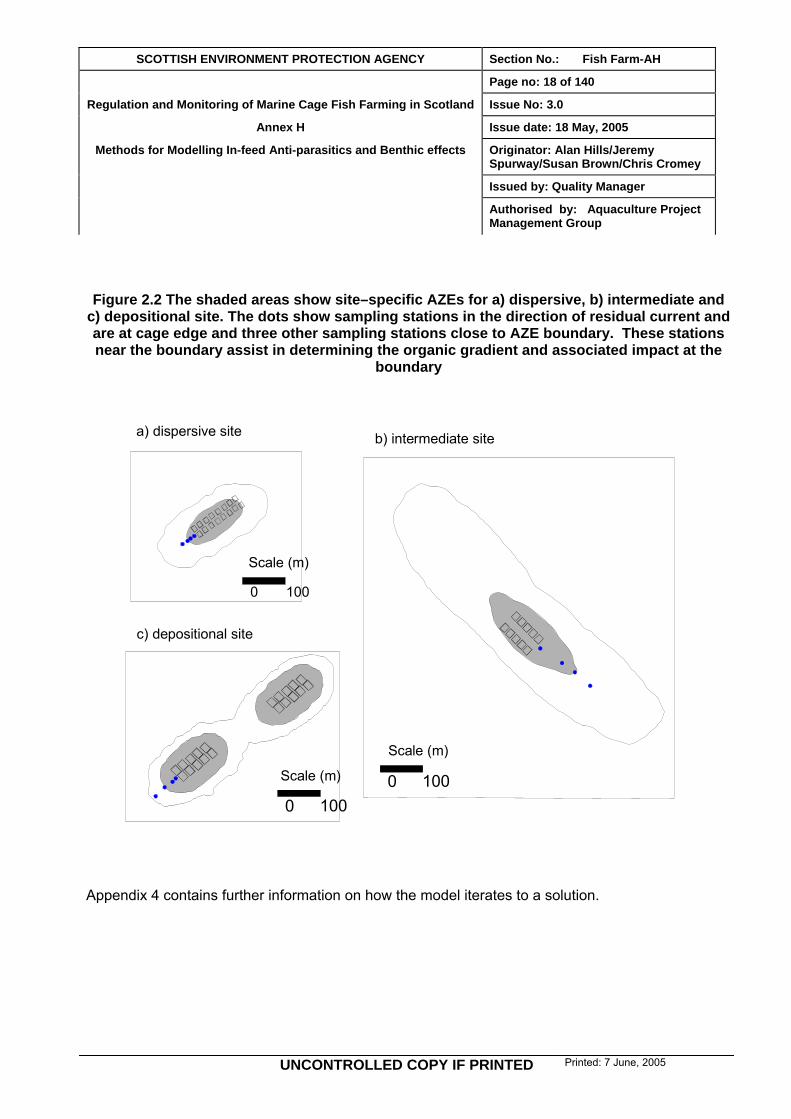
As a result, different sites have different size AZE as in Figure 2.2. At the dispersive site (a), high near–bed current results in resuspension of deposited solids and a small AZE of overall low impact can be expected. The intermediate site shows the situation that can occur at a deep site (b), where surface current results in high dispersion in the water column, but the low near–bed current results in little or no resuspension. As a result, the AZE covers a wide area and is low in overall impact. The depositional site (c) has a small AZE but deposition within this zone can be expected to be heavy with a consequent increased risk to the viability of sediment re-worker species. The distance to the AZE boundaries for the examples shown are 25 m, 120 m and 52 m.
In Figure 2.2 it is important to note the approximate layout of the proposed sampling stations at these hypothetical sites. These are placed near the cage, one on the AZE boundary and one either side of the boundary. Such a sampling station arrangement maximises the chance of sampling the less impacted end of the organic enrichment gradient at the outer limits of the boundary. It is also important to note, that no sampling stations perpendicular to the main axis of current are proposed as the greatest distance of the AZE boundary from the cage group is of main interest. Sampling locations will therefore be site-specific and identified in self-monitoring protocols.
UNCONTROLLED COPY IF PRINTED Printed: 7 June, 2005
SCOTTISH ENVIRONMENT PROTECTION AGENCY Section No.: Fish Farm-AH Page no: 18 of 140
Regulation and Monitoring of Marine Cage Fish Farming in Scotland Issue No: 3.0 Annex H Issue date: 18 May, 2005
Methods for Modelling In-feed Anti-parasitics and Benthic effects Originator: Alan Hills/Jeremy Spurway/Susan Brown/Chris Cromey
Issued by: Quality Manager Authorised by: Aquaculture Project
Management Group
Figure 2.2 The shaded areas show site–specific AZEs for a) dispersive, b) intermediate and c) depositional site. The dots show sampling stations in the direction of residual current and are at cage edge and three other sampling stations close to AZE boundary. These stations near the boundary assist in determining the organic gradient and associated impact at the
boundary
b) intermediate site
c) depositional site
0 1000 100
Scale (m)
Scale (m)
a) dispersive site
0 100
Scale (m)
Appendix 4 contains further information on how the model iterates to a solution.
UNCONTROLLED COPY IF PRINTED Printed: 7 June, 2005

SCOTTISH ENVIRONMENT PROTECTION AGENCY Section No.: Fish Farm-AH Page no: 19 of 140
Regulation and Monitoring of Marine Cage Fish Farming in Scotland Issue No: 3.0 Annex H Issue date: 18 May, 2005
Methods for Modelling In-feed Anti-parasitics and Benthic effects Originator: Alan Hills/Jeremy Spurway/Susan Brown/Chris Cromey
Issued by: Quality Manager Authorised by: Aquaculture Project
Management Group
H:2.5 Feed Load Profiles
H:2.5.1 Anti-parasitic chemicals The rate of administration of food varies during the production cycle in response to the biomass and growth rate of the stock. Treatment with in-feed chemo-therapeutants is driven by degree of infestation and is not always carried out at fixed points in the growth cycle. Consequently, it is impossible for SEPA to know or predict the food load during any specific treatment period.
An annual average feed load is applied within the model, to provide a realistic particle mass to which excreted chemical can bind, prior to simulation of its descent through the water column and its dispersion by the currents around the cage site.
H:2.5.2 Particulate material and benthic effects Predictions of the deposition and associated benthic effects are useful for the period of maximum biomass. The position of benthic monitoring stations can be informed by the modelling and comparisons can be made between observed and predicted benthic indices. Although the DEPOMOD model is capable of modelling long time series of feed input as this changes over the growing cycle, this regulatory method models feed input around maximum biomass.
H:2.6 Environmental Quality Standards and Allowable Zones of Effect – Anti-parasitic chemicals
This section outlines the EQS and AZE used for anti-parasitic chemicals. EQS aspects for modelling of benthic effects and maximum farm biomass are detailed in H:7.3.6.
SEPA’s approach to setting chemo-therapeutant consent limits, is based on the comparison of Environmental Quality Standards (EQSs) with predictive modelling results. Environmental Quality Standards for in-feed chemicals may be applied in two main ways:
• a consent-limiting concentration of chemical permitted within the seabed sediment
or
• a non consent-limiting concentration of chemical permitted within the seabed sediment which, if exceeded, will trigger a requirement for enhanced monitoring.
The first type of EQS is termed a “limit value” and the second a “trigger value”. The details of the requirements for enhanced monitoring are outlined in the discharge consent.
UNCONTROLLED COPY IF PRINTED Printed: 7 June, 2005
SCOTTISH ENVIRONMENT PROTECTION AGENCY Section No.: Fish Farm-AH Page no: 20 of 140
Regulation and Monitoring of Marine Cage Fish Farming in Scotland Issue No: 3.0 Annex H Issue date: 18 May, 2005
Methods for Modelling In-feed Anti-parasitics and Benthic effects Originator: Alan Hills/Jeremy Spurway/Susan Brown/Chris Cromey
Issued by: Quality Manager Authorised by: Aquaculture Project
Management Group
The models use site-specific environmental data and estimate the limits that must be imposed on the discharge to prevent the relevant EQSs from being breached outwith the allowable zone of effects (AZE). Once these limits have been determined model output is also examined to determine if the EQS trigger values have been exceeded.
AZEs are defined as “the area (or volume) of sea bed or receiving water in which SEPA will allow some exceedence of a relevant Environmental Quality Standard (EQS)”. Restrictions on the chemo-therapeutant quantities that can be used within a specific time period or the rate of release are then incorporated into the consent.
The shape of the zone will be a result of environmental factors such as bathymetry and flow field and also of the particle settling characteristics.
SEPA applies two separate levels of EQSs over two different areas:
• in the near-field, to protect sediment worker species below and in close proximity to the cages
• in the far-field, to protect all other species at greater distance from the cages.
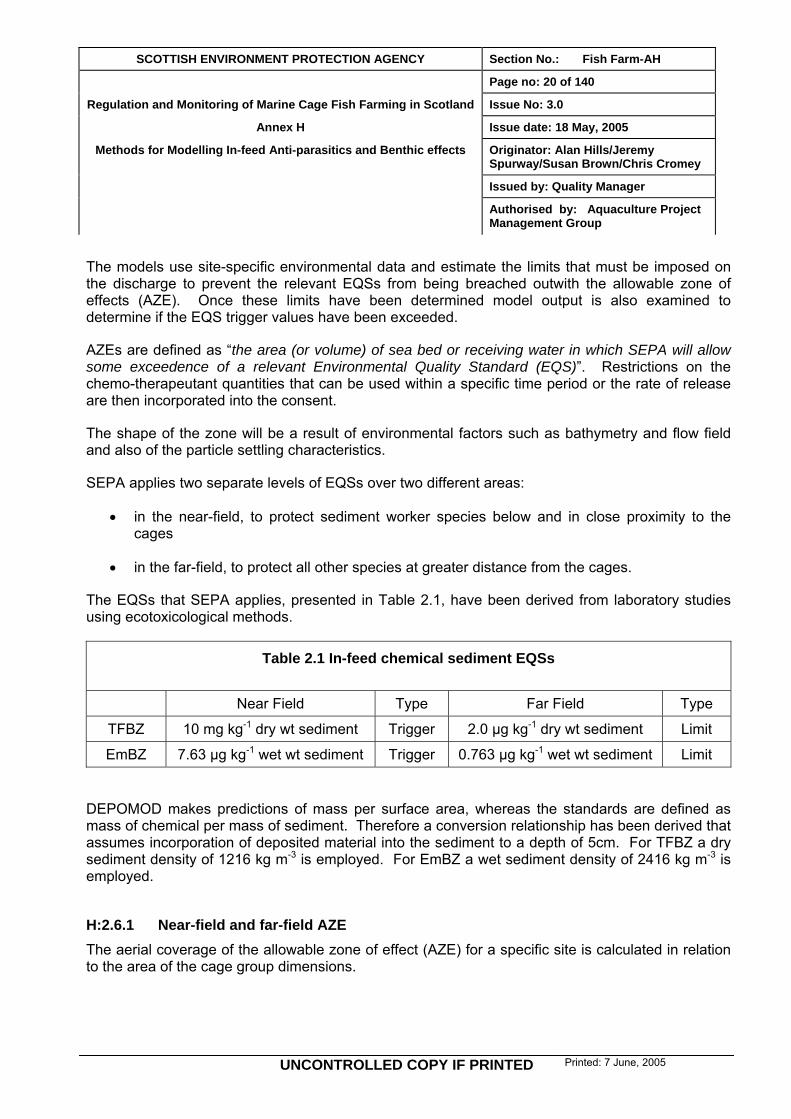
The EQSs that SEPA applies, presented in Table 2.1, have been derived from laboratory studies using ecotoxicological methods.
Table 2.1 In-feed chemical sediment EQSs
Near Field Type Far Field Type
TFBZ 10 mg kg-1 dry wt sediment Trigger 2.0 µg kg-1 dry wt sediment Limit
EmBZ 7.63 µg kg-1 wet wt sediment Trigger 0.763 µg kg-1 wet wt sediment Limit
DEPOMOD makes predictions of mass per surface area, whereas the standards are defined as mass of chemical per mass of sediment. Therefore a conversion relationship has been derived that assumes incorporation of deposited material into the sediment to a depth of 5cm. For TFBZ a dry sediment density of 1216 kg m-3 is employed. For EmBZ a wet sediment density of 2416 kg m-3 is employed.
H:2.6.1 Near-field and far-field AZE The aerial coverage of the allowable zone of effect (AZE) for a specific site is calculated in relation to the area of the cage group dimensions.
UNCONTROLLED COPY IF PRINTED Printed: 7 June, 2005

SCOTTISH ENVIRONMENT PROTECTION AGENCY Section No.: Fish Farm-AH Page no: 21 of 140
Regulation and Monitoring of Marine Cage Fish Farming in Scotland Issue No: 3.0 Annex H Issue date: 18 May, 2005
Methods for Modelling In-feed Anti-parasitics and Benthic effects Originator: Alan Hills/Jeremy Spurway/Susan Brown/Chris Cromey
Issued by: Quality Manager Authorised by: Aquaculture Project
Management Group
The near-field AZE is an area equivalent to the area bounded by a margin 25m from the edge of the cages. Similarly, the far-field AZE is an area equivalent to the area bounded by a margin 100m from the edge of the cages (Figure 2.3).
Figure 2.3 Relation of near and far-field AZE to cage area for anti-parasitic chemical modelling. Note, fixed areas are used in this method as near-field and far-field EQS
chemical criteria relate to these areas
far-field
near-field 25m
100m
The near-field trigger values prescribed for TFBZ and EmBZ, are evaluated against the mean concentration within the near-field AZE. The far-field EQSs for both chemicals are applied universally beyond the far-field AZE.
N.B.(4) AZEs from different cage groups may overlap. When this occurs, no account is taken of any overlap in the total AZE calculation for the site. The total AZE for the site is simply the sum of the individual cage group AZEs.
H:2.7 Data Preparation Tools The adoption of a standard method, model domain, grid resolution, time-step etc. and the consistent structure of the often complex and extensive input data encourages the use of a suite of data preparation tools. The primary requirements are for tools, including templates and automation macros, that average and format current and bathymetric data. Further tools facilitate the calculation of cage centre positions within each cage group, the calculation of the near- and far-field AZEs and allow the determination of a suitable model domain within which to centre the cages. These are described in further detail in sections H:3.3, H:3.4 and H:3.5.
In addition, the SEPA tools have been designed to facilitate the adoption of file-naming conventions and data processing audit trails for quality assurance purposes.
UNCONTROLLED COPY IF PRINTED Printed: 7 June, 2005

SCOTTISH ENVIRONMENT PROTECTION AGENCY Section No.: Fish Farm-AH Page no: 22 of 140
Regulation and Monitoring of Marine Cage Fish Farming in Scotland Issue No: 3.0 Annex H Issue date: 18 May, 2005
Methods for Modelling In-feed Anti-parasitics and Benthic effects Originator: Alan Hills/Jeremy Spurway/Susan Brown/Chris Cromey
Issued by: Quality Manager Authorised by: Aquaculture Project
Management Group
Currently, the preparation of current data is undertaken prior to modelling, whereas derivation of all spatial data, i.e. cage positions, model extents and bathymetry, is incorporated into AUTODEPOMOD.
UNCONTROLLED COPY IF PRINTED Printed: 7 June, 2005

SCOTTISH ENVIRONMENT PROTECTION AGENCY Section No.: Fish Farm-AH Page no: 23 of 140
Regulation and Monitoring of Marine Cage Fish Farming in Scotland Issue No: 3.0 Annex H Issue date: 18 May, 2005
Methods for Modelling In-feed Anti-parasitics and Benthic effects Originator: Alan Hills/Jeremy Spurway/Susan Brown/Chris Cromey
Issued by: Quality Manager Authorised by: Aquaculture Project
Management Group
H:3 METHOD OVERVIEW – ANTI-PARASITIC CHEMICALS
H:3.1 Determination of model domain Fish cage groups are typically 100 to 200 m long. The far-field AZE is equivalent to a 100 m margin around the group, resulting in an assessment area of perhaps 400 m in length. To allow for a tidal inequality in the residual flow, the deposition footprint might be offset by 100 m. Thus, a minimum model domain might be of the order of 500 m in length. A standard grid of twice this has been adopted in order that an indicative prediction can be made of impact further afield due to particles at the slowest end of the settling velocity distribution.
The site-specific current data, used to generate the flow field in DEPOMOD, is collected at a single location. As such, the degree to which it is representative of the whole model domain will depend on additional factors such as the complexity of the local bathymetry. It is believed that to extend the assumption of realism beyond 500m from the observation site is not acceptable.
H:3.2 Determination of model resolution DEPOMOD calculates particle positions relative to a sub-grid of ten times the resolution of the minor grid. By selecting a minor grid resolution of 25 m, particles are thus calculated to a 2.5 m resolution. This results in a nominal accuracy for the impact area calculations of 6.25 m2. In the case of a single 15 m square cage, 6.25 m2 is 0.00014% of the 46,225 m2 far-field AZE and 0.0015% of the 4225 m2 near-field AZE. Thus, the choice of a 25 m minor grid resolution is unlikely to significantly degrade the accuracy of the EQS compliance assessment calculations and this has been confirmed by sensitivity tests in the DEPOMOD model.
H:3.3 Preparation of Cage Positions DEPOMOD uses cage centre positions, cage shape, size and, in the case of square cages, orientation to define the sources of release of particles. Individual cage groups generally consist of regularly spaced cages, usually in a grid pattern. In the case of square cages there are normally walkways separating cages in a raft. Thus, knowledge of the cage size and separation allows calculation of the relative cage centre positions. Eastings and northings for each cage centre can next be determined, by application of trigonometry, with the additional site information of group orientation with respect to grid north and a position for a single group end-member.
The origin of the 1 km square model domain can be established by determination of the centre of the group or groups of cages and subtracting approximately 500 m from both easting and northing. It is helpful to round the actual origin to the nearest 10 m.
UNCONTROLLED COPY IF PRINTED Printed: 7 June, 2005
SCOTTISH ENVIRONMENT PROTECTION AGENCY Section No.: Fish Farm-AH Page no: 24 of 140
Regulation and Monitoring of Marine Cage Fish Farming in Scotland Issue No: 3.0 Annex H Issue date: 18 May, 2005
Methods for Modelling In-feed Anti-parasitics and Benthic effects Originator: Alan Hills/Jeremy Spurway/Susan Brown/Chris Cromey
Issued by: Quality Manager Authorised by: Aquaculture Project
Management Group
H:3.4 Preparation of Bathymetry DEPOMOD requires that average depth – to chart datum – is established for each wetted grid cell, and that dry grid cells are denoted as such by a code value of “-10”.
The system used by SEPA to generate a grid of depth values comprises a number of steps and involves third-party data, several pieces of processing software and some automated formatting routines that have been developed in-house. The data and software components are described below followed by their application to the bathymetry preparation process.
H:3.4.1 C-MAP C-MAP vector electronic chart data (C-MAP UK Ltd.) stores the information derived from UKHO bathymetric surveys as depths - to chart datum - with latitude and longitude to the WGS84 datum.
H:3.4.2 CM93-Extract An intermediary program (CM93-Extract; Ocean Data Systems Ltd.) interrogates the C-MAP electronic charts and produces Surfer input. These are two comma-separated text files covering user-defined areas; bathymetric information as x-y-z data in OSGB36 eastings and northings and depth to chart datum, and land boundary information as x-y data, again in eastings and northings.
H:3.4.3 Surfer The Surfer (Golden Software Inc.) contouring package works by assimilating spatially referenced parameters - in this case x-y-z bathymetric data, where x, y and z are in metres – and reduces the data to a grid of spatially-averaged values by application of a user-selected algorithmic routine. The resolution and origin of the grid can also be specified. A blanking routine masks grid nodes that fall on land, to which Surfer then assigns a non-z-value code. A further in-built routine allows extraction of the gridded data to a lower resolution.
H:3.4.4 Procedure CM93-Extract is used to create x-y-z depth data and x-y land boundary blanking files in Surfer format by selecting an area corresponding to the 1 km square model domain.
Cell-centred average depths are obtained by:
• selecting a grid resolution of twice that required, i.e. 12.5 m;
• gridding x-y-z data across the chosen model domain;
• extracting the data at 25 m resolution, starting from the second grid node.
UNCONTROLLED COPY IF PRINTED Printed: 7 June, 2005
SCOTTISH ENVIRONMENT PROTECTION AGENCY Section No.: Fish Farm-AH Page no: 25 of 140
Regulation and Monitoring of Marine Cage Fish Farming in Scotland Issue No: 3.0 Annex H Issue date: 18 May, 2005
Methods for Modelling In-feed Anti-parasitics and Benthic effects Originator: Alan Hills/Jeremy Spurway/Susan Brown/Chris Cromey
Issued by: Quality Manager Authorised by: Aquaculture Project
Management Group
The resulting file is output in an ASCII format, rather than Surfer’s native binary format.
The Surfer ASCII format is blocks of text, separated by an empty line, for each row of the gridded data, starting from the grid origin, i.e. southwest. DEPOMOD expects data in a file with three header rows, followed by depth data for each grid cell in rows, one for each row in the model grid, starting from the most north-westerly cell. An Excel macro automatically reformats the Surfer ASCII format file to a space-separated format suitable for input into DEPOMOD.
H:3.5 Preparation of Hydrographic Data The temporal resolution of the hydrographic data used to drive the advection of particles within DEPOMOD also determines the resolution, and hence file size, of the time-series load file for EmBZ. Sensitivity testing by SAMS has determined that current data of resolution higher than an hour results in little greater accuracy in the model predictions. This is therefore employed as the standard resolution in determining in-feed chemical consents. SEPA’s hydrographic data requirements specify a minimum resolution of 20 minutes, so data is vector-averaged to produce the required hourly data. Hourly averaging data also has the benefit of placing minimal emphasis on any spikes in the raw data which might not be typically observed in a spring-neap cycle.
The fifteen-day data is presented as both intermediate-spring-intermediate-neap-intermediate (tide) and intermediate-neap-intermediate-spring-intermediate to allow determination of the worst-case tidal conditions, against which the compliance assessment is made. This requires the identification of the data records that occur at intermediate tides, i.e. midway between springs and neaps. This ensures that, for tidally dominated sites, the initial 7-day treatment period falls within either the period of weakest or strongest flows depending which time-series is selected.
For AUTODEPOMOD the current data files also include mean sea level and magnetic variation information, should the data not be corrected to grid north, within the file-header lines.
A number of standard templates, each for raw survey data of a different resolution, have been produced that facilitate the formatting of the averaged data into files for input into DEPOMOD, including header information.
H:3.6 Calculation of Chemical Loads The load of chemical applied in a single treatment is based on the manufacturers’ recommended treatment strategies and is primarily determined by the biomass of fish held on the site.
The realities of fish husbandry mean that not all of the applied load reaches the fish. Some proportion of the applied medicated feed is not consumed - typically 3-10% - and is removed from the cages with its full chemical load by a combination of settling and dispersion. The actual quantity wasted will depend on the feeding method. However, due to the need to deliver an efficacious dose and the expense of the compounds, accepted practice is to present the medicated feed as the first feed of the day, when the fish are hungriest, and to keep the stock on “short-
UNCONTROLLED COPY IF PRINTED Printed: 7 June, 2005

SCOTTISH ENVIRONMENT PROTECTION AGENCY Section No.: Fish Farm-AH Page no: 26 of 140
Regulation and Monitoring of Marine Cage Fish Farming in Scotland Issue No: 3.0 Annex H Issue date: 18 May, 2005
Methods for Modelling In-feed Anti-parasitics and Benthic effects Originator: Alan Hills/Jeremy Spurway/Susan Brown/Chris Cromey
Issued by: Quality Manager Authorised by: Aquaculture Project
Management Group
rations” during the treatment period to maximise uptake. Consequently, the lower end of the observed range – 3% waste – is applied.
H:3.6.1 Calicide The feed load for TFBZ is defined as medicated feed at the manufacturer’s specified dosage rate (refer to section H:2.2.1).
The dose and formulation as applied in the modelling are:
• Active ingredient is presented at 10 mg kg-1 biomass for 7 days;
• Active ingredient is formulated at 2 g kg-1 feed.
Therefore: ][kgfeedMedicated 7*21*
10001000*10*][tbiomass
= Eq. 2.1
27*10*][tbiomass
= Eq. 2.2
35*][tbiomass= Eq. 2.3
Where “biomass” is in tonnes.
The kinetics of the conversion of medicated feed to medicated faeces is derived from published literature. In reality, as the chemical is not applied to all the feed presented during the treatment period, one would expect pulses of faeces containing quantities of medicated material, whilst at other times, uncontaminated faeces will be excreted. However, the proportion of faeces containing medicated material will be dependant on the extra feed load – an unknown quantity at the modelling stage. Therefore, the additional uncontaminated material is not taken into account within these calculations. The potential smothering effect of this extra material is also not taken into account, as no robust estimate of the seasonally fluctuating maintenance diet is determinable or available.
UNCONTROLLED COPY IF PRINTED Printed: 7 June, 2005

SCOTTISH ENVIRONMENT PROTECTION AGENCY Section No.: Fish Farm-AH Page no: 27 of 140
Regulation and Monitoring of Marine Cage Fish Farming in Scotland Issue No: 3.0 Annex H Issue date: 18 May, 2005
Methods for Modelling In-feed Anti-parasitics and Benthic effects Originator: Alan Hills/Jeremy Spurway/Susan Brown/Chris Cromey
Issued by: Quality Manager Authorised by: Aquaculture Project
Management Group
H:3.6.2 SLICE The feed load for EmBZ is presented in a time series due to the length of the excretion period – the same kinetics apply as in section H:3.6.1, however the discharge is time varying.
To summarise the discharge characteristics:
1. a quantity of medicated feed (Fa) is fed to the fish over seven days, carrying an associated applied chemical load (Ma);
2. 97% of the medicated feed is consumed (Fc); the remainder (3%) is wasted (Fw) and carries an associated chemical load (Mw);
3. of the consumed medicated feed (Fc), 10% of the active ingredient load is excreted immediately (Mt);
4. the remaining 90% (M0) of the active ingredient load, the body load, on the consumed medicated feed (Fc) is excreted at an exponential rate, 50% of any initial body load being excreted over 36 days.
These can be formulated as follows:
• EmBZ is presented at 50 µg kg-1 biomass for 7 days (refer to section H:2.2.2).
Therefore: ][)( gMloadEmBZ a µ 7100050][ ×××= tbiomass Eq. 2.4
350000][ ×= tbiomass Eq. 2.5
][)( mgMloadEmBZ a 350][ ×= tbiomass Eq. 2.6
• Active ingredient is formulated at 10 mg EmBZ kg-1 feed (refer to section H:2.2.2).
Therefore: ][)( kgFfeedMedicated a 10
][mgloadEmBZ= Eq. 2.7
35][ ×= tbiomass Eq. 2.8
UNCONTROLLED COPY IF PRINTED Printed: 7 June, 2005

SCOTTISH ENVIRONMENT PROTECTION AGENCY Section No.: Fish Farm-AH Page no: 28 of 140
Regulation and Monitoring of Marine Cage Fish Farming in Scotland Issue No: 3.0 Annex H Issue date: 18 May, 2005
Methods for Modelling In-feed Anti-parasitics and Benthic effects Originator: Alan Hills/Jeremy Spurway/Susan Brown/Chris Cromey
Issued by: Quality Manager Authorised by: Aquaculture Project
Management Group
• The division of waste and consumed feed and active ingredient are as follows:
][)( kgFfeedWaste w aF×= 03.0 Eq. 2.9
][)( mgMEmBZWaste w aM×= 03.0 Eq. 2.10
][)( kgFfeedConsumed c aF×= 97.0 Eq. 2.11
][)( mgMEmBZConsumed c aM×= 97.0 Eq. 2.12
• The treatment excretion and remaining body load of the active ingredient are thus:
][)( mgMEmBZexcretedTreatment t cM×= 1.0 Eq. 2.13
][)( 0 mgMEmBZloadBody cM×= 9.0 Eq. 2.14
• Using an exponential expression for the excretion of the compound:
TM )(0
TxeM ××= Eq. 2.15
where: T is time in days;
x is the excretion rate;
M0 is the mass of compound in the fish prior to excretion;
MT is the mass of compound excreted at time T.
UNCONTROLLED COPY IF PRINTED Printed: 7 June, 2005

SCOTTISH ENVIRONMENT PROTECTION AGENCY Section No.: Fish Farm-AH Page no: 29 of 140
Regulation and Monitoring of Marine Cage Fish Farming in Scotland Issue No: 3.0 Annex H Issue date: 18 May, 2005
Methods for Modelling In-feed Anti-parasitics and Benthic effects Originator: Alan Hills/Jeremy Spurway/Susan Brown/Chris Cromey
Issued by: Quality Manager Authorised by: Aquaculture Project
Management Group
For Emamectin the value of x can be obtained from:
)36(10050 ××= xe
36
)5.0(Lnx =
019254088.0−=x
Table 3.1 shows the proportion of an initial body load discharged over time, and illustrates that nearly 99% of the body load of chemical has been excreted from the fish after a period of 223 days:
Table 3.1 EmBZ excretion profile
Period Number of days (post treatment)
Proportion of remaining chemical
released (%)
Quantity of original chemical released
(%)
Cumulative quantity of chemical released
(%)
1 36 (43) 50 50 50
2 72 (79) 50 25 75
3 108 (115) 50 12.5 87.5
4 144 (151) 50 6.25 93.75
5 180 (187) 50 3.125 96.875
6 216 (223) 50 1.5625 98.4375
The inverse of the excretion profile obtained with Eq. 2.15 corresponds to a profile of cumulative discharge, which, by assuming complete deposition, is equivalent to accumulation of EmBZ on the seabed.
Examination of the result of applying decay to the cumulative discharge profile reveals that the maximum quantity of chemical on the seabed occurs on day 118 after treatment. All consent and modelling results pertaining to EQS levels are thus assessed on this day.
UNCONTROLLED COPY IF PRINTED Printed: 7 June, 2005
SCOTTISH ENVIRONMENT PROTECTION AGENCY Section No.: Fish Farm-AH Page no: 30 of 140
Regulation and Monitoring of Marine Cage Fish Farming in Scotland Issue No: 3.0 Annex H Issue date: 18 May, 2005
Methods for Modelling In-feed Anti-parasitics and Benthic effects Originator: Alan Hills/Jeremy Spurway/Susan Brown/Chris Cromey
Issued by: Quality Manager Authorised by: Aquaculture Project
Management Group
DEPOMOD version 2.0 and above includes the facility to specify time-series discharge profiles as ancillary input files. Feed load and chemical mass on a waste feed particle and on a faecal particle are specified for each model time-step.
The feed load should be taken from the feed load for the passing run. This should be converted into the appropriate units. This is to provide a realistic quantity of material for attachment of the chemical.
An initial time series discharge file is produced for 118 days of excretion and includes the waste feed and initial elevated excretion rate during the treatment period. This is used for the iteration refinement. This file is re-specified for each biomass scenario assessed during the iterative pursuit of compliance with EQS values.
A discharge profile file is specified for 223 days at the EQS compliant biomass for a further model run to generate the SRC.
H:3.7 Testing Model Results
H:3.7.1 Compliance testing As stated previously (section H:3.6.2), EmBZ compliance is determined on the 118th day after treatment. In contrast, TFBZ compliance is determined at the end of the treatment period (i.e., 7 days). The model predictions of chemical concentration across the model domain are tested against the standards described in section H:2.6.
Examination of the model results for aerial impact is dependent on the analysis routines available within the contouring software, Surfer (Golden Software Inc.). Model results are gridded, as described in section H:3.4.3 but with z as DEPOMOD’s concentration prediction in mass of chemical per mass of sediment. The area and volume, in terms of x-y-z values, within a user-defined contour value of z are determined by use of Surfer’s “Volume” routine.
For assessment of the far-field AZE the z-contour value is set to the far-field EQS and the resulting area compared with the area of the AZE as determined by the method above (section H:2.6.1).
The near-field assessment is a little more complex and requires iteration towards a solution. The z-contour value is repeatedly adjusted until the area bounded by the z-contour is within 1% of the near-field AZE area derived as in section H:2.6.1. The mean concentration within the near-field AZE is then determined from the following equation:
UNCONTROLLED COPY IF PRINTED Printed: 7 June, 2005

SCOTTISH ENVIRONMENT PROTECTION AGENCY Section No.: Fish Farm-AH Page no: 31 of 140
Regulation and Monitoring of Marine Cage Fish Farming in Scotland Issue No: 3.0 Annex H Issue date: 18 May, 2005
Methods for Modelling In-feed Anti-parasitics and Benthic effects Originator: Alan Hills/Jeremy Spurway/Susan Brown/Chris Cromey
Issued by: Quality Manager Authorised by: Aquaculture Project
Management Group
ionConcentrat
areavolumezarea +×
=
Where: “z” is the specified contour value in DEPOMOD output units
“concentration” is in the same units as z
“area” is the area within the specified contour
“volume” is the volume above the specified contour
H:3.7.2 Establishing “worst case” tidal conditions The TFBZ deposition footprint is sensitive to the timing of treatment relative to the state of the tide, i.e. whether undertaken during springs or neaps. The current data files produced by the template tools are configured to present the data in both neap-spring and spring-neap formats.
A common discharge scenario, typically correlating to the peak biomass, is run under both tidal conditions and the near and far-field tests applied. The tide condition resulting in the greater area of impact within the far-field EQS concentration contour, is deemed to be the “worst case”. This “worst case” tidal condition is used in all subsequent tests for EQS compliance.
Due to the length of the model runs the EmBZ deposition footprint is not significantly sensitive to the tidal condition and all runs use the spring-neap configured data.
H:3.7.3 Mass balance At sites characterised by energetic flow fields, typically where the current speeds are in excess of the critical speed for resuspension (9.5 cm s-1) for more than 10% of the near bottom hydrographic data record, a proportion of the excreted chemical is exported form the model grid through an open boundary. A mass balance is performed to determine the quantity of the chemical lost, i.e. the difference between total chemical applied and that remaining within the model domain. Care must be taken to ensure that losses due to mechanisms other than export are factored into the calculation of quantity of chemical applied. For TFBZ this is the 10% that remains within the fish and for EmBZ the cumulative excretion and decay up until day 118.
H:3.8 Reported Model Output Upon completion of modelling, SEPA requires that the following parameters be reported:
For TFBZ - the recommended Total Allowable Quantity (TAQ) of chemical (the compliant quantity) in terms of mass of chemical and the equivalent treatable biomass (tonnes).
UNCONTROLLED COPY IF PRINTED Printed: 7 June, 2005

SCOTTISH ENVIRONMENT PROTECTION AGENCY Section No.: Fish Farm-AH Page no: 32 of 140
Regulation and Monitoring of Marine Cage Fish Farming in Scotland Issue No: 3.0 Annex H Issue date: 18 May, 2005
Methods for Modelling In-feed Anti-parasitics and Benthic effects Originator: Alan Hills/Jeremy Spurway/Susan Brown/Chris Cromey
Issued by: Quality Manager Authorised by: Aquaculture Project
Management Group
For EmBZ - the recommended Total Allowable Quantity (TAQ) of chemical (the compliant quantity) in terms of mass of chemical and the equivalent treatable biomass. The Maximum Treatment Quantity (MTQ) of chemical (the quantity of chemical required to treat the peak biomass of stock), where this does not exceed the TAQ. The Site Residual Curve (SRC) from the 223 days model run which describes the amount of chemical remaining in the model domain and, as such, represents a time series of chemical accumulation and decay at the seabed.
H:3.9 Report structure Modelling reports submitted to SEPA in support of applications to discharge should conform to the standards of normal scientific reporting, for which there is a generally accepted structure, which may be summarised as follows:
• Summary
• Introduction
• Background to techniques
• Methods
• Input data
• Results
• Discussion
• Conclusions
• References
• Appendices
In addition, when preparing information for inclusion on the Public Register, cognisance should be given to the non-scientific-specialist status of the readership and also to the likely restricted access of the readership to the scientific literature. To this end, some effort should be made to summarise the findings of referred material and to provide a simplified overview of techniques employed.
In an attempt to reduce the burden of reporting on the applicant, of record maintenance on the Public Register and the environmental impact of the quantity of printed material supplied to representees, SEPA proposes that modelling reports for fish farm chemo-therapeutants be submitted in two parts. The first of these, the Methods Report, should comprise the non-site-specific aspects of the report and will be common to all applications and the second, the Technical Summary, contains the site-specific material. An applicant may submit a single Methods Report, which will be given a unique identification code within the Public Register. Thereafter any
UNCONTROLLED COPY IF PRINTED Printed: 7 June, 2005

SCOTTISH ENVIRONMENT PROTECTION AGENCY Section No.: Fish Farm-AH Page no: 33 of 140
Regulation and Monitoring of Marine Cage Fish Farming in Scotland Issue No: 3.0 Annex H Issue date: 18 May, 2005
Methods for Modelling In-feed Anti-parasitics and Benthic effects Originator: Alan Hills/Jeremy Spurway/Susan Brown/Chris Cromey
Issued by: Quality Manager Authorised by: Aquaculture Project
Management Group
applications made by the same applicant that employ the same method may submit the Technical Summary alone and refer to the Method Report by its identifying code.
The content of the two reports is described in the following sections in relation to the normal scientific report structure outlined above.
H:3.9.1 Method Report The generic aspects of the modelling process are described in an Introduction, Background to techniques, Methods, References and Appendices.
H:3.9.2 Technical Summary The site-specific material is presented in sections corresponding to Summary, Input data, Results, Discussion, Conclusion and Appendices.
H:3.10 Summary of Required Information Before commencing modelling, the following information should be available:
• 15 days current data at hourly intervals as speed in cm/s and direction for the depths specified elsewhere by SEPA
• depth of current meter deployment site and heights of data records above the seabed
• local magnetic variation at time of hydrographic data collection
• number, shape, size (depth and diameter or width), separation and layout of cages
• bathymetric depth for an area of 1km square, centred on the cage group or groups
• mean sea level for the area in which the farm is located (from Admiralty Tide Tables)
• maximum consented biomass
• annual feed load
UNCONTROLLED COPY IF PRINTED Printed: 7 June, 2005

SCOTTISH ENVIRONMENT PROTECTION AGENCY Section No.: Fish Farm-AH Page no: 34 of 140
Regulation and Monitoring of Marine Cage Fish Farming in Scotland Issue No: 3.0 Annex H Issue date: 18 May, 2005
Methods for Modelling In-feed Anti-parasitics and Benthic effects Originator: Alan Hills/Jeremy Spurway/Susan Brown/Chris Cromey
Issued by: Quality Manager Authorised by: Aquaculture Project
Management Group
H:4 AUTODEPOMOD – ALL METHODS
H:4.1 Structure of the Following Sections Technicalities of AUTODEPOMOD are described here. The remainder of the document will describe input data, a step-by-step guide on running AUTODEPOMOD and reporting of results for determining consent limits for each of chemo-therapeutants and maximum biomass.
H:4.2 The Principles of AUTODEPOMOD AUTODEPOMOD v 2 is a Windows (2000\XP) based application which embodies the SEPA method for assessing the appropriate sea-lice medicine consent limits for a specific fish farm site. Thus the concepts and tests utilised in the method are contained within the software. These concepts are outlined in sections of this document and some history to model development is given in H:2.1.6. The AUTODEPOMOD package utilises a number of ancillary software packages. These are:
• DEPOMOD V3.0 - A version of DEPOMOD written to interface with AUTODEPOMOD.
• Microsoft, Excel 2000 or 2002 (XP) - A spreadsheet package.
• Golden Software, Surfer V7.04 or V8 - A data gridding and contouring package.
• Compass Data Systems, Cm93Extract - A C-Map chart data extraction utility (optional)
• Microsoft, Internet Explorer 5.5 or 6 - A Web Browsing Package.
The appropriate versions of Excel, Surfer and Internet Explorer must be installed on a system for AUTODEPOMOD to function correctly (DEPOMOD V3.0 is installed with AUTODEPOMOD). Cm93Extract does not. However, SEPA has found the use of this package improves the efficiency of the modelling process.
Input of data into AUTODEPOMOD is made via Excel templates, text files and dialog input. The software takes this input and drives the DepomodV3.0 modules, using standard settings specified by SEPA. Output from DEPOMOD is subjected to SEPA EQS tests automatically. AUTODEPOMOD then determines if these tests have been passed or failed, and to what degree.
AUTODEPOMOD has a great deal of functionality. It has the capacity to iterate towards a pass solution and carry out multiple batch runs under different scenarios. The key aspects of this functionality will be addressed below.
A record of model information is kept by AUTODEPOMOD for each site. This information is used in the assessment of the appropriate consent limits. Once these have been determined appropriate output from AUTODEPOMOD will need to be reported to SEPA. This reporting is not done automatically.
UNCONTROLLED COPY IF PRINTED Printed: 7 June, 2005

SCOTTISH ENVIRONMENT PROTECTION AGENCY Section No.: Fish Farm-AH Page no: 35 of 140
Regulation and Monitoring of Marine Cage Fish Farming in Scotland Issue No: 3.0 Annex H Issue date: 18 May, 2005
Methods for Modelling In-feed Anti-parasitics and Benthic effects Originator: Alan Hills/Jeremy Spurway/Susan Brown/Chris Cromey
Issued by: Quality Manager Authorised by: Aquaculture Project
Management Group
H:4.3 Recommended Installation Requirements (Please Read Closely)
N.B.(5) In order to install AUTODEPOMOD V 2 correctly, it would be helpful if the user follows the following installation requirements as closely as possible. Installations which differ significantly from this may have problems. In addition SEPA cannot guarantee the success of any installation, as this may be due to factors beyond its control. Please take special note of the need for the Microsoft Service Packs (and Script Editor functions) detailed below as AUTODEPOMOD will NOT work without them. It is advisable not to try and run AUTODEPOMOD until the user has read the following section
The recommended installation requirements for AUTODEPOMOD V 2 are:
• Windows 2000 or XP.
• DEPOMOD V3.0 (this is installed during the AUTODEPOMOD installation)
• Surfer V7.04 or Surfer V8
• Excel 2000: Service Release 1a (SR-1a) and Service Pack 2 (SP-2) must also be installed (these can be obtained from: http://office.microsoft.com/downloads/).
OR
• Excel 2002: Service Pack 2 (SP-1) must also be installed (these can be obtained from: http://office.microsoft.com/downloads/).
ALSO
• Internet Explorer (IE) V5.5 or V6.0: this must be installed to ensure that the Microsoft Script Editor (MSE) is available. MSE V6 or V7 will work.
o MSE V6 may not be installed with Excel 2000. To get round this install a full version of IE V5.5.
o MSE V7 is likely to be installed with Excel 2002. However, if this is not the case a full installation of IE V6.0 may allow MSE V7 to be installed.
Installation on Windows XP (Professional) is recommended. In the event of an AUTODEPOMOD crash, the task manager facility in these operating systems can be used to shut down applications which are still running.
UNCONTROLLED COPY IF PRINTED Printed: 7 June, 2005

SCOTTISH ENVIRONMENT PROTECTION AGENCY Section No.: Fish Farm-AH Page no: 36 of 140
Regulation and Monitoring of Marine Cage Fish Farming in Scotland Issue No: 3.0 Annex H Issue date: 18 May, 2005
Methods for Modelling In-feed Anti-parasitics and Benthic effects Originator: Alan Hills/Jeremy Spurway/Susan Brown/Chris Cromey
Issued by: Quality Manager Authorised by: Aquaculture Project
Management Group
H:4.4 Recommended Installation Location (Please Read Closely)
N.B.(6) It would greatly assist SEPA’s auditing process if all external parties installed AUTODEPOMOD on a Hard Disk partition named C:
The auditing process would be assisted if this is changed to:
C:\SEPA Consent\
Finally, it would be beneficial if external parties adhered to the file structure put in place by AUTODEPOMOD.
H:4.5 Interfacing AUTODEPOMOD with Cm93Extract AUTODEPOMOD has been built to interface with the Compass Data Systems Cm93Extract utility. This application allows the extraction of bathymetric and coastline data from C-Map charts into a format that can be processed to generate a DEPOMOD model grid. AUTODEPOMOD carries out this processing automatically using Surfer, thus the bathymetric and coastline data generated by CM93Extract are in a standard Surfer format. As such, any source of bathymetric and coastline data can be used with AUTODEPOMOD as long as it is prepared in a standard Surfer format and mimics the naming convention produced by CM93Extract.
N.B.(7) One of the most important AUTODEPOMOD files is the SEPA.ini file (contained within C:\SEPA Consent\). It contains the default, SEPA recommended, settings for AUTODEPOMOD. The SEPA.ini file also details various paths to a number of files accessed by AUTODEPOMOD. SEPA.ini may be opened by any text editor, but can also be accessed via SITE and GLOBAL defaults (P17-A, Plate 13) from within the AUTODEPOMOD environment. If the file is opened in a text editor, the paths are specified near the top in the following way:
[Programs] DataFolder=\DATA Gridgen=\DEPOMOD\Gridgen#.exe Partrack=\DEPOMOD\Part#.exe Resus=\DEPOMOD\Resus#.exe Cmap=c:\WINXP\NOTEPAD.EXE
This is how the file will appear after AUTODEPOMOD installation, where # is the current executable installed with the software. The first three paths will not cause any problem or need to be changed. The fourth path will need to be altered. If CM93Extract is installed on the system then the path will need to specify the location of the CM93Extract.exe file, e.g.:
UNCONTROLLED COPY IF PRINTED Printed: 7 June, 2005
SCOTTISH ENVIRONMENT PROTECTION AGENCY Section No.: Fish Farm-AH Page no: 37 of 140
Regulation and Monitoring of Marine Cage Fish Farming in Scotland Issue No: 3.0 Annex H Issue date: 18 May, 2005
Methods for Modelling In-feed Anti-parasitics and Benthic effects Originator: Alan Hills/Jeremy Spurway/Susan Brown/Chris Cromey
Issued by: Quality Manager Authorised by: Aquaculture Project
Management Group
Cmap=c:\C-Map\CM93Extract.exe
If CM93Extract is not installed then the best course of action is to alter the path to specify the location of the Windows Notepad.exe application. This path will depend on the version of Windows the user has, e.g. for Windows NT4 it should be:
Cmap=c:\Winnt\Notepad.exe
It could also be altered to specify the application the user is using to derive bathymetric and coastline data from.
H:4.6 Computer Performance Requirements AUTODEPOMOD is likely to run satisfactorily on machines with the performance required to fulfil the installation requirements detailed above. AUTODEPOMOD and its ancillaries will operate more smoothly and quickly on a more powerful machine and one which is dedicated to the model. Some difficulty can occur using other applications on a machine which is undertaking many model iterations. The following should be considered as a minimum specification:
• Processor: 1Ghz Pentium III
• Hard Disk: 40 GB.
• Memory: 512 MB of RAMBUS memory.
• Graphics & Screen. 1024x768 minimum
However for optimal performance it is recommended to use the fastest processor available such as the Pentium IV 3.4 GHz and a Serial ATA or SCSI hard disk. If you expect to run other applications at the same time as AUTODEPOMOD a dual processor machine is recommended.
UNCONTROLLED COPY IF PRINTED Printed: 7 June, 2005

SCOTTISH ENVIRONMENT PROTECTION AGENCY Section No.: Fish Farm-AH Page no: 38 of 140
Regulation and Monitoring of Marine Cage Fish Farming in Scotland Issue No: 3.0 Annex H Issue date: 18 May, 2005
Methods for Modelling In-feed Anti-parasitics and Benthic effects Originator: Alan Hills/Jeremy Spurway/Susan Brown/Chris Cromey
Issued by: Quality Manager Authorised by: Aquaculture Project
Management Group
H:5 USING AUTODEPOMOD TO ESTIMATE CONSENT LIMITS FOR ANTI-PARASITIC CHEMICALS The following guide should enable external parties to run AUTODEPOMOD to estimate in-feed medicine consent limits, using the SEPA method. After dealing with a number of preliminary issues, the guide will begin by detailing model grid set-up. This process is common to the assessment of both Calicide and Slice. The guide will then deal with the assessment of Calicide and Slice in turn. At some points during the guide the reader will be directed to the appendices at the end of this document.
H:5.1 Overview of AUTODEPOMOD File Structure Before running AUTODEPOMOD it is helpful to become familiar with the file structure used by the system. The general file structure used by AUTODEPOMOD is outlined in Plate 1.
N.B.(8) It is assumed that the installation of AUTODEPOMOD has conformed to the recommendation made above in N.B.(6).
UNCONTROLLED COPY IF PRINTED Printed: 7 June, 2005

SCOTTISH ENVIRONMENT PROTECTION AGENCY Section No.: Fish Farm-AH Page no: 39 of 140
Regulation and Monitoring of Marine Cage Fish Farming in Scotland Issue No: 3.0 Annex H Issue date: 18 May, 2005
Methods for Modelling In-feed Anti-parasitics and Benthic effects Originator: Alan Hills/Jeremy Spurway/Susan Brown/Chris Cromey
Issued by: Quality Manager Authorised by: Aquaculture Project
Management Group
A: Main Folder on C:B: All files relating to all sites are stored in this subfolder.
C: Each site has it’s own folder with a structure created by AutoDepomod.
E: Template Files, Reporting Forms and Guidelines
D: Depomod V3 Files
Plate 1: The AUTODEPOMOD File Structure
The folder \SEPA Consent\ contains numerous critical files:
• AUTODEPOMOD.exe: the executable file for version 1 of the software which runs the AUTODEPOMOD application. For version 2 there are two applications, AUTODEPOMOD_srf7.exe and AUTODEPOMOD_srf8.exe (compiled specifically for Surfer 7 and 8 respectively).
• DisplayMaps.dll: Mapping module dll.
UNCONTROLLED COPY IF PRINTED Printed: 7 June, 2005

SCOTTISH ENVIRONMENT PROTECTION AGENCY Section No.: Fish Farm-AH Page no: 40 of 140
Regulation and Monitoring of Marine Cage Fish Farming in Scotland Issue No: 3.0 Annex H Issue date: 18 May, 2005
Methods for Modelling In-feed Anti-parasitics and Benthic effects Originator: Alan Hills/Jeremy Spurway/Susan Brown/Chris Cromey
Issued by: Quality Manager Authorised by: Aquaculture Project
Management Group
• SEPA.ini: the initialisation file which holds the recommended default settings when using AUTODEPOMOD with the SEPA method. This may only be altered as detailed in N.B.(6) and is the Global defaults .ini
The \sitename\ folder is created by AUTODEPOMOD, within \SEPA Consent\Data\, when the user creates a new site using the software.
N.B.(9) In this context the “sitename” folder should be taken as a generic name for any site folder.
It contains three critical files:
• FF-in-sitename.xls: an Excel spreadsheet used by AUTODEPOMOD for entering site administration details. This is a copy of the template file FF-in-blank.xls held in \SEPA Consent\templates\excel.
• sitename-FFMTv3.0.xls: an Excel spreadsheet used by AUTODEPOMOD for entering cage location, configuration and model grid boundary details. This is a copy of the template file FFMTv3.0.xls held in \SEPA Consent\templates\excel. sitename-FFMTv2.0.xls is an older version of the file used for AUTODEPOMOD V1.
• SEPA-sitename.ini: a text file detailing the location of critical files, and the default settings recommended by SEPA. This is a site specific copy of the template file SEPA.ini held in \SEPA Consent\.
The subfolder structure within the \sitename\ folder is detailed below:
• \Bath\: files relating to the bath treatment calculation should be placed here (see Annex G of the Fish Farm Manual at: http://www.sepa.org.uk/guidance/fishfarmmanual/manual.asp).
• \depomod\: files and subfolders relating to DEPOMOD V3 modules and Surfer.
o \gridgen\: files relating to the DEPOMOD V3 Gridgen module. Bathymetry and coastline data also need to be placed here, this is detailed in later sections.
o \mapping\: files output from the mapping module
\XLS\: output packaged in a Excel file
o \partrack\: files relating to the DEPOMOD V3 Partrack module.
\current-data\: hourly averaged current meter data must be placed here, this is detailed in later sections.
UNCONTROLLED COPY IF PRINTED Printed: 7 June, 2005

SCOTTISH ENVIRONMENT PROTECTION AGENCY Section No.: Fish Farm-AH Page no: 41 of 140
Regulation and Monitoring of Marine Cage Fish Farming in Scotland Issue No: 3.0 Annex H Issue date: 18 May, 2005
Methods for Modelling In-feed Anti-parasitics and Benthic effects Originator: Alan Hills/Jeremy Spurway/Susan Brown/Chris Cromey
Issued by: Quality Manager Authorised by: Aquaculture Project
Management Group
o \resus\: files relating to the DEPOMOD V3 Resus module. It contains critical Log files in .CSV format shown in the AUTODEPOMOD log file display (.log files)
o \site-data\: this sub-folder is no longer used and can be deleted.
o \surfer\: files relating to Surfer output from AUTODEPOMOD. It contains three critical files:
sitename-EMBZ.SRF: a Surfer template for plotting the AUTODEPOMOD output for Slice. This is a renamed copy of the template file CHEM_TEMPLATE.SRF held in \SEPA Consent\templates\Surfer.
sitename-TFBZ.SRF: a Surfer template for plotting the AUTODEPOMOD output for Calicide. This is a renamed copy of the template file CHEM_TEMPLATE.SRF held in \SEPA Consent\templates\Surfer.
sitename-BENTHIC.SRF: a Surfer template for plotting the AUTODEPOMOD output for maximum biomass modelling
CHEM_TEMPLATE.xls: a dummy Excel file needed to facilitate the AUTODEPOMOD (do not delete). This is a copy of the template file CHEM_TEMPLATE.xls held in \SEPA Consent\templates\Surfer.
• \Mail\: e-mail and communications files relating to the site.
• \Processed HG\: files relating to processed hydrographic data for the site.
• \Raw\: files relating to the raw hydrographic and meteorological data for the site.
The folder \SEPA Consent\DEPOMOD\ contains the system files for DEPOMOD V3.
The folder \SEPA Consent\templates\ contains sub-folders which contain various template files, reporting forms and Guidelines.
The subfolder structure under \templates\ folder is detailed below:
• \excel\: contains all Excel templates required for AUTODEPOMOD (see above) and the Excel templates required to format raw hydrographic data into hourly average data.
• \Forms\: contains the forms required to submit consent results to SEPA.
• \Guidelines\: contains guidelines for Slice and Calicide consent determination using DEPOMOD V2.
UNCONTROLLED COPY IF PRINTED Printed: 7 June, 2005

SCOTTISH ENVIRONMENT PROTECTION AGENCY Section No.: Fish Farm-AH Page no: 42 of 140
Regulation and Monitoring of Marine Cage Fish Farming in Scotland Issue No: 3.0 Annex H Issue date: 18 May, 2005
Methods for Modelling In-feed Anti-parasitics and Benthic effects Originator: Alan Hills/Jeremy Spurway/Susan Brown/Chris Cromey
Issued by: Quality Manager Authorised by: Aquaculture Project
Management Group
N.B.(10) These guidelines are included for additional information only, they are not controlled documents. They refer to spreadsheet software which will not be available and SEPA will have extreme difficulty accepting modelling submissions made using them. They are also more cumbersome and time consuming than the methods presented here.
• \Surfer\: contains all Surfer templates required for AUTODEPOMOD (see above).
The above file structure will be referred to throughout the following step-by-step guide.
H:5.2 Model Grid Generation In the SEPA method, farm cages are centred within a 1km square DEPOMOD model grid composed of 25m grid cells. When interfaced with CM93Extract, AUTODEPOMOD can generate a model grid quickly and easily. This grid can also be revised easily. A model grid can be constructed by AUTODEPOMOD, without CM93 Extract, as long as the user provides it with bathymetric and coastline data for the 1km square grid. This data should be in the format specified in Appendix 1.
The steps for using both data sources will be outlined below.
H:5.2 Step 1 Start AUTODEPOMOD. After the Splash Screen has gone click on the Create New Project button. The user will be presented with the dialog screen shown in Plate 2. Enter the sitename in the dialog box.
Plate 2: AUTODEPOMOD Site Input Dialog
It is helpful if this is kept as brief as possible. There are problems with long sitenames. As a guide, a sitename of no more than 10 characters should be used. After the user has entered the new sitename, AUTODEPOMOD will copy the required templates to the folders outlined in section H:5.1. It will then open the files sitename-FFMTv3.0.xls and FF-in-sitename.xls into a protected copy of EXCEL. This protected copy can only be closed using the exit buttons on each spreadsheet within it. During the manipulation of these the AUTODEPOMOD dialog will not be available.
UNCONTROLLED COPY IF PRINTED Printed: 7 June, 2005

SCOTTISH ENVIRONMENT PROTECTION AGENCY Section No.: Fish Farm-AH Page no: 43 of 140
Regulation and Monitoring of Marine Cage Fish Farming in Scotland Issue No: 3.0 Annex H Issue date: 18 May, 2005
Methods for Modelling In-feed Anti-parasitics and Benthic effects Originator: Alan Hills/Jeremy Spurway/Susan Brown/Chris Cromey
Issued by: Quality Manager Authorised by: Aquaculture Project
Management Group
H:5.2 Step 2 The protected copy of Excel will open sitename-FFMTv3.0.xls at the Cage Layout sheet.
N.B.(11) Ignore all other sheets. Do not alter anything on these sheets or press any buttons embedded on them.
The user can use the Excel Window function to switch between this and the FF-in-sitename.xls, which is also open. Using the EXIT button in either spreadsheet will return to the AUTODEPOMOD dialog.
H:5.2 Step 3 An image of the dialog is shown in Plate 3. A number of error messages are displayed on the dialog, these will be removed as various steps are carried out. An explanation of the buttons, tabs and text boxes relating to the Grid and Cage Setup is given below.
Plate 3: Grid and Cage Set up
UNCONTROLLED COPY IF PRINTED Printed: 7 June, 2005

SCOTTISH ENVIRONMENT PROTECTION AGENCY Section No.: Fish Farm-AH Page no: 44 of 140
Regulation and Monitoring of Marine Cage Fish Farming in Scotland Issue No: 3.0 Annex H Issue date: 18 May, 2005
Methods for Modelling In-feed Anti-parasitics and Benthic effects Originator: Alan Hills/Jeremy Spurway/Susan Brown/Chris Cromey
Issued by: Quality Manager Authorised by: Aquaculture Project
Management Group
P3-A Main Sitename Files (double click to open): Main Excel - opens a protected copy of Excel and sitename-FFMTv3.0.xls as the primary spreadsheet. FF-in-sitename.xls also opened.
P3-B Main Sitename Files (double click to open): Info Sheet - opens a protected copy of Excel and FF-in-sitename.xls as the primary spreadsheet. sitename-FFMTv3.0.xls also opened.
P3-C Main Sitename Files (double click to open): SRF EmBz - opens a copy of Surfer to display AUTODEPOMOD output for Slice against model grid bathymetry.
P3-D Main Sitename Files (double click to open): SRF TfBz - opens a copy of Surfer to display AUTODEPOMOD output for Calicide against model grid bathymetry.
P3-E Main Sitename Files (double click to open): Benthic - opens a copy of Surfer to display AUTODEPOMOD output for maximum biomass against model grid bathymetry.
N.B.(12) Always use the Close Program Cross (at the top right of the Surfer Window) to exit the copy of Surfer opened by clicking P3-C to P3-E. The copy can be closed by using the Program Minimise underscore, but this can lead to problems and software crashes.
P3-F Grid and Cage Setup: clicking this tab allows access to the Grid and Cage Setup dialogs shown in Plate 3.
P3-G Model Parameters: clicking this tab allows access to the Model Parameters dialogs which are used to configure model runs.
P3-H Edit Cages: opens a protected copy of Excel and sitename-FFMTv3.0.xls as the primary spreadsheet. FF-in-sitename.xls also opened.
N.B.(13) Any changes to cage and model grid limits must be made by clicking the Edit Cages button.
P3-I C-Map limits: displays model grid limits (specified within sitename-FFMTv3.0.xls). These can be entered into CM93Extract to produce bathymetric and coastline data which is used, by AUTODEPOMOD, to construct a model grid and produce a Surfer plot on which to display model results. These limits can also be used with other bathymetric and coastline data sources to achieve the same end.
P3-J Run C-Map: Starts CM93Extract or any other application specified in the loaded ini file.
P3-K C-Map Files: Indicates the presence of C-map files produced by CM93Extract and displays their names. Mimicked C-Map files will be registered here correctly as long as they are placed in the right location and conform to the format outlined in Appendix 1.
UNCONTROLLED COPY IF PRINTED Printed: 7 June, 2005

SCOTTISH ENVIRONMENT PROTECTION AGENCY Section No.: Fish Farm-AH Page no: 45 of 140
Regulation and Monitoring of Marine Cage Fish Farming in Scotland Issue No: 3.0 Annex H Issue date: 18 May, 2005
Methods for Modelling In-feed Anti-parasitics and Benthic effects Originator: Alan Hills/Jeremy Spurway/Susan Brown/Chris Cromey
Issued by: Quality Manager Authorised by: Aquaculture Project
Management Group
P3-L Generate Grid File: initiates AUTODEPOMOD to generate a Surfer Grid File from the files displayed in P3-K.
P3-M Grid Cell Size: This text box allows the user to enter the model grid cell size. This should be set at 25m.
P3-N Create Gridgen Output: initiates AUTODEPOMOD to generate model grid files that can be used by the DEPOMOD V3 Partrack module.
P3-O Messages: activates a message box which appears at the bottom of the dialog. This displays messages relating to the tasks carried out by AUTODEPOMOD.
P3-P About: displays a splash screen detailing information about AUTODEPOMOD.
P3-Q Exit: closes the AUTODEPOMOD application.
Plate 4: FF-in-sitename Information Critical to Modelling
UNCONTROLLED COPY IF PRINTED Printed: 7 June, 2005

SCOTTISH ENVIRONMENT PROTECTION AGENCY Section No.: Fish Farm-AH Page no: 46 of 140
Regulation and Monitoring of Marine Cage Fish Farming in Scotland Issue No: 3.0 Annex H Issue date: 18 May, 2005
Methods for Modelling In-feed Anti-parasitics and Benthic effects Originator: Alan Hills/Jeremy Spurway/Susan Brown/Chris Cromey
Issued by: Quality Manager Authorised by: Aquaculture Project
Management Group
H:5.2 Step 4 Use Edit Cages to access FF-in-sitename.xls. This spreadsheet file allows the user to collate information required to carry out modelling for the site. Not all columns need to be filled in. Those critical to the modelling process are highlighted in yellow on Plate 4. Fill these in and press the exit button on the sheet.
H:5.2 Step 5 Use Edit Cages to access sitename-FFMTv3.0.xls. This spreadsheet allows the user to enter information related to the site cage layout and characteristics and hydrographic data current meter position. It also allows the user to set the limits of the 1km square model grid. The Cage Layout sheet is composed of two key sections. The first of these is the Data Input Section which is shown in Plate 5. As stated on the sheet, only the yellow boxes must be filled in and green boxes show derived information. Details of up to three cage groups can be entered. An explanation of the various boxes, buttons and displays is given below:
P5-A The user can enter a 12 figure NGR position in these boxes. Enter Eastings next to the E(m) box and Northings next to the N(m) box. Once the user enters a position here the boxes at P5-B will go blank. In addition, the equivalent WGS-84 Latitude (Lat) and Longitude (Long) will be displayed in the boxes at P5-C.
UNCONTROLLED COPY IF PRINTED Printed: 7 June, 2005
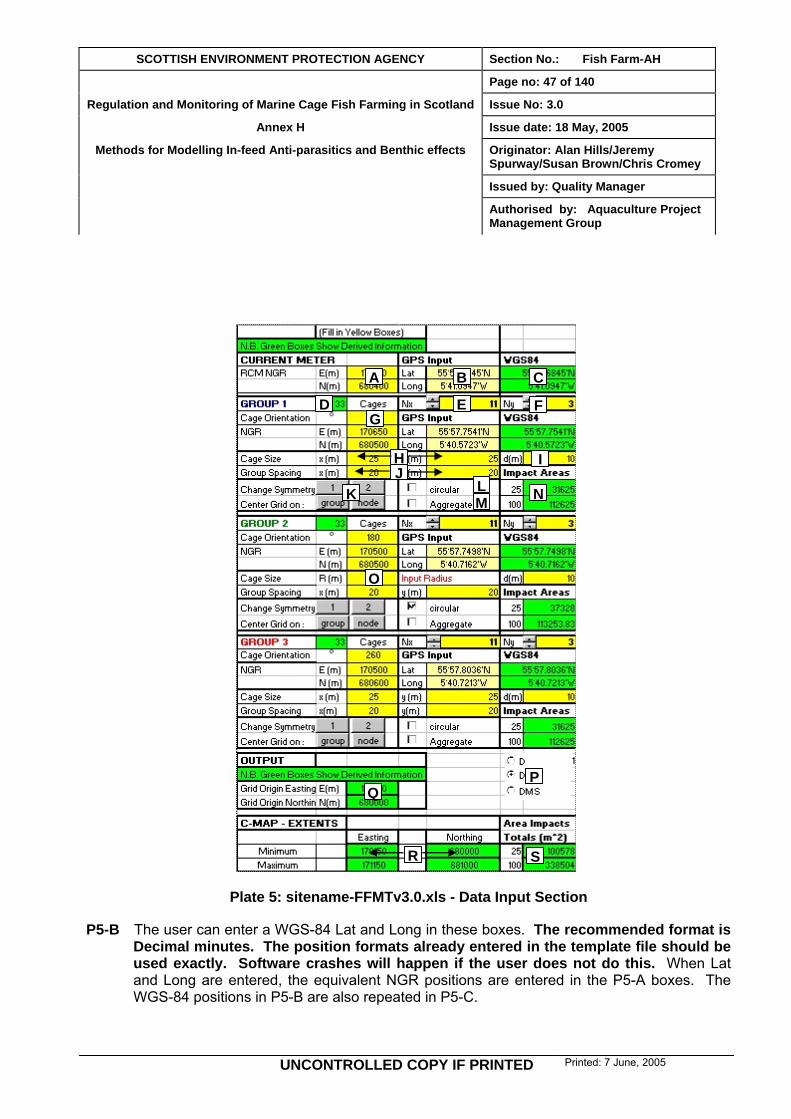
SCOTTISH ENVIRONMENT PROTECTION AGENCY Section No.: Fish Farm-AH Page no: 47 of 140
Regulation and Monitoring of Marine Cage Fish Farming in Scotland Issue No: 3.0 Annex H Issue date: 18 May, 2005
Methods for Modelling In-feed Anti-parasitics and Benthic effects Originator: Alan Hills/Jeremy Spurway/Susan Brown/Chris Cromey
Issued by: Quality Manager Authorised by: Aquaculture Project
Management Group
A B C
D E FG
H IJ
L NK
O
Q
R
M
S
P
Plate 5: sitename-FFMTv3.0.xls - Data Input Section
P5-B The user can enter a WGS-84 Lat and Long in these boxes. The recommended format is Decimal minutes. The position formats already entered in the template file should be used exactly. Software crashes will happen if the user does not do this. When Lat and Long are entered, the equivalent NGR positions are entered in the P5-A boxes. The WGS-84 positions in P5-B are also repeated in P5-C.
UNCONTROLLED COPY IF PRINTED Printed: 7 June, 2005

SCOTTISH ENVIRONMENT PROTECTION AGENCY Section No.: Fish Farm-AH Page no: 48 of 140
Regulation and Monitoring of Marine Cage Fish Farming in Scotland Issue No: 3.0 Annex H Issue date: 18 May, 2005
Methods for Modelling In-feed Anti-parasitics and Benthic effects Originator: Alan Hills/Jeremy Spurway/Susan Brown/Chris Cromey
Issued by: Quality Manager Authorised by: Aquaculture Project
Management Group
P5-C These are the equivalent WGS-84 positions to those displayed in either or both P5-A and P5-B. Their format can be controlled by selecting the appropriate radio button in P5-P.
P5-D The number of cages in the appropriate group. This value is altered by P5-E and P5-F.
P5-E The number of cages in the longest (longitudinal or x) axis of the cage group. This can be altered by editing the yellow box or by using the arrows adjacent to this. Enter zero to remove the appropriate cage group the model grid.
P5-F The number of cages in the shortest (transverse or y) axis of the cage group. This can be altered by editing the yellow box or by using the arrows adjacent to this. Enter zero to remove the appropriate cage group from the model grid. Up to three rows of cages can be entered.
P5-G The orientation of the longest axis of the cage group in degrees relative to Grid North.
P5-H The (rectangular or square) cage size can be entered in these boxes. Follow the x and y conventions outlined in P5-E and P5-F.
P5-I The working depth (i.e. net depth) of the cages in this group.
P5-J The spacing between cage centres in this group can be entered in these boxes. Follow the x and y conventions outlined in P5-E and P5-F.
P5-K These buttons allow the user to change the symmetry of the cages around the central longest (x) axis of the cage group. They also allow the user to place the cage group, or the primary cage location (i.e. that entered as the position for the group), at the centre of the 1km square grid defined in P5-R. Use of the group centering function is not recommended.
P5-L Clicking this box allows the user to specify that the cage group is composed of circular cages.
P5-M Clicking this box allows the user to aggregate rows of parallel square cages. This feature was introduced because of the cage number limit imposed by DEPOMOD V2. It is now redundant and should not need to be used.
P5-N Displays the 25m and 100m Allowable Zone of Effects (AZE) for the cage group for anti-parasitic chemical modelling in m2 (see section H:2.6.1 above). This can be calculated for cage groups composed of entirely of circular or square cages. The method for the circular cage calculation breaks down when the cage separation is large. When this happens the boxes will turn red. Should this occur, then it may be worth considering separating cages with overlapping AZEs into discrete cage groups. The total AZE for a site for anti-parasitic chemical modelling is simply the sum of the AZEs for each individual cage group. No account is taken of any cage-group AZE overlap (see N.B.(4) and P5-S).
UNCONTROLLED COPY IF PRINTED Printed: 7 June, 2005

SCOTTISH ENVIRONMENT PROTECTION AGENCY Section No.: Fish Farm-AH Page no: 49 of 140
Regulation and Monitoring of Marine Cage Fish Farming in Scotland Issue No: 3.0 Annex H Issue date: 18 May, 2005
Methods for Modelling In-feed Anti-parasitics and Benthic effects Originator: Alan Hills/Jeremy Spurway/Susan Brown/Chris Cromey
Issued by: Quality Manager Authorised by: Aquaculture Project
Management Group
P5-O If circular cages have been specified enter the radius of the cages in the group here.
P5-P Click on these radio buttons to specify the format of the lat and long positions displayed in the boxes represented by P5-C. D: Decimal Degrees, DM: Degrees Decimal Minutes, DMS: Degrees Minutes and Seconds.
P5-Q The current grid model origin in Eastings and Northings (see section H:5.2 Step 6).
P5-R The current model grid extents in Eastings and Northings (see section H:5.2 Step 6).
P5-S The total AZE for all the cage groups in the model grid for anti-parasitic chemical modelling. All model output will be assessed against these values (see N.B.(4) and P5-N above).
H:5.2 Step 6 Many of the buttons outlined above manipulate the second key section of the Cage Layout sheet which is shown in Plate 6.
UNCONTROLLED COPY IF PRINTED Printed: 7 June, 2005
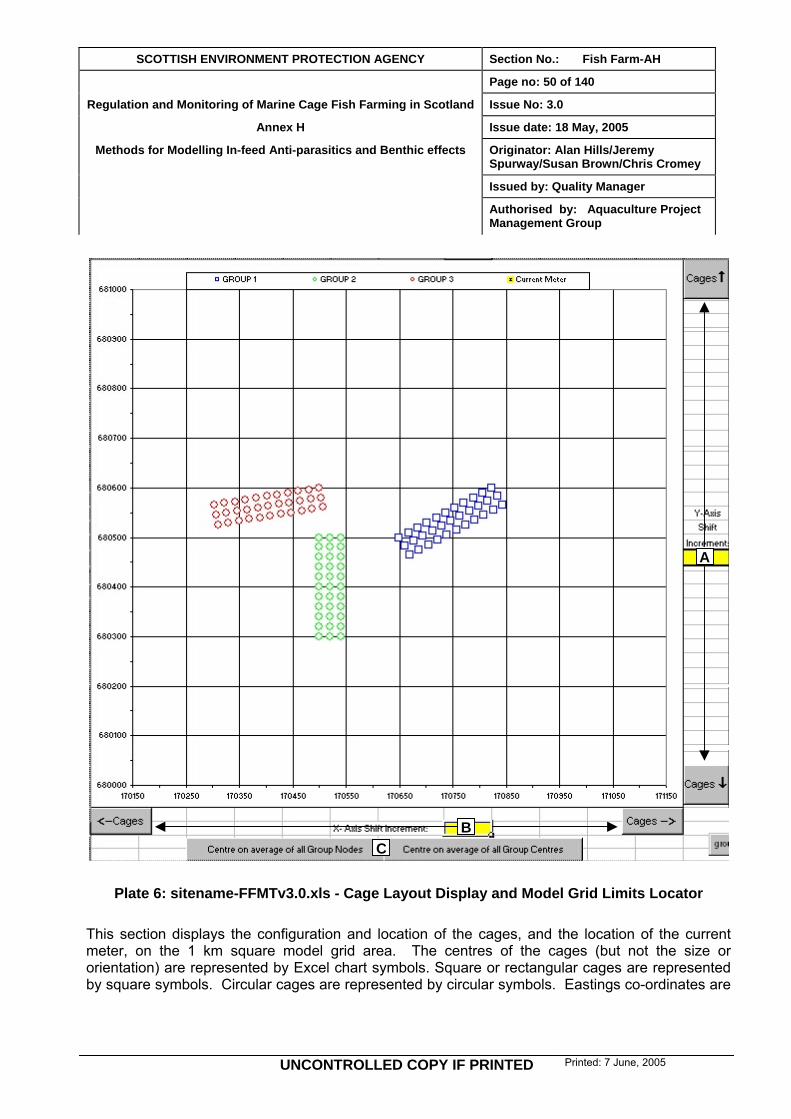
SCOTTISH ENVIRONMENT PROTECTION AGENCY Section No.: Fish Farm-AH Page no: 50 of 140
Regulation and Monitoring of Marine Cage Fish Farming in Scotland Issue No: 3.0 Annex H Issue date: 18 May, 2005
Methods for Modelling In-feed Anti-parasitics and Benthic effects Originator: Alan Hills/Jeremy Spurway/Susan Brown/Chris Cromey
Issued by: Quality Manager Authorised by: Aquaculture Project
Management Group
A
CB
Plate 6: sitename-FFMTv3.0.xls - Cage Layout Display and Model Grid Limits Locator
This section displays the configuration and location of the cages, and the location of the current meter, on the 1 km square model grid area. The centres of the cages (but not the size or orientation) are represented by Excel chart symbols. Square or rectangular cages are represented by square symbols. Circular cages are represented by circular symbols. Eastings co-ordinates are
UNCONTROLLED COPY IF PRINTED Printed: 7 June, 2005
SCOTTISH ENVIRONMENT PROTECTION AGENCY Section No.: Fish Farm-AH Page no: 51 of 140
Regulation and Monitoring of Marine Cage Fish Farming in Scotland Issue No: 3.0 Annex H Issue date: 18 May, 2005
Methods for Modelling In-feed Anti-parasitics and Benthic effects Originator: Alan Hills/Jeremy Spurway/Susan Brown/Chris Cromey
Issued by: Quality Manager Authorised by: Aquaculture Project
Management Group
given on the x-axis of the chart with Northings given on the y-axis. An explanation of the buttons and boxes shown on Plate 6 is given below.
P6-A These buttons can shift the y-axis up or down (making the cages appear to move up or down) by the increment (in meters) entered in the yellow box.
P6-B These buttons can shift the x-axis to the left or to the right (making the cages appear to move left or right) by the increment (in meters) entered in the yellow box.
P6-C These buttons are similar to those described in P5-K. Their use is not recommended.
H:5.2 Step 7 Use the features of sitename-FFMTv3.0.xls outlined in sections H:5.2 Step 5 and H:5.2 Step 6 to enter the cage configuration and layout details for the site. Centre the cages close to the centre of the 1 km square model grid area as possible. This is best done by eye.
N.B.(14) As a guide, it is best to try and minimise the escape of particles from the model grid area. Consideration of the hydrographic data, and knowledge of the coastline geometry, may help in this regard. Centring the cages is a good starting point but it may not always be the optimal solution.
H:5.2 Step 8 Once the user is satisfied with the cage layout exit sitename-FFMTv3.0.xls using the Exit button on the Cage Layout Sheet. Check that the values displayed in P3-I have been updated to those determined in H:5.2 Step 6.
N.B.(15) If CM93Extract is installed on the system follow H:5.2 Step 9 to H:5.2 Step 13 otherwise follow H:5.2 Step 14 to H:5.2 Step 15. Even if the user does not have CM93Extract it is advisable to read through the sections relating to its use, in order to become familiar with the principles involved when using data to generate a model grid.
H:5.2 Step 9 Press button P3-J to run CM93Extract. The main AUTODEPOMOD dialog will disappear and be replaced by the two dialogs shown below in
H:5.2 Step 10 Plate 7. The details and use of the major buttons on these dialogs are outlined below.
P7-A These radio buttons control the datum of the chart data to be extracted from the C-Map files. It should always be set to: Datum of Original Chart.
P7-B This drop-down menu allows the user to select a datum, that may be used to apply a co-ordinate transformation to the available C-Map chart data. The user should use it to
UNCONTROLLED COPY IF PRINTED Printed: 7 June, 2005

SCOTTISH ENVIRONMENT PROTECTION AGENCY Section No.: Fish Farm-AH Page no: 52 of 140
Regulation and Monitoring of Marine Cage Fish Farming in Scotland Issue No: 3.0 Annex H Issue date: 18 May, 2005
Methods for Modelling In-feed Anti-parasitics and Benthic effects Originator: Alan Hills/Jeremy Spurway/Susan Brown/Chris Cromey
Issued by: Quality Manager Authorised by: Aquaculture Project
Management Group
select: Ord. Surv. 1936 - Scotland-Shetland. Please note that this is not the default datum.
A
B
C
D
Plate 7: CM93Extract - Grid Generation Dialogs 1
UNCONTROLLED COPY IF PRINTED Printed: 7 June, 2005

SCOTTISH ENVIRONMENT PROTECTION AGENCY Section No.: Fish Farm-AH Page no: 53 of 140
Regulation and Monitoring of Marine Cage Fish Farming in Scotland Issue No: 3.0 Annex H Issue date: 18 May, 2005
Methods for Modelling In-feed Anti-parasitics and Benthic effects Originator: Alan Hills/Jeremy Spurway/Susan Brown/Chris Cromey
Issued by: Quality Manager Authorised by: Aquaculture Project
Management Group
P7-C This drop-down menu box specifies the projection to be used when transforming C-Map chart data to another co-ordinate system. It can only be set to: British National Grid. No other option is possible.
P7-D This dialog is produced by AUTODEPOMOD. It displays the maximum and minimum limits of the 1 km square model grid defined during H:5.2 Step 6.
H:5.2 Step 11 Once the changes and checks, detailed in H:5.2 Step 9, have been made hit the Next button. The dialogs shown in
H:5.2 Step 12 Plate 7 will be replaced by those shown in Plate 8.
Plate 8: CM93Extract - Grid Generation Dialogs 2
UNCONTROLLED COPY IF PRINTED Printed: 7 June, 2005

SCOTTISH ENVIRONMENT PROTECTION AGENCY Section No.: Fish Farm-AH Page no: 54 of 140
Regulation and Monitoring of Marine Cage Fish Farming in Scotland Issue No: 3.0 Annex H Issue date: 18 May, 2005
Methods for Modelling In-feed Anti-parasitics and Benthic effects Originator: Alan Hills/Jeremy Spurway/Susan Brown/Chris Cromey
Issued by: Quality Manager Authorised by: Aquaculture Project
Management Group
The details and use of the major areas and buttons on these dialogs are outlined below.
P8-A This area allows the user to specify the chart from which data will be extracted. In order for any charts to be selected the check box next to Bathymetry must be checked. After this has been done the user can specify the range of chart scales available for data extraction. The scales are represented by the letters C to G, with C being the largest scale available and G being the smallest. Multiple scales can be selected, however, this is not recommended.
P8-B This area allows the user to specify the scale of the charts to be displayed in area P8-H and P8-I. The scales are represented by the letters C to G, with C being the largest scale available and G being the smallest. This corresponds exactly to the scale reference outlined for area P8-A.
P8-C After changing the display in area P8-I, using the buttons in area P8-B, button P8-C can be used to update the display to show the land areas in the selected charts.
P8-D Enter the Eastings and Northings extents of the 1km square area determined in H:5.2 Step 6. This information is displayed in P8-K. The chosen area is also outlined in red, in area P8-I.
P8-E This check box allows the user to select whether or not coastline data is extracted along with bathymetric data. It must be checked on.
P8-F This text box allows the user to specify the depth value that is associated with the coastline data. In the SEPA method it must be set to -4.
P8-G This drop down menu allows the user to select whether or not the extracted chart depths are assigned positive or negative values. In the SEPA method, they must be given positive values.
P8-H This area lists the available charts from which data can be extracted. This list will vary according to the various settings chosen at any one time.
P8-I The chart, land and grid extents display area.
P8-J This area displays the Latitude and Longitude (OSGB36 Datum), and the associated 12 figure NGR, of the position that the cursor is hovering over when in area P8-I.
P8-K This dialog is produced by AUTODEPOMOD. It displays the maximum and minimum limits of the 1 km square model grid defined during H:5.2 Step 6.
Use the dialogs detailed above to select the most appropriate chart from which to extract bathymetric and coastline data. It is best to enter the grid extent information in area P8-D first. As a general rule, the smallest scale of chart available for the area should be chosen. Thus the smallest scale chart (i.e. C) should then be selected in both P8-A and P8-B. If
UNCONTROLLED COPY IF PRINTED Printed: 7 June, 2005

SCOTTISH ENVIRONMENT PROTECTION AGENCY Section No.: Fish Farm-AH Page no: 55 of 140
Regulation and Monitoring of Marine Cage Fish Farming in Scotland Issue No: 3.0 Annex H Issue date: 18 May, 2005
Methods for Modelling In-feed Anti-parasitics and Benthic effects Originator: Alan Hills/Jeremy Spurway/Susan Brown/Chris Cromey
Issued by: Quality Manager Authorised by: Aquaculture Project
Management Group
H:5.2 Step 13 Once the changes and checks, detailed in H:5.2 Step 11, have been made hit the Next button. The dialogs shown in Plate 8 will be replaced by that shown in Plate 9 (The grid extents dialog will still be open but is not shown here). The details and use of the buttons and menus on this dialog are outlined below.
P9-A This drop down menu allows the user to specify the format of the extracted chart data. In the SEPA method, it must be set to: Surfer 6.0 File.
A
B
C
Plate 9: CM93Extract - Grid Generation Dialogs 3
P9-B This button opens a saving dialog which allows the user to specify the location and filename of the extracted bathymetric data. These data will be saved in a comma separated variables (sitename.csv) file.
UNCONTROLLED COPY IF PRINTED Printed: 7 June, 2005
SCOTTISH ENVIRONMENT PROTECTION AGENCY Section No.: Fish Farm-AH Page no: 56 of 140
Regulation and Monitoring of Marine Cage Fish Farming in Scotland Issue No: 3.0 Annex H Issue date: 18 May, 2005
Methods for Modelling In-feed Anti-parasitics and Benthic effects Originator: Alan Hills/Jeremy Spurway/Susan Brown/Chris Cromey
Issued by: Quality Manager Authorised by: Aquaculture Project
Management Group
P9-C This button opens a saving dialog which allows the user to specify the location and filename of the extracted land data. These data will be saved in a Golden Software Blanking (sitename.bln) file.
Use the buttons on this dialog to specify where both of the extracted data files are to be saved. They must be saved to the same location. The generic location is specified below:
C:\SEPA Consent\Data\sitename\depomod\gridgen\
N.B.(16) In this case “sitename” should be taken as a generic name for any site. Thus the extracted data files must have exactly the same name as the site the user has created (see N.B.(9)) .
In addition to the files specified above, two further files will be saved to this location. These are:
• sitename.ini: a text file containing information about the settings and choices made during the data extraction process. The grid extents information contained within this file is critical to the model grid generation process.
• sitename.log: a text file containing the same information as sitename.ini with extra technical information. This file is not critical for the model grid generation process.
Once the location has been specified hit the Finish button to extract the data and OK and Close to return to the main dialog. The boxes shown in P3-K should be filled in with the files specified above. In addition the Cmap INI File problem message below P3-J will disappear.
H:5.2 Step 14 If CM93Extract is not installed on the system then the user will have to prepare files, similar to those produced by the software. Three files are required by AUTODEPOMOD to generate a model grid. The required format and content of these files is detailed in Appendix 1. However, they are described briefly here:
• sitename.csv: this file must contain all available bathymetric and coastline data within the chosen 1 km square model grid area. For contouring purposes, coastline values must be included in this file and given the value of -4.
• sitename.bln: this file must contain all available coastline data within the chosen 1 km square model grid area.
N.B.(17) The source of all bathymetric and coastline data must be declared explicitly in any reporting. It is strongly recommended that all bathymetric and coastline data be sourced from UK Hydrographic Office Admiralty Charts. Coastline data should not be extracted from Ordnance Survey maps. In areas with poor chart coverage, Admiralty Chart data may be
UNCONTROLLED COPY IF PRINTED Printed: 7 June, 2005
SCOTTISH ENVIRONMENT PROTECTION AGENCY Section No.: Fish Farm-AH Page no: 57 of 140
Regulation and Monitoring of Marine Cage Fish Farming in Scotland Issue No: 3.0 Annex H Issue date: 18 May, 2005
Methods for Modelling In-feed Anti-parasitics and Benthic effects Originator: Alan Hills/Jeremy Spurway/Susan Brown/Chris Cromey
Issued by: Quality Manager Authorised by: Aquaculture Project
Management Group
supplemented and/or corrected with additional soundings. These should be made carefully. Good positional information and accurate depth soundings are essential. In addition, make sure that all soundings are corrected for approximate tidal height, thus correcting them to Chart Datum, before including them in sitename.csv. Please see Attachment VIII of the SEPA Fish Farming Manual for further guidance on how to collect hydrographic data.
• sitename.ini: this file contains the positions of the four corners of the 1 km square model grid.
Prepare the 3 files as detailed in Appendix 1.
H:5.2 Step 15 Make sure AUTODEPOMOD is closed down and place the files generated during H:5.2 Step 14 in location:
C:\SEPA Consent\Data\sitename\depomod\gridgen\
Restart AUTODEPOMOD. If named correctly, the files should register in P3-K. Before proceeding check that there are no error messages (in red) below P3-J. In version 2 of AUTODEPOMOD, once these three files have been created the files can be loaded by double clicking on the white boxes in the C-Map files panel. It is not usually necessary to restart AUTODEPOMOD.
H:5.2 Step 16 Make sure that a Grid Cell Size of 25 m is entered in P3-M and that the Surfer visible checkbox is ticked. Hit the Generate Grid File shown in P3-L. This will activate Surfer to manipulate the extracted chart data to produce a Surfer Grid of the model area. A dialog will appear indicating progress. Once this has occurred AUTODEPOMOD will open a copy of Surfer and, using the newly created Surfer Grid, will display a plot of the model grid area bathymetry, with the cages and current meter positions shown. Close this using the Close Program Cross (see N.B.(12)). Note that after the user has closed Surfer, the text on P3-L will have changed to Refresh Grid Ref.
H:5.2 Step 17 Hit the Create Gridgen Output shown in P3-N. This activates Surfer, Excel and the DEPOMOD Gridgen module and manipulates them to produce files which reflect the grid generation choices made above. These can be used by the DEPOMOD Partrack module. Note that after the user has hit P3-N the Not all Gridgen files exist message will change to Gridgen Files Exist. In addition, the text on P3-N will change to ReCreate Gridgen Output. Similarly the NO GRIDGEN OUTPUT to the right of P3-G will be removed.
H:5.2 Step 18 If the user is unsatisfied with the model grid they have chosen, repeat H:5.2 Step 5 to H:5.2 Step 17. Do this each time a change is made to make sure that any alterations are carried through to the Gridgen files produced in H:5.2 Step 17. This is critical for the next stage. If the user changes the model grid origin, the error message Coordinate Mismatch Cage Layout vs
UNCONTROLLED COPY IF PRINTED Printed: 7 June, 2005

SCOTTISH ENVIRONMENT PROTECTION AGENCY Section No.: Fish Farm-AH Page no: 58 of 140
Regulation and Monitoring of Marine Cage Fish Farming in Scotland Issue No: 3.0 Annex H Issue date: 18 May, 2005
Methods for Modelling In-feed Anti-parasitics and Benthic effects Originator: Alan Hills/Jeremy Spurway/Susan Brown/Chris Cromey
Issued by: Quality Manager Authorised by: Aquaculture Project
Management Group
Cmap INI appear beneath P3-J. This message will be removed when the user has matched up the new grid origin with the information in the files detailed in P3-K.
H:5.2 Step 19 This completes setting up the model grid. If the user is setting up AUTODEPOMOD for anti-parasitic chemicals, then continue to read the following sections. If the user is setting the model up for maximum biomass consent modelling then go to H:7.3.
H:5.3 Key Modelling Concepts Relating to AUTODEPOMOD
H:5.3.1 Particle Numbers One of the key input parameters into AUTODEPOMOD is the number of particles which are released per cage per time step (part/cage/∆t). These particles represent faecal and waste feed in the model. In reality a very large number of particles are released from a fish farm site. We cannot model every one of these so, following the principle that groups of them (often with different settling velocities) will follow similar paths, we choose to model a number of particles which should describe the behaviour of groups of particles. If the number of particles released during a model run is small then, depending on the number of time steps, an inaccurate simulation of deposition could result. Since we are modelling a small number of particle groups, we are not covering as many possibilities. Thus, the model result would be a poor description of the real particle deposition footprint. Increasing the number of particles released will generally increase the accuracy of the model result. However, this increase in accuracy is not limitless. There will be a point in any simulation, beyond which, no increase significant in accuracy will be gained from an increase in part/cage/∆t. In addition increasing part/cage/∆t increases the time required to achieve a model run result. AUTODEPOMOD does not allow an input of more than 30 part/cage/∆t.
In an effort to balance computational time against estimates of accuracy, and achieve consistency between sites, SEPA has determined that a value of 10 part/cage/∆t should be used when making final consent limit assessments for Slice and Calicide.
N.B.(18) SEPA recognises that further work is required with respect to particle numbers. SEPA suggest that the current recommended setting (10 part/cage/∆t) is used for regulatory modelling, to ensure fair and consistent consent assessment. Within AUTODEPOMOD there is a dialog box which recommends a part/cage/∆t to be used when carrying out a consent assessment. The recommended minimum is based on work carried out by the Scottish Association for Marine Science (SAMS) and the recommendation varies from site to site. In many cases the recommended minimum part/cage/∆t is not much greater than 10, sometimes it is less. This is the setting recommended by SAMS and could be used for any investigative modelling and as a basis for further work in this area. Some additional information on particle numbers and a graphic output showing the effect of particle numbers on deposition footprints is given in P19-A.
UNCONTROLLED COPY IF PRINTED Printed: 7 June, 2005

SCOTTISH ENVIRONMENT PROTECTION AGENCY Section No.: Fish Farm-AH Page no: 59 of 140
Regulation and Monitoring of Marine Cage Fish Farming in Scotland Issue No: 3.0 Annex H Issue date: 18 May, 2005
Methods for Modelling In-feed Anti-parasitics and Benthic effects Originator: Alan Hills/Jeremy Spurway/Susan Brown/Chris Cromey
Issued by: Quality Manager Authorised by: Aquaculture Project
Management Group
H:5.3.2 The Principle of Running AUTODEPOMOD to Achieve EQS Compliance For each site assessed, a model run result will exist in which the various EQS criteria are complied with exactly. This model run will be linked to a particular biomass to be treated which equates to a Medicine Mass (MM) released into the model domain. This is the maximum mass of medicine that, based on the SEPA method, can be used at the site. It is called the Total Allowable Quantity (TAQ) (see H:3.8).
N.B.(19) The input of MM in AUTODEPOMOD is controlled by entering a biomass of fish to be treated. The MM required to treat this biomass is calculated using the dosage and feeding regimes recommended by the medicine manufacturers. SEPA recognises that actual feeding regimes may differ, depending on fish appetite. However, it is difficult to incorporate this unknown factor into the consent setting process.
It would be very difficult and time consuming to determine the TAQ exactly. Therefore, SEPA considers that if a model result is within +/-1% of all the EQS criteria, compliance is deemed to have been achieved.
It is not easy to guess the MM which will give a model result within the compliance range specified above. In addition, the relationship between MM and compliance is often not linear and varies from site to site. Thus, a search through all the possible MMs that can be applied, must be performed. For Calicide, the upper limit to this search would be the MM required to treat the peak biomass at the site. For Slice it would be 5 times this value.
The search could take the form of a linear reduction of MM inputted into the model. After an unknown number of runs, compliance would be achieved. If this were to lie outside the +/- 1% range then further runs would be required to increase MM to get a result within this range. This search method is inefficient but it could be easily automated.
Another way of searching would be to have a modeller use their educated guess, based on the results of several model runs, to refine the MM input to get within the +/- 1% range. This is more efficient than a linear search but the process cannot be easily automated.
A efficient way of searching, that can be easily automated, is the binary search method. This is outlined below.
H:5.3.3 The Binary Search Method for Slice and Calicide The basic iterative method used by AUTODEPOMOD is called the binary search. This can be used when performing Slice and Calicide assessments. In a binary search the upper limit MM is modelled first. If the result of this model run does not comply with EQS criteria then the MM value is halved and the model ran again. There are three possible outcomes of this second run:
• Compliance is achieved and the result is within the +/- 1% range, unlikely but still possible.
UNCONTROLLED COPY IF PRINTED Printed: 7 June, 2005

SCOTTISH ENVIRONMENT PROTECTION AGENCY Section No.: Fish Farm-AH Page no: 60 of 140
Regulation and Monitoring of Marine Cage Fish Farming in Scotland Issue No: 3.0 Annex H Issue date: 18 May, 2005
Methods for Modelling In-feed Anti-parasitics and Benthic effects Originator: Alan Hills/Jeremy Spurway/Susan Brown/Chris Cromey
Issued by: Quality Manager Authorised by: Aquaculture Project
Management Group
• Compliance is achieved outside the +/- 1% range. Thus we know that the exact compliance result is produced by a MM somewhere between the upper limit MM and half of this value.
• Compliance is not achieved. Thus we know that the exact result is produced by a MM somewhere between zero and half of the upper limit MM.
It can be seen that the first run will reduce the search range by half. This method can be repeated until compliance is achieved close to, or within, the +/- 1% range. It can be appreciated that this method is reasonably efficient and can be easily automated.
H:5.3.4 The Binary Search, with Accuracy Offset, Method. Differences in discharge time between Slice and Calicide mean that Slice model runs take longer than Calicide runs. The final consent assessment for Slice and Calicide must be carried out with 10 part/cage/∆t. However, it is possible to use a lower accuracy model result to get near to the +/- 1% EQS compliance range without carrying out time consuming 10 part/cage/∆t runs.
In this method two initial runs are made at the upper limit MM using 1 and 10 part/cage/∆t. An approximate offset in AZE compliance between the two runs can then be calculated. This offset is not constant with respect to variations in MM. However, the variation is not so great as to render it of no use. A binary search is carried out using 1 part/cage/∆t. The AZE offset is applied to each model result to estimate whether or not compliance would be achieved if 10 part/cage/∆t had been used. Once compliance at this level of accuracy is predicted a 10 part/cage/∆t run is carried out to confirm whether or not is the case. Often, this result will not be within the +/- 1% EQS compliance range, but it will be near. A binary search using 10 part/cage/∆t can then be carried out to get within this range.
It is also possible to use AUTODEPOMOD to carry out a binary search without using the accuracy offset estimation. In this way a binary search can be performed using 1 part/cage/∆t until compliance is achieved. AUTODEPOMOD will then carry out a run, using the same MM but with 10 part/cage/∆t.
These processes are automated within AUTODEPOMOD.
UNCONTROLLED COPY IF PRINTED Printed: 7 June, 2005

SCOTTISH ENVIRONMENT PROTECTION AGENCY Section No.: Fish Farm-AH Page no: 61 of 140
Regulation and Monitoring of Marine Cage Fish Farming in Scotland Issue No: 3.0 Annex H Issue date: 18 May, 2005
Methods for Modelling In-feed Anti-parasitics and Benthic effects Originator: Alan Hills/Jeremy Spurway/Susan Brown/Chris Cromey
Issued by: Quality Manager Authorised by: Aquaculture Project
Management Group
H:5.4 Slice Consent Limit Assessment
H:5.4 Step 1 The Model parameters are shown in Plate 10. An explanation of the buttons, tabs and text boxes on the dialog is given below.
BD
R N
A
J IGF
E C
K H
X
O
VY
TWZ
P QUAA
LM
S
Plate 10: AUTODEPOMOD Main Dialog - Slice Consent Limit Assessment (this dialog shows version 1 of the model and so does not show the Benthic modelling radio button). Chemical
modelling features are the same between version 1 and 2.
P10-A Slice (Emamectin): Use this radio button to select the buttons and text boxes required to carry out a Slice consent limit assessment.
P10-B Calicide (Teflubenzuron): Use this radio button to select the buttons and text boxes required to carry out a Calicide consent limit assessment.
P10-C Biomass to model: This text box allows the user to enter the biomass of fish to be treated with medicine. The biomass determines the Medicine Mass (MM) released during a model run. The value entered here can be used to carry out an assessment at one MM, or it
UNCONTROLLED COPY IF PRINTED Printed: 7 June, 2005

SCOTTISH ENVIRONMENT PROTECTION AGENCY Section No.: Fish Farm-AH Page no: 62 of 140
Regulation and Monitoring of Marine Cage Fish Farming in Scotland Issue No: 3.0 Annex H Issue date: 18 May, 2005
Methods for Modelling In-feed Anti-parasitics and Benthic effects Originator: Alan Hills/Jeremy Spurway/Susan Brown/Chris Cromey
Issued by: Quality Manager Authorised by: Aquaculture Project
Management Group
may be used as the upper limit MM for a binary search (see section H:5.3). Typically 5 times the peak biomass at a site is entered here, in the first instance, when carrying out Slice assessment.
P10-D PARTICLES (minimum, use minimum): This box recommends a particle number, the number of particles released per cage per model time step, (part/cage/∆t) based on a recommendation by SAMS (see N.B.(18)). The check box to the right allows the user to accept this recommendation and override the settings made using P10-F and P10-G. The minimum particle number recommended for Slice is always 1, due to the large number of particles released during a simulation. This feature is only applicable to Calicide modelling.
P10-E Red’d consent mass: This text box displays the recommended consent mass (in grams) of Teflubenzuron. This figure is calculated, automatically, from the biomass entry in P10-C.
P10-F Initial\Single Run: This drop down menu allows the user to select the part/cage/∆t, up to a maximum of 30, for a single model run. This value will also be used as the low accuracy setting during an Accuracy Offset Binary Search (see section H:5.3).
P10-G Refine at: This drop down menu is the same at that in P10-F. However, this part/cage/∆t number will be used as the high accuracy (and final consent assessment value) setting during an Accuracy Offset Binary Search (see section H:5.3).
P10-H Current files: This area provides information that confirms that the appropriate current meter data files are available to AUTODEPOMOD. The Recheck button in this area allows AUTODEPOMOD to update this information if changes have been made. Please see Appendix 2 for information relating to the preparation and formatting of current meter data for use with AUTODEPOMOD.
P10-I Food Load: This is the amount of food applied to the site over the time scale specified in P10-J. Please see section H:2.5 for more details on why this value is required. The annual average food load is often entered here.
P10-J Mnths: This is the timescale (in months) over which the value of food load, entered in P10-I, is distributed over. It is often 12 months.
P10-K Over 36 days: This is the amount of food, based on entries in P10-I and P10-J, applied, on average, to the site in a 36 day period. It is important to try and estimate this value in such a way that it represents the average situation at the site.
P10-L Period: These radio buttons are used to select the length of time over which an assessment model run is carried out; 118 or 223 days. Theory, and field data, suggests that the maximum mass of emamectin on the seabed will occur, on average, at approximately 118 days after treatment begins. Thus, EQS compliance is assessed on the results of a 118 day model run. A 223 day model run is required to generate an SRC for the site, to enable retreatment. Please see section H:3.6.2 for more information.
UNCONTROLLED COPY IF PRINTED Printed: 7 June, 2005

SCOTTISH ENVIRONMENT PROTECTION AGENCY Section No.: Fish Farm-AH Page no: 63 of 140
Regulation and Monitoring of Marine Cage Fish Farming in Scotland Issue No: 3.0 Annex H Issue date: 18 May, 2005
Methods for Modelling In-feed Anti-parasitics and Benthic effects Originator: Alan Hills/Jeremy Spurway/Susan Brown/Chris Cromey
Issued by: Quality Manager Authorised by: Aquaculture Project
Management Group
P10-M Redo Pass at 223 days: This check box allows the user to instruct AUTODEPOMOD to carry out a 223 day run after compliance has been achieved on a 118 day run.
P10-N Show Log: This button will activate a dialog detailing the model run history for the current site. The information given in this dialog will be detailed in H:5.4 Step 4.
P10-O Convergence Value: In some cases the difference between compliance and non-compliance may be due to a very small increment of modelled biomass. If this is the case then it may take many binary search runs to achieve EQS compliance. The “convergence value” entered in this text box allows the user to set a limit on the binary search incremental change. Thus, if it is set to 5 tonnes, a binary search will stop if the incremental change, required to achieve compliance, is 5 tonnes or less.
N.B.(20) Due to the time available to SEPA, for each consent assessment, the convergence value is often set to 5 tonnes. SEPA has found this to be a reasonable operational compromise. However, SEPA will accept model results achieved using lower convergence values.
P10-P BATCH: This button will activate a dialog which will allow the user to set up a batch of AUTODEPOMOD model runs with variable input of: Biomass, Food Load and part/cage/∆t. The user can also specify whether or not resuspension is included in the model run result.
P10-Q Perform Single Run: This button will cause AUTODEPOMOD to run once, with the current model input parameters specified.
P10-R Do Blanking File: This button executes a series of actions using AUTODEPOMOD and Surfer to generate a Surfer Blanking file. This can be used to exclude areas of predicted deposition from the EQS compliance assessment. This issue is covered in H:5.6.
N.B.(21) Deposition blanking files should only be used in circumstances where the predicted deposition is clearly an artefact of the modelling process. Where they are used, the results with and without the blanking file should be clearly presented in any modelling report (see H:6.3).
P10-S Do scoping runs: Checking this box instructs AUTODEPOMOD to use the Binary Search, with Accuracy Offset, method described in section H:5.3.4.
P10-T No Random Walk: Checking this box instructs AUTODEPOMOD to carry out model runs without using the Random Walk turbulence model switched on. The Dispersion Coefficients in the settings in the SEPA.ini file will be ignored. In doing so the effects of Turbulent Diffusion will not be simulated.
P10-U RUN MODEL: This button will cause AUTODEPOMOD to run, entering the binary search process outlined in section H:2.5. The nature of the binary search will depend on the settings
UNCONTROLLED COPY IF PRINTED Printed: 7 June, 2005

SCOTTISH ENVIRONMENT PROTECTION AGENCY Section No.: Fish Farm-AH Page no: 64 of 140
Regulation and Monitoring of Marine Cage Fish Farming in Scotland Issue No: 3.0 Annex H Issue date: 18 May, 2005
Methods for Modelling In-feed Anti-parasitics and Benthic effects Originator: Alan Hills/Jeremy Spurway/Susan Brown/Chris Cromey
Issued by: Quality Manager Authorised by: Aquaculture Project
Management Group
made using the dialog shown in Plate 10. AUTODEPOMOD will stop running when EQS compliance has been achieved or when the convergence value (see P10-O) is reached.
P10-V Use Blanking file: Checking this box instructs AUTODEPOMOD to use the blanking file, created by pressing P10-R, when assessing EQS compliance.
P10-W No Resuspension: Checking this box instructs AUTODEPOMOD to carry out model runs without applying a simulation of resuspension processes.
P10-X Test EQS: This button can be used to perform an EQS test on existing model run results. It activates a dialog to display the results of this operation.
P10-Y Use Next Level Accuracy: Checking this box instructs AUTODEPOMOD to use the most accurate solution available.
N.B.(22) The Use Next Level Accuracy box should always be checked. When this setting is used in DEPOMOD V2.0 a numerical error may occur. This is not a bug in DEPOMOD; the numerical method used to improve accuracy cannot be used in every situation. AUTODEPOMOD corrects for this error and automatically turns this setting off if it occurs. Model runs performed without “Next Level Accuracy” are perfectly acceptable for consent assessments.
P10-Z Delete Failed runs: Checking this box instructs AUTODEPOMOD to delete all files relating to model runs which have not achieved EQS compliance. Details about the run, and the associated EQS testing results, are retained in a log file.
P10-AA TEST PARTICLES: This button allows the user to run AUTODEPOMOD iteratively for each part/cage/∆t in a specified range of part/cage/∆t. It is not required in the SEPA consent assessment method but it may be useful for exploring the particle number issues outlined in section H:5.3.1.
Once familiar with the dialog shown in Plate 10 proceed to the next step. Exit AUTODEPOMOD. Format the current meter data files, required by AUTODEPOMOD, for the site. This process is described in Appendix 2.
UNCONTROLLED COPY IF PRINTED Printed: 7 June, 2005

SCOTTISH ENVIRONMENT PROTECTION AGENCY Section No.: Fish Farm-AH Page no: 65 of 140
Regulation and Monitoring of Marine Cage Fish Farming in Scotland Issue No: 3.0 Annex H Issue date: 18 May, 2005
Methods for Modelling In-feed Anti-parasitics and Benthic effects Originator: Alan Hills/Jeremy Spurway/Susan Brown/Chris Cromey
Issued by: Quality Manager Authorised by: Aquaculture Project
Management Group
H:5.4 Step 2 Once the current meter data files have been formatted, and placed in the required location, open AUTODEPOMOD and load sitename. The data files should now appear in the area shown in P10-H. If they do not, repeat the above steps until they are loaded correctly; in particular check that the files are named exactly as specified and that they have been saved in the correct location. In AUTODEPOMOD V2, current meter files can be loaded by double clicking on the white boxes in the Current files group.
H:5.4 Step 3 Set up AUTODEPOMOD to carry out an initial, 118 day, Slice assessment run. Much of the information required can be found in FF-in-sitename.xls (see H:5.2 Step 4):
• Enter 5 times the peak biomass for the site in the box shown in P10-C
• Enter the food load tonnage, and the period over which this figure is applied, in the boxes shown in P10-I and P10-J
• Click the radio button shown in P10-L to118 days
• Click the check box shown in P10-M to off
• Ensure that the part/cage/∆t box shown in P10-F is set to 10
• Carry out a single run by hitting the button shown in P10-Q
H:5.4 Step 4 Once the initial run is finished, examine the results of the run by hitting the Show Log button. The main AUTODEPOMOD dialog will disappear and be replaced by the Run Log Dialog. An example of this dialog is shown in Plate 11. An explanation buttons, tabs and text boxes on the dialog is given below. The Run Log Dialog is one single large dialog, however, to facilitate presentation, it is shown as two separate dialogs in Plate 11.
Essentially the dialog displays the contents of a text file called sitename-EMBZ.log which can be found at location:
C:\SEPA Consent\Data\sitename\depomod\resus\
UNCONTROLLED COPY IF PRINTED Printed: 7 June, 2005

SCOTTISH ENVIRONMENT PROTECTION AGENCY Section No.: Fish Farm-AH Page no: 66 of 140
Regulation and Monitoring of Marine Cage Fish Farming in Scotland Issue No: 3.0 Annex H Issue date: 18 May, 2005
Methods for Modelling In-feed Anti-parasitics and Benthic effects Originator: Alan Hills/Jeremy Spurway/Susan Brown/Chris Cromey
Issued by: Quality Manager Authorised by: Aquaculture Project
Management Group
A B C D E F G H I J K L M N O
P Q R S T U V W X
Y Z
Plate 11: Run Log Dialog
P11-A Run No.: Each completed AUTODEPOMOD run is assigned a number, which increases from 1 to n in chronological order, these are displayed in this column.
P11-B Start time: The start time of each run is shown in this column.
P11-C End time: The end time of each run is shown in this column.
P11-D Runtime D:h:m:s: The run time of each run is shown in this column.
P11-E Consent Mass(g): The Medicine Mass (MM), in grams, released into the model domain associated with each run is shown in this column. This is derived from the treatment mass shown in P11-F.
P11-F Biomass (tonnes): The treatment biomass, in tonnes, which equates to the MM shown in P11-E, associated with each run is shown in this column.
P11-G Part No.: The part/cage/∆t (see H:5.3.1) associated with each run is shown in this column.
UNCONTROLLED COPY IF PRINTED Printed: 7 June, 2005

SCOTTISH ENVIRONMENT PROTECTION AGENCY Section No.: Fish Farm-AH Page no: 67 of 140
Regulation and Monitoring of Marine Cage Fish Farming in Scotland Issue No: 3.0 Annex H Issue date: 18 May, 2005
Methods for Modelling In-feed Anti-parasitics and Benthic effects Originator: Alan Hills/Jeremy Spurway/Susan Brown/Chris Cromey
Issued by: Quality Manager Authorised by: Aquaculture Project
Management Group
P11-H Tide: The tidal state associated with the first 7 days of MM discharge is shown in the column. S denotes a discharge which starts on an intermediate tide and then progresses through a spring tide. N denotes a discharge which starts on an intermediate tide and then progresses through a neap tide.
P11-I PASS\FAIL: The text in this column indicates the status of the results of each run with respect to its compliance with EQS criteria. A number of entries are possible:
• HIGH: The results of the model run do not comply with the EQS criteria. The predicted impact is greater than that allowed.
• LOW: The results of the model run comply with the EQS criteria but the predicted impact is less than that allowed.
• PASS: The results of the model run comply with the EQS criteria as specified in H:5.3.2.
• CONV: The results of the model run do not comply with the EQS criteria as specified in H:5.3.2. Furthermore the incremental change in biomass, required to achieve compliance, is less than the convergence value; set using the text box shown by P10-O.
• MAX: The results of the model comply with the EQS criteria and the predicted impact is less than allowed. The total medicine mass is the maximum allowed and therefore there is no further iteration.
The columns highlighted by P11-J to P11-O show the results of the far field EQS testing. These results determine whether or not the run has achieved EQS compliance (i.e., the entry in P11-I), since the near field tests only take the form of trigger values. The various columns are detailed below.
P11-J Flag: The text in this column indicates the status of the results of each run with respect to its compliance with far field EQS criteria. The entries possible in this column are the same as those which may appear in P11-I, with the exception of CONV and MAX, which do not appear.
P11-K dArea: The text in this column indicates the difference (in m2) between the predicted far field impact area and the far field Allowable Zone of Effects (AZE) (see section H:2.6). The far field AZE for the site is shown in P11-L. Note that:
• This number will be positive if the predicted impact area is greater than the AZE.
• This number will be negative if the predicted impact area is less than the AZE.
UNCONTROLLED COPY IF PRINTED Printed: 7 June, 2005

SCOTTISH ENVIRONMENT PROTECTION AGENCY Section No.: Fish Farm-AH Page no: 68 of 140
Regulation and Monitoring of Marine Cage Fish Farming in Scotland Issue No: 3.0 Annex H Issue date: 18 May, 2005
Methods for Modelling In-feed Anti-parasitics and Benthic effects Originator: Alan Hills/Jeremy Spurway/Susan Brown/Chris Cromey
Issued by: Quality Manager Authorised by: Aquaculture Project
Management Group
P11-L Area(m2): The text in this column indicates the far field AZE for the site. This is calculated in sitename-FFMTv3.0.xls and it is shown in P5-S. The predicted far field impact area for the model run can be calculated by adding the values in P11-K and P11-L.
P11-M adjust: The text in this column indicates the area which is subtracted from a low part/cage/∆t run to predict the impact area of a run made with a higher part/cage/∆t value. A value will only appear here if the user is using the Do scoping runs feature highlighted in P10-S and described in H:5.3.4.
P11-N µg\kg: The text in this column indicates the average concentration of EmBZ (in µgkg-1) within the area bounded by the predicted far field impact area This value is not directly relevant to EQS compliance, but provides useful information.
P11-O Vol(m3): The text in this column relates to the calculation of the value shown P11-N, it can be ignored when assessing the results of a model run.
The columns highlighted by P11-P to P11-U show the results of the near field EQS testing. These results do not affect EQS compliance, however, they do determine whether or not enhanced monitoring will be required at the site (see section H:2.6). The various columns are detailed below.
P11-P Flag: The text in this column indicates the status of the results of each run with respect to the near field EQS trigger value. The entries possible in this column are the same as those which may appear in P11-I, with the exception of CONV and MAX, which do not appear.
P11-Q dConc: The text in this column indicates the difference (in µgkg-1) between the predicted average concentration of medicine residue, within the near field AZE, and the near field EQS trigger value (see section H:2.6). The near field AZE for the site is shown in P11-T. This is calculated in sitename-FFMTv3.0.xls and it is shown in P5-S. Note that:
• This number will be positive if the predicted concentration is greater than the near field trigger value.
• This number will be negative if the predicted concentration is less than the near field trigger value.
P11-R µg\kg: The text in this column indicates the predicted average concentration of medicine residue within the near field AZE.
P11-S dArea: The text in this column indicates the difference (in m2) between the area over which the value in P11-R has been calculated and the near field AZE for the site (shown in P11-T). This value should be relatively small.
P11-T Area(m2): The text in this column indicates the near field AZE for the site. This is calculated in sitename-FFMTv3.0.xls and it is shown in P5-S.
UNCONTROLLED COPY IF PRINTED Printed: 7 June, 2005

SCOTTISH ENVIRONMENT PROTECTION AGENCY Section No.: Fish Farm-AH Page no: 69 of 140
Regulation and Monitoring of Marine Cage Fish Farming in Scotland Issue No: 3.0 Annex H Issue date: 18 May, 2005
Methods for Modelling In-feed Anti-parasitics and Benthic effects Originator: Alan Hills/Jeremy Spurway/Susan Brown/Chris Cromey
Issued by: Quality Manager Authorised by: Aquaculture Project
Management Group
P11-U Vol(m3): The text in this column relates to the calculation of the value shown P11-R, it can be ignored when assessing the results of a model run.
P11-V Mass Bal.: The text in this column indicates the mass of medicine residue left in the model grid at the end of each run. This value must be reported, see H:6.2.
P11-W GRID file: The text in this column indicates the name of the Surfer grid file on which EQS testing, by AUTODEPOMOD, takes place. The path to the file location is also given. See H:5.7 for details of the naming convention of this file.
P11-X Biomass File (SLICE only): The text in this column indicates the name of the AUTODEPOMOD input file used in the model run. The path to the file location is also given. This file is only produced when modelling Slice. The filename structure also gives some information about the input parameters used in the model run. The general filename structure is:
A-B-C-D-E.csv
where: A = sitename
B = E - which denotes Emamectin
C = input biomass (tonnes)
D = feed load over 36 days (tonnes)
E = length of model run (either 118 or 223 days)
P11-Y Run files exist and Run files Missing\Deleted: This area of the dialog is comprised of a key which relates to the colour of the text boxes. Files relating to individual model runs can be deleted, however, the results can still be stored in the sitename-EMBZ.log file (see start of H:5.4 Step 4). If this is done then the text boxes relating to the appropriate run will be coloured. Should the user wish to delete the run entry from the records completely, the user can use a text editor to edit the entry out of the sitename-EMBZ.log. If this is done the entry will no longer appear in Run Log Dialog.
P11-Z VIEW MESSAGES: Pressing this button will switch the dialog window to display run messages relating to each individual run. These may be of interest if errors occur. Press the VIEW STATUS button to return to the main dialog.
UNCONTROLLED COPY IF PRINTED Printed: 7 June, 2005

SCOTTISH ENVIRONMENT PROTECTION AGENCY Section No.: Fish Farm-AH Page no: 70 of 140
Regulation and Monitoring of Marine Cage Fish Farming in Scotland Issue No: 3.0 Annex H Issue date: 18 May, 2005
Methods for Modelling In-feed Anti-parasitics and Benthic effects Originator: Alan Hills/Jeremy Spurway/Susan Brown/Chris Cromey
Issued by: Quality Manager Authorised by: Aquaculture Project
Management Group
H:5.4 Step 5 If the result of the run outlined in H:5.4 Step 3 is an EQS compliance PASS then proceed to H:5.4 Step 7. If the result is an EQS compliance FAIL (i.e., HIGH appears in P11-I) then proceed to H:5.4 Step 6.
H:5.4 Step 6 Exit the Run Log Dialog and view a contour plot of the results by pressing the button shown in P3-C. After pressing this button select the Surfer grid file for the run, this is given in the column shown in P11-W. Check for any anomalies in the deposition footprint. If none are found then the user will need to use the techniques and features of AUTODEPOMOD, described above, to find the Biomass/Medicine Mass (MM) which yields an EQS compliance PASS. If the use of a blanking file is required then refer to P10-R and H:5.6.
Once a PASS has been achieved, for a 118 day run with 10 part/cage/∆t, proceed to H:5.4 Step 7.
H:5.4 Step 7 Exit the Run Log Dialog and view a contour plot of the results by pressing the button shown in P3-C. After pressing this button select the Surfer grid file for the run, this is given in the column shown in P11-W. If the results of this run are satisfactory (i.e., the deposition footprint is in agreement with expectations) then carry out a single identical run, using most of the same input parameters as in H:5.4 Step 3, except:
• Click the radio button shown in P10-L to 223 days
Once this run is completed then proceed to H:5.5.
H:5.5 Calicide Consent Limit Assessment The modelling assessment for Calicide is very similar to that for Slice. It is less complex and quicker and, if the user is familiar with the Slice assessment detailed above, then the Calicide assessment should be straightforward. As such, much of what is presented in H:5.4 is not repeated in this section. Instead the main exceptions to the Slice assessment process are outlined here.
H:5.5 Step 1 Click the radio button shown in P10-B, this will alter Plate 10 slightly. The Do Scoping runs check box, shown in P10-S, will be disabled. In addition, the SLICE parameters box, containing items P10-I to P10-M, will become the Calicide parameters box. The changes to this area of Plate 10 are shown below in Plate 12. An explanation of these buttons, tabs and text boxes is given below.
UNCONTROLLED COPY IF PRINTED Printed: 7 June, 2005

SCOTTISH ENVIRONMENT PROTECTION AGENCY Section No.: Fish Farm-AH Page no: 71 of 140
Regulation and Monitoring of Marine Cage Fish Farming in Scotland Issue No: 3.0 Annex H Issue date: 18 May, 2005
Methods for Modelling In-feed Anti-parasitics and Benthic effects Originator: Alan Hills/Jeremy Spurway/Susan Brown/Chris Cromey
Issued by: Quality Manager Authorised by: Aquaculture Project
Management Group
AB
D
Plate 12: Changes to Plate 10 During Calicide Assessment
P12-A Food Load (7 days): This is the amount of food applied to the site over the 7 day treatment period. It is calculated automatically using the biomass value entered in P10-C.
P12-B Tidal: These radio buttons are used to select the point in the tidal cycle (i.e., the point in the current meter data) when the start of the 7 day MM release takes place. Please refer to H:3.5 and Appendix 2 for more information on this subject.
N.B.(23) Clicking the Neap-Spring button will cause the 7 day discharge to take place over the intermediate-neap-intermediate phase of the tidal cycle. Clicking the Spring-Neap button will cause the 7 day discharge to take place over the intermediate-spring-intermediate phase of the tidal cycle.
P12-D Automatically Redo using Spring-Neap: If Neap-Spring has been clicked in the first instance, this check box allows the user to instruct AUTODEPOMOD to automatically redo the model run using the Spring-Neap setting.
H:5.5 Step 2 Set up AUTODEPOMOD to carry out an initial Neap-Spring Calicide assessment run. Much of the information required can be found in FF-in-sitename.xls (see H:5.2 Step 4):
• Enter the peak biomass for the site in the box shown in P10-C
• Click the radio button shown in P12-B to Neap-Spring.
• Ensure that part/cage/∆t boxes shown in P10-F and P10-G are both set to 10.
• Carry out a single run by hitting the button shown in P10-Q
H:5.5 Step 3 Repeat the run outlined in H:5.5 Step 2 except:
• Click the radio button shown in P12-B to Spring-Neap.
UNCONTROLLED COPY IF PRINTED Printed: 7 June, 2005

SCOTTISH ENVIRONMENT PROTECTION AGENCY Section No.: Fish Farm-AH Page no: 72 of 140
Regulation and Monitoring of Marine Cage Fish Farming in Scotland Issue No: 3.0 Annex H Issue date: 18 May, 2005
Methods for Modelling In-feed Anti-parasitics and Benthic effects Originator: Alan Hills/Jeremy Spurway/Susan Brown/Chris Cromey
Issued by: Quality Manager Authorised by: Aquaculture Project
Management Group
H:5.5 Step 4 Once these initial runs have finished, examine the results of the runs by hitting the Show Log button. The Run Log Dialog detailed in H:5.4 Step 4 will appear. The entries in this dialog are the same as those detailed in H:5.4 Step 4 and Plate 11. However, the column shown in P11-X is not relevant to Calicide assessment.
H:5.5 Step 5 Exit the Run Log Dialog and view a contour plot of the run results by pressing the button shown in P3-D. After pressing this button select the Surfer grid file for the run the user wishes to view, this is given in the column shown in P11-W. Check for any anomalies in the deposition footprint. If the use of a blanking file is required then refer to P10-R and H:5.6. Once a blanking file has been produced the user will need to repeat H:5.5 Step 1 to H:5.5 Step 5.
H:5.5 Step 6 If either, or both, of the initial runs result in an EQS compliance PASS then no further model runs are necessary, proceed to H:5.5 Step 8.
If both of the initial runs result in an EQS compliance FAIL the proceed to H:5.5 Step 7. The failure may be due to a LOW or HIGH entry in P11-I.
H:5.5 Step 7 Determine which of the initial runs resulted in the largest predicted far field impact area. The predicted impact area for each run can be calculated by adding together the entries in P11-K and P11-L.
N.B.(24) The discharge tidal state (i.e., Neap-Spring or Spring-Neap) which corresponds with the largest predicted impact area should be used for all further model runs.
Use the techniques and features of AUTODEPOMOD, described above, to find the Biomass/Medicine Mass (MM) which yields an EQS compliance PASS.
H:5.5 Step 8 Once a PASS has been achieved, with 10 part/cage/∆t, one further run is needed to determine the worst case mass balance. Repeat the final run with the opposing discharge tidal state to that used to achieve a pass. Proceed to H:6.2.
H:5.6 Blanking File Use
N.B.(25) Blanking files should be used only where they are strictly necessary. In practise SEPA has found them to be of use very occasionally. In most circumstances they have been applied during Calicide assessments. If a blanking file is used then it must be clearly stated in any modelling report (see H:6.3). In addition model runs results, without using the blanking file, must also be submitted.
In general, a blanking file is used when an area of predicted deposition occurs outside the main deposition footprint. These areas of deposition may occur due to:
UNCONTROLLED COPY IF PRINTED Printed: 7 June, 2005

SCOTTISH ENVIRONMENT PROTECTION AGENCY Section No.: Fish Farm-AH Page no: 73 of 140
Regulation and Monitoring of Marine Cage Fish Farming in Scotland Issue No: 3.0 Annex H Issue date: 18 May, 2005
Methods for Modelling In-feed Anti-parasitics and Benthic effects Originator: Alan Hills/Jeremy Spurway/Susan Brown/Chris Cromey
Issued by: Quality Manager Authorised by: Aquaculture Project
Management Group
• model particles becoming artificially trapped against a land boundary
• model particles (with low settling velocities) being advected outwith the normal zone of deposition by current meter anomalies, which are often related to strong wind forcing.
Often the concentrations within these areas are low, however, they can increase the predicted impact area by a large amount. This is a particular problem during the Calicide assessment as the far field EQS value for Calicide is very low compared to the concentrations required for treatment and, hence, those typically found in the model grid.
The principle behind the blanking file process is to specify an area within the model grid (usually around the main area of deposition), outwith which, the predicted medicine residue concentrations are ignored. This area is applied to the Surfer grid file for a model run creating an additional “blanked” file at the end of the run. EQS testing is then carried out on the “blanked” file.
If a blanking file is to be used please follow the instructions given below.
UNCONTROLLED COPY IF PRINTED Printed: 7 June, 2005

SCOTTISH ENVIRONMENT PROTECTION AGENCY Section No.: Fish Farm-AH Page no: 74 of 140
Regulation and Monitoring of Marine Cage Fish Farming in Scotland Issue No: 3.0 Annex H Issue date: 18 May, 2005
Methods for Modelling In-feed Anti-parasitics and Benthic effects Originator: Alan Hills/Jeremy Spurway/Susan Brown/Chris Cromey
Issued by: Quality Manager Authorised by: Aquaculture Project
Management Group
H:5.6 Step 1 Press the Do Blanking file shown on P10-R. Select the Surfer grid file for the run the user wishes to create the blanking file around. The name of this file is given in the column shown in P11-W.
H:5.6 Step 2 A RUN RESULTS dialog will appear containing the instructions on how to create a blanking file. Press OK to continue.
H:5.6 Step 3 A copy of Surfer will open displaying a contour plot of the grid the user has selected. Use the View Fit to Window command on the toolbar to more easily view the plot.
H:5.6 Step 4 Click on the contour plot and then use the Map Digitize command to start the map digitiser. At this point the cursor will change to a large cross. Click the cursor on the first point on the contour plot which will be the starting point for the blanking file boundary. A window will appear with the name “digit.bln”. The Easting and Northing of the point the user has clicked on is written in this window. In addition, the point will be highlighted on the contour plot as a small red cross.
H:5.6 Step 5 Use a collection of clicked points (represented by small red crosses) to define a boundary, outwith which, medicine residues in the model grid shall be ignored. Ensure that the crosses are reasonably regular and form a neat shape. If a mistake is made close the “digit.bln” window and say No to save changes. To remove the existing red crosses press F5 on the keyboard. Repeat H:5.6 Step 4.
H:5.6 Step 6 Once the user is happy with the blanking area press the Escape key. The user will be prompted to save changes in the “digit.bln” window. Click yes and save the file as:
sitename.bln
in location
C:\SEPA Consent\DATA\sitename\depomod\resus\
N.B.(26) Although multiple blanking files can be specified only one blanking file may be in operation at any one time. There must only be one sitename.bln, but the names of multiple blanking files can be changed around.
UNCONTROLLED COPY IF PRINTED Printed: 7 June, 2005

SCOTTISH ENVIRONMENT PROTECTION AGENCY Section No.: Fish Farm-AH Page no: 75 of 140
Regulation and Monitoring of Marine Cage Fish Farming in Scotland Issue No: 3.0 Annex H Issue date: 18 May, 2005
Methods for Modelling In-feed Anti-parasitics and Benthic effects Originator: Alan Hills/Jeremy Spurway/Susan Brown/Chris Cromey
Issued by: Quality Manager Authorised by: Aquaculture Project
Management Group
H:5.6 Step 7 Minimise the copy of Surfer using the button at the top right of the Surfer window (do not quit as the process will not work). After this is done the Surfer will process the blanking file input and produce a new contour plot. The area which is blanked will be shaded purple while the area within the boundary will be visible. This allows the user to check that the blanking file is acceptable.
H:5.6 Step 8 Minimise the copy of Surfer using the button at the top right of the Surfer window (do not quit as the process will not work). A Blanking File dialog will appear and the user will be prompted to indicate if the blanking file is satisfactory.
If NO is clicked then the RUN RESULTS dialog will appear again, repeat H:5.6 Step 2 to H:5.6 Step 8 until the user is satisfied with the blanking area.
If YES is clicked, the copy of Surfer will close and the user will be returned to the main AUTODEPOMOD dialog shown in Plate 10.
H:5.6 Step 9 To use the blanking file during model runs make sure the Use Blanking file box shown in P10-Y is checked.
N.B.(27) The blanking file cannot be applied retrospectively, it can only be applied to runs carried out after its creation.
H:5.7 Surfer Grid Results File Naming Convention The Surfer Grid Results filename structure gives some information about the input parameters used in the model run. The general filename structure is:
A-B-C-Df.grd
where: A = sitename
B = E (Emamectin) or T (Teflubenzuron)
C = discharge tidal state (S or N)
D = run number
f = final
If a blanking file has been used the general filename structure will be A-B-C-Dfz.grd where z = zoned.
UNCONTROLLED COPY IF PRINTED Printed: 7 June, 2005

SCOTTISH ENVIRONMENT PROTECTION AGENCY Section No.: Fish Farm-AH Page no: 76 of 140
Regulation and Monitoring of Marine Cage Fish Farming in Scotland Issue No: 3.0 Annex H Issue date: 18 May, 2005
Methods for Modelling In-feed Anti-parasitics and Benthic effects Originator: Alan Hills/Jeremy Spurway/Susan Brown/Chris Cromey
Issued by: Quality Manager Authorised by: Aquaculture Project
Management Group
H:6 REPORTING OF CONSENT LIMIT ASSESSMENT RESULTS – ANTI-PARASITIC CHEMICALS An outline of general reporting requirements is given in H:3.8 and H:3.9. More specific details are detailed below.
H:6.1 Summary of Application Procedure The application procedure, with respect to sea lice medicine consent assessment, will generally proceed as follows:
H:6.1 Step 1 The site and hydrographic survey is performed at the farm site.
N.B.(28) Data quality is the keystone of the application process. SEPA recommends that a site and hydrographic survey report be produced as soon as possible after the survey has been completed. The report and data should be then be evaluated by a qualified and experienced hydrographer/physical oceanographer. As SEPA will ultimately be required to check the data, we would encourage applicants to submit the report and data to SEPA as soon as possible, prior to modelling and submission of a full application. Should any additional work be required, SEPA will be in a position to advise on this in good time.
N.B.(29) The site and hydrographic survey report and data should be submitted, in electronic format, to the e-mail address: [email protected]
H:6.1 Step 2 The site and hydrographic survey report and data are submitted to SEPA prior to application.
• If the information submitted is found to be acceptable, consent modelling and the application procedure can progress.
• If the information is found to be unacceptable then SEPA will aim to inform the applicant of any deficiencies within 1 week of receipt of the submission. These deficiencies should be addressed, and the corrective action accepted by SEPA, before modelling and full application is carried out.
OR
UNCONTROLLED COPY IF PRINTED Printed: 7 June, 2005

SCOTTISH ENVIRONMENT PROTECTION AGENCY Section No.: Fish Farm-AH Page no: 77 of 140
Regulation and Monitoring of Marine Cage Fish Farming in Scotland Issue No: 3.0 Annex H Issue date: 18 May, 2005
Methods for Modelling In-feed Anti-parasitics and Benthic effects Originator: Alan Hills/Jeremy Spurway/Susan Brown/Chris Cromey
Issued by: Quality Manager Authorised by: Aquaculture Project
Management Group
H:6.1 Step 3 The site and hydrographic survey report and data are submitted to SEPA along with a modelling technical summary and full application. SEPA registry staff will pass the necessary information to SEPA Hydrography/Modelling (HM) staff for evaluation.
• If the site and hydrographic survey report and data submitted are found to be acceptable, SEPA registry will be informed and all other aspects of the application will be allowed to proceed. SEPA HM staff will aim to respond to SEPA registry staff within 1 week of receipt of the information. We will also aim to communicate any deficiencies in the modelling technical summary to the applicant, within 2 weeks of receipt of the information.
N.B.(30) As the modelling is reasonably straightforward to repeat, only deficiencies in the site and hydrographic data reporting will prevent the application from proceeding. Deficiencies in the modelling should be addressed as soon as possible. However, it is advisable to wait until a biomass decision has been made before re-submitting a modelling report (see H:6.1 Step 4).
• If the site and hydrographic survey report and data submitted are found to be unacceptable, SEPA registry will be informed. SEPA HM staff will aim to respond to registry staff within 1 week of receipt of the information. All other aspects of the application will not be allowed to proceed. The application, including the modelling technical summary, will be returned to the applicant along with the application fee and a written summary of the deficiencies of the submission. These deficiencies should be addressed, and the corrective action accepted by SEPA, before further modelling is carried out and full application is repeated.
N.B.(31) If the site and hydrographic survey report is found to be unacceptable the modelling technical summary will not be examined.
H:6.1 Step 4 If H:6.1 Step 3 is completed, other aspects of the application will proceed. Of these, the setting of the biomass part of the consent is the most relevant to the modelling process. The modelling technical summary will have been prepared using the application biomass. This level of biomass is not always granted during the application process. Two possibilities exist:
• The application biomass is granted at the level used in the modelling process. Providing the SEPA HM staff have an acceptable modelling technical summary, we will aim to have all appropriate consent material to the appropriate SEPA EPI officer within 1 week of notification of the biomass decision.
• The application biomass is set at a level different to that used in the modelling process. This decision will be communicated to the applicant as soon as possible. Providing that any modelling deficiencies have been addressed, the modelling should be repeated using the new biomass. A new modelling technical summary should be prepared and submitted to SEPA as soon as possible. SEPA HM staff will aim to have all appropriate consent material
UNCONTROLLED COPY IF PRINTED Printed: 7 June, 2005

SCOTTISH ENVIRONMENT PROTECTION AGENCY Section No.: Fish Farm-AH Page no: 78 of 140
Regulation and Monitoring of Marine Cage Fish Farming in Scotland Issue No: 3.0 Annex H Issue date: 18 May, 2005
Methods for Modelling In-feed Anti-parasitics and Benthic effects Originator: Alan Hills/Jeremy Spurway/Susan Brown/Chris Cromey
Issued by: Quality Manager Authorised by: Aquaculture Project
Management Group
to the appropriate SEPA EPI officer within 1 week of receipt of the new technical summary (or pertinent information by e-mail, see N.B.(32).
N.B.(32) The pertinent information from the new modelling technical summary should be submitted to SEPA via e-mail. However, a final report should be produced and submitted to SEPA for inclusion on the public register.
H:6.1 Step 5 Once SEPA HM staff have provided consent material to the appropriate SEPA EPI officer, and all other aspects of the application have been completed successfully, consent should be issued.
H:6.2 Consideration of Mass Balance At most sites modelled some proportion of the applied Medicine Mass (MM) is lost from the model grid. The amount of MM lost is dependent on the current flow measured at the site. This can range from near 0 to near 100% at some sites. SEPA expects each applicant to assess the amount and fate of the material which leaves the model grid.
N.B.(33) This fate assessment must be presented with each modelling technical summary. The report will be deemed unacceptable if no information is presented about this subject.
The method for calculating the amount of MM which leaves the model grid is detailed below. More information on this calculation can be found on slide 21 of the document located at:
http://www.sepa.org.uk/aquaculture/modelling/pdf/InFeeds.pdf
H:6.2.1 Mass Balance Calculation for Slice Open the Slice Run Log Dialog shown in Plate 11 and locate the 118 day run which achieves an EQS pass. The value shown in the column indicated by P11-E is Mstart. The value shown, for the same run, in the column highlighted by P11-V is Mend. The MM lost from the model grid Mlost-S is calculated by:
Mlost-S = (Mstart x 0.74) - Mend
H:6.2.2 Mass Balance Calculation for Calicide Open the Calicide Run Log Dialog and locate the run EQS pass run which gives the worst case mass balance. The value shown in the column indicated by P11-E is Mstart. The value shown, for
UNCONTROLLED COPY IF PRINTED Printed: 7 June, 2005

SCOTTISH ENVIRONMENT PROTECTION AGENCY Section No.: Fish Farm-AH Page no: 79 of 140
Regulation and Monitoring of Marine Cage Fish Farming in Scotland Issue No: 3.0 Annex H Issue date: 18 May, 2005
Methods for Modelling In-feed Anti-parasitics and Benthic effects Originator: Alan Hills/Jeremy Spurway/Susan Brown/Chris Cromey
Issued by: Quality Manager Authorised by: Aquaculture Project
Management Group
the same run, in the column highlighted by P11-V is Mend. The MM lost from the model grid Mlost-C is calculated by:
Mlost-C = (Mstart x 0.9) - Mend
H:6.2.3 Brief Guidance on Fate Assessment The predicted export of material from each site modelled should be assessed on a case by case basis. As a guide, the fate of the material should be regarded with respect to:
• the near bed current meter record
• the bathymetry and coastline of the surrounding area, in particular, whether the material is likely to be transported to a constrained or unconstrained receiving water
• any major potential deposition areas that the material is likely to be transported towards
• the potential for cumulative deposition
• the likely concentration of the material in the receiving water in relation to the far field EQS criteria.
• the area of impact of the material if it is dispersed evenly to the far field EQS concentration
N.B.(34) In addition to the consent values achieved with the modelling process, the applicant must also recommend a set of consent values which take the assessment into account.
H:6.3 Blanking File Use - Reporting
N.B.(35) Where a blanking file is used its use must be clearly stated in the modelling technical summary. In addition, results must be presented for identical runs made without the use if the blanking file.
H:6.4 The Collation of Modelling Results The results of the modelling process are collated on a Marine Modelling Summary Sheet. This is an Excel 2000 spreadsheet named: marine_sum_v1.xls. A copy of this file can be found at:
http://www.sepa.org.uk/aquaculture/modelling/index.htm
UNCONTROLLED COPY IF PRINTED Printed: 7 June, 2005

SCOTTISH ENVIRONMENT PROTECTION AGENCY Section No.: Fish Farm-AH Page no: 80 of 140
Regulation and Monitoring of Marine Cage Fish Farming in Scotland Issue No: 3.0 Annex H Issue date: 18 May, 2005
Methods for Modelling In-feed Anti-parasitics and Benthic effects Originator: Alan Hills/Jeremy Spurway/Susan Brown/Chris Cromey
Issued by: Quality Manager Authorised by: Aquaculture Project
Management Group
N.B.(36) Up to three copies of this sheet should be submitted:
• One showing the recommended consent levels based on the results of the modelling process
• One showing the recommended consent levels in light of the mass balance fate assessment
• One showing the recommended consent levels after the use of a blanking file (if required)
An indication of the contents of the sheet must be included in the filename.
Information on how to incorporate the recommended consent levels on this form is given below.
H:6.4 Step 1 In-feed modelling results are entered, in various boxes, below row 17 of the sheet. The various boxes and values to be entered within them are detailed below:
Peak Biomass (tonnes): Enter the peak biomass for the site (application or consented) in Cell C18.
AZE (m^2) - Far-Field: Enter the far field AZE for the site in Cell E18. This is detailed in the column shown in P11-L.
AZE (m^2) - Near-Field: Enter the near field AZE for the site in Cell F18. This is detailed in the column shown in P11-T.
H:6.4 Step 2 Row 20 allows the user to enter the Recommended consent mass (g) for:
Teflubenzuron: This entry may be the value, for the EQS PASS run, shown in the column indicated on P11-E. It may also be the value determined in light of the fate assessment.
Emamectin TAQ: This entry may be the value, for the 118 day EQS PASS run, shown in the column indicated on P11-E. It may also be the value determined in light of the fate assessment.
UNCONTROLLED COPY IF PRINTED Printed: 7 June, 2005
SCOTTISH ENVIRONMENT PROTECTION AGENCY Section No.: Fish Farm-AH Page no: 81 of 140
Regulation and Monitoring of Marine Cage Fish Farming in Scotland Issue No: 3.0 Annex H Issue date: 18 May, 2005
Methods for Modelling In-feed Anti-parasitics and Benthic effects Originator: Alan Hills/Jeremy Spurway/Susan Brown/Chris Cromey
Issued by: Quality Manager Authorised by: Aquaculture Project
Management Group
Emamectin MTQ: This entry is the MM required to treat the peak biomass consented for the site. This can be determined using the text boxes shown in P10-C and P10-E. It may also be the value determined in light of the fate assessment. If the TAQ is less than the MTQ then they will become equal.
For each entry in row 20, the Equivalent treatable biomass (tonnes) for the consent mass will be given in cell directly beneath in row 21.
H:6.4 Step 3 Row 22 allows the user to enter the Area of impact at far-field EQS (m^2) for:
Teflubenzuron: This entry may be the value, for the EQS PASS run, shown in the column indicated on P11-L added to the value indicated on P11-K. It may also be the value of the impact area, at the far field EQS, determined during the fate assessment.
Emamectin TAQ: This entry may be the value, for the 118 day EQS PASS run, shown in the column indicated on P11-L added to the value indicated on P11-K. It may also be the value of the impact area, at the far field EQS, determined during the fate assessment.
H:6.4 Step 4 Row 23 allows the user to enter the Mass balance (g) for:
Teflubenzuron: Enter the value, for the EQS PASS run, shown in the column indicated on P11-V. This value should not be the Mlost-C value calculated in H:6.2.
Emamectin TQA: Enter the value, for the 118 day EQS PASS run, shown in the column indicated on P11-V. This value should not be the Mlost-S value calculated in H:6.2.
For each entry in row 23, the Mass balance (% of recommended consent mass) for the consent mass will be given in cell directly beneath in row 24. This percentage does not take into account any degradation or food wastage.
H:6.4 Step 5 Row 26 allows the user to enter the Mean concentration within near-field AZE for:
Teflubenzuron: Enter the value, for the EQS PASS run, shown in the column indicated on P11-R.
Emamectin TAQ: Enter the value, for the 118 day EQS PASS run, shown in the column indicated on P11-R.
UNCONTROLLED COPY IF PRINTED Printed: 7 June, 2005

SCOTTISH ENVIRONMENT PROTECTION AGENCY Section No.: Fish Farm-AH Page no: 82 of 140
Regulation and Monitoring of Marine Cage Fish Farming in Scotland Issue No: 3.0 Annex H Issue date: 18 May, 2005
Methods for Modelling In-feed Anti-parasitics and Benthic effects Originator: Alan Hills/Jeremy Spurway/Susan Brown/Chris Cromey
Issued by: Quality Manager Authorised by: Aquaculture Project
Management Group
H:6.5 Submission of Information for Assessment of Modelling Work In order to offer the applicant a consistent, efficient service, SEPA require an electronic copy of all site survey and hydrographic data reports (HG), modelling reports (MR) and test case reports (TC). Where possible the report should be in PDF format and have a generic name eg: sitename_date_XX.pdf where XX refers to the type of report, as indicated in brackets above. Thus a hydrographic report for a fish farm at Dingwall dated 1st June 2005 would be Dingwall_050601_HG.pdf. The following items are required for submission to SEPA for assessment and inclusion into the consent:
• A Method Report or a reference to a registered Method Report (see H:3.9)
• A Technical Summary (see H:3.9)
• A CD-ROM containing:
• All modelling and data files as created by AUTODEPOMOD and as outlined in H:5.1
• Completed Copies of marine_sum_v1.xls
• An electronic copy of the appropriate Method Report (Microsoft Word of PDF)
• An electronic copy of the appropriate Technical Summary (Microsoft Word of PDF)
N.B.(37) Prior to submission of any modelling results for a real site, SEPA requires the submission, by applicants or their consultants, of the above items for a TEST SITE called “sitename”. This information is required so that SEPA can; assess the methods used, check the model set-up and identify any problems which may hinder assessment of future modelling results. Please note that this submission will include bath and in-feed treatment modelling. The information required to model “sitename” is detailed in Appendix 3. Should the user be unable to source actual bathymetric data for the area around “sitename” an alternative bathymetric data set may be found at:
http://www.sepa.org.uk/aquaculture/modelling/index.htm
Details of how to submit the items for “sitename” will be issued via e-mail and on the above website. For details of requirements of test site requirements prior to submission of Benthic modelling see section H:7.4.5
UNCONTROLLED COPY IF PRINTED Printed: 7 June, 2005

SCOTTISH ENVIRONMENT PROTECTION AGENCY Section No.: Fish Farm-AH Page no: 83 of 140
Regulation and Monitoring of Marine Cage Fish Farming in Scotland Issue No: 3.0 Annex H Issue date: 18 May, 2005
Methods for Modelling In-feed Anti-parasitics and Benthic effects Originator: Alan Hills/Jeremy Spurway/Susan Brown/Chris Cromey
Issued by: Quality Manager Authorised by: Aquaculture Project
Management Group
H:7 USING AUTODEPOMOD TO ESTIMATE BIOMASS CONSENT LIMITS
H:7.1 Creating a new project and getting started Creating a new project and setting up the model for a site consists of three major sections as follows:
• Grid and cage setup
• Model parameters
• Iteration to a solution and mapping module
As well as some of the background information given in previous sections (H:2.1.2, H:2.1.4, H:2.4.2), Appendix 4 also contains information on how the model iterates to a solution. This information is useful for the reader and will increase understanding of this method.
P13-A Starting AUTODEPOMOD: Double click on the SEPA Consent Integrated Application icon and Plate 13 will be shown. At this stage, any modification of default data via the GLOBAL Defaults button will result in all new sites using the modified default data.
P13-B Directory structure: Details on the directory structure and naming convention of files associated with the AUTODEPOMOD package are detailed in H:5.1.
UNCONTROLLED COPY IF PRINTED Printed: 7 June, 2005

SCOTTISH ENVIRONMENT PROTECTION AGENCY Section No.: Fish Farm-AH Page no: 84 of 140
Regulation and Monitoring of Marine Cage Fish Farming in Scotland Issue No: 3.0 Annex H Issue date: 18 May, 2005
Methods for Modelling In-feed Anti-parasitics and Benthic effects Originator: Alan Hills/Jeremy Spurway/Susan Brown/Chris Cromey
Issued by: Quality Manager Authorised by: Aquaculture Project
Management Group
Plate 13. On start up of AUTODEPOMOD, the Create New Project and Global Default buttons are shown
H:7.2 Grid and Cage Setup page To create a new project and set up the model grid and cages, H:5.2 Step 1 to H:5.2 Step 19 in the chemical modelling methods should be followed and are not repeated here. Some of the main data considerations are summarised below:
Cage positions, layouts and dimensions – this information is entered here
C-Map files – the majority of users will not have access to the C-Map extract software, so the C-Map files will need to be generated by other means and is a straightforward process.
Input (csv file) – contains bathymetry data
Blanking (bln) file – contains information on coastlines and land areas
UNCONTROLLED COPY IF PRINTED Printed: 7 June, 2005

SCOTTISH ENVIRONMENT PROTECTION AGENCY Section No.: Fish Farm-AH Page no: 85 of 140
Regulation and Monitoring of Marine Cage Fish Farming in Scotland Issue No: 3.0 Annex H Issue date: 18 May, 2005
Methods for Modelling In-feed Anti-parasitics and Benthic effects Originator: Alan Hills/Jeremy Spurway/Susan Brown/Chris Cromey
Issued by: Quality Manager Authorised by: Aquaculture Project
Management Group
Settings (ini) file – contains the grid limits
The procedure for non-Cmap users for these three files is given in H:5.2 Step 14. File formats are detailed in Appendix 1.
At the end of Grid and Cage set up, the user should have arrived at H:5.2 Step 19. Proceed to the Model Parameters page.
H:7.3 Model parameters page For benthic consent biomass modelling, Plate 14 shows the dialog set up for ‘sitename’, with default and site-specific data for a hypothetical site. With the exception of the settings in the Benthic Parameters group, all other functionality in this dialog is described in detail in section H:5.4. However, a summary is given below.
H:7.3.1 Summary of dialog settings described previously White boxes can be edited by the user, yellow boxes cannot. Default particle number settings are initial run using 1 followed by refining at 10 particles (P10-D, P10-F, P10-G). This ensures initial runs are undertaken quickly followed by refining of runs using greater number of particles to increase accuracy. The features Do scoping run (P10-S), Use blanking file (P10-V) and Delete failed runs (P10-Z) are switched off. The highest level of accuracy is always used, so Use Next level of accuracy is default switched on (P10-Y). Both random walk (P10-T) and resuspension (P10-W) are important processes fundamental in predicting the dispersion of particles, and the models are always in use (check boxes switched off). The model will iterate to a solution to the nearest biomass tonnage shown in Convergence value (P10-O). The Perform Single Run button (P10-Q) can be used to run the model once to test a specific biomass or parameter change. To iterate to a solution automatically, the RUN MODEL button is used (P10-U).
The model will iterate through several runs until a solution (PASS) occurs. Biomass is iterated to the biomass Convergence Value (i.e. default of 5 tonnes). The model will then be rerun using a higher number of particles so that increased accuracy is achieved. This change in particle numbers will give a slightly different footprint shape and therefore the EQS test needs to be repeated. After several more runs and small changes in biomass, another PASS will be achieved. The model will then be rerun using a different sequence of tidal data (Spring-Neap sequence) until a PASS is achieved. This process of refining the model predictions using increasing particle numbers and a different sequence of current data is undertaken automatically in AUTODEPOMOD (V2). The refinement process may result in an increase or reduction in the PASS biomass compared to the initial runs. However, in most cases the change between PASS before and after refining is usually less than 50 tonnes (or 5 %).
UNCONTROLLED COPY IF PRINTED Printed: 7 June, 2005
SCOTTISH ENVIRONMENT PROTECTION AGENCY Section No.: Fish Farm-AH Page no: 86 of 140
Regulation and Monitoring of Marine Cage Fish Farming in Scotland Issue No: 3.0 Annex H Issue date: 18 May, 2005
Methods for Modelling In-feed Anti-parasitics and Benthic effects Originator: Alan Hills/Jeremy Spurway/Susan Brown/Chris Cromey
Issued by: Quality Manager Authorised by: Aquaculture Project
Management Group
H:7.3.2 Benthic parameters page This page is used to enter information on farm biomass, Specific Feeding Rate (SFR), Cage Volume Adjustment (CVA), feed input, stocking density, distribution of feed between cages and the sequence of hydrographic data used in the model run. However, the most important of these are SFR, stocking density and the distribution of feed between cages.
Specific Feeding Rate (SFR)
This method iterates to a solution by varying fish farm biomass, consequently a suitable conversion is required. This conversion from biomass to feed input is made using a Specific Feeding Rate (SFR) based on the weight of feed as a percentage of fish biomass per day:
100SFR1000)tonnes(Biomass)dkg(inputFeed 1 ∗∗=− (1)
In reality, SFR will vary with fish size and water temperature. This variation is ignored in the proposed method because the aim is to model the peak impact, where compliance is assessed during the period of highest feeding rates rather than a whole growing cycle. Consequently, a single representative value is chosen. Analysis of a substantial volume of monthly feed use data supplied by the industry indicates a factor of 0.7% biomass day-1 is representative of feed rate at peak biomass.
Stocking Density
The stocking density of the cages needs to be defined to ensure that the biomass consented is suitable for the cage capacity of a site. SEPA appreciates that issues such as fish welfare, feeding efficiency and production targets must be balanced, and that the careful operator considers all these factors in controlling the density of stock at any given stage of the life cycle.
After making enquiries, SEPA has implemented a default stocking density of 17kg m-3, and this value has been employed whilst determining suitable impact limiting criteria. In general, a reduction in stocking density will reduce the degree of impact below the cages. Consequently, it may be found that upon applying the proposed modelling methodology to a particular site, a compliant maximum biomass may be obtained by careful variation of the interdependent parameters of cage size, configuration and stocking density; in so doing, care should be taken to ensure that a realistic and achievable combination is employed. This may be appropriate for specific cage configurations and should be discussed with SEPA during pre-application consultations on a site by site basis.
UNCONTROLLED COPY IF PRINTED Printed: 7 June, 2005

SCOTTISH ENVIRONMENT PROTECTION AGENCY Section No.: Fish Farm-AH Page no: 87 of 140
Regulation and Monitoring of Marine Cage Fish Farming in Scotland Issue No: 3.0 Annex H Issue date: 18 May, 2005
Methods for Modelling In-feed Anti-parasitics and Benthic effects Originator: Alan Hills/Jeremy Spurway/Susan Brown/Chris Cromey
Issued by: Quality Manager Authorised by: Aquaculture Project
Management Group
TseAaiw
Tttfcptmc
Ot
Tadsen
Fe
Ss(a
T
Guiding principle of method: The number of cages entered under the Grid and Cage Setup page is the maximum number of cages at the site. The Stocking density is used to determine biomass per cage and SFR is used to determine feed input. In the model, as different biomass is tested, cage numbers are varied up to the maximum so that the stocking density is constant.
he method assesses impact at a site by varying biomass. In reality, cages will be stocked up to ome maximum stocking density, and the efficient deployment of plant (e.g. cages, feed systems, tc.) will require that the minimum number of cages are in use at any one time. In UTODEPOMOD V2’s, the biomass, and hence feed load, applied in each iteration of the model, re distributed across an appropriate and realistic proportion of the cage group. For the automated
terative determination of a compliant biomass, the AutoDistribute method has been developed hich automatically determines the correct number of cages to use in the model run.
he ‘AutoDistribute’ method - A maximum number of cages are defined for the tonnage proposed o be held. Using the site stocking density, AUTODEPOMOD (V2) calculates the maximum onnage of the farm – given the size of the cages. If a PASS is obtained and the result ‘MAX’, the arm is fully stocked up to the maximum number of cages. In this case it is very important to heck that the stocking density is correct. A bug sometimes causes the iteration to continue ast the advised stocking density. If a FAIL is obtained then biomass is reduced by decreasing
he number of cages until compliance is reached. Due to concerns regarding the validation of the odel at very high energy sites and large biomasses, the maximum size of any farm that SEPA will
onsent is currently 2500 tonnes (see H:7.3.3 for more detail).
ther available methods should not be used to determine compliant biomass, but can be used to est scenarios designed to optimise site use:
he ‘Equally distribute’ method - apportions equal amounts of the total waste load resulting from n individual iteration biomass in each of the predefined cages. As the applied total load ecreases, the load from each cage decreases proportionally; this method may therefore result in a ituation where the equivalent stocking density in each cage falls below a level that would be either conomic or practical to maintain, but where, in reality, stock would be consolidated into a smaller umber of cages.
or a few sites tested, a slightly different biomass was obtained for the different methods as xpected due to the effect this had on particle dispersion and subsequent deposition.
EPA proposes to adopt the ‘AutoDistribute’ method as a default. A representative figure for tocking density (SD) of 17 kg m-3 is set as default and SFR of 0.7 %. Cage Volume Adjustment CVA) allows a proportion of the cage volume (Vcage, m3) to be used in calculations (if necessary) nd has a default value of 1.
he number of cages (N) used for a test biomass (Btest) is:
UNCONTROLLED COPY IF PRINTED Printed: 7 June, 2005

SCOTTISH ENVIRONMENT PROTECTION AGENCY Section No.: Fish Farm-AH Page no: 88 of 140
Regulation and Monitoring of Marine Cage Fish Farming in Scotland Issue No: 3.0 Annex H Issue date: 18 May, 2005
Methods for Modelling In-feed Anti-parasitics and Benthic effects Originator: Alan Hills/Jeremy Spurway/Susan Brown/Chris Cromey
Issued by: Quality Manager Authorised by: Aquaculture Project
Management Group
CVAVSD1000B
Ncage
test
∗∗∗
= (2)
As cages are stocked sequentially, the last cage in the sequence will not be fully stocked when the maximum number of cages is not in use. For example, where Btest = 100 tonnes, SD = 17 kg m-3 and cage dimensions = 16 m*16 m*10 m, N = 2.3 cages.
The maximum amount of biomass possible at the site is then determined by the stocking density and the maximum number of cages (Nmax).
Maximum biomass (Bmax, tonnes) for a site is:
1000SDCVAVN
B cagemaxmax
∗∗∗= (3)
e.g. where Nmax = 20, Bmax = 870 tonnes.
UNCONTROLLED COPY IF PRINTED Printed: 7 June, 2005

SCOTTISH ENVIRONMENT PROTECTION AGENCY Section No.: Fish Farm-AH Page no: 89 of 140
Regulation and Monitoring of Marine Cage Fish Farming in Scotland Issue No: 3.0 Annex H Issue date: 18 May, 2005
Methods for Modelling In-feed Anti-parasitics and Benthic effects Originator: Alan Hills/Jeremy Spurway/Susan Brown/Chris Cromey
Issued by: Quality Manager Authorised by: Aquaculture Project
Management Group
Plate 14: AUTODEPOMOD Model Parameters page showing Benthic modelling selected
P14-A Tidal: Neap-Spring sequence: The fifteen-day data is presented as both intermediate-spring-intermediate-neap-intermediate (tide) and intermediate-neap-intermediate-spring-intermediate to allow determination of the worst-case tidal conditions, against which the compliance assessment will be made. This test ensures that the compliance result is not dependent on where the model run is started in the spring-neap cycle of the input data. Click on the Neap-Spring radio button and ensure that the Automatically Redo using Spring-neap box is checked. Where the same consent biomass is achieved independent of whether a Neap-Spring or Spring-Neap sequence is used, the solution with the smallest AZE area should be submitted with the consent.
P14-B Feed input – constant: As the model is being run for peak biomass, a constant feed input is used in the simulation. Other options which are not used in this method allow a feed input to be set up as a time series so that feed input can be varied over a period of time as a farm increases in size.
UNCONTROLLED COPY IF PRINTED Printed: 7 June, 2005

SCOTTISH ENVIRONMENT PROTECTION AGENCY Section No.: Fish Farm-AH Page no: 90 of 140
Regulation and Monitoring of Marine Cage Fish Farming in Scotland Issue No: 3.0 Annex H Issue date: 18 May, 2005
Methods for Modelling In-feed Anti-parasitics and Benthic effects Originator: Alan Hills/Jeremy Spurway/Susan Brown/Chris Cromey
Issued by: Quality Manager Authorised by: Aquaculture Project
Management Group
P14-C Edit Parameters: To check input data on stocking density, cage volume adjustment, SFR and the Auto-distribute function, click on Edit Parameters.
Plate 15: Constant Feed input dialog used for specifying stocking density, CVA and SFR
P15-A Auto-distribute: This feature should be switched ON as default so that when biomass is changed between simulations the model calculates the appropriate number of cages using stocking density and CVA. Check stocking density = 17 kg m-3, CVA = 1 and SFR = 0.7 % (white boxes can be edited by the user, yellow boxes cannot). The model automatically calculates the biomass and associated feed input for the maximum number of cages defined at the grid generation stage. In the example in Plate 15, 1050 tonnes of fish is the maximum biomass which can be farmed with the number of cages set up in the model.
UNCONTROLLED COPY IF PRINTED Printed: 7 June, 2005

SCOTTISH ENVIRONMENT PROTECTION AGENCY Section No.: Fish Farm-AH Page no: 91 of 140
Regulation and Monitoring of Marine Cage Fish Farming in Scotland Issue No: 3.0 Annex H Issue date: 18 May, 2005
Methods for Modelling In-feed Anti-parasitics and Benthic effects Originator: Alan Hills/Jeremy Spurway/Susan Brown/Chris Cromey
Issued by: Quality Manager Authorised by: Aquaculture Project
Management Group
Plate 16: Dialog used for specifying feed input distribution between cages when AutoDistribute is switched OFF
P16-A Cages page: To display information on the distribution of feed input between cages, click on the Cages page tab (Plate 16). As Auto-distribute is switched ON, the biomass is distributed evenly between cages according to stocking density and is calculated automatically by the model. For this regulatory method, the user does not need to modify this page and any information in the boxes is ignored by the model. If Auto-distribute is switched OFF, the user can specify proportions of feed input between cages. Any feed input can be investigated and stocking density is ignored in Plate 15.
H:7.3.3 Site Defaults Site defaults assist in standardising certain data across runs. These data can be typically represented by a well established data set and used at all sites. This allows prioritisation of measurement of site specific data that must be measured for every site. An example of default data is settling velocity of the waste particles. Examples of site specific data are bathymetry and hydrography. Using default data means that differences in the predicted flux of particles and resultant benthic effects between sites will primarily be a result of differences in feed input, hydrography, bathymetry and cage layouts. Click on SITE defaults to display the defaults page (Plate 17). On first creating a new project, a GLOBAL defaults button appears (P13-A).
UNCONTROLLED COPY IF PRINTED Printed: 7 June, 2005

SCOTTISH ENVIRONMENT PROTECTION AGENCY Section No.: Fish Farm-AH Page no: 92 of 140
Regulation and Monitoring of Marine Cage Fish Farming in Scotland Issue No: 3.0 Annex H Issue date: 18 May, 2005
Methods for Modelling In-feed Anti-parasitics and Benthic effects Originator: Alan Hills/Jeremy Spurway/Susan Brown/Chris Cromey
Issued by: Quality Manager Authorised by: Aquaculture Project
Management Group
Plate 17: Program locations of DEPOMOD executable files
P17-A Program locations: This page specifies the location of DEPOMOD executable files and may show absolute or relative paths. A warning will be given if an incorrect location is given and naming convention is as follows: Gridgen (grid generation) executable – Gridgen#.exe, ParTrack (particle tracking) executable – Part#.exe, and Resus (resuspension) executable – Resus#.exe. If CMap, which is a bathymetry extraction utility for electronic charts is not in use (H:4.5), the location of some other executable should be in place here to act as a dummy. E.g. C:\WINDOWS\NOTEPAD.EXE
UNCONTROLLED COPY IF PRINTED Printed: 7 June, 2005

SCOTTISH ENVIRONMENT PROTECTION AGENCY Section No.: Fish Farm-AH Page no: 93 of 140
Regulation and Monitoring of Marine Cage Fish Farming in Scotland Issue No: 3.0 Annex H Issue date: 18 May, 2005
Methods for Modelling In-feed Anti-parasitics and Benthic effects Originator: Alan Hills/Jeremy Spurway/Susan Brown/Chris Cromey
Issued by: Quality Manager Authorised by: Aquaculture Project
Management Group
Plate 18: Hydrographic input data, trajectory evaluation, dispersion coefficients and maximum site biomass default settings
P18-A Time step of velocity data and Number of time steps: This is information regarding the hydrographic data set up in the model (Plate 18). As this regulatory method requires hourly averaged hydrographic data (3600 s) of length 15 days (360 steps of hourly data), these settings are shown as default. Details of hydrographic data format are given in Appendix 2.
P18-B Trajectory evaluation accuracy: An optimum value of 60 seconds is set for fish farm wastes and this is the length of time step for calculation of particle trajectories. Using a fast settling particle as a worse case example, a feed particle settling at 0.12 m s-1 will sink 7.2 m in 60 s. The model is set up with three different layers, where each layer represents approximately one third of the water column. Thus, for a 21 m water column or deeper, the particle will appropriately use hydrographic information from each of the three layers without skipping any layers. 600 seconds would result in the particle skipping layers, 6 seconds would result in increased computation for no significant benefit.
P18-C Dispersion coefficients: Default horizontal and vertical horizontal dispersion coefficients are 0.1 and 0.001 m2 s-1 and these are used for modelling of all sites. These values are conservative.
P18-D Maximum biomass: Default value 2500 t. As with all models, AUTODEPOMOD (V2) attempts to simulate reality but inevitably it has limitations. The accuracy of any model prediction depends critically on the quality of the input data. This particular version of the model has so far been validated against a limited set of environmental data. Although the field data appears to fit
UNCONTROLLED COPY IF PRINTED Printed: 7 June, 2005

SCOTTISH ENVIRONMENT PROTECTION AGENCY Section No.: Fish Farm-AH Page no: 94 of 140
Regulation and Monitoring of Marine Cage Fish Farming in Scotland Issue No: 3.0 Annex H Issue date: 18 May, 2005
Methods for Modelling In-feed Anti-parasitics and Benthic effects Originator: Alan Hills/Jeremy Spurway/Susan Brown/Chris Cromey
Issued by: Quality Manager Authorised by: Aquaculture Project
Management Group
well with predicted impacts, there are indications that the model may over-estimate impacts at depositional sites and under-estimate impacts at well flushed sites. SEPA proposes therefore to adopt a cautious approach until the method can be tested against a larger data set. In particular, in view of the potential to under-estimate impacts, there is a significant degree of uncertainty associated with very large production units and SEPA proposes to adopt an upper size limit of 2500 tonnes biomass until it has more confidence in model predictions at this level of production.
Plate 19: Particle number, refining step size, tidal sequence, feed attributes resuspension and G-model settings
P19-A Particle numbers and refining of particle runs: All particle-tracking models use a particle ensemble to represent the discharged material (Plate 19). Too few particles result in inaccurate modelling of the discharge, too many particles increase computational time without additional benefit; consequently, the number of particles used in the simulations is often optimised (- the result of this process is illustrated in
UNCONTROLLED COPY IF PRINTED Printed: 7 June, 2005

SCOTTISH ENVIRONMENT PROTECTION AGENCY Section No.: Fish Farm-AH Page no: 95 of 140
Regulation and Monitoring of Marine Cage Fish Farming in Scotland Issue No: 3.0 Annex H Issue date: 18 May, 2005
Methods for Modelling In-feed Anti-parasitics and Benthic effects Originator: Alan Hills/Jeremy Spurway/Susan Brown/Chris Cromey
Issued by: Quality Manager Authorised by: Aquaculture Project
Management Group
Figure 7.1 Particle numbers are important in flux predictions. Increasing particle numbersby an order of magnitude eliminates footprint shape artefacts
P19-B ). In this method, after a consent biomass is obtained using normal particle numbers (Refine biomass after initial runs box is checked), further model runs refine the result using a higher number of particles to increase simulation accuracy. To increase speed of runs, Number of particles for initial runs = 1 and then biomass refined after initial runs with 10 particles (Number of particles for refining runs = 10) (Plate 19). See also P10-D, P10-F and P10-G for further information.
UNCONTROLLED COPY IF PRINTED Printed: 7 June, 2005
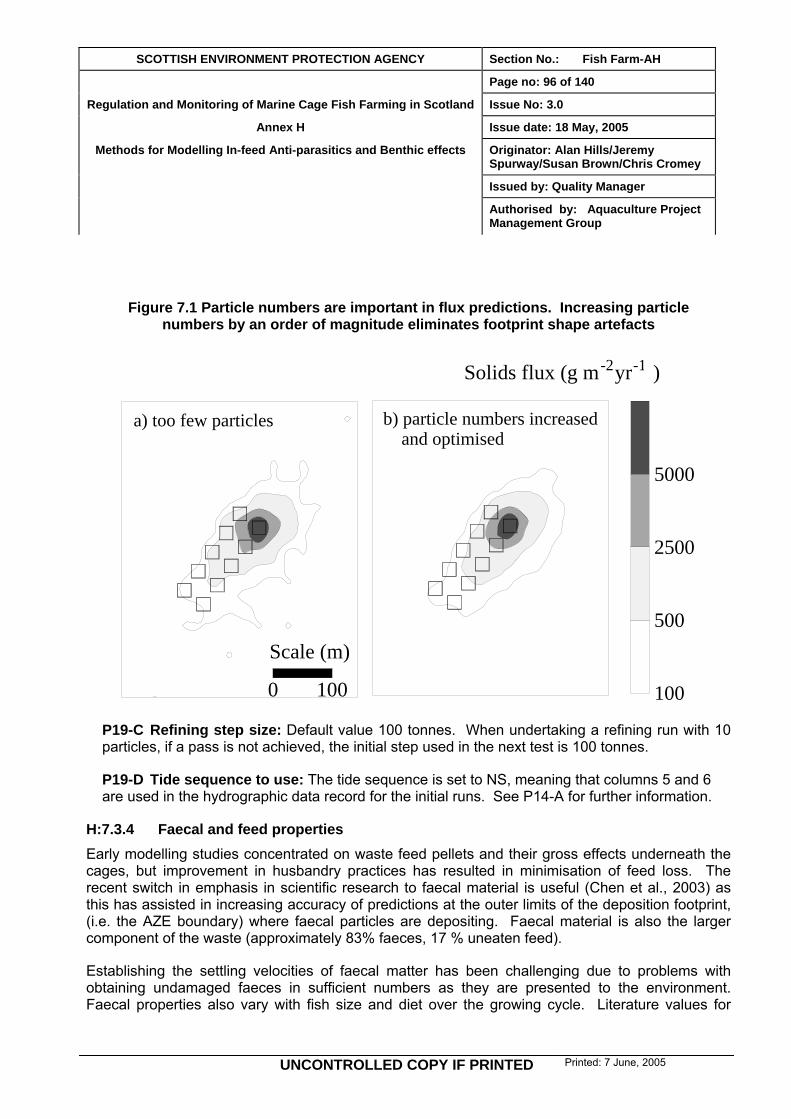
SCOTTISH ENVIRONMENT PROTECTION AGENCY Section No.: Fish Farm-AH Page no: 96 of 140
Regulation and Monitoring of Marine Cage Fish Farming in Scotland Issue No: 3.0 Annex H Issue date: 18 May, 2005
Methods for Modelling In-feed Anti-parasitics and Benthic effects Originator: Alan Hills/Jeremy Spurway/Susan Brown/Chris Cromey
Issued by: Quality Manager Authorised by: Aquaculture Project
Management Group
Figure 7.1 Particle numbers are important in flux predictions. Increasing particle numbers by an order of magnitude eliminates footprint shape artefacts
0 100
Scale (m)
100
500
2500
5000
Solids flux (g m yr )-2 -1
a) too few particles b) particle numbers increased and optimised
P19-C Refining step size: Default value 100 tonnes. When undertaking a refining run with 10 particles, if a pass is not achieved, the initial step used in the next test is 100 tonnes.
P19-D Tide sequence to use: The tide sequence is set to NS, meaning that columns 5 and 6 are used in the hydrographic data record for the initial runs. See P14-A for further information.
H:7.3.4 Faecal and feed properties Early modelling studies concentrated on waste feed pellets and their gross effects underneath the cages, but improvement in husbandry practices has resulted in minimisation of feed loss. The recent switch in emphasis in scientific research to faecal material is useful (Chen et al., 2003) as this has assisted in increasing accuracy of predictions at the outer limits of the deposition footprint, (i.e. the AZE boundary) where faecal particles are depositing. Faecal material is also the larger component of the waste (approximately 83% faeces, 17 % uneaten feed).
Establishing the settling velocities of faecal matter has been challenging due to problems with obtaining undamaged faeces in sufficient numbers as they are presented to the environment. Faecal properties also vary with fish size and diet over the growing cycle. Literature values for
UNCONTROLLED COPY IF PRINTED Printed: 7 June, 2005

SCOTTISH ENVIRONMENT PROTECTION AGENCY Section No.: Fish Farm-AH Page no: 97 of 140
Regulation and Monitoring of Marine Cage Fish Farming in Scotland Issue No: 3.0 Annex H Issue date: 18 May, 2005
Methods for Modelling In-feed Anti-parasitics and Benthic effects Originator: Alan Hills/Jeremy Spurway/Susan Brown/Chris Cromey
Issued by: Quality Manager Authorised by: Aquaculture Project
Management Group
settling rates of salmon faeces range from 1.7 to 6 cm s-1 ; some of these experiments have been fairly simple and potentially unreliable (see Magill et al. (In Press) for review). The method described here uses a normal distribution of settling rates measured in the DEPOMOD project (µ = 3.2 cm s-1, σ = 1.1 cm s-1, n=44, Cromey et al., 2002). This data set has one of the highest sample sizes in literature experiments on fish faeces and is supported by the findings of Panchang et al. (1997) (µ = 3.2 cm s-1, n = 50).
The percentage of uneaten feed pellets is set at 3%; feed digestibility and water content are set at 85% and 9% respectively, according to manufacturers’ specification for several feeds. Feed settling rates are also drawn from a normal distribution (µ = 8.3 cm s-1, σ = 1.5 cm s-1, Cromey et al., 2002) measured from settling experiments and agree with Chen et al. (1999). The mean of sixteen data sets of settling data collated by the DEPOMOD project was 10.8 cm s-1, but it was not appropriate to use this mean value as some of these experiments included very large pellets used for broodstock. Disaggregation of feed pellets has been measured (Stewart and Grant, 2002) but modelling of this process in this method is believed to add an unnecessary degree of complexity.
The mass of feed particles released in the model is determined from the percentage of feed pellets lost with an adjustment for water content. Of the feed consumed, an adjustment is made for digestibility and water content to calculate the mass of faecal material released. Total particulate material rather than carbon is modelled and no decay or solubility (Tlusty et al., 2000) is taken into account. This is due to the DEPOMOD benthic module requiring predictions of total particulate material (i.e. solids not carbon).
P19-E Feed properties: The percentage of uneaten feed pellets is set at 3%; feed digestibility and water content are set at 85% and 9% respectively, according to manufacturers’ specification for several feeds.
H:7.3.5 DEPOMOD resuspension model The DEPOMOD resuspension model is one of only two validated resuspension models of aquaculture discharges in the scientific literature (Cromey et al, 2002). This model is compartmentalised into erosion–transport–deposition–consolidation processes, also common practice in estuarine resuspension models (Clarke and Elliot, 1998). For a specific particle on the seabed, there are several forces acting on it. Drag which is a result of frictional forces between it and surrounding particles along with gravitational forces act to keep the particle on the bed. The near–bed current creates lift, a buoyancy component created by the current moving over the particle. The net result of all these forces will determine particle movement, such that if lift exceeds gravitational and drag forces, the particle will be resuspended.
As near–bed current increases, the shearing force will eventually exceed a critical threshold and erosion takes place. Particles are transported at ambient near–bed current speed and may re-deposit if current decreases below a critical threshold for deposition.
DEPOMOD resuspension parameters were validated using a tracer with similar settling and size characteristics to fish farm waste material. Tracer redistribution as a result of resuspension
UNCONTROLLED COPY IF PRINTED Printed: 7 June, 2005

SCOTTISH ENVIRONMENT PROTECTION AGENCY Section No.: Fish Farm-AH Page no: 98 of 140
Regulation and Monitoring of Marine Cage Fish Farming in Scotland Issue No: 3.0 Annex H Issue date: 18 May, 2005
Methods for Modelling In-feed Anti-parasitics and Benthic effects Originator: Alan Hills/Jeremy Spurway/Susan Brown/Chris Cromey
Issued by: Quality Manager Authorised by: Aquaculture Project
Management Group
processes was determined by up to forty 0.1 m2 grab samples taken per sampling event for one month. In addition to threshold values, the erodibility constant and consolidation time parameters were validated. The DEPOMOD benthic effects model was also validated using the following parameters:
Critical resuspension speed a = 9.5 cm s-1
Critical deposition speed a = 4.5 cm s-1
Erodibility constant = 60 g m-2 d-1
Consolidation time (time in resuspendable ‘fluff’ layer) = 4 days
Note: a. measured 1.8 m above bed
These parameters are likely to vary depending on the nature of the solids discharged, natural sediment characteristics and benthic fauna and flora. However, as is commonly the case with the majority of resuspension models, these parameters are kept constant in DEPOMOD and cannot be adjusted by the user. The critical resuspension speed is the most important parameter. The other validated aquaculture impact resuspension model suggests a critical resuspension speed of 66 cm s-1 (Dudley et al., 2000), but this would result in minimal predictions of resuspension for the majority of Scottish sites.
P19-F Benthic resuspension parameters: Default values for Particle consolidation time is 4 days and Loops is 2 and these default values should not be changed by the user.
P19-G G model: Use G-model box default setting is unchecked. As the DEPOMOD benthic relationship is validated using total solids (i.e. without taking into account particle decay), the G-model which is a first-order decay rate equation is switched OFF.
UNCONTROLLED COPY IF PRINTED Printed: 7 June, 2005

SCOTTISH ENVIRONMENT PROTECTION AGENCY Section No.: Fish Farm-AH Page no: 99 of 140
Regulation and Monitoring of Marine Cage Fish Farming in Scotland Issue No: 3.0 Annex H Issue date: 18 May, 2005
Methods for Modelling In-feed Anti-parasitics and Benthic effects Originator: Alan Hills/Jeremy Spurway/Susan Brown/Chris Cromey
Issued by: Quality Manager Authorised by: Aquaculture Project
Management Group
Plate 20: Food and faecal particle settling velocity default settings
P20-A Food particle settling velocities: Default data are a Normal distribution of settling velocities (Mean = 0.083 m s-1, SD (standard deviation) = 0.015 m s-1). See H:7.3.4. As the Normal distribution button is in use, the number of groups (No) and pptn must also be set to one even though this information is not being used directly in the model, as shown in Plate 20. P20-B Faecal particle settling velocities: Default data are a Normal distribution of settling velocities (Mean = 0.032 m s-1, SD (standard deviation) = 0.011 m s-1). See H:7.3.4. As the Normal distribution button is in use, the number of groups (No) and pptn must also be set to one even though this information is not being used directly in the model, as shown in Plate 20.
H:7.3.6 EQS Benthic criteria Selection of Environmental Quality Standards
A suitable environmental quality standard for particulate organic matter requires an indicator (e.g. Infaunal Trophic Index, carbon flux, total organic carbon, solids flux), a limit for that indicator (e.g. 700g carbon m-2 y-1) and a zone outwith which the chosen indicator must not exceed the limit.
An indicator is most useful as a regulatory tool if it can be both measured in surveys and predicted by a validated model. The appropriate indicator proposed here is the Infaunal Trophic Index (ITI), correlated with solids flux. The use of carbon flux was debated but set aside, as modelled carbon flux is difficult to relate to measurable total organic carbon and little is known about the decay of faecal carbon in the sea.
UNCONTROLLED COPY IF PRINTED Printed: 7 June, 2005
SCOTTISH ENVIRONMENT PROTECTION AGENCY Section No.: Fish Farm-AH Page no: 100 of 140
Regulation and Monitoring of Marine Cage Fish Farming in Scotland Issue No: 3.0 Annex H Issue date: 18 May, 2005
Methods for Modelling In-feed Anti-parasitics and Benthic effects Originator: Alan Hills/Jeremy Spurway/Susan Brown/Chris Cromey
Issued by: Quality Manager Authorised by: Aquaculture Project
Management Group
The ITI is a biotic index, developed by the Water Research Centre (Codling and Ashley, 1992). It expresses changes in the feeding (trophic) mode of communities of benthic organisms. The index differs from other numerical methods in requiring knowledge of the ecology of the taxa. The index responds satisfactorily to pollution gradients from a variety of sources including sewage and industrial discharges. ITI has values that range from 0 to 100 and results can be interpreted as follows:
ITI Value Assessment
60 to 100: Community ‘Normal’
30 to 60: Community ‘Changed’
< 30: Community ‘Degraded’
The ITI criterion that SEPA will apply to denote the edge of the AZE is 30, a value commonly regarded as the threshold of a “degraded” community. The proposed method applies this limit at a locus that depends on the site-specific distribution of waste. The derived AZE within the locus is therefore site-specific, related to the intensity of the impact.
EQS criteria validation
The AUTODEPOMOD (v2) model produces a seabed map with contours predicting the fate of various percentages of the released particles. At a given site, the contour enclosing 100% of the settled particles would lie some distance out from the cages and a contour containing 10% of the particles would lie much closer.
The application of AUTODEPOMOD (v2) as a predictive tool depends on the value chosen for the percentage of particles. The model could be set up to predict the fate of all the particles released from a cage but the vagaries of the scatter of particles at the outer edges of the foot-print affect the confidence with which these predictions can be made. Also, the particles which travel furthest are least likely to contribute to benthic impact. Considering the fate of all particles may therefore result in less useful predictions than when a smaller percentage is considered.
The accuracy of the model in predicting the site-specific AZE is also variable depending upon which ITI value is used to denote the boundary within which this chosen percentage of particles will settle. An examination of
UNCONTROLLED COPY IF PRINTED Printed: 7 June, 2005

SCOTTISH ENVIRONMENT PROTECTION AGENCY Section No.: Fish Farm-AH Page no: 101 of 140
Regulation and Monitoring of Marine Cage Fish Farming in Scotland Issue No: 3.0 Annex H Issue date: 18 May, 2005
Methods for Modelling In-feed Anti-parasitics and Benthic effects Originator: Alan Hills/Jeremy Spurway/Susan Brown/Chris Cromey
Issued by: Quality Manager Authorised by: Aquaculture Project
Management Group
Figure 7.2 DEPOMOD benthic module - Modelled solids accumulation (Savail) plotted against observed Infaunal Trophic Index. Circles demonstrate the variation in the benthic composition ofduplicate grabs and the Envelope of Acceptable Precision is defined to take account of this naturalvariation (88% in EAP, n = 42 stations)
demonstrates that variability in observations and model predictions is at its highest at the low impact end of the scale and shows that the model performs most accurately at the lower end of the ITI range justifying the choice of a low ITI value. In this part of the graph, the variation between measured and predicted ITI is minimised.
UNCONTROLLED COPY IF PRINTED Printed: 7 June, 2005

SCOTTISH ENVIRONMENT PROTECTION AGENCY Section No.: Fish Farm-AH Page no: 102 of 140
Regulation and Monitoring of Marine Cage Fish Farming in Scotland Issue No: 3.0 Annex H Issue date: 18 May, 2005
Methods for Modelling In-feed Anti-parasitics and Benthic effects Originator: Alan Hills/Jeremy Spurway/Susan Brown/Chris Cromey
Issued by: Quality Manager Authorised by: Aquaculture Project
Management Group
Figure 7.2 DEPOMOD benthic module - Modelled solids accumulation (Savail) plotted against observed Infaunal Trophic Index. Circles demonstrate the variation in the benthic
composition of duplicate grabs and the Envelope of Acceptable Precision is defined to take account of this natural variation (88% in EAP, n = 42 stations)
0
10
20
30
40
50
60
70
80
90
100
110100100010000100000
S avail + 1 (g m-2 yr-1)
Infa
unal
Tro
phic
Inde
x
Envelope of Acceptable Precision
Observed ITI
Modelled
The ITI EQS criteria have been determined by testing a range of ITI and proportion of the deposited solids combinations against the modelled deposition at a number of sites chosen for their long-term records of benthic impact. The choice of percentage of modelled solids has been balanced between the opposing requirements of:
i. being high enough to capture a representative proportion of the total deposition
ii. low enough to exclude outlying deposition, in which confidence is lower, and to which the benthic response is less well defined.
UNCONTROLLED COPY IF PRINTED Printed: 7 June, 2005

SCOTTISH ENVIRONMENT PROTECTION AGENCY Section No.: Fish Farm-AH Page no: 103 of 140
Regulation and Monitoring of Marine Cage Fish Farming in Scotland Issue No: 3.0 Annex H Issue date: 18 May, 2005
Methods for Modelling In-feed Anti-parasitics and Benthic effects Originator: Alan Hills/Jeremy Spurway/Susan Brown/Chris Cromey
Issued by: Quality Manager Authorised by: Aquaculture Project
Management Group
For this reason, SEPA has decided to base the model runs used in the biomass setting process upon predictions of the fate of 80% of the particles (MEQS) remaining within the model grid as this will result in more robust predictions.
SEPA also propose to use a value of 10 ITI (IEQS) as a limiting model parameter to estimate biomass limits at cage fish farms, and then to establish the boundary of the AZE by extrapolating out to the 30 ITI contour [i.e. the boundary beyond which SEPA would not expect the benthic fauna to be changed and degraded]. SEPA may fine tune both the ITI and percentage parameters in the light of data arising from further model runs.
Thus, SEPA will base the derivation of its regulatory standards from data taken from the most statistically robust part of the model output and use these results toextrapolate out to establish the AZE boundary at a site-specific shaped contour where ITI measurements are sensitive enough to gauge the impact on marine benthic fauna. Representative sampling points can then be derived on the longest axis of the AZE; this being possible regardless of whether its shape is rectangular or elliptical or the impacted area is off-set from the centre of the fish farm cages.
Plate 21: EQS benthic criteria default data
P21-A Select Percent Solids, ITI threshold and Pass: These are default EQS criteria set at 80% for Percentage Solids, 10 ITI for the ITI threshold with a Pass tolerance of ± 1 %. See H:7.3.6 for details and validation of these criteria. The model iterates until 80 % of the solids remaining in the footprint are enclosed by the 10 ITI contour.
UNCONTROLLED COPY IF PRINTED Printed: 7 June, 2005

SCOTTISH ENVIRONMENT PROTECTION AGENCY Section No.: Fish Farm-AH Page no: 104 of 140
Regulation and Monitoring of Marine Cage Fish Farming in Scotland Issue No: 3.0 Annex H Issue date: 18 May, 2005
Methods for Modelling In-feed Anti-parasitics and Benthic effects Originator: Alan Hills/Jeremy Spurway/Susan Brown/Chris Cromey
Issued by: Quality Manager Authorised by: Aquaculture Project
Management Group
P21-B Flux trigger: Default value 10 000 g m-2 yr-1. In the model run, the average flux underneath the cages is calculated by determining the equivalent sea bed area occupied by the cage groups and determining the average flux over this area. The trigger value set in the defaults dialog is used to flag the site if the average flux underneath the cages exceeds the trigger value. Although not applied as a near field EQS, this flux trigger value indicates the severity of benthic impact underneath the cages.
P21-C Sampling ITI: Default value is 30 ITI. This is the denoted edge of the AZE as described in H:7.3.6. The footprint area enclosed by the 30 ITI contour is the AZE.
P21-D Transect ITI sampling values: Default values are 1, 4, 20, 30, 40 ITI and are used in the mapping module. When a transect is positioned in the mapping module on the footprint, positions along the transect are determined for each of these ITI values. For each position, distance and bearing and predicted flux from the cages are reported.
P21-E Flux Contour Interval for Surfer/Mapping: Default value is 5000 g m-2 yr-1. This is the interval for contours in the mapping module.
H:7.3.7 The log file During and at the end of the model run, a log file is displayed showing information for the run. At any other time the user can display the log file by clicking on the Show log button displayed in Plate 14. An example log file is described in this section and the information is interpreted by use of a contour plot at the end of the section (Figure 7.3).
UNCONTROLLED COPY IF PRINTED Printed: 7 June, 2005

SCOTTISH ENVIRONMENT PROTECTION AGENCY Section No.: Fish Farm-AH Page no: 105 of 140
Regulation and Monitoring of Marine Cage Fish Farming in Scotland Issue No: 3.0 Annex H Issue date: 18 May, 2005
Methods for Modelling In-feed Anti-parasitics and Benthic effects Originator: Alan Hills/Jeremy Spurway/Susan Brown/Chris Cromey
Issued by: Quality Manager Authorised by: Aquaculture Project
Management Group
Plate 22: Log file displaying columns Run no. to ITIflag
P22-A Log - Run no, start, end and run time: The run number, start, end and total run time are displayed in these columns (Plate 22).
P22-B Log – Feed and biomass: This is the biomass used in the run (tonnes) and the associated feed input (kg d-1) for this biomass calculated from SFR (see H:7.3.2).
P22-C Log – Part no., Tide and grid type: This is the particle number setting used in the run, the tidal sequence used (N = N,S; S= S,N) and grid type is the gridding algorithm used (Kg = krigging). Note that for run 9, the solution is refined using 10 particles for a neap tidal sequence and then rerun using a spring tide in runs 10 to 15. The difference between the more accurate 10S solution (run 15) run and the 1N solution (run 8) is approximately 16 tonnes (3.2 %).
Log – PASS/FAIL and Benthic testing: % solids is the 80 % EQS criteria and the flux contour which encloses this mass is given by Cntr(g/m2/yr). The benthic impact associated with this flux is given by ITI and this relationship is obtained from the DEPOMOD benthic module graph (
UNCONTROLLED COPY IF PRINTED Printed: 7 June, 2005
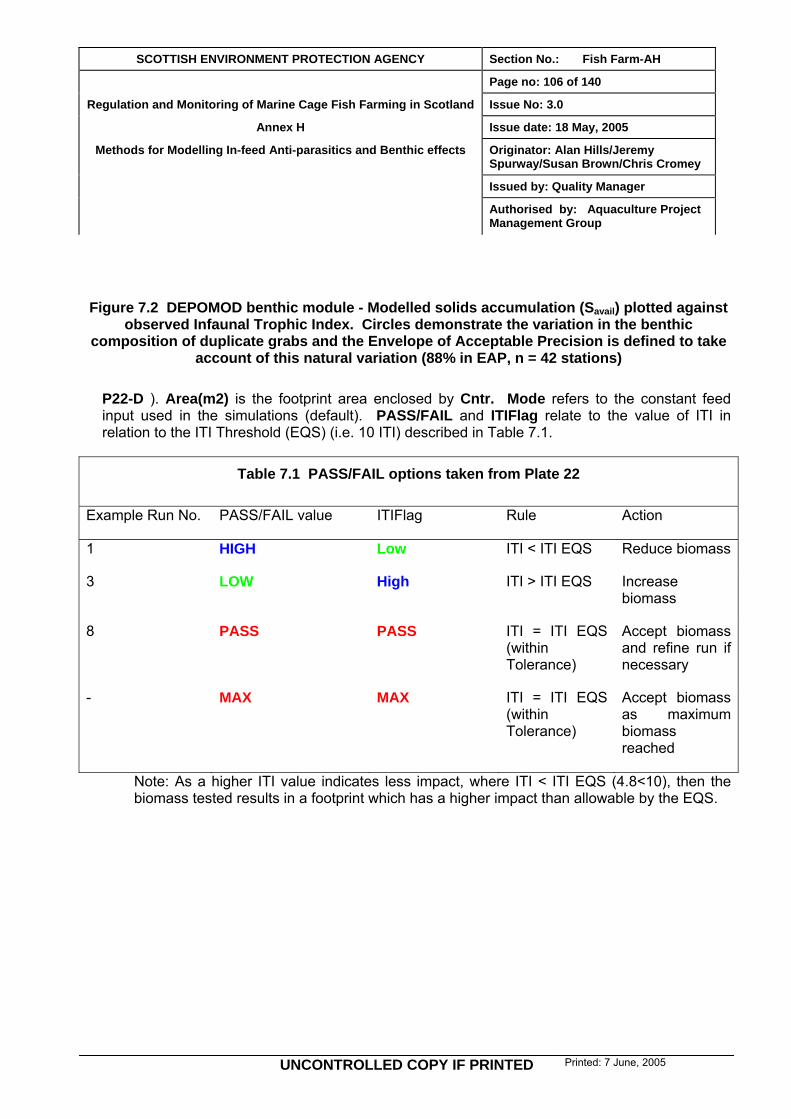
SCOTTISH ENVIRONMENT PROTECTION AGENCY Section No.: Fish Farm-AH Page no: 106 of 140
Regulation and Monitoring of Marine Cage Fish Farming in Scotland Issue No: 3.0 Annex H Issue date: 18 May, 2005
Methods for Modelling In-feed Anti-parasitics and Benthic effects Originator: Alan Hills/Jeremy Spurway/Susan Brown/Chris Cromey
Issued by: Quality Manager Authorised by: Aquaculture Project
Management Group
Figure 7.2 DEPOMOD benthic module - Modelled solids accumulation (Savail) plotted against observed Infaunal Trophic Index. Circles demonstrate the variation in the benthic
composition of duplicate grabs and the Envelope of Acceptable Precision is defined to take account of this natural variation (88% in EAP, n = 42 stations)
P22-D ). Area(m2) is the footprint area enclosed by Cntr. Mode refers to the constant feed input used in the simulations (default). PASS/FAIL and ITIFlag relate to the value of ITI in relation to the ITI Threshold (EQS) (i.e. 10 ITI) described in Table 7.1.
Table 7.1 PASS/FAIL options taken from Plate 22
Example Run No. PASS/FAIL value ITIFlag Rule Action
1 HIGH Low ITI < ITI EQS Reduce biomass
3 LOW High ITI > ITI EQS Increase biomass
8 PASS PASS ITI = ITI EQS (within Tolerance)
Accept biomass and refine run if necessary
- MAX MAX ITI = ITI EQS (within Tolerance)
Accept biomass as maximum biomass reached
Note: As a higher ITI value indicates less impact, where ITI < ITI EQS (4.8<10), then the biomass tested results in a footprint which has a higher impact than allowable by the EQS.
UNCONTROLLED COPY IF PRINTED Printed: 7 June, 2005

SCOTTISH ENVIRONMENT PROTECTION AGENCY Section No.: Fish Farm-AH Page no: 107 of 140
Regulation and Monitoring of Marine Cage Fish Farming in Scotland Issue No: 3.0 Annex H Issue date: 18 May, 2005
Methods for Modelling In-feed Anti-parasitics and Benthic effects Originator: Alan Hills/Jeremy Spurway/Susan Brown/Chris Cromey
Issued by: Quality Manager Authorised by: Aquaculture Project
Management Group
Plate 23: Log file displaying columns Benthic cage group to Benthic cage params
P23-A Log – Benthic cage group – Flux and trigger: The output in these columns are the predicted under cage conditions in relation to the Trig. (Trigger) set (default 10 000 g m-2 yr-1 (P21-B)). The area equivalent to the cage group area is given by Area (m2) and the flux contour which encloses this area is given by EqCntr. Mean and Max flux and the ITI minimum (ITImin) within this area are given. If Mean > Trig. then Yes is stated, otherwise No is stated. Note, Area is halved as cage numbers are halved between runs 1 and 2 (P23-B).
P23-B Log - Benthic Cage Distribution: Mode refers to the AutoDistribute function (Auto = AutoDistribute ON, Equal = AutoDistribute OFF). The number of cages used in the simulation and the final stocking density are specified by Cages and FinalStkD. Note these variables change as different biomass is tested and cage numbers are changed. The FinalStkD assumes biomass is distributed evenly equally across the cages.
P23-C Log - Benthic Cage Params: These are default values of stocking density (StkD), specific feeding rate (SFR) and cage volume adjustment (VolAdj) – see H:7.3.2.
UNCONTROLLED COPY IF PRINTED Printed: 7 June, 2005

SCOTTISH ENVIRONMENT PROTECTION AGENCY Section No.: Fish Farm-AH Page no: 108 of 140
Regulation and Monitoring of Marine Cage Fish Farming in Scotland Issue No: 3.0 Annex H Issue date: 18 May, 2005
Methods for Modelling In-feed Anti-parasitics and Benthic effects Originator: Alan Hills/Jeremy Spurway/Susan Brown/Chris Cromey
Issued by: Quality Manager Authorised by: Aquaculture Project
Management Group
Plate 24: Log file displaying columns Sampling Area to Grid file
Log – Sampling Area: This is the AZE defined by the area enclosed by the 30 ITI EQS contour (ITI). Flux is the flux associated with this ITI value from the DEPOMOD benthic module graph (
UNCONTROLLED COPY IF PRINTED Printed: 7 June, 2005
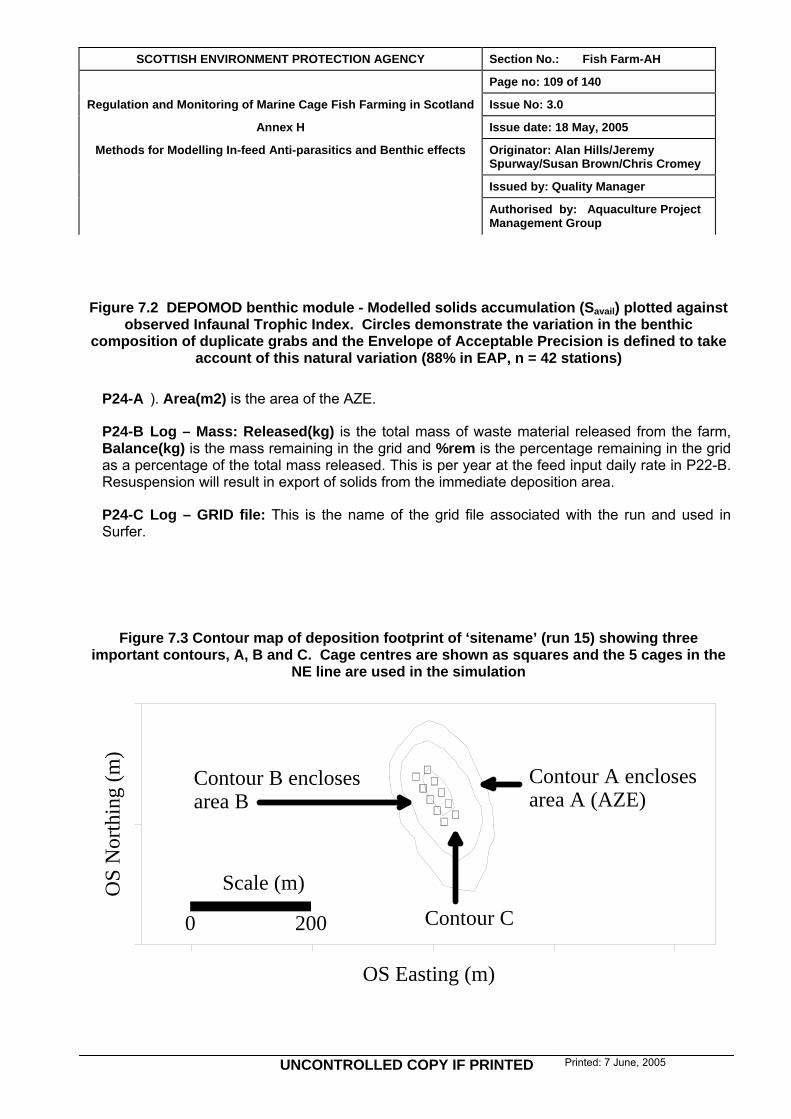
SCOTTISH ENVIRONMENT PROTECTION AGENCY Section No.: Fish Farm-AH Page no: 109 of 140
Regulation and Monitoring of Marine Cage Fish Farming in Scotland Issue No: 3.0 Annex H Issue date: 18 May, 2005
Methods for Modelling In-feed Anti-parasitics and Benthic effects Originator: Alan Hills/Jeremy Spurway/Susan Brown/Chris Cromey
Issued by: Quality Manager Authorised by: Aquaculture Project
Management Group
Figure 7.2 DEPOMOD benthic module - Modelled solids accumulation (Savail) plotted against observed Infaunal Trophic Index. Circles demonstrate the variation in the benthic
composition of duplicate grabs and the Envelope of Acceptable Precision is defined to take account of this natural variation (88% in EAP, n = 42 stations)
P24-A ). Area(m2) is the area of the AZE.
P24-B Log – Mass: Released(kg) is the total mass of waste material released from the farm, Balance(kg) is the mass remaining in the grid and %rem is the percentage remaining in the grid as a percentage of the total mass released. This is per year at the feed input daily rate in P22-B. Resuspension will result in export of solids from the immediate deposition area.
P24-C Log – GRID file: This is the name of the grid file associated with the run and used in Surfer.
Figure 7.3 Contour map of deposition footprint of ‘sitename’ (run 15) showing three important contours, A, B and C. Cage centres are shown as squares and the 5 cages in the
NE line are used in the simulation
OS Easting (m)
OS
Nor
thin
g (m
)
Contour A enclosesarea A (AZE)
Contour B enclosesarea B
Contour C0 200
Scale (m)
UNCONTROLLED COPY IF PRINTED Printed: 7 June, 2005

SCOTTISH ENVIRONMENT PROTECTION AGENCY Section No.: Fish Farm-AH Page no: 110 of 140
Regulation and Monitoring of Marine Cage Fish Farming in Scotland Issue No: 3.0 Annex H Issue date: 18 May, 2005
Methods for Modelling In-feed Anti-parasitics and Benthic effects Originator: Alan Hills/Jeremy Spurway/Susan Brown/Chris Cromey
Issued by: Quality Manager Authorised by: Aquaculture Project
Management Group
Output from the log file for Run 15 can be interpreted with the aid of the three important contours shown in Figure 7.3.
Contour A – This is the AZE. Contour A is 30 ITI (and 191.8 g m-2 yr-1). Area A is 33742 m2. See 0.
Contour B – This is the contour used for testing against EQS criteria. Contour B is 10 ITI EQS (10.1 ITI within tolerance and 1545 g m-2 yr-1). Area B is 17391 m2. See 0 and Table 7.1.
Contour C – This is the under cage group area used for calculating mean and maximum flux. Contour C is 23290 g m-2 yr-1 and area C is 2311 m2. See P23-A.
Plate 25: Using the filter button, failed runs can be eliminated from the log file
P25-A Log – Filter button: Click on the Filter button to filter some of the runs from the log file. Plate 25 shows how failed runs can be eliminated from the log file. Plate 22 shows all runs.
H:7.3.8 Mapping module The purpose of the mapping dialog is to display bathymetry, cage location and model output flux in order for the user to determine sampling station locations. In addition, this then outputs all necessary information into a single Excel file to allow the filling in of required forms (see “Submit” button).
UNCONTROLLED COPY IF PRINTED Printed: 7 June, 2005
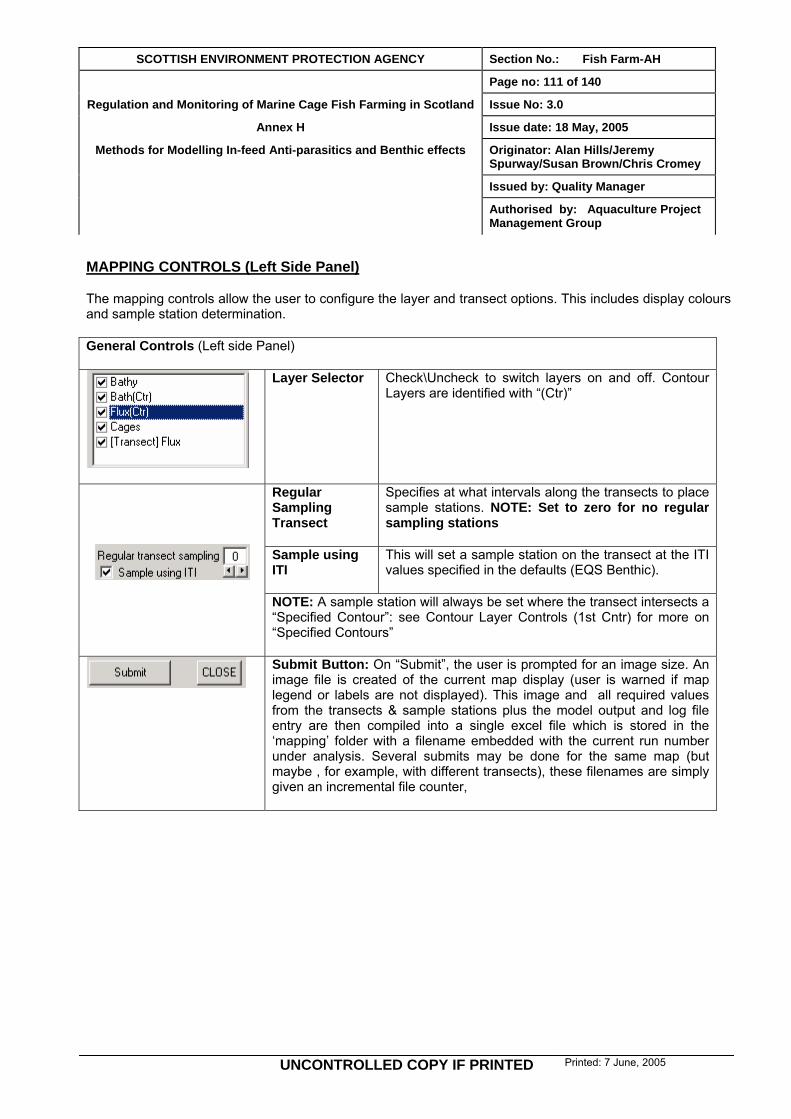
SCOTTISH ENVIRONMENT PROTECTION AGENCY Section No.: Fish Farm-AH Page no: 111 of 140
Regulation and Monitoring of Marine Cage Fish Farming in Scotland Issue No: 3.0 Annex H Issue date: 18 May, 2005
Methods for Modelling In-feed Anti-parasitics and Benthic effects Originator: Alan Hills/Jeremy Spurway/Susan Brown/Chris Cromey
Issued by: Quality Manager Authorised by: Aquaculture Project
Management Group
MAPPING CONTROLS (Left Side Panel)
The mapping controls allow the user to configure the layer and transect options. This includes display colours and sample station determination.
General Controls (Left side Panel)
Layer Selector Check\Uncheck to switch layers on and off. Contour Layers are identified with “(Ctr)”
Regular Sampling Transect
Specifies at what intervals along the transects to place sample stations. NOTE: Set to zero for no regular sampling stations
Sample using ITI
This will set a sample station on the transect at the ITI values specified in the defaults (EQS Benthic).
NOTE: A sample station will always be set where the transect intersects a “Specified Contour”: see Contour Layer Controls (1st Cntr) for more on “Specified Contours”
Submit Button: On “Submit”, the user is prompted for an image size. An image file is created of the current map display (user is warned if map legend or labels are not displayed). This image and all required values from the transects & sample stations plus the model output and log file entry are then compiled into a single excel file which is stored in the ‘mapping’ folder with a filename embedded with the current run number under analysis. Several submits may be done for the same map (but maybe , for example, with different transects), these filenames are simply given an incremental file counter,
UNCONTROLLED COPY IF PRINTED Printed: 7 June, 2005
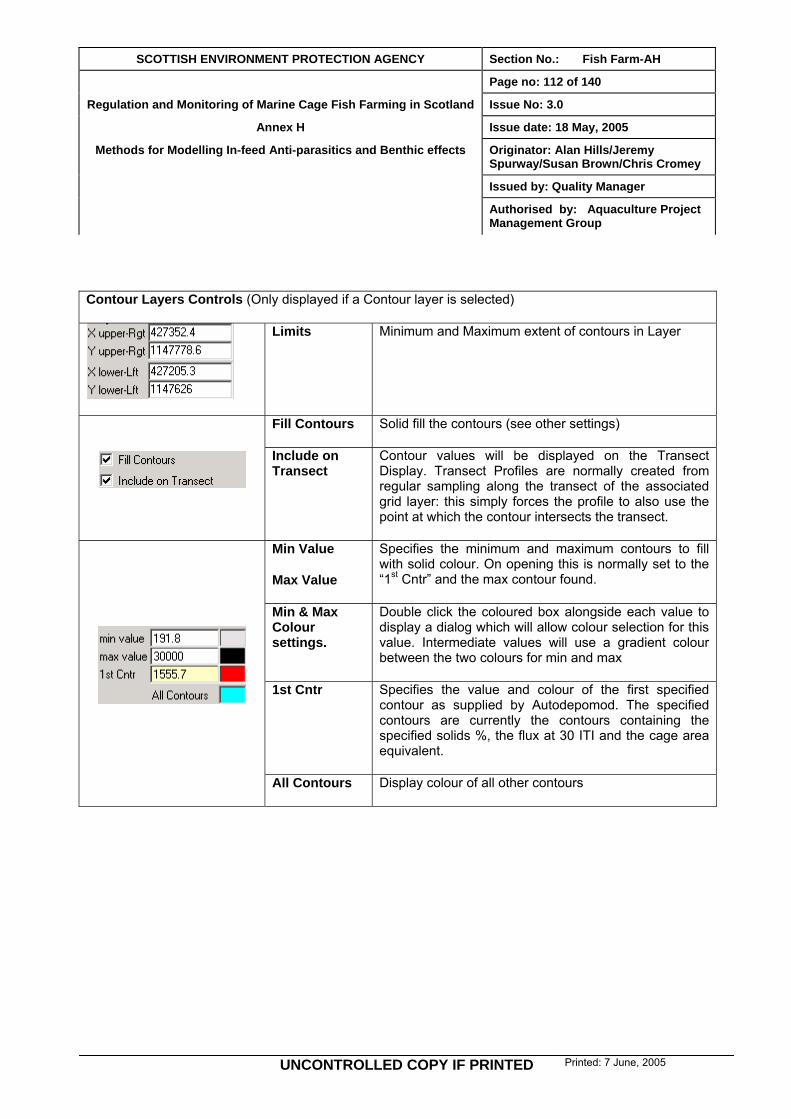
SCOTTISH ENVIRONMENT PROTECTION AGENCY Section No.: Fish Farm-AH Page no: 112 of 140
Regulation and Monitoring of Marine Cage Fish Farming in Scotland Issue No: 3.0 Annex H Issue date: 18 May, 2005
Methods for Modelling In-feed Anti-parasitics and Benthic effects Originator: Alan Hills/Jeremy Spurway/Susan Brown/Chris Cromey
Issued by: Quality Manager Authorised by: Aquaculture Project
Management Group
Contour Layers Controls (Only displayed if a Contour layer is selected)
Limits Minimum and Maximum extent of contours in Layer
Fill Contours Solid fill the contours (see other settings)
Include on Transect
Contour values will be displayed on the Transect Display. Transect Profiles are normally created from regular sampling along the transect of the associated grid layer: this simply forces the profile to also use the point at which the contour intersects the transect.
Min Value
Max Value
Specifies the minimum and maximum contours to fill with solid colour. On opening this is normally set to the “1st Cntr” and the max contour found.
Min & Max Colour settings.
Double click the coloured box alongside each value to display a dialog which will allow colour selection for this value. Intermediate values will use a gradient colour between the two colours for min and max
1st Cntr Specifies the value and colour of the first specified contour as supplied by Autodepomod. The specified contours are currently the contours containing the specified solids %, the flux at 30 ITI and the cage area equivalent.
All Contours Display colour of all other contours
UNCONTROLLED COPY IF PRINTED Printed: 7 June, 2005

SCOTTISH ENVIRONMENT PROTECTION AGENCY Section No.: Fish Farm-AH Page no: 113 of 140
Regulation and Monitoring of Marine Cage Fish Farming in Scotland Issue No: 3.0 Annex H Issue date: 18 May, 2005
Methods for Modelling In-feed Anti-parasitics and Benthic effects Originator: Alan Hills/Jeremy Spurway/Susan Brown/Chris Cromey
Issued by: Quality Manager Authorised by: Aquaculture Project
Management Group
Grid Size Grid size in cells
Cell Size Size of each cell
X lower-Lft
Y lower-Lft
Coordinates of lower left corner of grid
Use for Transect
The grid will be sampled at regular intervals along the transect to create a profile
Negify In the transect will display positive values as a negative and vice versa (e.g. Bathymetry)
Fill In the Transect display, will fill the area below the profile
Min Value
Max Value
Specifies the minimum and maximum grid values to display
Min & Max Colour settings
Double click the required box to change colour for value. Intermediate values will use a gradient colour between the two colours for min and max
Blanking Specifies the colour to use for blanked areas of the grid. Value displayed is the internal blanking value.
UNCONTROLLED COPY IF PRINTED Printed: 7 June, 2005

SCOTTISH ENVIRONMENT PROTECTION AGENCY Section No.: Fish Farm-AH Page no: 114 of 140
Regulation and Monitoring of Marine Cage Fish Farming in Scotland Issue No: 3.0 Annex H Issue date: 18 May, 2005
Methods for Modelling In-feed Anti-parasitics and Benthic effects Originator: Alan Hills/Jeremy Spurway/Susan Brown/Chris Cromey
Issued by: Quality Manager Authorised by: Aquaculture Project
Management Group
MAP MODES – Right side of dialog
The buttons on the right side of the window allow the user to set the current interactive map mode: this includes zooming and transect and sample station creation.
Map Modes (1) - General & Scaling
Zoom In Left Click on map. Drag mouse to select the zoom area. Release mouse to complete
Zoom Out Redraws map at previous zoom scale
Full Scale Redraws complete map at full scale.
Default mode Click on this to return to default pointer
Display Grid Toggles Grid & Legend display
Labelling Toggles Transect and Sample Station Labels
Map Modes (2) - Transects
Create
Left Click on map at of start of transect. Keeping mouse button pressed, move mouse to draw transect. Release button to complete. During creation a Transect profile window is created and displayed showing Bathymetry, Flux and ITI along the currently drawn transect.
Hint: Current length & bearing of transect displayed at bottom of map
Move Click as close as possible to the desired transect. Keeping mouse button pressed, move mouse to drag it. Release mouse button to complete.
Delete Click as close as possible to the desired transect. Confirm deletion
Save Saves current transects to a user specified file.
Hint: This file is a simple CSV file and can be edited in Excel or notepad.
Load
Loads transects from a user specified file.
Hint: User can create a file from scratch or edit an existing file to create a transect with specified coordinates. Save a file first to see format.
UNCONTROLLED COPY IF PRINTED Printed: 7 June, 2005
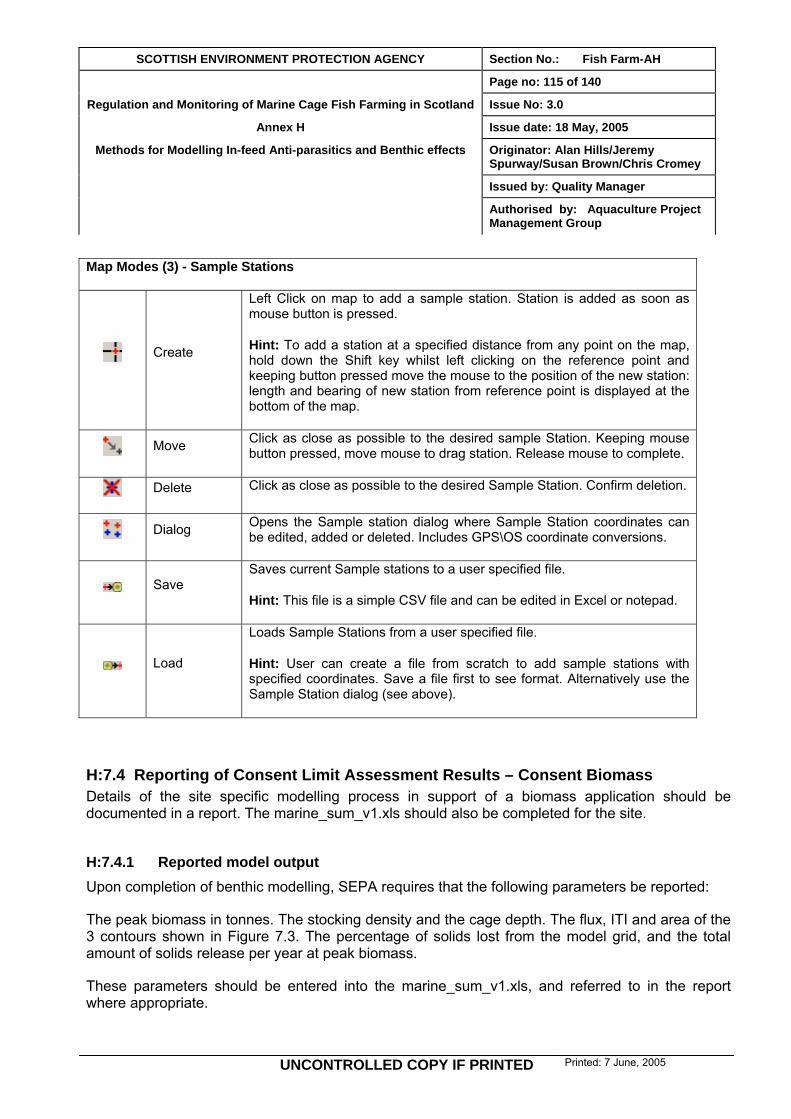
SCOTTISH ENVIRONMENT PROTECTION AGENCY Section No.: Fish Farm-AH Page no: 115 of 140
Regulation and Monitoring of Marine Cage Fish Farming in Scotland Issue No: 3.0 Annex H Issue date: 18 May, 2005
Methods for Modelling In-feed Anti-parasitics and Benthic effects Originator: Alan Hills/Jeremy Spurway/Susan Brown/Chris Cromey
Issued by: Quality Manager Authorised by: Aquaculture Project
Management Group
Map Modes (3) - Sample Stations
Create
Left Click on map to add a sample station. Station is added as soon as mouse button is pressed.
Hint: To add a station at a specified distance from any point on the map, hold down the Shift key whilst left clicking on the reference point and keeping button pressed move the mouse to the position of the new station: length and bearing of new station from reference point is displayed at the bottom of the map.
Move Click as close as possible to the desired sample Station. Keeping mouse button pressed, move mouse to drag station. Release mouse to complete.
Delete Click as close as possible to the desired Sample Station. Confirm deletion.
Dialog Opens the Sample station dialog where Sample Station coordinates can be edited, added or deleted. Includes GPS\OS coordinate conversions.
Save Saves current Sample stations to a user specified file.
Hint: This file is a simple CSV file and can be edited in Excel or notepad.
Load
Loads Sample Stations from a user specified file.
Hint: User can create a file from scratch to add sample stations with specified coordinates. Save a file first to see format. Alternatively use the Sample Station dialog (see above).
H:7.4 Reporting of Consent Limit Assessment Results – Consent Biomass Details of the site specific modelling process in support of a biomass application should be documented in a report. The marine_sum_v1.xls should also be completed for the site.
H:7.4.1 Reported model output Upon completion of benthic modelling, SEPA requires that the following parameters be reported:
The peak biomass in tonnes. The stocking density and the cage depth. The flux, ITI and area of the 3 contours shown in Figure 7.3. The percentage of solids lost from the model grid, and the total amount of solids release per year at peak biomass.
These parameters should be entered into the marine_sum_v1.xls, and referred to in the report where appropriate.
UNCONTROLLED COPY IF PRINTED Printed: 7 June, 2005

SCOTTISH ENVIRONMENT PROTECTION AGENCY Section No.: Fish Farm-AH Page no: 116 of 140
Regulation and Monitoring of Marine Cage Fish Farming in Scotland Issue No: 3.0 Annex H Issue date: 18 May, 2005
Methods for Modelling In-feed Anti-parasitics and Benthic effects Originator: Alan Hills/Jeremy Spurway/Susan Brown/Chris Cromey
Issued by: Quality Manager Authorised by: Aquaculture Project
Management Group
H:7.4.2 Sampling stations The locations of the sampling stations are site specific as shown in Figure 2.2. Thus the NGRs of the 3 sampling stations on the transect, should be reported, together with their depth, distance from cages and the predicted ITI. In addition details of the 3 sampling stations on a ‘spare transect’ are required. The ‘spare transect’ can be used in the field in the event of a physical inability to sample at the original locations due for example to the absence of soft sediments or the presence of reefs.
H:7.4.3 Contour plots A plot of the solids deposition should be included in the report, showing the location of both the sampling transect and the spare transect. The cross-section through both transects should also be included.
H:7.4.4 Report structure Modelling reports submitted to SEPA in support of applications to discharge should conform to the standards of normal scientific reporting, for which there is a generally accepted structure, a summary of which is given in section H:3.9
H:7.4.5 Summary of Required Information for benthic modelling See H:6.5 Submission of Information for Assessment of Modelling Work for a summary.
N.B.(38) Prior to submission of any benthic modelling results for a real site, SEPA requires the submission, by applicants or their consultants, of the above items for a TEST SITE called “BioTest”. This information is required so that SEPA can; assess the methods used, check the model set-up and identify any problems that may hinder assessment of future modelling results. If a test site has already been submitted for infeed treatment modelling then an addendum to the original test site report can be submitted, detailing the additional steps. The information required to model “BioTest” is detailed on the CD and on the below website. Should the user be unable to source actual bathymetric data for the area around “BioTest” an alternative bathymetric data set may be found at:
http://www.sepa.org.uk/aquaculture/modelling/index.htm
Details of how to submit the items for “BioTest” will be issued via e-mail and on the above website.
UNCONTROLLED COPY IF PRINTED Printed: 7 June, 2005
SCOTTISH ENVIRONMENT PROTECTION AGENCY Section No.: Fish Farm-AH Page no: 117 of 140
Regulation and Monitoring of Marine Cage Fish Farming in Scotland Issue No: 3.0 Annex H Issue date: 18 May, 2005
Methods for Modelling In-feed Anti-parasitics and Benthic effects Originator: Alan Hills/Jeremy Spurway/Susan Brown/Chris Cromey
Issued by: Quality Manager Authorised by: Aquaculture Project
Management Group
H:8 REFERENCES
Chen, Y.S., Beveridge, M.C.M., Telfer, T.C. (1999a). Physical Characteristics of commercial pelleted Atlantic salmon feeds and consideration of implications for modelling of waste dispersion through sedimentation. Aquaculture International, 7, 89–100.
Chen, Y.S., Beveridge, M.C.M., Telfer, T.C. (1999b). Settling rate characteristics and nutrient content of the faeces of Atlantic Salmon, Salmo salar and the implications for modelling of waste dispersion. Aquaculture Research, 30, 395–398.
Chen, Y.S., Beveridge, M.C.M., Telfer, T.C., Roy, W.J. (2003). Nutrient leaching and settling rate characteristics of the faeces of Atlantic salmon (Salmo salar L.) and the implications for modelling of solid waste dispersion. J. Appl. Ichthyol. 19, 114–117.
Clarke, S., Elliot, A.J. (1998). Modelling suspended sediment concentrations in the Firth of Forth.
Estuarine Coastal Shelf Science 47: 235–250. Cromey, C.J., Black, K.D., Edwards, A., Jack I.A. (1998). Modelling the deposition and biological
effects of organic carbon from marine sewage discharges. Estuarine Coastal and Shelf Science, 47, 295–308.
Cromey, C.J., Nickell, T.D., Black, K.D., Provost, P.G., Griffiths, C.R. (2002a). Validation of a fish farm waste resuspension model by use of a particulate tracer discharged from a point source in a coastal environment. Estuaries, 25, 916–929.
Cromey, C.J., Nickell, T.D., Black, K.D. (2002b). DEPOMOD – modelling the deposition and biological effects of waste solids from marine cage farms. Aquaculture, 214, 211–239.
Dudley, R.W., Panchang, V.G., Newell, C.R. (2000). Application of a comprehensive modelling strategy for the management of net–pen aquaculture waste transport. Aquaculture 187, 319–349.
Magill, S.H., Thetmeyer, H., Cromey, C.J. (In press). Settling velocity of faecal pellets of gilthead sea bream (Sparus aurata L.) and sea bass (Dicentrarchus labrax L.) and sensitivity analysis using measured data in a deposition model. Aquaculture journal.
Panchang, V., Cheng, G., Newell, C., 1997. Modelling hydrodynamics and aquaculture waste transport in coastal Maine. Estuaries 20, 14–41.
UNCONTROLLED COPY IF PRINTED Printed: 7 June, 2005

SCOTTISH ENVIRONMENT PROTECTION AGENCY Section No.: Fish Farm-AH Page no: 118 of 140
Regulation and Monitoring of Marine Cage Fish Farming in Scotland Issue No: 3.0 Annex H Issue date: 18 May, 2005
Methods for Modelling In-feed Anti-parasitics and Benthic effects Originator: Alan Hills/Jeremy Spurway/Susan Brown/Chris Cromey
Issued by: Quality Manager Authorised by: Aquaculture Project
Management Group
SECRU (2002). Review and synthesis of the environmental impacts of aquaculture. Scottish Executive Central Research Unit, Edinburgh, UK, ISBN 0-7559-3403-2, http://www.scotland.gov.uk
SEPA (2003a). Site and Hydrographic Survey Requirements for Applications for Consent to
Discharge from Marine Cage Salmon Farms. Marine fish farming manual, Attachment VIII. www.sepa.org.uk/aquaculture. Scottish Environment Protection Agency, Stirling, UK, 24 pp.
SEPA (2003b). Methods for Modelling In-feed Anti-parasitics. Marine fish farming manual, Annex H.
www.sepa.org.uk/aquaculture. Scottish Environment Protection Agency, Stirling, UK, 79 pp. Stewart, A.R.J., Grant, J. (2002). Disaggregation rates of extruded salmon feed pellets: influence of
physical and biological variables. Aquaculture Research, 33, 799–810. Tlusty, M.F., Snook, K., Pepper, V.A., Anderson, M.R. (2000). The potential for soluble and
transport loss of particulate aquaculture wastes. Aquaculture Research, 31, 745–755. WRC 1992 (Codling & Ashley) Development of a biotic index for the assessment of pollution status
of marine benthic communities. SNIFFER.
UNCONTROLLED COPY IF PRINTED Printed: 7 June, 2005
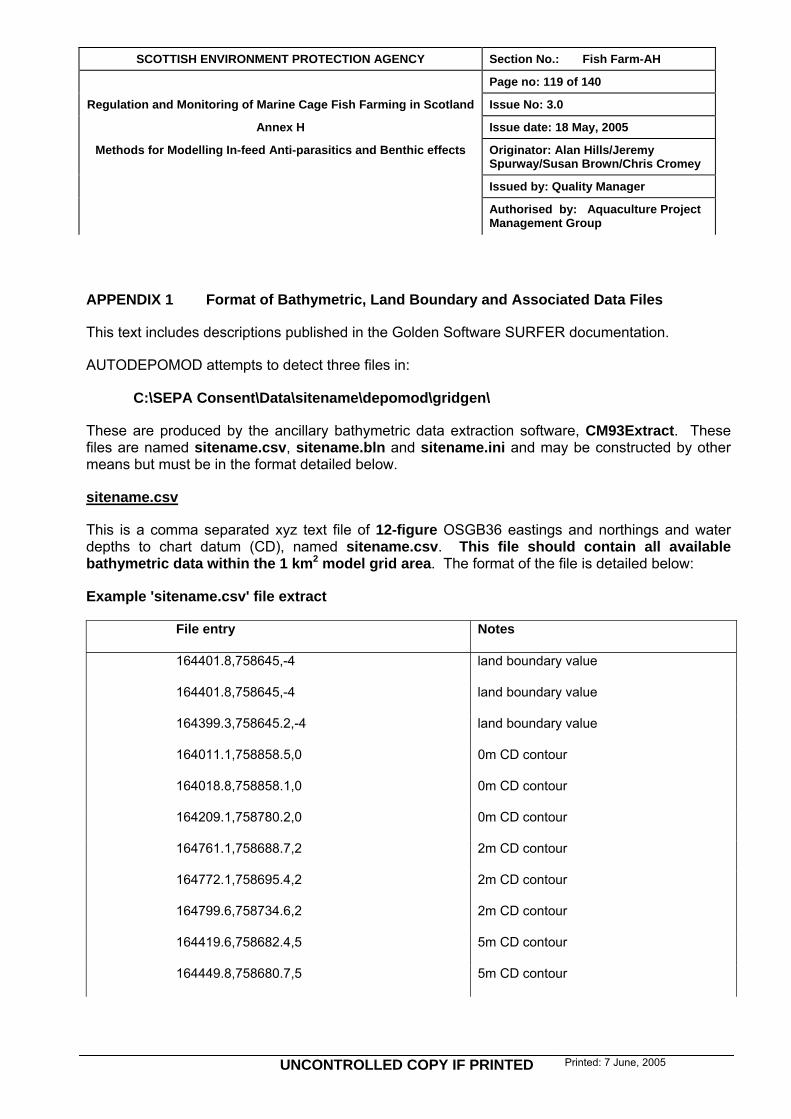
SCOTTISH ENVIRONMENT PROTECTION AGENCY Section No.: Fish Farm-AH Page no: 119 of 140
Regulation and Monitoring of Marine Cage Fish Farming in Scotland Issue No: 3.0 Annex H Issue date: 18 May, 2005
Methods for Modelling In-feed Anti-parasitics and Benthic effects Originator: Alan Hills/Jeremy Spurway/Susan Brown/Chris Cromey
Issued by: Quality Manager Authorised by: Aquaculture Project
Management Group
APPENDIX 1 Format of Bathymetric, Land Boundary and Associated Data Files
This text includes descriptions published in the Golden Software SURFER documentation.
AUTODEPOMOD attempts to detect three files in:
C:\SEPA Consent\Data\sitename\depomod\gridgen\
These are produced by the ancillary bathymetric data extraction software, CM93Extract. These files are named sitename.csv, sitename.bln and sitename.ini and may be constructed by other means but must be in the format detailed below.
sitename.csv
This is a comma separated xyz text file of 12-figure OSGB36 eastings and northings and water depths to chart datum (CD), named sitename.csv. This file should contain all available bathymetric data within the 1 km2 model grid area. The format of the file is detailed below:
Example 'sitename.csv' file extract
File entry Notes
164401.8,758645,-4 land boundary value
164401.8,758645,-4 land boundary value
164399.3,758645.2,-4 land boundary value
164011.1,758858.5,0 0m CD contour
164018.8,758858.1,0 0m CD contour
164209.1,758780.2,0 0m CD contour
164761.1,758688.7,2 2m CD contour
164772.1,758695.4,2 2m CD contour
164799.6,758734.6,2 2m CD contour
164419.6,758682.4,5 5m CD contour
164449.8,758680.7,5 5m CD contour
UNCONTROLLED COPY IF PRINTED Printed: 7 June, 2005
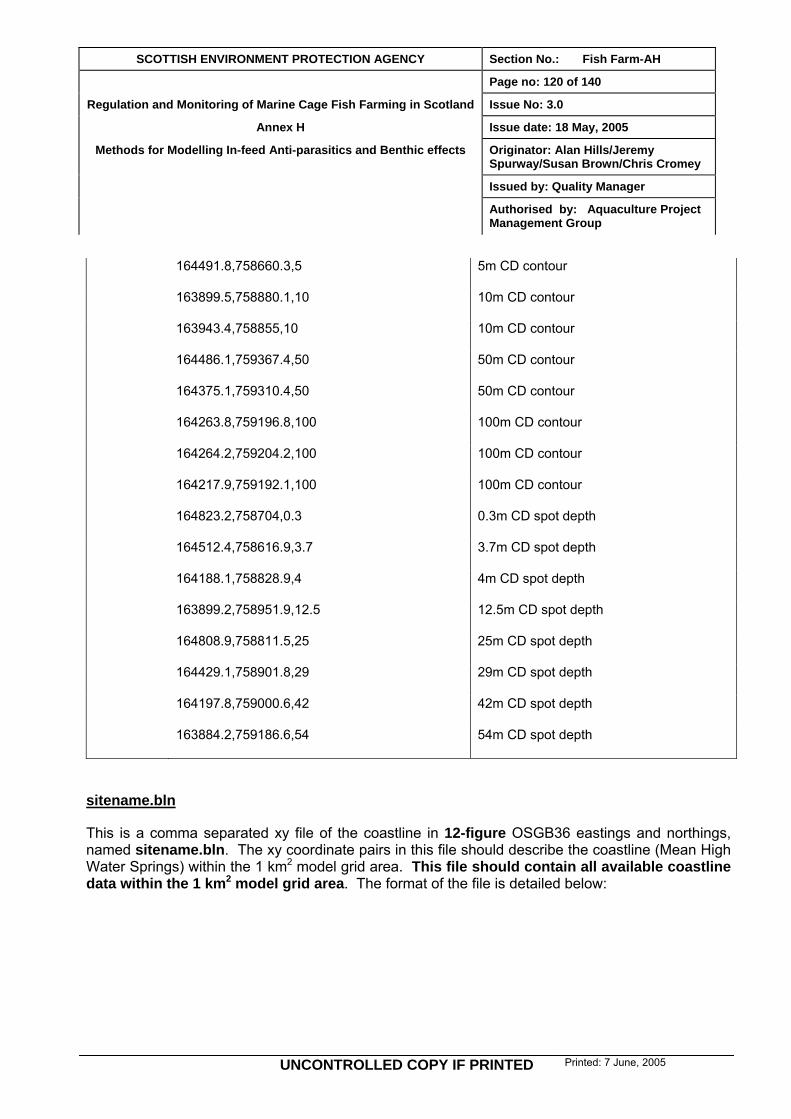
SCOTTISH ENVIRONMENT PROTECTION AGENCY Section No.: Fish Farm-AH Page no: 120 of 140
Regulation and Monitoring of Marine Cage Fish Farming in Scotland Issue No: 3.0 Annex H Issue date: 18 May, 2005
Methods for Modelling In-feed Anti-parasitics and Benthic effects Originator: Alan Hills/Jeremy Spurway/Susan Brown/Chris Cromey
Issued by: Quality Manager Authorised by: Aquaculture Project
Management Group
164491.8,758660.3,5 5m CD contour
163899.5,758880.1,10 10m CD contour
163943.4,758855,10 10m CD contour
164486.1,759367.4,50 50m CD contour
164375.1,759310.4,50 50m CD contour
164263.8,759196.8,100 100m CD contour
164264.2,759204.2,100 100m CD contour
164217.9,759192.1,100 100m CD contour
164823.2,758704,0.3 0.3m CD spot depth
164512.4,758616.9,3.7 3.7m CD spot depth
164188.1,758828.9,4 4m CD spot depth
163899.2,758951.9,12.5 12.5m CD spot depth
164808.9,758811.5,25 25m CD spot depth
164429.1,758901.8,29 29m CD spot depth
164197.8,759000.6,42 42m CD spot depth
163884.2,759186.6,54 54m CD spot depth
sitename.bln
This is a comma separated xy file of the coastline in 12-figure OSGB36 eastings and northings, named sitename.bln. The xy coordinate pairs in this file should describe the coastline (Mean High Water Springs) within the 1 km2 model grid area. This file should contain all available coastline data within the 1 km2 model grid area. The format of the file is detailed below:
UNCONTROLLED COPY IF PRINTED Printed: 7 June, 2005
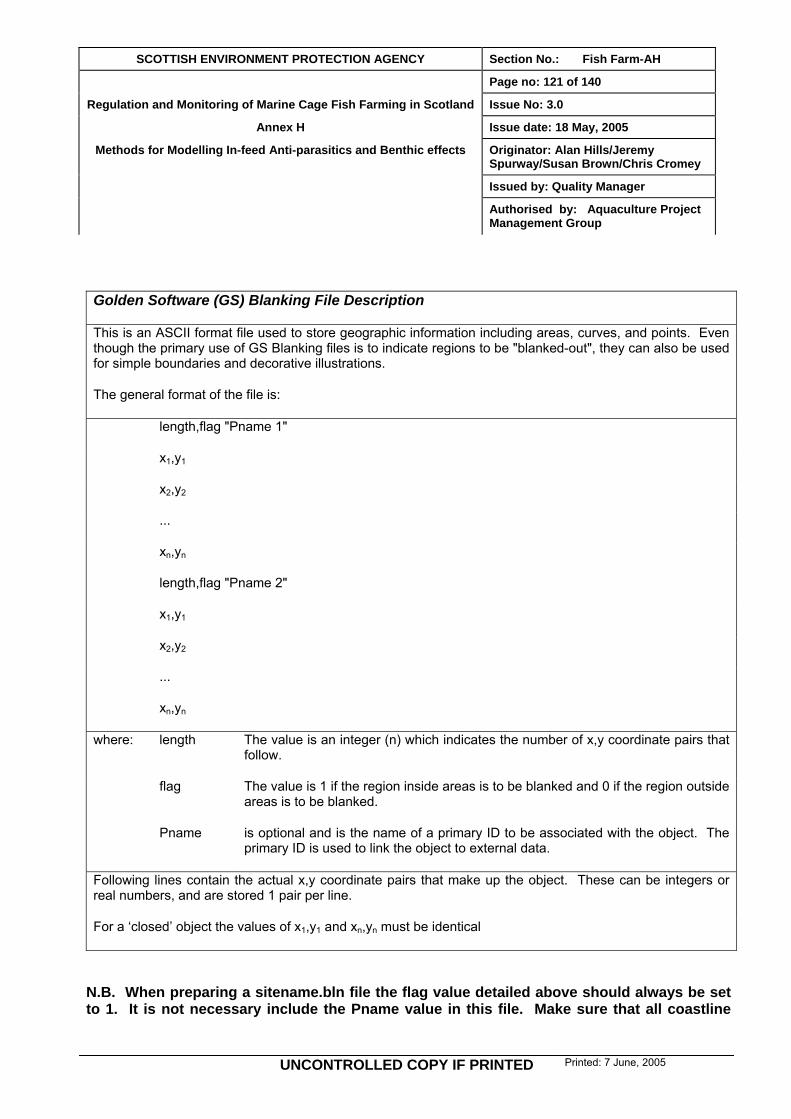
SCOTTISH ENVIRONMENT PROTECTION AGENCY Section No.: Fish Farm-AH Page no: 121 of 140
Regulation and Monitoring of Marine Cage Fish Farming in Scotland Issue No: 3.0 Annex H Issue date: 18 May, 2005
Methods for Modelling In-feed Anti-parasitics and Benthic effects Originator: Alan Hills/Jeremy Spurway/Susan Brown/Chris Cromey
Issued by: Quality Manager Authorised by: Aquaculture Project
Management Group
Golden Software (GS) Blanking File Description
This is an ASCII format file used to store geographic information including areas, curves, and points. Even though the primary use of GS Blanking files is to indicate regions to be "blanked-out", they can also be used for simple boundaries and decorative illustrations.
The general format of the file is:
length,flag "Pname 1"
x1,y1
x2,y2
...
xn,yn
length,flag "Pname 2"
x1,y1
x2,y2
...
xn,yn
where: length The value is an integer (n) which indicates the number of x,y coordinate pairs that follow.
flag The value is 1 if the region inside areas is to be blanked and 0 if the region outside areas is to be blanked.
Pname is optional and is the name of a primary ID to be associated with the object. The primary ID is used to link the object to external data.
Following lines contain the actual x,y coordinate pairs that make up the object. These can be integers or real numbers, and are stored 1 pair per line.
For a ‘closed’ object the values of x1,y1 and xn,yn must be identical
N.B. When preparing a sitename.bln file the flag value detailed above should always be set to 1. It is not necessary include the Pname value in this file. Make sure that all coastline
UNCONTROLLED COPY IF PRINTED Printed: 7 June, 2005
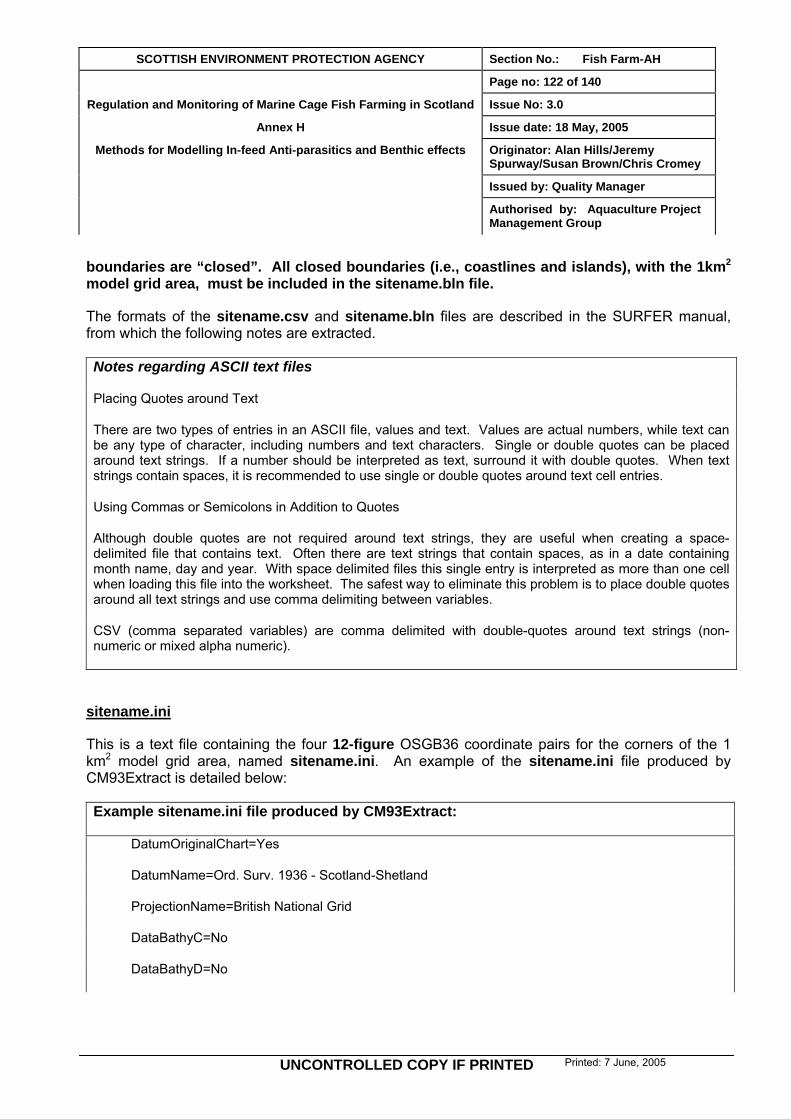
SCOTTISH ENVIRONMENT PROTECTION AGENCY Section No.: Fish Farm-AH Page no: 122 of 140
Regulation and Monitoring of Marine Cage Fish Farming in Scotland Issue No: 3.0 Annex H Issue date: 18 May, 2005
Methods for Modelling In-feed Anti-parasitics and Benthic effects Originator: Alan Hills/Jeremy Spurway/Susan Brown/Chris Cromey
Issued by: Quality Manager Authorised by: Aquaculture Project
Management Group
boundaries are “closed”. All closed boundaries (i.e., coastlines and islands), with the 1km2 model grid area, must be included in the sitename.bln file.
The formats of the sitename.csv and sitename.bln files are described in the SURFER manual, from which the following notes are extracted.
Notes regarding ASCII text files
Placing Quotes around Text
There are two types of entries in an ASCII file, values and text. Values are actual numbers, while text can be any type of character, including numbers and text characters. Single or double quotes can be placed around text strings. If a number should be interpreted as text, surround it with double quotes. When text strings contain spaces, it is recommended to use single or double quotes around text cell entries.
Using Commas or Semicolons in Addition to Quotes
Although double quotes are not required around text strings, they are useful when creating a space-delimited file that contains text. Often there are text strings that contain spaces, as in a date containing month name, day and year. With space delimited files this single entry is interpreted as more than one cell when loading this file into the worksheet. The safest way to eliminate this problem is to place double quotes around all text strings and use comma delimiting between variables.
CSV (comma separated variables) are comma delimited with double-quotes around text strings (non-numeric or mixed alpha numeric).
sitename.ini
This is a text file containing the four 12-figure OSGB36 coordinate pairs for the corners of the 1 km2 model grid area, named sitename.ini. An example of the sitename.ini file produced by CM93Extract is detailed below:
Example sitename.ini file produced by CM93Extract:
DatumOriginalChart=Yes
DatumName=Ord. Surv. 1936 - Scotland-Shetland
ProjectionName=British National Grid
DataBathyC=No
DataBathyD=No
UNCONTROLLED COPY IF PRINTED Printed: 7 June, 2005

SCOTTISH ENVIRONMENT PROTECTION AGENCY Section No.: Fish Farm-AH Page no: 123 of 140
Regulation and Monitoring of Marine Cage Fish Farming in Scotland Issue No: 3.0 Annex H Issue date: 18 May, 2005
Methods for Modelling In-feed Anti-parasitics and Benthic effects Originator: Alan Hills/Jeremy Spurway/Susan Brown/Chris Cromey
Issued by: Quality Manager Authorised by: Aquaculture Project
Management Group
DataBathyE=Yes
DataBathyF=No
DataBathyG=No
DataLandE=Yes
DataUseLand=Yes
DataUseBathy=Yes
DataAreaXMin=175160
DataAreaXMax=176160
DataAreaYMin=857631
DataAreaYMax=858631
DataBathyIncludeCoastline=Yes
DataDepths=Positive
DataLandValue=-4
FileFormat=Surfer 6.0 File
FileBathy=C:\SEPA Consent\DATA\sitename\depomod\gridgen\sitename.csv
FileLand=C:\SEPA Consent\DATA\sitename\depomod\gridgen\sitename.bln
N.B. However, only the following parameters are required for AUTODEPOMOD and this is all that will need to be entered in the sitename.ini file.
UNCONTROLLED COPY IF PRINTED Printed: 7 June, 2005

SCOTTISH ENVIRONMENT PROTECTION AGENCY Section No.: Fish Farm-AH Page no: 124 of 140
Regulation and Monitoring of Marine Cage Fish Farming in Scotland Issue No: 3.0 Annex H Issue date: 18 May, 2005
Methods for Modelling In-feed Anti-parasitics and Benthic effects Originator: Alan Hills/Jeremy Spurway/Susan Brown/Chris Cromey
Issued by: Quality Manager Authorised by: Aquaculture Project
Management Group
DataAreaXMin=x1
DataAreaXMax=x2
DataAreaYMin=y1
DataAreaYMax=y2
where: x1 is the 12-figure OSGB36 value denoting the western boundary of the model domain
x2 is the 12-figure OSGB36 value denoting the eastern boundary of the model domain;
x2= x1+1000
y1 is the 12-figure OSGB36 value denoting the southern boundary of the model domain
y2 is the 12-figure OSGB36 value denoting the northern boundary of the model domain;
y2= y1+1000
UNCONTROLLED COPY IF PRINTED Printed: 7 June, 2005

SCOTTISH ENVIRONMENT PROTECTION AGENCY Section No.: Fish Farm-AH Page no: 125 of 140
Regulation and Monitoring of Marine Cage Fish Farming in Scotland Issue No: 3.0 Annex H Issue date: 18 May, 2005
Methods for Modelling In-feed Anti-parasitics and Benthic effects Originator: Alan Hills/Jeremy Spurway/Susan Brown/Chris Cromey
Issued by: Quality Manager Authorised by: Aquaculture Project
Management Group
APPENDIX 2 The Preparation and Formatting of Current Meter Data for Use with AUTODEPOMOD
A brief description regarding the preparation of hydrographic data is given in section H:3.5. Any data used for consent assessment should meet the requirements set out in Attachment VIII of the SEPA Fish Farming Manual “Site and Hydrographic Survey Requirements”.
Data collected according to these requirements will need to be averaged and formatted for use with AUTODEPOMOD. SEPA has constructed spreadsheet tools for this purpose, named according to the temporal resolution of the input data, e.g. temp-10min-HGv*.xls (where * is the version number of the template) is for use with data collected at ten-minute intervals.
AUTODEPOMOD will look for up to three current meter data files in the location:
C:\SEPA Consent\Data\sitename\depomod\partrack\current-data\
Certain additional information is contained within these files that facilitates production of DEPOMOD’s internal “calibration” files and the automated configuration of the particle-tracking module. The information required is detailed below, it should ideally be obtained prior to use of the templates:
• the depth at the current meter deployment site
• the height of retrieval of each data set above the seabed
• the magnetic variation during the survey - this can be obtained from an up to date Ordnance Survey map of the area
• the mean sea level, above chart datum, for the area around the site - this can be obtained from Admiralty Tide Tables - use the closest point available.
Upon opening the template spreadsheet, the user is presented with the “control” sheet. The template is also comprised of 3 other groups of sheets:
(N.B.: in each case below, * denotes a “wildcard” for the suffix s, m or b. These correspond to the height of current meter data retrieval and denote surface, middle or bottom respectively.)
• “raw data-*”: raw current meter data are entered in these sheets and hourly average values are produced
• “hr-av-*”: hourly averaged current meter data are organised here
UNCONTROLLED COPY IF PRINTED Printed: 7 June, 2005

SCOTTISH ENVIRONMENT PROTECTION AGENCY Section No.: Fish Farm-AH Page no: 126 of 140
Regulation and Monitoring of Marine Cage Fish Farming in Scotland Issue No: 3.0 Annex H Issue date: 18 May, 2005
Methods for Modelling In-feed Anti-parasitics and Benthic effects Originator: Alan Hills/Jeremy Spurway/Susan Brown/Chris Cromey
Issued by: Quality Manager Authorised by: Aquaculture Project
Management Group
• “NSN-SNS-*”: these sheets organise all data into a format that can be read by AUTODEPOMOD, the sheets are saved as text files.
Instructions are provided on completion of the “control” and “raw data-*” sheets. In almost all cases yellow boxes should be filled in.
The “raw data-*” sheets
Data is entered into the “raw data-*” sheets as current speed and direction preceded by a date and time stamp. This is may be expediently pre-processed into columns using Excel. An example of the “raw data-*” sheets may be found in Appendix 2 - Plate 1. Upon population of the yellow data entry area, the reliability of the averaging may be examined numerically and graphically by inspection of the percentile comparison and scatter plots. Note that the data entry area carries a reminder of the correct temporal resolution required for the specific template tool.
Appendix 2 - Plate 1: The “raw data-*” Sheet
UNCONTROLLED COPY IF PRINTED Printed: 7 June, 2005

SCOTTISH ENVIRONMENT PROTECTION AGENCY Section No.: Fish Farm-AH Page no: 127 of 140
Regulation and Monitoring of Marine Cage Fish Farming in Scotland Issue No: 3.0 Annex H Issue date: 18 May, 2005
Methods for Modelling In-feed Anti-parasitics and Benthic effects Originator: Alan Hills/Jeremy Spurway/Susan Brown/Chris Cromey
Issued by: Quality Manager Authorised by: Aquaculture Project
Management Group
The “control” Sheet
An illustration of the “control” sheet is given in Appendix 2 - Plate 2. Fill in all yellow boxes:
• replace XXXX with “sitename” (see N.B.(9) above)
• replace X with the depth at the current meter deployment site
• replace x, y and z with the heights of the surface, middle and bottom data retrievals respectively (N.B.: If only two sets of current meter data are to be used then entry y may be ignored).
• Determine the hourly record number of the intermediate tide (see H:3.5 above) (which lies approximately mid-way between neap and spring tides) by examination of the pressure record and column F of the “hr-av-*” sheet. Replace sss with this value.
• Replace nnn with the hourly record number that corresponds to the intermediate tide mid-way between springs and neaps.
• DEPOMOD is driven by current meter data using units of cms-1 and the template has the facility for converting data input in ms-1 automatically from identification of the speed units of the input data. This is achieved by replacing ? with m/s or cm/s as appropriate.
• Replace mm with the mean sea level relative to chart datum
• Replace x.xW with the magnetic variation during the current meter deployment. (N.B.: The user must keep to the x.xW format. If magnet variation has already been subtracted to correct to Grid North then enter 0.0W)
Appendix 2 - Plate 2: The “control” Sheet
UNCONTROLLED COPY IF PRINTED Printed: 7 June, 2005
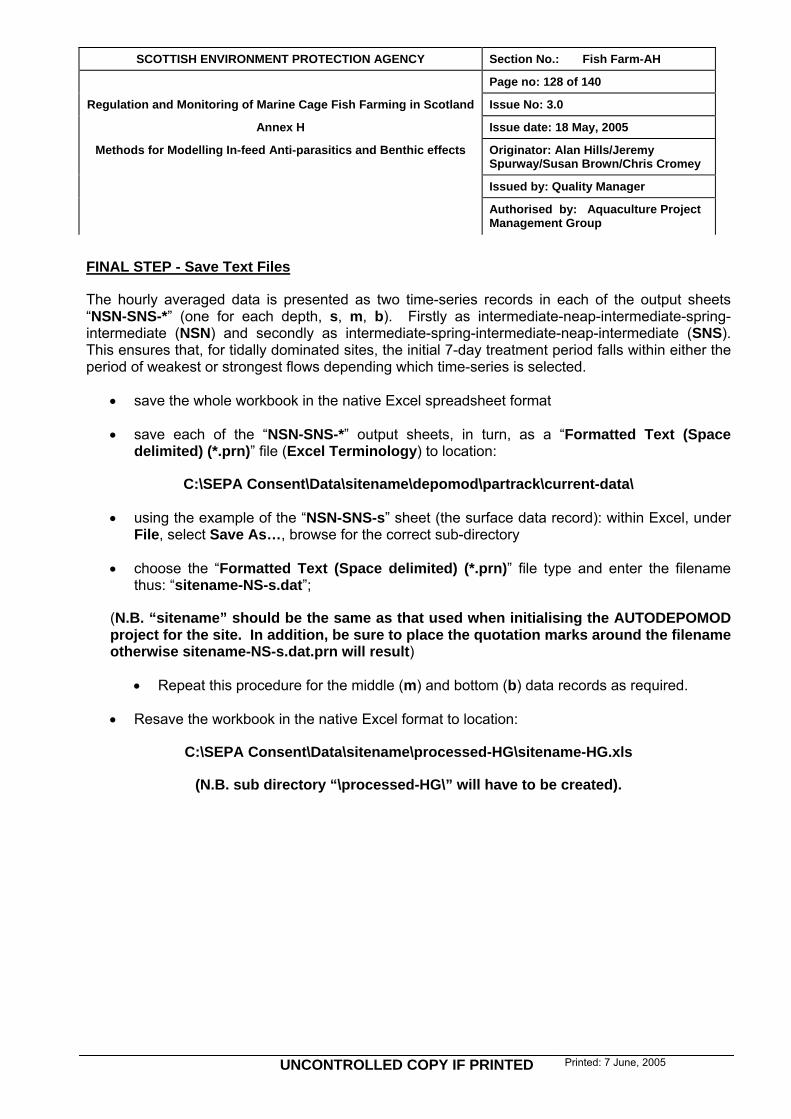
SCOTTISH ENVIRONMENT PROTECTION AGENCY Section No.: Fish Farm-AH Page no: 128 of 140
Regulation and Monitoring of Marine Cage Fish Farming in Scotland Issue No: 3.0 Annex H Issue date: 18 May, 2005
Methods for Modelling In-feed Anti-parasitics and Benthic effects Originator: Alan Hills/Jeremy Spurway/Susan Brown/Chris Cromey
Issued by: Quality Manager Authorised by: Aquaculture Project
Management Group
FINAL STEP - Save Text Files
The hourly averaged data is presented as two time-series records in each of the output sheets “NSN-SNS-*” (one for each depth, s, m, b). Firstly as intermediate-neap-intermediate-spring-intermediate (NSN) and secondly as intermediate-spring-intermediate-neap-intermediate (SNS). This ensures that, for tidally dominated sites, the initial 7-day treatment period falls within either the period of weakest or strongest flows depending which time-series is selected.
• save the whole workbook in the native Excel spreadsheet format
• save each of the “NSN-SNS-*” output sheets, in turn, as a “Formatted Text (Space delimited) (*.prn)” file (Excel Terminology) to location:
C:\SEPA Consent\Data\sitename\depomod\partrack\current-data\
• using the example of the “NSN-SNS-s” sheet (the surface data record): within Excel, under File, select Save As…, browse for the correct sub-directory
• choose the “Formatted Text (Space delimited) (*.prn)” file type and enter the filename thus: “sitename-NS-s.dat”;
(N.B. “sitename” should be the same as that used when initialising the AUTODEPOMOD project for the site. In addition, be sure to place the quotation marks around the filename otherwise sitename-NS-s.dat.prn will result)
• Repeat this procedure for the middle (m) and bottom (b) data records as required.
• Resave the workbook in the native Excel format to location:
C:\SEPA Consent\Data\sitename\processed-HG\sitename-HG.xls
(N.B. sub directory “\processed-HG\” will have to be created).
UNCONTROLLED COPY IF PRINTED Printed: 7 June, 2005

SCOTTISH ENVIRONMENT PROTECTION AGENCY Section No.: Fish Farm-AH Page no: 129 of 140
Regulation and Monitoring of Marine Cage Fish Farming in Scotland Issue No: 3.0 Annex H Issue date: 18 May, 2005
Methods for Modelling In-feed Anti-parasitics and Benthic effects Originator: Alan Hills/Jeremy Spurway/Susan Brown/Chris Cromey
Issued by: Quality Manager Authorised by: Aquaculture Project
Management Group
APPENDIX 3 INPUT DATA FOR TEST SITE - “sitename”
Group Orientation: 335o Magnetic
along longest axis of group
Current Meter Position:NGR NM 74870 95410
Approx. 25m
Cage Position: NGR NM 74890 95390
1m
27m
2m
AnyCompany (“sitename plan”) Proposed Cage Configuration, “sitename”, June 2002 10 x 27m square steel cages
Appendix 3 - Plate 1: SITE PLAN FOR “sitename” TEST SITE
UNCONTROLLED COPY IF PRINTED Printed: 7 June, 2005

SCOTTISH ENVIRONMENT PROTECTION AGENCY Section No.: Fish Farm-AH Page no: 130 of 140
Regulation and Monitoring of Marine Cage Fish Farming in Scotland Issue No: 3.0 Annex H Issue date: 18 May, 2005
Methods for Modelling In-feed Anti-parasitics and Benthic effects Originator: Alan Hills/Jeremy Spurway/Susan Brown/Chris Cromey
Issued by: Quality Manager Authorised by: Aquaculture Project
Management Group
Site Data Input Data
Consent #: LB Distance to shore (km): 0.2
Sitename: Sitename Water depth at site (m): 35
Site NGR: NM 74890 95390 # of cages: 10
Receiving water: AnyCoast Round/Square: Square
Company: AnyCompany Diameter/Circumference/Width (m):
27
Deadline for Representations:
LB Working Depth (m): 14
Bi-annual production (tonnes):
914 Treatment shallowing depth (range?) (m):
4m or
Vol = 3136m3
Peak biomass (tonnes): 1200
Medicines applied for: Azamethiphos, Cypermethrin, Teflubenzuron, Emamectin
Current meter NGR: NM 74870 95410
Annual load (tonnes): 1645
N.B. In this table # = number and LB = Leave Blank
Appendix 3 - Table 1: FF-in-sitename.xls - Input Information
UNCONTROLLED COPY IF PRINTED Printed: 7 June, 2005

SCOTTISH ENVIRONMENT PROTECTION AGENCY Section No.: Fish Farm-AH Page no: 131 of 140
Regulation and Monitoring of Marine Cage Fish Farming in Scotland Issue No: 3.0 Annex H Issue date: 18 May, 2005
Methods for Modelling In-feed Anti-parasitics and Benthic effects Originator: Alan Hills/Jeremy Spurway/Susan Brown/Chris Cromey
Issued by: Quality Manager Authorised by: Aquaculture Project
Management Group
Cage RCM
location of group: NM 74890 95390 position of mooring: NM 74870 95410
number of cages in group: 10 depth at mooring(m): 29
Round or Square cages?: Square height of surface meter relative to seabed (m):
26
cage dimensions (m): 27 X 27 height of middle meter relative to seabed (m):
15
cage depth (m): 14 height of bottom meter relative to seabed (m):
3
cage group configuration: 5 X 2
orientation (oMagnetic): 335
peak biomass (tonnes): 1200
Appendix 3 - Table 2: Cage and Current Meter Information
Magnetic Correction to Grid North at Site: 4o 30’ W of Grid North June 1999 (Annual Change 7’ E) - From OS Map
Mean Tidal Level at Site (m): 2.9 - From Admiralty Tide Tables
Date of Neap Tides: 26/03/1999
Date of Spring Tides: 02/04/1999
Appendix 3 - Table 3: Additional Site Information
UNCONTROLLED COPY IF PRINTED Printed: 7 June, 2005

SCOTTISH ENVIRONMENT PROTECTION AGENCY Section No.: Fish Farm-AH Page no: 132 of 140
Regulation and Monitoring of Marine Cage Fish Farming in Scotland Issue No: 3.0 Annex H Issue date: 18 May, 2005
Methods for Modelling In-feed Anti-parasitics and Benthic effects Originator: Alan Hills/Jeremy Spurway/Susan Brown/Chris Cromey
Issued by: Quality Manager Authorised by: Aquaculture Project
Management Group
APPENDIX 4 MAXIMUM BIOMASS MODELLING - APPLICATION OF EQS WITHIN THE MODELLING METHODOLOGY
Several features of the deposition footprint are analysed in the method and it is important to note these analyses are “post–resuspension” predictions (Cromey et al, 2002). As the DEPOMOD benthic effects model was validated with the resuspension model switched on, it is necessary to include resuspension predictions in this method. The effect of resuspension is site–specific and will depend on near–bed current speed in relation to the critical threshold parameters.
Figure 8area), thpercent%, C =
The abofails. Ifresult atoleranc
MEQS – t
IEQS – th
IEQS(tol) –IEQS(tol) a
Figurthe pre
The following fundamental analyses are undertaken for the footprint for each test biomass (Btest):
C – this is a solids flux contour (g m-2 yr-1)
M – percentage mass of solids contained within the contour C
.1 shows a predicted footprint and two contours. Enclosed in the inner contour (the shaded ere is a certain mass of waste faecal and feed material. This mass of material in terms of a
age of the total mass in the footprint is the quantity M. Therefore in Figure 8.1, for M = 99 10 g m-2 yr-1 and I = 58 ITI. Similarly, for M = 70 %, C = 405 g m-2 yr-1 and I = 22 ITI.
ve calculations are used along with EQS criteria to determine whether a site passes or the model was designed to iterate to the EQS criteria exactly, excess model runs would s the model iterated to a solution to several decimal places. To prevent this, some e is required on the EQS criteria.
his is the EQS percentage of solids contained within the contour C
is is the EQS ITI value for the flux at contour C
this is a percentage of IEQS and is usually 1%. i.e. a PASS occurs when the criteria IEQS ± re reached
e 8.1. A deposition footprint showing a) solids flux at the sea bed (g m-2 yr-1) and b) dicted ITI for 10 and 405 g m-2 yr-1 is 58 and 22 respectively. The 405 g m-2 yr-1 contour
UNCONTROLLED COPY IF PRINTED Printed: 7 June, 2005

SCOTTISH ENVIRONMENT PROTECTION AGENCY Section No.: Fish Farm-AH Page no: 133 of 140
Regulation and Monitoring of Marine Cage Fish Farming in Scotland Issue No: 3.0 Annex H Issue date: 18 May, 2005
Methods for Modelling In-feed Anti-parasitics and Benthic effects Originator: Alan Hills/Jeremy Spurway/Susan Brown/Chris Cromey
Issued by: Quality Manager Authorised by: Aquaculture Project
Management Group
encloses 70 % of the footprint mass (C = 405 g m-2 yr-1, M = 70 %, I = 22)
0 100
Scale (m)
10 g m yr contour encloses 99 % of footprint mass
405 g m yr contour encloses 70 % of footprint mass inshaded area
-2 -1
-2 -1
0 100
Scale (m)
At this contour, there is a predicted ITI of 58
At this contour, there is a predicted ITI of 22
a) predicted solids flux b) predicted benthic impact (ITI)
Note rerunning the site for a different biomass will result in the same shape AZE. The areas containing 99 and 70% of the mass will be the same size, but the contours enclosing the areas would have changed. This is because footprint shape is determined by dispersion and is independent of discharged mass.
General description of the steps in compliance assessment In this section, a general description is given of how a site is assessed and a series of schematic diagrams are given showing how compliance is achieved. EQS criteria are 80 % (MEQS) for solids and 10 ITI (ITIEQS).
Example Model set up
AUTODEPOMOD (V2) is set up with depth, hydrography, cage layouts and any other site-specific information described in the main text. All other data are default as previously described. From the maximum number of cages entered, stocking density and CVA, the maximum biomass and feed input for the site is calculated. The general process is an iterative one, the model will test different biomass until the predicted flux and benthic impact meet the EQS criteria. This may take over 30 iterations of the model, but this is automated within AUTODEPOMOD (V2).
UNCONTROLLED COPY IF PRINTED Printed: 7 June, 2005

SCOTTISH ENVIRONMENT PROTECTION AGENCY Section No.: Fish Farm-AH Page no: 134 of 140
Regulation and Monitoring of Marine Cage Fish Farming in Scotland Issue No: 3.0 Annex H Issue date: 18 May, 2005
Methods for Modelling In-feed Anti-parasitics and Benthic effects Originator: Alan Hills/Jeremy Spurway/Susan Brown/Chris Cromey
Issued by: Quality Manager Authorised by: Aquaculture Project
Management Group
The model is run at the maximum biomass and solids flux and benthic impact (ITI) predictions are obtained for the grid area. A series of calculations then follow with respect to the deposition footprint. Using the EQS criteria of MEQS, the contour C is identified which encloses this amount of mass. Using the solids flux prediction at contour C, the value of ITI is calculated (denoted I) as described in Figure 8.1.
An EQS test is now undertaken using I, where the higher the value of I the less impacted the benthic fauna.
Bio
Forton
EQS test:
If I > IEQS then the predicted impact at contour C is less than the EQS, so the test is defined as a PASS (LOW) and biomass is increased in the next iteration
If I < IEQS then the predicted impact at contour C is greater than the EQS will allow, so the test is defined as a FAIL (HIGH) and biomass is decreased in the next iteration
mass = 706 tonnes
the following example, the model would be set up and run for a maximum biomass of 706 nes (
UNCONTROLLED COPY IF PRINTED Printed: 7 June, 2005

SCOTTISH ENVIRONMENT PROTECTION AGENCY Section No.: Fish Farm-AH Page no: 135 of 140
Regulation and Monitoring of Marine Cage Fish Farming in Scotland Issue No: 3.0 Annex H Issue date: 18 May, 2005
Methods for Modelling In-feed Anti-parasitics and Benthic effects Originator: Alan Hills/Jeremy Spurway/Susan Brown/Chris Cromey
Issued by: Quality Manager Authorised by: Aquaculture Project
Management Group
Figure 8.2 A site tested at 706 tonnes which has a predicted impact higher than the EQS criteria. As a result, this test will be defined as FAIL (HIGH) and in the next iteration biomass
will be decreased. The shaded area contains the mass, MEQS (Figure 8.1)
). For this biomass, I < IEQS indicating that at this biomass the IEQS criteria will be exceeded as the lower the value of I, the higher the impact. This will result in a FAIL (HIGH). The biomass used in the next test is calculated using a binary search so it will be half of 706 tonnes as this is an initial run (i.e. 353 tonnes). In subsequent runs, the biomass to test would be halfway between the biomass tested in the previous last two runs.
UNCONTROLLED COPY IF PRINTED Printed: 7 June, 2005
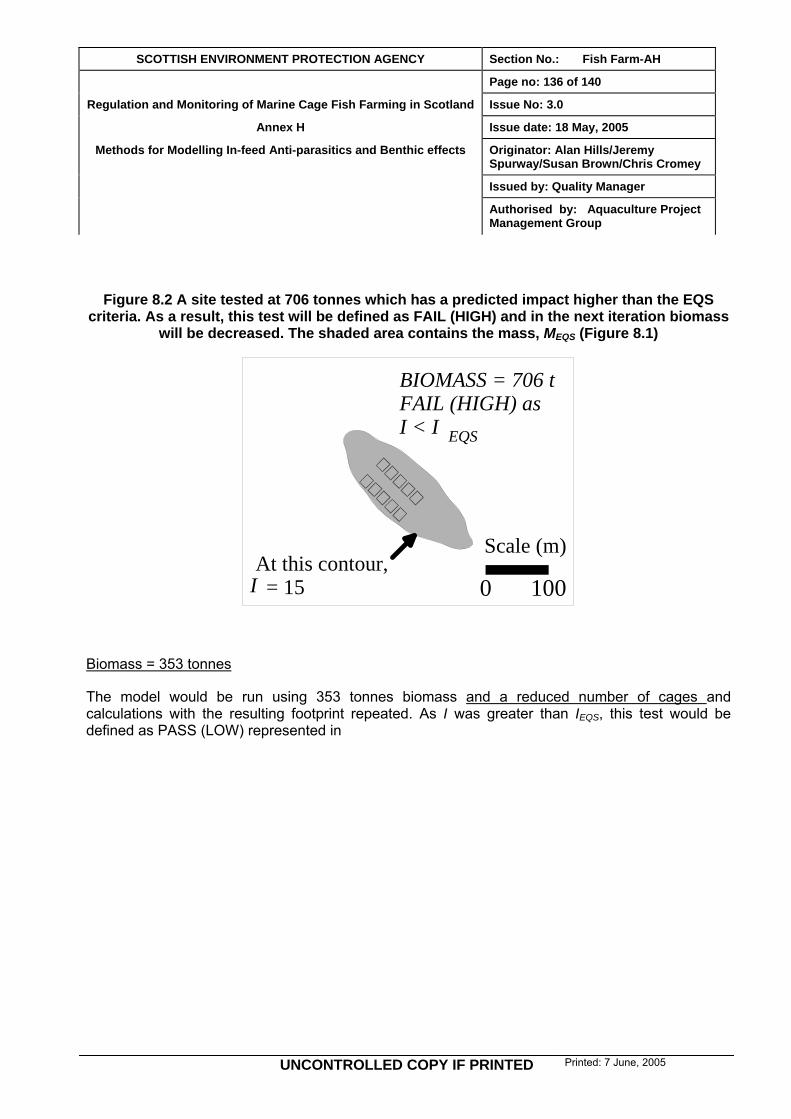
SCOTTISH ENVIRONMENT PROTECTION AGENCY Section No.: Fish Farm-AH Page no: 136 of 140
Regulation and Monitoring of Marine Cage Fish Farming in Scotland Issue No: 3.0 Annex H Issue date: 18 May, 2005
Methods for Modelling In-feed Anti-parasitics and Benthic effects Originator: Alan Hills/Jeremy Spurway/Susan Brown/Chris Cromey
Issued by: Quality Manager Authorised by: Aquaculture Project
Management Group
Figure 8.2 A site tested at 706 tonnes which has a predicted impact higher than the EQS criteria. As a result, this test will be defined as FAIL (HIGH) and in the next iteration biomass
will be decreased. The shaded area contains the mass, MEQS (Figure 8.1)
0 10
Scale (m)
BIOMASS = 706 tFAIL (HIGH) as I < I
At this contour, = 15 0
EQS
I
Biomass = 353 tonnes
The model would be run using 353 tonnes biomass and a reduced number of cages and calculations with the resulting footprint repeated. As I was greater than IEQS, this test would be defined as PASS (LOW) represented in
UNCONTROLLED COPY IF PRINTED Printed: 7 June, 2005

SCOTTISH ENVIRONMENT PROTECTION AGENCY Section No.: Fish Farm-AH Page no: 137 of 140
Regulation and Monitoring of Marine Cage Fish Farming in Scotland Issue No: 3.0 Annex H Issue date: 18 May, 2005
Methods for Modelling In-feed Anti-parasitics and Benthic effects Originator: Alan Hills/Jeremy Spurway/Susan Brown/Chris Cromey
Issued by: Quality Manager Authorised by: Aquaculture Project
Management Group
Figure 8.3 The site retested at 353 tonnes has a predicted impact lower than the EQS criteria. As a result, this test will be defined as PASS (LOW) and in the next iteration
biomass will be increased
. In the next iteration, the biomass will be increased to 529.5 tonnes and retested.
UNCONTROLLED COPY IF PRINTED Printed: 7 June, 2005

SCOTTISH ENVIRONMENT PROTECTION AGENCY Section No.: Fish Farm-AH Page no: 138 of 140
Regulation and Monitoring of Marine Cage Fish Farming in Scotland Issue No: 3.0 Annex H Issue date: 18 May, 2005
Methods for Modelling In-feed Anti-parasitics and Benthic effects Originator: Alan Hills/Jeremy Spurway/Susan Brown/Chris Cromey
Issued by: Quality Manager Authorised by: Aquaculture Project
Management Group
Figure 8.3 The site retested at 353 tonnes has a predicted impact lower than the EQS criteria. As a result, this test will be defined as PASS (LOW) and in the next iteration
biomass will be increased
0 10
Scale (m)
BIOMASS = 353 tPASS (LOW) as I > I
At this contour, = 55 0
EQS
I
Biomass = 680 tonnes (compliance biomass)
The model will iterate through several runs using different cage numbers and biomass until a solution (PASS) occurs where I = IEQS ± IEQS(tol). Biomass is iterated to the biomass convergence value (i.e. default of 5 tonnes). The model will then be rerun using a higher number of particles so that increased accuracy is achieved, previously described. This change in particle numbers will give a slightly different footprint shape and therefore the EQS test needs to be repeated. After several more runs and small changes in biomass, another PASS will be achieved. The model will then be rerun using a different sequence of tidal data and a PASS achieved at 680 tonnes (
UNCONTROLLED COPY IF PRINTED Printed: 7 June, 2005

SCOTTISH ENVIRONMENT PROTECTION AGENCY Section No.: Fish Farm-AH Page no: 139 of 140
Regulation and Monitoring of Marine Cage Fish Farming in Scotland Issue No: 3.0 Annex H Issue date: 18 May, 2005
Methods for Modelling In-feed Anti-parasitics and Benthic effects Originator: Alan Hills/Jeremy Spurway/Susan Brown/Chris Cromey
Issued by: Quality Manager Authorised by: Aquaculture Project
Management Group
Figure 8.4 Compliance is achieved at 680 tonnes as the predicted impact is the same as the EQS criteria. Sampling stations are shown as dots
). This process of refining the model predictions using increasing particle numbers and a different sequence of current data is undertaken automatically in AUTODEPOMOD (V2). For another site, it could have resulted in a reduction in the PASS biomass. However, in most cases the change between PASS before and after refining is usually less than 50 tonnes (5 %).
UNCONTROLLED COPY IF PRINTED Printed: 7 June, 2005

SCOTTISH ENVIRONMENT PROTECTION AGENCY Section No.: Fish Farm-AH Page no: 140 of 140
Regulation and Monitoring of Marine Cage Fish Farming in Scotland Issue No: 3.0 Annex H Issue date: 18 May, 2005
Methods for Modelling In-feed Anti-parasitics and Benthic effects Originator: Alan Hills/Jeremy Spurway/Susan Brown/Chris Cromey
Issued by: Quality Manager Authorised by: Aquaculture Project
Management Group
Figure 8.4 Compliance is achieved at 680 tonnes as the predicted impact is the same as the EQS criteria. Sampling stations are shown as dots
0 100
Scale (m)
BIOMASS = 680 tPASS as I = I EQS
At this contour, =I I EQS
UNCONTROLLED COPY IF PRINTED Printed: 7 June, 2005