Embed Size (px)
Citation preview
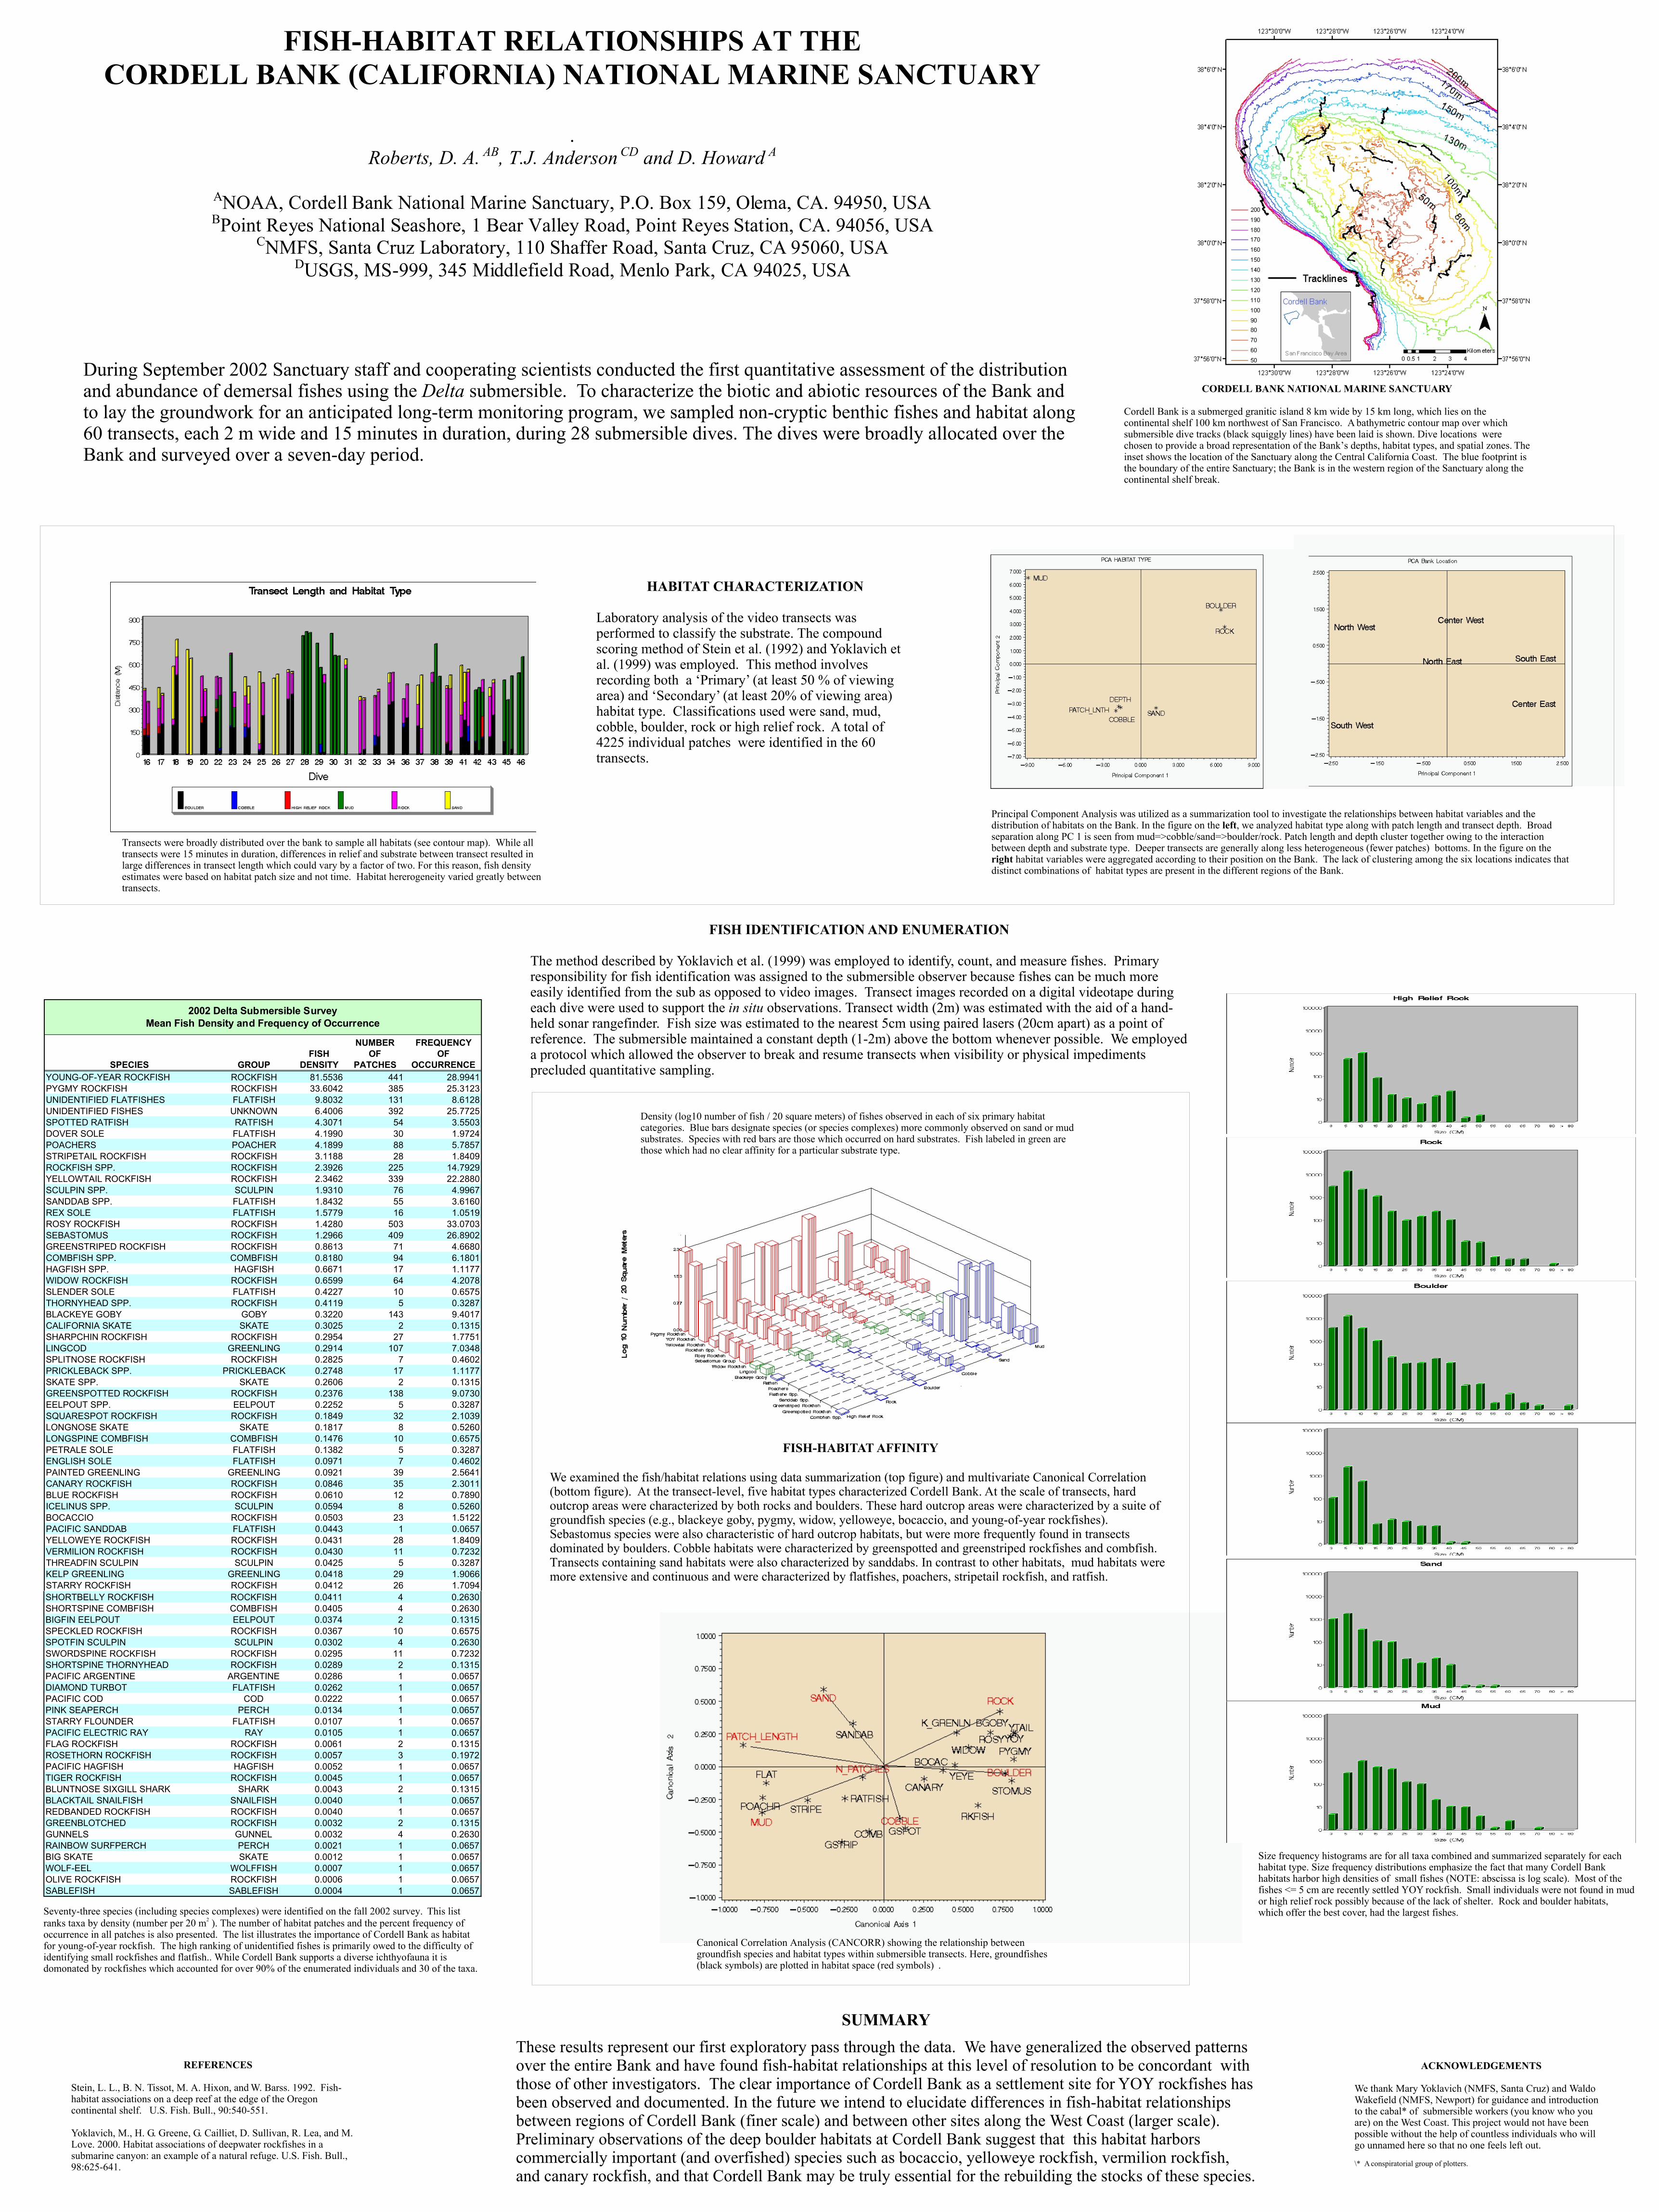
Canonical Correlation Analysis (CANCORR) showing the relationship between groundfish species and habitat types within submersible transects. Here, groundfishes (black symbols) are plotted in habitat space (red symbols) .
FISH-HABITAT RELATIONSHIPS AT THE CORDELL BANK (CALIFORNIA) NATIONAL MARINE SANCTUARY
.
Roberts, D. A. AB, T.J. Anderson CD and D. Howard A
ANOAA, Cordell Bank National Marine Sanctuary, P.O. Box 159, Olema, CA. 94950, USA BPoint Reyes National Seashore, 1 Bear Valley Road, Point Reyes Station, CA. 94056, USA
CNMFS, Santa Cruz Laboratory, 110 Shaffer Road, Santa Cruz, CA 95060, USA DUSGS, MS-999, 345 Middlefield Road, Menlo Park, CA 94025, USA
During September 2002 Sanctuary staff and cooperating scientists conducted the first quantitative assessment of the distribution and abundance of demersal fishes using the Delta submersible. To characterize the biotic and abiotic resources of the Bank and to lay the groundwork for an anticipated long-term monitoring program, we sampled non-cryptic benthic fishes and habitat along 60 transects, each 2 m wide and 15 minutes in duration, during 28 submersible dives. The dives were broadly allocated over the Bank and surveyed over a seven-day period.
HABITAT CHARACTERIZATION
Laboratory analysis of the video transects was performed to classify the substrate. The compound scoring method of Stein et al. (1992) and Yoklavich et al. (1999) was employed. This method involves recording both a ‘Primary’ (at least 50 % of viewing area) and ‘Secondary’ (at least 20% of viewing area) habitat type. Classifications used were sand, mud, cobble, boulder, rock or high relief rock. A total of 4225 individual patches were identified in the 60 transects.
FISH IDENTIFICATION AND ENUMERATION
The method described by Yoklavich et al. (1999) was employed to identify, count, and measure fishes. Primary responsibility for fish identification was assigned to the submersible observer because fishes can be much more easily identified from the sub as opposed to video images. Transect images recorded on a digital videotape during each dive were used to support the in situ observations. Transect width (2m) was estimated with the aid of a hand-held sonar rangefinder. Fish size was estimated to the nearest 5cm using paired lasers (20cm apart) as a point of reference. The submersible maintained a constant depth (1-2m) above the bottom whenever possible. We employed a protocol which allowed the observer to break and resume transects when visibility or physical impediments precluded quantitative sampling.SPECIES GROUP
FISHDENSITY
NUMBEROF
PATCHES
FREQUENCYOF
OCCURRENCE
YOUNG-OF-YEAR ROCKFISH ROCKFISH 81.5536 441 28.9941
PYGMY ROCKFISH ROCKFISH 33.6042 385 25.3123
UNIDENTIFIED FLATFISHES FLATFISH 9.8032 131 8.6128
UNIDENTIFIED FISHES UNKNOWN 6.4006 392 25.7725
SPOTTED RATFISH RATFISH 4.3071 54 3.5503
DOVER SOLE FLATFISH 4.1990 30 1.9724
POACHERS POACHER 4.1899 88 5.7857
STRIPETAIL ROCKFISH ROCKFISH 3.1188 28 1.8409
ROCKFISH SPP. ROCKFISH 2.3926 225 14.7929
YELLOWTAIL ROCKFISH ROCKFISH 2.3462 339 22.2880
SCULPIN SPP. SCULPIN 1.9310 76 4.9967
SANDDAB SPP. FLATFISH 1.8432 55 3.6160
REX SOLE FLATFISH 1.5779 16 1.0519
ROSY ROCKFISH ROCKFISH 1.4280 503 33.0703
SEBASTOMUS ROCKFISH 1.2966 409 26.8902
GREENSTRIPED ROCKFISH ROCKFISH 0.8613 71 4.6680
COMBFISH SPP. COMBFISH 0.8180 94 6.1801
HAGFISH SPP. HAGFISH 0.6671 17 1.1177
WIDOW ROCKFISH ROCKFISH 0.6599 64 4.2078
SLENDER SOLE FLATFISH 0.4227 10 0.6575
THORNYHEAD SPP. ROCKFISH 0.4119 5 0.3287
BLACKEYE GOBY GOBY 0.3220 143 9.4017
CALIFORNIA SKATE SKATE 0.3025 2 0.1315
SHARPCHIN ROCKFISH ROCKFISH 0.2954 27 1.7751
LINGCOD GREENLING 0.2914 107 7.0348
SPLITNOSE ROCKFISH ROCKFISH 0.2825 7 0.4602
PRICKLEBACK SPP. PRICKLEBACK 0.2748 17 1.1177
SKATE SPP. SKATE 0.2606 2 0.1315
GREENSPOTTED ROCKFISH ROCKFISH 0.2376 138 9.0730
EELPOUT SPP. EELPOUT 0.2252 5 0.3287
SQUARESPOT ROCKFISH ROCKFISH 0.1849 32 2.1039
LONGNOSE SKATE SKATE 0.1817 8 0.5260
LONGSPINE COMBFISH COMBFISH 0.1476 10 0.6575
PETRALE SOLE FLATFISH 0.1382 5 0.3287
ENGLISH SOLE FLATFISH 0.0971 7 0.4602
PAINTED GREENLING GREENLING 0.0921 39 2.5641
CANARY ROCKFISH ROCKFISH 0.0846 35 2.3011
BLUE ROCKFISH ROCKFISH 0.0610 12 0.7890
ICELINUS SPP. SCULPIN 0.0594 8 0.5260
BOCACCIO ROCKFISH 0.0503 23 1.5122
PACIFIC SANDDAB FLATFISH 0.0443 1 0.0657
YELLOWEYE ROCKFISH ROCKFISH 0.0431 28 1.8409
VERMILION ROCKFISH ROCKFISH 0.0430 11 0.7232
THREADFIN SCULPIN SCULPIN 0.0425 5 0.3287
KELP GREENLING GREENLING 0.0418 29 1.9066
STARRY ROCKFISH ROCKFISH 0.0412 26 1.7094
2002 Delta Submersible SurveyMean Fish Density and Frequency of Occurrence
SHORTBELLY ROCKFISH ROCKFISH 0.0411 4 0.2630
SHORTSPINE COMBFISH COMBFISH 0.0405 4 0.2630
BIGFIN EELPOUT EELPOUT 0.0374 2 0.1315
SPECKLED ROCKFISH ROCKFISH 0.0367 10 0.6575
SPOTFIN SCULPIN SCULPIN 0.0302 4 0.2630
SWORDSPINE ROCKFISH ROCKFISH 0.0295 11 0.7232
SHORTSPINE THORNYHEAD ROCKFISH 0.0289 2 0.1315
PACIFIC ARGENTINE ARGENTINE 0.0286 1 0.0657
DIAMOND TURBOT FLATFISH 0.0262 1 0.0657
PACIFIC COD COD 0.0222 1 0.0657
PINK SEAPERCH PERCH 0.0134 1 0.0657
STARRY FLOUNDER FLATFISH 0.0107 1 0.0657
PACIFIC ELECTRIC RAY RAY 0.0105 1 0.0657
FLAG ROCKFISH ROCKFISH 0.0061 2 0.1315
ROSETHORN ROCKFISH ROCKFISH 0.0057 3 0.1972
PACIFIC HAGFISH HAGFISH 0.0052 1 0.0657
TIGER ROCKFISH ROCKFISH 0.0045 1 0.0657
BLUNTNOSE SIXGILL SHARK SHARK 0.0043 2 0.1315
BLACKTAIL SNAILFISH SNAILFISH 0.0040 1 0.0657
REDBANDED ROCKFISH ROCKFISH 0.0040 1 0.0657
GREENBLOTCHED ROCKFISH 0.0032 2 0.1315
GUNNELS GUNNEL 0.0032 4 0.2630
RAINBOW SURFPERCH PERCH 0.0021 1 0.0657
BIG SKATE SKATE 0.0012 1 0.0657
WOLF-EEL WOLFFISH 0.0007 1 0.0657
OLIVE ROCKFISH ROCKFISH 0.0006 1 0.0657
SABLEFISH SABLEFISH 0.0004 1 0.0657
Seventy-three species (including species complexes) were identified on the fall 2002 survey. This list 2ranks taxa by density (number per 20 m ). The number of habitat patches and the percent frequency of
occurrence in all patches is also presented. The list illustrates the importance of Cordell Bank as habitat for young-of-year rockfish. The high ranking of unidentified fishes is primarily owed to the difficulty of identifying small rockfishes and flatfish.. While Cordell Bank supports a diverse ichthyofauna it is domonated by rockfishes which accounted for over 90% of the enumerated individuals and 30 of the taxa.
Principal Component Analysis was utilized as a summarization tool to investigate the relationships between habitat variables and the distribution of habitats on the Bank. In the figure on the left, we analyzed habitat type along with patch length and transect depth. Broad separation along PC 1 is seen from mud=>cobble/sand=>boulder/rock. Patch length and depth cluster together owing to the interaction between depth and substrate type. Deeper transects are generally along less heterogeneous (fewer patches) bottoms. In the figure on the right habitat variables were aggregated according to their position on the Bank. The lack of clustering among the six locations indicates that distinct combinations of habitat types are present in the different regions of the Bank.
CORDELL BANK NATIONAL MARINE SANCTUARY
Cordell Bank is a submerged granitic island 8 km wide by 15 km long, which lies on the continental shelf 100 km northwest of San Francisco. A bathymetric contour map over which submersible dive tracks (black squiggly lines) have been laid is shown. Dive locations were chosen to provide a broad representation of the Bank’s depths, habitat types, and spatial zones. The inset shows the location of the Sanctuary along the Central California Coast. The blue footprint is the boundary of the entire Sanctuary; the Bank is in the western region of the Sanctuary along the continental shelf break.
SUMMARY
These results represent our first exploratory pass through the data. We have generalized the observed patterns over the entire Bank and have found fish-habitat relationships at this level of resolution to be concordant with those of other investigators. The clear importance of Cordell Bank as a settlement site for YOY rockfishes has been observed and documented. In the future we intend to elucidate differences in fish-habitat relationships between regions of Cordell Bank (finer scale) and between other sites along the West Coast (larger scale). Preliminary observations of the deep boulder habitats at Cordell Bank suggest that this habitat harbors commercially important (and overfished) species such as bocaccio, yelloweye rockfish, vermilion rockfish, and canary rockfish, and that Cordell Bank may be truly essential for the rebuilding the stocks of these species.
REFERENCES
Stein, L. L., B. N. Tissot, M. A. Hixon, and W. Barss. 1992. Fish-habitat associations on a deep reef at the edge of the Oregon continental shelf. U.S. Fish. Bull., 90:540-551.
Yoklavich, M., H. G. Greene, G. Cailliet, D. Sullivan, R. Lea, and M. Love. 2000. Habitat associations of deepwater rockfishes in a submarine canyon: an example of a natural refuge. U.S. Fish. Bull., 98:625-641.
ACKNOWLEDGEMENTS
We thank Mary Yoklavich (NMFS, Santa Cruz) and Waldo Wakefield (NMFS, Newport) for guidance and introduction to the cabal* of submersible workers (you know who you are) on the West Coast. This project would not have been possible without the help of countless individuals who will go unnamed here so that no one feels left out.
\* A conspiratorial group of plotters.
Transects were broadly distributed over the bank to sample all habitats (see contour map). While all transects were 15 minutes in duration, differences in relief and substrate between transect resulted in large differences in transect length which could vary by a factor of two. For this reason, fish density estimates were based on habitat patch size and not time. Habitat hererogeneity varied greatly between transects.
FISH-HABITAT AFFINITY
We examined the fish/habitat relations using data summarization (top figure) and multivariate Canonical Correlation (bottom figure). At the transect-level, five habitat types characterized Cordell Bank. At the scale of transects, hard outcrop areas were characterized by both rocks and boulders. These hard outcrop areas were characterized by a suite of groundfish species (e.g., blackeye goby, pygmy, widow, yelloweye, bocaccio, and young-of-year rockfishes). Sebastomus species were also characteristic of hard outcrop habitats, but were more frequently found in transects dominated by boulders. Cobble habitats were characterized by greenspotted and greenstriped rockfishes and combfish. Transects containing sand habitats were also characterized by sanddabs. In contrast to other habitats, mud habitats were more extensive and continuous and were characterized by flatfishes, poachers, stripetail rockfish, and ratfish.
Density (log10 number of fish / 20 square meters) of fishes observed in each of six primary habitat categories. Blue bars designate species (or species complexes) more commonly observed on sand or mud substrates. Species with red bars are those which occurred on hard substrates. Fish labeled in green are those which had no clear affinity for a particular substrate type.
Size frequency histograms are for all taxa combined and summarized separately for each habitat type. Size frequency distributions emphasize the fact that many Cordell Bank habitats harbor high densities of small fishes (NOTE: abscissa is log scale). Most of the fishes <= 5 cm are recently settled YOY rockfish. Small individuals were not found in mud or high relief rock possibly because of the lack of shelter. Rock and boulder habitats, which offer the best cover, had the largest fishes.