Embed Size (px)
Citation preview

BAK SA 101 Annual Report 2014.Docx 17 November 2015 PUGET SOUND ENERGY Baker River Hydroelectric Project
SETTLEMENT AGREEMENT ARTICLE 101
FISH PROPAGATION 2014 ANNUAL REPORT
REPORTING PERIOD JANUARY 1, 2014 – DECEMBER 31, 2014
BAKER RIVER HYDROELECTRIC PROJECT FERC No. 2150
November 2015
Fish Propagation 2014 Annual Report CONTENTS
BAK SA 101 Annual Report 2014.Docx 17 November 2015 PUGET SOUND ENERGY Baker River Hydroelectric Project Page ii
CONTENTS 1.0 Executive Summary .................................................................................................................................................................. 1
2.0 Introduction ............................................................................................................................................................................... 1 3.0 Activity Report .......................................................................................................................................................................... 2
3.1 Principal Management Activities ...................................................................................................................................... 2 3.2 Design and Planning Activities ....................................................................................................................................... 37
3.3 Documents Submitted .................................................................................................................................................... 37
4.0 Accounting .............................................................................................................................................................................. 38 4.1 Funding .......................................................................................................................................................................... 38
4.2 Expenditures .................................................................................................................................................................. 38
4.3 Adjustments .................................................................................................................................................................... 39 5.0 Supporting Documents .......................................................................................................................................................... 39
6.0 References ............................................................................................................................................................................... 39

Fish Propagation 2014 Annual Report List of Tables
BAK SA 101 Annual Report 2014.Docx 17 November 2015 PUGET SOUND ENERGY Baker River Hydroelectric Project Page iii
List of Tables Table 1. Fish Co-Managers’ preseason sockeye beach loading plan and actual beach loading, 2014. ...................................... 11 Table 2. 2014 sockeye salmon beach loading records by data source (WDFW, PSE) and difference. ........................................ 12 Table 3. Salmon production from Baker fish propagation facilities, February 1, 2014 to May 31, 2014. ....................................... 13 Table 4. Sockeye broodstock and fry production from Baker fish propagation facilities, plus subsequent smolts counted
for each brood year from 1999 through 2014. ............................................................................................................. 16 Table 5. Salmon releases from Baker River fish propagation facilities, 2014. ............................................................................... 18 Table 6. Salmon rearing inventory at fish propagation facilities as of December 31, 2014. .......................................................... 19 Table 7. Funds allocated to nutrient enhancement account, 2012–2014 (years one to three). ..................................................... 38
List of Figures Figure 1. Baker fish hatchery site layout. ......................................................................................................................................... 6 Figure 2. Baker fish hatchery constructed facilities. ......................................................................................................................... 7 Figure 3. Baker Fish Hatchery and improved Spawning Beach 4 during operation. ....................................................................... 7 Figure 4. Spawning Beach 4. . ....................................................................................................................................................... 10 Figure 5. The hatchery A.I. holding facilities contained 4,101 adult sockeye in 2014, and are capable of holding up to 6,000
broodstock. .................................................................................................................................................................. 10 Figure 6. Yearly sockeye artificial incubation program. ................................................................................................................. 15 Figure 7. Yearly number of sockeye fry released into the reservoirs from Baker fish propagation programs, brood years
1957-2013 (release years 1958-2014). ....................................................................................................................... 17 Figure 8. Juvenile fish rearing facilities in use for sockeye and coho salmon and rainbow trout. .................................................. 19 Figure 9. Average fork length for Baker Lake age 1 sockeye smolts (2010–2014). ...................................................................... 22 Figure 10. Average condition factor (K) for Baker Lake age 1 sockeye smolts (2010–2014). ....................................................... 22 Figure 11. Five LWD structures were installed in the main channel alignment during July and August 2013
to help maintain pond hydrology. ................................................................................................................................ 26 Figure 12. Demolition of Spawning Beach 3 (upper). Surface and sub-surface infrastructure removed and hauled offsite
for disposal (lower). ..................................................................................................................................................... 27 Figure 13. All site facilities removed .............................................................................................................................................. 28 Figure 14. 2014 LWD modifications to improve function included installing liners on the upstream end and notches .................. 29 Figure 15. 2014 LWD modifications included adding a roughen channel between LWD structures 4 and 3. ............................... 30 Figure 16. 2014 re-vegetation and mulch around the LWD structures. ......................................................................................... 31 Figure 17. 2014 re-vegetation and mulch along the former access road and along the floodplain swale ..................................... 32 Figure 18. Mulch placement along the LWD structures. ................................................................................................................ 33 Figure 19. Photos taken at completion in December 2014, following a site walk with the USDA-FS. ........................................... 34 Figure 20. Spawning Beaches 1, 2, and 3 before decommissioning ............................................................................................ 35 Figure 21. Conditions at completion of decommissioning (April 18, 2013 design), showing infrastructure removed,
site regrading, large woody debris structures in the channel alignment, and an overflow swale. .............................. 36

BAK SA 101 Annual Report 2014.Docx 17 November 2015 PUGET SOUND ENERGY Baker River Hydroelectric Project Page 1
1.0 Executive Summary This annual report reviews activities undertaken by Puget Sound Energy (PSE) in 2014 to implement settlement agreement article 101, “Fish Propagation” (SA 101) of the Order on Offer of Settlement, Issuing New License and Dismissing Amendment Application as Moot (the license) issued by the Federal Energy Regulatory Commission (FERC) on October 17, 2008 for the Baker River Hydroelectric Project. The report covers the SA 101 reporting period of January 1 through December 31, 2014, as outlined in the revised aquatics reporting schedule submitted to the FERC on September 11, 2014, and approved by the FERC on January 16, 2015. It has been prepared in consistence with SA 102, “Aquatics Reporting,” and SA 101.
SA 101 implementation measures during the reporting period of January 1, 2014 through December 31, 2014 included:
• Continuing to implement the Fish Propagation Facilities Plan in accordance with the plan’s schedule.
• Completing the decommissioning of the site of Sockeye Spawning Beaches 1, 2, and 3 based on the Channel Creek Site Decommissioning Plan (December 2012); and required modifications outlined in the final USFS construction punch list.
• Funding and operating fish propagation and enhancement programs for 2014 in the new Baker fish hatchery and Sockeye Spawning Beach 4, including achieving a combined production of 6.59 million fry, the highest in 56 years of production from Baker facilities, and exceeding the goal of 6 million. Approximately 4.76 million sockeye fry were from the fourth brood year operation of the new hatchery, and 1.83 million were from the operation of the improved Spawning Beach 4. Performance of these facilities increased sockeye fry production more than two-fold from levels prior to 2008. In June, the hatchery and spawning beach began fifth brood year operation by receiving 2014 adult sockeye.
• Planning long term surface erosion protection measures at the Sulphur Springs water supply intake (hatchery headworks). Interim surface erosion control measures are currently protecting the hatchery headwork repairs completed in 2013.
• Convening a fry release site technical working group to identify options related to the number of usable release sites.
• Developing a draft memorandum regarding procedures to be followed in managing the reservoir nutrient enhancement funding requirement per SA 101(f).
• Continuing a study approach in collaboration with the ARG for monitoring adult returns and the size and number of outmigrating smolts to provide feedback on basin sockeye production limits. PSE provided a summary of results to the ARG from 2014 adult and smolt data collection efforts.
2.0 Introduction This Fish Propagation Report has been prepared for the Baker River Hydroelectric Project (the Project), pursuant to the Order on Offer of Settlement, Issuing New License and Dismissing Amendment Application as Moot dated October 17, 2008 (the license). In the

Fish Propagation 2014 Annual Report Activity Report
BAK SA 101 Annual Report 2014.Docx 17 November 2015 PUGET SOUND ENERGY Baker River Hydroelectric Project Page 2
license, settlement agreement article (SA) 101, “Fish Propagation” (appendix A), sets forth the applicable requirements for the Fish Propagation Facilities Plan (the Plan), which in turn sets forth the requirements of this annual report.
This annual report summarizes the activities conducted under SA 101 from January 1, 2014 through December 31, 2014, including management activities, monitoring, design and planning, surveys and data collection activities, consultation, documents prepared, modifications to or deviations from the Plan, issues and resolution, accounting, and purposed changes to the FERC-approved Plan. This report provides the ongoing format for future reports.
3.0 Activity Report 3.1 Principal Management Activities
Principal activities during the 2014 reporting period (January 1, 2014 through December 31, 2014) included the following (which are described in greater detail in sections 3.1.1 through 3.1.5):
• Continuing to implement the Fish Propagation Facilities Plan (PSE, 2009a) approved by the FERC on May 26, 2010.
• Completing the decommissioning of the site of Sockeye Spawning Beaches 1, 2 and 3 based on a Channel Creek Site Decommissioning Plan (December 2012), after receiving documentation confirming USDA-FS approval (“Notice to Proceed”) of the final design plan dated April 18, 2013 and providing construction updates to the USDA-FS and ARG. The USDA-FS provided a punch list of required construction modifications and concurred with a schedule extension allowing completion of the decommissioning, per the plan and required modifications outlined in the final USFS construction punch list, by December 2014.
• Operating the newly-constructed Baker fish hatchery for the fourth year, releasing 3.78 million sockeye fry to Baker Lake and 1.95 million sockeye fry to Lake Shannon, and retaining 374,000 fry for the 20,000-pound production rearing program.
• Continuing the existing propagation and enhancement programs. The Fish Co-managers (the Sauk-Suiattle Indian Tribe, Swinomish Indian Tribal Community, Upper Skagit Indian Tribe, and Washington Department of Fish and Wildlife) increased the 20,000-pound production program’s rearing goal for sockeye, but left the goals for coho and rainbow trout production unchanged. Allocated to this extended rearing program were approximately 374,000 sockeye, 65,000 coho, and 20,000 rainbow trout fry. Rearing and release objectives were achieved during the reporting period.
• Planning long-term erosion control measures at the Sulphur springs water supply intake in consultation with the USDA-FS and WDFW. Interim measures installed by PSE to reduce surface erosion in the construction area, has provided protection to the hatchery headwork water supply repairs completed in 2013.
• Consulting with the Washington Department of Fish and Wildlife (WDFW) on fish propagation plans, hatchery operation protocols, and the continuing PSE funding of fish propagation/enhancement programs and an onsite manager. In response to the Fish Co-manager’s policy on fry release sites, the Fish Co-managers and PSE
Fish Propagation 2014 Annual Report Activity Report
BAK SA 101 Annual Report 2014.Docx 17 November 2015 PUGET SOUND ENERGY Baker River Hydroelectric Project Page 3
convened a Fry Release Site Technical Working Group to identify options and establish a path forward that all can support. The Fish Co-managers and PSE have also exchanged letters to clarify their positions regarding the Fish Co-managers’ request that PSE purchase and install a water chiller system at the Baker fish hatchery.
• Developing a draft memorandum regarding procedures to be followed in managing the reservoir nutrient enhancement funding requirement in SA 101(f), including fund requests, fund disbursement, and annual reporting, as well as a mechanism for returning unspent funds to the Habitat Enhancement, Restoration, and Conservation fund. The draft memorandum is being prepared for review by the Fish Co-managers.
• Continuing a study approach in collaboration with the ARG for monitoring adult returns and the size and number of outmigrating smolts to provide feedback on basin sockeye production limits. PSE provided a summary of results to the ARG in December 2014 from the year’s adult and smolt data collection efforts.
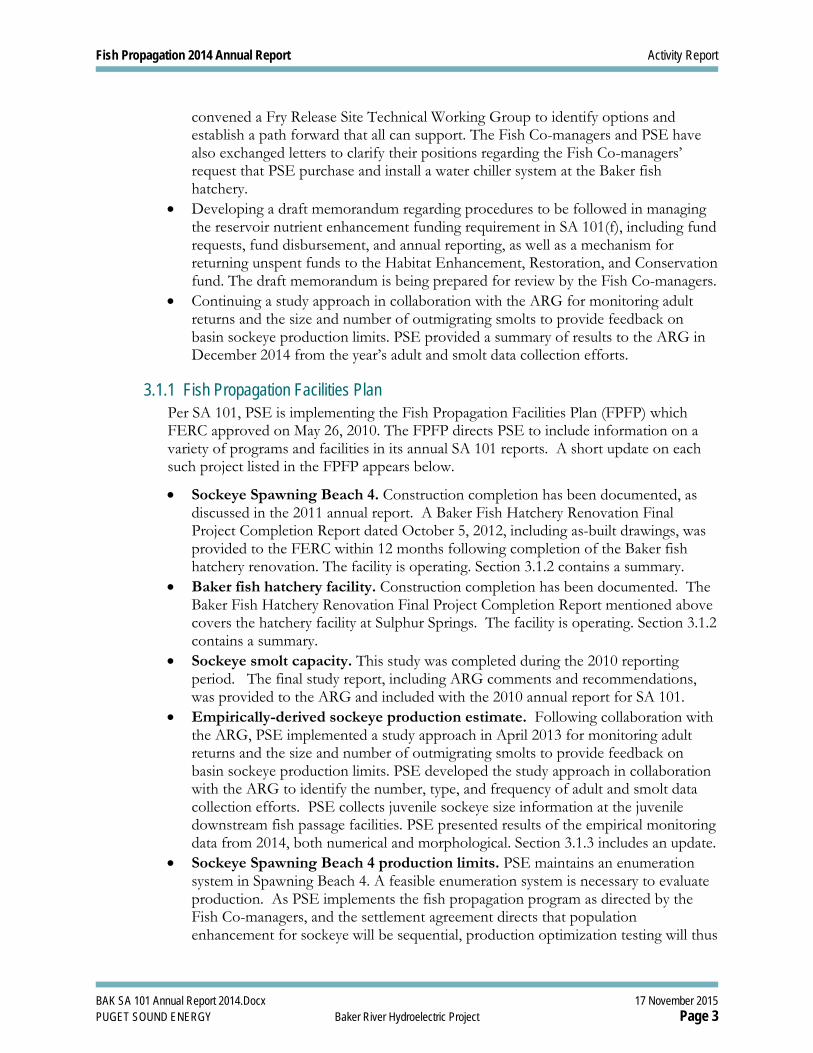
3.1.1 Fish Propagation Facilities Plan Per SA 101, PSE is implementing the Fish Propagation Facilities Plan (FPFP) which FERC approved on May 26, 2010. The FPFP directs PSE to include information on a variety of programs and facilities in its annual SA 101 reports. A short update on each such project listed in the FPFP appears below.
• Sockeye Spawning Beach 4. Construction completion has been documented, as discussed in the 2011 annual report. A Baker Fish Hatchery Renovation Final Project Completion Report dated October 5, 2012, including as-built drawings, was provided to the FERC within 12 months following completion of the Baker fish hatchery renovation. The facility is operating. Section 3.1.2 contains a summary.
• Baker fish hatchery facility. Construction completion has been documented. The Baker Fish Hatchery Renovation Final Project Completion Report mentioned above covers the hatchery facility at Sulphur Springs. The facility is operating. Section 3.1.2 contains a summary.
• Sockeye smolt capacity. This study was completed during the 2010 reporting period. The final study report, including ARG comments and recommendations, was provided to the ARG and included with the 2010 annual report for SA 101.
• Empirically-derived sockeye production estimate. Following collaboration with the ARG, PSE implemented a study approach in April 2013 for monitoring adult returns and the size and number of outmigrating smolts to provide feedback on basin sockeye production limits. PSE developed the study approach in collaboration with the ARG to identify the number, type, and frequency of adult and smolt data collection efforts. PSE collects juvenile sockeye size information at the juvenile downstream fish passage facilities. PSE presented results of the empirical monitoring data from 2014, both numerical and morphological. Section 3.1.3 includes an update.
• Sockeye Spawning Beach 4 production limits. PSE maintains an enumeration system in Spawning Beach 4. A feasible enumeration system is necessary to evaluate production. As PSE implements the fish propagation program as directed by the Fish Co-managers, and the settlement agreement directs that population enhancement for sockeye will be sequential, production optimization testing will thus

Fish Propagation 2014 Annual Report Activity Report
BAK SA 101 Annual Report 2014.Docx 17 November 2015 PUGET SOUND ENERGY Baker River Hydroelectric Project Page 4
commence on a schedule to be determined in consultation with the ARG, and specifically the Fish Co-managers. At the September 2013 ARG meeting, PSE requested that the Fish Co-managers consider approaches to loading one or more spawning beach sections when setting annual broodstock goals, as a means of testing the facility’s upper limits. The Fish Co-managers meet annually to establish production goals. Sockeye production has increased gradually at the hatchery, and has remained unchanged at the spawning beach.
• Spawning Beaches 1–3 (Channel Creek site). The decommissioning project per the plan and required modifications outlined in the final USFS construction punch list was completed by the end of 2014. A decommissioning plan, documentation confirming U.S. Forest Service approval of the decommissioning plan, and interim progress updates was provided in the 2013 SA 101 annual report, and progress updates made subsequently until completion of Channel Creek site decommissioning activities. PSE submitted a Channel Creek Site Decommissioning Plan in December 2012. The USDA-FS approved the final design plan dated April 18, 2013 (in their “Notice to Proceed” dated May 29, 2013). Project construction began on July 16, 2013 in accordance to plans. Interim progress updates were provided to the ARG throughout construction. Decommissioning was completed in December 2014, including the required modifications outlined in the final USFS construction punch list. Section 3.1.4 provides an update.
• Confirmation of annual PSE funding of the Fish Propagation and Enhancement Program and the annual fish production plan. The Fish Co-Managers will provide PSE with an annual fish production plan. Following completion of the Baker fish hatchery renovation, PSE requested that the Fish Co-Managers provide the annual fish production plan to PSE annually by September 30 to accommodate the PSE budget, reporting processes, and timeline requirements. PSE funded the fish propagation and enhancement program during the reporting period. The Fish Co-managers are continuing to work on a draft annual plan and progress updates have been provided at the quarterly ARG meetings. Sufficient production planning information in lieu of a plan document was provided throughout the reporting period to successfully implement the fish production programs. The Fish Co-Managers provided PSE with a plan to achieve a production goal of 6 million fry. The Fish Co-managers increased the 20,000-pound production program’s sockeye rearing goal from previous years while continuing the status quo for coho and rainbow trout production. Allocated to this extended rearing program were approximately 374,000 sockeye (an increase from 130,000, primarily for fall releases), 65,000 coho, and 20,000 rainbow trout fry. The WDFW informed PSE of sockeye fry distribution plans for the resulting 2014 brood year production of sockeye, directing 4.65 million fry into Baker Lake and 2 million into Lake Shannon and retaining 350,000 for extended rearing and fall parr release into Baker Lake (Baker River Co-Managers, 2014). PSE and the Fish Co-managers convened a technical working group to examine the number of usable sockeye fry release locations, identify options, and establish a and a path forward to resolve the issues that has led to the Fish Co-manager’s policy on fry release sites. PSE responded to the Fish Co-managers’ request that PSE purchase and install a water chiller system at the Baker fish hatchery. Section 3.1.3 presents the results of the fish propagation
Fish Propagation 2014 Annual Report Activity Report
BAK SA 101 Annual Report 2014.Docx 17 November 2015 PUGET SOUND ENERGY Baker River Hydroelectric Project Page 5
programs and discusses the Fish Co-manager requests, and section 4.2 describes expenditures during the reporting period.
• Annual confirmation of PSE funding of the Reservoir Nutrient Enhancement Program. Funding, which is not to exceed $60,000 annually, was placed into a PSE account for disbursements available to the Fish Co-managers. The use of funds will be at the discretion of the Fish Co-managers. The process to disburse funds was initiated in 2013. PSE met with the Fish Co-managers (the Washington Department of Fisheries, Swinomish Indian Tribal Community, Sauk-Suiattle Indian Tribe, and Upper Skagit Indian Tribe) to discuss a mechanism for distributing the fund. During this reporting period, the Fish Co-managers and PSE have been developing a draft memorandum regarding the procedures to be followed in connection with managing the fund. Section 3.1.3 includes an update. Funding is scheduled for license years 5–50. Funding activity during the reporting period is reported in section 4.1.
• Fish facility operations manual for the Sulphur Springs site. Operations procedures, including abnormal operation and maintenance procedures in accordance to PSE standards, were developed during completion of the Baker fish hatchery renovation. PSE and the Baker fish hatchery design and construction contractor, McMillen-McDougall, prepared the procedures for inclusion in the updated manual replacing the April 2009 manual completed for the previous fish culture facilities. The new procedures are in use now for the operation and maintenance of Spawning Beach 4 and the new hatchery. Living as an electronic file collection, the operations manual provides access to procedures for operations, maintenance and emergency response from the Baker Plant and hatchery and easy navigation to facility layout, descriptions and drawings, emergency, physical and biological operations, security and maintenance procedures, and makes future updates readily available.
• Annual contract and budgeting report governing operation of fisheries enhancement programs. This will report the annual budget and actual costs. WDFW is under a PSE contract, whereby PSE funds an onsite manager for operations. Expenditures from the WDFW contract during the reporting period are reported in section 4.2.
• Fish propagation facilities operations audit. Results of the fish propagation facilities and program are discussed in section 3.1.3 and provide an audit of the annual facilities and programs based on a January 1 to December 31 operating year. The audit will address financial accounting, fish handling and disease management operations, hazardous materials handling, and spill prevention, control, and countermeasures (SPCC) compliance. PSE, per the FERC license, developed an SPCC plan for the project. This plan was submitted to the FERC, and compliance is mandatory. At the time of this report, there have been no incidents.

Fish Propagation 2014 Annual Report Activity Report
BAK SA 101 Annual Report 2014.Docx 17 November 2015 PUGET SOUND ENERGY Baker River Hydroelectric Project Page 6
3.1.2 SA 101 A & B – Sockeye Spawning Beach 4 and Baker Fish Hatchery PSE completed the construction of new fish culture facilities and modification of Spawning Beach 4 at Sulphur Springs by December 31, 2011, based upon the Baker Fish Hatchery Renovation 100% Final Design Documentation Report (McMillen, 2009). Final project completion is documented in the 2011 annual report.
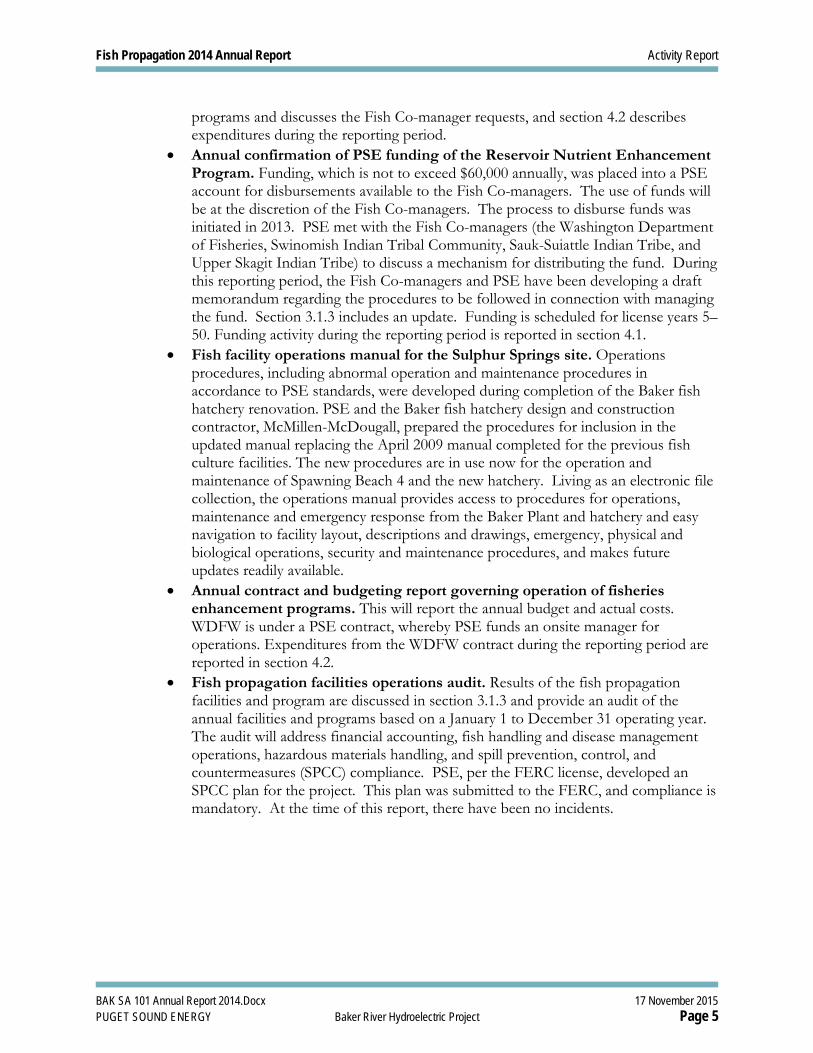
A Baker Fish Hatchery Renovation Final Project Completion Report (PSE, 2012a) dated October 5, 2012, including as-built drawings, was provided to the FERC within 12 months following completion of the Baker Fish Hatchery renovation. The facilities are now in their 4th operating year. Figures 1, 2, and 3 show the Baker fish hatchery site layout and the completed facilities in operation.
Figure 1. Baker fish hatchery site layout.
Fish Propagation 2014 Annual Report Activity Report
BAK SA 101 Annual Report 2014.Docx 17 November 2015 PUGET SOUND ENERGY Baker River Hydroelectric Project Page 7
Figure 2. Baker fish hatchery constructed facilities. Clockwise from top left: egg incubation,
adult holding and fry transfer hoppers, outdoor rearing, early rearing.
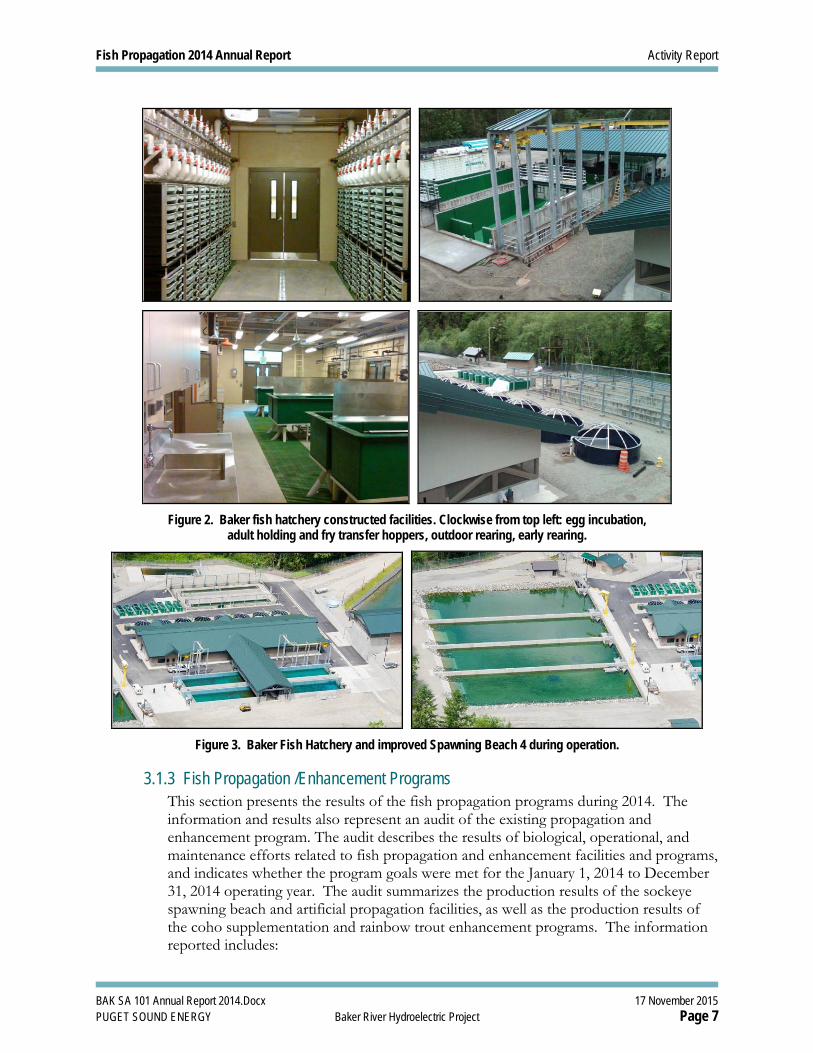
Figure 3. Baker Fish Hatchery and improved Spawning Beach 4 during operation.
3.1.3 Fish Propagation /Enhancement Programs This section presents the results of the fish propagation programs during 2014. The information and results also represent an audit of the existing propagation and enhancement program. The audit describes the results of biological, operational, and maintenance efforts related to fish propagation and enhancement facilities and programs, and indicates whether the program goals were met for the January 1, 2014 to December 31, 2014 operating year. The audit summarizes the production results of the sockeye spawning beach and artificial propagation facilities, as well as the production results of the coho supplementation and rainbow trout enhancement programs. The information reported includes:

Fish Propagation 2014 Annual Report Activity Report
BAK SA 101 Annual Report 2014.Docx 17 November 2015 PUGET SOUND ENERGY Baker River Hydroelectric Project Page 8
• Sockeye and coho fry production numbers. • A discussion of disease management and results. • Remedial responses to protect the water supply headworks from a naturally
occurring landslide. • Reporting related to adult returns, facility loading, production totals, and release
numbers for juvenile sockeye, coho, and the other fish propagation and enhancement programs for rainbow trout.
The current fish production program at the Baker River Project is directed by the Fish Co-Managers and is a combination of sockeye, coho, and rainbow trout production. The program continues the previous propagation and enhancement programs established by PSE with the WDFW, the Upper Skagit Indian Tribe, the Sauk-Suiattle Indian Tribe, and the Swinomish Indian Tribal Community, the USFWS, NOAA Fisheries, and the USDA-FS — except that these programs are now contained in an improved sockeye spawning beach and the newly-constructed Baker River fish hatchery, and will enable the continued sequential development of population enhancement for sockeye and a 20,000-pound-capacity production program made up of any one or any combination of several species. Program updates, directives, and changes are provided by the Fish Co-Managers and reviewed at scheduled ARG meetings.
Fish propagation and enhancement program funding and operations in the new hatchery and improved Spawning Beach 4 during 2014 were based on a production goal of 6 million sockeye fry and a juvenile rearing goal of 330,000 sockeye, 60,000 coho, and 20,000 rainbow trout.
In April 2014, the Fish Co-managers initiated a steelhead research program based on a single brood year. The program designates a brood of up to eight Skagit winter steelhead, follows the brood through their release as 2-year-old smolts. The experimental program is an initial exploratory research activity expected to operate for two years; its goal is to inform future consideration regarding restoration of the Baker River steelhead run.
3.1.3.1 Sockeye Salmon Spawning Beaches Spawning Beach 4, completed in 1990 to replace the aging, isolated, and vulnerable Beaches 2 and 3, is operated as four isolated compartments (A, B, C, and D) to reduce and contain outbreaks of infectious hematopoietic necrosis (IHN), a viral disease endemic to sockeye populations. The WDFW provides on-site management of Spawning Beach 4, with support from PSE in the form of funds and personnel. The improved Spawning Beach 4 operated for the third year during this reporting period, as the modifications required by SA 101 had been completed. These modifications included an isolated water supply, concrete barriers for compartment isolation, a new pond liner, outlet structure improvements, and cranes and concrete pads for carcass removal and better access.
If the IHN virus is detected above the threshold level for any one of the compartments during routine testing, a chlorination treatment system is activated and a protocol to stop collection of fry in that segment is triggered at the direction of the Fish Co-managers. The fry emerging from the infected compartment are terminated, and effluent is diverted
Fish Propagation 2014 Annual Report Activity Report
BAK SA 101 Annual Report 2014.Docx 17 November 2015 PUGET SOUND ENERGY Baker River Hydroelectric Project Page 9
to the chlorination treatment system in accordance with the disease management protocol developed by the Fish Co-Managers for the facility. The disease management protocol is a set of agreements on how to determine when to stop taking fry from a beach section. This protocol has been in place for the past 16 years, and is revised annually as more is learned about the disease. During this reporting period, viral sampling of adult fish indicated that IHN virus was present in sockeye that returned to the Baker system in the fall of 2013, and detected IHN virus in adult fish placed in Spawning Beach 4 and in the artificial incubation adult holding ponds. The containment features of the Spawning Beach and hatchery, and operational procedures for disease management and biosecurity procedures worked to contain and limit infection episodes. Winter/spring (2014) viral sampling of fry produced from both these facilities confirmed that IHN was not present in fry produced from Spawning Beach 4.
Surplus adult sockeye salmon may be released into Baker Lake for spawning in the upper Baker River and its tributaries. Spawning Beach 3 operated periodically as an unattended production facility until replacement production was provided from the new Baker fish hatchery at Sulphur Springs. When it did operate, Spawning Beach 3 usually required pumping to supplement the gravity water supply. PSE provided support in the form of equipment and personnel at the request of the WDFW. The site of Spawning Beaches 1, 2, and 3 was decommissioned as a requirement of SA 101. The decommissioning project was initiated in June 2013; Spawning Beaches 1, 2, and 3 were dismantled, and the site was returned to a natural condition.
3.1.3.2 Sockeye Adult Returns (2014 Brood Year) Each year, the Fish Co-Managers based the spawning beach loading goals and artificial incubation (AI) program goals on the predicted sockeye run size and ideal loading conditions. Spawning density goals help maximize production and manage for disease. It should be noted that the WDFW directs the facility’s fish propagation program objectives on behalf of the Fish Co-Managers. In 2014, the plan called for holding up to 2,201 adult sockeye in Spawning Beach 4, and 4,101 sockeye as brood stock for the artificial incubation (AI) program.
A total of 14,176 sockeye returned to the Baker River adult trap during 2014. The return exceeded the Fish Co-Managers’ 2014 allocation for the fish propagation facilities, so 7,207 sockeye were placed into Baker Lake, while 622 were allocated to tribal ceremonial and subsistence. A distribution methodology developed by the Fish Co-Managers allocated fish between Spawning Beach 4, the artificial incubation program, lake release, and tribal ceremonial and subsistence fishing based on representative portions of the expected run timing. Beach 4 was seeded with a total of 2,196 fish. Artificial incubation raceways were seeded with a total of 4,101 fish. Combined, the facilities were seeded with a total of 6,297 fish. The loading plan and actual loading count are reported in table 1.

Fish Propagation 2014 Annual Report Activity Report
BAK SA 101 Annual Report 2014.Docx 17 November 2015 PUGET SOUND ENERGY Baker River Hydroelectric Project Page 10
Figure 4. Spawning Beach 4. The beach was loaded with 2,196 adult sockeye in 2014, and is
capable of holding over 3,400.
Figure 5. The hatchery A.I. holding facilities contained 4,101 adult sockeye in 2014, and are
capable of holding up to 6,000 broodstock.
Fish Propagation 2014 Annual Report Activity Report
BAK SA 101 Annual Report 2014.Docx 17 November 2015 PUGET SOUND ENERGY Baker River Hydroelectric Project Page 11
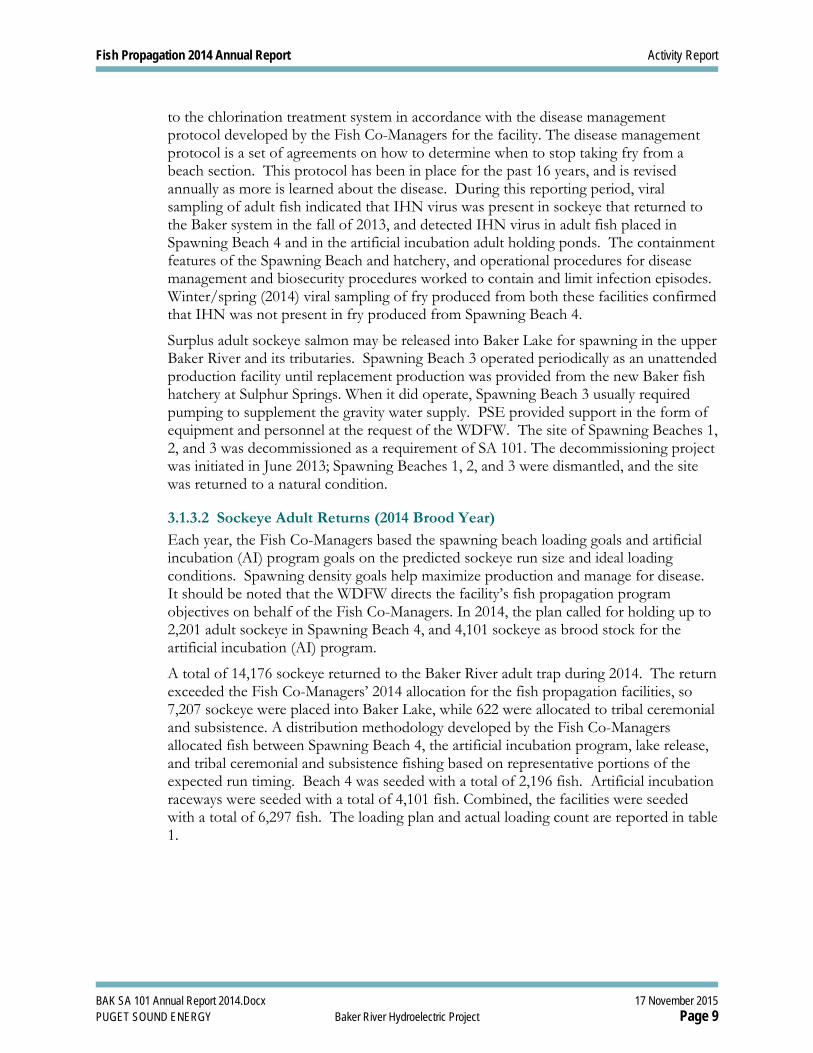
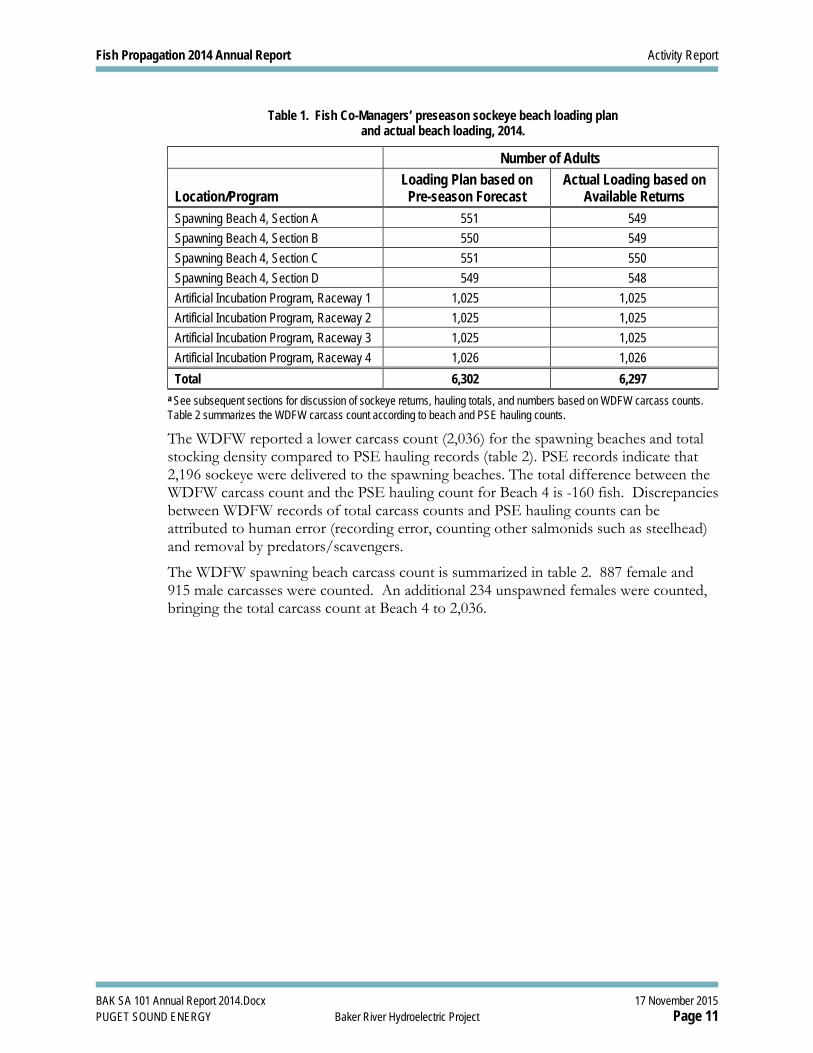
Table 1. Fish Co-Managers’ preseason sockeye beach loading plan and actual beach loading, 2014.
Number of Adults Location/Program
Loading Plan based on Pre-season Forecast
Actual Loading based on Available Returns
Spawning Beach 4, Section A 551 549 Spawning Beach 4, Section B 550 549 Spawning Beach 4, Section C 551 550 Spawning Beach 4, Section D 549 548 Artificial Incubation Program, Raceway 1 1,025 1,025 Artificial Incubation Program, Raceway 2 1,025 1,025 Artificial Incubation Program, Raceway 3 1,025 1,025 Artificial Incubation Program, Raceway 4 1,026 1,026 Total 6,302 6,297
a See subsequent sections for discussion of sockeye returns, hauling totals, and numbers based on WDFW carcass counts. Table 2 summarizes the WDFW carcass count according to beach and PSE hauling counts.
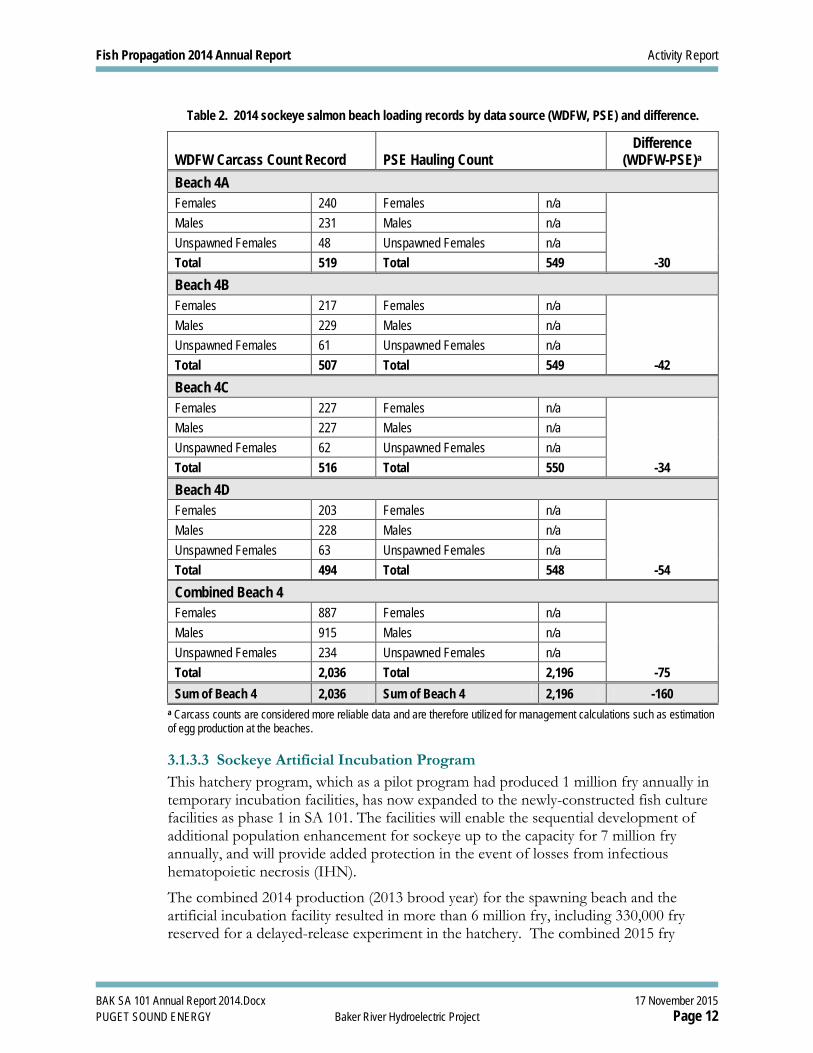
The WDFW reported a lower carcass count (2,036) for the spawning beaches and total stocking density compared to PSE hauling records (table 2). PSE records indicate that 2,196 sockeye were delivered to the spawning beaches. The total difference between the WDFW carcass count and the PSE hauling count for Beach 4 is -160 fish. Discrepancies between WDFW records of total carcass counts and PSE hauling counts can be attributed to human error (recording error, counting other salmonids such as steelhead) and removal by predators/scavengers.
The WDFW spawning beach carcass count is summarized in table 2. 887 female and 915 male carcasses were counted. An additional 234 unspawned females were counted, bringing the total carcass count at Beach 4 to 2,036.
Fish Propagation 2014 Annual Report Activity Report
BAK SA 101 Annual Report 2014.Docx 17 November 2015 PUGET SOUND ENERGY Baker River Hydroelectric Project Page 12
Table 2. 2014 sockeye salmon beach loading records by data source (WDFW, PSE) and difference.
WDFW Carcass Count Record
PSE Hauling Count
Difference (WDFW-PSE)a
Beach 4A Females 240 Females n/a Males 231 Males n/a Unspawned Females 48 Unspawned Females n/a Total 519 Total 549 -30 Beach 4B Females 217 Females n/a Males 229 Males n/a Unspawned Females 61 Unspawned Females n/a Total 507 Total 549 -42 Beach 4C Females 227 Females n/a Males 227 Males n/a Unspawned Females 62 Unspawned Females n/a Total 516 Total 550 -34 Beach 4D Females 203 Females n/a Males 228 Males n/a Unspawned Females 63 Unspawned Females n/a Total 494 Total 548 -54 Combined Beach 4 Females 887 Females n/a Males 915 Males n/a Unspawned Females 234 Unspawned Females n/a Total 2,036 Total 2,196 -75 Sum of Beach 4 2,036 Sum of Beach 4 2,196 -160
a Carcass counts are considered more reliable data and are therefore utilized for management calculations such as estimation of egg production at the beaches.
3.1.3.3 Sockeye Artificial Incubation Program This hatchery program, which as a pilot program had produced 1 million fry annually in temporary incubation facilities, has now expanded to the newly-constructed fish culture facilities as phase 1 in SA 101. The facilities will enable the sequential development of additional population enhancement for sockeye up to the capacity for 7 million fry annually, and will provide added protection in the event of losses from infectious hematopoietic necrosis (IHN).
The combined 2014 production (2013 brood year) for the spawning beach and the artificial incubation facility resulted in more than 6 million fry, including 330,000 fry reserved for a delayed-release experiment in the hatchery. The combined 2015 fry

Fish Propagation 2014 Annual Report Activity Report
BAK SA 101 Annual Report 2014.Docx 17 November 2015 PUGET SOUND ENERGY Baker River Hydroelectric Project Page 13
production (2014 brood year), which is anticipated to be 7 million, will be totaled in early 2015, and therefore will be reported in the 2015 annual report.
PSE will take a sequential approach for scheduling and increasing future sockeye fry production per SA 101 (c), “Sequential Development of Sockeye Population,” using both the spawning beach program and the artificial incubation (AI) program for enhancement. In this approach, PSE would provide for facility operations as directed by the Fish Co-managers, with sequential increases of approximately 1 million fry per year until either Spawning Beach 4 plus phase 1 of the artificial incubation program reach their maximum capacity, or the Baker River system reaches its maximum capacity.
3.1.3.4 Sockeye Egg Production (2013 Brood Year) Spawning Beach 4 (SB4). Based on the carcass counts of spawned females and using an average fecundity of 3,000 eggs, as previously determined for the Baker River stock, it is estimated that approximately 3,039,000 eggs were deposited into the spawning beach gravels.
Artificial incubation (AI). According to WDFW records, from 1,664 spawned females, the AI program yielded a total of 4,893,032 eyed-eggs which had developed on vertical stack egg incubation trays supplied by the hatchery. Inclining the egg incubation trays at 5% was a slight operational adjustment this past year to benefit egg survival.
3.1.3.5 Sockeye Fry Production (2013 brood year) Spawning Beach 4. According to WDFW records, the spawning beach program produced approximately 1,828,946 fry between February and May 2014 for the 2013 brood year (table 4). These fry after emerging from the beach gravel emigrate to a collection hopper and are transported as unfed fry.
Artificial Incubation. According to WDFW records, the AI program produced approximately 4,761,302 fry between February and May 2014, released 3,894,242 fry into the reservoirs, and retained 374,833 for a delayed-release experiment in the hatchery, satisfying the fry production objectives established by the Fish Co-Managers for the artificial incubation program (table 3). In 2014, AI-program-produced fry were held and fed for up to 10 days.
Table 3. Salmon production from Baker fish propagation facilities, February 1, 2014 to May 31, 2014.
Production Year
Brood Year Species Program Stock Number
Release Size
Release Site
Feb. - May 2014 2013 sockeye Artificial Incubation Baker 3,894,242a fed fry
Baker Lake, Lake
Shannon
Feb. - May 2014 2013 sockeye Spawning Beach Baker 1,828,946b unfed fry Baker Lake
Feb. - May 2014 2013 sockeye Extended Rearing Baker 374,833c fed fry (see table 7)
Feb. - May 2014 2013 coho Extended Rearing Baker 223,935d fed fry (see table 7)
a Approximately 1,946,111 were released in Baker Lake, 1,948,131 were released in Lake Shannon.

Fish Propagation 2014 Annual Report Activity Report
BAK SA 101 Annual Report 2014.Docx 17 November 2015 PUGET SOUND ENERGY Baker River Hydroelectric Project Page 14
bAll were counted into Baker Lake, during end of season annual shutdown a residual amount of remaining fry estimated at 10,000 were released into Lake Shannon. c Approximately 374,833 was held in the extended rearing program and will be released in November 2014 (table 6). d Approximately 156,390 will be released as fry in Lake Shannon June 2014 , approximately 65,000 will be held in the extended rearing program and will be released in May 2015 (table 6).
3.1.3.6 Sockeye Fry Disposition (2013 Brood Year) Spawning Beach 4. The Fish Co-Managers determine the allocation percentages of fry to Lake Shannon and Baker Lake. According to WDFW records, most (99.5%) of the unfed Spawning Beach 4 fry (1,828,946) were released into Baker Lake. The other 0.5% that went into Lake Shannon consisted of approximately 10,000 residual remaining fry that were released into Lake Shannon when Beach 4 was shut down for the season.
Artificial Incubation. The Fish Co-Managers determine the allocation percentage of fry to Lake Shannon and Baker Lake. According to WDFW records, 1,946,111 (45.6%) fed fry from the artificial incubation program were released into Baker Lake, and 1,948,131 (45.6%) fed fry from the artificial incubation program were released into Lake Shannon. Artificial incubation fry were transported to swim-up troughs and fed for one to three weeks before release into Baker Lake and Lake Shannon. The holding was intended to allow the fry to swim up and become active before release, to develop foraging behavior, to time the release to the forage base population and coordinate with operational activities. Of these, 374,833 fed fry (8.8%) from the artificial incubation program are being reared for use in future studies and for continuing fish propagation and enhancement programs (the previous goal was 130,000).
303,434 juvenile sockeye were reserved for the delayed-release experiment at the hatchery: from the 2013 brood year, 295,156 ad-clipped fish at 32-35 fish per pound (fpp) were released into Baker Lake in November 2014; from the 2012 brood year, 6,281 ad-clipped fish at 20 fpp were inserted with a passive integrated transponder (PIT) and used to study Lower Baker fish passage beginning in March 2014 (table 5); and an additional 1,997 ad-clipped fish at 18 fpp were inserted with a PIT and used to study Upper Baker fish passage beginning in March 2014 (table 5). All fish were raised to appropriate release sizes and released on schedule.
Sockeye fry production was only slightly affected by infectious hematopoietic necrosis (IHN), a virulent rhabdoviral disease that occurs in the wild and can typically cause high mortality in juvenile sockeye. During this reporting period, viral sampling indicated that IHN virus was carried in adult sockeye that returned to the Baker system fall 2013, and detected IHN virus in adult fish placed in Spawning Beach 4 and in the artificial incubation adult holding ponds. The containment features of the Spawning Beach and hatchery, operational procedures for disease management, and biosecurity procedures worked to contain and limit infection episodes in subsequent fry production. Winter/spring (2014) viral sampling confirmed that no IHN was present in fry produced from Spawning Beach 4. IHN infection was contained to a single episode in the artificial incubation program: two egg trays from the 2nd egg take (28,058 sockeye eggs) were euthanized on February 10, 2014.

Fish Propagation 2014 Annual Report Activity Report
BAK SA 101 Annual Report 2014.Docx 17 November 2015 PUGET SOUND ENERGY Baker River Hydroelectric Project Page 15
3.1.3.7 Sockeye Fry Production and Distribution (2014 brood year) It is expected that the Spawning Beach 4 segments will produce roughly 2 million sockeye fry , and that the artificial incubation program will produce roughly 5 million fry from the 2014 brood year. The WDFW informed PSE of approximate distributions of those 7 million fry in a sockeye fry distribution plan for the resulting 2014 brood year production of sockeye, directing 4.65 million fry into Baker Lake and 2 million into Lake Shannon and retaining 350,000 (with adiopose mark) for extended rearing for fall par release into Baker Lake of which 5,000 raised to smolt for passage studies (Baker River Co-Managers, 2014).
3.1.3.8 Yearly Sockeye Fry Propagation Sockeye fry recruitment to the reservoirs since 1957 has come from four constructed spawning beaches, hatchery production using artificial incubation, and limited natural spawning. Figure 6 shows the collection of eggs for the sockeye artificial incubation program. Figure 7 shows the trend of fry releases from spawning beaches and hatchery production. Levels have increased significantly since the new Baker Hatchery began operation.
Table 4 lists the most recent sockeye fry production from brood years dating back to 1999. PSE implemented a study approach April 2013 to monitor the numerical response to increased fry production. The approach to monitoring includes an annual accounting of the empirical data in this table. This includes fry production, plus subsequent smolts counted.
During 2014, the total yearly sockeye fry propagation from the Baker Hatchery was 6,590,248, making 2014 the 5th consecutive year in which fry production exceeded 5 million. The total was a two-fold increase from levels prior to 2008, and the highest in 56 years of production from Baker River facilities.
Figure 6. Yearly sockeye artificial incubation program.

Fish Propagation 2014 Annual Report Activity Report
BAK SA 101 Annual Report 2014.Docx 17 November 2015 PUGET SOUND ENERGY Baker River Hydroelectric Project Page 16
Table 4. Sockeye broodstock and fry production from Baker fish propagation facilities, plus subsequent smolts counted for each brood year from 1999 through 2014.
Brood year
Spawning beach spawned females
Counted fry out of spawning beach #4
Estimated fry from beach #3
AI spawned females
Egg take for AI
Fry produced from AI
Fry to Baker Lake
Fry to Lake Shannon
Smolts from Baker Lakea
Smolts from Lake Shannona
1999 1,393 1,856,639 222,000 2,078,639 194,537 418 2000 1,770 3,281,896 323,000 3,604,896 140,021 9,460 2001 1,017 1,316,042 227,000 1,543,042 70,414 412 2002 1,677 1,537,065 323,000 228 693,305 663,950 2,259,540 264,475 166,698 4,122 2003 1,854 2,089,175 308,000 348 734,262 758,944 2,971,059 185,060 113,767 3,316 2004 1,662 1,638,138 239,000 438 1,212,800 1,188,524 2,801,902 263,760 284,494 4,810 2005 971 1,656,858 0 490 1,157,300 1,134,742 2,791,600 0 117,014 41,250 2006 1,807 1,990,183 0 475 1,246,190 1,224,356 2,914,539 300,000 252,416 588 2007 850 1,892,677 0 298 953,718 921,940 2,814,617 0 335,353 7,588 2008 1,161 1,326,437 0 330 993,454 965,506 2,291,943 0 435,297 1,290 2009 1,713 3,511,564 0 465 1,713,599 1,596,630 5,108,194 0 203,550 5,958 2010 0 0 0 1,637 5,199,858 5,089,860 4,139,680 950,180 452,612 17,307 2011 589 1,158,025 0 1,690 5,072,919 4,368,735 3,558,264 2,000,010 577,085 181,234 2012 1,415 2,100,202 0 1,298 3,375,845 3,262,645 3,836,878 1,349,520 564,432 375,447 2013 1,013 1,828,946 NA 2,124 4,893,032 4,761,302 3,775,057 1,948,131 TBD TBD 2014 887 TBD NA 1,846 5,325,011 TBD TBD TBD TBD TBD
a Counts include all sockeye outmigrants (wild produced and Baker propagation facilities) but do not reflect smolt production by brood year because the majority of smolts outmigrate at age 1.

Fish Propagation 2014 Annual Report Activity Report
BAK SA 101 Annual Report 2014.Docx 17 November 2015 PUGET SOUND ENERGY Baker River Hydroelectric Project Page 17
Figure 7. Yearly number of sockeye fry released into the reservoirs
from Baker fish propagation programs, brood years 1957-2013 (release years 1958-2014).
3.1.3.9 Coho Supplementation program The coho supplementation program continues to produce juvenile coho from the stock of naturally-reproduced wild origin coho adults in the Baker River system for use in studies and for the ongoing fish propagation and enhancement objectives determined by the Fish Co-Managers. Approximately 93,406 fry were allocated for extended rearing and release as smolts in the spring of 2014 to continue migration experiments and contribute to adult returns. These fry, reared in raceways at Upper Baker, resulted in a total of 91,234 yearlings. Of these fish, 3,298 (21 fpp) were released into net pens in Lake Shannon and 1,991 (24 fpp) were released into net pens in Baker Lake to be used for juvenile passage biological studies. The remaining 85,945 yearling fish (22 fpp) were released below both dams into the Baker River stress relief ponds (SRP) in April 2014 to contribute to future fall adult returns. All fish were raised to appropriate sizes and released on schedule (table 5).

Fish Propagation 2014 Annual Report Activity Report
BAK SA 101 Annual Report 2014.Docx 17 November 2015 PUGET SOUND ENERGY Baker River Hydroelectric Project Page 18
Table 5. Salmon releases from Baker River fish propagation facilities, 2014.
Release Date Brood Year Species Stock Number
Size (fish/lb.)
Pounds Planted Release Site
March 13, 2014 2012 sockeye Baker 6,281 20 315 Shannon Pens March 13, 2014 2012 sockeye Baker 1,997 18 111 Baker Pens March 19, 2014 2012 coho Baker 1,991 24 84 Baker Pens March 20, 2014 2012 coho Baker 3,298 21 155 Shannon Pens April 30, 2014 2012 coho Baker 85,945 22 3,997 SRP June 11, 2014 2013 coho Baker 156,390 247 633 Lake Shannon Nov 5, 2014 2013 sockeye Baker 109,637 32 3,448 Baker Lake Nov 6, 2014 2013 sockeye Baker 185,519 35 5,359 Baker Lake Total Releases 551,058 14,102
3.1.3.10 Coho Adult Returns (2014 Brood Year) A total of 2,945 coho adults returned to the Baker River trap in 2014, of which 197 were removed from the trap for the supplementation program. These fish were held at the Baker hatchery until sexually mature and then spawned. The coded wire tags were recovered from their carcasses for stock identification.
3.1.3.11 Coho Egg and Fry Production (2013 Brood Year) For the 2013 brood year (2014 fry production), 100 Coho females were spawned and an estimated total of 233,919 eyed eggs were incubated at the hatchery.
An inventory of fry based on eyed egg weight samples less ponding loss provided a count of 223,935. Approximately 65,000 fry will be allocated to the extended rearing program (the program goal is 60,000), resulting in a surplus of Coho fry. The 156,390 surplus fry (~200 fpp) were released into Lake Shannon at Sulphur Creek in June 2014.
The estimated 65,000 fry allocated for extended rearing will be released as yearlings (~20 fpp) in the spring of 2015 to continue migration experiments and contribute to adult returns. An additional 6,500 will be used for juvenile passage biological studies. All of these fish reared at the Baker hatchery will be used for the annual mark-recapture (reservoir migration response) experiments. The remaining 58,500 yearling fish will be released into the Baker River stress relief ponds below both dams to contribute to future fall returns. A salmon rearing inventory is shown in table 6.

Fish Propagation 2014 Annual Report Activity Report
BAK SA 101 Annual Report 2014.Docx 17 November 2015 PUGET SOUND ENERGY Baker River Hydroelectric Project Page 19
Table 6. Salmon rearing inventory at fish propagation facilities as of December 31, 2014.
Planned Release Date
Brood Year Species Program Stock Inventory
Planned Release (fish/lb.)
Planned Release Site
March 2015 2013 Sockeye Extended Rearing Baker 9,986 20 Baker/
Shannon
May 2015 2014 Coho Extended Rearing Baker 63,986 20
Baker/ Shannon/
Baker River
3.1.3.12 Rainbow Trout Production WDFW provided 19,249 rainbow trout fingerlings (2013 brood year) for the rearing program in July 2014. These fish will be released in 2015. The rearing program contributes catchable-sized rainbow trout for local recreational fishing, and for derbies. PSE supplies labor, rearing facilities, and food until the last release. During 2014, 22,421 catchable fish were released. Approximately 18,103 rainbow trout (from the 2012 brood year) were released into Depression Lake for recreational fishing, and 2,515 rainbow trout were released into Grandy Lake as an expansion of this recreational fishing program. 1,700 trout were allocated to the Upper Skagit Indian Tribe, and 103 for a local community fishing derby. All fish were raised to appropriate target sizes averaging less than 2 fpp, and were released on schedule.
Figure 8 shows the Baker fish hatchery in operation for juvenile fish rearing for the 20,000 pound capacity production program directed by the Fish Co-managers’ annual fish production goals.
Figure 8. Juvenile fish rearing facilities in use for sockeye and coho salmon and rainbow trout. Raceways and rectangular and circular tanks are provided
for program flexibility and multiple species.
Fish Propagation 2014 Annual Report Activity Report
BAK SA 101 Annual Report 2014.Docx 17 November 2015 PUGET SOUND ENERGY Baker River Hydroelectric Project Page 20
3.1.3.13 Facilities Operations Monitoring – Repairs to Water Supply Landslide activity over the years has at times adversely affected the water intake and supply system for the spawning beach and hatchery. Because of the potential for soil slippage at the springs supplying water to the fish production facilities, turbidity events are monitored by alarm systems. Past events have resulted in temporary turbidity excursions in the water supply. PSE has responded to these by switching to an alternate (domestic) water supply until the primary supply could be restored. To address these events, new sand separators were installed as part of the Baker fish hatchery renovation. These sand separators protect the water supply by removing sediment both under normal conditions and following a landslide event. However, landslides in December 2012 resulted in large amounts of sediment infiltrating the water supply and overwhelming the sand separators.
PSE mobilized quickly to respond to the December 2012 landslide and temporarily restored water supply by removing rip rap (large boulders), cleaning and removing the sediment buildup, and replacing the riprap back into the spring channel while monitoring for turbidity. Juvenile fish in the hatchery were relocated to offsite locations, including the stress relief ponds at Lower Baker. Only a few adult sockeye broodstock remained and were spawned, and adult coho broodstock were connected to the backup water system. Incubating sockeye and coho eggs already on the domestic water supply remained on the back-up water supply system.
PSE began planning for permanent repairs to begin in June 2013 during the normal annual hatchery maintenance shutdown in preparation for the next brood cycle, so that it would have the least effect to fish. June is also part of the drier season, making new landslides unlikely during the repairs.
Making these repairs to the hatchery headworks required PSE to review conditions, consult with the USDA-FS and the ARG, and then plan and initiate repairs following USDA-FS approval of planned work. PSE designed a repair method employing a graded filter and geotextile filter fabric at the Sulphur Springs water supply intake to control further sediment infusion. The filter materials were selected to cap the hatchery water intake area, protecting it from sliding materials in the event of a new landslide. The repair method was approved by the USDA-FS on May 28, 2013 (USDA-FS, 2013a) and PSE immediately initiated construction work based on the approved design (PSE, 2013a).
Upon exposing the underlying rebar intake pipe structures in the spring flow path, PSE discovered these to be damaged and replaced or refurbished them. Substantial equipment was used throughout construction. In compliance with best management practices, PSE installed straw wattles for erosion control, monitored turbidity, and stopped work when measured turbidities exceeded relevant background criteria, resuming when the condition was no longer present. The repair project was completed on schedule on June 28, 2013. Water supply to the hatchery was restored on the same day, ahead of delivery of the earliest returns of fish for spawning. The completed repair work is intended as a permanent solution for protecting the water supply from sliding material.

Fish Propagation 2014 Annual Report Activity Report
BAK SA 101 Annual Report 2014.Docx 17 November 2015 PUGET SOUND ENERGY Baker River Hydroelectric Project Page 21
The intake consists of cylindrical “pipes” constructed with steel bars that are buried in riprap. The riprap is covered with a graded filter consisting of quarry spalls, ballast, gravel, and a woven geotextile. For years, the lack of a graded filter had subjected the intake to sedimentation. The reconstructed intake now collects and conveys spring water to a headworks box free from sediment.
PSE is currently working with the USDA-FS and WDFW to implement long-term erosion protection measures that would stabilize the repairs and reduce erosion. Temporary erosion control measures were installed following the unusually large amount of surface runoff that occurred during heavy November 2013 rainstorms. There has not been any additional erosion since these measures were put in place. Even though one rain event produced 3.5 inches; the spawning beach and hatchery water supply remained clear and protected. The objective of the long-term erosion protection measures is to prevent surface erosion in the construction area, thus protecting the repairs to the headworks completed in June 2013 and minimizing sediment transfer to Sulphur Creek. PSE is discussing longer-term erosion control measures with the USDA-FS and WDFW to confirm the design approach and details, and implementation is scheduled for the summer 2015.
3.1.3.14 Empirically-Derived Production Limits for Sockeye Salmon PSE implemented a study approach in April 2013 for monitoring adult returns and the size and number of outmigrating smolts to provide feedback on basin sockeye production limits (PSE, 2013). PSE developed the study approach in collaboration with the ARG to establish the number, type, and frequency of adult and smolt data collection efforts (PSE collects juvenile sockeye size information at the juvenile downstream fish passage facilities).
PSE submitted a summary to the ARG of empirical data monitored during the 2014 outmigration period, both numerical and morphological, on December 19, 2014. Numbers of fry, numbers of outmigrating smolts, and numbers of returning adult sockeye were provided in tables. A record 939,879 sockeye smolts were counted in 2014. PSE presented the length and weight of smolts and condition of smolts (k-factor) in graphs. In 2014, the Baker Lake age 1 average size was 107 mm, and the average condition was 0.91. In Lake Shannon, age 1 average size was 120 mm, and average condition was 0.92. Figure 9 shows Baker Lake age 1 average size from 2010–2014. Figure 10 shows Baker Lake age 1 average condition factor from 2010–2014. The complete data summary presentation is attached to this report (see section 5.0, “Supporting Documents”).

Fish Propagation 2014 Annual Report Activity Report
BAK SA 101 Annual Report 2014.Docx 17 November 2015 PUGET SOUND ENERGY Baker River Hydroelectric Project Page 22
Figure 9. Average fork length for Baker Lake age 1 sockeye smolts (2010–2014).
Figure 10. Average condition factor (K) for Baker Lake age 1 sockeye smolts (2010–2014).
3.1.3.15 Fry Release Site Technical Working Group In a letter dated December 9, 2013, the Fish Co-managers responded to PSE’s fry release information and identification of alternate release sites that was presented at the June 13, 2013 ARG meeting (Baker River Co-managers, 2013). The Fish Co-managers’ letter clarified their technical evaluation of current fry release locations that has led to their objectives and policy for effective fry planting. The Fish Co-managers and PSE convened a technical working group to identify options and establish a path forward to resolving the issues related to the number of usable release sites. The technical working
90
95
100
105
110
115
120
125
130
2010 2011 2012 2013 2014
Fork
leng
th (m
m)
Average Length - "Age 1" (2 Wk May - 2 Wk June) - UPPER BAKER
114 mm 109 mm 108 mm 106 mm 107 mm
0.80
0.85
0.90
0.95
1.00
1.05
2010 2011 2012 2013 2014
Con
ditio
n fa
ctor
(K)
Average Condition factor - "Age 1" (2 Wk May - 2 Wk June) - UPPER BAKER
0.95 0.94 0.92 0.91 0.91
Fish Propagation 2014 Annual Report Activity Report
BAK SA 101 Annual Report 2014.Docx 17 November 2015 PUGET SOUND ENERGY Baker River Hydroelectric Project Page 23
group met three times during 2014 (April 3, 2014, June 30, 2014 and September 24, 2014) and had important discussions, including brainstorming options, identifying areas to research, and considering potential funding mechanisms. The group is in the midst of working through various issues specific to the options, including potential funding sources, permitting options, and contingency plans. The meetings have produced important discussions and a good understanding of each stakeholder’s interests. These meetings will continue during 2015.
3.1.3.16 Request to Install Chillers In a letter dated October 8, 2013, the Fish Co-managers made a request to PSE to purchase and install a water chiller system at the Baker fish hatchery, which was completed in 2011 (WDFW, 2013). The request was made for two main reasons: (1) slow egg development during incubation for some early portions of the hatchery production, and (2) to enable the application of otolith marks to fish stocks in order to assist the Fish Co-managers in making ongoing management decisions for fish propagation. After reviewing the history of the hatchery renovation, the license obligations, and ultimately the need for chilled water at the hatchery for fish propagation, PSE responded to the request in a letter dated April 4, 2014, indicating that PSE had fulfilled its obligation under SA 101(b) to construct additional fish culture facilities, and is not obligated to fund a chilled water system for management activities. The Fish Co-managers provided a follow-up response April 15, 2014, calling attention to their interpretation of PSE’s much broader commitment under the full context of SA 101. PSE reviewed the first response to the Fish Co-managers, and in a July 28, 2014 letter outlined the company’s basis for declining the request to fund a chilled water system at the Baker fish hatchery. PSE suggested the use of adaptive management funds already in the license as one potential funding mechanism for the chilled water system. The issue remains an area of disagreement between the Fish Co-managers and PSE.
3.1.3.17 Nutrient Enhancement Fund SA 101(f) The license requires PSE to make funding available for the implementation of a reservoir nutrient enhancement program. Annual funding prescribed by SA 101(f) for nutrient enhancement was made available in 2012 (the first year of deposit), and will accrue at $60,000 per year (escalated from 2006 dollars; see section 4.1) each year from the date of license issuance. On June 12, 2013, PSE met with the Fish Co-managers to discuss a mechanism for distributing the fund. During 2014, the Fish Co-managers and PSE have been developing a draft memorandum regarding the procedures to be followed in managing the fund, including fund requests, fund disbursement, and annual reporting, as well as a mechanism for returning unspent funds to the Habitat Enhancement, Restoration, and Conservation (HERC) fund. Completion of the memorandum is expected in 2015.
3.1.4 SA 101 d – Maintain, Then Restore Natural Conditions at Spawning Beaches 1, 2, and 3 Before the renovation and construction of the Baker fish hatchery was complete, PSE initiated discussion with the USDA-FS to develop a decommissioning plan that outlines decommissioning procedures for the site of Sockeye Spawning Beaches 1, 2, and 3.

Fish Propagation 2014 Annual Report Activity Report
BAK SA 101 Annual Report 2014.Docx 17 November 2015 PUGET SOUND ENERGY Baker River Hydroelectric Project Page 24
Actual decommissioning of the Channel Creek site will occur after the USDA-FS (the land owner) authorizes decommissioning. PSE consulted with the USDA-FS towards an understanding of the decommissioning procedures. PSE and the USDA-FS sought input from the ARG and the Cultural Resources Advisory Group (CRAG) at meetings. The consultation process resulted in a USDA-FS scope-of-work document (USDA-FS, 2011), an agreement on a general approach that considered the input of the ARG and CRAG, and the development of conceptual design options presented to the ARG in June 2012, followed by the ARG’s selection of restoration “Alternative 5”, in July 2012.
The following restoration goals for the decommissioning of the site were determined during a workshop with PSE, and the ARG, held on June 26, 2012 (PSE, 2012).
• Salmon Spawning Habitat: Provide spawning habitat for adult salmon throughout the existing natural channel in the project area (to the most practicable extent).
• Maintain Pond Hydrology: Maintain the open water component of the upstream pond by implementing some type of downstream grade control structure (or similar) to help maintain pond water elevations.
• Overflow Swale: Provide an overflow swale to direct overflows from the upstream pond to the downstream pond and channel. This will prevent water from flowing overland to the south away from the channel and pond network.
The following site decommissioning goals were identified by the USDA-FS.
• Remove Infrastructure: All surface and subsurface infrastructure constructed and installed as part of the spawning beaches will be removed and hauled off-site for appropriate disposal or recycle.
• Decommission Gravel Surfacing: The gravel surfacing within the site will be decommissioned to USFS standards (roadway decommissioning may involve removal of the gravel surface and the sub-base scarified to a depth of approximately 1 foot).
• Re-grade Site: Upon removal of the site facilities (surface and subsurface), the site will be re-graded to emulate natural, pre-facility grades and contours.
• Cut and Fill Volume: Decommissioning will generate cut and fill. To the extent practicable, cuts and fills will be balanced on-site to minimize or eliminate the need for the import and export of fill materials.
“Alternative 5”, which meets these goals, includes enhancement along the existing Channel Creek alignment with grade control (large woody debris structures) placed in the channel to help maintain the water surface elevations in the upstream pond. In addition, an overflow swale will connect the upstream pond to the downstream pond to help keep water in the existing channel and pond complex. The overflow swale will provide a flow pathway during higher-flow drainage events, and if beaver activity in the main channel creates backwater conditions (with the potential for overflow) in the pond.
PSE provided an alternatives assessment report to the ARG in August 2012 as documentation for moving forward with the “Alternative 5” design. PSE developed a Channel Creek Site Decommissioning Plan that outlines the progress that PSE has made in planning for decommissioning and the procedures for decommissioning based on the “Alternative 5” design. Following ARG review, PSE provided the ARG with an updated plan including ARG comments and PSE responses (December 2012). PSE finalized the

Fish Propagation 2014 Annual Report Activity Report
BAK SA 101 Annual Report 2014.Docx 17 November 2015 PUGET SOUND ENERGY Baker River Hydroelectric Project Page 25
design with a plan set dated April 18, 2013 (Anchor QEA, 2013). PSE received documentation (“Notice to Proceed”) confirming that the USDA-FS had completed its review and approved the decommissioning (USDA-FS, 2013).
Construction began on July 16, 2013 and all in-water work was completed on August 9, 2013. All five LWD structures were set and man-made objects were removed from the upper pond and creek. Demolition of Beach 1 commence first out the three beaches. Asbestos abatement in Beach 2 began August 26th and was completed in about 1 week. Final grading of the site was completed by the end of December 2013. Interim progress updates were provided to the ARG at meetings in June and September 2013, and in January 2014. Re-vegetation was completed on approximately 50% of the site. Efforts were suspended until 2014 due to issues with frozen ground. The site was stabilized for the winter, and modifications to the LWD structures that were requested by the USDA-FS were scheduled for mid-July 2014. The remaining re-vegetation work was scheduled for the fall of 2014, along with the completion of other remaining punch list items. The USDA-FS provided a punch list of construction modifications it would require for completion, which included modifications to correct intended functions of several of the LWD structures during the next allowable in-water work window (July-August 2014), and hence concurred with a schedule extension to complete the decommissioning in the fall of 2014.
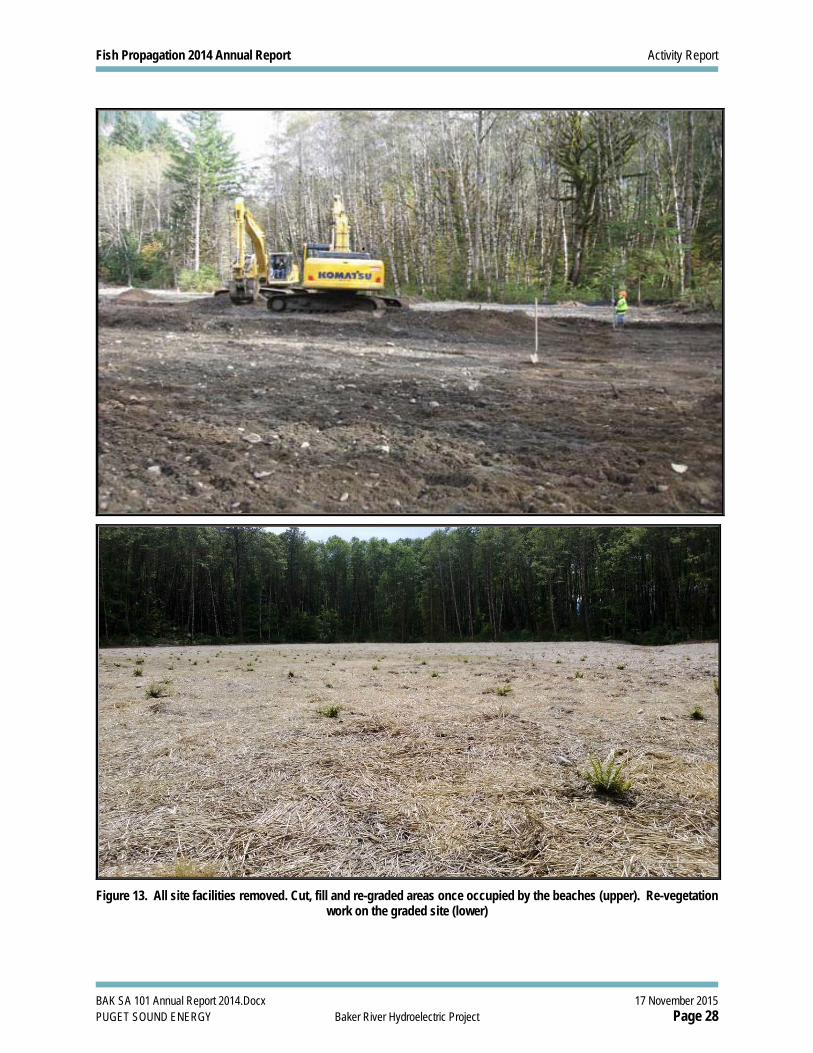
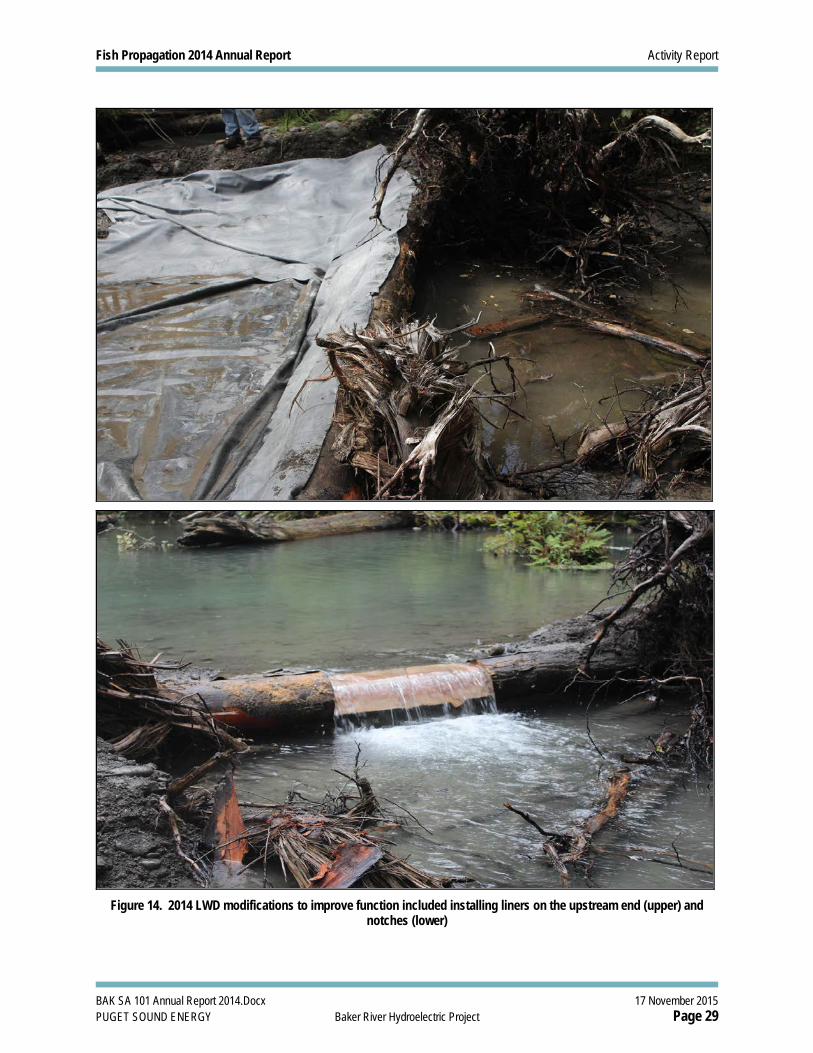
The decommissioning project per the plan and required modifications outlined in the final USFS construction punch list was completed by the end of 2014. Modifications to the LWD installations to improve their function included notching the LWD structures to assist fish passage, lining the upstream end to prevent undermining, and installing a roughened channel between LWD structures 3 and 4. That work was completed in August 2014 and those structures are functioning very well. Re-vegetation on the site resumed in October and was completed in November 2014. A walk through of the site to review all finished work with the USDA-FS was conducted, final punch list items were identified and then completed in December 2014. Figures 11-21 show the construction, LWD modifications, re-vegetation, final completion and original plans.

Fish Propagation 2014 Annual Report Activity Report
BAK SA 101 Annual Report 2014.Docx 17 November 2015 PUGET SOUND ENERGY Baker River Hydroelectric Project Page 26
Figure 11. Five LWD structures were installed in the main channel alignment during July and August 2013 to help
maintain pond hydrology.
Fish Propagation 2014 Annual Report Activity Report
BAK SA 101 Annual Report 2014.Docx 17 November 2015 PUGET SOUND ENERGY Baker River Hydroelectric Project Page 27
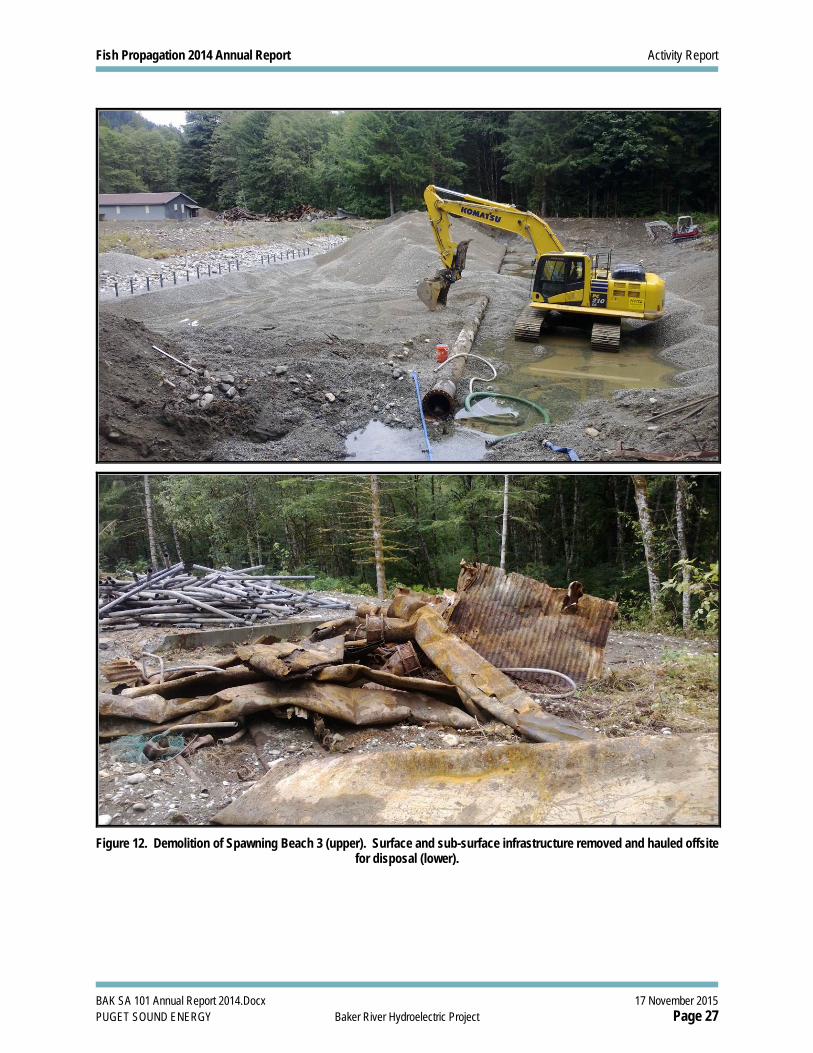
Figure 12. Demolition of Spawning Beach 3 (upper). Surface and sub-surface infrastructure removed and hauled offsite
for disposal (lower).
Fish Propagation 2014 Annual Report Activity Report
BAK SA 101 Annual Report 2014.Docx 17 November 2015 PUGET SOUND ENERGY Baker River Hydroelectric Project Page 28
Figure 13. All site facilities removed. Cut, fill and re-graded areas once occupied by the beaches (upper). Re-vegetation
work on the graded site (lower)
Fish Propagation 2014 Annual Report Activity Report
BAK SA 101 Annual Report 2014.Docx 17 November 2015 PUGET SOUND ENERGY Baker River Hydroelectric Project Page 29
Figure 14. 2014 LWD modifications to improve function included installing liners on the upstream end (upper) and
notches (lower)

Fish Propagation 2014 Annual Report Activity Report
BAK SA 101 Annual Report 2014.Docx 17 November 2015 PUGET SOUND ENERGY Baker River Hydroelectric Project Page 30
Figure 15. 2014 LWD modifications included adding a roughen channel between LWD structures 4 and 3.

Fish Propagation 2014 Annual Report Activity Report
BAK SA 101 Annual Report 2014.Docx 17 November 2015 PUGET SOUND ENERGY Baker River Hydroelectric Project Page 31
Figure 16. 2014 re-vegetation and mulch around the LWD structures.

Fish Propagation 2014 Annual Report Activity Report
BAK SA 101 Annual Report 2014.Docx 17 November 2015 PUGET SOUND ENERGY Baker River Hydroelectric Project Page 32
Figure 17. 2014 re-vegetation and mulch along the former access road (upper) and along the floodplain swale (lower)

Fish Propagation 2014 Annual Report Activity Report
BAK SA 101 Annual Report 2014.Docx 17 November 2015 PUGET SOUND ENERGY Baker River Hydroelectric Project Page 33
Figure 18. Mulch placement along the LWD structures.

Fish Propagation 2014 Annual Report Activity Report
BAK SA 101 Annual Report 2014.Docx 17 November 2015 PUGET SOUND ENERGY Baker River Hydroelectric Project Page 34
Figure 19. Photos taken at completion in December 2014, following a site walk with the USDA-FS.

Fish Propagation 2014 Annual Report Activity Report
BAK SA 101 Annual Report 2014.Docx 17 November 2015 PUGET SOUND ENERGY Baker River Hydroelectric Project Page 35
Figure 20. Spawning Beaches 1, 2, and 3 before decommissioning. (PSE, 2013)

Fish Propagation 2014 Annual Report Activity Report
BAK SA 101 Annual Report 2014.Docx 17 November 2015 PUGET SOUND ENERGY Baker River Hydroelectric Project Page 36
Figure 21. Conditions at completion of decommissioning (April 18, 2013 design), showing infrastructure removed, site regrading,
large woody debris structures in the channel alignment, and an overflow swale. (PSE, 2013)

Fish Propagation 2014 Annual Report Activity Report
BAK SA 101 Annual Report 2014.Docx 17 November 2015 PUGET SOUND ENERGY Baker River Hydroelectric Project Page 37
3.1.5 SA 101 – Fish Propagation Facility Operation Audit Financial accounting. This information is reported in section 4.0, “Accounting.”
Fish handling and disease management operations. The results of the propagation and enhancement programs are reported in section 3.1.3. This information includes operation of the sockeye salmon spawning beaches, loading results, sockeye AI program, sockeye egg & fry production, sockeye fry disposition, coho supplementation, coho returns, coho egg and fry production, rainbow trout production and monitoring of the facility water supply. The goal for every hatchery program is to provide optimum rearing conditions to produce healthy fish. Fish production goals were met for healthy fish (such as numbers of fish, growth, and release) for this reporting period. “Best management practices” were followed. Disease management procedures for IHN were in place. IHN incidents were contained to small batches of fish during this reporting period. Preventative treatments were applied when necessary. PSE works closely with the Fish Co-Managers’ fish health staff, who determine when and what types of treatments are warranted.
Hazardous materials handling. PSE identified materials of concern at the decommissioning site of Spawning Beaches 1, 2, and 3 to be associated with the removal of any structures, and it was determined that these include underground asbestos cement piping, other asbestos containing materials, lead-based painted materials, and sub-surface soils affected by petroleum. PSE is responsible for its removal, handling, and disposal at a location approved by PSE during decommissioning. During the decommissioning of this site, PSE worked with contractors to ensure that all hazardous materials were removed from the site and disposed of properly.
Spill prevention, control, and countermeasures (SPCC) compliance. PSE, per the FERC license, developed an SPCC plan for the project. This plan was submitted to the FERC prior to construction, and compliance is mandatory. There have been no incidents. Several PSE documents currently address the management of water quality protection at the Baker Project. These are the SPCC Plan, the Upper Baker Generation Plan (GeoEngineers, 2008a), the Construction Stormwater Pollution Prevention Plan for the Upper Baker River hatchery (GeoEngineers, 2008), and the SA 401 Water Quality Protection Plan (PSE, 2009).
3.2 Design and Planning Activities Installation of temporary erosion control measures for protecting the repairs to the hatchery headworks water supply. Long-term erosion control measures are currently being developed.
3.3 Documents Submitted The 2013 annual report that covers the SA 101 reporting period of June 1, 2013 through May 31, 2014, as prescribed by SA 102, was submitted to the ARG for comment on October 28, 2014. Comments and responses from the ARG review have been included in the revised 2013 report submitted to the FERC on December 16, 2014 under the May 26, 2010 Order Modifying and Approving Fish Propagation Facilities Plan, Settlement Agreement Article 101.

Fish Propagation 2014 Annual Report Accounting
BAK SA 101 Annual Report 2014.Docx 17 November 2015 PUGET SOUND ENERGY Baker River Hydroelectric Project Page 38
Section 5.0 lists additional documents attached with this 2014 annual report.
4.0 Accounting Puget Sound Energy, pursuant to settlement agreement articles 102, 201, 301, 501, and 602, is required to provide an annual summary of expenditures made during the preceding year, as well as an accounting of funding expenditures, any interest earned, disbursements made as required by any article, and adjustments for inflation. This section provides an accounting of all expenditures made during the reporting period, including pre-license expenditures such as costs incurred for early land acquisition efforts.
All disbursement adjustments and relevant calculations were determined using the guidelines provided in settlement agreement article 602.
4.1 Funding Prescribed annual funding for SA 101(f) nutrient enhancement was made available in 2012 (the first year of deposit) and will accrue at $60,000 per year each year of the date of license issuance, escalated from 2006 dollars. Annual funding is made available on the anniversary date of license issuance — October 17, 2008. The balance is reflected in the following table.
Table 7. Funds allocated to nutrient enhancement account, 2012–2014 (years one to three).
Year Amount Allocated
Amount Spent
Amount Carried Over
Interest a Remaining
(1) 2012 66,840 0 66,840 33 66,873 (2) 2013 67,262 0 134,135 67 134,202 (3) 2014 68,412 0 202,614 -- 202,614b
Total 202,514 0 202,614 100 202,614(+)b a Annually, $60,000 is allocated in October of the reporting period, escalation is applied in February, and interest is accrued the following October. b Not including interest that will be accrued in October 2015. Note: table incorporates adjustments based on the latest accounting review; rounding error may cause slight discrepancy.
4.2 Expenditures PSE budgeted to fund a contract with the WDFW to operate Sockeye Spawning Beach 4. $176,634 was spent on this contract during the reporting period. PSE budgeted for additional operations and maintenance costs for SA 101 implementation and spent $1,144,063 during the reporting period. This number represents costs attributed to continuing existing fish propagation and enhancement programs, repairs at the head works and implementation of the Fish Propagation Facilities Plan.
PSE spent $300,471 in capital costs for SA 101 implementation during the reporting period. This number represents costs attributed to completing the decommissioning of Spawning Beaches 1, 2 and 3.
The total expenditure of all funds for SA 101 during the reporting period was $1,621,168.

Fish Propagation 2014 Annual Report Supporting Documents
BAK SA 101 Annual Report 2014.Docx 17 November 2015 PUGET SOUND ENERGY Baker River Hydroelectric Project Page 39
4.3 Adjustments There were no adjustments to the funding for SA 101 during the reporting period.
5.0 Supporting Documents The following documents are attached to this report.
• Empirically-Derived Production Limits for Sockeye Salmon in the Baker River Basin, Draft data summary for SA 101(c)(2) submitted to the ARG December 19, 2014.
• Baker River Co-Managers Sockeye Fry Distribution Plan, June 2014.
6.0 References Anchor QEA. 2013. Baker Lake Spawning Beach Decommissioning, Bid Set Drawing
Submittal, prepared by Anchor, QEA, prepared for Puget Sound Energy, Bellevue, Washington. April 18, 2013.
Baker River Co-Managers. 2014. Baker River Co-Managers Sockeye Fry Distribution Plan, June 2014, email to Puget Sound Energy. June 12, 2014.
———. 2013. State and Tribal Co-manager’s Response to PSE Fry Release Information PowerPoint Presentation at the June 13, 2013 ARG Meeting, letter to Puget Sound Energy. December 9, 2013.
GeoEngineers, Inc. 2008. Construction Stormwater Pollution Prevention Plan, Upper Baker Fish Hatchery, prepared by GeoEngineers, Inc., prepared for Puget Sound Energy, Bellevue, Washington. June 2008.
———. 2008a. Spill Prevention, Control and Countermeasure Plan, Upper Baker Generation Plant, prepared for Puget Sound Energy, Bellevue, Washington. August 2008.
McMillen, M.D. 2009. Baker Fish Hatchery Renovation, 100% Final Design Documentation Report. Prepared by McMillen Engineering, LLC for Puget Sound Energy, Inc., Bellevue, Washington.
Puget Sound Energy (PSE). 2013. Empirically-Derived Production Limits for Sockeye Salmon in the Baker River Basin, Draft approach for SA 101(c)(2). April 8, 2013.
———. 2013a. Upper Baker Spawning Beach- Water Supply Intake, final 2-page plan set, Baker River Hydro Project. Puget Sound Energy, Inc., Bellevue, Washington. April 12, 2013.
———. 2012. Channel Creek Site Decommission Plan, including Aquatic Resources Group comments and PSE responses. December 19, 2012.
———. 2012a. Final Project Completion Report to FERC, Baker Fish Hatchery Renovation. Puget Sound Energy, Inc., Bellevue, Washington. October 5, 2012.
———. 2009. Final Water Quality Protection Plan, Baker River Hydroelectric Project. Puget Sound Energy, Inc., Bellevue, Washington. August 2009.
———. 2009a. Fish Propagation Facilities Plan. Puget Sound Energy. August 2009.

Fish Propagation 2014 Annual Report References
BAK SA 101 Annual Report 2014.Docx 17 November 2015 PUGET SOUND ENERGY Baker River Hydroelectric Project Page 40
WDFW (Washington Department of Fish and Wildlife). 2013. Water Chiller at Baker Sulphur Springs Facility -Article 101(b)- Baker River Hydroelectric Project- Federal Energy Regulatory Commission No. 2150, letter to Puget Sound Energy. October 30, 2013.
USDA-FS (USDA Forest Service). 2013. Notice to Proceed, Baker Project, FERC 2150, SA 101(d) Decommission Spawning Beaches 1, 2, and 3. Sedro-Woolley, Washington. May 29, 2013.
———. 2013a. Notice to Proceed, Baker Project, FERC 2150, Water Supply Intake-Upper Baker Spawning Beach., Sedro-Woolley, Washington. May 28, 2013.
———. 2011. Draft Scope of Work, Baker Project, FERC 2150, SA 101(d) Decommission Spawning Beaches., Sedro-Woolley, Washington. June 2011.