Embed Size (px)
Citation preview

Telecommunications Sector Discussion Student Investment Management Presentation
Fisher College of Business Piaoyun Xing, Tianchao Xu March 18, 2014
Agenda 1. Sector Overview 2. Business Analysis 3. Economic Analysis 4. Financial Analysis 5. Valuation Analysis 6. Recommendation
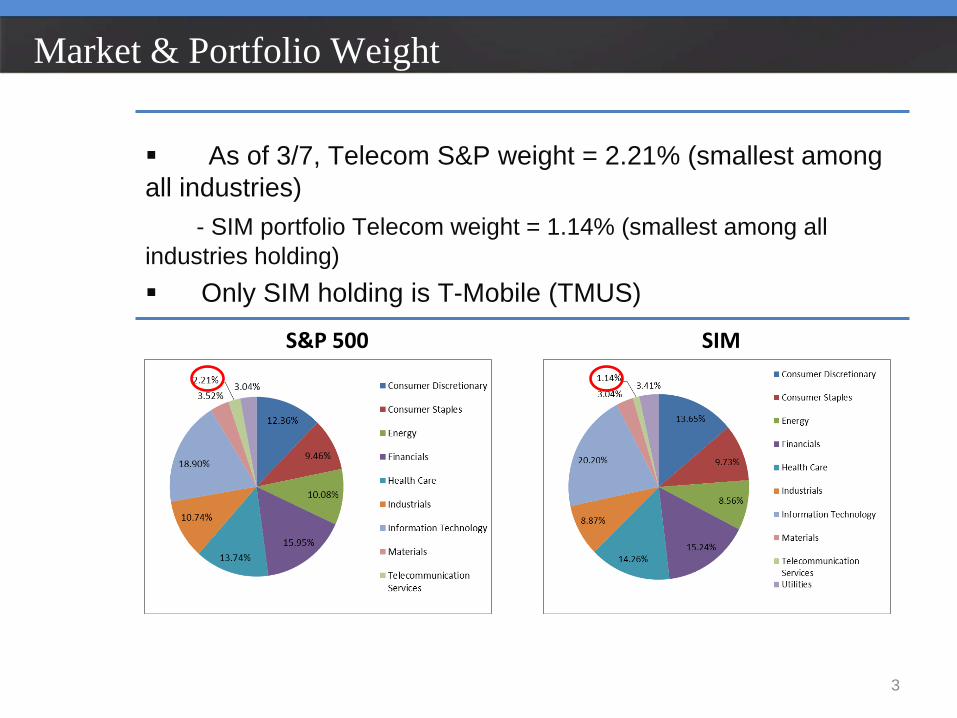
As of 3/7, Telecom S&P weight = 2.21% (smallest among all industries) - SIM portfolio Telecom weight = 1.14% (smallest among all industries holding) Only SIM holding is T-Mobile (TMUS) S&P 500 SIM
Market & Portfolio Weight
3
Telecom Service Components
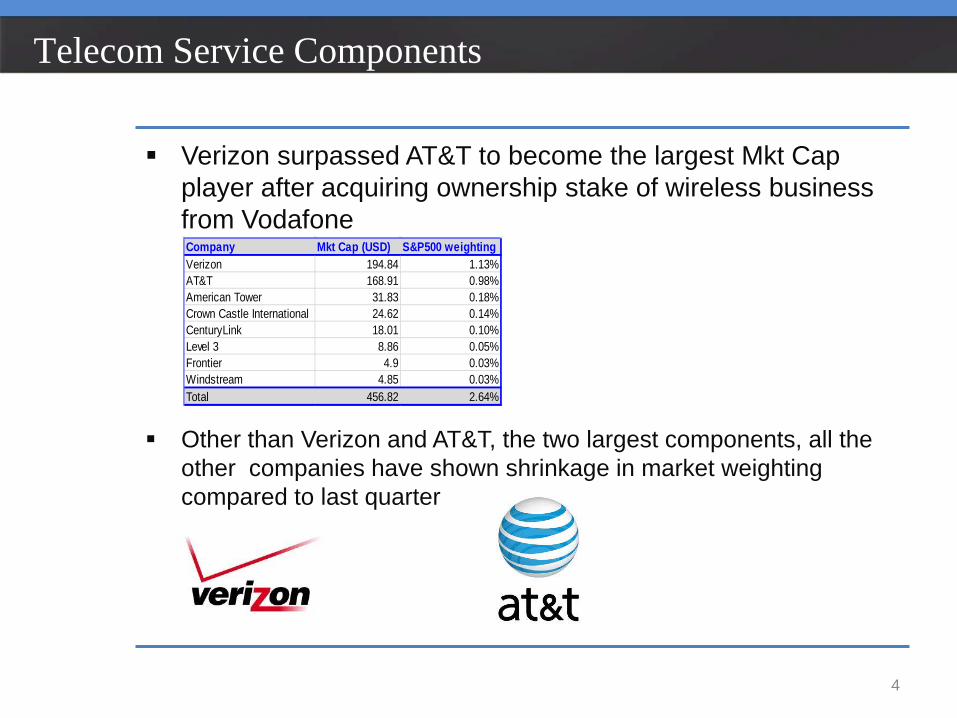
Verizon surpassed AT&T to become the largest Mkt Cap
player after acquiring ownership stake of wireless business from Vodafone
Other than Verizon and AT&T, the two largest components, all the
other companies have shown shrinkage in market weighting compared to last quarter
Company Mkt Cap (USD) S&P500 weightingVerizon 194.84 1.13%AT&T 168.91 0.98%American Tower 31.83 0.18%Crown Castle International 24.62 0.14%CenturyLink 18.01 0.10%Level 3 8.86 0.05%Frontier 4.9 0.03%Windstream 4.85 0.03%Total 456.82 2.64%
4
Telecommunication Industry Overview
Level 1 Industries: - Pure-play Wireless Telecom Svc Sprint (owned by Softbank), US Cellular, Leap Wireless - Diversified Telecom Svc
Level 2 Diversified Telecom Svc: - Integrated Telecommunications Svc: Verizon, AT&T - Alternative Carriers Qwest Communications, SBA Communications
5
Sector Performance- YTD
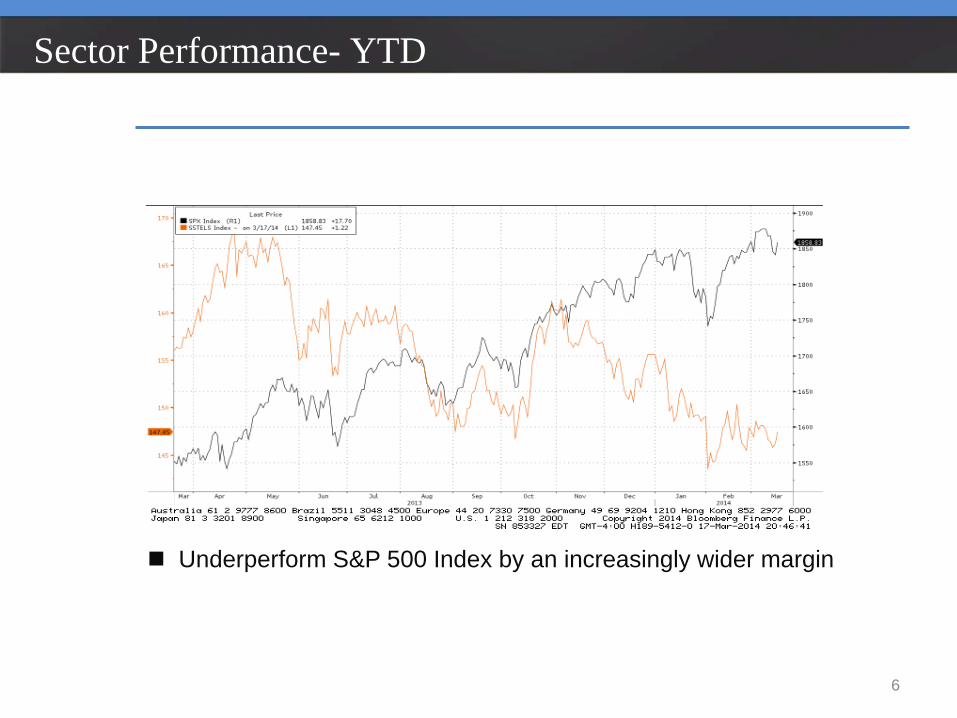
Underperform S&P 500 Index by an increasingly wider margin
6
Sector Performance- QTD
7
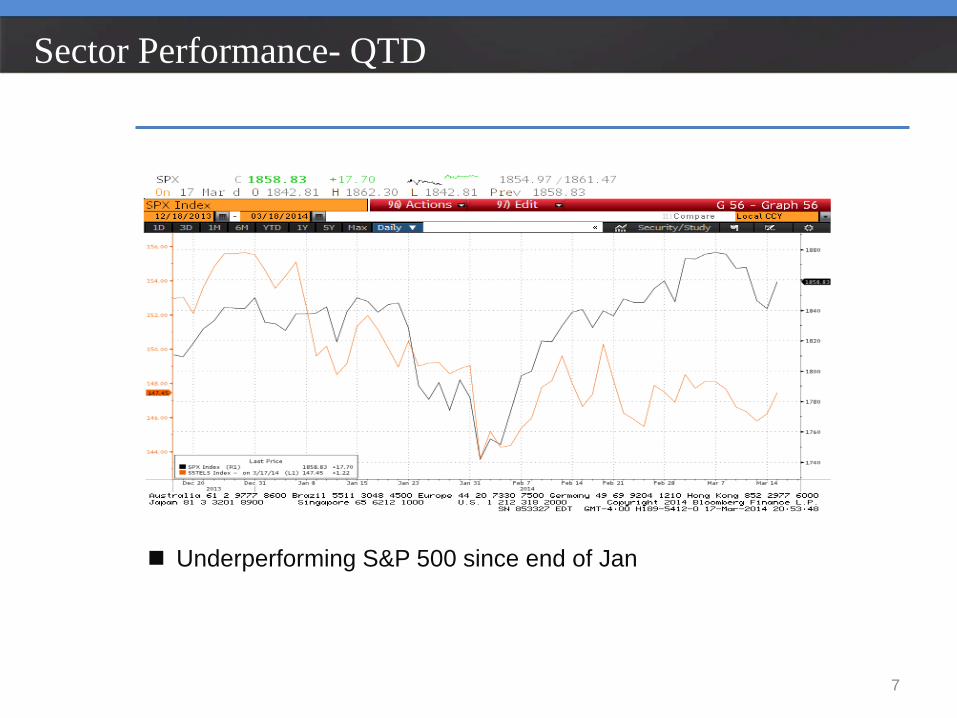
Underperforming S&P 500 since end of Jan
Agenda 1. Sector Overview 2. Business Analysis 3. Economic Analysis 4. Financial Analysis 5. Valuation Analysis 6. Recommendation
Key Industry Metrics
9
Market Penetration - subscriber base as % of the total number of potential customer
- suggest how much growth potential remains in a certain market
Average Revenue per User (ARPU) - average monthly revenue generated by each customer unit
- driven by minutes of use and value-added services
Average Revenue per Account (ARPA) - driven by data allotments and added devices to the account in shared data plan
Churn - % of customers that terminate services every month
- goal to minimize this metric
Industry Life Cycle
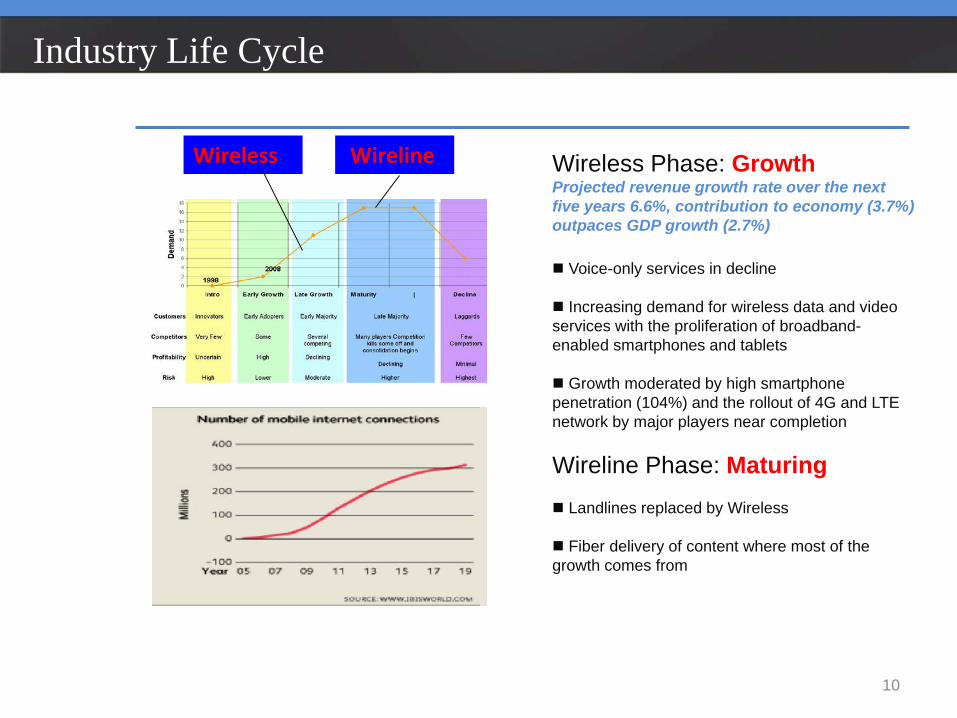
Wireline Wireless Wireless Phase: Growth Projected revenue growth rate over the next five years 6.6%, contribution to economy (3.7%) outpaces GDP growth (2.7%) Voice-only services in decline Increasing demand for wireless data and video services with the proliferation of broadband-enabled smartphones and tablets Growth moderated by high smartphone penetration (104%) and the rollout of 4G and LTE network by major players near completion
Wireline Phase: Maturing Landlines replaced by Wireless Fiber delivery of content where most of the growth comes from
10
Geographic Coverage
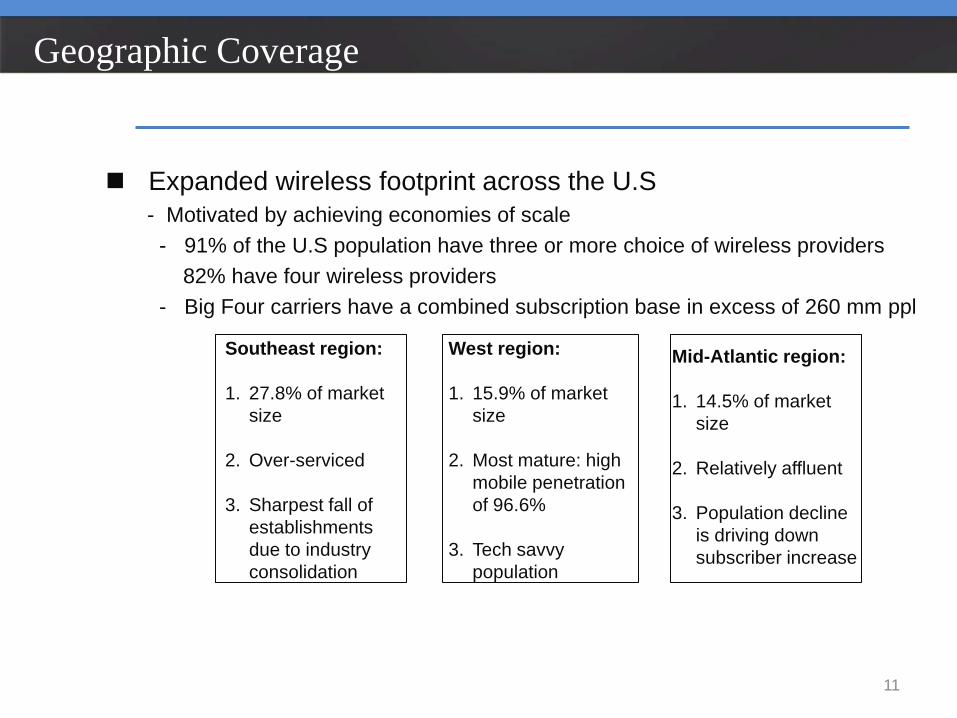
Expanded wireless footprint across the U.S - Motivated by achieving economies of scale - 91% of the U.S population have three or more choice of wireless providers 82% have four wireless providers - Big Four carriers have a combined subscription base in excess of 260 mm ppl
11
Southeast region: 1. 27.8% of market
size
2. Over-serviced
3. Sharpest fall of establishments due to industry consolidation
West region: 1. 15.9% of market
size
2. Most mature: high mobile penetration of 96.6%
3. Tech savvy population
Mid-Atlantic region: 1. 14.5% of market
size
2. Relatively affluent
3. Population decline is driving down subscriber increase
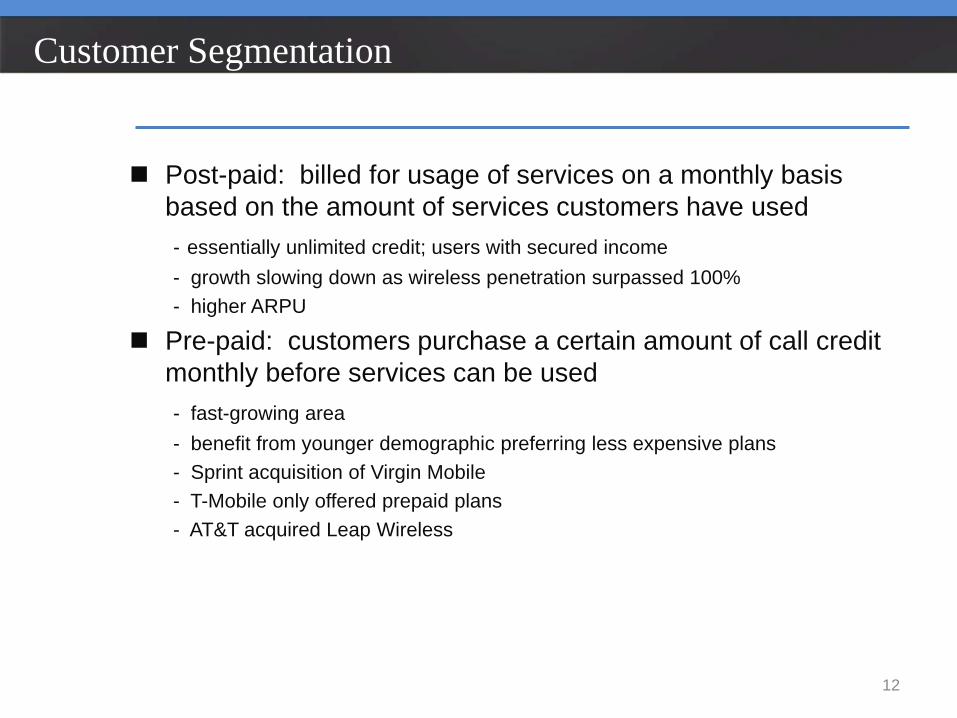
Customer Segmentation
Post-paid: billed for usage of services on a monthly basis based on the amount of services customers have used
- essentially unlimited credit; users with secured income - growth slowing down as wireless penetration surpassed 100% - higher ARPU
Pre-paid: customers purchase a certain amount of call credit monthly before services can be used
- fast-growing area - benefit from younger demographic preferring less expensive plans - Sprint acquisition of Virgin Mobile - T-Mobile only offered prepaid plans - AT&T acquired Leap Wireless
12
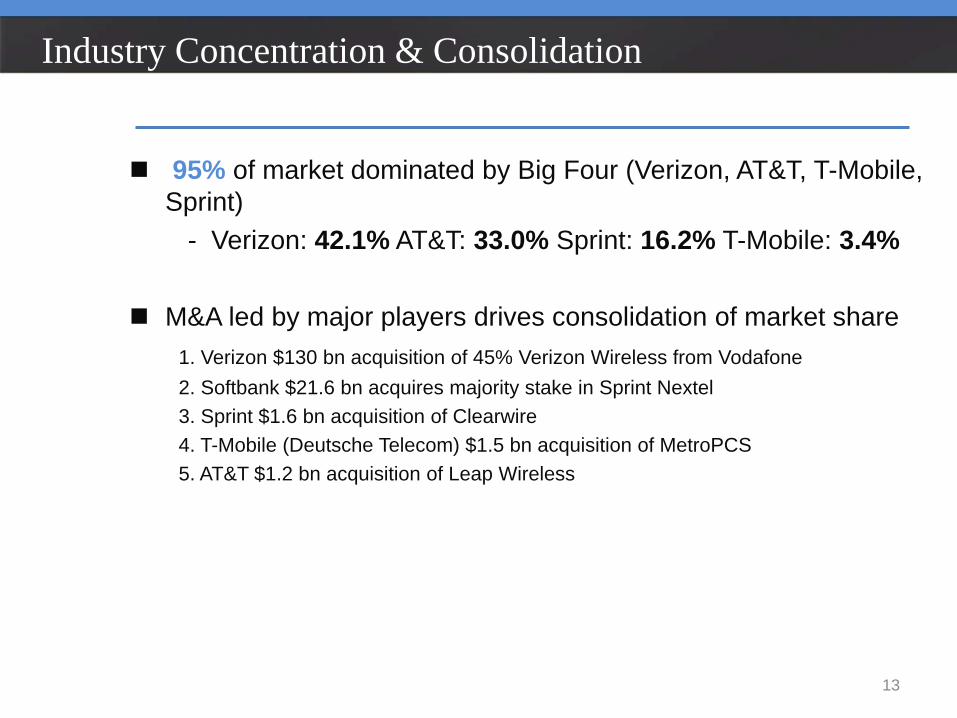
Industry Concentration & Consolidation 95% of market dominated by Big Four (Verizon, AT&T, T-Mobile,
Sprint) - Verizon: 42.1% AT&T: 33.0% Sprint: 16.2% T-Mobile: 3.4% M&A led by major players drives consolidation of market share 1. Verizon $130 bn acquisition of 45% Verizon Wireless from Vodafone 2. Softbank $21.6 bn acquires majority stake in Sprint Nextel 3. Sprint $1.6 bn acquisition of Clearwire 4. T-Mobile (Deutsche Telecom) $1.5 bn acquisition of MetroPCS 5. AT&T $1.2 bn acquisition of Leap Wireless
13
LTE- The New Wireless Standard
14
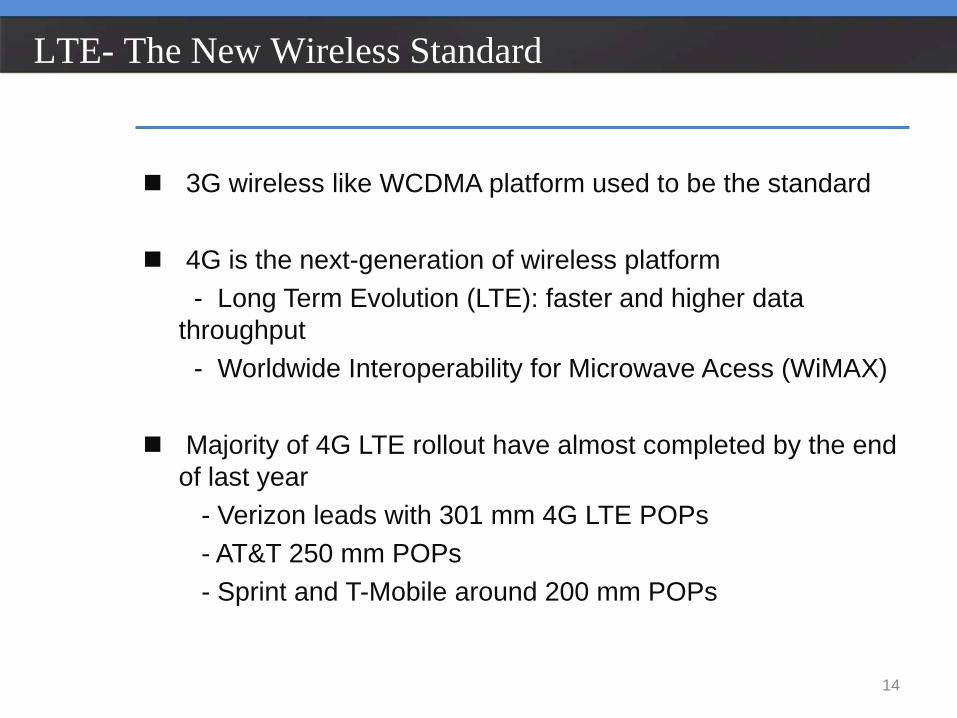
3G wireless like WCDMA platform used to be the standard 4G is the next-generation of wireless platform - Long Term Evolution (LTE): faster and higher data
throughput - Worldwide Interoperability for Microwave Acess (WiMAX) Majority of 4G LTE rollout have almost completed by the end
of last year - Verizon leads with 301 mm 4G LTE POPs - AT&T 250 mm POPs - Sprint and T-Mobile around 200 mm POPs
Smartphones
15
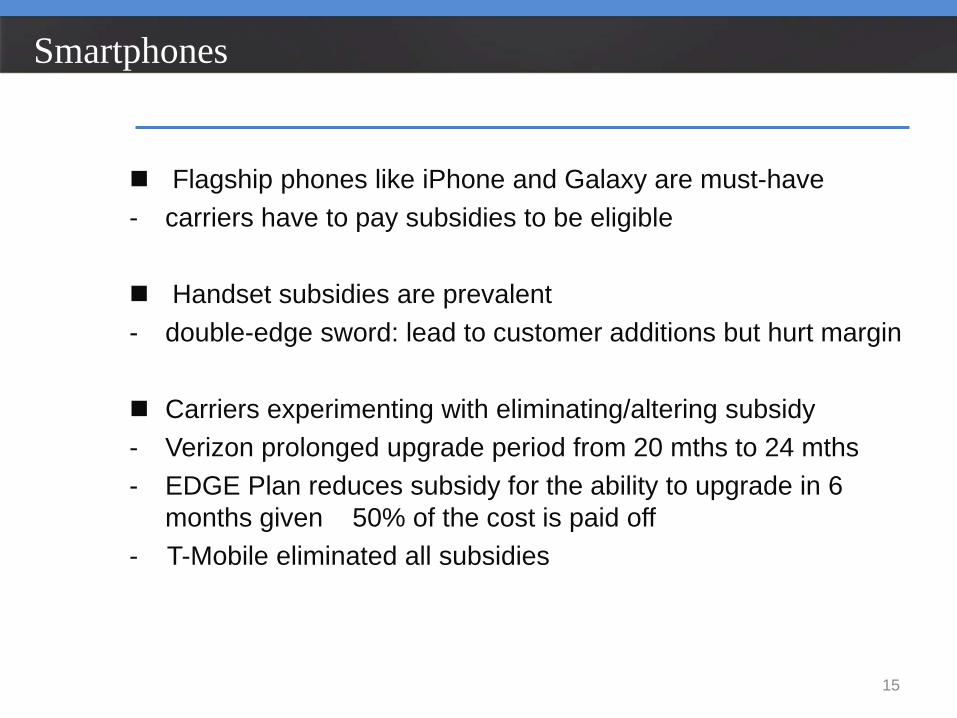
Flagship phones like iPhone and Galaxy are must-have - carriers have to pay subsidies to be eligible Handset subsidies are prevalent - double-edge sword: lead to customer additions but hurt margin
Carriers experimenting with eliminating/altering subsidy - Verizon prolonged upgrade period from 20 mths to 24 mths - EDGE Plan reduces subsidy for the ability to upgrade in 6
months given 50% of the cost is paid off - T-Mobile eliminated all subsidies
Regulation
16
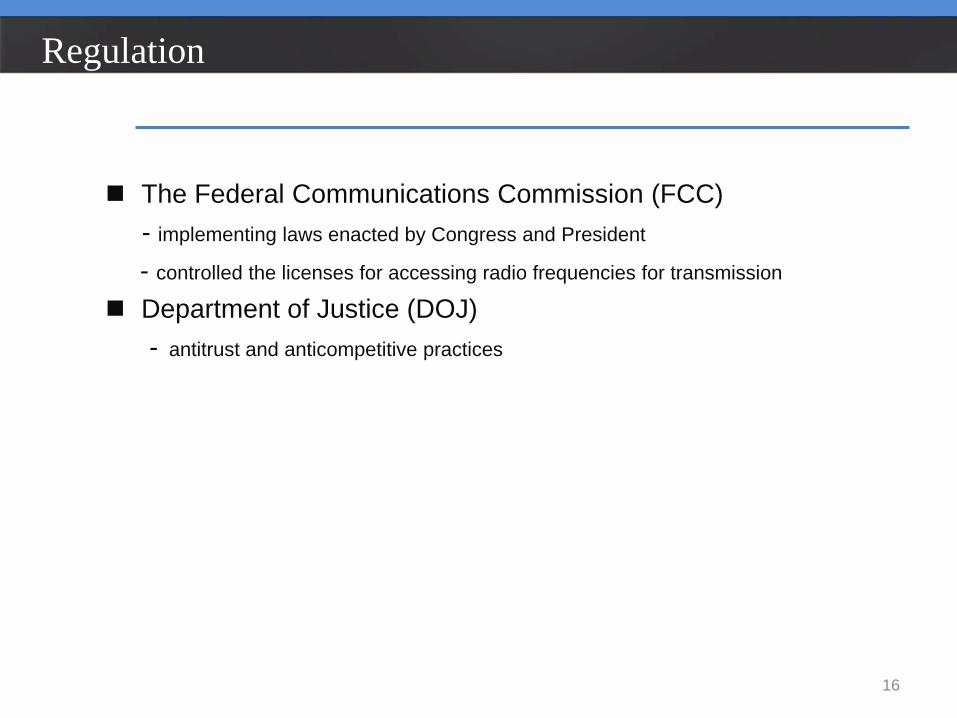
The Federal Communications Commission (FCC) - implementing laws enacted by Congress and President
- controlled the licenses for accessing radio frequencies for transmission
Department of Justice (DOJ) - antitrust and anticompetitive practices
Porter’s Five Forces
17
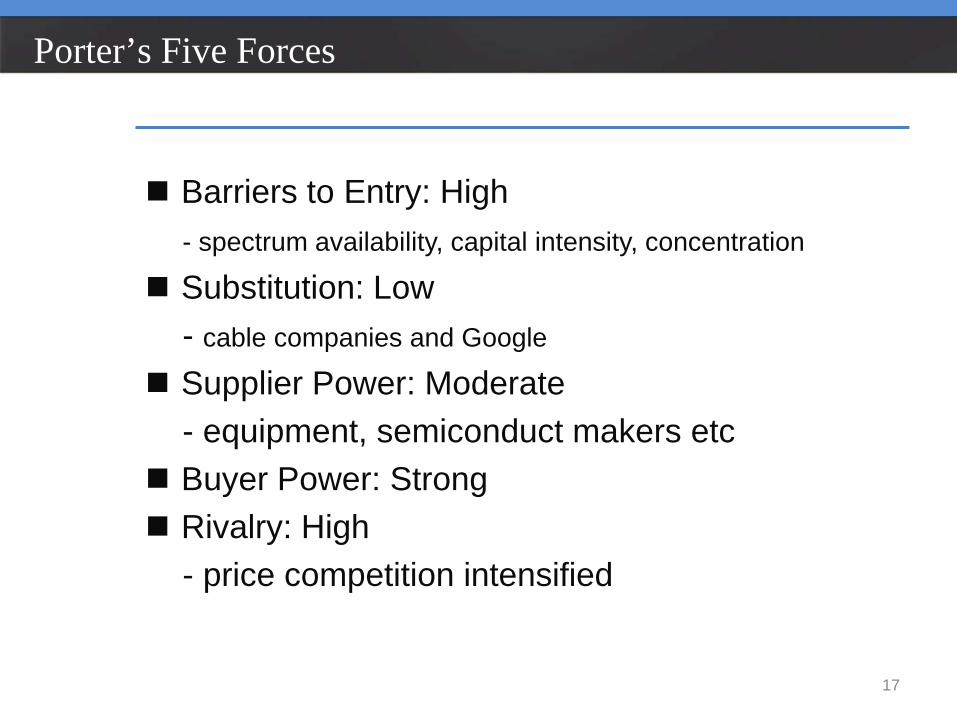
Barriers to Entry: High - spectrum availability, capital intensity, concentration
Substitution: Low - cable companies and Google
Supplier Power: Moderate - equipment, semiconduct makers etc Buyer Power: Strong Rivalry: High - price competition intensified
Agenda 1. Sector Overview 2. Business Analysis 3. Economic Analysis 4. Financial Analysis 5. Valuation Analysis 6. Recommendation
Real GDP & Telecom
19
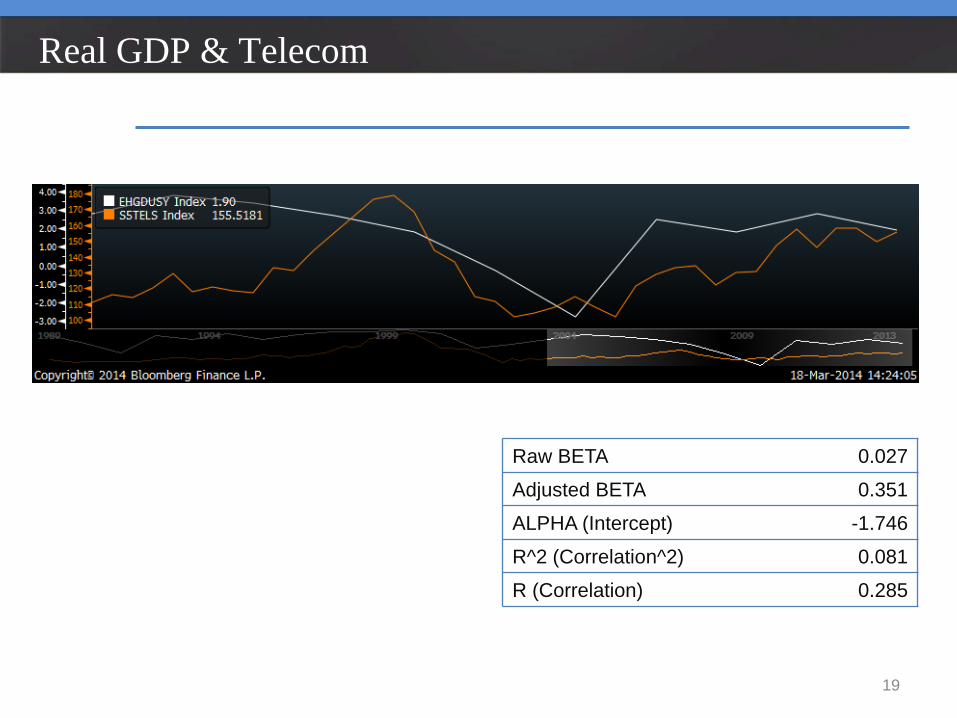
Raw BETA 0.027
Adjusted BETA 0.351
ALPHA (Intercept) -1.746
R^2 (Correlation^2) 0.081
R (Correlation) 0.285
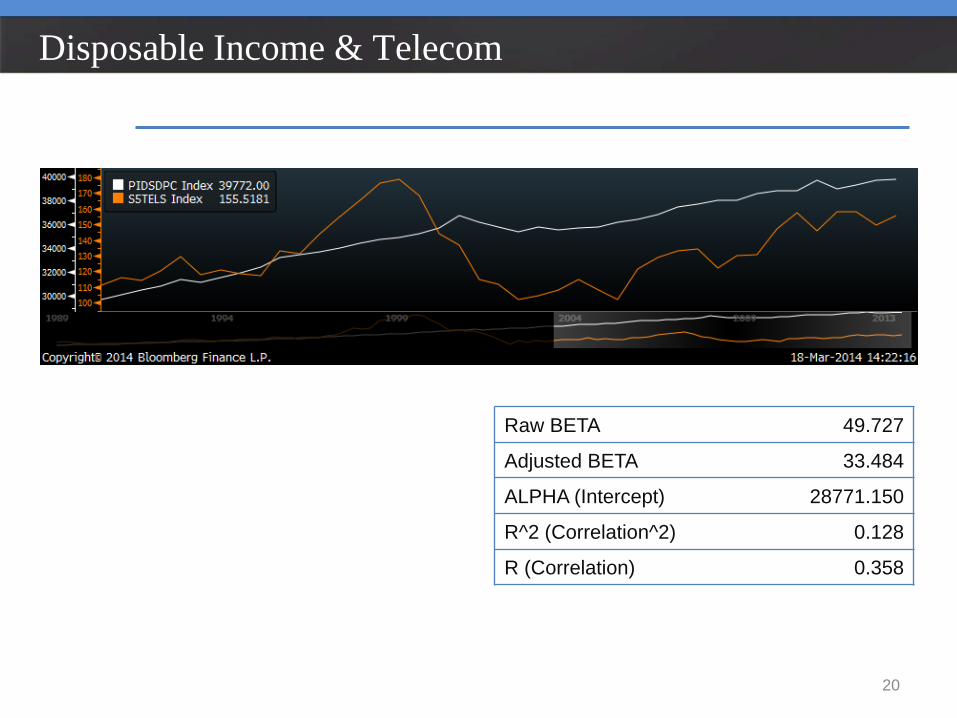
Disposable Income & Telecom
20
Raw BETA 49.727
Adjusted BETA 33.484
ALPHA (Intercept) 28771.150
R^2 (Correlation^2) 0.128
R (Correlation) 0.358
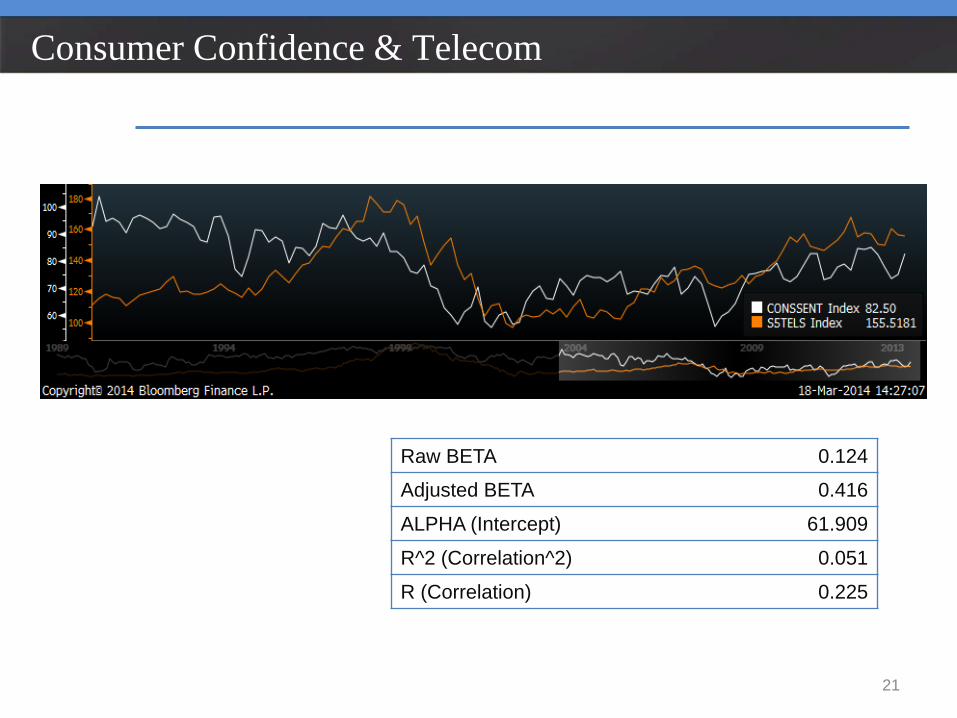
Consumer Confidence & Telecom
21
Raw BETA 0.124
Adjusted BETA 0.416
ALPHA (Intercept) 61.909
R^2 (Correlation^2) 0.051
R (Correlation) 0.225
Agenda 1. Sector Overview 2. Business Analysis 3. Economic Analysis 4. Financial Analysis 5. Valuation Analysis 6. Recommendation
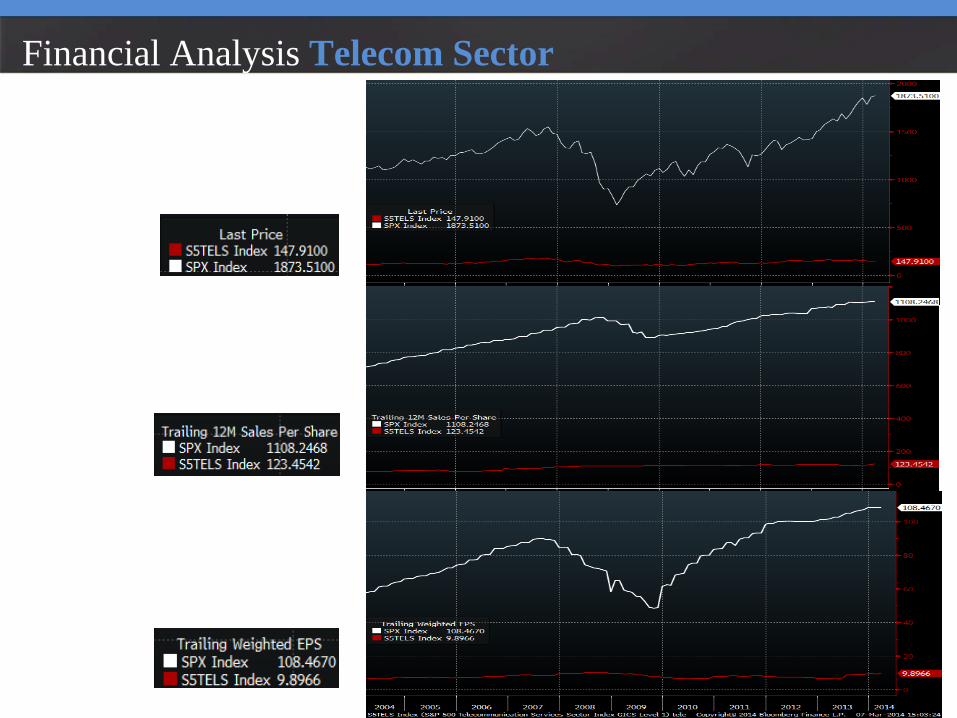
Financial Analysis Telecom Sector
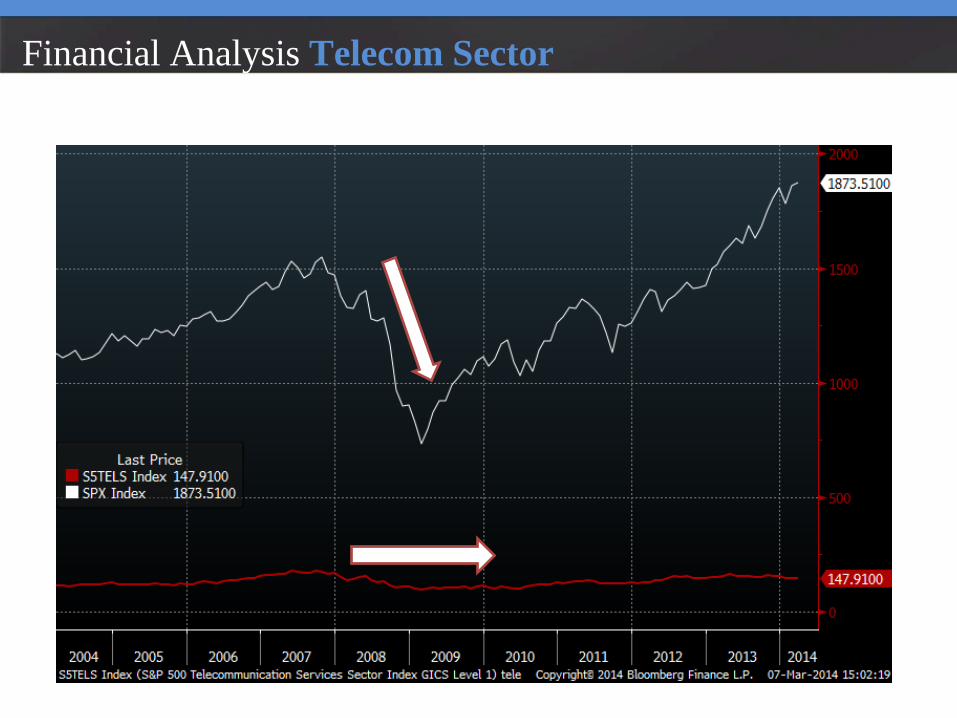
Financial Analysis Telecom Sector
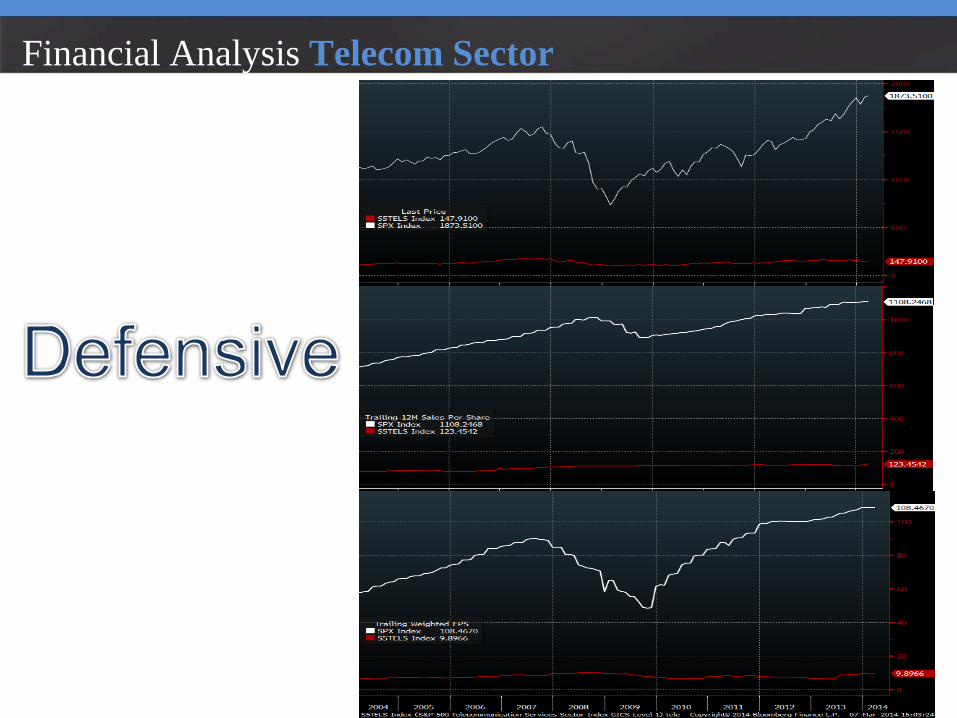
Financial Analysis Telecom Sector
Financial Analysis Telecom Sector
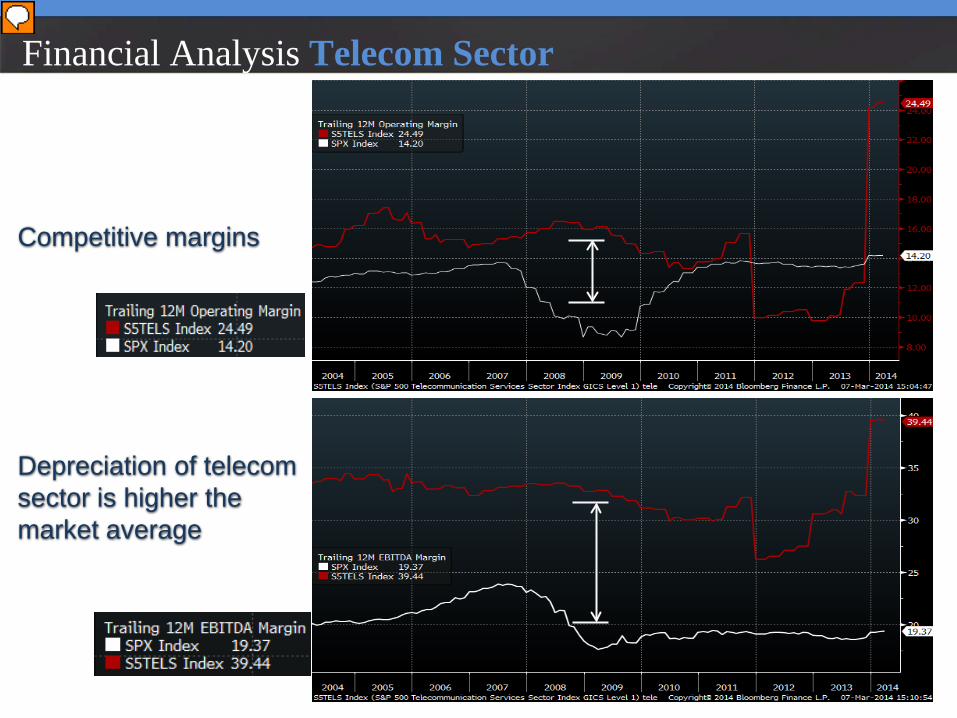
Depreciation of telecom sector is higher the market average
Competitive margins
Financial Analysis Telecom Sector
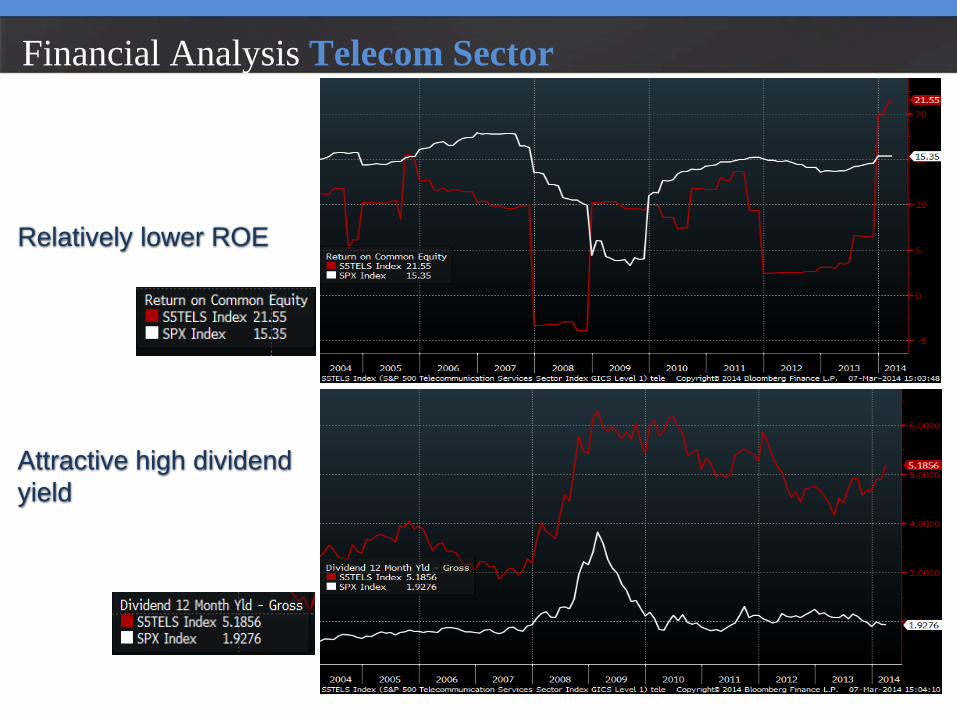
Attractive high dividend yield
Relatively lower ROE
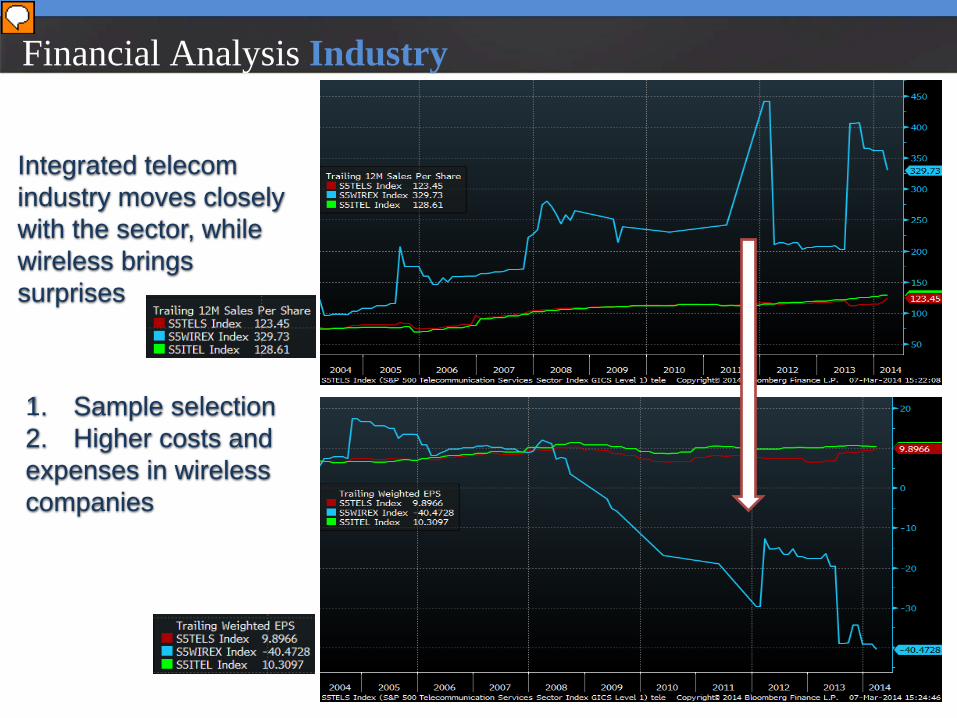
Financial Analysis Industry
Integrated telecom industry moves closely with the sector, while wireless brings surprises
1. Sample selection 2. Higher costs and expenses in wireless companies
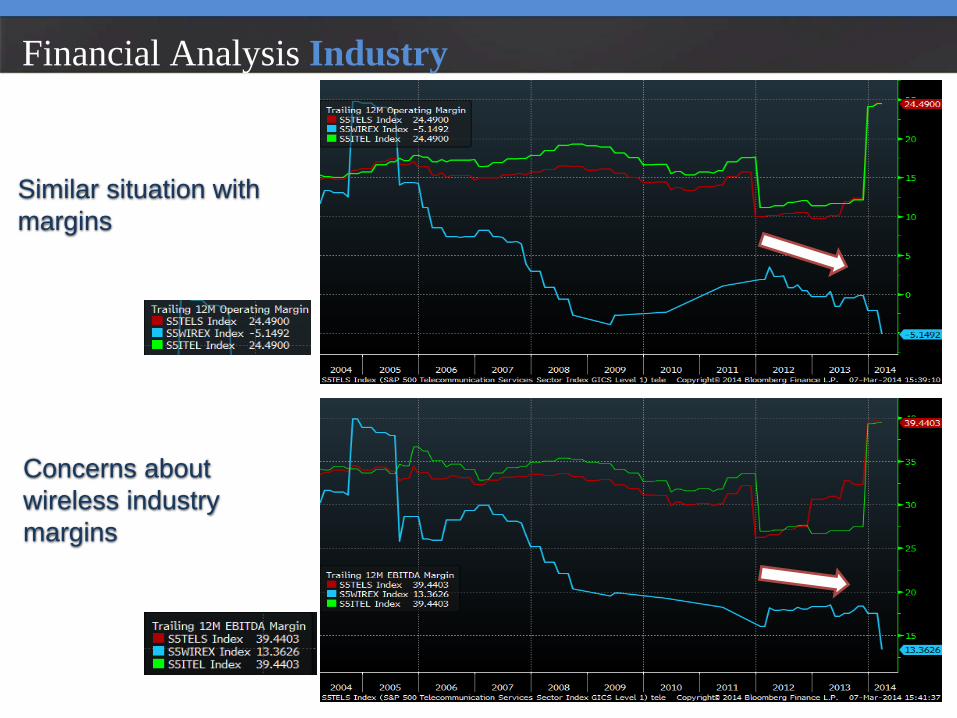
Financial Analysis Industry
Similar situation with margins
Concerns about wireless industry margins
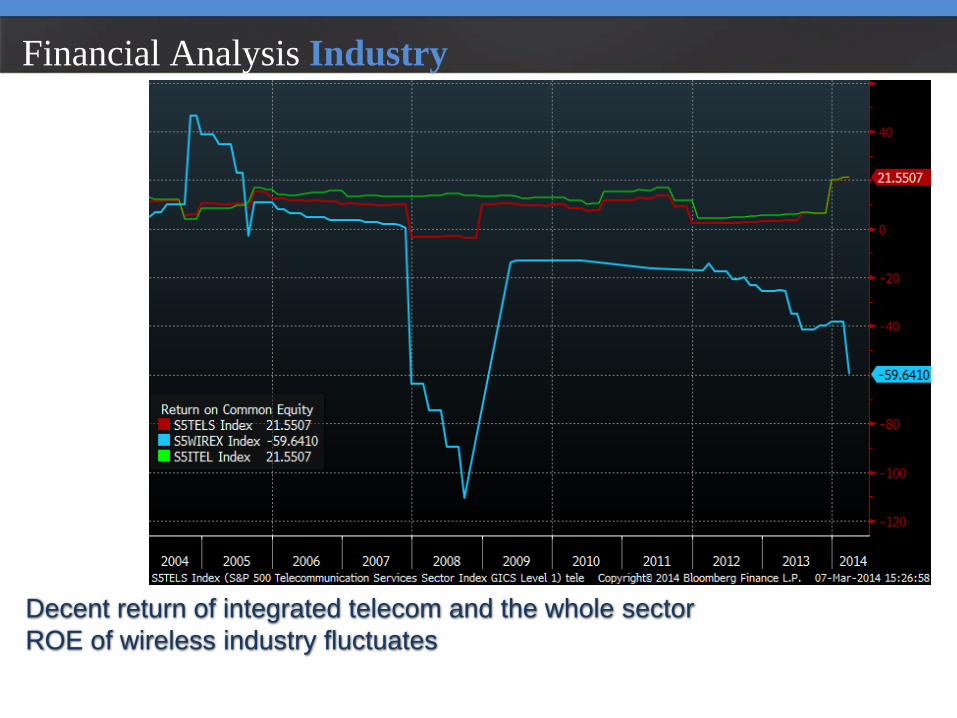
Financial Analysis Industry
Decent return of integrated telecom and the whole sector ROE of wireless industry fluctuates
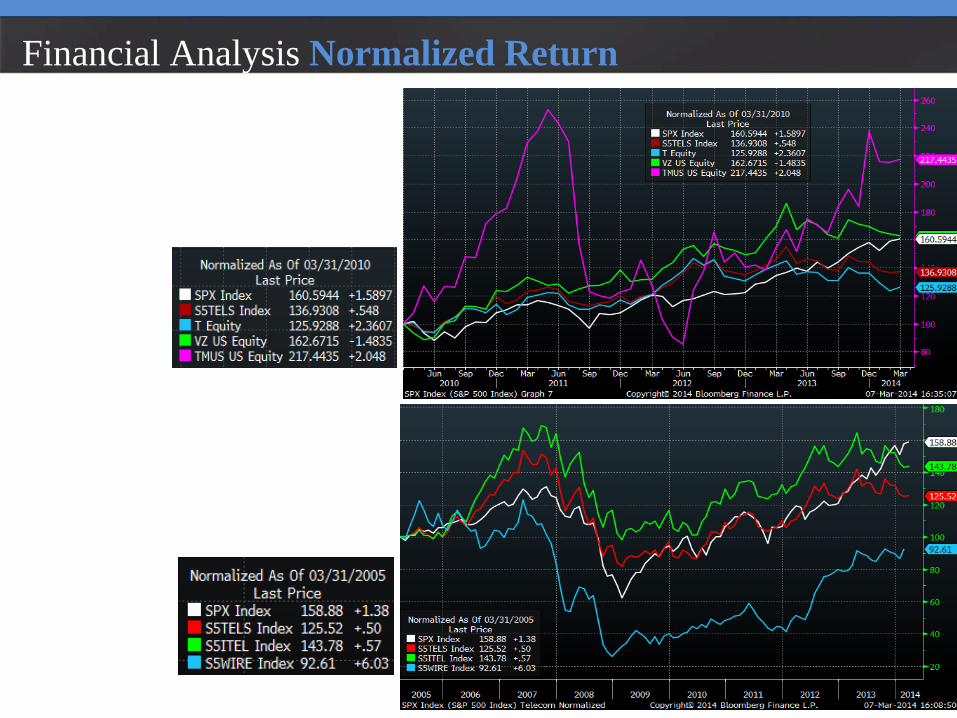
Financial Analysis Normalized Return
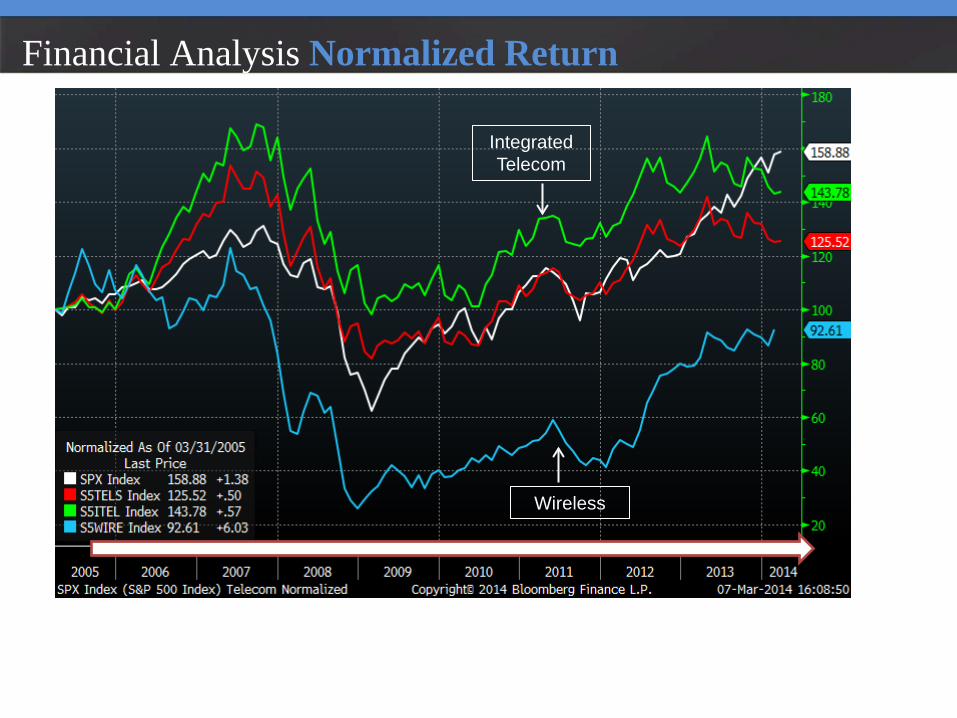
Integrated Telecom
Wireless
Financial Analysis Normalized Return
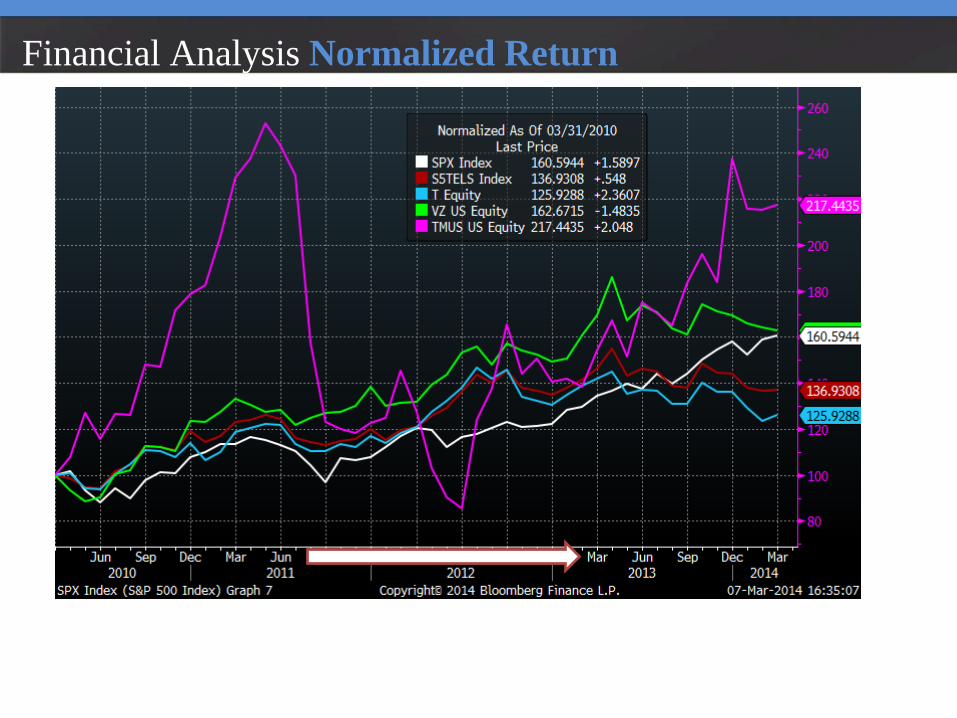
Integrated Telecom
Wireless
Financial Analysis Normalized Return
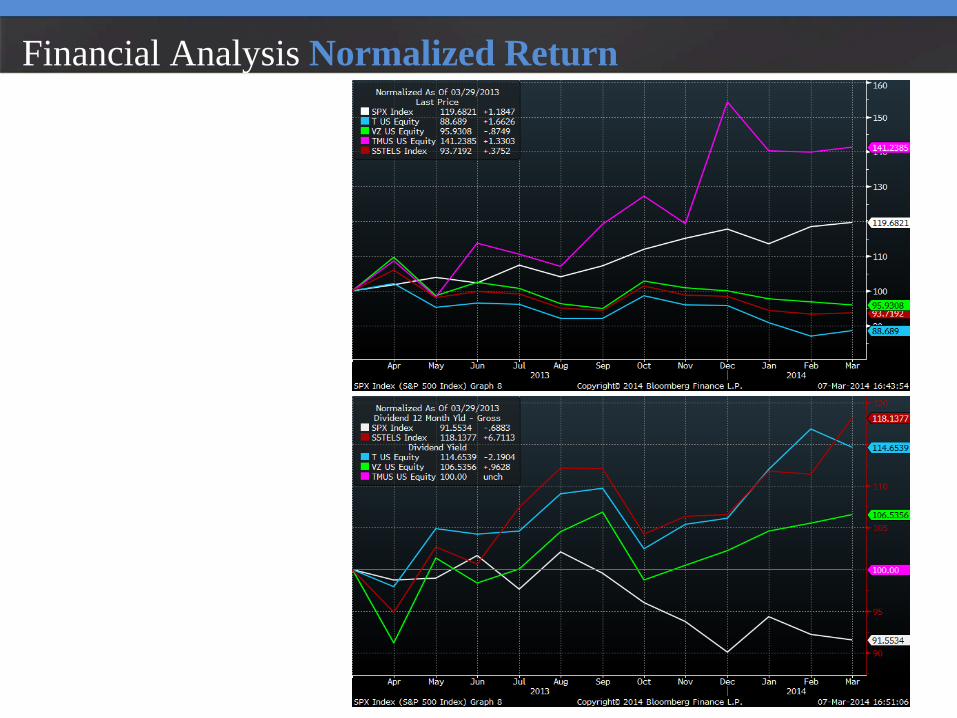
Financial Analysis Normalized Return
Agenda 1. Sector Overview 2. Business Analysis 3. Economic Analysis 4. Financial Analysis 5. Valuation Analysis 6. Recommendation
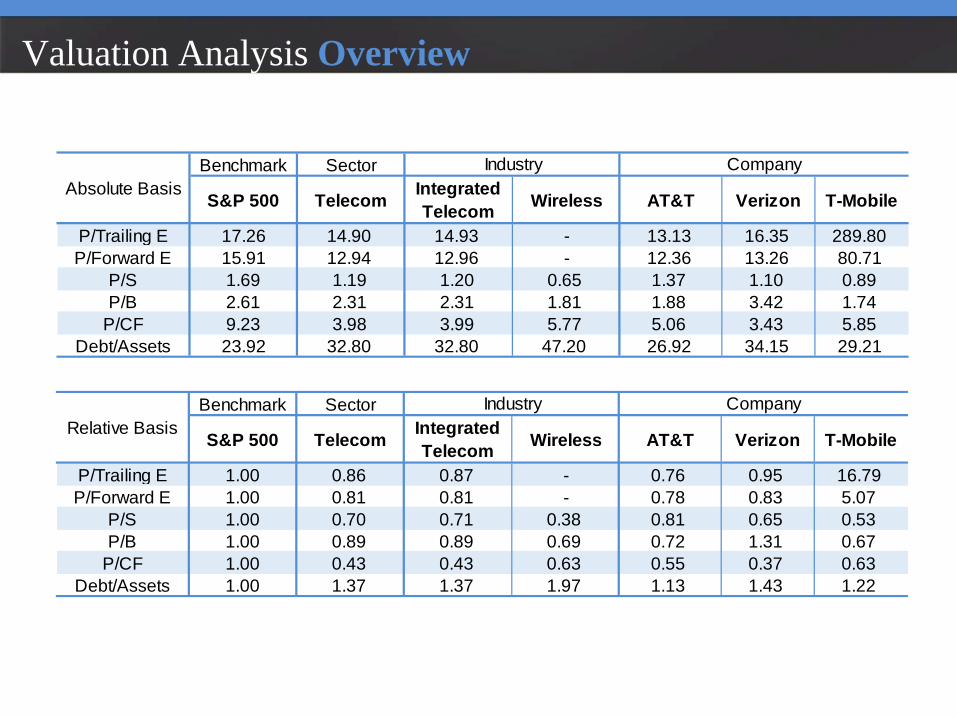
Benchmark Sector
S&P 500 Telecom IntegratedTelecom Wireless AT&T Verizon T-Mobile
P/Trailing E 17.26 14.90 14.93 - 13.13 16.35 289.80P/Forward E 15.91 12.94 12.96 - 12.36 13.26 80.71
P/S 1.69 1.19 1.20 0.65 1.37 1.10 0.89P/B 2.61 2.31 2.31 1.81 1.88 3.42 1.74
P/CF 9.23 3.98 3.99 5.77 5.06 3.43 5.85Debt/Assets 23.92 32.80 32.80 47.20 26.92 34.15 29.21
Absolute BasisIndustry Company
Benchmark Sector
S&P 500 Telecom IntegratedTelecom Wireless AT&T Verizon T-Mobile
P/Trailing E 1.00 0.86 0.87 - 0.76 0.95 16.79P/Forward E 1.00 0.81 0.81 - 0.78 0.83 5.07
P/S 1.00 0.70 0.71 0.38 0.81 0.65 0.53P/B 1.00 0.89 0.89 0.69 0.72 1.31 0.67
P/CF 1.00 0.43 0.43 0.63 0.55 0.37 0.63Debt/Assets 1.00 1.37 1.37 1.97 1.13 1.43 1.22
CompanyRelative Basis
Industry
Valuation Analysis Overview
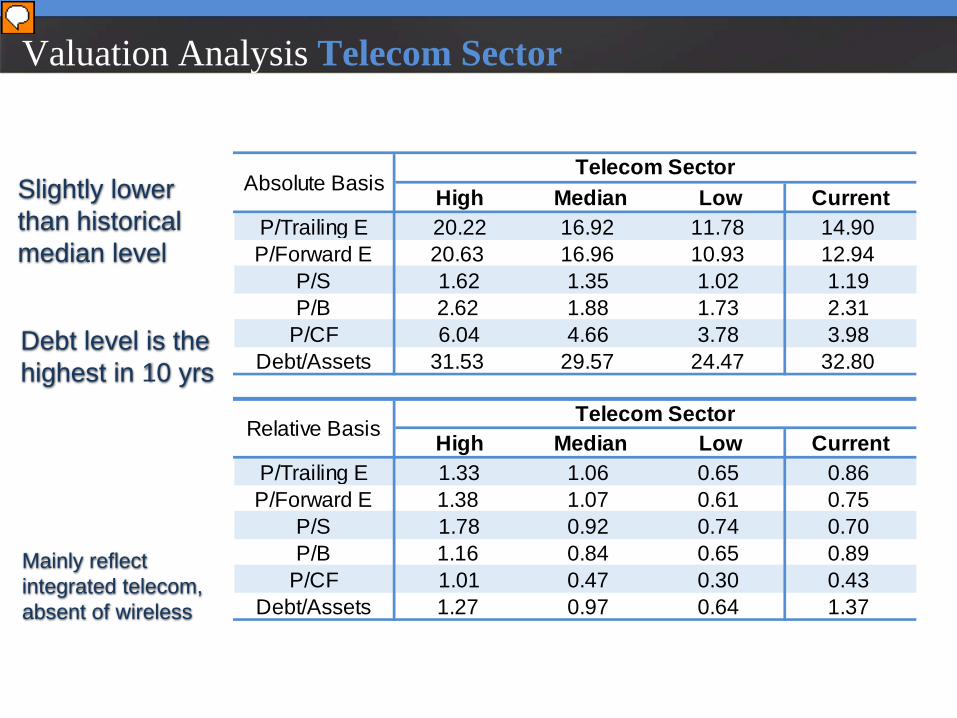
High Median Low CurrentP/Trailing E 20.22 16.92 11.78 14.90P/Forward E 20.63 16.96 10.93 12.94
P/S 1.62 1.35 1.02 1.19P/B 2.62 1.88 1.73 2.31
P/CF 6.04 4.66 3.78 3.98Debt/Assets 31.53 29.57 24.47 32.80
High Median Low CurrentP/Trailing E 1.33 1.06 0.65 0.86P/Forward E 1.38 1.07 0.61 0.75
P/S 1.78 0.92 0.74 0.70P/B 1.16 0.84 0.65 0.89
P/CF 1.01 0.47 0.30 0.43Debt/Assets 1.27 0.97 0.64 1.37
Relative Basis
Telecom Sector
Telecom Sector
Absolute Basis
Valuation Analysis Telecom Sector
Slightly lower than historical median level
Debt level is the highest in 10 yrs
Mainly reflect integrated telecom, absent of wireless
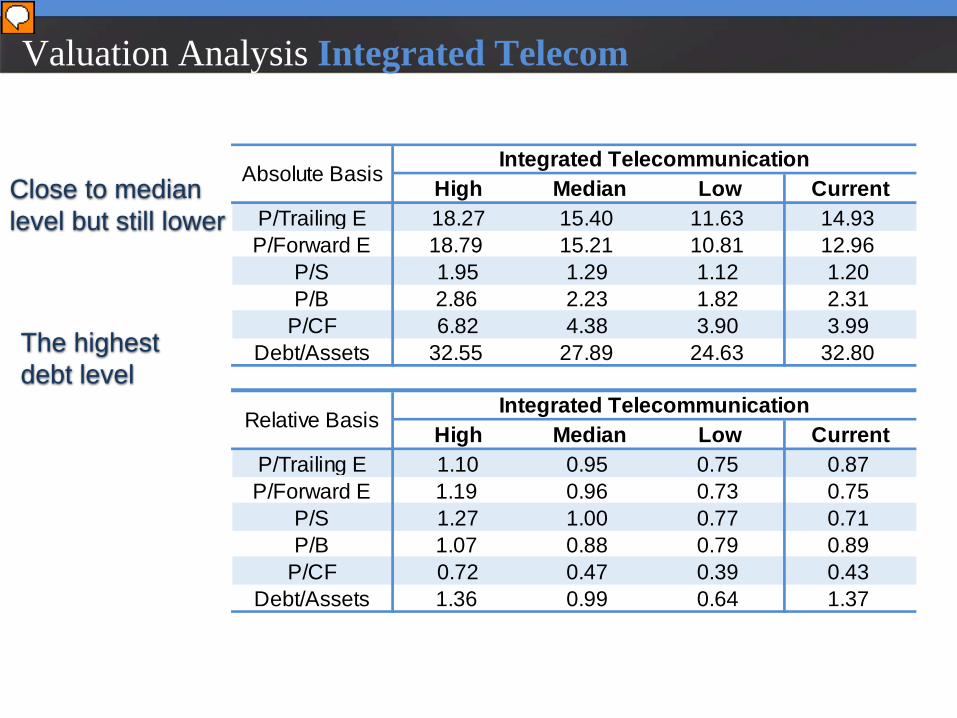
High Median Low CurrentP/Trailing E 18.27 15.40 11.63 14.93P/Forward E 18.79 15.21 10.81 12.96
P/S 1.95 1.29 1.12 1.20P/B 2.86 2.23 1.82 2.31
P/CF 6.82 4.38 3.90 3.99Debt/Assets 32.55 27.89 24.63 32.80
High Median Low CurrentP/Trailing E 1.10 0.95 0.75 0.87P/Forward E 1.19 0.96 0.73 0.75
P/S 1.27 1.00 0.77 0.71P/B 1.07 0.88 0.79 0.89
P/CF 0.72 0.47 0.39 0.43Debt/Assets 1.36 0.99 0.64 1.37
Absolute BasisIntegrated Telecommunication
Relative BasisIntegrated Telecommunication
Valuation Analysis Integrated Telecom
Close to median level but still lower
The highest debt level
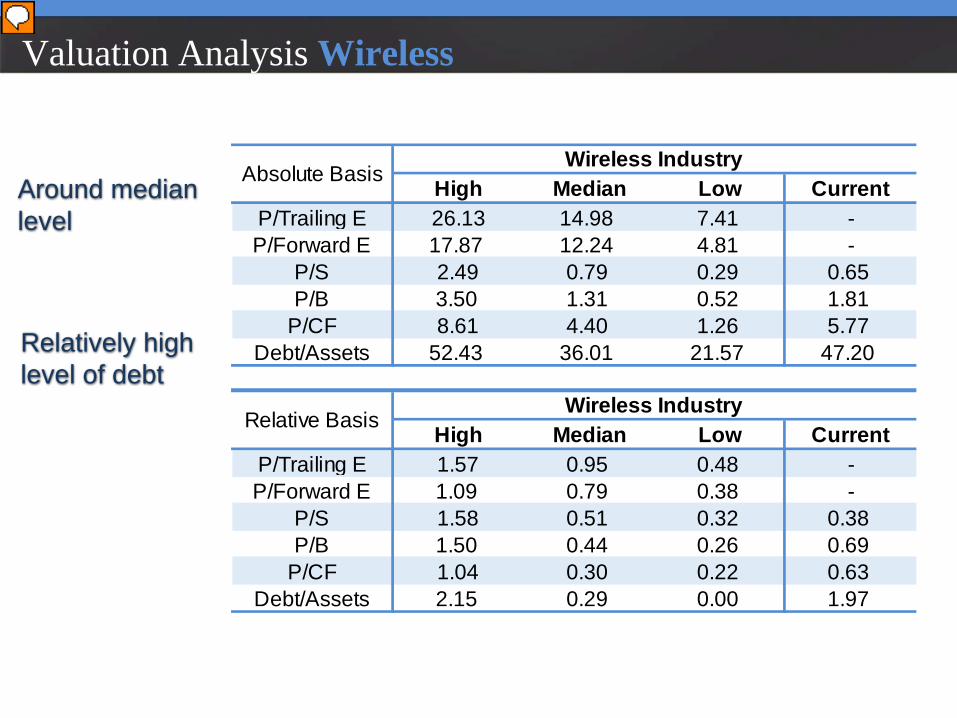
High Median Low CurrentP/Trailing E 26.13 14.98 7.41 -P/Forward E 17.87 12.24 4.81 -
P/S 2.49 0.79 0.29 0.65P/B 3.50 1.31 0.52 1.81
P/CF 8.61 4.40 1.26 5.77Debt/Assets 52.43 36.01 21.57 47.20
High Median Low CurrentP/Trailing E 1.57 0.95 0.48 -P/Forward E 1.09 0.79 0.38 -
P/S 1.58 0.51 0.32 0.38P/B 1.50 0.44 0.26 0.69
P/CF 1.04 0.30 0.22 0.63Debt/Assets 2.15 0.29 0.00 1.97
Relative BasisWireless Industry
Absolute BasisWireless Industry
Valuation Analysis Wireless
Relatively high level of debt
Around median level
Agenda 1. Sector Overview 2. Business Analysis 3. Economic Analysis 4. Financial Analysis 5. Valuation Analysis 6. Recommendation
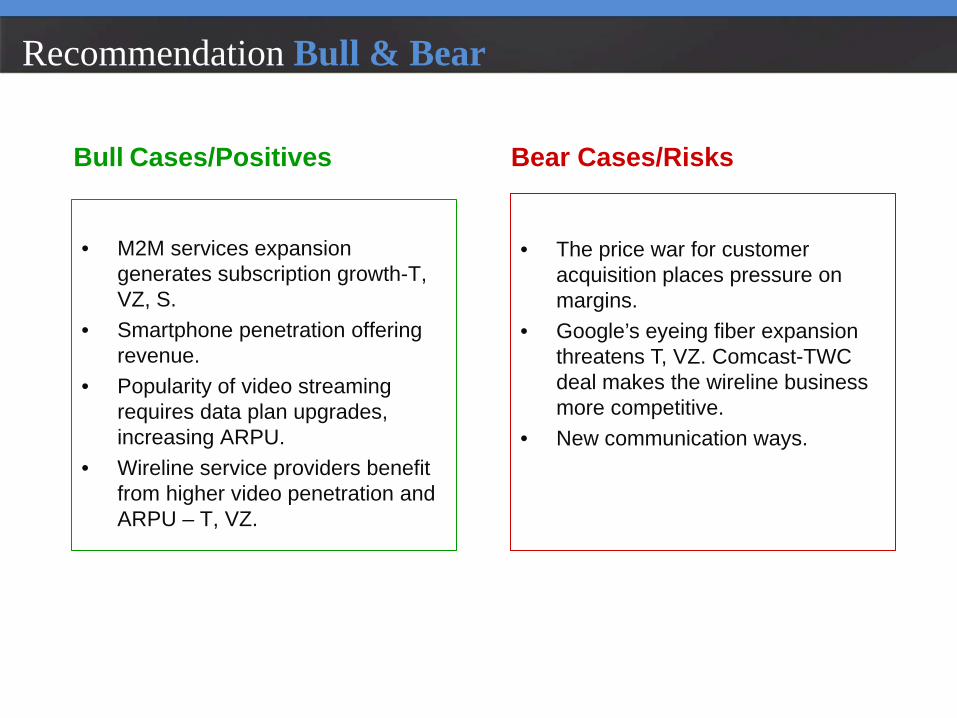
Bull Cases/Positives Bear Cases/Risks
• M2M services expansion
generates subscription growth-T, VZ, S.
• Smartphone penetration offering revenue.
• Popularity of video streaming requires data plan upgrades, increasing ARPU.
• Wireline service providers benefit from higher video penetration and ARPU – T, VZ.
• The price war for customer
acquisition places pressure on margins.
• Google’s eyeing fiber expansion threatens T, VZ. Comcast-TWC deal makes the wireline business more competitive.
• New communication ways.
Recommendation Bull & Bear
Main conclusion: • We recommend overweight telecom sector. • The sector is slightly undervalued now. • Several bullish factors may drive the growth.
Recommendation Summary
Other recommendations: Overweight: Verizon, AT&T • Stability, high dividend yields, new growth trend, undervalued Underweight: T-Mobile • Riskier, volatility, overvalued

THANK YOU Q & A