Embed Size (px)
Citation preview
FISHERIES INVENTORY AND UTILIZATION
OF SAN DIEGO BAY, SAN DIEGO, CALIFORNIA
FOR SURVEYS CONDUCTED IN APRIL AND JULY 2008
Daniel J. Pondella, II, MA, Ph.D, and Jonathan P. Williams, MS.
Vantuna Research Group
Moore Laboratory of Zoology Occidental College 1600 Campus Rd.
Los Angeles, CA 90041
February 2009
ii
Vantuna Research Group Daniel J. Pondella, II, Ph.D., Principal Investigator Jonathan P. Williams, M.S., Research Associate Field and laboratory research assistants: Diana Birney Brianna Bowman Logan Brown Ben Chubak Paul Cutter Jean Davis Amanda Haas Brent Haggin Mackenzie Hansler Bridget McCann Chelsea Muñoz David Panek Evan Poirson Makenzie Mabry Report Authors: Dan Pondella and Jonathan Williams Acknowledgments We are very grateful for the field assistance from the Port of San Diego. The following employees of the Port of San Diego also assisted in field sampling: David Merk, Marshall Olson, Kelly Makley, and Stephanie Bauer. We greatly appreciate Eileen Maher’s oversight and management of this project. We would also like to thank Mitch Perdue for his assistance and review of this project.
iii
TABLE OF CONTENTS
List of Tables iv
List of Figures v
Executive Summary 1
Methods and Materials
Field Surveys 4
Sampling Procedures 5
Results and Discussion
Water Quality Parameters 11
Numerical Catch and Biomass 12
Species Diversity and Richness 20
Catch by Sampling Period and Ecoregion 21
Catch in Bay Habitats 25
Nursery Area Function 28
Ecological Importance of Species 29
Principle Species 31
Catch by Sampling Method 41
Ecoregion Comparisons: Best Estimates of Density and Standing Stock 49
Avian Forage Species 55
Fishery Species 58
Southern Species Found in San Diego Bay 61
Indigenous Bay and Estuary Fishes 63
Comparison of the Current and Historical April and July Surveys 64
Literature Cited 68

iv
LIST OF TABLES
Table 1. Lambert Coordinates for San Diego Bay Fisheries Inventory 5
Table 2. Total abundance of fishes collected in San Diego Bay 14
Table 3. Total biomass of fishes collected in San Diego Bay 15
Table 4. Total abundance and biomass in the North Ecoregion 16
Table 5. Total abundance and biomass in the North-Central Ecoregion 17
Table 6. Total abundance and biomass in the South-Central Ecoregion 18
Table 7. Total abundance and biomass in the South Ecoregion 19
Table 8. Total abundance by sampling period 23
Table 9. Total biomass by sampling period 24
Table 10. Total abundance of fishes by subhabitat 26
Table 11. Total abundance by strata (vegetated, non-veg and channel) 27
Table 12. Percent of juveniles by species 28
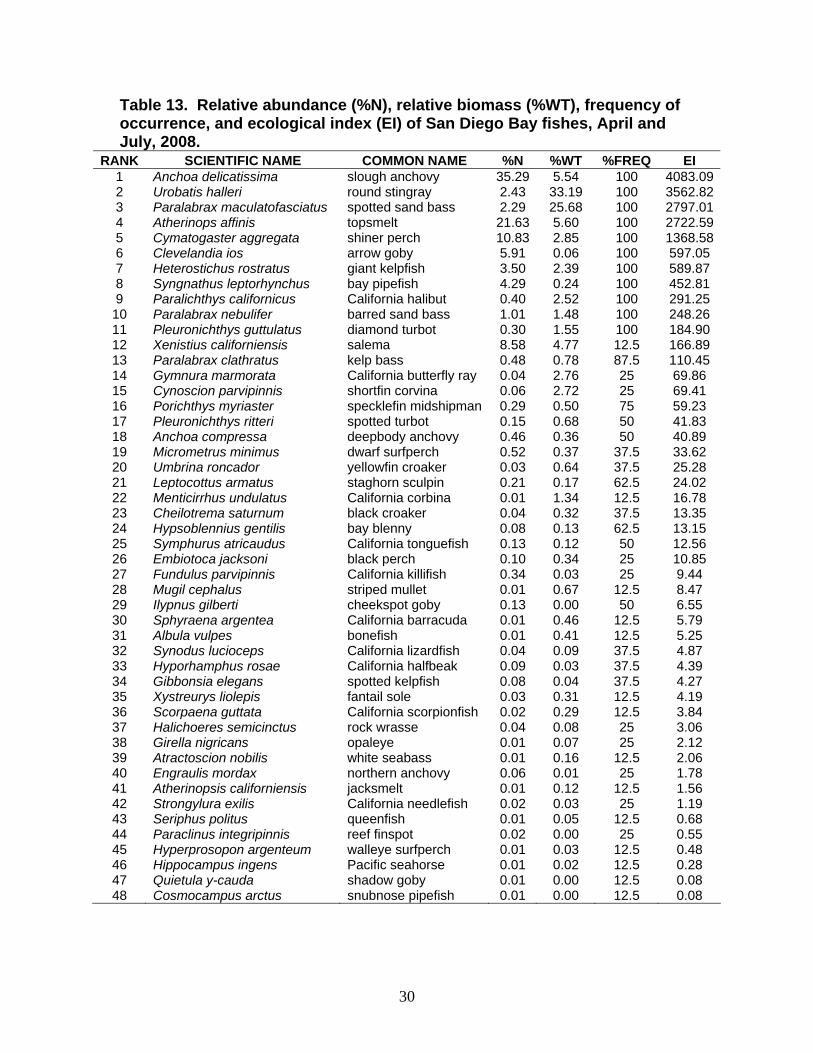
Table 13. Ecological Index of fishes 30
Table 14. Total catch by sampling method 42
Table 15. Total biomass by sampling method 45
Table 16. Density and biomass estimates by gear type 48
Table 17. Estimates of Aerial Coverage of depth strata by Ecoregion 50
Table 18. Best estimate of fish density and estimated stock size 51
Table 19. Best estimate of fishes, forage fishes, and fishery species 54
Table 20. Best estimate of forage fish species 55
Table 21. Best estimate of fishery species 58
Table 22. Exotic southern species from San Diego Bay 61
Table 23. Abundance of southern species in San Diego Bay 61
Table 24. Indigenous bay/estuarine species taken in San Diego Bay, 2008 63
Table 25. Shannon-Weiner Diversity Historical Comparison 64
Table 26. Species Richness Historical Comparison 65
Table 27. Historical Comparison of Total Catch 66
Table 28. Historical Comparison of Total Biomass 67

v
LIST OF FIGURES
Figure 1. Sampling locations in San Diego Bay 4
Figure 2. Sampling events for the North Ecoregion 7
Figure 3. Sampling events for the North-Central Ecoregion 8
Figure 4. Sampling events for the South-Central Ecoregion 9
Figure 5. Sampling events for the South Ecoregion 10
Figure 6. Summary of physical-chemical measurements by ecoregion 11
Figure 7. Catch of fishes by Ecoregion 12
Figure 8. Catch of the five numerically dominant species by ecoregion 13
Figure 9. Shannon-Weiner Diversity and species richness by Ecoregion 20
Figure 10. Shannon-Weiner Diversity and richness by sampling month 20
Figure 11. Total abundance by sampling month 22
Figure 12. Total biomass by sampling month 22
Figure 13. Top 20 species ranked by Ecological Index 29
Figure 14. Length frequency of slough anchovy 31
Figure 15. Disc width frequency of round stingray 32
Figure 16. Length frequency of spotted sand bass 33
Figure 17. Length frequency of topsmelt 34
Figure 18. Length frequency of shiner perch 35
Figure 19. Length frequency of arrow goby 36
Figure 20. Length frequency of giant kelpfish 37
Figure 21. Length frequency of bay pipefish 38
Figure 22. Length frequency of California halibut 39
Figure 23. Length frequency of barred sand bass 40
Figure 24. Abundance of southern species in San Diego Bay 62
Figure 25. Shannon-Weiner diversity historical comparison 64
Figure 26. Species richness historical comparison 65
Figure 27. Historical comparison of total catch 66
Figure 28. Historical Comparison of Total Biomass 67

vi

1
Executive Summary
The Vantuna Research Group at Occidental College surveyed the estuarine fishes
of San Diego Bay in April and July 2008 for the Port of San Diego. The survey followed the protocols established from July 1994 to April 1999 (Allen 1999, Allen et al. 2002, Pondella et al. 2006). The goals of the current study were to update the previous study and address the following objectives:
• Identify, determine and quantify the utilization of the fishery populations in San
Diego Bay
• Identify habitats that support juvenile fish species and describe nursery utilization
• Determine geographic and/or habitat areas of San Diego Bay that support significant populations of fish species utilized as forage by endangered avian species
In order to accomplish the objectives for these two sampling periods, we have documented the following parameters:
Fish species composition and abundance Species diversity Abundance by bay Ecoregion
Ecological importance of species Nursery area function Fish assemblage structure Water quality parameters Fish density and biomass estimates
Numerical and biomass density Density and standing stock of avian forage species Density and standing stock of fishery species ‘southern’ species unique to San Diego Bay
Composition and Abundance
During this study, 15,692 (48 species) fishes weighing 183 kg were collected during April and July 2008. The most numerous species comprising 35.3% of the catch was slough anchovy (Anchoa delicatissima), followed by topsmelt (Atherinops affinis; 21.6%), shiner perch (Cymatogaster aggregata; 10.8%), salema (Xenistius californiensis; 5.7%) and arrow goby (Clevelandia ios; 5.9%). In terms of biomass, round stingrays (Urobatis halleri) dominated the catch comprising 33.2% of the biomass. The spotted sand bass (Paralabrax maculatofasciatus: 25.7%) followed by topsmelt (5.6%), slough anchovy (5.5%) and California butterfly ray (2.8%) rounded out the top five fishes for total biomass.

2
Nursery Area Function
San Diego Bay continues to be a nursery area for the great majority of the fishes found there. Approximately 62% of all fishes sampled in San Diego Bay were juveniles Ecological Importance of Species
The principle fishes surveyed during these sampling periods as determined by the Ecological Index were the following estuarine species: slough anchovy, round stingray, spotted sand bass, topsmelt and shiner perch. Slough anchovy ranked first with an E.I. of 4,083 while round stingray ranked second (E.I. 3,562). Both species were found ubiquitously throughout the bay, round stingray were dominant in terms of biomass and topsmelt in terms of numerical abundance. These species were followed by spotted sand bass (E.I. 2,797), topsmelt (E.I. 2,723) and shiner perch (E.I. 1,369). Best Estimates of Density and Standing Stock
The best total estimate for the total stock size was 24,776,133 fishes. With an estimated surface area of 4858 ha (Table 13) this gives an overall fish density 0.51 ind/m2 (Table 23). Nearly half of this estimate was slough anchovy (12 million). Salema (2.6 million) arrow goby (2.2 million) shiner perch (2.2 million), topsmelt (1.7 million) bay pipefish (1.2 million) and giant kelpfish (1.2 million) dominated the stock estimate. The stock estimate for the bay was unsurprisingly dominated by schooling and forage fishes.
Avian Forage Species
Forage species are primarily surface dwelling schooling fish that are accessible to diving avian predators, especially terns. Generally, forage fishes are small silvery-sided fishes that are found in large schools. These schooling fishes are generally not habitat specific and move throughout the bay’s ecosystem. Seven species of important avian forage species were captured during this study. These species were: deepbody anchovy, slough anchovy, northern anchovy, California halfbeak, topsmelt, jacksmelt and shiner perch. The most abundant forage fishes were slough anchovy; topsmelt, and shiner perch. These species were primarily found at small sizes, less than 50 mm in length. These small forage fishes were present during both sampling periods (April and July) indicating that there was a plentiful source of small fishes needed by the nesting birds in the area. The stock estimate for forage fish was over 16 million fishes and an estimate of 60 metric tons (mt). Slough anchovy (25 mt) accounted for nearly half of this biomass followed by shiner perch (9.5 mt) and topsmelt (5.4 mt). During these sampling periods the bay supported more than enough fish biomass at the appropriate size classes for the birds of the region.
3
Fisheries Species
During this study, 15 species were captured which have importance in either the recreational or commercial fisheries in California. Including all Ecoregions, standing stock estimates of fisheries species totaled 89.9 (mt). Estimates were greatest at the South-Central Ecoregion (37.7 mt), followed by the South (35.8 mt), North-Central (12.4 mt) and North Ecoregions (4.0 mt).
Trends and Comparisons
In 2008, the South Ecoregion had the highest diversity recorded (H’ = 2.00). At the remaining ecoregions diversity was roughly equal to the 2005 sampling season and as high as has been observed in the study. Overall, 2008 Shannon-Wiener Diversity estimates were very strong. By contrast to the diversity values, species richness values for 2008 are at the middle or low end of the range of values for each ecoregion.
San Diego Bay as a Unique Fish Habitat
San Diego Bay is known for being the northern edge of the range for a number of southern fishes that are not normally distributed in the Southern California Bight. As an example, at least nineteen northern range extensions have been reported for the bay. During the study the following six species (bonefish, shortfin corvina, California butterfly ray, Pacific seahorse, California halfbeak, California needlefish) with primarily southern distributions were taken. These fishes were mostly found in the south ecoregion. As the largest estuary in Southern California, San Diego Bay provides critical habitat for bay and estuary fishes. The high productivity rate coupled with the abundance of juvenile fishes in the bay highlights the importance of the bay as a nursery habitat. The bay contains extensive shallow water eelgrass habitat that supports a unique assemblage of juvenile and adult fishes. San Diego Bay serves as critical habitat for many fishes that, in turn support surrounding nearshore ecosystems. Juvenile fishes emigrate from the bay to offshore habitats, and important or endangered avian species utilize forage fishes in the bay. Southern California indigenous bay and estuary fishes represented 49% of the total catch in this survey.

4
Field Surveys
To adequately assess the status of all components of the ichthyofauna of the San Diego Bay, four Ecoregions of San Diego Bay including North, North-Central, South-Central, and South were sampled and inventoried (Figure 1, Table 1).
Figure 1. Sampling locations of the North (1), North-Central (2), South-Central (3) and South (4) Ecoregions in San Diego Bay.
5
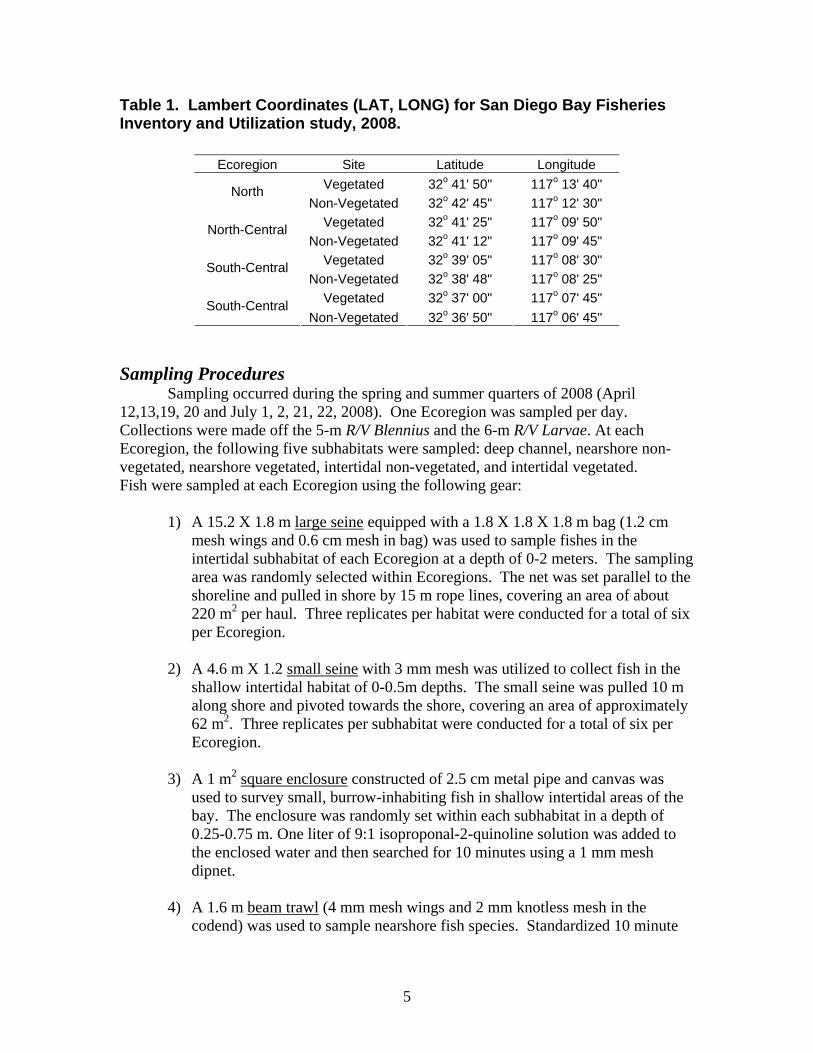
Table 1. Lambert Coordinates (LAT, LONG) for San Diego Bay Fisheries Inventory and Utilization study, 2008.
Ecoregion Site Latitude Longitude Vegetated 32o 41' 50" 117o 13' 40" North
Non-Vegetated 32o 42' 45" 117o 12' 30" Vegetated 32o 41' 25" 117o 09' 50" North-Central
Non-Vegetated 32o 41' 12" 117o 09' 45" Vegetated 32o 39' 05" 117o 08' 30" South-Central
Non-Vegetated 32o 38' 48" 117o 08' 25" Vegetated 32o 37' 00" 117o 07' 45" South-Central
Non-Vegetated 32o 36' 50" 117o 06' 45" Sampling Procedures
Sampling occurred during the spring and summer quarters of 2008 (April 12,13,19, 20 and July 1, 2, 21, 22, 2008). One Ecoregion was sampled per day. Collections were made off the 5-m R/V Blennius and the 6-m R/V Larvae. At each Ecoregion, the following five subhabitats were sampled: deep channel, nearshore non-vegetated, nearshore vegetated, intertidal non-vegetated, and intertidal vegetated. Fish were sampled at each Ecoregion using the following gear:
1) A 15.2 X 1.8 m large seine equipped with a 1.8 X 1.8 X 1.8 m bag (1.2 cm mesh wings and 0.6 cm mesh in bag) was used to sample fishes in the intertidal subhabitat of each Ecoregion at a depth of 0-2 meters. The sampling area was randomly selected within Ecoregions. The net was set parallel to the shoreline and pulled in shore by 15 m rope lines, covering an area of about 220 m2 per haul. Three replicates per habitat were conducted for a total of six per Ecoregion.
2) A 4.6 m X 1.2 small seine with 3 mm mesh was utilized to collect fish in the
shallow intertidal habitat of 0-0.5m depths. The small seine was pulled 10 m along shore and pivoted towards the shore, covering an area of approximately 62 m2. Three replicates per subhabitat were conducted for a total of six per Ecoregion.
3) A 1 m2 square enclosure constructed of 2.5 cm metal pipe and canvas was
used to survey small, burrow-inhabiting fish in shallow intertidal areas of the bay. The enclosure was randomly set within each subhabitat in a depth of 0.25-0.75 m. One liter of 9:1 isoproponal-2-quinoline solution was added to the enclosed water and then searched for 10 minutes using a 1 mm mesh dipnet.
4) A 1.6 m beam trawl (4 mm mesh wings and 2 mm knotless mesh in the
codend) was used to sample nearshore fish species. Standardized 10 minute
6
tows were conducted behind the 5-m research vessel, covering an area of approximately 290 m2 per replicate.
5) A 66 X 6 m purse seine (1.2 cm mesh wings and 0.6 cm mesh bag) was used
to sample fish species in the nearshore and channel subhabitats. The purse seine was randomly set within each subhabitat and sampled a total area of approximately 296 m2 per replicate. Three replicates per subhabitat were conducted during each sampling period.
6) An 8 m semi-balloon otter trawl (2 cm mesh wings and 0.8 cm mesh codend)
towed behind the 5-m research vessel was used to survey fishes from the deepest portions of the channel subhabitat. The otter trawl was towed for 10 minutes and sampled a total area of approximately 2,417 m2 per each replicate. Three replicates were conducted per Ecoregion.
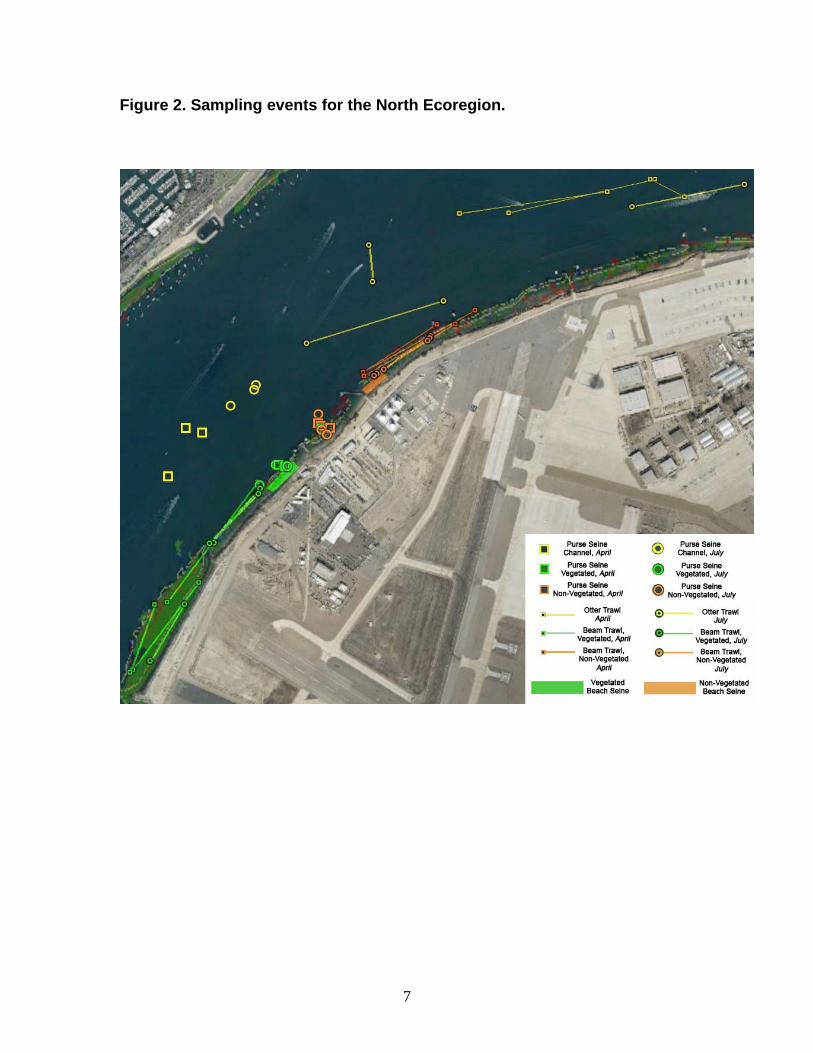
All fishes or subsamples of large catches were returned to the laboratory where all individuals were identified to species, measured to the nearest 0.01 mm (Standard Length or Disk Width) with a Mitutoyo Digital Caliper and weighed with a Sartorius Analytical Balance. Large fishes were measured aboard ship to the nearest millimeter and gram using Pesola hanging scales and returned. Lambert coordinates of each sampling effort were recorded for all sampling events. For otter and beam trawls the start and finish of each tow was recorded. The station events are plotted in Figures 2-5.
7
Figure 2. Sampling events for the North Ecoregion.

8
Figure 3. Sampling events for the North-Central Ecoregion.

9
Figure 4. Sampling events for the South-Central Ecoregion.

10
Figure 5. Sampling events for the South Ecoregion.

11
Water Quality Parameters
Water temperature (°C), salinity (ppt), dissolved oxygen (mgO2/1), and pH was measured at each Ecoregion. Data entry, summarization, graphing, and descriptive analyses were accomplished using Microsoft Excel for Windows. Microsoft Excel was also used to tabulate the physical and chemical parameters of each Ecoregion sampled by the Sea-Bird oceanographic profiler. Temperature and salinity increased from north to south in the bay during April and July sampling periods. Dissolved oxygen and pH were relatively stable and decreased slightly from north to south (Figure 6).
Figure 6. Summary of mean physical-chemical measurements by Ecoregion over the sampling months, 2008.
Surface Temperature
15
17
19
21
23
25
27
North North‐Central South‐Central South
ºC
April 2008
July 2008
Surface Dissolved Oxygen
3
3.5
4
4.5
5
5.5
6
6.5
7
North North‐Central South‐Central South
ml/L
April 2008
July 2008
Surface pH
7.95
8
8.05
8.1
8.15
North North‐Central South‐Central South
pH
April 2008
July 2008
Surface Salinity
33
33.5
34
34.5
35
35.5
36
North North‐Central South‐Central South
ppt
April 2008
July 2008
12
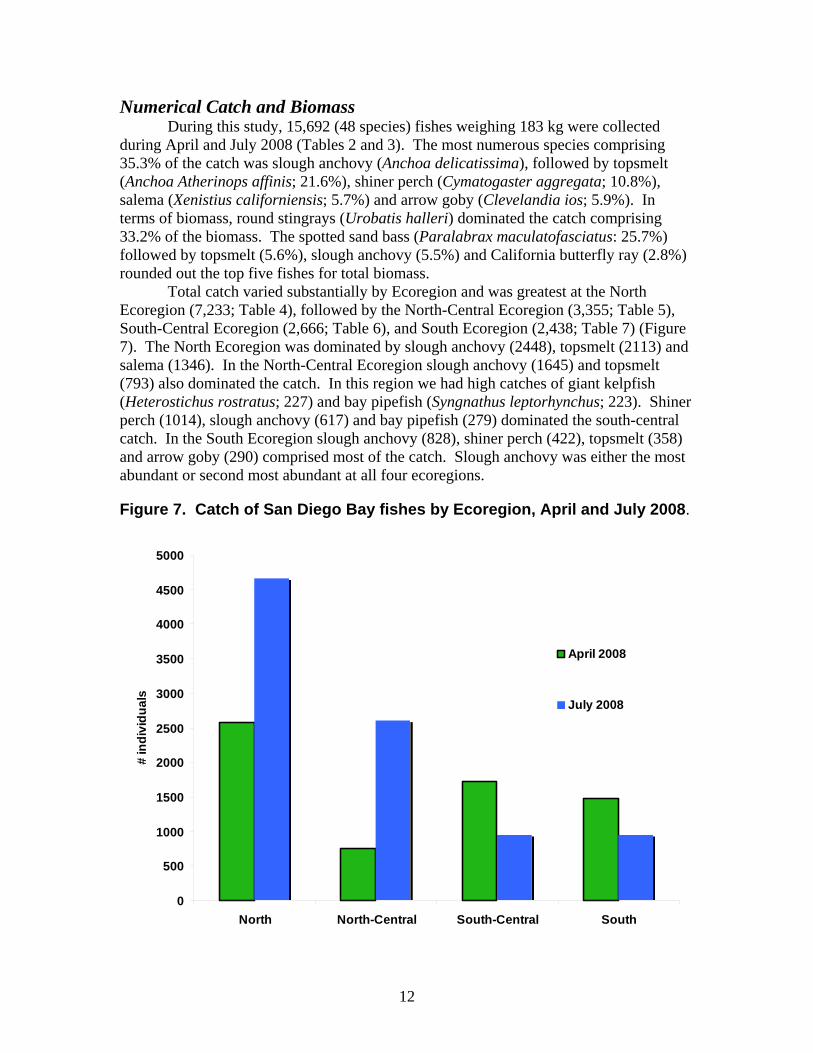
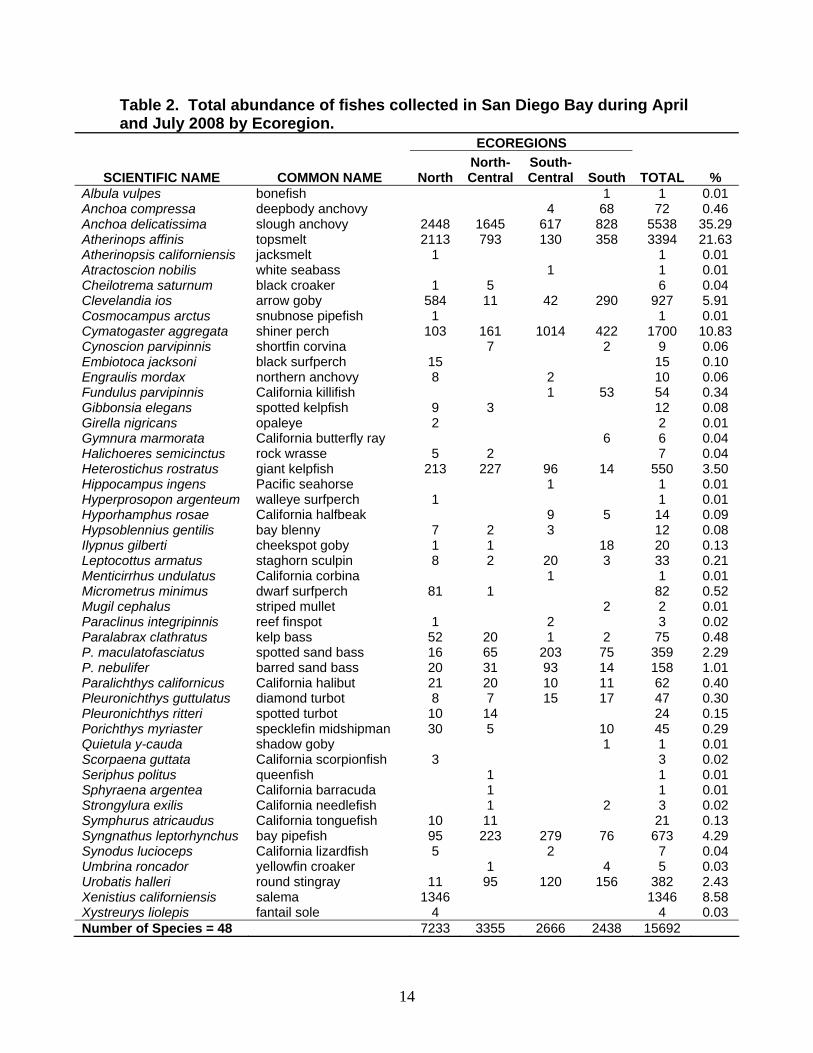
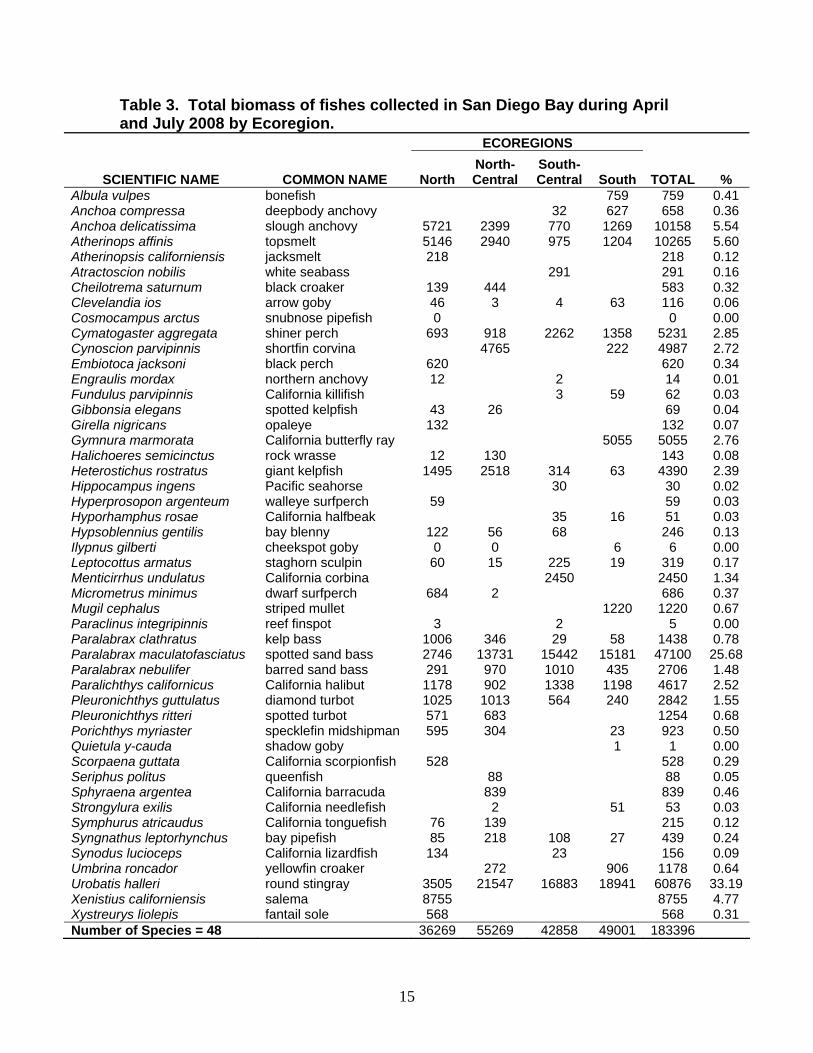
Numerical Catch and Biomass During this study, 15,692 (48 species) fishes weighing 183 kg were collected
during April and July 2008 (Tables 2 and 3). The most numerous species comprising 35.3% of the catch was slough anchovy (Anchoa delicatissima), followed by topsmelt (Anchoa Atherinops affinis; 21.6%), shiner perch (Cymatogaster aggregata; 10.8%), salema (Xenistius californiensis; 5.7%) and arrow goby (Clevelandia ios; 5.9%). In terms of biomass, round stingrays (Urobatis halleri) dominated the catch comprising 33.2% of the biomass. The spotted sand bass (Paralabrax maculatofasciatus: 25.7%) followed by topsmelt (5.6%), slough anchovy (5.5%) and California butterfly ray (2.8%) rounded out the top five fishes for total biomass. Total catch varied substantially by Ecoregion and was greatest at the North Ecoregion (7,233; Table 4), followed by the North-Central Ecoregion (3,355; Table 5), South-Central Ecoregion (2,666; Table 6), and South Ecoregion (2,438; Table 7) (Figure 7). The North Ecoregion was dominated by slough anchovy (2448), topsmelt (2113) and salema (1346). In the North-Central Ecoregion slough anchovy (1645) and topsmelt (793) also dominated the catch. In this region we had high catches of giant kelpfish (Heterostichus rostratus; 227) and bay pipefish (Syngnathus leptorhynchus; 223). Shiner perch (1014), slough anchovy (617) and bay pipefish (279) dominated the south-central catch. In the South Ecoregion slough anchovy (828), shiner perch (422), topsmelt (358) and arrow goby (290) comprised most of the catch. Slough anchovy was either the most abundant or second most abundant at all four ecoregions.
Figure 7. Catch of San Diego Bay fishes by Ecoregion, April and July 2008.
0
500
1000
1500
2000
2500
3000
3500
4000
4500
5000
North North-Central South-Central South
# in
divi
dual
s
April 2008
July 2008

13
Overall the catch of the five numerically dominant fishes had mixed patterns over
the four ecoregions (Figure 8). Catch of shiner perch increased to the south with a high in the South-Central Ecoregion. Both slough anchovy and topsmelt decreased from the North to South Ecoregion with their lowest catch at the South-Central ecoregion. Arrow gobies were caught in greater numbers in the North and South Ecoregions, while salema were only caught in the North Ecoregion.
Figure 8. Total catch of the five numerically dominant species by Ecoregion.
0
500
1000
1500
2000
2500
3000
North North-Central South-Central SouthEcoregion
# in
divi
dual
s
slough anchovy
topsmelt
arrow goby
shiner perch
salema
Spotted sand bass had the highest catch in terms of biomass at three ecoregions
(North-Central, 13.7 kg; South-Central, 15.4 kg; and South, 15.2 kg). It was fifth in biomass (2.7 kg) in the North Ecoregion. Biomass in the North Ecoregion was dominated by salema (8.7 kg), slough anchovy (5.7 kg), topsmelt (5.1 kg), round stingray (Urobatis halleri, 3.5 kg) and spotted sand bass (2.7 kg). For the North-Central Ecoregion after spotted sand bass, shortfin corvina (Cynoscion parvipinnis, 4.8 kg) was dominant. In the South-Central Ecoregion California corbina (Menticirrhus undulatus, 2.5 kg) and shiner perch (2.3 kg) had the second and third highest biomass values, respectively. Finally in the South Ecoregion, California butterfly ray (Gymnura marmorata, 5.0 kg), shiner perch (1.4 kg), slough anchovy (1.3 kg) and topsmelt (1.2 kg) were the second through fifth highest biomass values, respectively.
14
Table 2. Total abundance of fishes collected in San Diego Bay during April and July 2008 by Ecoregion.
ECOREGIONS
SCIENTIFIC NAME COMMON NAME NorthNorth-Central
South-Central South TOTAL %
Albula vulpes bonefish 1 1 0.01 Anchoa compressa deepbody anchovy 4 68 72 0.46 Anchoa delicatissima slough anchovy 2448 1645 617 828 5538 35.29Atherinops affinis topsmelt 2113 793 130 358 3394 21.63Atherinopsis californiensis jacksmelt 1 1 0.01 Atractoscion nobilis white seabass 1 1 0.01 Cheilotrema saturnum black croaker 1 5 6 0.04 Clevelandia ios arrow goby 584 11 42 290 927 5.91 Cosmocampus arctus snubnose pipefish 1 1 0.01 Cymatogaster aggregata shiner perch 103 161 1014 422 1700 10.83Cynoscion parvipinnis shortfin corvina 7 2 9 0.06 Embiotoca jacksoni black surfperch 15 15 0.10 Engraulis mordax northern anchovy 8 2 10 0.06 Fundulus parvipinnis California killifish 1 53 54 0.34 Gibbonsia elegans spotted kelpfish 9 3 12 0.08 Girella nigricans opaleye 2 2 0.01 Gymnura marmorata California butterfly ray 6 6 0.04 Halichoeres semicinctus rock wrasse 5 2 7 0.04 Heterostichus rostratus giant kelpfish 213 227 96 14 550 3.50 Hippocampus ingens Pacific seahorse 1 1 0.01 Hyperprosopon argenteum walleye surfperch 1 1 0.01 Hyporhamphus rosae California halfbeak 9 5 14 0.09 Hypsoblennius gentilis bay blenny 7 2 3 12 0.08 Ilypnus gilberti cheekspot goby 1 1 18 20 0.13 Leptocottus armatus staghorn sculpin 8 2 20 3 33 0.21 Menticirrhus undulatus California corbina 1 1 0.01 Micrometrus minimus dwarf surfperch 81 1 82 0.52 Mugil cephalus striped mullet 2 2 0.01 Paraclinus integripinnis reef finspot 1 2 3 0.02 Paralabrax clathratus kelp bass 52 20 1 2 75 0.48 P. maculatofasciatus spotted sand bass 16 65 203 75 359 2.29 P. nebulifer barred sand bass 20 31 93 14 158 1.01 Paralichthys californicus California halibut 21 20 10 11 62 0.40 Pleuronichthys guttulatus diamond turbot 8 7 15 17 47 0.30 Pleuronichthys ritteri spotted turbot 10 14 24 0.15 Porichthys myriaster specklefin midshipman 30 5 10 45 0.29 Quietula y-cauda shadow goby 1 1 0.01 Scorpaena guttata California scorpionfish 3 3 0.02 Seriphus politus queenfish 1 1 0.01 Sphyraena argentea California barracuda 1 1 0.01 Strongylura exilis California needlefish 1 2 3 0.02 Symphurus atricaudus California tonguefish 10 11 21 0.13 Syngnathus leptorhynchus bay pipefish 95 223 279 76 673 4.29 Synodus lucioceps California lizardfish 5 2 7 0.04 Umbrina roncador yellowfin croaker 1 4 5 0.03 Urobatis halleri round stingray 11 95 120 156 382 2.43 Xenistius californiensis salema 1346 1346 8.58 Xystreurys liolepis fantail sole 4 4 0.03 Number of Species = 48 7233 3355 2666 2438 15692
15
Table 3. Total biomass of fishes collected in San Diego Bay during April and July 2008 by Ecoregion.
ECOREGIONS
SCIENTIFIC NAME COMMON NAME North North-Central
South-Central South TOTAL %
Albula vulpes bonefish 759 759 0.41 Anchoa compressa deepbody anchovy 32 627 658 0.36 Anchoa delicatissima slough anchovy 5721 2399 770 1269 10158 5.54 Atherinops affinis topsmelt 5146 2940 975 1204 10265 5.60 Atherinopsis californiensis jacksmelt 218 218 0.12 Atractoscion nobilis white seabass 291 291 0.16 Cheilotrema saturnum black croaker 139 444 583 0.32 Clevelandia ios arrow goby 46 3 4 63 116 0.06 Cosmocampus arctus snubnose pipefish 0 0 0.00 Cymatogaster aggregata shiner perch 693 918 2262 1358 5231 2.85 Cynoscion parvipinnis shortfin corvina 4765 222 4987 2.72 Embiotoca jacksoni black perch 620 620 0.34 Engraulis mordax northern anchovy 12 2 14 0.01 Fundulus parvipinnis California killifish 3 59 62 0.03 Gibbonsia elegans spotted kelpfish 43 26 69 0.04 Girella nigricans opaleye 132 132 0.07 Gymnura marmorata California butterfly ray 5055 5055 2.76 Halichoeres semicinctus rock wrasse 12 130 143 0.08 Heterostichus rostratus giant kelpfish 1495 2518 314 63 4390 2.39 Hippocampus ingens Pacific seahorse 30 30 0.02 Hyperprosopon argenteum walleye surfperch 59 59 0.03 Hyporhamphus rosae California halfbeak 35 16 51 0.03 Hypsoblennius gentilis bay blenny 122 56 68 246 0.13 Ilypnus gilberti cheekspot goby 0 0 6 6 0.00 Leptocottus armatus staghorn sculpin 60 15 225 19 319 0.17 Menticirrhus undulatus California corbina 2450 2450 1.34 Micrometrus minimus dwarf surfperch 684 2 686 0.37 Mugil cephalus striped mullet 1220 1220 0.67 Paraclinus integripinnis reef finspot 3 2 5 0.00 Paralabrax clathratus kelp bass 1006 346 29 58 1438 0.78 Paralabrax maculatofasciatus spotted sand bass 2746 13731 15442 15181 47100 25.68Paralabrax nebulifer barred sand bass 291 970 1010 435 2706 1.48 Paralichthys californicus California halibut 1178 902 1338 1198 4617 2.52 Pleuronichthys guttulatus diamond turbot 1025 1013 564 240 2842 1.55 Pleuronichthys ritteri spotted turbot 571 683 1254 0.68 Porichthys myriaster specklefin midshipman 595 304 23 923 0.50 Quietula y-cauda shadow goby 1 1 0.00 Scorpaena guttata California scorpionfish 528 528 0.29 Seriphus politus queenfish 88 88 0.05 Sphyraena argentea California barracuda 839 839 0.46 Strongylura exilis California needlefish 2 51 53 0.03 Symphurus atricaudus California tonguefish 76 139 215 0.12 Syngnathus leptorhynchus bay pipefish 85 218 108 27 439 0.24 Synodus lucioceps California lizardfish 134 23 156 0.09 Umbrina roncador yellowfin croaker 272 906 1178 0.64 Urobatis halleri round stingray 3505 21547 16883 18941 60876 33.19Xenistius californiensis salema 8755 8755 4.77 Xystreurys liolepis fantail sole 568 568 0.31 Number of Species = 48 36269 55269 42858 49001 183396
16
Table 4. Total number of individuals and biomass (g) of fish species captured April and July 2008 in the North Ecoregion.
SCIENTIFIC NAME COMMON NAME TOTAL
# % TOTAL MASS
(g) % Anchoa delicatissima slough anchovy 2448 33.84 5721 15.77Atherinops affinis topsmelt 2113 29.21 5146 14.19Atherinopsis californiensis jacksmelt 1 0.01 218 0.60 Cheilotrema saturnum black croaker 1 0.01 139 0.38 Clevelandia ios arrow goby 584 8.07 46 0.13 Cosmocampus arctus snubnose pipefish 1 0.01 0 0.00 Cymatogaster aggregata shiner perch 103 1.42 693 1.91 Embiotoca jacksoni black perch 15 0.21 620 1.71 Engraulis mordax northern anchovy 8 0.11 12 0.03 Gibbonsia elegans spotted kelpfish 9 0.12 43 0.12 Girella nigricans opaleye 2 0.03 132 0.36 Halichoeres semicinctus rock wrasse 5 0.07 12 0.03 Heterostichus rostratus giant kelpfish 213 2.94 1495 4.12 Hyperprosopon argenteum walleye surfperch 1 0.01 59 0.16 Hypsoblennius gentilis bay blenny 7 0.10 122 0.34 Ilypnus gilberti cheekspot goby 1 0.01 0 0.00 Leptocottus armatus staghorn sculpin 8 0.11 60 0.17 Micrometrus minimus dwarf surfperch 81 1.12 684 1.89 Paraclinus integripinnis reef finspot 1 0.01 3 0.01 Paralichthys californicus California halibut 21 0.29 1178 3.25 Paralabrax clathratus kelp bass 52 0.72 1006 2.77 Paralabrax maculatofasciatus spotted sand bass 16 0.22 2746 7.57 Paralabrax nebulifer barred sand bass 20 0.28 291 0.80 Pleuronichthys guttulatus diamond turbot 8 0.11 1025 2.83 Pleuronichthys ritteri spotted turbot 10 0.14 571 1.57 Porichthys myriaster specklefin midshipman 30 0.41 595 1.64 Scorpaena guttata California scorpionfish 3 0.04 528 1.46 Symphurus atricaudus California tonguefish 10 0.14 76 0.21 Syngnathus leptorhynchus bay pipefish 95 1.31 85 0.24 Synodus lucioceps California lizardfish 5 0.07 134 0.37 Urobatis halleri round stingray 11 0.15 3505 9.66 Xenistius californiensis salema 1346 18.61 8755 24.14Xystreurys liolepis fantail sole 4 0.06 568 1.57 Number of Species = 33 7,233 36,269
17
Table 5. Total number of individuals and biomass (g) of fish species captured in the North-Central Ecoregion, April and July 2008.
SCIENTIFIC NAME COMMON NAME TOTAL
# % TOTAL MASS
(g) % Anchoa delicatissima slough anchovy 1645 49.03 2399 4.34 Atherinops affinis topsmelt 793 23.64 2940 5.32 Cheilotrema saturnum black croaker 5 0.15 444 0.80 Clevelandia ios arrow goby 11 0.33 3 0.00 Cymatogaster aggregata shiner perch 161 4.80 918 1.66 Cynoscion parvipinnis shortfin corvina 7 0.21 4765 8.62 Gibbonsia elegans spotted kelpfish 3 0.09 26 0.05 Halichoeres semicinctus rock wrasse 2 0.06 130 0.24 Heterostichus rostratus giant kelpfish 227 6.77 2518 4.56 Hypsoblennius gentilis bay blenny 2 0.06 56 0.10 Ilypnus gilberti cheekspot goby 1 0.03 0 0.00 Leptocottus armatus staghorn sculpin 2 0.06 15 0.03 Micrometrus minimus dwarf surfperch 1 0.03 2 0.00 Paralabrax clathratus kelp bass 20 0.60 346 0.63 Paralabrax maculatofasciatus spotted sand bass 65 1.94 13731 24.84Paralabrax nebulifer barred sand bass 31 0.92 970 1.75 Paralichthys californicus California halibut 20 0.60 902 1.63 Pleuronichthys guttulatus diamond turbot 7 0.21 1013 1.83 Pleuronichthys ritteri spotted turbot 14 0.42 683 1.24 Porichthys myriaster specklefin midshipman 5 0.15 304 0.55 Seriphus politus queenfish 1 0.03 88 0.16 Sphyraena argentea California barracuda 1 0.03 839 1.52 Strongylura exilis California needlefish 1 0.03 2 0.00 Symphurus atricaudus California tonguefish 11 0.33 139 0.25 Syngnathus leptorhynchus bay pipefish 223 6.65 218 0.39 Umbrina roncador yellowfin croaker 1 0.03 272 0.49 Urobatis halleri round stingray 95 2.83 21547 38.99Number of Species = 27 3,355 55,269

18
Table 6. Total number of individuals and biomass (g) of fish species captured in the South-Central Ecoregion, April and July 2008.
SCIENTIFIC NAME COMMON NAME TOTAL
# % TOTAL MASS (g) % Anchoa compressa deepbody anchovy 4 0.15 32 0.07 Anchoa delicatissima slough anchovy 617 23.14 770 1.80 Atherinops affinis topsmelt 130 4.88 975 2.28 Atractoscion nobilis white seabass 1 0.04 291 0.68 Clevelandia ios arrow goby 42 1.58 4 0.01 Cymatogaster aggregata shiner perch 1014 38.03 2262 5.28 Engraulis mordax Pacific sardine 2 0.08 2 0.00 Fundulus parvipinnis California killifish 1 0.04 3 0.01 Heterostichus rostratus giant kelpfish 96 3.60 314 0.73 Hippocampus ingens Pacific seahorse 1 0.04 30 0.07 Hyporhamphus rosae California halfbeak 9 0.34 35 0.08 Hypsoblennius gentilis bay blenny 3 0.11 68 0.16 Leptocottus armatus staghorn sculpin 20 0.75 225 0.52 Menticirrhus undulatus California corbina 1 0.04 2450 5.72 Pleuronichthys guttulatus diamond turbot 15 0.56 564 1.32 Paraclinus integripinnis reef finspot 2 0.08 2 0.01 Paralabrax clathratus kelp bass 1 0.04 29 0.07 Paralabrax maculatofasciatus spotted sand bass 203 7.61 15442 36.03Paralabrax nebulifer barred sand bass 93 3.49 1010 2.36 Paralichthys californicus California halibut 10 0.38 1338 3.12 Syngnathus leptorhynchus bay pipefish 279 10.47 108 0.25 Synodus lucioceps California lizardfish 2 0.08 23 0.05 Urobatis halleri round stingray 120 4.50 16883 39.39Number of Species = 23 2,666 42,858
Black Perch
19
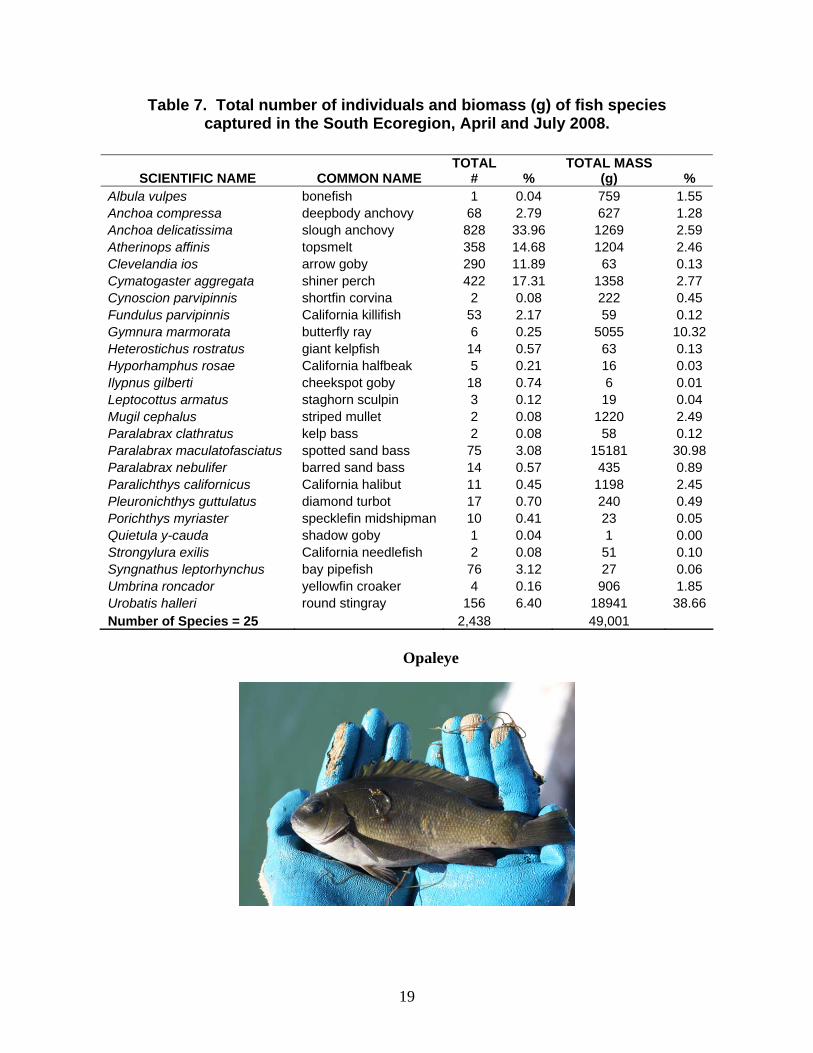
Table 7. Total number of individuals and biomass (g) of fish species captured in the South Ecoregion, April and July 2008.
SCIENTIFIC NAME COMMON NAME TOTAL
# % TOTAL MASS
(g) % Albula vulpes bonefish 1 0.04 759 1.55 Anchoa compressa deepbody anchovy 68 2.79 627 1.28 Anchoa delicatissima slough anchovy 828 33.96 1269 2.59 Atherinops affinis topsmelt 358 14.68 1204 2.46 Clevelandia ios arrow goby 290 11.89 63 0.13 Cymatogaster aggregata shiner perch 422 17.31 1358 2.77 Cynoscion parvipinnis shortfin corvina 2 0.08 222 0.45 Fundulus parvipinnis California killifish 53 2.17 59 0.12 Gymnura marmorata butterfly ray 6 0.25 5055 10.32Heterostichus rostratus giant kelpfish 14 0.57 63 0.13 Hyporhamphus rosae California halfbeak 5 0.21 16 0.03 Ilypnus gilberti cheekspot goby 18 0.74 6 0.01 Leptocottus armatus staghorn sculpin 3 0.12 19 0.04 Mugil cephalus striped mullet 2 0.08 1220 2.49 Paralabrax clathratus kelp bass 2 0.08 58 0.12 Paralabrax maculatofasciatus spotted sand bass 75 3.08 15181 30.98Paralabrax nebulifer barred sand bass 14 0.57 435 0.89 Paralichthys californicus California halibut 11 0.45 1198 2.45 Pleuronichthys guttulatus diamond turbot 17 0.70 240 0.49 Porichthys myriaster specklefin midshipman 10 0.41 23 0.05 Quietula y-cauda shadow goby 1 0.04 1 0.00 Strongylura exilis California needlefish 2 0.08 51 0.10 Syngnathus leptorhynchus bay pipefish 76 3.12 27 0.06 Umbrina roncador yellowfin croaker 4 0.16 906 1.85 Urobatis halleri round stingray 156 6.40 18941 38.66Number of Species = 25 2,438 49,001
Opaleye
20
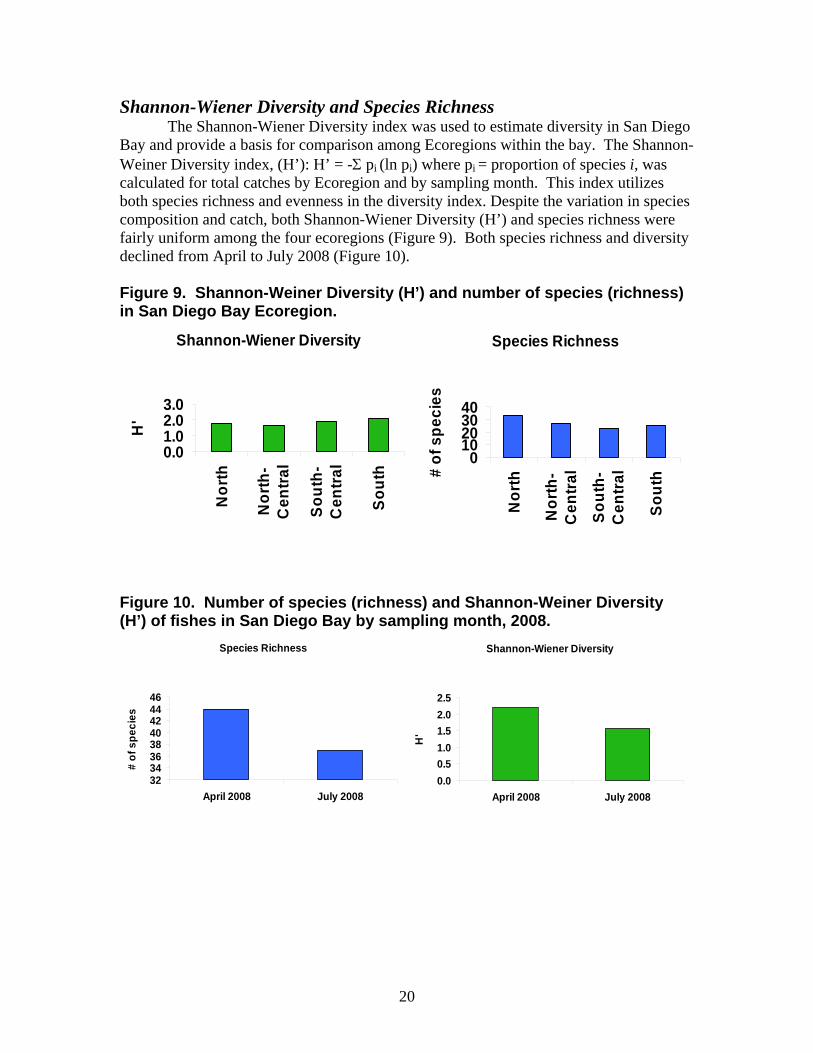
Shannon-Wiener Diversity and Species Richness The Shannon-Wiener Diversity index was used to estimate diversity in San Diego
Bay and provide a basis for comparison among Ecoregions within the bay. The Shannon-Weiner Diversity index, (H’): H’ = -Σ pi (ln pi) where pi = proportion of species i, was calculated for total catches by Ecoregion and by sampling month. This index utilizes both species richness and evenness in the diversity index. Despite the variation in species composition and catch, both Shannon-Wiener Diversity (H’) and species richness were fairly uniform among the four ecoregions (Figure 9). Both species richness and diversity declined from April to July 2008 (Figure 10). Figure 9. Shannon-Weiner Diversity (H’) and number of species (richness) in San Diego Bay Ecoregion.
Figure 10. Number of species (richness) and Shannon-Weiner Diversity (H’) of fishes in San Diego Bay by sampling month, 2008.
Shannon-Wiener Diversity
0.00.51.01.52.02.5
April 2008 July 2008
H'
Species Richness
3234363840424446
April 2008 July 2008
# of
spe
cies
Shannon-Wiener Diversity
0.01.02.03.0
Nor
th
Nor
th-
Cen
tral
Sout
h-C
entra
l
Sout
h
H'
Species Richness
010203040
Nor
th
Nor
th-
Cen
tral
Sout
h-C
entra
l
Sout
h# of
spe
cies

21
Catch by Sampling Period and Ecoregion
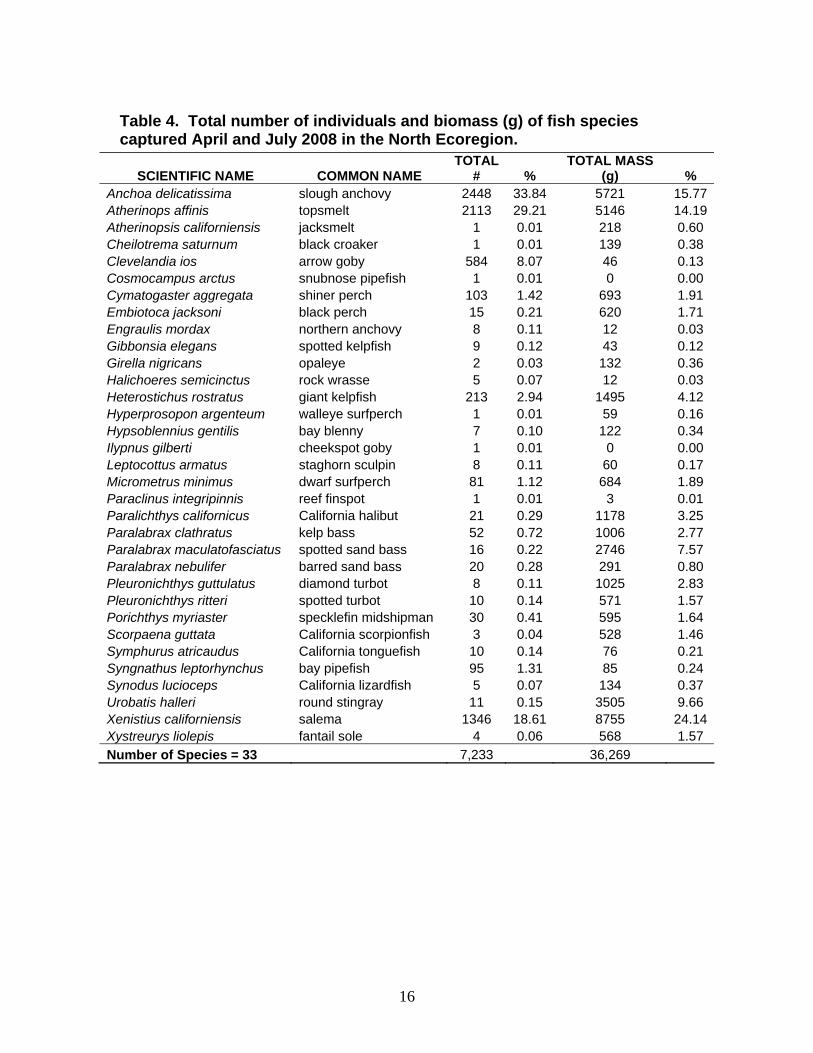
North (Ecoregion 1) – A total of 7,233 fishes belonging to 33 species, weighing 36.2 kg were collected in the North Ecoregion over two sampling periods in 2008 (Table 6). Slough anchovy was the most abundant species (33.8%), followed by topsmelt (29.2%), salema (18.6%), arrow goby (8.1%) and giant kelpfish (2.9%). Salema led in total biomass (24.1%), followed by slough anchovy (5.7%), topsmelt (5.1%), round stingray (3.5%) and spotted sand bass (2.7%).
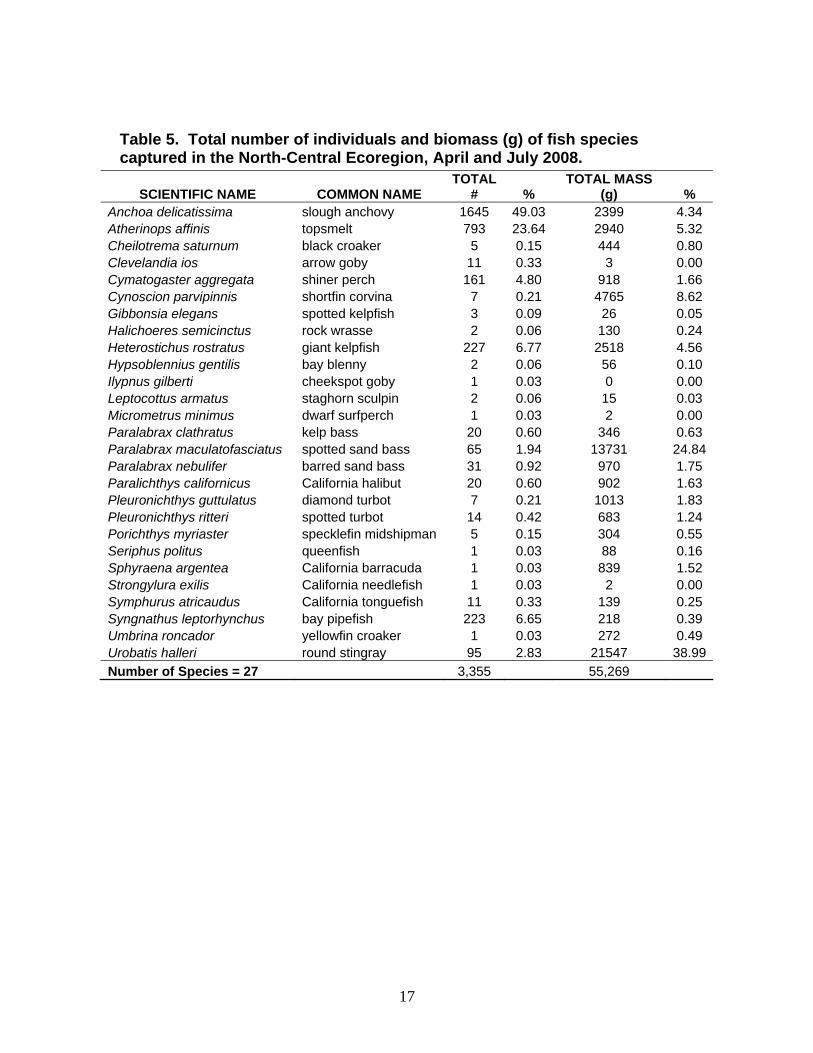
North-Central (Ecoregion 2) - A total of 3,355 fishes belonging to 27 species, weighing 55 kg were collected in the North-Central Ecoregion over two sampling periods in 2008 (Table 7). Slough anchovy was the most abundant species (49.0%), followed by topsmelt (23.6%), giant kelpfish (6.8%), bay pipefish (6.7%) and shiner perch (4.8%). Spotted sand bass led in total biomass (24.8%), followed by shortfin corvina (8.6%), topsmelt (5.3%), giant kelpfish (4.6%) and slough anchovy (4.3%).
South-Central (Ecoregion 3) - A total of 2,666 fishes belonging to 23 species,
weighing 43 kg were collected in the South-Central Ecoregion over the two sampling periods in 2008 (Table 8). Shiner perch was the most abundant species (38.0%), followed by sough anchovy (23.1%), bay pipefish (10.5%), spotted sand bass (7.6%) and topsmelt (4.9%). Spotted sand bass led in total biomass (36.0%), followed by California corbina (5.7%), shiner perch (5.3%), California halibut (3.1%) and barred sand bass (2.4%).
South (Ecoregion 4) - A total of 2,438 fishes belonging to 25 species, weighing
49 kg were collected in the South Ecoregion in April and July 2008 (Table 9). Slough anchovy was the most abundant species (34.0%), followed by shiner perch (17.3%), topsmelt (14.7%), arrow goby (11.9%) and round stingray (6.4%). Spotted sand bass led in total biomass (31.0%), followed by butterfly ray (10.3%), shiner perch (2.8%), slough anchovy (2.6%) and topsmelt (2.5%).
In April 2008, 6,523 individuals comprising 44 species of fishes were captured (Figure 11, Table 8). In July, the catch increased to 9,169 fish, but species richness decreased to 37 species. Total biomass was greater in April (103 kg) than July (81 kg) (Figure 12, Table 9). With the exception of the North-Central Ecoregion, biomass decreased in all ecoregions in the July survey (Figure 12).

22
Figure 11. Total catch of fishes (above) and biomass (below) in San Diego Bay by sampling period, 2008.
Figure 12. Biomass (kg) of fishes by Ecoregion and sampling month in San Diego Bay, 2008.
0
5000
10000
15000
20000
25000
30000
35000
April 2008 July 2008
Bio
mas
s (g
)
North
North-Central
South-Central
South
0
20000
40000
60000
80000
100000
120000
April 2008 July 2008
Bio
mas
s (g
)
0100020003000400050006000700080009000
10000
April 2008 July 2008
# in
divi
dual
s

23
Table 8. Total catch of fish species taken in San Diego Bay by 2008 sampling period.
SCIENTIFIC NAME COMMON NAME April 2008 July 2008 TOTAL % Albula vulpes bonefish 1 1 0.01 Anchoa compressa deepbody anchovy 57 15 72 0.46 Anchoa delicatissima slough anchovy 778 4760 5538 35.29Atherinops affinis topsmelt 1192 2202 3394 21.63Atherinopsis californiensis jacksmelt 1 1 0.01 Atractoscion nobilis white seabass 1 1 0.01 Cheilotrema saturnum black croaker 2 4 6 0.04 Clevelandia ios arrow goby 260 667 927 5.91 Cosmocampus arctus snubnose pipefish 1 1 0.01 Cymatogaster aggregata shiner perch 1559 141 1700 10.83Cynoscion parvipinnis shortfin corvina 9 9 0.06 Embiotoca jacksoni black surfperch 8 7 15 0.10 Engraulis mordax northern anchovy 8 2 10 0.06 Fundulus parvipinnis California killifish 1 53 54 0.34 Gibbonsia elegans spotted kelpfish 3 9 12 0.08 Girella nigricans opaleye 1 1 2 0.01 Gymnura marmorata California butterfly ray 4 2 6 0.04 Halichoeres semicinctus rock wrasse 5 2 7 0.04 Heterostichus rostratus giant kelpfish 220 330 550 3.50 Hippocampus ingens Pacific seahorse 1 1 0.01 Hyperprosopon argenteum walleye surfperch 1 1 0.01 Hyporhamphus rosae California halfbeak 11 3 14 0.09 Hypsoblennius gentilis bay blenny 3 9 12 0.08 Ilypnus gilberti cheekspot goby 5 15 20 0.13 Leptocottus armatus staghorn sculpin 32 1 33 0.21 Menticirrhus undulatus California corbina 1 1 0.01 Micrometrus minimus dwarf surfperch 22 60 82 0.52 Mugil cephalus striped mullet 2 2 0.01 Paraclinus integripinnis reef finspot 1 2 3 0.02 Paralabrax clathratus kelp bass 44 31 75 0.48 Paralabrax maculatofasciatus spotted sand bass 253 106 359 2.29 Paralabrax nebulifer barred sand bass 103 55 158 1.01 Paralichthys californicus California halibut 35 27 62 0.40 Pleuronichthys guttulatus diamond turbot 36 11 47 0.30 Pleuronichthys ritteri spotted turbot 3 21 24 0.15 Porichthys myriaster specklefin midshipman 8 37 45 0.29 Quietula y-cauda shadow goby 1 1 0.01 Scorpaena guttata California scorpionfish 3 3 0.02 Seriphus politus queenfish 1 1 0.01 Sphyraena argentea California barracuda 1 1 0.01 Strongylura exilis California needlefish 2 1 3 0.02 Symphurus atricaudus California tonguefish 9 12 21 0.13 Syngnathus leptorhynchus bay pipefish 291 382 673 4.29 Synodus lucioceps California lizardfish 5 2 7 0.04 Umbrina roncador yellowfin croaker 3 2 5 0.03 Urobatis halleri round stingray 192 190 382 2.43 Xenistius californiensis salema 1346 1346 8.58 Xystreurys liolepis fantail sole 4 4 0.03
Total: 6523 9169 15692 Species Richness: 44 37 48

24
Table 9. Total biomass of fish species taken in San Diego Bay by sampling period.
SCIENTIFIC NAME COMMON NAME April 2008
July 2008 TOTAL %
Albula vulpes bonefish 759 759 0.41 Anchoa compressa deepbody anchovy 497 161 658 0.36 Anchoa delicatissima slough anchovy 1192 8967 10158 5.54 Atherinops affinis topsmelt 7345 2920 10265 5.60 Atherinopsis californiensis jacksmelt 218 218 0.12 Atractoscion nobilis white seabass 291 291 0.16 Cheilotrema saturnum black croaker 190 393 583 0.32 Clevelandia ios arrow goby 42 73 116 0.06 Cosmocampus arctus snubnose pipefish 0 0 0.00 Cymatogaster aggregata shiner surfperch 4448 782 5231 2.85 Cynoscion parvipinnis shortfin corvina 4987 4987 2.72 Embiotoca jacksoni black perch 416 204 620 0.34 Engraulis mordax northern anchovy 12 2 14 0.01 Fundulus parvipinnis California killifish 3 59 62 0.03 Gibbonsia elegans spotted kelpfish 34 34 69 0.04 Girella nigricans opaleye 132 1 132 0.07 Gymnura marmorata California butterfly ray 3830 1225 5055 2.76 Halichoeres semicinctus rock wrasse 12 130 143 0.08 Heterostichus rostratus giant kelpfish 837 3553 4390 2.39 Hippocampus ingens Pacific seahorse 30 30 0.02 Hyperprosopon argenteum walleye surfperch 59 59 0.03 Hyporhamphus rosae California halfbeak 36 15 51 0.03 Hypsoblennius gentilis bay blenny 31 215 246 0.13 Ilypnus gilberti cheekspot goby 2 5 6 0.00 Leptocottus armatus staghorn sculpin 315 4 319 0.17 Menticirrhus undulatus California corbina 2450 2450 1.34 Micrometrus minimus dwarf surfperch 373 313 686 0.37 Mugil cephalus striped mullet 1220 1220 0.67 Paraclinus integripinnis reef finspot 3 2 5 0.00 Paralabrax clathratus kelp bass 806 633 1438 0.78 Paralabrax maculatofasciatus spotted sand bass 25931 21170 47100 25.68Paralabrax nebulifer barred sand bass 1233 1473 2706 1.48 Paralichthys californicus California halibut 2970 1647 4617 2.52 Pleuronichthys guttulatus diamond turbot 1560 1282 2842 1.55 Pleuronichthys ritteri spotted turbot 94 1160 1254 0.68 Porichthys myriaster specklefin midshipman 910 12 923 0.50 Quietula y-cauda shadow goby 1 1 0.00 Scorpaena guttata California scorpionfish 528 528 0.29 Seriphus politus queenfish 88 88 0.05 Sphyraena argentea California barracuda 839 839 0.46 Strongylura exilis California needlefish 51 2 53 0.03 Symphurus atricaudus California tonguefish 106 109 215 0.12 Syngnathus leptorhynchus bay pipefish 179 260 439 0.24 Synodus lucioceps California lizardfish 33 123 156 0.09 Umbrina roncador yellowfin croaker 862 316 1178 0.64 Urobatis halleri round stingray 28504 32372 60876 33.19Xenistius californiensis salema 8755 8755 4.77 Xystreurys liolepis fantail sole 568 568 0.31 Number of Species = 48 102,891 80,505 183,396

25
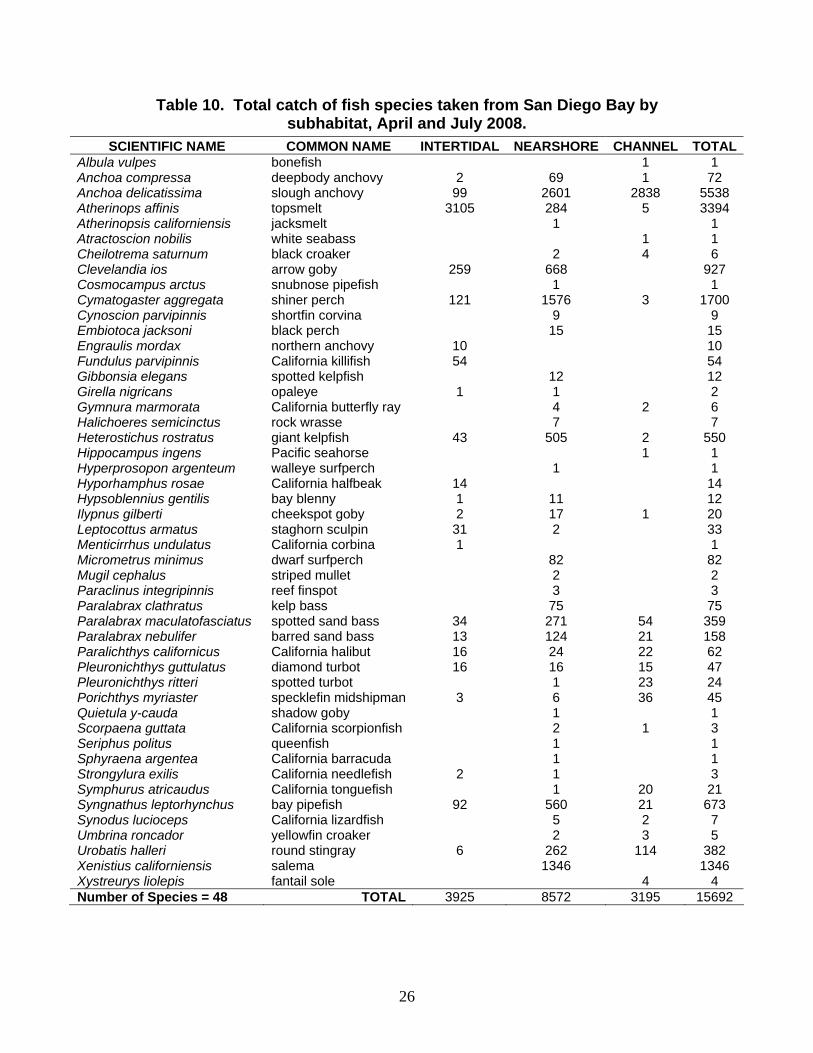
Catch in Bay Habitats Of three bay habitats (intertidal, nearshore and channel) the greatest catch of
fishes was in the nearshore (8,572; Table 10). 3,195 fishes from 24 species were captured in the channel stations and 3,925 were surveyed in the intertidal stations (Table 10). A total of 7,582 fishes were taken in vegetated areas (Table 11). In the vegetated areas 43 of the 48 species surveyed in these study periods were found. 4,915 fishes comprising 32 species were caught in the nearshore non-vegetated areas.
Dwarf Surfperch
26
Table 10. Total catch of fish species taken from San Diego Bay by subhabitat, April and July 2008.
SCIENTIFIC NAME COMMON NAME INTERTIDAL NEARSHORE CHANNEL TOTALAlbula vulpes bonefish 1 1 Anchoa compressa deepbody anchovy 2 69 1 72 Anchoa delicatissima slough anchovy 99 2601 2838 5538 Atherinops affinis topsmelt 3105 284 5 3394 Atherinopsis californiensis jacksmelt 1 1 Atractoscion nobilis white seabass 1 1 Cheilotrema saturnum black croaker 2 4 6 Clevelandia ios arrow goby 259 668 927 Cosmocampus arctus snubnose pipefish 1 1 Cymatogaster aggregata shiner perch 121 1576 3 1700 Cynoscion parvipinnis shortfin corvina 9 9 Embiotoca jacksoni black perch 15 15 Engraulis mordax northern anchovy 10 10 Fundulus parvipinnis California killifish 54 54 Gibbonsia elegans spotted kelpfish 12 12 Girella nigricans opaleye 1 1 2 Gymnura marmorata California butterfly ray 4 2 6 Halichoeres semicinctus rock wrasse 7 7 Heterostichus rostratus giant kelpfish 43 505 2 550 Hippocampus ingens Pacific seahorse 1 1 Hyperprosopon argenteum walleye surfperch 1 1 Hyporhamphus rosae California halfbeak 14 14 Hypsoblennius gentilis bay blenny 1 11 12 Ilypnus gilberti cheekspot goby 2 17 1 20 Leptocottus armatus staghorn sculpin 31 2 33 Menticirrhus undulatus California corbina 1 1 Micrometrus minimus dwarf surfperch 82 82 Mugil cephalus striped mullet 2 2 Paraclinus integripinnis reef finspot 3 3 Paralabrax clathratus kelp bass 75 75 Paralabrax maculatofasciatus spotted sand bass 34 271 54 359 Paralabrax nebulifer barred sand bass 13 124 21 158 Paralichthys californicus California halibut 16 24 22 62 Pleuronichthys guttulatus diamond turbot 16 16 15 47 Pleuronichthys ritteri spotted turbot 1 23 24 Porichthys myriaster specklefin midshipman 3 6 36 45 Quietula y-cauda shadow goby 1 1 Scorpaena guttata California scorpionfish 2 1 3 Seriphus politus queenfish 1 1 Sphyraena argentea California barracuda 1 1 Strongylura exilis California needlefish 2 1 3 Symphurus atricaudus California tonguefish 1 20 21 Syngnathus leptorhynchus bay pipefish 92 560 21 673 Synodus lucioceps California lizardfish 5 2 7 Umbrina roncador yellowfin croaker 2 3 5 Urobatis halleri round stingray 6 262 114 382 Xenistius californiensis salema 1346 1346 Xystreurys liolepis fantail sole 4 4 Number of Species = 48 TOTAL 3925 8572 3195 15692

27
Table 11. Total catch of fish species taken from San Diego Bay, 2008 by vegetated, non-vegetated and channel stations.
SCIENTIFIC NAME COMMON NAME CHANNELNON-VEG VEG TOTAL
Albula vulpes bonefish 1 1 Anchoa compressa deepbody anchovy 1 21 50 72 Anchoa delicatissima slough anchovy 2838 920 1780 5538 Atherinops affinis topsmelt 5 2156 1233 3394 Atherinopsis californiensis jacksmelt 1 1 Atractoscion nobilis white seabass 1 1 Cheilotrema saturnum black croaker 4 1 1 6 Clevelandia ios arrow goby 245 682 927 Cosmocampus arctus snubnose pipefish 1 1 Cymatogaster aggregata shiner perch 3 374 1323 1700 Cynoscion parvipinnis shortfin corvina 1 8 9 Embiotoca jacksoni black perch 4 11 15 Engraulis mordax northern anchovy 1 9 10 Fundulus parvipinnis California killifish 54 54 Gibbonsia elegans spotted kelpfish 5 7 12 Girella nigricans opaleye 2 2 Gymnura marmorata California butterfly ray 2 2 2 6 Halichoeres semicinctus rock wrasse 1 6 7 Heterostichus rostratus giant kelpfish 2 305 243 550 Hippocampus ingens Pacific seahorse 1 1 Hyperprosopon argenteum walleye surfperch 1 1 Hypsoblennius gentilis bay blenny 9 3 12 Hyporhamphus rosae California halfbeak 7 7 14 Ilypnus gilberti cheekspot goby 1 6 13 20 Leptocottus armatus staghorn sculpin 4 29 33 Menticirrhus undulatus California corbina 1 1 Micrometrus minimus dwarf surfperch 40 42 82 Mugil cephalus striped mullet 1 1 2 Paralichthys californicus California halibut 22 14 26 62 Paralabrax clathratus kelp bass 23 52 75 Paraclinus integripinnis reef finspot 2 1 3 Paralabrax maculatofasciatus spotted sand bass 54 175 130 359 Paralabrax nebulifer barred sand bass 21 97 40 158 Pleuronichthys guttulatus diamond turbot 15 3 29 47 Pleuronichthys ritteri spotted turbot 23 1 24 Porichthys myriaster specklefin midshipman 36 8 1 45 Quietula y-cauda shadow goby 1 1 Scorpaena guttata California scorpionfish 1 2 3 Seriphus politus queenfish 1 1 Sphyraena argentea California barracuda 1 1 Strongylura exilis California needlefish 1 2 3 Symphurus atricaudus California tonguefish 20 1 21 Syngnathus leptorhynchus bay pipefish 21 344 308 673 Synodus lucioceps California lizardfish 2 4 1 7 Umbrina roncador yellowfin croaker 3 2 5 Urobatis halleri round stingray 114 106 162 382 Xenistius californiensis salema 34 1312 1346 Xystreurys liolepis fantail sole 4 4 Total: 3195 4915 7582 15692 Species Richness: 24 32 43 48

28
Nursery Area Function San Diego Bay continues to be a nursery area for the great majority of the fishes found there. Approximately 62% of all fishes sampled in San Diego Bay were juveniles (Table 12). In terms of percent juveniles captured, the top four species (northern anchovy, California halibut, kelp bass and barred sand bass) are all critical commercial and recreational species. The high catch of juvenile fishes in San Diego Bay highlights the continued importance of San Diego Bay as a nursery area for bay, estuarine and nearshore species Table 12. Percent of juveniles taken of the top 35 species of fish from San Diego Bay.
SCIENTIFIC NAME COMMON NAME % JUVENILES Engraulis mordax northern anchovy 100 Paralichthys californicus California halibut 100 Paralabrax clathratus kelp bass 100 Paralabrax nebulifer barred sand bass 100 Xenistius californiensis salema 100 Heterostichus rostratus giant kelpfish 97.8 Porichthys myriaster specklefin midshipman 95.6 Fundulus parvipinnis California killifish 94.4 Gibbonsia elegans spotted kelpfish 91.7 Embiotoca jacksoni black perch 86.7 Cymatogaster aggregata shiner perch 86.1 Halichoeres semicinctus rock wrasse 85.7 Clevelandia ios arrow goby 80.8 Syngnathus leptorhynchus bay pipefish 80.5 Urobatis halleri round stingray 80.4 Atherinops affinis topsmelt 75.6 Pleuronichthys guttulatus diamond turbot 57.4 Synodus lucioceps California lizardfish 57.1 Paralabrax maculatofasciatus spotted sand bass 57.1 Micrometrus minimus dwarf surfperch 42.7 Umbrina roncador yellowfin croaker 40.0 Cheilotrema saturnum black croaker 33.3 Cynoscion parvipinnis shortfin corvina 33.3 Paraclinus integripinnis reef finspot 33.3 Scorpaena guttata California scorpionfish 33.3 Anchoa delicatissima slough anchovy 26.5 Xystreurys liolepis fantail sole 25.0 Gymnura marmorata California butterfly ray 16.7 Hypsoblennius gentilis bay blenny 16.7 Hyporhamphus rosae California halfbeak 7.1 Anchoa compressa deepbody anchovy 6.9 Ilypnus gilberti cheekspot goby 5.0 Pleuronichthys ritteri spotted turbot 4.2 Leptocottus armatus staghorn sculpin 3.0 Symphurus atricaudus California tonguefish 0.0 Total: 61.8
29
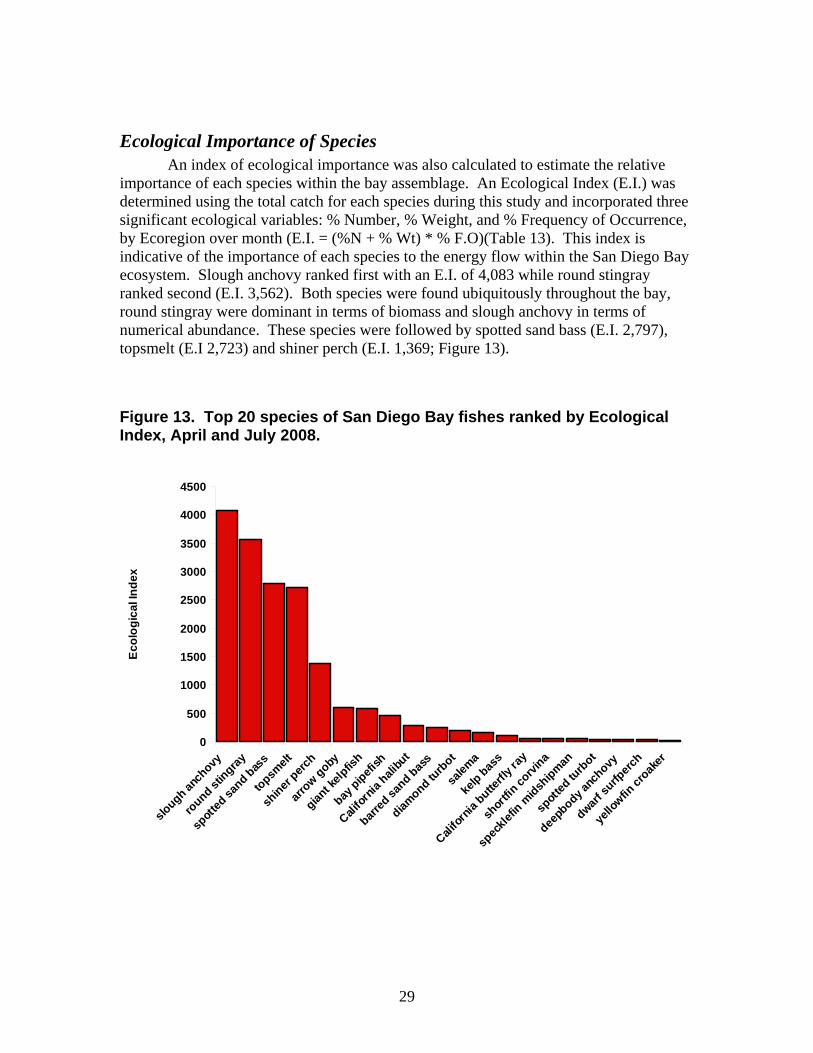
Ecological Importance of Species An index of ecological importance was also calculated to estimate the relative importance of each species within the bay assemblage. An Ecological Index (E.I.) was determined using the total catch for each species during this study and incorporated three significant ecological variables: % Number, % Weight, and % Frequency of Occurrence, by Ecoregion over month (E.I. = (%N + % Wt) * % F.O)(Table 13). This index is indicative of the importance of each species to the energy flow within the San Diego Bay ecosystem. Slough anchovy ranked first with an E.I. of 4,083 while round stingray ranked second (E.I. 3,562). Both species were found ubiquitously throughout the bay, round stingray were dominant in terms of biomass and slough anchovy in terms of numerical abundance. These species were followed by spotted sand bass (E.I. 2,797), topsmelt (E.I 2,723) and shiner perch (E.I. 1,369; Figure 13).
Figure 13. Top 20 species of San Diego Bay fishes ranked by Ecological Index, April and July 2008.
0
500
1000
1500
2000
2500
3000
3500
4000
4500
slough a
nchovy
round s
tingray
spott
ed sa
nd bas
s
topsmelt
shiner
perch
arrow goby
giant k
elpfis
h
bay pipefi
sh
Califor
nia hali
but
barred
sand b
ass
diamond tu
rbot
salem
a
kelp bas
s
Califor
nia butte
rfly r
ay
shor
tfin co
rvina
spec
klefin
midsh
ipman
spott
ed tu
rbot
deepb
ody anc
hovy
dwarf su
rfperc
h
yello
wfin cr
oaker
Ecol
ogic
al In
dex
30
Table 13. Relative abundance (%N), relative biomass (%WT), frequency of occurrence, and ecological index (EI) of San Diego Bay fishes, April and July, 2008.
RANK SCIENTIFIC NAME COMMON NAME %N %WT %FREQ EI 1 Anchoa delicatissima slough anchovy 35.29 5.54 100 4083.092 Urobatis halleri round stingray 2.43 33.19 100 3562.823 Paralabrax maculatofasciatus spotted sand bass 2.29 25.68 100 2797.014 Atherinops affinis topsmelt 21.63 5.60 100 2722.595 Cymatogaster aggregata shiner perch 10.83 2.85 100 1368.586 Clevelandia ios arrow goby 5.91 0.06 100 597.05 7 Heterostichus rostratus giant kelpfish 3.50 2.39 100 589.87 8 Syngnathus leptorhynchus bay pipefish 4.29 0.24 100 452.81 9 Paralichthys californicus California halibut 0.40 2.52 100 291.25 10 Paralabrax nebulifer barred sand bass 1.01 1.48 100 248.26 11 Pleuronichthys guttulatus diamond turbot 0.30 1.55 100 184.90 12 Xenistius californiensis salema 8.58 4.77 12.5 166.89 13 Paralabrax clathratus kelp bass 0.48 0.78 87.5 110.45 14 Gymnura marmorata California butterfly ray 0.04 2.76 25 69.86 15 Cynoscion parvipinnis shortfin corvina 0.06 2.72 25 69.41 16 Porichthys myriaster specklefin midshipman 0.29 0.50 75 59.23 17 Pleuronichthys ritteri spotted turbot 0.15 0.68 50 41.83 18 Anchoa compressa deepbody anchovy 0.46 0.36 50 40.89 19 Micrometrus minimus dwarf surfperch 0.52 0.37 37.5 33.62 20 Umbrina roncador yellowfin croaker 0.03 0.64 37.5 25.28 21 Leptocottus armatus staghorn sculpin 0.21 0.17 62.5 24.02 22 Menticirrhus undulatus California corbina 0.01 1.34 12.5 16.78 23 Cheilotrema saturnum black croaker 0.04 0.32 37.5 13.35 24 Hypsoblennius gentilis bay blenny 0.08 0.13 62.5 13.15 25 Symphurus atricaudus California tonguefish 0.13 0.12 50 12.56 26 Embiotoca jacksoni black perch 0.10 0.34 25 10.85 27 Fundulus parvipinnis California killifish 0.34 0.03 25 9.44 28 Mugil cephalus striped mullet 0.01 0.67 12.5 8.47 29 Ilypnus gilberti cheekspot goby 0.13 0.00 50 6.55 30 Sphyraena argentea California barracuda 0.01 0.46 12.5 5.79 31 Albula vulpes bonefish 0.01 0.41 12.5 5.25 32 Synodus lucioceps California lizardfish 0.04 0.09 37.5 4.87 33 Hyporhamphus rosae California halfbeak 0.09 0.03 37.5 4.39 34 Gibbonsia elegans spotted kelpfish 0.08 0.04 37.5 4.27 35 Xystreurys liolepis fantail sole 0.03 0.31 12.5 4.19 36 Scorpaena guttata California scorpionfish 0.02 0.29 12.5 3.84 37 Halichoeres semicinctus rock wrasse 0.04 0.08 25 3.06 38 Girella nigricans opaleye 0.01 0.07 25 2.12 39 Atractoscion nobilis white seabass 0.01 0.16 12.5 2.06 40 Engraulis mordax northern anchovy 0.06 0.01 25 1.78 41 Atherinopsis californiensis jacksmelt 0.01 0.12 12.5 1.56 42 Strongylura exilis California needlefish 0.02 0.03 25 1.19 43 Seriphus politus queenfish 0.01 0.05 12.5 0.68 44 Paraclinus integripinnis reef finspot 0.02 0.00 25 0.55 45 Hyperprosopon argenteum walleye surfperch 0.01 0.03 12.5 0.48 46 Hippocampus ingens Pacific seahorse 0.01 0.02 12.5 0.28 47 Quietula y-cauda shadow goby 0.01 0.00 12.5 0.08 48 Cosmocampus arctus snubnose pipefish 0.01 0.00 12.5 0.08
31
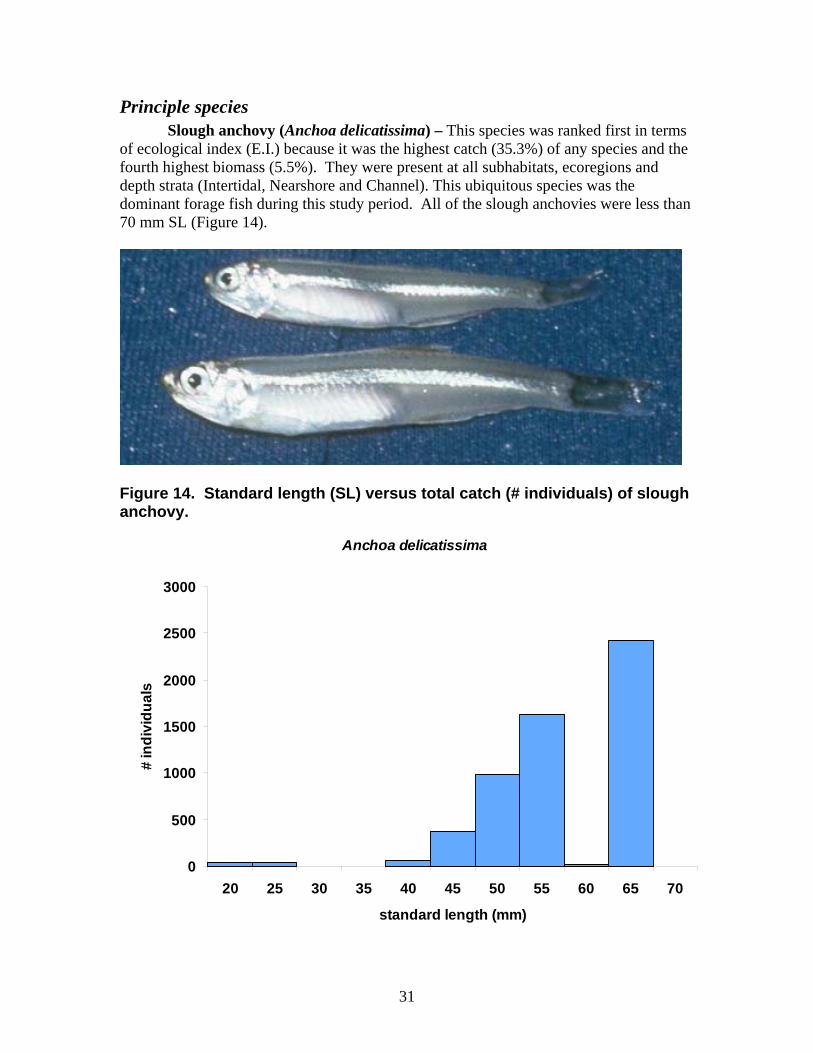
Principle species Slough anchovy (Anchoa delicatissima) – This species was ranked first in terms
of ecological index (E.I.) because it was the highest catch (35.3%) of any species and the fourth highest biomass (5.5%). They were present at all subhabitats, ecoregions and depth strata (Intertidal, Nearshore and Channel). This ubiquitous species was the dominant forage fish during this study period. All of the slough anchovies were less than 70 mm SL (Figure 14).
Figure 14. Standard length (SL) versus total catch (# individuals) of slough anchovy.
Anchoa delicatissima
0
500
1000
1500
2000
2500
3000
20 25 30 35 40 45 50 55 60 65 70
standard length (mm)
# in
divi
dual
s
32
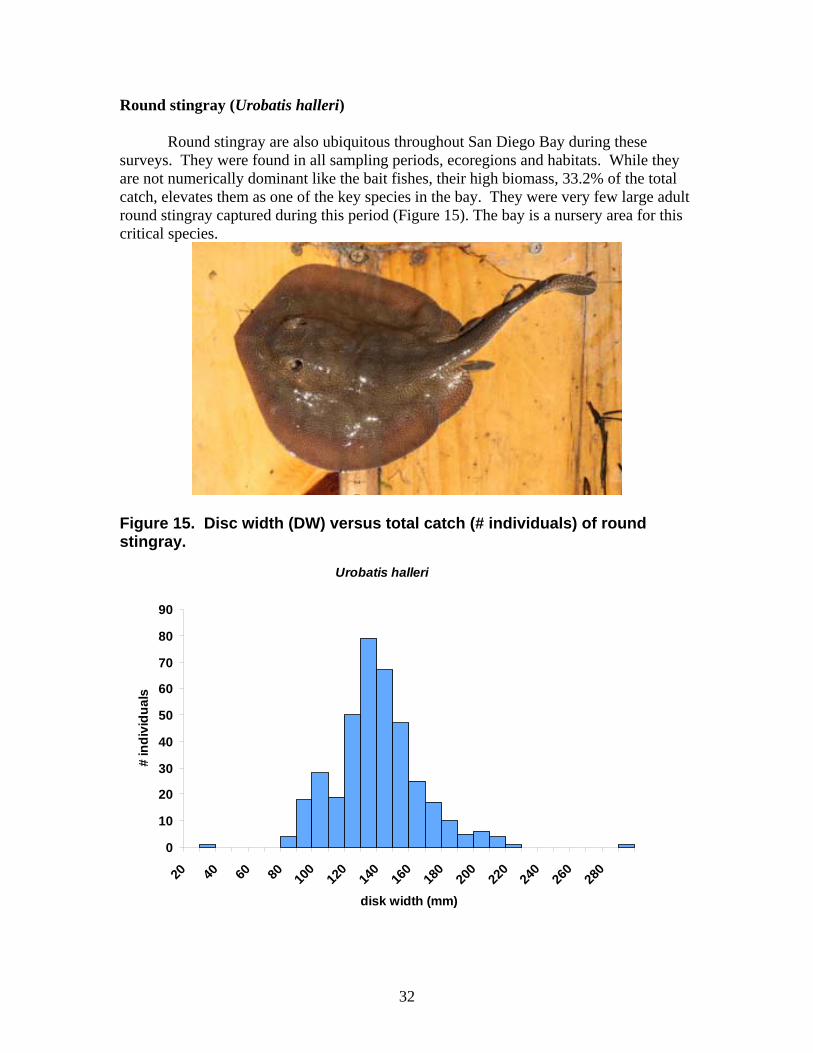
Round stingray (Urobatis halleri)
Round stingray are also ubiquitous throughout San Diego Bay during these surveys. They were found in all sampling periods, ecoregions and habitats. While they are not numerically dominant like the bait fishes, their high biomass, 33.2% of the total catch, elevates them as one of the key species in the bay. They were very few large adult round stingray captured during this period (Figure 15). The bay is a nursery area for this critical species.
Figure 15. Disc width (DW) versus total catch (# individuals) of round stingray.
Urobatis halleri
0
10
20
30
40
50
60
70
80
90
20 40 60 80 100
120
140
160
180
200
220
240
260
280
disk width (mm)
# in
divi
dual
s

33
Spotted sand bass (Paralabrax maculatofasciatus)
Spotted sand bass are the ubiquitous mesocarnivore in San Diego Bay. They are dominant in terms of total catch and biomass. This important recreational fish species primarily utilizes bays and estuaries along the Southern California coastline. There was a bimodal distribution in size classes of spotted sand bass (Figure 16) indicating the presence of both juveniles and adult fish.
Figure 16. Standard length (SL) versus total catch (# individuals) of spotted sand bass.
Paralabrax maculatofasciatus
0
10
20
30
40
50
60
20 40 60 80 100
120
140
160
180
200
220
240
260
280
300
standard length (mm)
# in
divi
dual
s

34
Topsmelt (Atherinops affinis)
The second most predominant forage fish in the bay in 2008 was topsmelt. This species was found in all of the bay ecoregions and various bay habitats during both sampling periods. The catch of topsmelt was primarily small individuals (20-40 mm SL) and another age class was present in the 80-110 mm SL size range (Figure 17). Topsmelt were caught primarily in the intertidal strata, with very few individuals captured in the channel. While they were observed in all four ecoregions, the highest catch (5,146) was in the North Ecoregion.
Figure 17. Standard length (SL) versus total catch (# individuals) of topsmelt.
Atherinops affinis
0
100
200
300
400
500
600
700
800
900
1000
20 40 60 80 100
120
140
160
180
200
standard length (mm)
# in
divi
dual
s

35
Shiner perch (Cymatogaster aggregata)
Shiner perch ranked fifth in the ecological index. They were found in all ecoregions and subhabitats. But, like topsmelt, there were very few individuals (3) found in the channel stations. Adult shiner perch, which live offshore, are known to utilize the bay for reproduction. Thus the bimodal distribution (Figure 18) is an indication of this life history pattern. Some larger individuals were present, but the bulk of the stock was young fishes who were typically associated with eelgrass beds.
Figure 18. Standard length (SL) versus total catch (# individuals) of shiner perch.
Cymatogaster aggregata
0
100
200
300
400
500
600
700
800
900
1000
30 40 50 60 70 80 90 100 110 120 130
standard length (mm)
# in
divi
dual
s
36
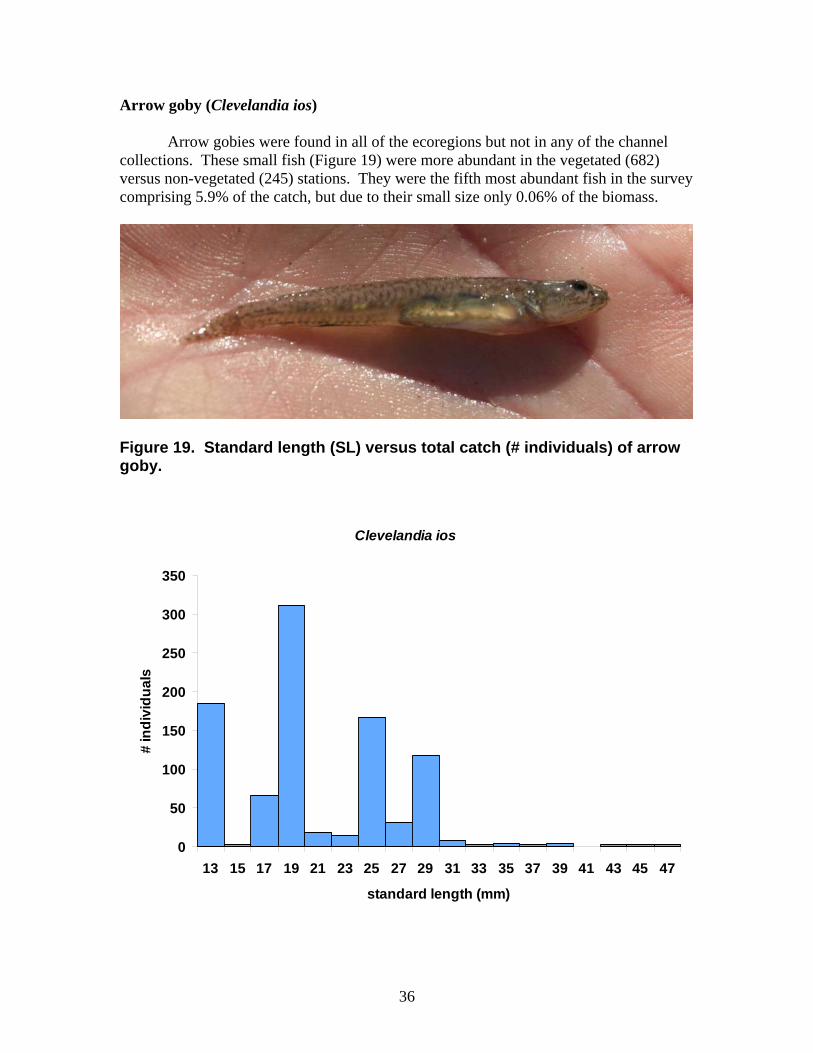
Arrow goby (Clevelandia ios)
Arrow gobies were found in all of the ecoregions but not in any of the channel collections. These small fish (Figure 19) were more abundant in the vegetated (682) versus non-vegetated (245) stations. They were the fifth most abundant fish in the survey comprising 5.9% of the catch, but due to their small size only 0.06% of the biomass.
Figure 19. Standard length (SL) versus total catch (# individuals) of arrow goby.
Clevelandia ios
0
50
100
150
200
250
300
350
13 15 17 19 21 23 25 27 29 31 33 35 37 39 41 43 45 47
standard length (mm)
# in
divi
dual
s

37
Giant kelpfish (Heterostichus rostratus)
Giant kelpfish were present in all ecoregions and habitats. However they were primarily found in the nearshore samples. Only 2 individuals were caught in the channel stations and an order of magnitude fewer were in the intertidal stations (43) when compared to the nearshore stations (505). 97.8% of the fishes captured were juveniles (Figure 20).
Figure 20. Standard length (SL) versus total catch (# individuals) of giant kelpfish.
Heterostichus rostratus
0
20
40
60
80
100
120
30 50 70 90 110
130
150
170
190
210
230
250
270
290
310
standard lenth (mm)
# in
divi
dual
s

38
Bay pipefish (Syngnathus leptorhynchus)
439 bay pipefish were surveyed in all four ecoregions. In addition to being found in all four ecoregions, they were also found in all subhabitats and depth zones. They were caught in greater numbers in the nearshore stations. The distribution of size classes (Figure 21) indicates that all age classes were present during this sampling period. Bay pipefish ranked eighth in the ecological index and are an important resident in the bay.
Figure 21. Standard length (SL) versus total catch (# individuals) of bay pipefish.
Syngnathus leptorhynchus
0
20
40
60
80
100
120
20 30 40 50 60 70 80 90 100
110
120
130
140
150
160
170
180
standard length (mm)
# in
divi
dual
s
39
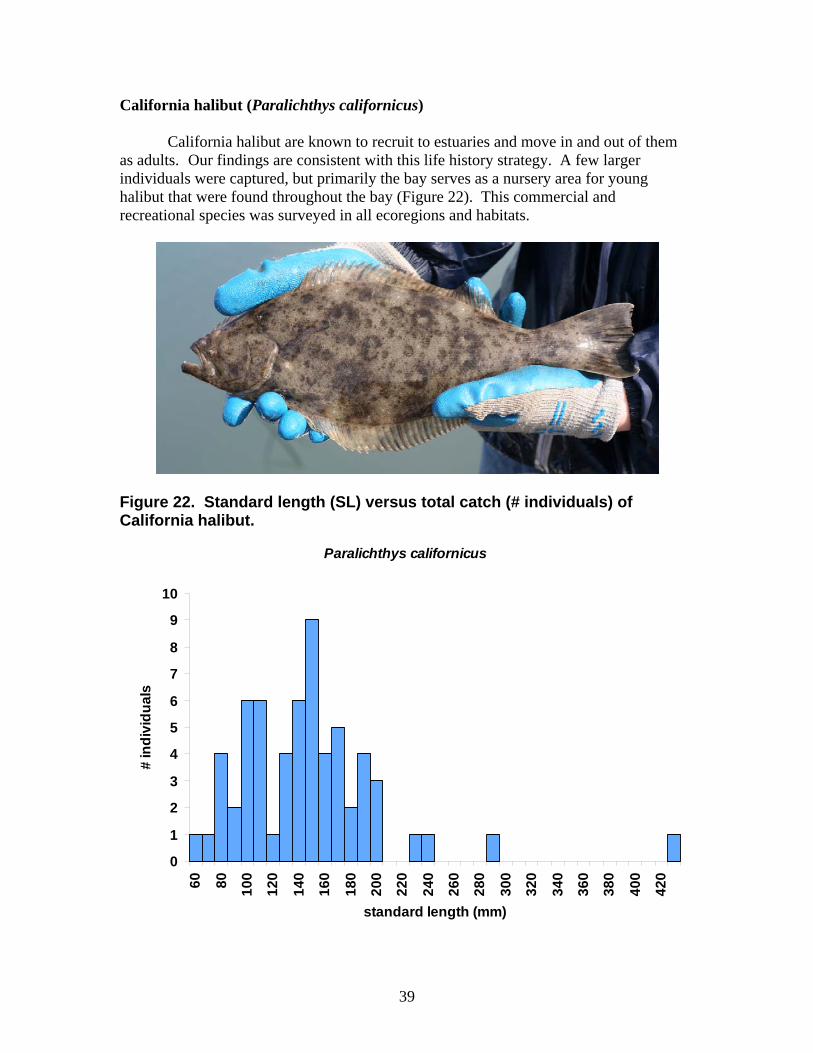
California halibut (Paralichthys californicus)
California halibut are known to recruit to estuaries and move in and out of them as adults. Our findings are consistent with this life history strategy. A few larger individuals were captured, but primarily the bay serves as a nursery area for young halibut that were found throughout the bay (Figure 22). This commercial and recreational species was surveyed in all ecoregions and habitats.
Figure 22. Standard length (SL) versus total catch (# individuals) of California halibut.
Paralichthys californicus
0
1
2
3
4
5
6
7
8
9
10
60 80 100
120
140
160
180
200
220
240
260
280
300
320
340
360
380
400
420
standard length (mm)
# in
divi
dual
s

40
Barred sand bass (Paralabrax nebulifer)
Barred sand bass were ranked tenth in the ecological index. This important recreational species utilizes the bay primarily as juveniles. Based upon the sizes captured (Figure 23) all of these fishes were in their first year of growth. Barred sand bass were present in all ecoregions and habitats.
Figure 23. Standard length (SL) versus total catch (# individuals) of barred sand bass.
Paralabrax nebulifer
0
5
10
15
20
25
30
35
40 50 60 70 80 90 100 110 120 130 140 150 160 170 180
standard length (mm)
# in
divi
dual
s

41
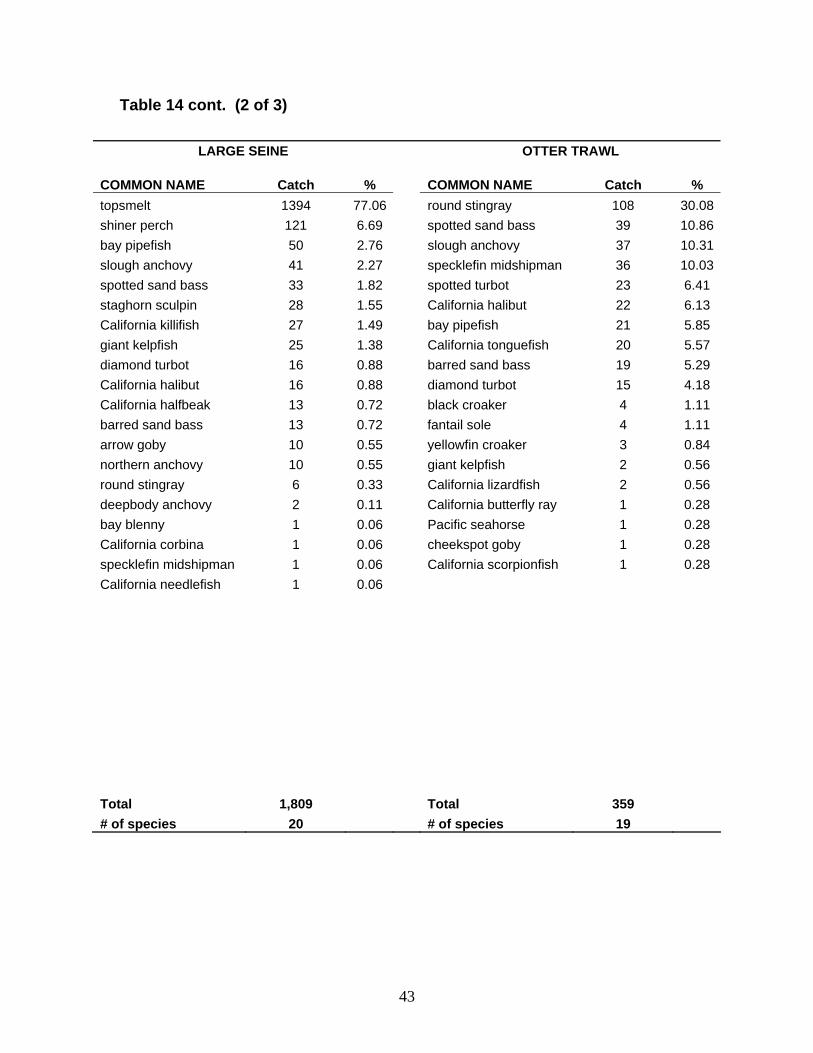
Catch by Sampling Method The greatest number of species were collected in the beam trawl and purse seines (30 species each), followed by large seine (20), otter trawl (19), small seine (12) and square enclosure (5); (Table 14). The purse seine captured the greatest number of fish, catching a total of 8,310. Large numbers of fishes were also caught by the beam trawl (3,098) and the small seine (2,090). The large seine (1,809) had relatively high catches with fewer caught in the otter trawl (359) and were similar in total catch. Only 26 fishes were collected in the square enclosure. The purse seine was most effective sampling the schooling fishes (slough anchovy, salema, shiner perch, and topsmelt). The beam trawl was most effective for catching benthic nearshore and eelgrass fishes (arrow goby, bay pipefish, shiner perch, and giant kelpfish) The square enclosure primarily caught arrow gobies. The large and small beach seines were particularly effective at catching topsmelt. The top species caught in the otter trawls was round stingray. The highest density of fishes were captured in the small seine (0.702 individuals/m2) followed by the square enclosure (0.542 individuals/m2); (Table 15 and 16). The square enclosure produced the highest biomass value (12.3 g/m2) due to the unusual capture of a single adult specklefin midshipmen. The purse seine and beam trawls produced similar amounts of biomass (3.9 and 3.5 g/m2, respectively); (Table 22).
Bay Blenny

42
Table 14. Total catch of fish species taken in San Diego Bay, April and July 2008 by sampling method (gear).
BEAM TRAWL PURSE SEINE COMMON NAME Catch % COMMON NAME Catch % arrow goby 668 21.56 slough anchovy 5198 62.55bay pipefish 556 17.95 salema 1346 16.20shiner perch 490 15.82 shiner perch 1089 13.10giant kelpfish 490 15.82 topsmelt 284 3.42 slough anchovy 204 6.58 spotted sand bass 120 1.44 round stingray 167 5.39 round stingray 101 1.22 spotted sand bass 166 5.36 deepbody anchovy 70 0.84 barred sand bass 110 3.55 kelp bass 24 0.29 dwarf surfperch 81 2.61 barred sand bass 16 0.19 kelp bass 51 1.65 giant kelpfish 15 0.18 cheekspot goby 17 0.55 California halibut 10 0.12 diamond turbot 15 0.48 shortfin corvina 9 0.11 California halibut 14 0.45 bay pipefish 4 0.05 black surfperch 12 0.39 black surfperch 3 0.04 spotted kelpfish 12 0.39 California butterfly ray 3 0.04 bay blenny 11 0.36 striped mullet 2 0.02 rock wrasse 6 0.19 California lizardfish 2 0.02 topsmelt 5 0.16 yellowfin croaker 2 0.02 specklefin midshipman 5 0.16 bonefish 1 0.01 reef finspot 3 0.10 jacksmelt 1 0.01 California lizardfish 3 0.10 white seabass 1 0.01 California butterfly ray 2 0.06 black croaker 1 0.01 staghorn sculpin 2 0.06 rock wrasse 1 0.01 California scorpionfish 2 0.06 walleye surfperch 1 0.01 black croaker 1 0.03 diamond turbot 1 0.01 opaleye 1 0.03 dwarf surfperch 1 0.01 spotted turbot 1 0.03 specklefin midshipman 1 0.01 shadow goby 1 0.03 queenfish 1 0.01 California tonguefish 1 0.03 California barracuda 1 0.01 snubnose pipefish 1 0.03 California needlefish 1 0.01 Total 3,098 Total 8,310 Number of species 30 # of species 30
43
Table 14 cont. (2 of 3)
LARGE SEINE OTTER TRAWL COMMON NAME Catch % COMMON NAME Catch % topsmelt 1394 77.06 round stingray 108 30.08shiner perch 121 6.69 spotted sand bass 39 10.86bay pipefish 50 2.76 slough anchovy 37 10.31slough anchovy 41 2.27 specklefin midshipman 36 10.03spotted sand bass 33 1.82 spotted turbot 23 6.41 staghorn sculpin 28 1.55 California halibut 22 6.13 California killifish 27 1.49 bay pipefish 21 5.85 giant kelpfish 25 1.38 California tonguefish 20 5.57 diamond turbot 16 0.88 barred sand bass 19 5.29 California halibut 16 0.88 diamond turbot 15 4.18 California halfbeak 13 0.72 black croaker 4 1.11 barred sand bass 13 0.72 fantail sole 4 1.11 arrow goby 10 0.55 yellowfin croaker 3 0.84 northern anchovy 10 0.55 giant kelpfish 2 0.56 round stingray 6 0.33 California lizardfish 2 0.56 deepbody anchovy 2 0.11 California butterfly ray 1 0.28 bay blenny 1 0.06 Pacific seahorse 1 0.28 California corbina 1 0.06 cheekspot goby 1 0.28 specklefin midshipman 1 0.06 California scorpionfish 1 0.28 California needlefish 1 0.06 Total 1,809 Total 359 # of species 20 # of species 19

44
Table 14 cont. (3 of 3)
SMALL SEINE SQUARE ENCLOSURE COMMON NAME Catch % COMMON NAME Catch % topsmelt 1711 81.87 arrow goby 21 80.77arrow goby 228 10.91 giant kelpfish 1 3.846slough anchovy 58 2.775 cheekspot goby 2 7.692bay pipefish 41 1.962 specklefin midshipman 1 3.846California killifish 27 1.292 bay pipefish 1 3.846giant kelpfish 17 0.813 staghorn sculpin 3 0.144 opaleye 1 0.048 California halfbeak 1 0.048 spotted sand bass 1 0.048 specklefin midshipman 1 0.048 California needlefish 1 0.048 Total 2,090 Total 26 Number of species 12 Number of species 5

45
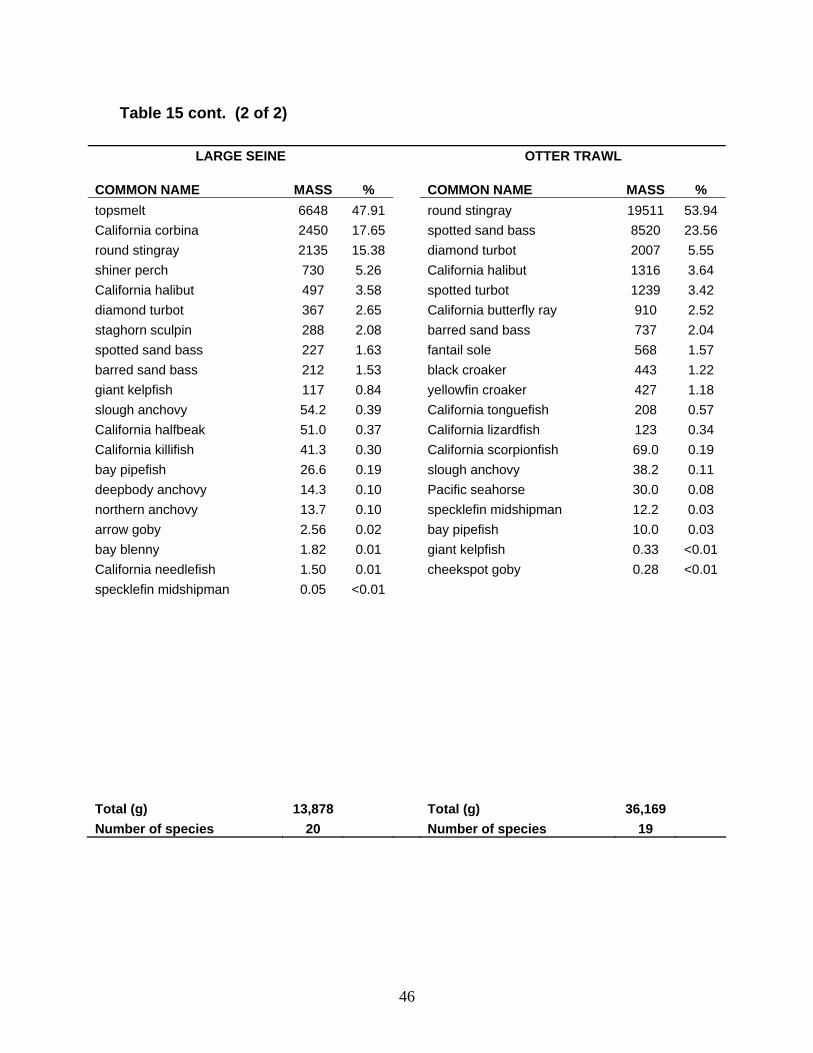
Table 15. Total biomass (g) of fish species taken from San Diego Bay, April and July 2008, ranked by sampling method.
BEAM TRAWL PURSE SEINE COMMON NAME MASS % COMMON NAME MASS % round stingray 25621 52.65 spotted sand bass 28808 34.57 spotted sand bass 9540 19.61 round stingray 13609 16.33 giant kelpfish 4060 8.34 slough anchovy 9808 11.77 California halibut 1676 3.44 salema 8755 10.50 California butterfly ray 1420 2.92 shortfin corvina 4987 5.98 barred sand bass 1209 2.48 shiner perch 3513 4.22 kelp bass 1018 2.09 topsmelt 3412 4.09 shiner perch 988 2.03 California butterfly ray 2725 3.27 dwarf surfperch 684 1.41 striped mullet 1220 1.46 black perch 522 1.07 California halibut 1128 1.35 California scorpionfish 459 0.94 California barracuda 839 1.01 bay pipefish 321 0.66 bonefish 759 0.91 diamond turbot 296 0.61 yellowfin croaker 751 0.90 slough anchovy 252 0.52 deepbody anchovy 644 0.77 bay blenny 244 0.50 barred sand bass 549 0.66 opaleye 132 0.27 kelp bass 421 0.50 arrow goby 72.9 0.15 white seabass 291 0.35 spotted kelpfish 68.5 0.14 jacksmelt 218 0.26 rock wrasse 18.1 0.04 diamond turbot 171 0.21 spotted turbot 15.3 0.03 black croaker 139 0.17 California lizardfish 10.5 0.02 giant kelpfish 126 0.15 staghorn sculpin 8.05 0.02 rock wrasse 125 0.15 California tonguefish 7.68 0.02 black perch 97.9 0.12 cheekspot goby 5.87 0.01 queenfish 88.0 0.11 reef finspot 5.03 0.01 walleye surfperch 58.5 0.07 topsmelt 2.64 0.01 California needlefish 51.0 0.06 black croaker 1.07 <0.01 California lizardfish 22.6 0.03 shadow goby 0.66 <0.01 specklefin midshipman 21.5 0.03 snubnose pipefish 0.40 <0.01 bay pipefish 2.27 <0.01 specklefin midshipman 0.36 <0.01 dwarf surfperch 1.91 <0.01 Total (g) 48,659 Total (g) 83,337 Number of species 30 Number of species 30
46
Table 15 cont. (2 of 2)
LARGE SEINE OTTER TRAWL COMMON NAME MASS % COMMON NAME MASS % topsmelt 6648 47.91 round stingray 19511 53.94 California corbina 2450 17.65 spotted sand bass 8520 23.56 round stingray 2135 15.38 diamond turbot 2007 5.55 shiner perch 730 5.26 California halibut 1316 3.64 California halibut 497 3.58 spotted turbot 1239 3.42 diamond turbot 367 2.65 California butterfly ray 910 2.52 staghorn sculpin 288 2.08 barred sand bass 737 2.04 spotted sand bass 227 1.63 fantail sole 568 1.57 barred sand bass 212 1.53 black croaker 443 1.22 giant kelpfish 117 0.84 yellowfin croaker 427 1.18 slough anchovy 54.2 0.39 California tonguefish 208 0.57 California halfbeak 51.0 0.37 California lizardfish 123 0.34 California killifish 41.3 0.30 California scorpionfish 69.0 0.19 bay pipefish 26.6 0.19 slough anchovy 38.2 0.11 deepbody anchovy 14.3 0.10 Pacific seahorse 30.0 0.08 northern anchovy 13.7 0.10 specklefin midshipman 12.2 0.03 arrow goby 2.56 0.02 bay pipefish 10.0 0.03 bay blenny 1.82 0.01 giant kelpfish 0.33 <0.01 California needlefish 1.50 0.01 cheekspot goby 0.28 <0.01 specklefin midshipman 0.05 <0.01 Total (g) 13,878 Total (g) 36,169 Number of species 20 Number of species 19
47
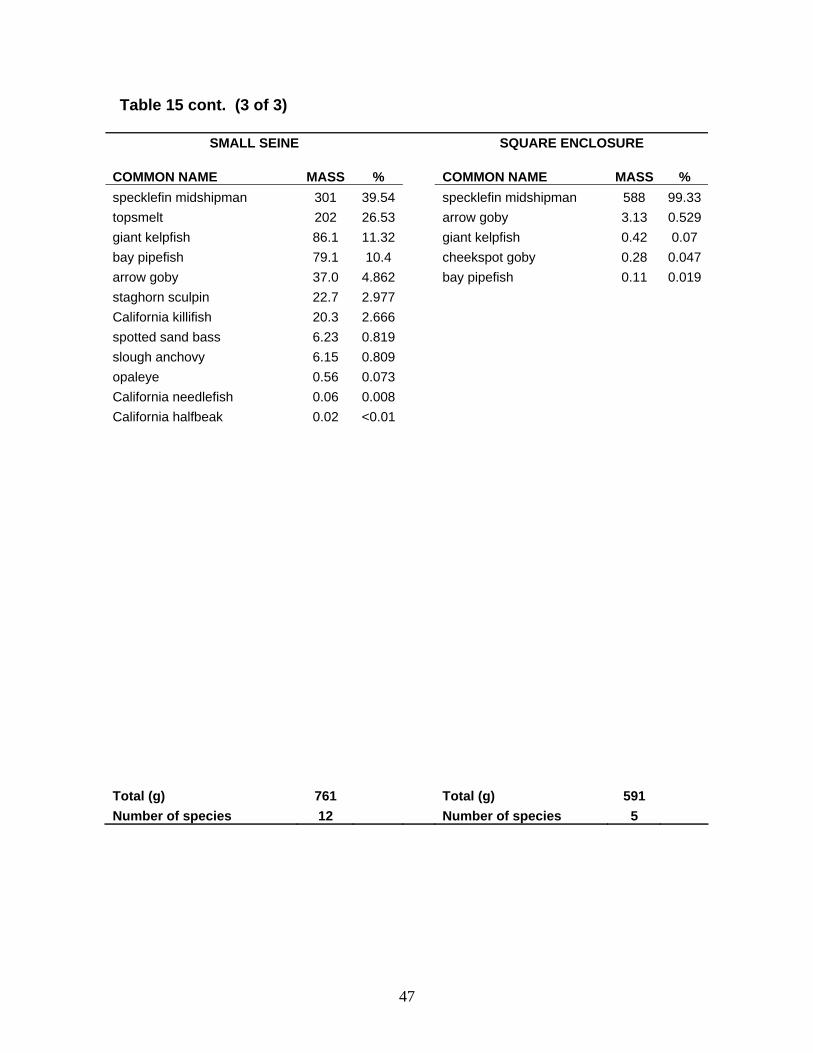
Table 15 cont. (3 of 3)
SMALL SEINE SQUARE ENCLOSURE COMMON NAME MASS % COMMON NAME MASS % specklefin midshipman 301 39.54 specklefin midshipman 588 99.33topsmelt 202 26.53 arrow goby 3.13 0.529giant kelpfish 86.1 11.32 giant kelpfish 0.42 0.07 bay pipefish 79.1 10.4 cheekspot goby 0.28 0.047arrow goby 37.0 4.862 bay pipefish 0.11 0.019staghorn sculpin 22.7 2.977 California killifish 20.3 2.666 spotted sand bass 6.23 0.819 slough anchovy 6.15 0.809 opaleye 0.56 0.073 California needlefish 0.06 0.008 California halfbeak 0.02 <0.01 Total (g) 761 Total (g) 591 Number of species 12 Number of species 5

48
Table 16. Comparison of mean densities and biomass densities by gear type for San Diego Bay 1994-1999 and April, July 2005, April, July 2008.
San Diego Bay 1994-1999 April, July 2005 April, July 2008
Gear #/m2 Gear #/m2 Gear #/m2 LS 0.369 LS 0.676 LS 0.171 SS 2.338 SS 0.440 SS 0.702 SE 3.583 SE 1.042 SE 0.542 BT 0.080 BT 1.164 BT 0.223 PS 1.770 PS 0.569 PS 0.390 OT 0.009 OT 0.032 OT 0.004
Grand Mean 1.358 Grand Mean 0.654 Grand Mean 0.339
Gear g/m2 Gear g/m2 Gear g/m2 LS 1.051 LS 1.684 LS 1.314 SS 0.272 SS 0.216 SS 0.256 SE 0.636 SE 0.176 SE 12.313 BT 2.232 BT 5.137 BT 3.496 PS 6.306 PS 5.579 PS 3.910 OT 1.678 OT 1.425 OT 0.416
Grand Mean 2.029 Grand Mean 2.370 Grand Mean 3.617
Butterfly Ray

49
Ecoregion Comparisons: Best Estimates of Density and Standing Stock
Density estimates used for the standing stock assessment were determined using the Best Estimate of Density within each Ecoregion. The best density estimate was determined in the following manner:
1) Sample densities estimated by gear type for each species were averaged over all
samples within the three depth strata (Intertidal, Nearshore, and Channel). 2) The maximum density for each species by gear type within each depth stratum
was determined to be the Best Estimate of Density for that species within that depth stratum.
3) The proportional aerial coverage of the three depth strata within the Ecoregion was determined previously by Allen et al. (2002) were used for the current study. These aerial proportions were then used to weight the Best Estimate of Density within the depth strata by species. A weighted average was then taken among these best estimates over the three depth strata for each species.
4) The sum of the weighted densities of all species represented Best Estimate of Density (numerical and biomass) for each depth stratum and Ecoregion was calculated.
Standing stock estimates were calculated by multiplying the best estimates by the
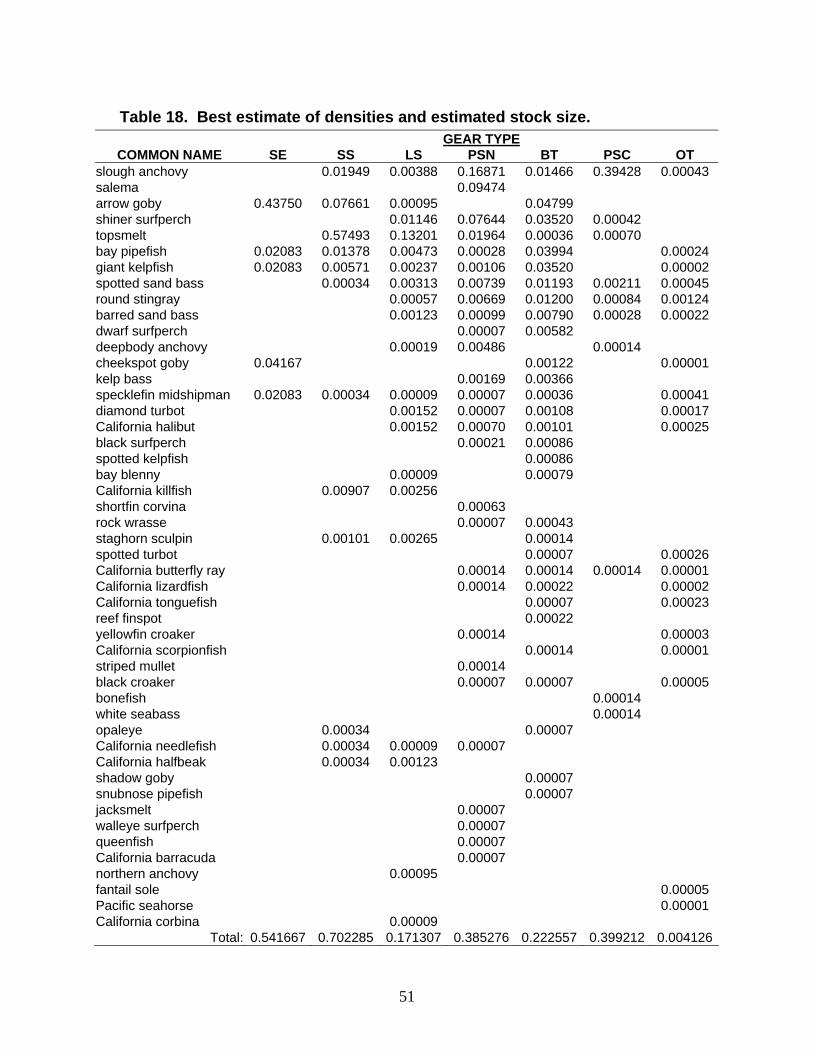
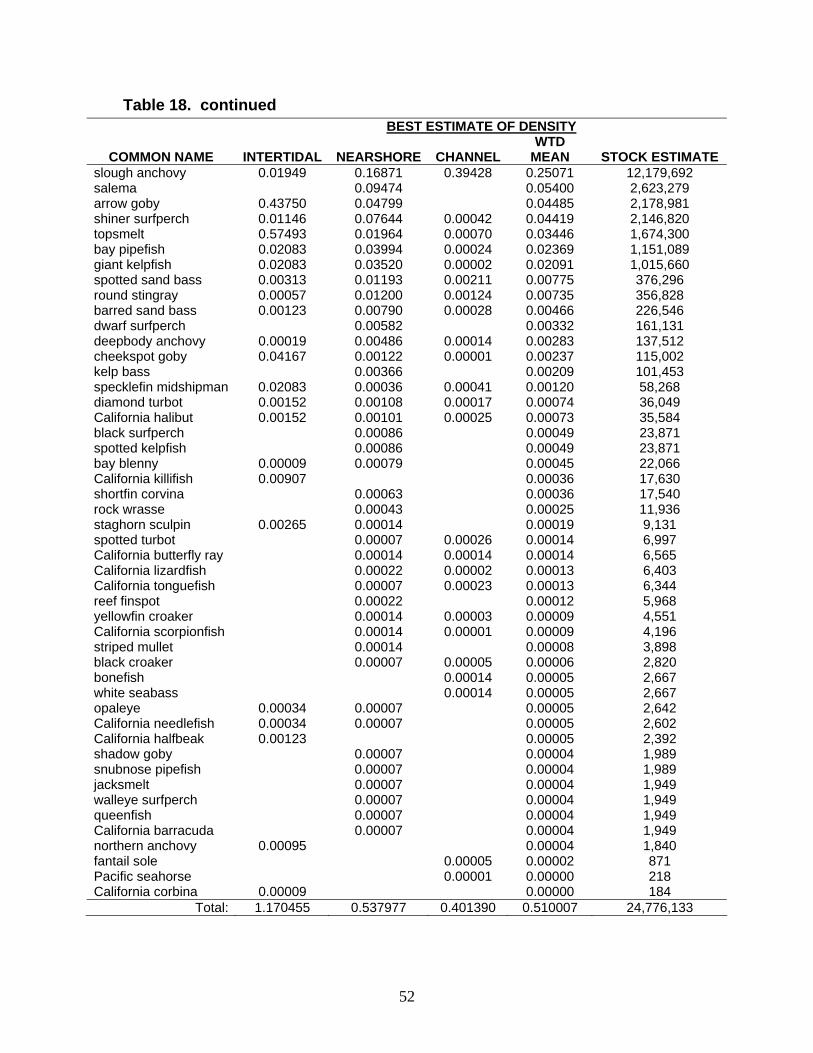
total area of the individual Ecoregions and San Diego Bay, as a whole (Table 17). The best total estimate for the total stock size was 24,776,133 fishes (Table 18).
With an estimated surface area of 4858 ha (Table 17) this gives an overall fish density 0.51 ind/m2 (Table 18). Nearly half of this estimate was slough anchovy (12 million). Salema (2.6 million) arrow goby (2.2 million) shiner perch (2.2 million), topsmelt (1.7 million) bay pipefish (1.2 million) and giant kelpfish (1.2 million) dominated the stock estimate. The stock estimate for the bay was unsurprisingly dominated by schooling and forage fishes. The total best estimate of biomass standing stock was 190,982 kg (Table 19). This gives an overall estimate of 3.93 g/m2 The standing stock was highest in the South Ecoregion (70 mt) closely followed by South-Central Ecoregion (68 mt). The North Ecoregion (33 mt) and North-Central Ecoregion (20 mt) were much lower. South-Central (49 mt) and North (30 mt) respectively (Table 19).
50
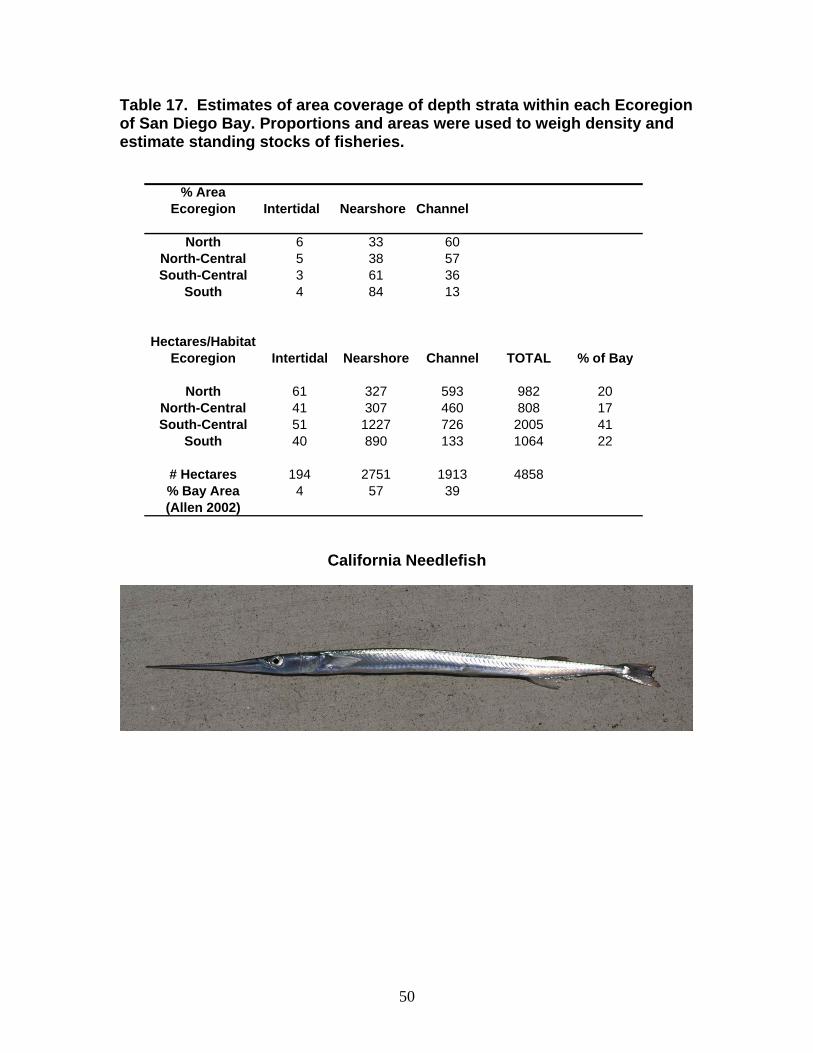
Table 17. Estimates of area coverage of depth strata within each Ecoregion of San Diego Bay. Proportions and areas were used to weigh density and estimate standing stocks of fisheries.
California Needlefish
% AreaEcoregion Intertidal Nearshore Channel
North 6 33 60North-Central 5 38 57South-Central 3 61 36
South 4 84 13
Hectares/HabitatEcoregion Intertidal Nearshore Channel TOTAL % of Bay
North 61 327 593 982 20North-Central 41 307 460 808 17South-Central 51 1227 726 2005 41
South 40 890 133 1064 22
# Hectares 194 2751 1913 4858% Bay Area 4 57 39(Allen 2002)
51
Table 18. Best estimate of densities and estimated stock size. GEAR TYPE
COMMON NAME SE SS LS PSN BT PSC OT slough anchovy 0.01949 0.00388 0.16871 0.01466 0.39428 0.00043 salema 0.09474 arrow goby 0.43750 0.07661 0.00095 0.04799 shiner surfperch 0.01146 0.07644 0.03520 0.00042 topsmelt 0.57493 0.13201 0.01964 0.00036 0.00070 bay pipefish 0.02083 0.01378 0.00473 0.00028 0.03994 0.00024 giant kelpfish 0.02083 0.00571 0.00237 0.00106 0.03520 0.00002 spotted sand bass 0.00034 0.00313 0.00739 0.01193 0.00211 0.00045 round stingray 0.00057 0.00669 0.01200 0.00084 0.00124 barred sand bass 0.00123 0.00099 0.00790 0.00028 0.00022 dwarf surfperch 0.00007 0.00582 deepbody anchovy 0.00019 0.00486 0.00014 cheekspot goby 0.04167 0.00122 0.00001 kelp bass 0.00169 0.00366 specklefin midshipman 0.02083 0.00034 0.00009 0.00007 0.00036 0.00041 diamond turbot 0.00152 0.00007 0.00108 0.00017 California halibut 0.00152 0.00070 0.00101 0.00025 black surfperch 0.00021 0.00086 spotted kelpfish 0.00086 bay blenny 0.00009 0.00079 California killfish 0.00907 0.00256 shortfin corvina 0.00063 rock wrasse 0.00007 0.00043 staghorn sculpin 0.00101 0.00265 0.00014 spotted turbot 0.00007 0.00026 California butterfly ray 0.00014 0.00014 0.00014 0.00001 California lizardfish 0.00014 0.00022 0.00002 California tonguefish 0.00007 0.00023 reef finspot 0.00022 yellowfin croaker 0.00014 0.00003 California scorpionfish 0.00014 0.00001 striped mullet 0.00014 black croaker 0.00007 0.00007 0.00005 bonefish 0.00014 white seabass 0.00014 opaleye 0.00034 0.00007 California needlefish 0.00034 0.00009 0.00007 California halfbeak 0.00034 0.00123 shadow goby 0.00007 snubnose pipefish 0.00007 jacksmelt 0.00007 walleye surfperch 0.00007 queenfish 0.00007 California barracuda 0.00007 northern anchovy 0.00095 fantail sole 0.00005 Pacific seahorse 0.00001 California corbina 0.00009
Total: 0.541667 0.702285 0.171307 0.385276 0.222557 0.399212 0.004126
52
Table 18. continued BEST ESTIMATE OF DENSITY
COMMON NAME INTERTIDAL NEARSHORE CHANNELWTD
MEAN STOCK ESTIMATE slough anchovy 0.01949 0.16871 0.39428 0.25071 12,179,692 salema 0.09474 0.05400 2,623,279 arrow goby 0.43750 0.04799 0.04485 2,178,981 shiner surfperch 0.01146 0.07644 0.00042 0.04419 2,146,820 topsmelt 0.57493 0.01964 0.00070 0.03446 1,674,300 bay pipefish 0.02083 0.03994 0.00024 0.02369 1,151,089 giant kelpfish 0.02083 0.03520 0.00002 0.02091 1,015,660 spotted sand bass 0.00313 0.01193 0.00211 0.00775 376,296 round stingray 0.00057 0.01200 0.00124 0.00735 356,828 barred sand bass 0.00123 0.00790 0.00028 0.00466 226,546 dwarf surfperch 0.00582 0.00332 161,131 deepbody anchovy 0.00019 0.00486 0.00014 0.00283 137,512 cheekspot goby 0.04167 0.00122 0.00001 0.00237 115,002 kelp bass 0.00366 0.00209 101,453 specklefin midshipman 0.02083 0.00036 0.00041 0.00120 58,268 diamond turbot 0.00152 0.00108 0.00017 0.00074 36,049 California halibut 0.00152 0.00101 0.00025 0.00073 35,584 black surfperch 0.00086 0.00049 23,871 spotted kelpfish 0.00086 0.00049 23,871 bay blenny 0.00009 0.00079 0.00045 22,066 California killifish 0.00907 0.00036 17,630 shortfin corvina 0.00063 0.00036 17,540 rock wrasse 0.00043 0.00025 11,936 staghorn sculpin 0.00265 0.00014 0.00019 9,131 spotted turbot 0.00007 0.00026 0.00014 6,997 California butterfly ray 0.00014 0.00014 0.00014 6,565 California lizardfish 0.00022 0.00002 0.00013 6,403 California tonguefish 0.00007 0.00023 0.00013 6,344 reef finspot 0.00022 0.00012 5,968 yellowfin croaker 0.00014 0.00003 0.00009 4,551 California scorpionfish 0.00014 0.00001 0.00009 4,196 striped mullet 0.00014 0.00008 3,898 black croaker 0.00007 0.00005 0.00006 2,820 bonefish 0.00014 0.00005 2,667 white seabass 0.00014 0.00005 2,667 opaleye 0.00034 0.00007 0.00005 2,642 California needlefish 0.00034 0.00007 0.00005 2,602 California halfbeak 0.00123 0.00005 2,392 shadow goby 0.00007 0.00004 1,989 snubnose pipefish 0.00007 0.00004 1,989 jacksmelt 0.00007 0.00004 1,949 walleye surfperch 0.00007 0.00004 1,949 queenfish 0.00007 0.00004 1,949 California barracuda 0.00007 0.00004 1,949 northern anchovy 0.00095 0.00004 1,840 fantail sole 0.00005 0.00002 871 Pacific seahorse 0.00001 0.00000 218 California corbina 0.00009 0.00000 184
Total: 1.170455 0.537977 0.401390 0.510007 24,776,133
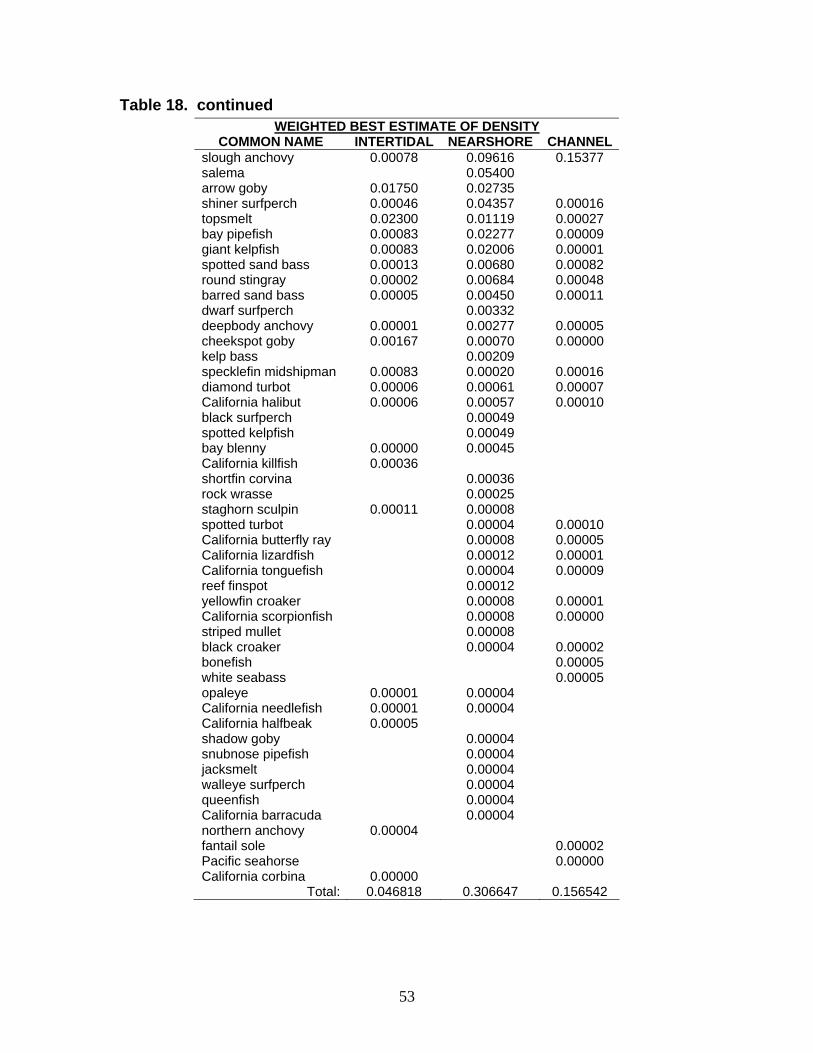
53
Table 18. continued WEIGHTED BEST ESTIMATE OF DENSITY
COMMON NAME INTERTIDAL NEARSHORE CHANNEL slough anchovy 0.00078 0.09616 0.15377 salema 0.05400 arrow goby 0.01750 0.02735 shiner surfperch 0.00046 0.04357 0.00016 topsmelt 0.02300 0.01119 0.00027 bay pipefish 0.00083 0.02277 0.00009 giant kelpfish 0.00083 0.02006 0.00001 spotted sand bass 0.00013 0.00680 0.00082 round stingray 0.00002 0.00684 0.00048 barred sand bass 0.00005 0.00450 0.00011 dwarf surfperch 0.00332 deepbody anchovy 0.00001 0.00277 0.00005 cheekspot goby 0.00167 0.00070 0.00000 kelp bass 0.00209 specklefin midshipman 0.00083 0.00020 0.00016 diamond turbot 0.00006 0.00061 0.00007 California halibut 0.00006 0.00057 0.00010 black surfperch 0.00049 spotted kelpfish 0.00049 bay blenny 0.00000 0.00045 California killfish 0.00036 shortfin corvina 0.00036 rock wrasse 0.00025 staghorn sculpin 0.00011 0.00008 spotted turbot 0.00004 0.00010 California butterfly ray 0.00008 0.00005 California lizardfish 0.00012 0.00001 California tonguefish 0.00004 0.00009 reef finspot 0.00012 yellowfin croaker 0.00008 0.00001 California scorpionfish 0.00008 0.00000 striped mullet 0.00008 black croaker 0.00004 0.00002 bonefish 0.00005 white seabass 0.00005 opaleye 0.00001 0.00004 California needlefish 0.00001 0.00004 California halfbeak 0.00005 shadow goby 0.00004 snubnose pipefish 0.00004 jacksmelt 0.00004 walleye surfperch 0.00004 queenfish 0.00004 California barracuda 0.00004 northern anchovy 0.00004 fantail sole 0.00002 Pacific seahorse 0.00000 California corbina 0.00000
Total: 0.046818 0.306647 0.156542

54
Table 19. Best estimate of biomass densities and standing stocks for all fish species, forage species only and fisheries species only. Estimates are for each depth strata and within each Ecoregion of San Diego Bay.
ALL FISH SPECIES BEST ESTIMATE OF BIOMASS (g/m2)
ECOREGION INTERTIDAL NEARSHORE CHANNELWTD
MEAN
STANDING STOCK
(kg) MT NORTH 2.04 3.85 3.27 3.35 32942 33
NORTH-CENTRAL 1.01 5.23 0.74 2.46 19843 20 SOUTH-CENTRAL 1.58 4.47 1.72 3.39 68008 68
SOUTH 0.64 7.40 2.71 6.60 70190 70 TOTAL: 190982 191
FORAGE FISH
SPECIES BEST ESTIMATE OF BIOMASS (g/m2)
ECOREGION INTERTIDAL NEARSHORE CHANNELWTD
MEAN
STANDING STOCK
(kg) MT NORTH 1.23 0.65 3.27 2.25 22108 22
NORTH-CENTRAL 2.14 1.69 3.28 2.62 21182 21 SOUTH-CENTRAL 0.36 0.70 0.00 0.44 8770 9
SOUTH 0.34 0.80 0.22 0.72 7640 8 TOTAL: 59699 60
R/C FISH SPECIES BEST ESTIMATE OF BIOMASS (g/m2)
ECOREGION INTERTIDAL NEARSHORE CHANNELWTD
MEAN
STANDING STOCK
(kg) MT NORTH 0.14 0.88 0.04 0.32 3150 3
NORTH-CENTRAL 0.03 3.51 0.32 1.52 12288 12 SOUTH-CENTRAL 1.04 2.04 1.23 1.72 34403 34
SOUTH 0.08 3.76 1.73 3.38 35995 36 TOTAL: 85836 86

55
Avian Forage Species Forage species are primarily surface dwelling schooling fish that are accessible to diving avian predators, especially terns. Generally, forage fishes are small silvery-sided fishes that are found in large schools. These schooling fishes are generally not habitat specific and move throughout the bay’s ecosystem. Seven species of important forage species were captured during this study. These species were: deepbody anchovy, slough anchovy, northern anchovy, California halfbeak, topsmelt, jacksmelt and shiner perch (Table 20). The most abundant forage fishes were slough anchovy; topsmelt, and shiner perch (Table 2). These species were primarily found at small (juvenile) size classes (<50 mm SL) appropriate for nesting birds to feed their young in the area (Figures 8, 11 and 12). The typical timing for the recruitment of fishes to San Diego Bay begins in the spring and continues through the summer and this is what was observed in 2008. The stock estimate for forage fish was over 16 million fishes and an estimate of 60 mt . Slough anchovy (25 mt) accounted for nearly half of this biomass followed by shiner perch (9.5 mt) and topsmelt (5.4 mt).
Table 20. Best estimate of standing stock and biomass densities for forage fish species. BIOMASS DENSITY (g/m2)
ECOREGION COMMON NAME SE SS LS PSN BT PSC OT NORTH slough anchovy 0.00176 0.01057 3.19797
topsmelt 0.17785 1.09290 0.56303 0.07225 jacksmelt 0.06130 shiner perch 0.13547 0.02737 0.06853 northern anchovy 0.00444 Total: 0.17785 1.23458 0.65171 0.07910 3.27022
NORTH-CENTRAL slough anchovy 0.00827 0.00823 0.65347 0.01223 0.00035
topsmelt 0.04658 0.77440 0.23686 0.01112 shiner perch 0.12308 0.15243 0.01483 Total: 0.23270 2.14474 1.69447 0.10616 3.28134 0.00035
SOUTH-CENTRAL deepbody anchovy 0.00540 0.00492
slough anchovy 0.00258 0.21255 0.00435 topsmelt 0.01050 0.33546 0.02298 shiner perch 0.00566 0.46138 0.17469 northern anchovy 0.00073 California halfbeak 0.01328 Total: 0.01050 0.35770 0.69691 0.17469 0.00435
SOUTH deepbody anchovy 0.17350 0.00583 slough anchovy 0.00797 0.19375 0.04950 0.20076 0.00141 topsmelt 0.03648 0.31559 0.09593 0.00076 shiner perch 0.01211 0.34139 0.02595 0.01291 California halfbeak 0.00002 0.00606 Total: 0.03650 0.34174 0.80457 0.07620 0.21951 0.00141
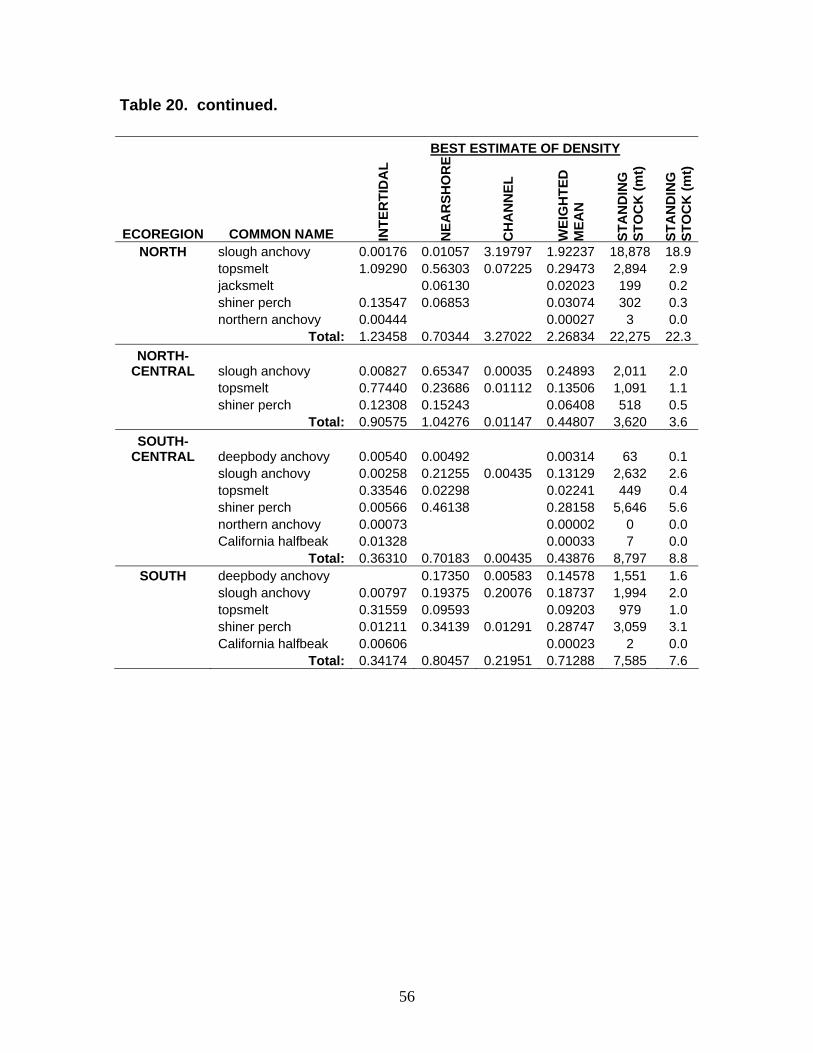
56
Table 20. continued.
BEST ESTIMATE OF DENSITY
ECOREGION COMMON NAME INTE
RTI
DA
L
NEA
RSH
OR
E
CH
AN
NEL
WEI
GH
TED
M
EAN
STA
ND
ING
ST
OC
K (m
t)
STA
ND
ING
ST
OC
K (m
t)
NORTH slough anchovy 0.00176 0.01057 3.19797 1.92237 18,878 18.9 topsmelt 1.09290 0.56303 0.07225 0.29473 2,894 2.9 jacksmelt 0.06130 0.02023 199 0.2 shiner perch 0.13547 0.06853 0.03074 302 0.3 northern anchovy 0.00444 0.00027 3 0.0 Total: 1.23458 0.70344 3.27022 2.26834 22,275 22.3
NORTH-CENTRAL slough anchovy 0.00827 0.65347 0.00035 0.24893 2,011 2.0
topsmelt 0.77440 0.23686 0.01112 0.13506 1,091 1.1 shiner perch 0.12308 0.15243 0.06408 518 0.5 Total: 0.90575 1.04276 0.01147 0.44807 3,620 3.6
SOUTH-CENTRAL deepbody anchovy 0.00540 0.00492 0.00314 63 0.1
slough anchovy 0.00258 0.21255 0.00435 0.13129 2,632 2.6 topsmelt 0.33546 0.02298 0.02241 449 0.4 shiner perch 0.00566 0.46138 0.28158 5,646 5.6 northern anchovy 0.00073 0.00002 0 0.0 California halfbeak 0.01328 0.00033 7 0.0 Total: 0.36310 0.70183 0.00435 0.43876 8,797 8.8
SOUTH deepbody anchovy 0.17350 0.00583 0.14578 1,551 1.6 slough anchovy 0.00797 0.19375 0.20076 0.18737 1,994 2.0 topsmelt 0.31559 0.09593 0.09203 979 1.0 shiner perch 0.01211 0.34139 0.01291 0.28747 3,059 3.1 California halfbeak 0.00606 0.00023 2 0.0 Total: 0.34174 0.80457 0.21951 0.71288 7,585 7.6
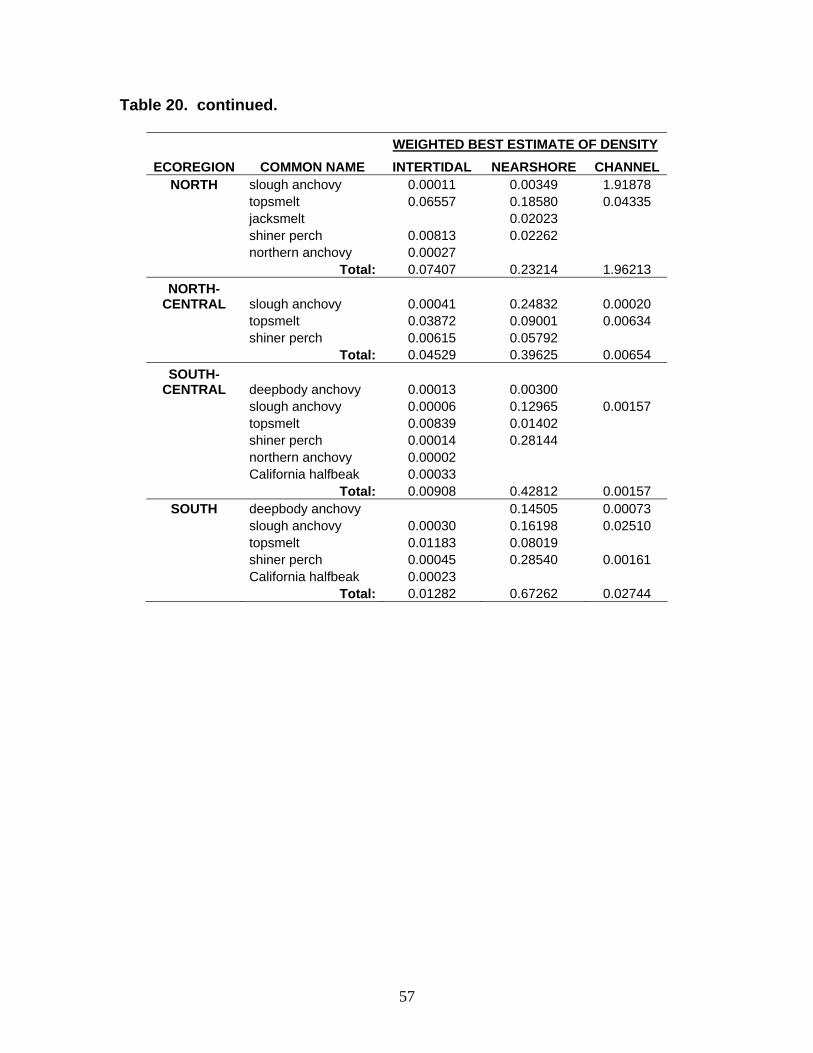
57
Table 20. continued.
WEIGHTED BEST ESTIMATE OF DENSITY ECOREGION COMMON NAME INTERTIDAL NEARSHORE CHANNEL
NORTH slough anchovy 0.00011 0.00349 1.91878 topsmelt 0.06557 0.18580 0.04335 jacksmelt 0.02023 shiner perch 0.00813 0.02262 northern anchovy 0.00027 Total: 0.07407 0.23214 1.96213
NORTH-CENTRAL slough anchovy 0.00041 0.24832 0.00020
topsmelt 0.03872 0.09001 0.00634 shiner perch 0.00615 0.05792 Total: 0.04529 0.39625 0.00654
SOUTH-CENTRAL deepbody anchovy 0.00013 0.00300
slough anchovy 0.00006 0.12965 0.00157 topsmelt 0.00839 0.01402 shiner perch 0.00014 0.28144 northern anchovy 0.00002 California halfbeak 0.00033 Total: 0.00908 0.42812 0.00157
SOUTH deepbody anchovy 0.14505 0.00073 slough anchovy 0.00030 0.16198 0.02510 topsmelt 0.01183 0.08019 shiner perch 0.00045 0.28540 0.00161 California halfbeak 0.00023 Total: 0.01282 0.67262 0.02744
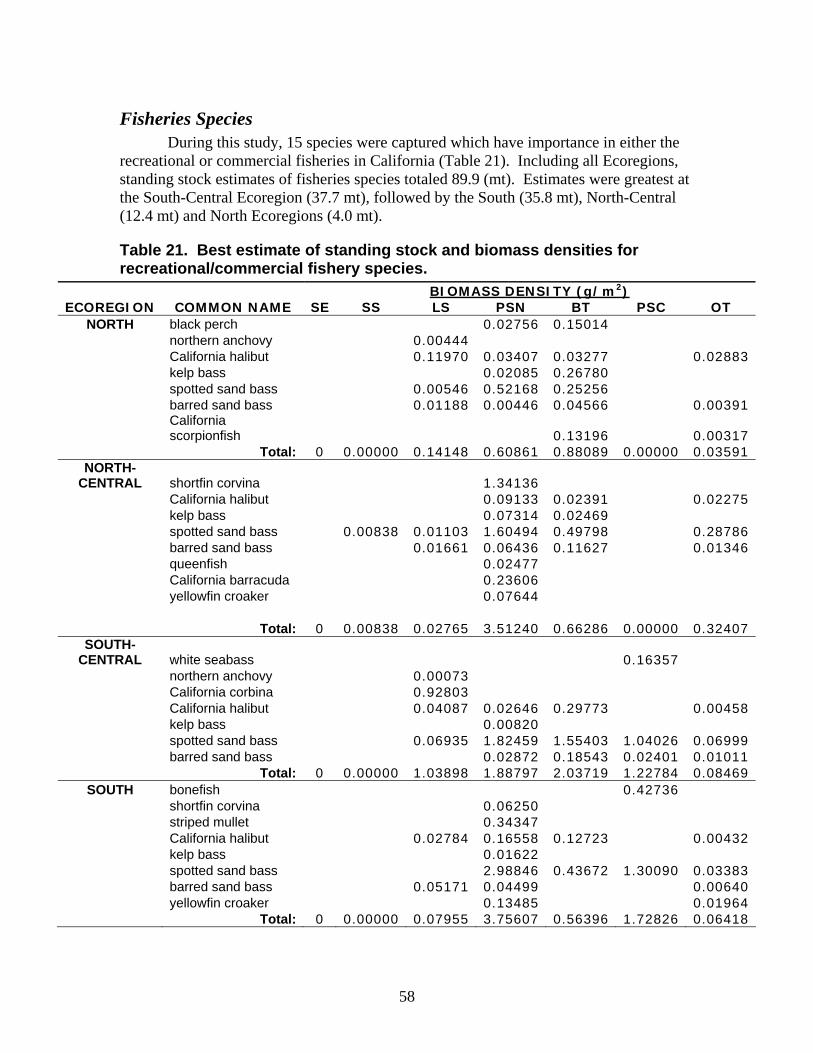
58
Fisheries Species During this study, 15 species were captured which have importance in either the
recreational or commercial fisheries in California (Table 21). Including all Ecoregions, standing stock estimates of fisheries species totaled 89.9 (mt). Estimates were greatest at the South-Central Ecoregion (37.7 mt), followed by the South (35.8 mt), North-Central (12.4 mt) and North Ecoregions (4.0 mt).
Table 21. Best estimate of standing stock and biomass densities for recreational/commercial fishery species.
BIOMASS DENSITY (g/m2) ECOREGION COMMON NAME SE SS LS PSN BT PSC OT
NORTH black perch 0.02756 0.15014 northern anchovy 0.00444 California halibut 0.11970 0.03407 0.03277 0.02883 kelp bass 0.02085 0.26780 spotted sand bass 0.00546 0.52168 0.25256 barred sand bass 0.01188 0.00446 0.04566 0.00391
California scorpionfish 0.13196 0.00317
Total: 0 0.00000 0.14148 0.60861 0.88089 0.00000 0.03591 NORTH-
CENTRAL shortfin corvina 1.34136 California halibut 0.09133 0.02391 0.02275 kelp bass 0.07314 0.02469 spotted sand bass 0.00838 0.01103 1.60494 0.49798 0.28786 barred sand bass 0.01661 0.06436 0.11627 0.01346 queenfish 0.02477 California barracuda 0.23606 yellowfin croaker 0.07644 Total: 0 0.00838 0.02765 3.51240 0.66286 0.00000 0.32407
SOUTH-CENTRAL white seabass 0.16357
northern anchovy 0.00073 California corbina 0.92803 California halibut 0.04087 0.02646 0.29773 0.00458 kelp bass 0.00820 spotted sand bass 0.06935 1.82459 1.55403 1.04026 0.06999 barred sand bass 0.02872 0.18543 0.02401 0.01011 Total: 0 0.00000 1.03898 1.88797 2.03719 1.22784 0.08469
SOUTH bonefish 0.42736 shortfin corvina 0.06250 striped mullet 0.34347 California halibut 0.02784 0.16558 0.12723 0.00432 kelp bass 0.01622 spotted sand bass 2.98846 0.43672 1.30090 0.03383 barred sand bass 0.05171 0.04499 0.00640 yellowfin croaker 0.13485 0.01964 Total: 0 0.00000 0.07955 3.75607 0.56396 1.72826 0.06418

59
Table 21. continued.
BEST ESTIMATE OF BIOMASS DENSITY
ECOREGION COMMON NAME INTER
TID
AL
NEA
RS
HO
RE
CH
AN
NEL
WEIG
HTED
M
EA
N
STA
ND
ING
S
TO
CK
(kg
)
STA
ND
ING
S
TO
CK
(m
t)
NORTH black perch 0.15014 0.04955 487 0.5 northern anchovy 0.00444 0.00027 3 0.0 California halibut 0.11970 0.03407 0.02883 0.03572 351 0.4 kelp bass 0.26780 0.08837 868 0.9 spotted sand bass 0.00546 0.52168 0.17248 1,694 1.7 barred sand bass 0.01188 0.04566 0.00391 0.01812 178 0.2 California scorpionfish 0.13196 0.00317 0.04545 446 0.4 Total: 0.14148 1.15130 0.03591 0.40997 4,026 4.0
NORTH-CENTRAL shortfin corvina 1.34136 0.50972 4,119 4.1
California halibut 0.09133 0.02275 0.04767 385 0.4 kelp bass 0.07314 0.02779 225 0.2 spotted sand bass 0.01103 1.60494 0.28786 0.77451 6,258 6.3 barred sand bass 0.01661 0.11627 0.01346 0.05269 426 0.4 queenfish 0.02477 0.00941 76 0.1 California barracuda 0.23606 0.08970 725 0.7 yellowfin croaker 0.07644 0.02905 235 0.2 Total: 0.02765 3.56432 0.32407 1.54054 12,448 12.4
SOUTH-CENTRAL white seabass 0.16357 0.05889 1,181 1.2
northern anchovy 0.00073 0.00002 0 0.0 California corbina 0.92803 0.02320 465 0.5 California halibut 0.04087 0.29773 0.00458 0.18429 3,695 3.7 kelp bass 0.00820 0.00500 100 0.1 spotted sand bass 0.06935 1.82459 1.04026 1.48923 29,859 29.9 barred sand bass 0.18543 0.02401 0.12176 2,441 2.4 Total: 1.03898 2.31595 1.23242 1.88238 37,742 37.7
SOUTH bonefish 0.42736 0.05342 568 0.6 shortfin corvina 0.06250 0.05225 556 0.6 striped mullet 0.34347 0.28714 3,055 3.1 California halibut 0.02784 0.16558 0.00432 0.14001 1,490 1.5 kelp bass 0.01622 0.01356 144 0.1 spotted sand bass 2.98846 1.30090 2.66096 28,313 28.3 barred sand bass 0.05171 0.04499 0.00640 0.04035 429 0.4 yellowfin croaker 0.13485 0.01964 0.11519 1,226 1.2 Total: 0.07955 3.75607 1.75862 3.36289 35,781 35.8

60
Table 21. continued.
WEIGHTED BEST ESTIMATE OF DENSITY
ECOREGION COMMON NAME INTERTIDAL NEARSHORE CHANNEL NORTH black perch 0.04955 northern anchovy 0.00027 California halibut 0.00718 0.01124 0.01730 kelp bass 0.08837 spotted sand bass 0.00033 0.17215 barred sand bass 0.00071 0.01507 0.00234 California scorpionfish 0.04355 0.00190 Total: 0.00849 0.37993 0.02155 NORTH-CENTRAL shortfin corvina 0.50972 California halibut 0.03471 0.01297 kelp bass 0.02779 spotted sand bass 0.00055 0.60988 0.16408 barred sand bass 0.00083 0.04418 0.00767 queenfish 0.00941 California barracuda 0.08970 yellowfin croaker 0.02905 Total: 0.00138 1.35444 0.18472 SOUTH-CENTRAL white seabass 0.05889 northern anchovy 0.00002 California corbina 0.02320 California halibut 0.00102 0.18161 0.00165 kelp bass 0.00500 spotted sand bass 0.00173 1.11300 0.37449 barred sand bass 0.11311 0.00865 Total: 0.02597 1.41273 0.44367 SOUTH bonefish 0.05342 shortfin corvina 0.05225 striped mullet 0.28714 California halibut 0.00104 0.13843 0.00054 kelp bass 0.01356 spotted sand bass 2.49835 0.16261 barred sand bass 0.00194 0.03761 0.00080 yellowfin croaker 0.11274 0.00245 Total: 0.00298 3.14008 0.21983
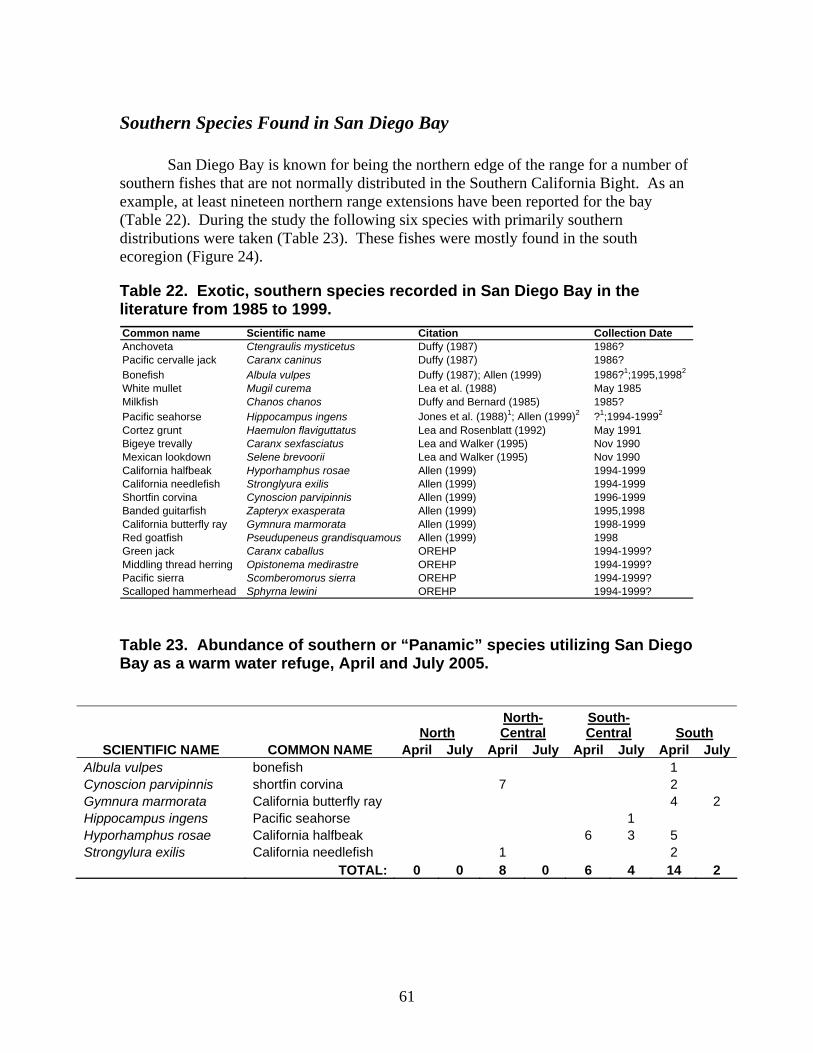
61
Southern Species Found in San Diego Bay
San Diego Bay is known for being the northern edge of the range for a number of southern fishes that are not normally distributed in the Southern California Bight. As an example, at least nineteen northern range extensions have been reported for the bay (Table 22). During the study the following six species with primarily southern distributions were taken (Table 23). These fishes were mostly found in the south ecoregion (Figure 24).
Table 22. Exotic, southern species recorded in San Diego Bay in the literature from 1985 to 1999.
Table 23. Abundance of southern or “Panamic” species utilizing San Diego Bay as a warm water refuge, April and July 2005.
North North-Central
South-Central South
SCIENTIFIC NAME COMMON NAME April July April July April July April JulyAlbula vulpes bonefish 1 Cynoscion parvipinnis shortfin corvina 7 2 Gymnura marmorata California butterfly ray 4 2 Hippocampus ingens Pacific seahorse 1 Hyporhamphus rosae California halfbeak 6 3 5 Strongylura exilis California needlefish 1 2 TOTAL: 0 0 8 0 6 4 14 2
Common name Scientific name Citation Collection DateAnchoveta Ctengraulis mysticetus Duffy (1987) 1986?Pacific cervalle jack Caranx caninus Duffy (1987) 1986?Bonefish Albula vulpes Duffy (1987); Allen (1999) 1986?1;1995,19982
White mullet Mugil curema Lea et al. (1988) May 1985Milkfish Chanos chanos Duffy and Bernard (1985) 1985?Pacific seahorse Hippocampus ingens Jones et al. (1988)1; Allen (1999)2 ?1;1994-19992
Cortez grunt Haemulon flaviguttatus Lea and Rosenblatt (1992) May 1991Bigeye trevally Caranx sexfasciatus Lea and Walker (1995) Nov 1990Mexican lookdown Selene brevoorii Lea and Walker (1995) Nov 1990California halfbeak Hyporhamphus rosae Allen (1999) 1994-1999California needlefish Stronglyura exilis Allen (1999) 1994-1999Shortfin corvina Cynoscion parvipinnis Allen (1999) 1996-1999Banded guitarfish Zapteryx exasperata Allen (1999) 1995,1998California butterfly ray Gymnura marmorata Allen (1999) 1998-1999Red goatfish Pseudupeneus grandisquamous Allen (1999) 1998Green jack Caranx caballus OREHP 1994-1999?Middling thread herring Opistonema medirastre OREHP 1994-1999?Pacific sierra Scomberomorus sierra OREHP 1994-1999?Scalloped hammerhead Sphyrna lewini OREHP 1994-1999?

62
Figure 24 . Abundance of southern or “Panamic Province” species collected in San Diego Bay, 2008.
0
1
2
3
4
5
6
7
8
9
10
bonefish shortfincorvina
Californiabutterfly
ray
Pacificseahorse
Californiahalfbeak
Californianeedlefish
# of
indi
vidu
als
North
North-Central
South-Central
South
Pacific Seahorse

63
Indigenous Bay and Estuary Fishes As the largest estuary in Southern California, San Diego Bay provides critical habitat for bay and estuary fishes. The high productivity rate coupled with the abundance of juvenile fishes in the bay highlights the importance of the bay as a nursery habitat. The bay contains extensive shallow water eelgrass habitat that supports a unique assemblage of juvenile and adult fishes. San Diego Bay serves as critical habitat for many fishes that, in turn support surrounding nearshore ecosystems. Juvenile fishes migrate out of the bay to surrounding habitats. And, these fishes provide a critical forage base for important and endangered avian species. Southern California indigenous bay and estuary fishes represented 49% of the total catch in this survey (Table 24).
Table 24. Indigenous bay/estuarine species taken in San Diego Bay April and July, 2008.
ECOREGIONS
SCIENTIFIC NAME COMMON NAME NorthNorth-Central
South-Central South TOTAL %
Anchoa compressa deepbody anchovy 4 68 72 0.94 Anchoa delicatissima slough anchovy 2448 1645 617 828 5538 72.34Clevelandia ios arrow goby 584 11 42 290 927 12.11Fundulus parvipinnis California killifish 1 53 54 0.71 Hypsoblennius gentilis bay blenny 7 2 3 12 0.16 Ilypnus gilberti cheekspot goby 1 1 18 20 0.26 Paralabrax maculatofasciatus spotted sand bass 16 65 203 75 359 4.69 Quietula y-cauda shadow goby 1 1 0.01 Syngnathus leptorhynchus bay pipefish 95 223 279 76 673 8.79 TOTAL: 3,151 1,947 1,149 1,409 7,656
California killifish
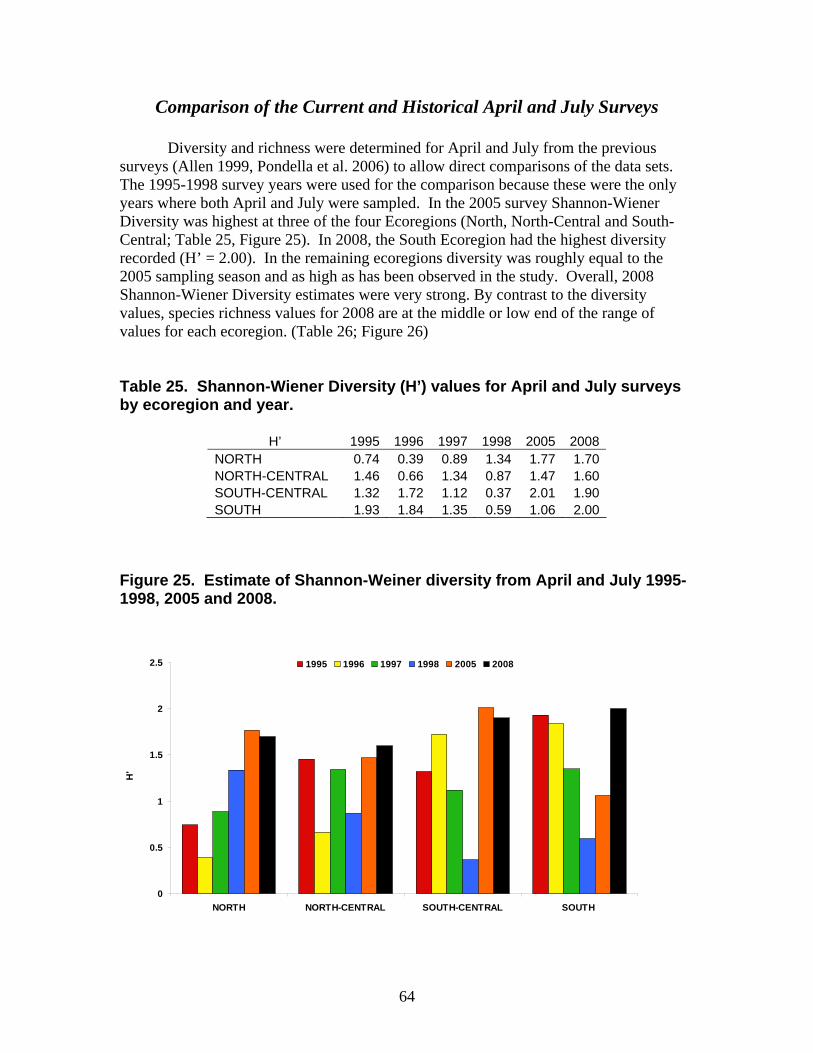
64
Comparison of the Current and Historical April and July Surveys
Diversity and richness were determined for April and July from the previous surveys (Allen 1999, Pondella et al. 2006) to allow direct comparisons of the data sets. The 1995-1998 survey years were used for the comparison because these were the only years where both April and July were sampled. In the 2005 survey Shannon-Wiener Diversity was highest at three of the four Ecoregions (North, North-Central and South-Central; Table 25, Figure 25). In 2008, the South Ecoregion had the highest diversity recorded (H’ = 2.00). In the remaining ecoregions diversity was roughly equal to the 2005 sampling season and as high as has been observed in the study. Overall, 2008 Shannon-Wiener Diversity estimates were very strong. By contrast to the diversity values, species richness values for 2008 are at the middle or low end of the range of values for each ecoregion. (Table 26; Figure 26)
Table 25. Shannon-Wiener Diversity (H’) values for April and July surveys by ecoregion and year.
H’ 1995 1996 1997 1998 2005 2008
NORTH 0.74 0.39 0.89 1.34 1.77 1.70 NORTH-CENTRAL 1.46 0.66 1.34 0.87 1.47 1.60 SOUTH-CENTRAL 1.32 1.72 1.12 0.37 2.01 1.90 SOUTH 1.93 1.84 1.35 0.59 1.06 2.00
Figure 25. Estimate of Shannon-Weiner diversity from April and July 1995-1998, 2005 and 2008.
0
0.5
1
1.5
2
2.5
NORTH NORTH-CENTRAL SOUTH-CENTRAL SOUTH
H'
1995 1996 1997 1998 2005 2008
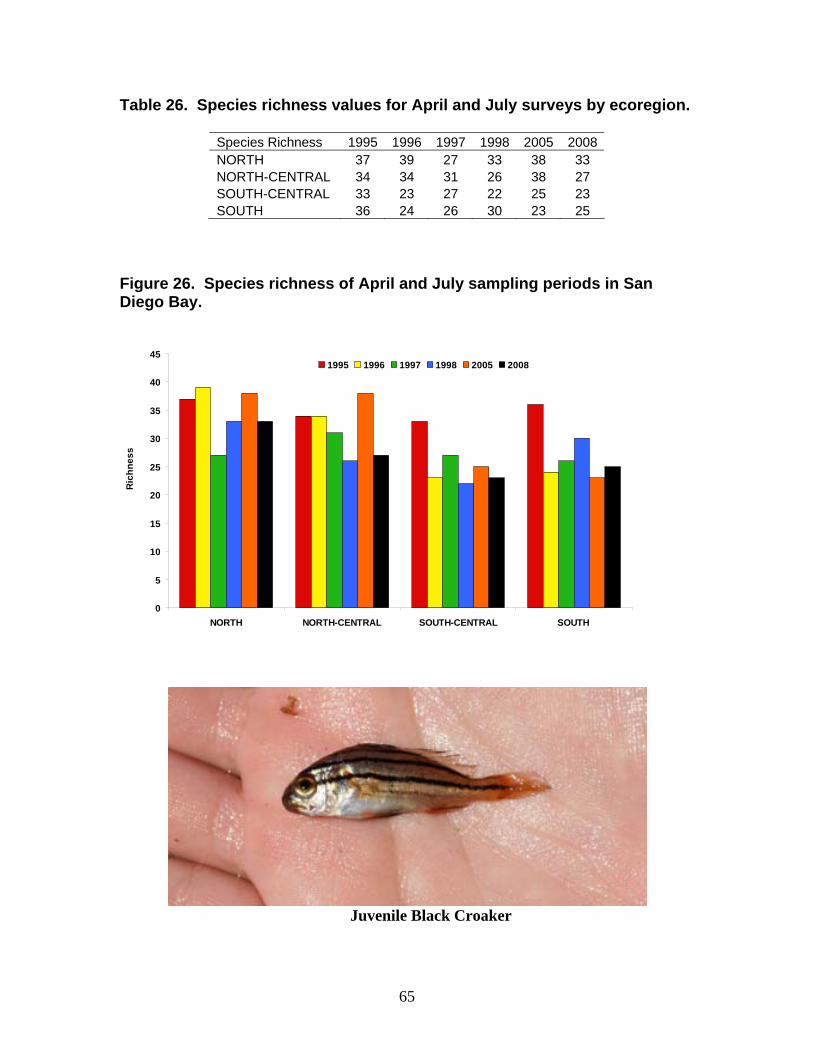
65
Table 26. Species richness values for April and July surveys by ecoregion.
Species Richness 1995 1996 1997 1998 2005 2008 NORTH 37 39 27 33 38 33 NORTH-CENTRAL 34 34 31 26 38 27 SOUTH-CENTRAL 33 23 27 22 25 23 SOUTH 36 24 26 30 23 25
Figure 26. Species richness of April and July sampling periods in San Diego Bay.
0
5
10
15
20
25
30
35
40
45
NORTH NORTH-CENTRAL SOUTH-CENTRAL SOUTH
Ric
hnes
s
1995 1996 1997 1998 2005 2008
Juvenile Black Croaker

66
Total catch and biomass from the April and July sampling periods were also compared from 1995-1998, 2005 and 2008. Overall, catch was lower in 2005 at both North and South-Central Ecoregions than the 1995-1998 sampling period (Table 27; Figure 27). Total abundance in the North and North-Central Ecoregions were heavily influenced by large schools of northern anchovies that were captured during those years. Abundance at the North-Central and South Ecoregions were comparable to the prior abundance estimates. Estimates of total biomass were remarkably similar for the years from 1995-1998 and present surveys (Table 28; Figure 28). Biomass was intermediate at North-Central and South Ecoregions. However, biomass was only slightly greater in 2005 than the lowest estimate during the 1998 El Niño year. Biomass and abundance were negatively affected during 1997-1998 El Niño and the 2005 sampling occurred during a weak El Niño event thus partially explaining similarities in biomass and abundance between the 1998 and 2005 surveys. Overall, the current community statistics were comparable to the previous surveys. Table 27. Total catch for April and July surveys by ecoregion.
Total Catch 1995 1996 1997 1998 2005 2008 NORTH 59178 91175 8978 14484 4,237 7233 NORTH-CENTRAL 19523 112964 8718 11603 12,537 3355 SOUTH-CENTRAL 22403 3623 10659 8267 2,346 2666 SOUTH 5063 3153 4735 14738 5,336 2438
Figure 27. Total abundance of fishes captured in San Diego Bay from April and July 1995-1998, 2005 and 2008 sampling periods.
0
20000
40000
60000
80000
100000
120000
NORTH NORTH-CENTRAL SOUTH-CENTRAL SOUTH
# In
divi
dual
s
1995 1996 1997 1998 2005 2008

67
Table 28. Total biomass (mt) for April and July surveys by ecoregion.
Biomass (mt) 1995 1996 1997 1998 2005 2008 NORTH 111.9 195.4 70.1 58.7 58.9 36.3 NORTH-CENTRAL 97.5 192.3 88.4 74.4 121.0 55.3 SOUTH-CENTRAL 102.4 46.6 65.4 33.2 34.2 42.9 SOUTH 89.2 75.8 48.2 52.3 77.4 49.0
Figure 28. Total biomass of fishes captured in San Diego Bay from April and July 1995-1998, 2005 and 2008 sampling periods.
0
50
100
150
200
250
NORTH NORTH-CENTRAL SOUTH-CENTRAL SOUTH
Bio
mas
s (k
g)
1995 1996 1997 1998 2005 2008
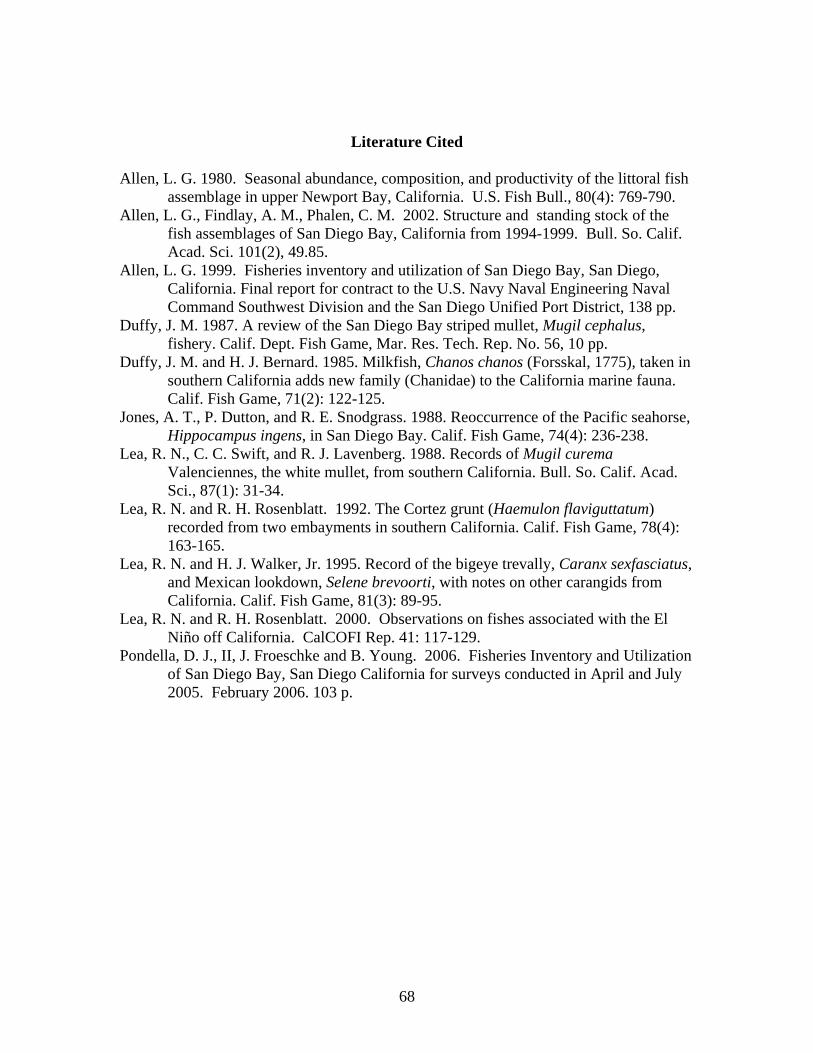
68
Literature Cited
Allen, L. G. 1980. Seasonal abundance, composition, and productivity of the littoral fish assemblage in upper Newport Bay, California. U.S. Fish Bull., 80(4): 769-790.
Allen, L. G., Findlay, A. M., Phalen, C. M. 2002. Structure and standing stock of the fish assemblages of San Diego Bay, California from 1994-1999. Bull. So. Calif. Acad. Sci. 101(2), 49.85.
Allen, L. G. 1999. Fisheries inventory and utilization of San Diego Bay, San Diego, California. Final report for contract to the U.S. Navy Naval Engineering Naval Command Southwest Division and the San Diego Unified Port District, 138 pp.
Duffy, J. M. 1987. A review of the San Diego Bay striped mullet, Mugil cephalus, fishery. Calif. Dept. Fish Game, Mar. Res. Tech. Rep. No. 56, 10 pp.
Duffy, J. M. and H. J. Bernard. 1985. Milkfish, Chanos chanos (Forsskal, 1775), taken in southern California adds new family (Chanidae) to the California marine fauna. Calif. Fish Game, 71(2): 122-125.
Jones, A. T., P. Dutton, and R. E. Snodgrass. 1988. Reoccurrence of the Pacific seahorse, Hippocampus ingens, in San Diego Bay. Calif. Fish Game, 74(4): 236-238.
Lea, R. N., C. C. Swift, and R. J. Lavenberg. 1988. Records of Mugil curema Valenciennes, the white mullet, from southern California. Bull. So. Calif. Acad. Sci., 87(1): 31-34.
Lea, R. N. and R. H. Rosenblatt. 1992. The Cortez grunt (Haemulon flaviguttatum) recorded from two embayments in southern California. Calif. Fish Game, 78(4): 163-165.
Lea, R. N. and H. J. Walker, Jr. 1995. Record of the bigeye trevally, Caranx sexfasciatus, and Mexican lookdown, Selene brevoorti, with notes on other carangids from California. Calif. Fish Game, 81(3): 89-95.
Lea, R. N. and R. H. Rosenblatt. 2000. Observations on fishes associated with the El Niño off California. CalCOFI Rep. 41: 117-129.
Pondella, D. J., II, J. Froeschke and B. Young. 2006. Fisheries Inventory and Utilization of San Diego Bay, San Diego California for surveys conducted in April and July 2005. February 2006. 103 p.