Embed Size (px)
Citation preview
Placeholder for Partner
Logo
SEADI GRANT DISCUSSION PAPER SERIES
Fisheries Market Integration and Poverty Reduction Analysis of Fisheries Products Market Integration in Ambon and Seram Islands

Fisheries Market Integration and Poverty Reduction Analysis of Fisheries Products Market Integration in Ambon and Seram Islands
December 2012
This publication was produced by DAI/Nathan Group for review by the United States Agency for International
Development (USAID). It is made possible by the support of the American people. Its contents are the sole
responsibility of the author or authors and do not necessarily reflect the views of USAID or the United States
government.
SEADI Discussion Paper No. 3 This paper was written by Yolanda Apituley, Pattimura University, Ambon, Indonesia to meet requirements of a grant funded by the USAID Support for Economic Analysis Development in Indonesia project.


Acknowledgements This paper was written by Yolanda Apituley, Pattimura University, Ambon, Indonesia, pursuant to a grant funded by the USAID Support for Economic Analysis Development in Indonesia project. The author would like to express her appreciation for comments from Dr. Richard Adams and Dr. Moekti Soejachmoen during the preparation of this paper.


Contents 3 Introduction 7
2. Research Methods 9
3. Overview of Ambon and Seram Islands 12
a. 3.1 Overview of Fishing Industry in Ambon and Seram Islands 12
3.2 Overview of Markets in Ambon and Seram Islands 15
3.3 Overview of Fresh Fish Markets In Markets of Ambon and Seram Islands 16
3.4 Marketing Functions in Fresh Fish Markets of Ambon and Seram Islands 18
3.5 Pricing Mechanisms of Fish Products in Markets of Ambon and Seram Islands 20
4 Analysis of Marketing Margins in Markets of Ambon and Seram Islands 22
5 Testing Fresh Fish Market Integration in Ambon and Seram Islands 25
6 Living of Fishermen in Ambon and Seram Islands through Market Integration 28
7 Conclusion 30
References 31
Appendix A. Map of Maluku Province 32
Appendix B. Documentation xxxv
Illustrations
Figures Figure 1: Map of Ambon Island 15 Figure 2: Map of Seram Island 16 Figure 3: Fresh Fish Marketing Channel in Region of Central Maluku 17 Figure 4: Stack of fish arranged by piece bamboo 21 Figure 5: Stack of complete and incomplete fish 21 Figure 8 Price Dynamic of Fresh Fish in Ambon and Seram Islands 23

V I
Tables Table 1: Potency and Production of Capture Fisheries in Ambon and Some Regencies in
Seram Island in 2006-2010 (in tons) 12 Table 2: Number of Fishermen and Fishery Households in Ambon and Some Regencies in
Seram Island 2006-2010 13 Table 3 Type and Number of General Fishing Gear Used in Ambon and Some Regencies
in Seram Island 2006–2010 14 Table 4: Marketing Function of Fresh Fish in Ambon and Seram Islands 18 Table 5 Marketing Margin of Fresh Fish in the Region of Central Maluku 22 Table 6 Fresh Fish Market Integration Using Mardika as Reference Market 26 Table 7 Analysis Result on Fresh Fish Market Integration Using Binaya as Reference
Market 26
1. Introduction Poverty is a complex and multidimensional problem. In Indonesia, as in many developing countries, the three main causes of poverty are: lack of opportunities for the poor, lack of capabilities for the poor, and limitations on the social, economic and political rights of the poor.
The purpose of this report is to analyze how marketing channels affect the poverty of fishermen in Maluku, one of the island provinces of Indonesia. Most fishermen in Maluku are traditional and use unpowered boats to fish. They tend to fish in wooden boats within a mile of the shore (Ponco, 2011).
The production of the fishermen in Maluku is quite variable (Kompas, 2011). At times, the daily catch is small or nothing at all. The low and variable level of the daily catch as well as character of the marketing system are two of the most important factors serving to ensure the poverty of the fishermen of Maluku.
The fishermen of Maluku face at least three key problems in marketing their output. First, fish products are perishable, and production centers are often located far away from urban consumption centers. Second, the lack of ice factories in Maluku means that fish cannot be marketed very far from where they are caught. Third, the limited transportation facilities in Maluku means that fishermen are forced to sell their output in the closest markets. These three conditions tend to reduce both the earnings and welfare of fishermen in Maluku.
In Maluku, the value of fish products and the welfare of fishermen could be increased by improving the efficiency of marketing channels. By increasing the efficiency of fish markets between producer and consumer, fishermen on the island might be able to sell their product in more distant markets and obtain better prices. Also, consumers might be able to receive a higher valued product.
The purpose of this paper is to analyze the level of market efficiency in the fish markets in Maluku as a way of understanding how to improve the lives of fishermen on this island. When markets are not integrated there is a large difference in price between producers and consumers, and fishermen do not tend to benefit. By contrast, when markets are more integrated, and prices are more similar between producers and consumers, fishermen can benefit. In economic terms, the integration of spatial prices between producers and consumers can be defined as the degree of price transmission between markets, as manifested in the level of prices for the same commodity in different geographical locations. According to Ravallion (1986), Faminow and Benson (1990), Goodwin and Shroeder (1991), when the import price of a commodity is equal to the price of the exported commodity (including the costs of

8
storage and transportation), then it can be said that spatial integration exists between the two markets.
This research aims to describe the general condition of the fresh fish market on two islands in Maluku Province: the islands of Ambon and Seram. It aims to analyze the marketing system for fish on these islands in order to understand whether there is an efficient integration of the fresh fish market on these two islands and the extent to which producers (fishermen) benefit from these activities. The working hypothesis of the research is that fresh fish markets on these islands are not integrated, which means that these markets are inefficient, and that fishermen do not benefit as much as they could.
2. Research Methods The islands of Ambon and Seram were selected for this study because they have more purse seine fishermen than other islands in Maluku. Approximately 12-15 fishermen are needed to operate a purse seine.
As a municipality of Maluku, Ambon has 4 big traditional fish markets where the community buys and sells fish: Benteng, Mardika, Passo and Wayame. In Ambon, this research was focused in Mardika and Passo. While in Seram Island, there are 3 regencies, Western Seram, Central Maluku and Eastern Seram. As Districts of Central Maluku but located in Ambon, Leihitu and Salahutu are well known as fisheries production center in Ambon. Therefore, this research is centered in 2 markets in Ambon (Mardika and Passo), 2 markets in the districts of Central Maluku located geographically in Ambon (Leihitu and Salahutu) and 3 markets in regencies in Seram Island (Binaya, Piru and Bula).
Research work in these fish markets began in April 2012 and lasted for 6 months. The study recorded average daily prices for 3 kinds of dominant fish marketed in these markets in order to: (1) describe the price dynamics of fish products, (2) identify the marketing channels for fish products and (3) analyze the degree of market integration in these markets.
In this study the analysis of spatial market integration is based on Ravallion’s model (1986), which assumed that there is one central (urban) market and a group of local (rural) markets. While there may be some trade among the local markets, it is trade with the central market which dominates the determination of prices in the local market. In this research, the central market is called the reference market, and the local markets are called follower markets. Using this terminology, the static pattern of price formation among n markets, where market R is the central market, can be expressed by the following model:
𝑅 = 𝑓(𝑃1,𝑃2,𝑃3, …,𝑃𝑛,𝑋) (1)
𝑃𝑖 = 𝑓𝑖(𝑅,𝑋𝑖) (𝑖 = 2, …, n) (2)
where n is local market with price P, R is price in the reference market, and Xi (i = 1, …, N) is a vector of other influences on local markets.
Equations (1) and (2) just measure the price in time t, so that adding the influence of time lags in price will give a more dynamic structure. However, long lag periods result in a more complicated model and so price here in each market is assumed to only have a one time lag phase :
𝑃𝑡 = 𝑎𝑖𝑃𝑡−1 + 𝑏𝑖0𝑅𝑡 + 𝑏𝑖1𝑅𝑡−1 + 𝑐𝑖𝑋𝑡 + 𝜀𝑡 (3)
1 0
for i = 1,2,..n.
Equation (3) is sensitive to multicollinearity because the price of local and reference markets are highly correlated. Estimating the model in first differences will reduce the influence of multicollinearity due to the weaker correlation of lag (Rt – Rt-1) and (Pt – Pt-1) rather than Rt and Pt. Expressing the model in first differences results in:
𝑃𝑡 − 𝑃𝑡−1 = 𝑎𝑖𝑃𝑡−1 − 𝑃𝑡−1 + 𝑏𝑖0𝑅𝑡 + 𝑏𝑖1𝑅𝑡−1 + 𝑐𝑖𝑋𝑡 + 𝜀𝑡 (4)
By adding bi0 Rt-1 on the right side, the equation becomes:
(𝑃𝑡 − 𝑃𝑡−1) = (𝑎𝑖 − 1)(𝑃𝑡−1 − 𝑅𝑡−1) + 𝑏𝑖0(𝑅𝑡 − 𝑅𝑡−1) + (𝑎𝑖 + 𝑏𝑖0 + 𝑏𝑖1 − 1)𝑅𝑡−1 +𝑐𝑖𝑋𝑡 + 𝜀𝑡 (4.1)
Equation (4.1) can be simplified as follows:
(𝑃𝑡 − 𝑃𝑡−1) = 𝛽1(𝑃𝑡−1 − 𝑅𝑡−1) + 𝛽2(𝑅𝑡 − 𝑅𝑡−1) + 𝛽3𝑅𝑡−1 + 𝛽4𝑋𝑡 + 𝜀𝑡 (4.2)
where : 𝑎𝑖 − 1 = 𝛽1, 𝑏𝑖0 = 𝛽2, 𝑎𝑖 + 𝑏𝑖0 + 𝑏𝑖1 − 1 = 𝛽3 dan 𝑐𝑖 = 𝛽4.
In this study, the Xt variable of other influences on market prices consists of three dummy variables: D1 for season variables, D2 for transportation variables; and D3 for communication variables. These dummy variables are needed because: (1) fish products are highly seasonable and prices therefore tend to fluctuate by season; (2) Maluku consists of thousands of islands and so transportation between markets can affect prices; and (3) communication between and among markets can also influence price.
With the three dummy variables, the Ravallion model (1986) can be re-written as:
(𝑃𝑡 − 𝑃𝑡−1) = 𝛽1(𝑃𝑡−1 − 𝑅𝑡−1) + 𝛽2(𝑅𝑡 − 𝑅𝑡−1) + 𝛽3𝑅𝑡−1 + 𝛽4𝐷1 + 𝛽5𝐷2 + 𝛽6𝐷3 + 𝜀𝑡 (5)
To get clearly interpretation, the equation (5) is rewritten as:
𝑃𝑡 = (1 + 𝛽1) 𝑃𝑡−1 + 𝛽2(𝑅𝑡 − 𝑅𝑡−1) + 𝛽3 − 𝛽1𝑅𝑡−1 + 𝛽4𝐷1 + 𝛽5𝐷2 + 𝛽6𝐷3 + 𝜀𝑡 (5.1)
where: b1 = 1 + 𝛽1, b2 = 𝛽2 and b3 = 𝛽3 − 𝛽1
Equation (5.1) can be rewritten as:
𝑃𝑡 = 𝑏1 𝑃𝑡−1 + 𝑏2(𝑅𝑡 − 𝑅𝑡−1) + 𝑏3𝑅𝑡−1 + 𝑏4𝐷1 + 𝑏5𝐷2 + 𝑏6𝐷3 + 𝜀𝑡 (6)
According to Timmer (1987), the influence of past prices in local markets as well as past prices in the reference market on today’s local price can be identified by the Index Market Connection (IMC), which is defined as the coefficient ratio of follower market and reference market:
IMC = b3/b1 (7)
According to Timmer, IMC < 1 indicates short run integration between reference and follower markets. The closer the IMC is to 0 the higher the degree of integration between reference and follower markets.
1 1
In this case, b2 is an indicator of long run price integration between reference and follower markets. This parameter measures the long run integration by which the b2 is 1 or closer to 1. If coefficient b2 = 1, the reference and follower markets are perfectly integrated.
In this approach, short run integration hypothesis can be formulated as:
H0 : b1/b3 = 0
H1 : b1/b3 ≠ 0
The value of b1/b3 = 0 when b1 = 0, so that the hypothesis above can be written as:
H0 : b1 = 0
H1 : b1 ≠ 0
For statistic test:
When H0 is rejected, it means markets are not in the short run integrated.
Hypothesis for long run integration is:
H0 : b2 = 1
H1 : b2 ≠ 1
For statistic test )(0
2
2
bSbthitung
−=
When H0 is rejected, it means markets are not in the long run integrated.
)(0
1
1
bSbtcalculate−
=
3. Overview of Ambon and Seram Islands A. 3.1 OVERVIEW OF FISHING INDUSTRY IN AMBON AND
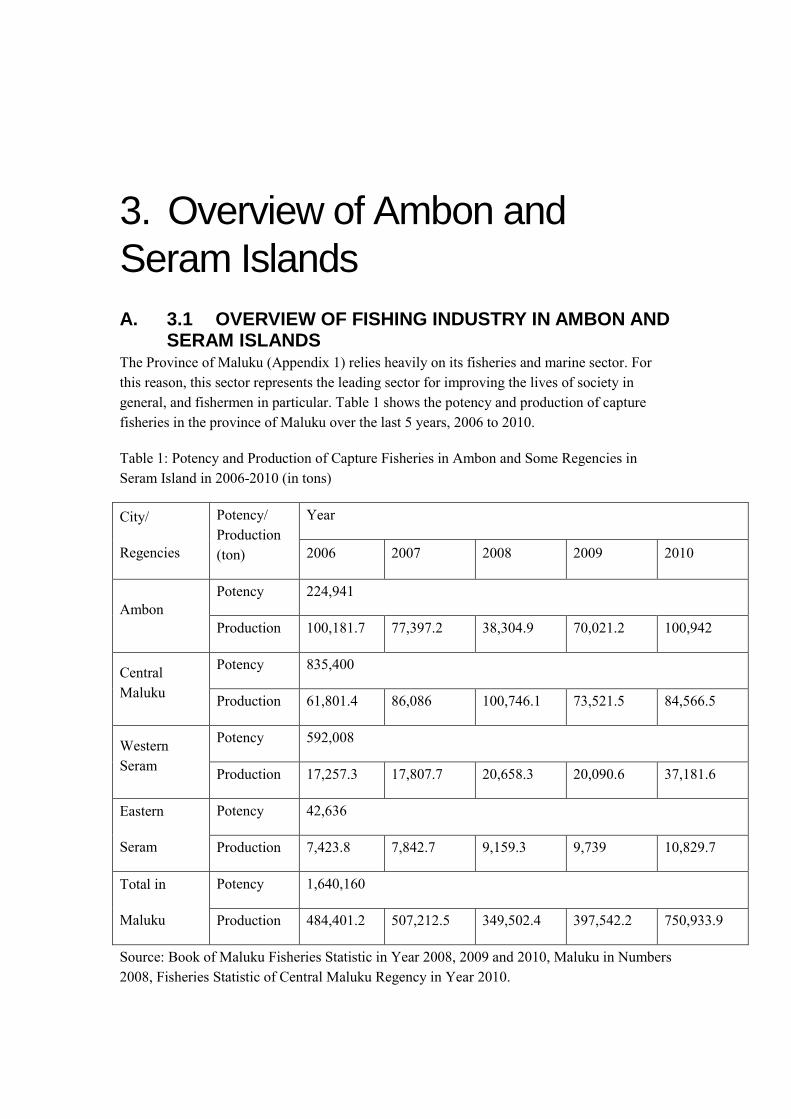
SERAM ISLANDS The Province of Maluku (Appendix 1) relies heavily on its fisheries and marine sector. For this reason, this sector represents the leading sector for improving the lives of society in general, and fishermen in particular. Table 1 shows the potency and production of capture fisheries in the province of Maluku over the last 5 years, 2006 to 2010.
Table 1: Potency and Production of Capture Fisheries in Ambon and Some Regencies in Seram Island in 2006-2010 (in tons)
City/
Regencies
Potency/ Production (ton)
Year
2006 2007 2008 2009 2010
Ambon Potency 224,941
Production 100,181.7 77,397.2 38,304.9 70,021.2 100,942
Central Maluku
Potency 835,400
Production 61,801.4 86,086 100,746.1 73,521.5 84,566.5
Western Seram
Potency 592,008
Production 17,257.3 17,807.7 20,658.3 20,090.6 37,181.6
Eastern
Seram
Potency 42,636
Production 7,423.8 7,842.7 9,159.3 9,739 10,829.7
Total in
Maluku
Potency 1,640,160
Production 484,401.2 507,212.5 349,502.4 397,542.2 750,933.9
Source: Book of Maluku Fisheries Statistic in Year 2008, 2009 and 2010, Maluku in Numbers 2008, Fisheries Statistic of Central Maluku Regency in Year 2010.
1 3
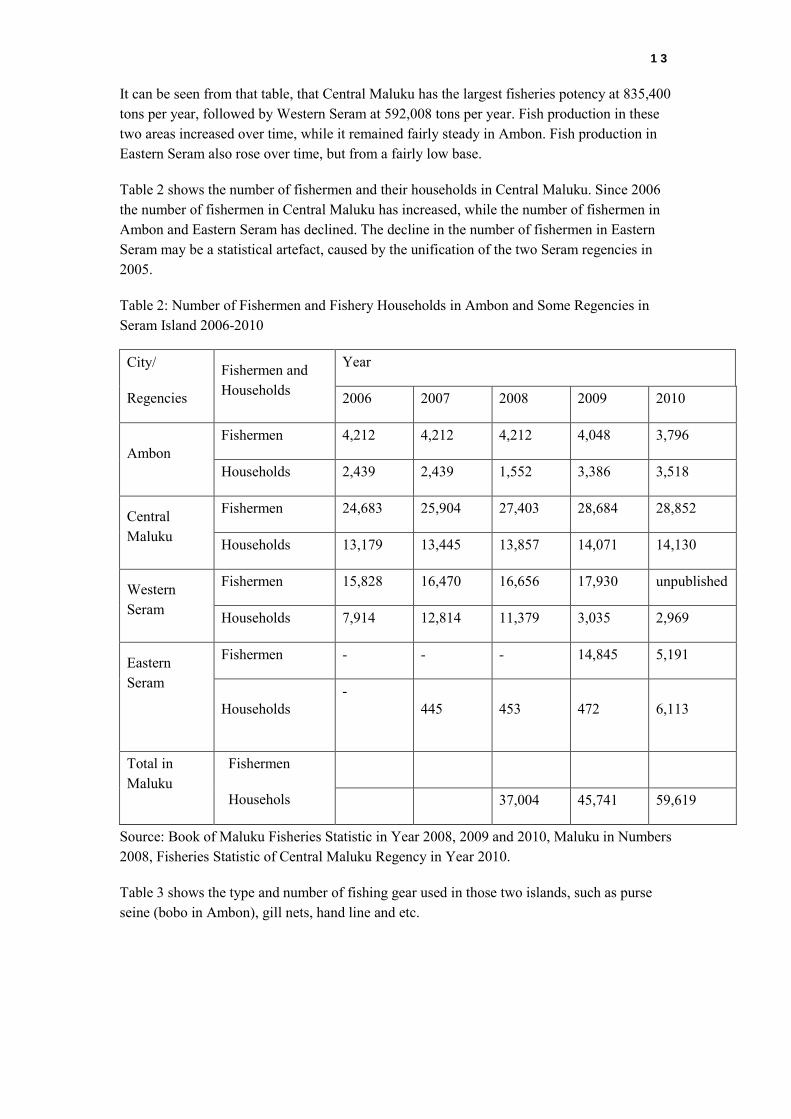
It can be seen from that table, that Central Maluku has the largest fisheries potency at 835,400 tons per year, followed by Western Seram at 592,008 tons per year. Fish production in these two areas increased over time, while it remained fairly steady in Ambon. Fish production in Eastern Seram also rose over time, but from a fairly low base.
Table 2 shows the number of fishermen and their households in Central Maluku. Since 2006 the number of fishermen in Central Maluku has increased, while the number of fishermen in Ambon and Eastern Seram has declined. The decline in the number of fishermen in Eastern Seram may be a statistical artefact, caused by the unification of the two Seram regencies in 2005.
Table 2: Number of Fishermen and Fishery Households in Ambon and Some Regencies in Seram Island 2006-2010
City/
Regencies
Fishermen and Households
Year
2006 2007 2008 2009 2010
Ambon Fishermen 4,212 4,212 4,212 4,048 3,796
Households 2,439 2,439 1,552 3,386 3,518
Central Maluku
Fishermen 24,683 25,904 27,403 28,684 28,852
Households 13,179 13,445 13,857 14,071 14,130
Western Seram
Fishermen 15,828 16,470 16,656 17,930 unpublished
Households 7,914 12,814 11,379 3,035 2,969
Eastern Seram
Fishermen - - - 14,845 5,191
Households -
445 453 472 6,113
Total in Maluku
Fishermen
Househols
37,004 45,741 59,619
Source: Book of Maluku Fisheries Statistic in Year 2008, 2009 and 2010, Maluku in Numbers 2008, Fisheries Statistic of Central Maluku Regency in Year 2010.
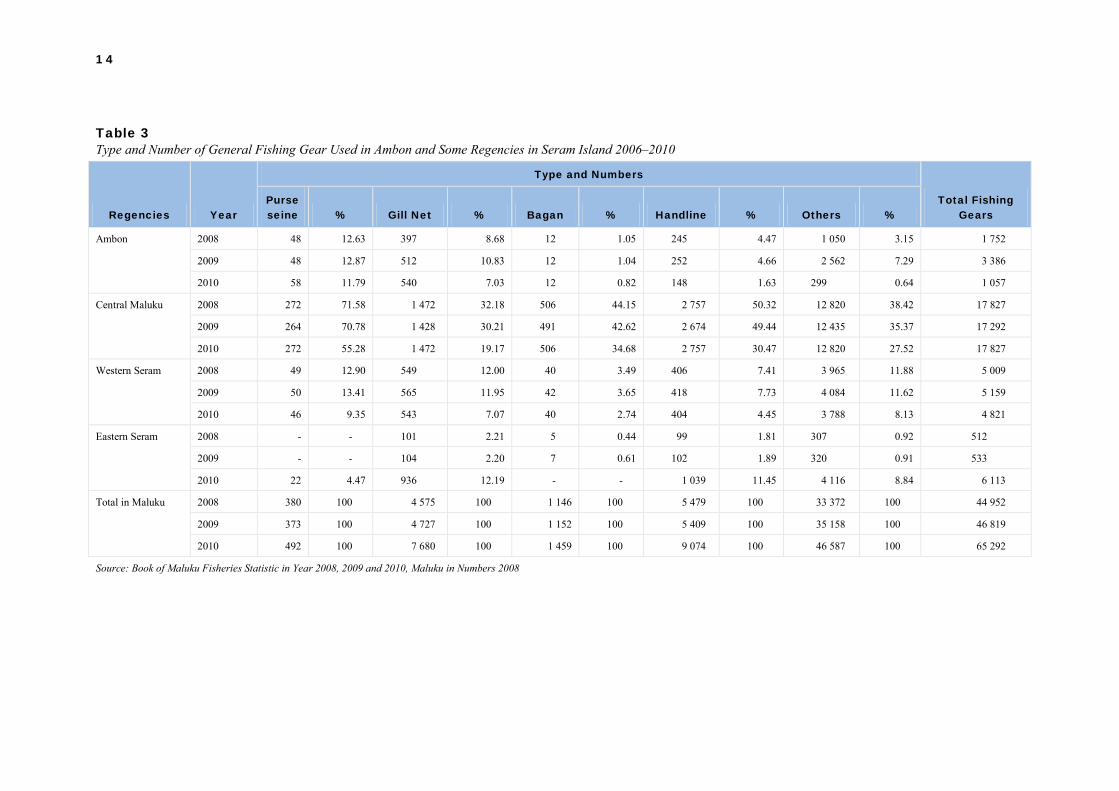
Table 3 shows the type and number of fishing gear used in those two islands, such as purse seine (bobo in Ambon), gill nets, hand line and etc.
1 4
Table 3 Type and Number of General Fishing Gear Used in Ambon and Some Regencies in Seram Island 2006–2010
Regencies Year
Type and Numbers
Total Fishing Gears
Purse seine % Gill Net % Bagan % Handline % Others %
Ambon 2008 48 12.63 397 8.68 12 1.05 245 4.47 1 050 3.15 1 752
2009 48 12.87 512 10.83 12 1.04 252 4.66 2 562 7.29 3 386
2010 58 11.79 540 7.03 12 0.82 148 1.63 299 0.64 1 057
Central Maluku 2008 272 71.58 1 472 32.18 506 44.15 2 757 50.32 12 820 38.42 17 827
2009 264 70.78 1 428 30.21 491 42.62 2 674 49.44 12 435 35.37 17 292
2010 272 55.28 1 472 19.17 506 34.68 2 757 30.47 12 820 27.52 17 827
Western Seram 2008 49 12.90 549 12.00 40 3.49 406 7.41 3 965 11.88 5 009
2009 50 13.41 565 11.95 42 3.65 418 7.73 4 084 11.62 5 159
2010 46 9.35 543 7.07 40 2.74 404 4.45 3 788 8.13 4 821
Eastern Seram 2008 - - 101 2.21 5 0.44 99 1.81 307 0.92 512
2009 - - 104 2.20 7 0.61 102 1.89 320 0.91 533
2010 22 4.47 936 12.19 - - 1 039 11.45 4 116 8.84 6 113
Total in Maluku 2008 380 100 4 575 100 1 146 100 5 479 100 33 372 100 44 952
2009 373 100 4 727 100 1 152 100 5 409 100 35 158 100 46 819
2010 492 100 7 680 100 1 459 100 9 074 100 46 587 100 65 292
Source: Book of Maluku Fisheries Statistic in Year 2008, 2009 and 2010, Maluku in Numbers 2008
The table shows that the number of fishing gear in Ambon and Western Seram fell over the period 2008 to 2010, while the number in Eastern Seram increased. In all years the total number of fishing gear was highest in Central Maluku.
3.2 OVERVIEW OF MARKETS IN AMBON AND SERAM ISLANDS
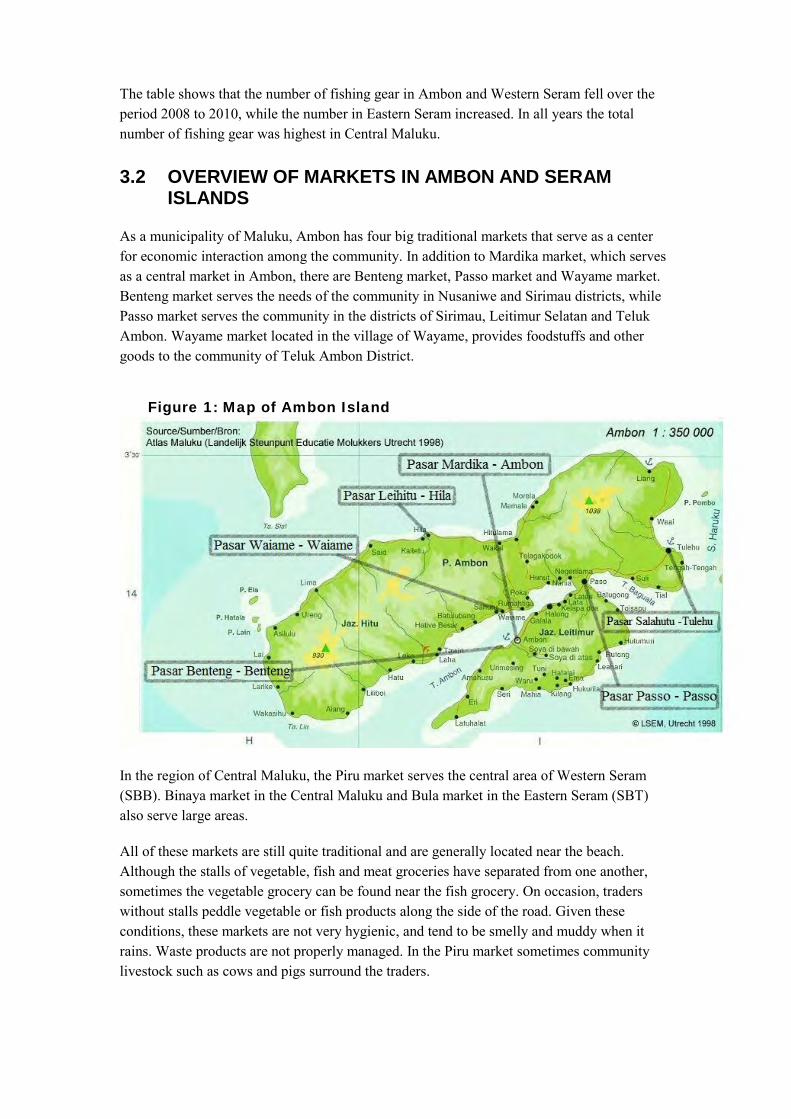
As a municipality of Maluku, Ambon has four big traditional markets that serve as a center for economic interaction among the community. In addition to Mardika market, which serves as a central market in Ambon, there are Benteng market, Passo market and Wayame market. Benteng market serves the needs of the community in Nusaniwe and Sirimau districts, while Passo market serves the community in the districts of Sirimau, Leitimur Selatan and Teluk Ambon. Wayame market located in the village of Wayame, provides foodstuffs and other goods to the community of Teluk Ambon District.
Figure 1: Map of Ambon Island
In the region of Central Maluku, the Piru market serves the central area of Western Seram (SBB). Binaya market in the Central Maluku and Bula market in the Eastern Seram (SBT) also serve large areas.
All of these markets are still quite traditional and are generally located near the beach. Although the stalls of vegetable, fish and meat groceries have separated from one another, sometimes the vegetable grocery can be found near the fish grocery. On occasion, traders without stalls peddle vegetable or fish products along the side of the road. Given these conditions, these markets are not very hygienic, and tend to be smelly and muddy when it rains. Waste products are not properly managed. In the Piru market sometimes community livestock such as cows and pigs surround the traders.
1 6
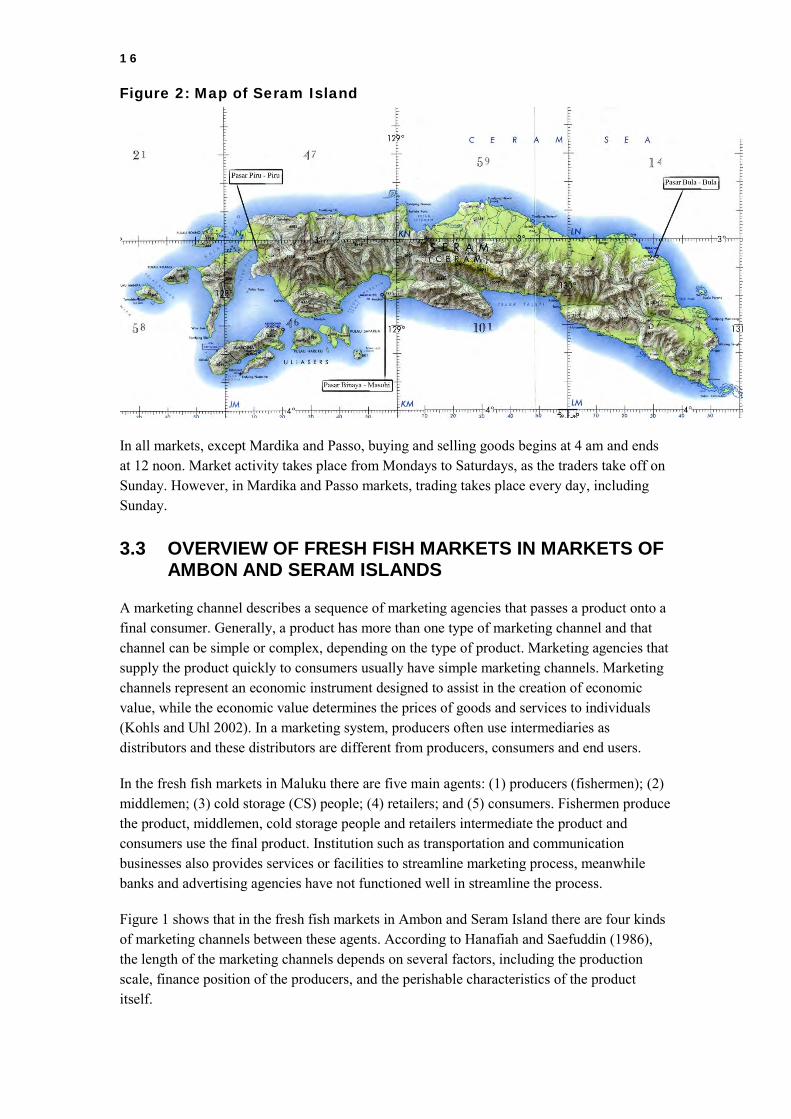
Figure 2: Map of Seram Island
In all markets, except Mardika and Passo, buying and selling goods begins at 4 am and ends at 12 noon. Market activity takes place from Mondays to Saturdays, as the traders take off on Sunday. However, in Mardika and Passo markets, trading takes place every day, including Sunday.
3.3 OVERVIEW OF FRESH FISH MARKETS IN MARKETS OF AMBON AND SERAM ISLANDS
A marketing channel describes a sequence of marketing agencies that passes a product onto a final consumer. Generally, a product has more than one type of marketing channel and that channel can be simple or complex, depending on the type of product. Marketing agencies that supply the product quickly to consumers usually have simple marketing channels. Marketing channels represent an economic instrument designed to assist in the creation of economic value, while the economic value determines the prices of goods and services to individuals (Kohls and Uhl 2002). In a marketing system, producers often use intermediaries as distributors and these distributors are different from producers, consumers and end users.
In the fresh fish markets in Maluku there are five main agents: (1) producers (fishermen); (2) middlemen; (3) cold storage (CS) people; (4) retailers; and (5) consumers. Fishermen produce the product, middlemen, cold storage people and retailers intermediate the product and consumers use the final product. Institution such as transportation and communication businesses also provides services or facilities to streamline marketing process, meanwhile banks and advertising agencies have not functioned well in streamline the process.
Figure 1 shows that in the fresh fish markets in Ambon and Seram Island there are four kinds of marketing channels between these agents. According to Hanafiah and Saefuddin (1986), the length of the marketing channels depends on several factors, including the production scale, finance position of the producers, and the perishable characteristics of the product itself.
1 7
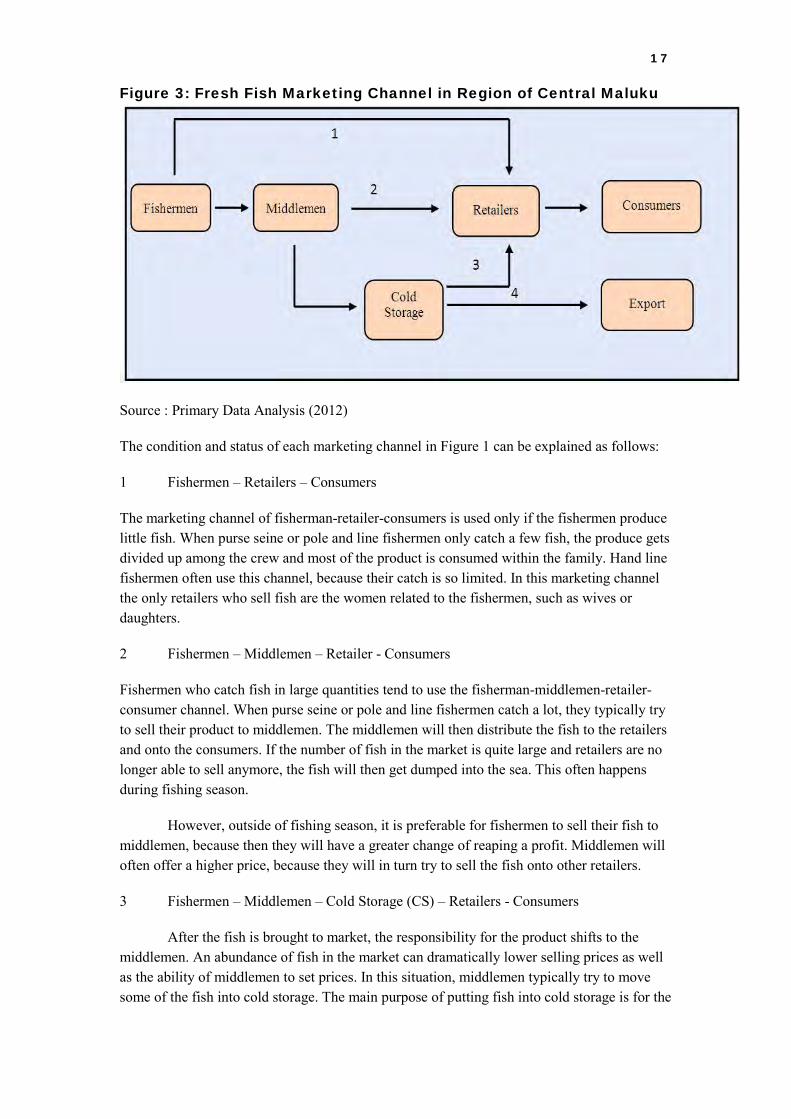
Figure 3: Fresh Fish Marketing Channel in Region of Central Maluku
Source : Primary Data Analysis (2012)
The condition and status of each marketing channel in Figure 1 can be explained as follows:
1 Fishermen – Retailers – Consumers
The marketing channel of fisherman-retailer-consumers is used only if the fishermen produce little fish. When purse seine or pole and line fishermen only catch a few fish, the produce gets divided up among the crew and most of the product is consumed within the family. Hand line fishermen often use this channel, because their catch is so limited. In this marketing channel the only retailers who sell fish are the women related to the fishermen, such as wives or daughters.
2 Fishermen – Middlemen – Retailer - Consumers
Fishermen who catch fish in large quantities tend to use the fisherman-middlemen-retailer-consumer channel. When purse seine or pole and line fishermen catch a lot, they typically try to sell their product to middlemen. The middlemen will then distribute the fish to the retailers and onto the consumers. If the number of fish in the market is quite large and retailers are no longer able to sell anymore, the fish will then get dumped into the sea. This often happens during fishing season.
However, outside of fishing season, it is preferable for fishermen to sell their fish to middlemen, because then they will have a greater change of reaping a profit. Middlemen will often offer a higher price, because they will in turn try to sell the fish onto other retailers.
3 Fishermen – Middlemen – Cold Storage (CS) – Retailers - Consumers
After the fish is brought to market, the responsibility for the product shifts to the middlemen. An abundance of fish in the market can dramatically lower selling prices as well as the ability of middlemen to set prices. In this situation, middlemen typically try to move some of the fish into cold storage. The main purpose of putting fish into cold storage is for the
1 8
purpose of export. For this reason, only certain types, sizes and qualities of fish are acceptable.
In certain situations, fishermen can sell directly to cold storage, when they know that they have a desirable quantity and quality of fish.
4 Fishermen – Middlemen – CS – Export
As noted above, the main purpose of cold storage is for exporting to foreign countries. Fish that has been purchased from the fishermen are collected, and when they meet a certain quota, they are sent to Surabaya for export.
3.4 MARKETING FUNCTIONS IN FRESH FISH MARKETS OF AMBON AND SERAM ISLANDS
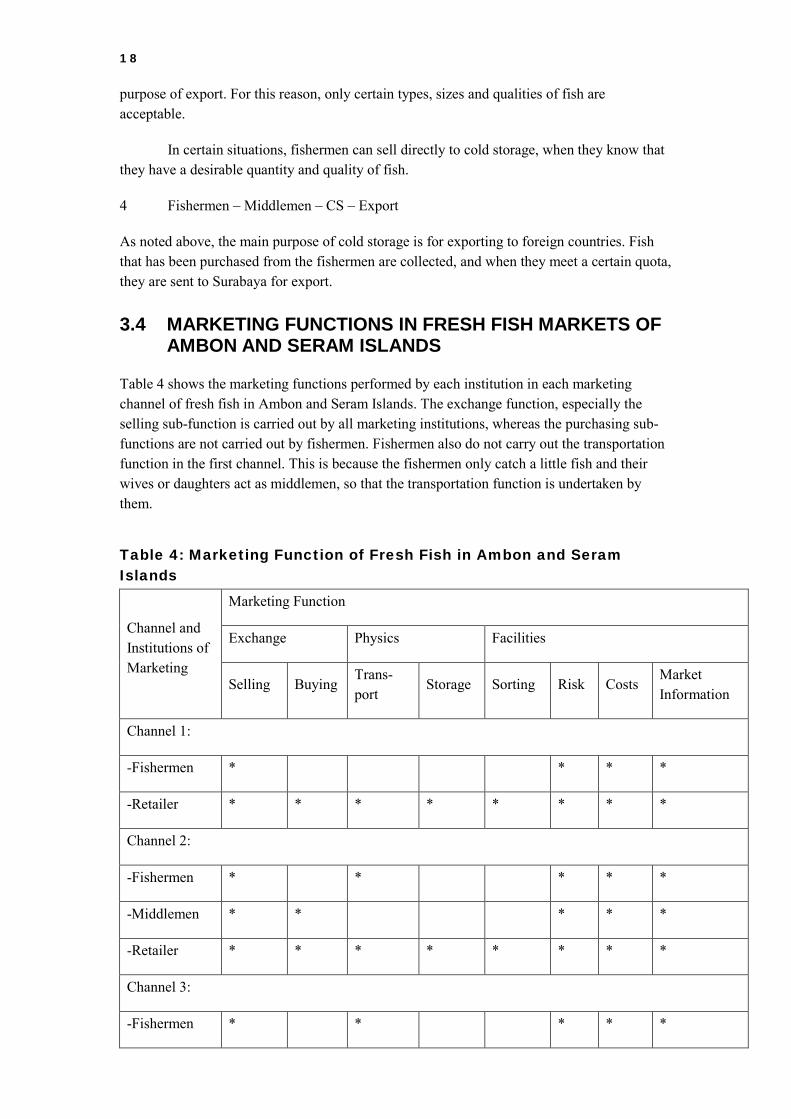
Table 4 shows the marketing functions performed by each institution in each marketing channel of fresh fish in Ambon and Seram Islands. The exchange function, especially the selling sub-function is carried out by all marketing institutions, whereas the purchasing sub-functions are not carried out by fishermen. Fishermen also do not carry out the transportation function in the first channel. This is because the fishermen only catch a little fish and their wives or daughters act as middlemen, so that the transportation function is undertaken by them.
Table 4: Marketing Function of Fresh Fish in Ambon and Seram Islands
Channel and Institutions of Marketing
Marketing Function
Exchange Physics Facilities
Selling Buying Trans-port
Storage Sorting Risk Costs Market Information
Channel 1:
-Fishermen * * * *
-Retailer * * * * * * * *
Channel 2:
-Fishermen * * * * *
-Middlemen * * * * *
-Retailer * * * * * * * *
Channel 3:
-Fishermen * * * * *
1 9
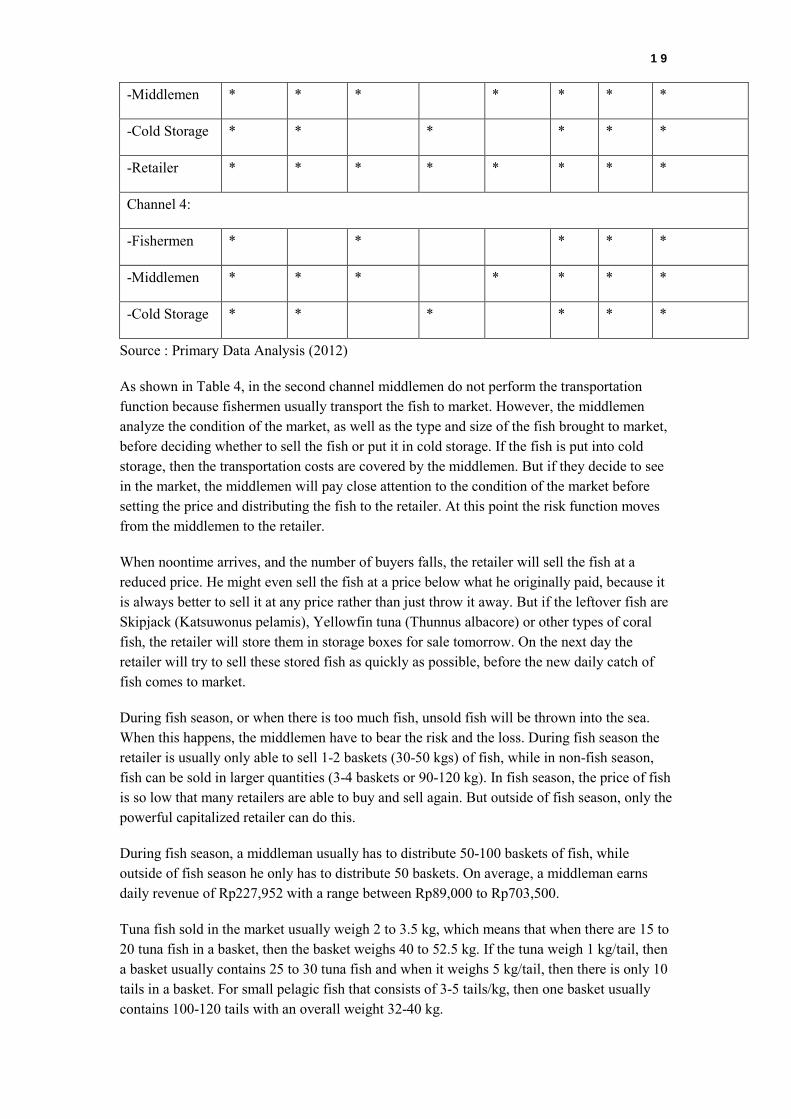
-Middlemen * * * * * * *
-Cold Storage * * * * * *
-Retailer * * * * * * * *
Channel 4:
-Fishermen * * * * *
-Middlemen * * * * * * *
-Cold Storage * * * * * *
Source : Primary Data Analysis (2012)
As shown in Table 4, in the second channel middlemen do not perform the transportation function because fishermen usually transport the fish to market. However, the middlemen analyze the condition of the market, as well as the type and size of the fish brought to market, before deciding whether to sell the fish or put it in cold storage. If the fish is put into cold storage, then the transportation costs are covered by the middlemen. But if they decide to see in the market, the middlemen will pay close attention to the condition of the market before setting the price and distributing the fish to the retailer. At this point the risk function moves from the middlemen to the retailer.
When noontime arrives, and the number of buyers falls, the retailer will sell the fish at a reduced price. He might even sell the fish at a price below what he originally paid, because it is always better to sell it at any price rather than just throw it away. But if the leftover fish are Skipjack (Katsuwonus pelamis), Yellowfin tuna (Thunnus albacore) or other types of coral fish, the retailer will store them in storage boxes for sale tomorrow. On the next day the retailer will try to sell these stored fish as quickly as possible, before the new daily catch of fish comes to market.
During fish season, or when there is too much fish, unsold fish will be thrown into the sea. When this happens, the middlemen have to bear the risk and the loss. During fish season the retailer is usually only able to sell 1-2 baskets (30-50 kgs) of fish, while in non-fish season, fish can be sold in larger quantities (3-4 baskets or 90-120 kg). In fish season, the price of fish is so low that many retailers are able to buy and sell again. But outside of fish season, only the powerful capitalized retailer can do this.
During fish season, a middleman usually has to distribute 50-100 baskets of fish, while outside of fish season he only has to distribute 50 baskets. On average, a middleman earns daily revenue of Rp227,952 with a range between Rp89,000 to Rp703,500.
Tuna fish sold in the market usually weigh 2 to 3.5 kg, which means that when there are 15 to 20 tuna fish in a basket, then the basket weighs 40 to 52.5 kg. If the tuna weigh 1 kg/tail, then a basket usually contains 25 to 30 tuna fish and when it weighs 5 kg/tail, then there is only 10 tails in a basket. For small pelagic fish that consists of 3-5 tails/kg, then one basket usually contains 100-120 tails with an overall weight 32-40 kg.

2 0
When middlemen sell fish to cold storage, the fish is usually only a certain type, quality and size. The storage function is then done by cold storage people, and the fish will later be purchased by middlemen or retailers for eventual export abroad.
3.5 PRICING MECHANISMS OF FISH PRODUCTS IN MARKETS OF AMBON AND SERAM ISLANDS
According to Hanafiah and Saefuddin (2006), the price of a product means that the market value (exchange rates) of that product is expressed in money terms. Price is an important and exciting thing for both the seller and buyer. For a seller, the difference between the cost of the product and its sales price will determine the amount of profit to be earned. Through prices, a consumer can indicate the type, quality and quantity of goods that he is willing to buy.
After the fishermen return with their catch, the owner of the nets will call the middleman to inform him of the type and quantity of fish caught. The fishermen usually return at dawn, and as soon as the middlemen have been informed, the fish will be transported to the market by a pickup truck. This usually takes place at 4 or 5 am, but can also occur later in the day, at 7 am to 12 noon. It all depends on when the fishermen return from the sea. Virtually all fishermen have a middleman in the market, someone whom they have used for decades. Between these parties there is standing agreement that if the fishermen bring fish to the market, then the middlemen will sell the fish to the retailers.
Although the fish are caught by fishermen, they lack the power to entirely set the price. There are always some negotiations, but the middlemen usually have more say about the price than the fishermen. When the price has been decided and approved by both sides, the retailers will then take the fish to their own stall for selling it. Payment can be done at the time fish is taken or after it is sold. Costs of transporting the fish to market are usually borne by the fisherman, while middlemen will normally pay for the consumption of the fisherman and his friend who go with him to the market. Many middlemen prefer selling fish to cold storage rather than to retailers, because the money can be received immediately and the price is stable. But cold storage only takes a certain size and quality of fish.
At the traditional markets in Ambon and Seram Islands, fish like Scad (Decapterus spp) Sardin (Rastrelliger sp) or Trevallies (Selaroides spp.), and so on are mostly sold in stack and it is vary depends on the availability of fish in the market. During a fish season, a stack of fish could be consisted of 10-15 tails and generally sold at Rp5,000– Rp10,000 per stack while in no fish season about 5-6 tails and sold at Rp10,000 to Rp20,000 per stack. Retailers have several tactics to encourage people to buy their fish. The most common tactic is to give one or two extra fish to the consumer. Reducing the price is rarely done by the retailer, but when 1-2 fish are given to the buyer, the retailer unintentionally lowers the selling price of the fish.
2 1
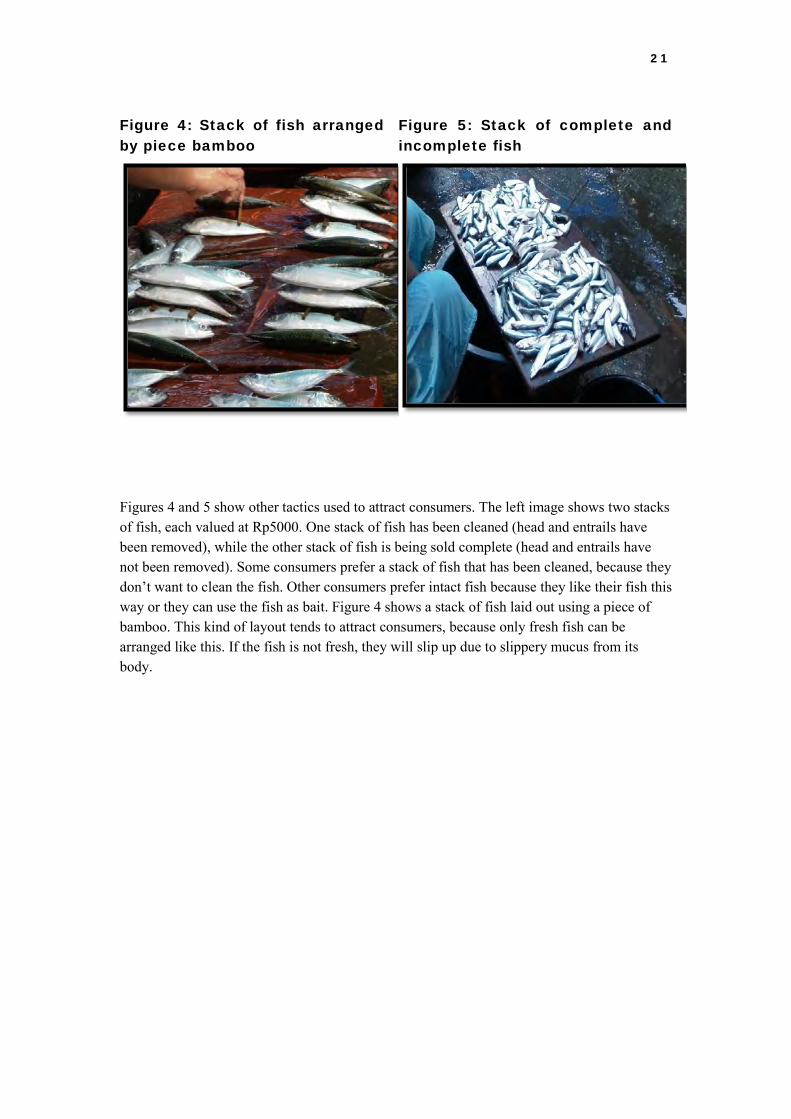
Figure 4: Stack of fish arranged by piece bamboo
Figure 5: Stack of complete and incomplete fish
Figures 4 and 5 show other tactics used to attract consumers. The left image shows two stacks of fish, each valued at Rp5000. One stack of fish has been cleaned (head and entrails have been removed), while the other stack of fish is being sold complete (head and entrails have not been removed). Some consumers prefer a stack of fish that has been cleaned, because they don’t want to clean the fish. Other consumers prefer intact fish because they like their fish this way or they can use the fish as bait. Figure 4 shows a stack of fish laid out using a piece of bamboo. This kind of layout tends to attract consumers, because only fresh fish can be arranged like this. If the fish is not fresh, they will slip up due to slippery mucus from its body.
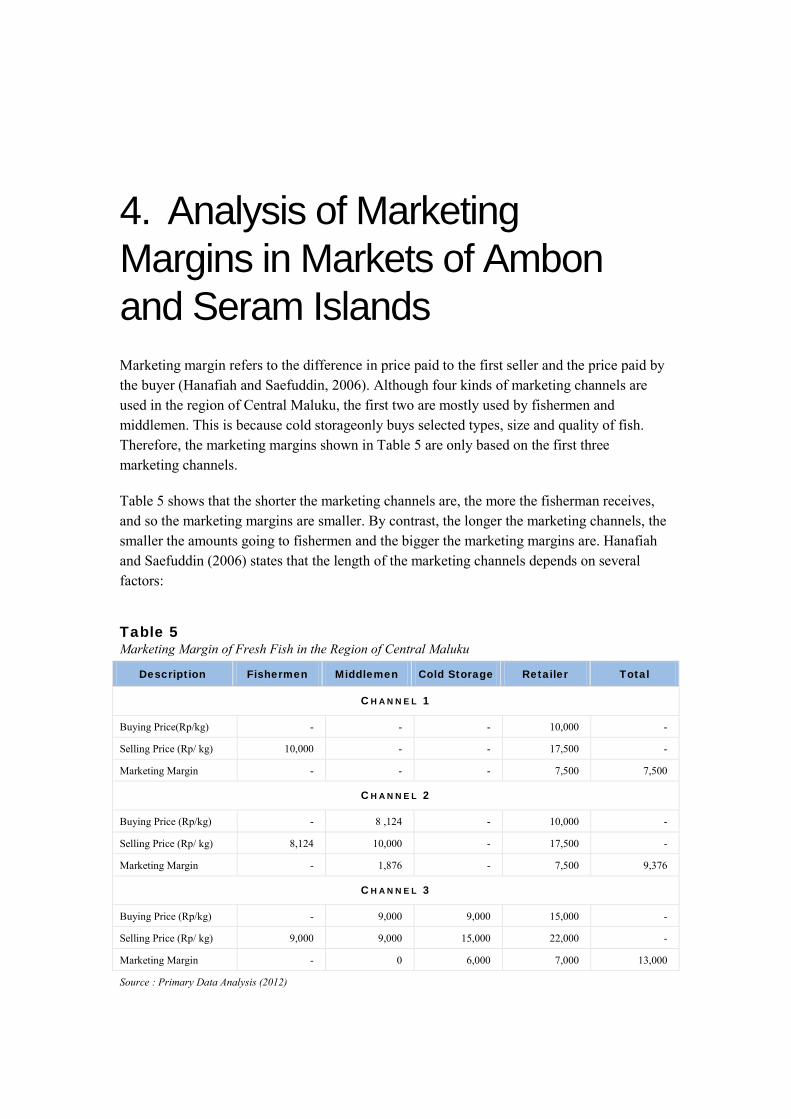
4. Analysis of Marketing Margins in Markets of Ambon and Seram Islands Marketing margin refers to the difference in price paid to the first seller and the price paid by the buyer (Hanafiah and Saefuddin, 2006). Although four kinds of marketing channels are used in the region of Central Maluku, the first two are mostly used by fishermen and middlemen. This is because cold storageonly buys selected types, size and quality of fish. Therefore, the marketing margins shown in Table 5 are only based on the first three marketing channels.
Table 5 shows that the shorter the marketing channels are, the more the fisherman receives, and so the marketing margins are smaller. By contrast, the longer the marketing channels, the smaller the amounts going to fishermen and the bigger the marketing margins are. Hanafiah and Saefuddin (2006) states that the length of the marketing channels depends on several factors:
Table 5 Marketing Margin of Fresh Fish in the Region of Central Maluku
Description Fishermen Middlemen Cold Storage Retailer Total
C H A N N E L 1
Buying Price(Rp/kg) - - - 10,000 -
Selling Price (Rp/ kg) 10,000 - - 17,500 -
Marketing Margin - - - 7,500 7,500
C H A N N E L 2
Buying Price (Rp/kg) - 8 ,124 - 10,000 -
Selling Price (Rp/ kg) 8,124 10,000 - 17,500 -
Marketing Margin - 1,876 - 7,500 9,376
C H A N N E L 3
Buying Price (Rp/kg) - 9,000 9,000 15,000 -
Selling Price (Rp/ kg) 9,000 9,000 15,000 22,000 -
Marketing Margin - 0 6,000 7,000 13,000
Source : Primary Data Analysis (2012)
2 3
The distance between producers and consumers. The longer the distance between producers and consumers, the longer the channel of a product.
A perishable product must be immediately received by the consumer, thus requiring shorter and faster marketing channels.
Production scale. Small scale producers tend to lose out if they sell directly to the market. In such circumstances the presence of middlemen is expected, so the marketing channels tends to be longer.
Entrepreneurs’ financial position.Producers who have strong finances tend to shorten their marketing channels because they are in position to perform some of the marketing functions themselves. In other words, producers who have capital tend to shorten the marketing channels.
Market integration is an indicator of market efficiency (Heytens 1986). Two markets are integrated when the difference of price among themis relatively small for the level of producers and consumers. The integration of spatial price can be defined as the price transmission among markets reflected in changing price in different geographical markets for similar commodities. According to Ravallion (1986), when the import price ofa commodity is equal to the price of the exported commodity (including the costs of transportation), then it can be said that spatial integration exists between the two markets.
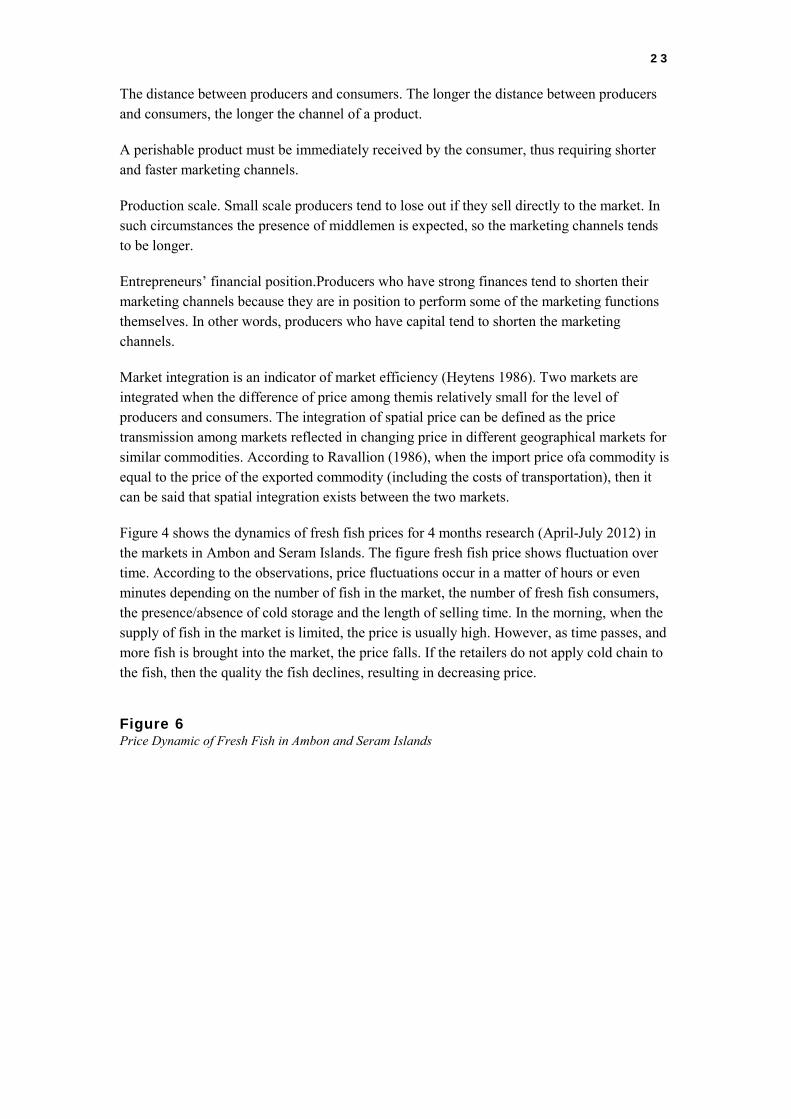
Figure 4 shows the dynamics of fresh fish prices for 4 months research (April-July 2012) in the markets in Ambon and Seram Islands. The figure fresh fish price shows fluctuation over time. According to the observations, price fluctuations occur in a matter of hours or even minutes depending on the number of fish in the market, the number of fresh fish consumers, the presence/absence of cold storage and the length of selling time. In the morning, when the supply of fish in the market is limited, the price is usually high. However, as time passes, and more fish is brought into the market, the price falls. If the retailers do not apply cold chain to the fish, then the quality the fish declines, resulting in decreasing price.
Figure 6 Price Dynamic of Fresh Fish in Ambon and Seram Islands
2 4
Source : Primary Data Analysis (2012)
In the traditional market in Ambon and Seram Islands, fish are not sold by the kilogram, but rather by the stack unit for small fish like Scad (Decapterus spp) sardine (Rastrelliger sp) and Trevallies (Selaroides spp) others. Big fish like Skipjack (Katsuwonus pelamis), Yellowfin (Thunnus albacore) and Bullet tuna (Euthynnus spp) are more often sold in unit of the tail. But sometimes big fish are also sold in stack sized 5 x 5 cm with a 1.5 cm thick as much as 8-10 pieces priced Rp10,000 in fish season or Rp20,000 in non-fishing season.This is one of the retailer strategies in selling fish when it is deemed too expensive for consumers. Price per stack fish is usually relatively stable, i.e. Rp10,000, Rp15,000 to Rp20,000 but the number and size of fish in these piles vary considerably. Skipjack (Katsuwonus pelamis), Yellowfin (Thunnus albacore) and Bullet tuna (Euthynnus spp) are often sold in two or four parts, extending from head to tail.
Figure 4 also shows that fish prices tend to rise and fall at similar rates across all markets, although the amount of the price increases/decreases varies over time. In the figure the lowest price of fish is Rp 4,966 on day 56 and 84, or in July and August in the market Leihitu. By contrast, in the figure the highest fish prices occur in the market Salahutu on day 2 and 27.
In the morning, when there is not much fish in the market, it is usually sold Rp20,000 per stack. As time progresses and more fish come into the market, prices tend to fall or the number of fish in a stack gets increased. If the quality of fish declines, the retailer has no choice but to increase the number of fish in a stack, so if it is converted into kilogram units, fish prices are cheaper.
Finally, the average fish prices in Leihitu market are lower than any other market. This might be due to the fact that fish production exceeds demand in this market. Fisheries Statistics for Maluku in 2010 shows that Leihitu District has the most fishery households in Central Maluku Regency, at 2.714 units, while the number of fishermen in this districts is 4,365 people. On the basis of these figures, it seems likely the fish production exceeds demand in this district.
5. Testing Fresh Fish Market Integration in Ambon and Seram Islands As noted above, analyzing the degree of market integration in the fresh fish markets in Ambon and Seram Islands can be done by estimating the Ravallion model (1986) in first differences. As expressed in equation (5), this model is:
𝑃𝑡 = 𝑏1 𝑃𝑡−1 + 𝑏2(𝑅𝑡 − 𝑅𝑡−1) + 𝑏3𝑅𝑡−1 + 𝑏4𝐷1 + 𝑏5𝐷2 + 𝑏6𝐷3 + 𝜀𝑡
As this research uses the average price of three kinds of dominant fish marketed either in the
reference or follower markets, then that model can be revised as:
P3it=(1+b1)P3it-1+b2(P3t - P3t-1)+(b3-b1) P3t-1+b4D1+b5D2+b6D3+ε ……. (8)
where P3it is the average of the daily price of 3 kinds of dominant fish marketed in local market (i) in time t, P3t is the average of daily price of 3 kinds of dominant fish marketed in reference market in time t, D1 is a seasonal dummy (0 = no fish season; 1 = fish season), D2 is a transportation dummy (0 = unstable; 1 = stable), D3 is a communication dummy (0 = no communication; 1 = communication).
The 3 kinds of dominant fish in a market were determined as follows. In general, the 5 main kinds of fish in the Maluku markets are: Trevallies (Selaroides spp), Scad (Decapterus spp), Skipjack (Katsuwonus pelamis), Yellowfin tuna (Thunnus spp) and Bullet tuna (Euthynus spp). Naturally, the number of each of these kinds of fish varies from day to day, and so the 3 dominant kinds on any given day are determined by the data collected in the research. For example, if the data showed that yesterday the three kinds of dominant fish were Skipjack (Katsuwonus pelamis), Scad (Decapterus spp) and Yellowfin tuna (Thunnus spp), today the data might show that the three dominant fish were Scad (Decapterus spp), Bullet tuna (Euthynus spp) and Trevallies (Selaroides spp), and so on. The price of the three kinds of dominant fish marketed in each market for 108 days was averaged and used in market integration testing.
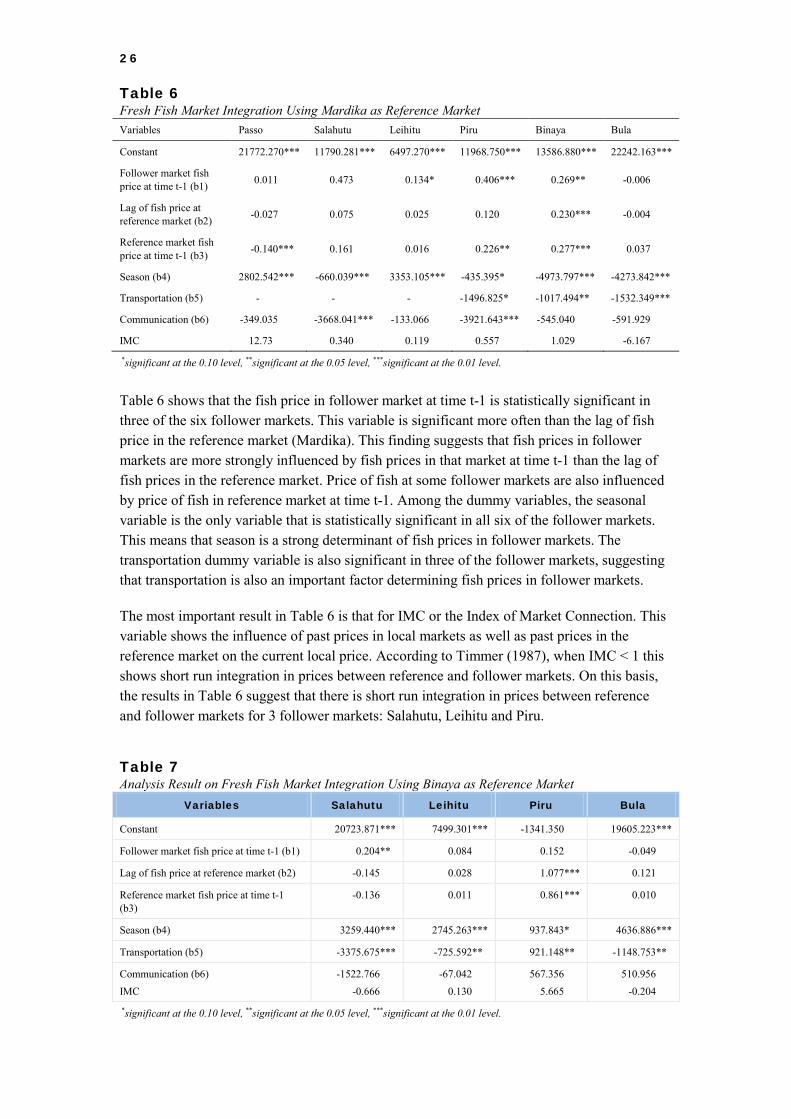
Table 6 presents results of estimating the model on fresh fish market integration when Mardika is used as the reference market and Passo, Salahutu, Leihitu, Piru, Binaya and Bula are follower markets. As can be seen, not all of the variables analyzed are significant and different markets show different variables being significant.
2 6
Table 6 Fresh Fish Market Integration Using Mardika as Reference Market Variables Passo Salahutu Leihitu Piru Binaya Bula
Constant 21772.270*** 11790.281*** 6497.270*** 11968.750*** 13586.880*** 22242.163***
Follower market fish price at time t-1 (b1) 0.011 0.473 0.134* 0.406*** 0.269** -0.006
Lag of fish price at reference market (b2) -0.027 0.075 0.025 0.120 0.230*** -0.004
Reference market fish price at time t-1 (b3) -0.140*** 0.161 0.016 0.226** 0.277*** 0.037
Season (b4) 2802.542*** -660.039*** 3353.105*** -435.395* -4973.797*** -4273.842***
Transportation (b5) - - - -1496.825* -1017.494** -1532.349***
Communication (b6) -349.035 -3668.041*** -133.066 -3921.643*** -545.040 -591.929
IMC 12.73 0.340 0.119 0.557 1.029 -6.167 *significant at the 0.10 level, **significant at the 0.05 level, ***significant at the 0.01 level.
Table 6 shows that the fish price in follower market at time t-1 is statistically significant in three of the six follower markets. This variable is significant more often than the lag of fish price in the reference market (Mardika). This finding suggests that fish prices in follower markets are more strongly influenced by fish prices in that market at time t-1 than the lag of fish prices in the reference market. Price of fish at some follower markets are also influenced by price of fish in reference market at time t-1. Among the dummy variables, the seasonal variable is the only variable that is statistically significant in all six of the follower markets. This means that season is a strong determinant of fish prices in follower markets. The transportation dummy variable is also significant in three of the follower markets, suggesting that transportation is also an important factor determining fish prices in follower markets.
The most important result in Table 6 is that for IMC or the Index of Market Connection. This variable shows the influence of past prices in local markets as well as past prices in the reference market on the current local price. According to Timmer (1987), when IMC < 1 this shows short run integration in prices between reference and follower markets. On this basis, the results in Table 6 suggest that there is short run integration in prices between reference and follower markets for 3 follower markets: Salahutu, Leihitu and Piru.
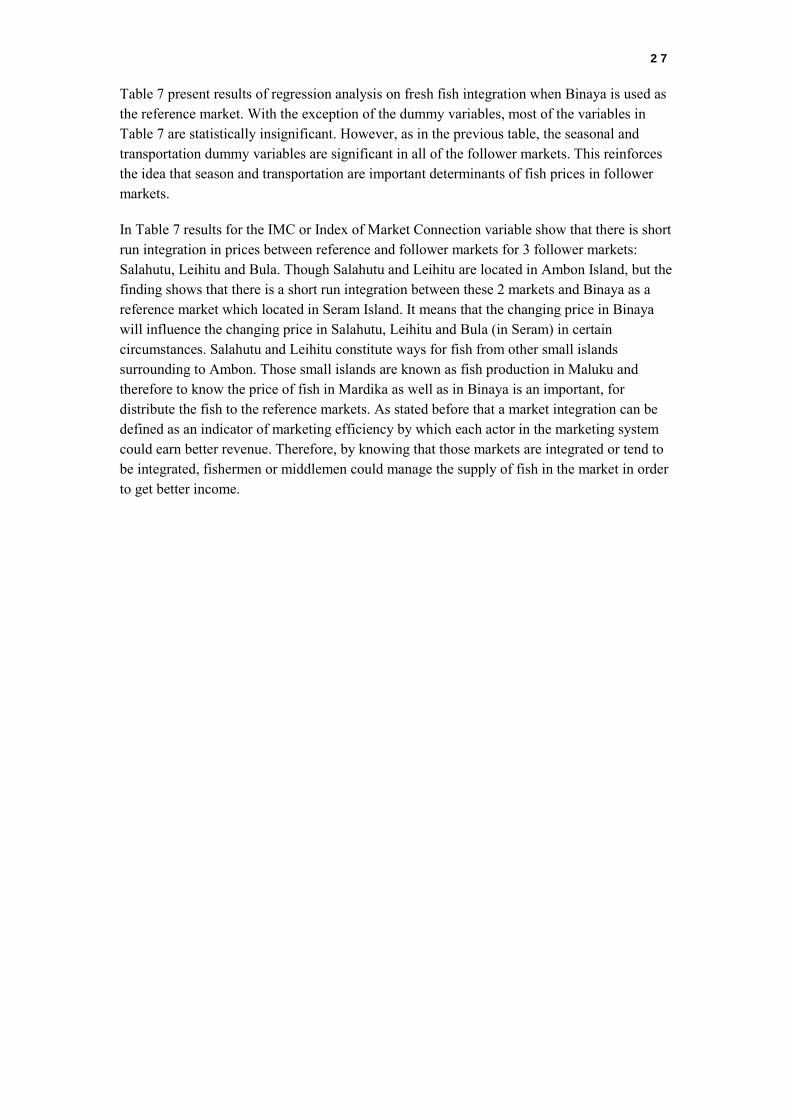
Table 7 Analysis Result on Fresh Fish Market Integration Using Binaya as Reference Market
Variables Salahutu Leihitu Piru Bula
Constant 20723.871*** 7499.301*** -1341.350 19605.223***
Follower market fish price at time t-1 (b1) 0.204** 0.084 0.152 -0.049
Lag of fish price at reference market (b2) -0.145 0.028 1.077*** 0.121
Reference market fish price at time t-1 (b3)
-0.136 0.011 0.861*** 0.010
Season (b4) 3259.440*** 2745.263*** 937.843* 4636.886***
Transportation (b5) -3375.675*** -725.592** 921.148** -1148.753**
Communication (b6) IMC
-1522.766 -0.666
-67.042 0.130
567.356 5.665
510.956 -0.204
*significant at the 0.10 level, **significant at the 0.05 level, ***significant at the 0.01 level.
2 7
Table 7 present results of regression analysis on fresh fish integration when Binaya is used as the reference market. With the exception of the dummy variables, most of the variables in Table 7 are statistically insignificant. However, as in the previous table, the seasonal and transportation dummy variables are significant in all of the follower markets. This reinforces the idea that season and transportation are important determinants of fish prices in follower markets.
In Table 7 results for the IMC or Index of Market Connection variable show that there is short run integration in prices between reference and follower markets for 3 follower markets: Salahutu, Leihitu and Bula. Though Salahutu and Leihitu are located in Ambon Island, but the finding shows that there is a short run integration between these 2 markets and Binaya as a reference market which located in Seram Island. It means that the changing price in Binaya will influence the changing price in Salahutu, Leihitu and Bula (in Seram) in certain circumstances. Salahutu and Leihitu constitute ways for fish from other small islands surrounding to Ambon. Those small islands are known as fish production in Maluku and therefore to know the price of fish in Mardika as well as in Binaya is an important, for distribute the fish to the reference markets. As stated before that a market integration can be defined as an indicator of marketing efficiency by which each actor in the marketing system could earn better revenue. Therefore, by knowing that those markets are integrated or tend to be integrated, fishermen or middlemen could manage the supply of fish in the market in order to get better income.
6. Living of Fishermen in Ambon and Seram Islands through Market Integration Market integration reflects price transmission and the extent of how changes in one market are transmitted to another, and implicitly shows the extent to which markets function efficiently. Spatial market integration implies smooth transmission of price signals and information across distanced markets. The absence of it refers to incomplete price transmission resulting mainly from government intervenes, trade handicaps, and/or transaction costs such as poor transportation and communication infrastructure (Omezzine 1998).
As stated before, besides production problems, the fishermen in Maluku are also facing marketing problems. Inefficient marketing showed by the result of fish market integration in Ambon and Seram Islands could be one of the causes of fishermen low revenue which also led to the low level of living. This research shows that the degree of integration of fish markets in Ambon and Seram Islands is only happened in some markets either the reference market is Mardika or Binaya. The integration of fish price takes place only in a short run which indicates that it is happened only in some circumstances. It means that at the time, a low marketing margin could happen as a logic implication of low transaction cost or other factors.
When markets are not integrated, the low price of fish in fishermen as well as high price in consumer level causes a high marketing margin. In fact, the biggest profit gained by the fishery products middlemen and (or) retailers who are also an extended of the middlemen themselves. The lowest price of fish in the fishermen level is mostly caused by the marketing system developed in decades which deliver more benefits to the middlemen. It is also added by the characteristic of product which is seasonable and perishable, limited of storage and transportation infrastructures, limited accessibility to information and market, especially for the fishermen in Seram Island. Geographic condition of Maluku which consists of thousand islands and long distance among regions (especially in Seram) makes the caught of fishermen in a region could only be sold in that region.
Lack of long run integration in prices between markets in Maluku can also be a factor affect the poverty of fishermen in this area, due to some reasons above. Therefore the role of Government is required on improving the marketing system of fisheries products in Maluku especially in Ambon and Seram Islands. Some strategic steps which could be offered resulted from this research are :

2 9
1 Improving the quality of product by applying post harvest technology, such as: provision of ice factory in production centre areas, improving and increasing of transportation infrastructure, in order to stabilized the market penetration and so the fishermen as producers could receive a reasonable margin according to the effort done
2 Government should develop a collaboration with private Cold Storage which located in production centers, like subsidies the electricity cost, so that Cold Storage able to buy fish from the fishermen with the proportionate price and quality.
3. Helping the middlemen who are weak in finance, so that they are able to compete in buying fish from the fishermen. The more of the strong finance of the middlemen the higher the bargaining position of the fishermen in determining fish price.
4. Improving the infrastructure of communication, so that fishermen could market information from many sources.

7. Conclusion Fluctuation of fish prices in the markets depends on the number of fish in the market, the number of fresh fish consumers, the presence or absence of cold storage and the length of selling time. In the traditional market in Ambon and Seram Islands, fish are sold in the stack unit for small fish like Scad (Decapterus spp), sardine (Rastrelliger sp) and Trevallies (Selaroides spp) others. Big fish like Skipjack (Katsuwonus pelamis), Yellowfin (Thunnus albacore) and Bullet tuna (Euthynnus spp) sold in tails.
Season significantly influences the price of fish in the whole markets, while transportation is significant in most of the markets, except Salahutu, Leihitu and Passo which located in the same land with Mardika as a reference market. Communication has a significant influence only in Salahutu and Piru. The fish prices in Salahutu and Leihitu markets are integrated in short run with either Mardika or Binaya as a reference market. Bula is only integrated when Binaya is a reference market. As Piru is the only market that integrated in the long run with Binaya resulting in efficiency of its marketing system.
Government’s role is necessary to improve the marketing system in Maluku which could deliver a higher income for fishermen.
References Dinas Perikanan dan Kelautan Provinsi Maluku. 2007. Buku Tahunan Statistik Perikanan
Provinsi Maluku Tahun 2007. Ambon.
Dinas Perikanan dan Kelautan Provinsi Maluku. 2008. Buku Tahunan Statistik Perikanan Provinsi Maluku Tahun 2008. Ambon.
Dinas Perikanan dan Kelautan Provinsi Maluku. 2009. Buku Tahunan Statistik Perikanan Provinsi Maluku Tahun 2009. Ambon.
Dinas Perikanan dan Kelautan Provinsi Maluku. 2010. Buku Tahunan Statistik Perikanan Provinsi Maluku Tahun 20010. Ambon.
Dinas Kelautan dan Perikanan Kabupaten Maluku Tengah. 2010. Laporan Tahunan Statistik Perikanan Tahun 2010. Masohi. Kabupaten Maluku Tengah.
Faminow MD, Benson BL. 1990. Integration of Spatial Markets. American Journal of Agricultural Economics. 72 (1) : 49-62.
Goodwin BK, Shroeder TC. 1991. Cointegration Test and Spatial Price Linkages in Regional Cattle Markets. American Journal of Agricultural Economics 73 (2) : 452-64.
Hanafiah AM, Saefuddin AM. 2006. Tataniaga Hasil Perikanan. Penerbit Universitas Indonesia. Jakarta.
Harian KOMPAS. 5 Desember 2011. Nelayan Terpaksa Membuang Ikan. Kompas : 21 (kolom 1-3).
Heytens PJ. 1986. Testing Market Integration. Food Research Institute Studies. Vol XX (1).
Kohls RL, Uhl JN. 2002. Marketing of Agricultural Products. A Prentice-Hall Upper Saddle River. New York.
Omezzine, A. 1998. On-shore fresh fish markets in Oman: A descriptive analysis. Agribusiness International, 10(1).
Ponco A. 2011. Mayoritas Nelayan Maluku Tradisional. Kompas : 24 Juni 2011.
Ravallion M. 1986. Testing Market Integration. American Journal of Agricultural Economics Vol 68 (1) : 102–109.
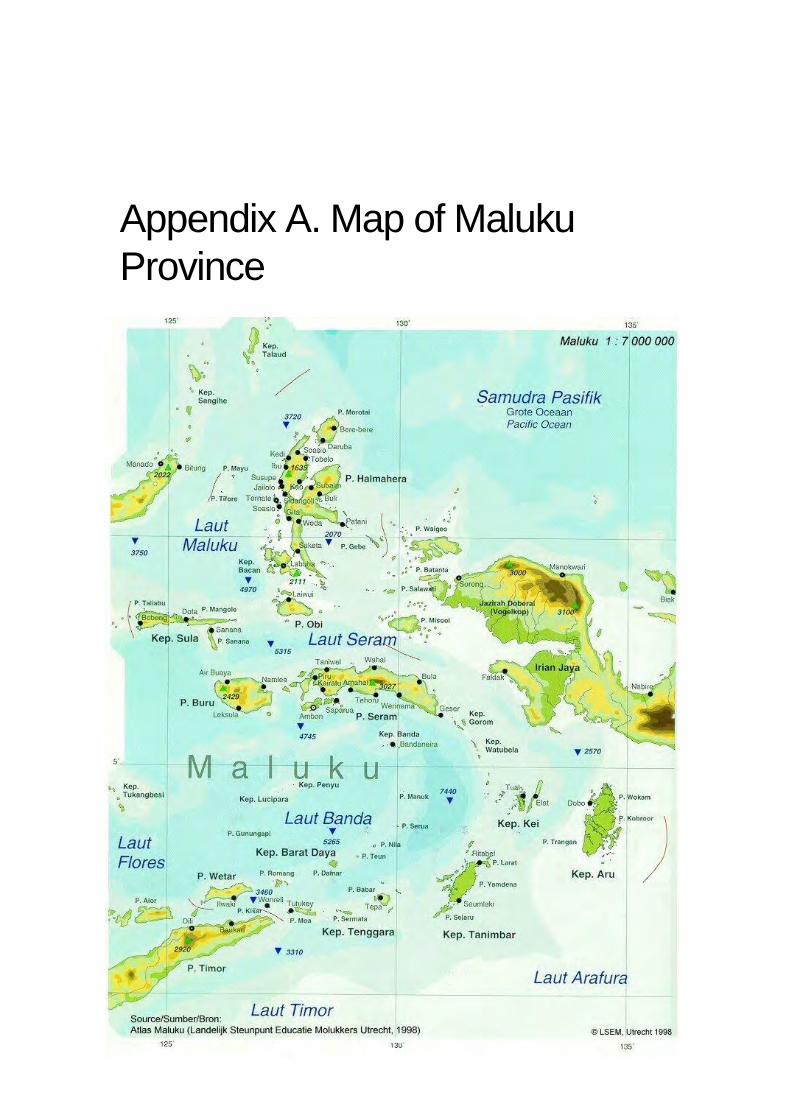
Appendix A. Map of Maluku Province

3 3


Appendix B. Documentation