Embed Size (px)
Citation preview

FISSHERIESS VALUEE CHAINN ASSESSSMENTT
BAGAMMOYO DISTRICTT, TANZAANIA
May 2011
Preppared by the Pwani Projecct
Tanzania CCoastal MManagemment Partnnership
i

This publication is available electronically on the Coastal Resources Center’s website at http://www.crc.uri.edu. For more information contact: Coastal Resources Center, University of Rhode Island, Narragansett Bay Campus, South Ferry Road, Narragansett, Rhode Island 02882, USA. Tel: (401) 874-6224; Fax: (401) 874-6920.
Citation: Wilbard Mkama, Abubakari Mposo, Mohamed Mselemu, James Tobey, Patrick Kajubili, Donald Robadue, Jeremiah Daffa, (2010), Fisheries Value Chain Analysis, Bagamoyo District, Tanzania, Coastal Resources Center, University of Rhode Island, Narragansett, RI, 28 pp.
Disclaimer: This report is made possible by the generous support of the American people through the United States Agency for International Development (USAID). The contents are the responsibility of the Coastal Resources Center at the University of Rhode Island as part of the Tanzania Coastal Management Partnership/Pwani Project. Cooperative Agreement No. 621-A-00-10-00012-00.
Cover and all photo credits: Wilbard Mkama
Cover photo: Sailing Canoes (Ngalawas) at Mlingotini Village: September, 2010
ii

Table of Contents
Acronyms ........................................................................................................................ iv
Acknowledgements ...........................................................................................................v
1. Introduction.................................................................................................................. 1
2. Methodology ................................................................................................................. 1
3. National Overview of the Marine Artisanal Fishery ................................................2
4. Bagamoyo District Overview of the Marine Artisanal Fishery ...............................3 Services and Facilities....................................................................................................7 Perceived Major challenges ...........................................................................................7
5. Value Chain Analysis...................................................................................................8 5.1 Fishers ...................................................................................................................... 8 5.2 Finance ..................................................................................................................... 9 5.3 Processing ................................................................................................................ 9 5.4 Fish Traders.............................................................................................................. 9 5.5. Beach Management Units and Collaborative Fisheries Management ..................11 5.6 Local and National Government ............................................................................12 5.7 MACEMP Project ..................................................................................................12
6. Conclusions and Recommendations .........................................................................18
7. References ................................................................................................................... 22
Annex 1: Guide to Names of Fish Species ...................................................................23
List of Figures
Figure 1. Fishermen focus group discussion: Dunda, November, 2010 ...............................2 Figure 2. Artisanal Catch and Number of Licensed Fishers In Bagamoyo District ..............5 Figure 3. Kitame Village beach, September, 2010 ...............................................................9 Figure 4. Improper handling prawn and fish at the Dar es Salaam Ferry Market ...............10 Figure 5. Ice blocks manufactured at the ferry market, Dar es Salaam, October, 2010 .....11 Figure 6. Icebox at Kitame..................................................................................................14 Figure 7. 40 hp outboard engine at Saadani ........................................................................15 Figure 8. Abandoned gillnet in fishermen’s home at Kitame ............................................17 Figure 9. Panorama of push and pull forces in open access fishery....................................19 Figure 10. Interventions to Support fishing ........................................................................20
iii
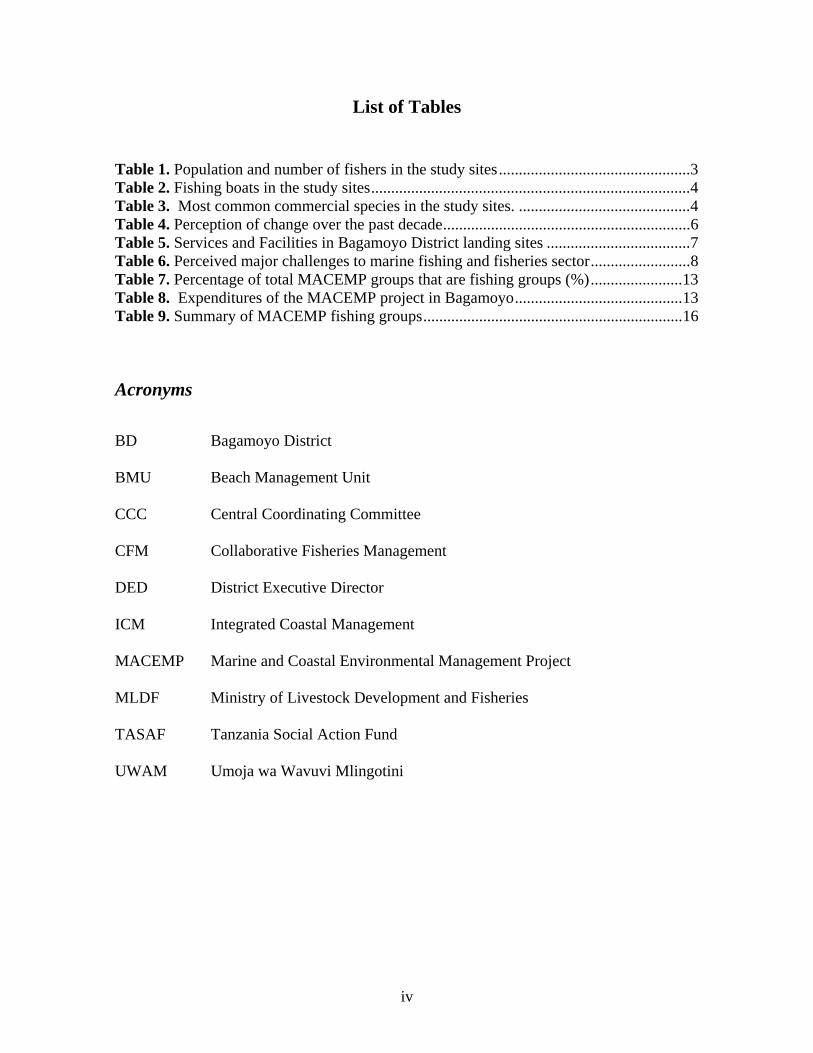
List of Tables
Table 1. Population and number of fishers in the study sites ................................................ 3 Table 2. Fishing boats in the study sites ................................................................................ 4 Table 3. Most common commercial species in the study sites. ........................................... 4 Table 4. Perception of change over the past decade .............................................................. 6 Table 5. Services and Facilities in Bagamoyo District landing sites .................................... 7 Table 6. Perceived major challenges to marine fishing and fisheries sector ......................... 8 Table 7. Percentage of total MACEMP groups that are fishing groups (%) ....................... 13 Table 8. Expenditures of the MACEMP project in Bagamoyo .......................................... 13 Table 9. Summary of MACEMP fishing groups ................................................................. 16
Acronyms
BD Bagamoyo District
BMU Beach Management Unit
CCC Central Coordinating Committee
CFM Collaborative Fisheries Management
DED District Executive Director
ICM Integrated Coastal Management
MACEMP Marine and Coastal Environmental Management Project
MLDF Ministry of Livestock Development and Fisheries
TASAF Tanzania Social Action Fund
UWAM Umoja wa Wavuvi Mlingotini
iv

Acknowledgements
This report was prepared by the Pwani Project of the Tanzania Coastal Management Partnership with the assistance of Mr. Mohamed Mselemu, Fisheries Officer and Mr. Abubakari Mposo, ICM Coordinator of the Bagamoyo District government and the village leadership at each of the five village study sites.
We are grateful to all those who have contributed to this report especially all those in the villages and landing sites who shared with us their own observations and knowledge about the opportunities and challenges facing the small-scale fisheries sub-sector in Tanzania.
v

1. Introduction
Tanzania is a coastal state in East Africa, bordering the Western Indian Ocean. The country has an ocean coast line of 1,424 km. Most of the coastline is characterized by rural development, and small-scale artisanal fisheries are an important part of the livelihoods of families in villages located on the coastal strip. There are an estimated 257 landing sites out of which only 58 percent are accessible year round by road, 53 percent have a good water supply, 46 percent have gear repair capabilities, and 39 percent have boat repair capabilities (MLDF 2009, MLDF 2010a).
This study examines the artisanal fishery in Bagamoyo District, which is located just 65 kilometers from Dar es Salaam. Bagamoyo District has a coast line of 100 km and a population of 228,967 in 2002 (National Census). Based on an annual growth rate of 2%, the current population is estimated to be 271,569. The marine fishery (of which 96 percent catch is from the artisanal fishery) is extremely important in Bagamoyo District. More than 90% of the population depends on the fishing industry as their major sources of daily income (Bagamoyo District Profile, 2009).
2. Methodology
A review was made of existing reports, data, and maps on the fishery from different sources, such as the Ministry of Livestock and Fisheries Development (MLFD), and various offices of Bagamoyo District government. Interviews with key informants were then held with district officials, including the ICM Facilitator, Fisheries Officers, Land Use (Spatial Planning) Officers, Cooperative Extension Officers, the District Executive Director, and Natural Resource Officers. Retail and wholesale fish markets in Bagamoyo and Dar es Salaam were also visited
There are nine coastal fishing villages in Bagamoyo District. The study team initially visited five, but later visited all nine in a follow-up field survey of the MACEMP project. Key informant and focus group interviews were conducted with Beach Management Units (BMUs), Environment Committees, Village leaders, fish buyers, fishers, and members of Collaborative Fisheries Management (CFM) Committees. The five villages were selected based on the fact that they are representative of the remaining four villages.
1

Figure 1. Fishermen focus group discussion: Dunda, November, 2010
3. National Overview of the Marine Artisanal Fishery
Nationally, there are an estimated 172,090 fishers in the marine and freshwater artisanal fishery composed of 135,769 freshwater fishers and 36,321 marine fishers (MLDF, 2009). Nationally, an estimated 4 million people are directly or indirectly employed in one way or another in the artisanal fisheries sub-sector (MLDF, 2007). This represents almost 10% of the entire 43 million population of Tanzania.
In Tanzania, the artisanal fishery (marine and freshwater) contributes about 99.15% of total fish harvest (MLDF, 2007). Since 2005, marine artisanal fish production has been decreasing rapidly. In 2007, the marine artisanal fishery contributed 13% of the total artisanal fish production (MLDF, 2007).
From 2007 to 2009 the number of marine fishers increased slightly by 0.2% from 36,247 to 36,321 in 2009 (MLDF, 2009). Over the same period, the number of fishing crafts increased at a greater rate (4%) from 7,342 to 7,664 (MLDF, 2009). Most of the vessels are unregistered. Sixty-eight percent of all fishing vessels were not registered in 2007 (MLDF, 2007). By 2009, this figure had increased to 73% (MLDF, 2009).
2

4. Bagamoyo District Overview of the Marine Artisanal Fishery
Bagamoyo District has 10 permanent landing sites (and 1 temporal) and an estimated 1,751 fishers (MLDF, 2010a).
Table 1. Population and number of fishers in the study sites
Land site/village Village Population*
Number of Fishers*
Mlingotini 2,121 800 Dunda (Kastamu and Nchipana landing sites)
11,428 250-270
Changwahela 250 200 Kitame 561 150 Saadani (Saadani and Kajanjo landing sites)
2,110 200
*Source: Village Council
Among these fishers, 1,462 use vessels, 229 are foot fishers and 60 are seaweed farmers (MLDF, 2010a). The dominant gears used by Bagamoyo fishers include gill nets (29%), hand lines (31%), and long lines (29%) (MLDF, 2010a). Most of the marine artisanal fishers in Bagamoyo District obtain their fish in shallow water habitats and nearby reef areas (TCMP, 2007) in the vicinity of the coastline. The Bagamoyo nearshore areas are characterized by sandy/muddy tidal flats, mangroves, coral reefs, rocky intertidal platforms, seagrass and algal beds, lagoons and estuaries (Msumi et al., 1999). These support fisheries through their high primary productivity and varied habitat. In spite of the importance of the marine and estuarine resources of Bagamoyo District, resource productivity is severely threatened by human activities, such as overfishing, dynamite fishing and other destructive fishing practices, and depletion of mangrove forests in the Bagamoyo area.
A small number of larger fishing vessels also fish far from the Bagamoyo coast. With recent grants of boats with engines from the Marine and Coastal Environmental Management Project (MACEMP), more fishing will now extend beyond the nearshore, shallow water areas.
3

Table 2. Fishing boats in the study sites
Landing Site/village
Dugout Canoes
Outrigger Canoe
(Ngalawa)
Dhow Large Boats (Mashua)
Boats with engines
Mlingotini 100 50 25 6 6 Dunda 10 70 5 5 5 Changwahela 15 15 10 2 5 Kitame* few 0 0 0 0 Saadani 2 19 0 0 8 *In Kitame, most of the boats are from Unguja (Zanzibar) and Bagamoyo (Dunda)
The table below shows the most common commercial species in the study sites. A very wide variety of fish species are harvested in addition to those listed. There is no by-catch, everything caught is sold or consumed by households.
Table 3. Most common commercial species in the study sites.
Landing Site/village Fishing sites Common and high value target fish species*
Mlingotini Kiteleke, Mshingwi, Milangon, Kilwa and Change
Changu, Kolekole, Karamamba, Tasi, Mkizi, and Chaa
Dunda Njemwambakuni, Bolibo, Bawe, Mivinje mitoto, Kibanda hodi, and Ruvu
Kolekole, Nguru,Changu,Tasi, Vibua, Pono, and Saladini About 20 women harvest Prawn at neap tide
Changwahela Mwaduga, Dambwe, Kifunguni, Mzimuni and Mbweni
Nguru, Changu, Kolekole, Swordfish, Tasi and Pweza
Kitame Matopeni, Kwa chege, Makonde, Mvinjeni utondo
Prawn (April to October), Kolekole, Changu, Karamamba, Chewa, Hongwe, and Mkizi
Saadani Fungunduli, Kajanjo, Dindiboko, Fungukubwa, Mazioni, Mwaniona, Mvinjeni, Mto wa kati and Uvinje
Nguru, Mziha, Pandu Hongwe Kanda and Gayogayo, Prawn (March to May)
*See Guide to Fish Names, Annex 1.
Artisanal fishing is by far the most important economic activity for the people in these villages with 70-80% of the population involved in some way in the fishing industry. Other occupations include boat building, salt making, charcoal making, mangrove pole cutting,
4

seaweed farming, house building, wage labour, livestock, and traditional medicine. Women traditionally play a role in fish processing, which in the case of Bagamoyo District only includes fish frying. They also harvest bivalves and fish on foot at low tide.
Community-based ecological monitoring studies conducted at selected sites in the district indicated declining health of some of Bagamoyo’s reefs. Interviews with fishers in 1996 revealed that stocks of prawns, fish, crabs, sea cucumbers, and mollusks had declined dramatically over the past 30-40 years. The causes of this decline were identified in 1999 as over-harvesting of resources, trampling by fishers during shell and sea cucumber collection, destruction by anchors, and dynamite fishing (CRC, 2005). From 1988 to 2010, the number of fishers in the District rose from 780 to 1,751.
At the same time that effort has more than doubled, the artisanal catch has declined dramatically. Annual catch in 2005 was nearly half of 1994 (See Figure 2 below) (District Fisheries Statistics). Along with the upsurge in the number of fishers, the number of traditional vessels in the district increased from 120 in 1996 to 368 in 2005.
Figure 2. Artisanal Catch and Number of Licensed Fishers In Bagamoyo District Source: Bagamoyo District Natural Resource Office, 2005, as shown in CRC, 2005.
Based on a 2005 report (CRC, 2005), fishermen report that daily catch per artisanal fisherman has declined from approximately 75kg in 1985 to 25kg in 2004. At the same time they have noticed a decrease in fish size (pers. comm. with Mlingotini fishers, January 2005). These are classic symptoms of unsustainable exploitation and over-fishing. The district’s artisanal catches are declining as fish stocks are collapsing. Poverty is
5

escalating in these fishing communities. Correspondingly, districts are losing revenue with the declining catch of small-scale fishers.
District catch data shows that after the introduction of Collaborative Fisheries Management (CFM) and ICM planning, catch began to increase again. The most recent data shows the following total catch for 2007-2010, which is significantly higher than the 2000-2005 period. Increased catch can be due to increased stock abundance, or increased fishing capacity and effort.
2,684 metric tonnes/year 2,781 metric tonnes/year 3,875 metric tonnes/year 2,941 metric tonnes/year
The District has one fiberglass boat with a 40 hp engine to conduct surveillance, but since July 2010 has not had a budget for fuel to operate it. The MACEMP program is providing a second patrol boat with a 75 hp engine.
Fishers and other stakeholders in the communities studied were asked their perception of change over the past decade. The table below show remarkably similar perceptions. Saadani, where the seasonal prawn fishery has historically been the major fishery, views climate change as a primary reason for worsening conditions. Freshwater flows to the Wami estuary are critical for prawn productivity.
Table 4. Perception of change over the past decade
Landing site/Village
Perception of change Reasons perceived
Mlingotini Decreased level of catch has resulted in worsening economic well-being and
increased time at sea
Growing number of fishermen, destructive fishing practices in the past,
climate change Dunda Decreased level of catch has resulted in
worsening economic well-being and increased time at sea
Growing number of fishermen, destructive fishing practices in the past,
climate change Changwahela Decreased level of catch has resulted in
worsening economic well-being and increased time at sea. Problem of
Kunduchi fishers intruding on fishing grounds
Growing number of fishermen, destructive fishing practices in the past,
climate change
Kitame Decreased level of catch has resulted in worsening economic well-being and
increased time at sea
Growing number of fishermen, destructive fishing practices in the past,
climate change, and trawling Saadani Decreased level of catch has resulted in
worsening economic well-being and increased time at sea
Climate change, trawling, blast and poison fishing practices
6

Services and Facilities. There are very limited services and facility infrastructure at the Bagamoyo District landing sites as shown in the table below.
Table 5. Services and Facilities in Bagamoyo District landing sites
Landing site/Village
Off beach
market
Cold storage
Electricity Fish processing
All season roads
Boat repair
Gear repair
Clean water supply
Mlingotini No No Yes No Yes Yes Yes Yes Nchipana/Dunda No No Yes Fish frying Yes Yes Yes No
Kastamu/Dunda Yes No Yes Fish frying Yes Yes Yes No
Changwahela No No No No No Yes Yes No Kitame No No No No No Yes Yes No Saadani No No Yes No No Yes Yes No Makurunge No No No No Yes Yes Yes Yes Magomeni No No Yes No Yes Yes Yes Yes Kaole No No Yes No Yes yes yes Yes Pande No No Yes No Yes Yes Yes Yes Kondo No No No No Yes Yes Yes Yes Mapinga No No Yes No Yes Yes Yes No
None of the fishing villages in Bagamoyo have facilities for fish handling, cold storage, processing, marketing and sales. The Kastamu landing site in Dunda is the only place used for auctioning fish soon after landing. At some of the landing sites, buyers bring their own small ice containers for keeping fresh fish. In Dunda, a few processors (mostly women) fry fish at the landing site.
Perceived Major challenges As shown in the table below, the major challenges to marine fishing and fisheries sector are perceived by the fishing communities and fishers as very similar across the study sites. The amount of fish catch is so low that there are no economies of scale for fish processing at the landing sites, ice boxes are not available on any of the boats or at any of the landing sites, and transportation is very limited to ship fish out to Dar es Salaam. Nevertheless, fishing effort continues to increase, catch per unit effort is falling, and fish prices continue to dramatically increase due to decrease catch and rapid growth in demand.
7

Table 6. Perceived major challenges to marine fishing and fisheries sector
Village Perceived challenges Mlingotini Lack of fish storage facilities, transportation to market are biggest
challenges. Others include better fishing gear and environmental education.
Dunda Lack of fish storage facilities, better fishing gear, and government revenue collection
Changwahela Lack of capital, lack of storage facilities, better fishing gear, and inaccessibility to markets
Kitame Declining fish catch, increased number of fishers, lack of capital, lack of storage facilities, better fishing gear, and inaccessibility to markets
Saadani Declining fish catch, increased number of fishers, lack of capital, lack of storage facilities, and inaccessibility to markets
5. Value Chain Analysis
5.1 Fishers
Fishers operating from boats are entirely male. They go out on a daily basis and share equally the catch. In Dunda and Mlingotini it was estimated by fishers interviewed that the average value of fish caught per person is 7,500 to 9,000 Tsh. In addition to this, up to 30% of the catch is distributed among the crew to supply their families with fish (artisanal fish catch provides 90 percent of the fish protein for Bagamoyo’s population (Msumi et al. 1999).) In fisheries that are seasonal, such as the prawn fishery in Saadani and Kitame, the average daily revenue from sale of fish can vary dramatically over the course of the year. In Dunda, Changwahela, Saadani, and probably the other villages, the custom is to disburse the revenues from catch of fish equally to all crew members. This is probably because the boats are owned collectively.
At 8,000 Tsh. per day, and assuming fishers go out 6 days a week, then the monthly income would be 180,000 to 216,000 Tsh (not including the fish for food that each crew member receives). If these revenues are accurate, then marine fishing, while struggling, is more lucrative than minimum wage labor, which is 85,000 Tsh. per month. Of course, the boats and gear do not last forever. It is estimated by fishers that an ngalawa costs 500,000-700,000, so if they have a usable lifetime of 5 years, then the monthly depreciation costs of the boat equal to 8,333 – 11,667 Tsh need to be taken into consideration. Larger boats (dhows and mashua) and engines will have a higher investment and depreciation cost.
8

Figure 3. Kitame Village beach, September, 2010
5.2 Finance
Boat and gear are usually purchased by fishermen through a loan or cash in kind primarily from fellow fishers and relatives. In rare cases, prawn fishers are provided gear by traders in return for selling to the traders at a reduced price.
5.3 Processing
There is no, or very little, smoking and drying/salting of fish in Bagamoyo district. This is because of insufficient fish supplies and the demand for and value of fresh fish is too high.
The only processing involves frying of fresh fish by women for immediate sale in neighboring villages.
5.4 Fish Traders
At the landing sites, buyers purchase fish at the beach by informal bargaining. Buyers are primarily local residents, typically women, who buy fish to fry and sell in other villages of Bagamoyo district. Dar es Salaam traders buy fish and pack them in small ice containers to preserve the fish and sell at the downtown Dar es Salaam Ferry market or to locations of rapid development and population growth, especially Mapinga, Vikawe, Kunduchi, Zingo and Kerege. Mlingotini fish buyers are mainly Dunda residents and Dar es Salaam traders. Dunda landing site fish are also locally purchased and sold to Dar es Salaam traders. The Dar Ferry market is 65 km from Dunda. Changwahela fish landing site to Dar Ferry market is only 40 km, a short trip by car, truck or motorcycle. Traders will generally purchase 30-50 kg of fish. Fish prices have been increasing rapidly, an indicator of decreasing catch and increasing demand.
9

There is an auction site for sellers and buyers at the Kastamu landing site in Dunda. However, the fish supply is insufficient for sellers who operate at Kastamu, and this situation is getting worse with time.
The market for prawn is different in Kitame and Saadani. In Kitame, prawn are sold by the fishers to traders in a monopoly market. Fishers must sell to the gear provider who buys the harvest at 20% less than the market price at the beach landing site. In Saadani, the study team was told that fishers fish with their own gear and sell to traders who transport the iced product to Zanzibar.
The ferry market in Dar el Salaam has facilities for processing and cold storage, but they are insufficient to meet the need. Fish traders at the Dar es Salaam ferry market perceive that fish trade would be improved if there was increased capital invested in storage facilities, and if the fishery had more modern gear and deep water boats. Fish traders from Bagamoyo sometimes pay for the Mbegani Fisheries Institute boat for fishing in deeper waters. In this case, fishermen will go 20-30 km off the coast. The study team was told that net profits from this activity are very good.
Figure 4. Improper handling prawn and fish at the Dar es Salaam Ferry Market, October, 2010
There are no retail fish stores in Bagamoyo town to purchase fresh fish on ice, or frozen fish. Individuals purchase fish from small sellers on the roadside, bus stand and at landing sites. Hotels and restaurants bring small ice storage containers to buy fish from sellers at the Kastamu landing site in Dunda.
10

Figure 5. Ice blocks manufactured at the ferry market, Dar es Salaam, October, 2010
5.5. Beach Management Units and Collaborative Fisheries Management
Beach Management Units (BMU) are composed of stakeholders in a fishing community with the goal of conservation, protection, monitoring and control of fishery resources and the environment, and fisheries planning and development with the fishing community in collaboration with government. BMUs were established throughout coastal Tanzania by the Fisheries Regulation 2009. At this time, BMUs exist on paper but they are not active. They require training and funding. One option for sustainable financing, suggested by a senior Fisheries Extension Officer in Bagamoyo District, is for villages to adopt by-laws that allow a percentage of fishing fines to go to the BMUs.
Beach Management Units apply to both marine and fresh water fisheries. They are tasked with the following (MLDF, 2010b):
• Enforcement of the Fisheries Act and Fisheries Regulations • Preparation of by-laws to facilitate the implementation of the National laws • Ensuring beach sanitation and hygiene • Collecting fisheries data/information, including fish catch and effort • Education on the negative impact of illegal fishing practices and other
environmental issues that affect fisheries resources and the general environment • Inspect fishing licenses, vessels, gear and fishing camps
11

• Monitor marine resources, including nursery and spawning grounds
The BMUs are supposed to work to minimize conflict in fishery resource use, reduce costs of government patrol and surveillance, and to support Village Environmental Committees on marine environmental protection. The leadership structure of each BMU is composed of a Chairperson, Secretary, Executive Committee, and the BMU assembly (all members), which meets once per year.
Collaborative Fisheries Management (CFM) pre-dates BMUs in marine fisheries, but were introduced in Law at the same time as BMUs (2009). Each CFM has a leadership and membership structure, typically located in a single fishing village (but a CFM can also encompass more than one village). The CFM concept is different from BMUs in that they deal not only with fish resources, but also other marine resources (mangroves, reefs, seagrass, etc.). It is an ecosystem-based approach to coastal and marine conservation. Multiple CFMs are resource users of the same reef system and marine ecosystem, so a Central Coordinating Committee that draws from all of the relevant CFMs is the coordination and decision-making structure for that particular marine area.
In principle, the CCCs and BMUs are intended to share recommendations and guidance and be mutually supportive. In practice, neither organizational structure is active in Bagamoyo District. The Department of Fisheries is currently reviewing the Fisheries Act to determine how to provide sustainable funding for both BMU and CFM structures, and to provide policy guidance for Districts.
5.6 Local and National Government
Local government is involved in fisheries management and decision making through Village Councils, Ward Executive Officers, District Executive Director and District fisheries officers.
Fisheries are a source of revenue at the District level. In Dunda fish landing sites, fishers are taxed 20 TSH per kilogram of fish sold for destination outside of Bagamoyo district. This is a source of District revenue that in theory is directed toward village development projects.
5.7 MACEMP Project
The Marine and Coastal Environmental Management Project (MACEMP) is funded by the World Bank and the Government of Tanzania. It was initiated in 2006. According to the Bagamoyo MACEMP Coordinator, the goal of the program was to reduce pressure on natural resources in the coast and economically boost the well being of coastal residents. During implementation of the project this design goal was seemingly lost because instead of reducing pressure on marine resources, pressure was increased. Livelihood groups in villages were granted fishing gear, engines and boats that effectively increased fishing effort. In the five villages of the VCA, a total of 24 fishing boats with engines was
12

recorded. The MACEMP program provided 42 engines to the same villages, almost a doubling of the number of fishing boats with engines.
MACEMP is hosted by the Ministry of Fisheries and Livestock Development (MFLD). From the Fisheries Department in MFLD, program resources are distributed to coastal Districts through the Tanzania Social Action Fund (TASAF, an NGO located in most of Tanzania’s Districts). TASAF delivers a grant to the District based on requests by the villages after a series of meetings to review the request and ensure that all conditions to access the grant money are fulfilled. After the purchase is made the District Officers receives receipts and over time visits the villages to ensure that the purchases are being used for the intended purpose and are being maintained.
Alternative livelihood and Fishing Groups were formed in all fishing villages at the time of the MACEMP project for the purpose of accessing MACEMP grants and loans that the program offered. These Groups are not connected to village government. They meet occasionally when there are agenda items to discuss. The majority of Groups formed in Bagamoyo coastal villages are Fishing Groups as shown below. Non-fishing Groups included crab fattening and livestock keeping.
Table 7. Percentage of total MACEMP groups that are fishing groups (%)
Saadani Kitame Mlingotini Kondo Changwahela Pande Kaole Magomeni Dunda
76 100 83 33 100 50 100 8.3 100
Source: Field survey of MACEMP group village leaders in Bagamoyo District,2011
The program also invested in land use planning, patrols, setup of Beach Monitoring Units (BMU), monitoring and evaluation, ecotourism, fish catch monitoring and management, coral reef monitoring and the purchase of office equipment . The distribution of MACEMP funds from 2008-2011 in Bagamoyo coastal villages is shown below.
Table 8. Expenditures of the MACEMP project in Bagamoyo
Timeframe Activity Expenditure (TSH) 2008-2011 Grants for 47 fishing groups and other livelihood
groups 900,000,000
2008/2009 Monitoring and evaluation, land use planning, BMUs, ecotourism, fish catch monitoring, data management and coral reef monitoring
236,129
2009/2010 Monitoring and evaluation, land use planning, BMUs, ecotourism, fish catch monitoring, data management and coral reef monitoring
127,818
2010/2011 Monitoring and evaluation, land use planning, BMUs, ecotourism, fish catch monitoring, data management and coral reef monitoring
770,816
TOTAL 901,136,764 Source: Bagamoyo MACEMP Coordinator
13

According to the Bagamoyo MACEMP Coordinator, about 53 fishing group have been formed out of which 47 have received grants. A field survey conducted in the first part of 2011 found that 100 fishing groups in 9 coastal villages were formed as part of the MACEMP program. The groups received fishing boats, outboard engines, fishing nets, iceboxes and life jackets. Before the MACEMP program, fishers could go as far as about five km and now they are able to go as far as 25km. Whether the boats and gear are used for fishing further offshore and have reduced pressure on natural resources in the coast is not confirmed with field evidence and interviews.
Most of the groups were trained by TASAF in group management and accounting, and in fisheries management by fisheries district officers. There was no formal training in engine maintenance and management. Most sardine and/or mackerel fishers have no ice boxes and sell their catch soon after landing. For the groups with ice boxes, ice blocks are mainly obtained in Malindi, Zanzibar when fishers land for the sale (auction).The price of an ice block is on average 6000 Tsh. and for a three day fishing trip fishers use about 8 ice blocks.
Figure 6. Icebox at Kitame
14

Figure 7. 40 hp outboard engine at Saadani
15

Table 9. Summary of MACEMP fishing groups
Village Saadani Kitame Mlingotini Kondo Changwahela Pande Kaole Magomeni Dunda Number of 17 10 6 3 3 2 3 36 20 groups Number of 10 13 20 29 15-18 20 14-16 11-20 10-20 members in the group Percentage of 20-50 20 20-30 24 22-26 25 12.5- 5-10 15-30 women in groups 37.5 (%) Number of 13 1 5 1 3 1 3 3 20 wooden boats Length/Width(m) 10/3 10/3.5 10/3.2 10/3.5 9/6 10/3 10/4 9/4 9/4 Number of 13 1 4 0 2 1 3 3 19 Engines(40HP) Number of 0 0 1 1 1 0 0 0 1 engines (60) Net mesh 6 6 0.75 0.5 0.5 0.5 0.25 6 and 3 0.25 size(Inches) and and
0.25 0.25 Icebox Yes Yes No No No No No Yes No
Lifejackets Yes Yes Yes, but not all
No No No Yes, but
Yes No
not all
Source: Field survey of MACEMP Fishing Groups in Bagamoyo District
16

The fishers in the Groups take turns using the boats, engines, and equipment, and share the revenues from their catch. It was found that generally 60%- 65% of the net income is saved in the group and 40% is distributed among members on board and members who were not on board. The exact arrangement varies across groups and depends on the particular agreement that each group has. Four fishers get on board per turn, spending more than three days at sea, except for the Dagaa fishers who spend a day. In Dagaa fishing, there may be in up to 19 members with the use of two dinghies for lighting. For some groups, fishing income that is saved is accumulated until the annual and semi-annual meeting where 80% of the saving is redistributed among members and 20% is retained. Some groups have not been able to generate savings and therefore do not distribute savings to its members.
There are internal conflicts in many of the groups. In Saadani, for example, the village leader stated that 12 out of 13 groups have internal conflicts. In some cases, group members on board make the sale of caught fish in Zanzibar, Dar es Salaam and Bagamoyo and report no catch to the rest of the group. Village leaders complain of poor involvement by MACEMP and TASAF to resolve conflicts and misuse of the system. In other cases, gear and the icebox have been abandoned and the boat is used to carry charcoal and mangroves to Zanzibar (Nguvukazi in Kitame).
Figure 8. Abandoned gillnet in fishermen’s home at Kitame
17

6. Conclusions and Recommendations
The artisanal fishing sector in Bagamoyo District has been badly degraded over time from overfishing and destructive fishing practices. Most of the marine resources are dependent on coral reef systems, which have been damaged and over harvested. In addition, estuarine nurseries have been impacts by alterations to freshwater flows and pulsing due to seasonal precipitation changes and other anthropogenic pressures on water resources. For these reasons, it must be concluded that one of the most important actions that can be taken to benefit fishers is to reduce fishing effort, and to protect and conserve fish resources and habitat to allow fisheries resources to recover.
There is very little fish processing in Bagamoyo. The majority is sold fresh to traders who sell in Dar es Salaam and the urban areas to the north of Dar es Salaam. The demand for fish there is very great, driving prices upward, causing overfishing, and easily absorbing nearly all the fish landed.
The driving factors are shown diagrammatically below. The high demand and insufficient supply of fish in the Dar es Salaam urban area reduces the fraction of fish available for local processing and sale in Bagamoyo. The excess demand for fish and high price are good for individual fishers, but high prices contribute to over fishing and collectively fishers are worse off as what can be caught gets smaller and smaller in total weight, fish size get smaller, and high value fish such as grouper nearly disappear.
Also at play in Bagamoyo are efforts to increase fishing capacity through boat, engine and gear grants (the MACEMP project) and efforts to control fishing. Both pull the fishery in opposite directions. The limited operational capacity of the Beach Management Units and Collaborative Fisheries Management means that the net effect is to drive the fishery even further in the direction of over fishing. This panorama of push and pull forces in open access fishery is shown in the larger, more detailed diagram below. This again points to the need for fisheries management in order to reduce fishing effort, and to protect and conserve fish resources and habitat to allow fisheries resources to recover.
18

Figgure 9. Panorrama of push and pull forcces in open acccess fishery
19
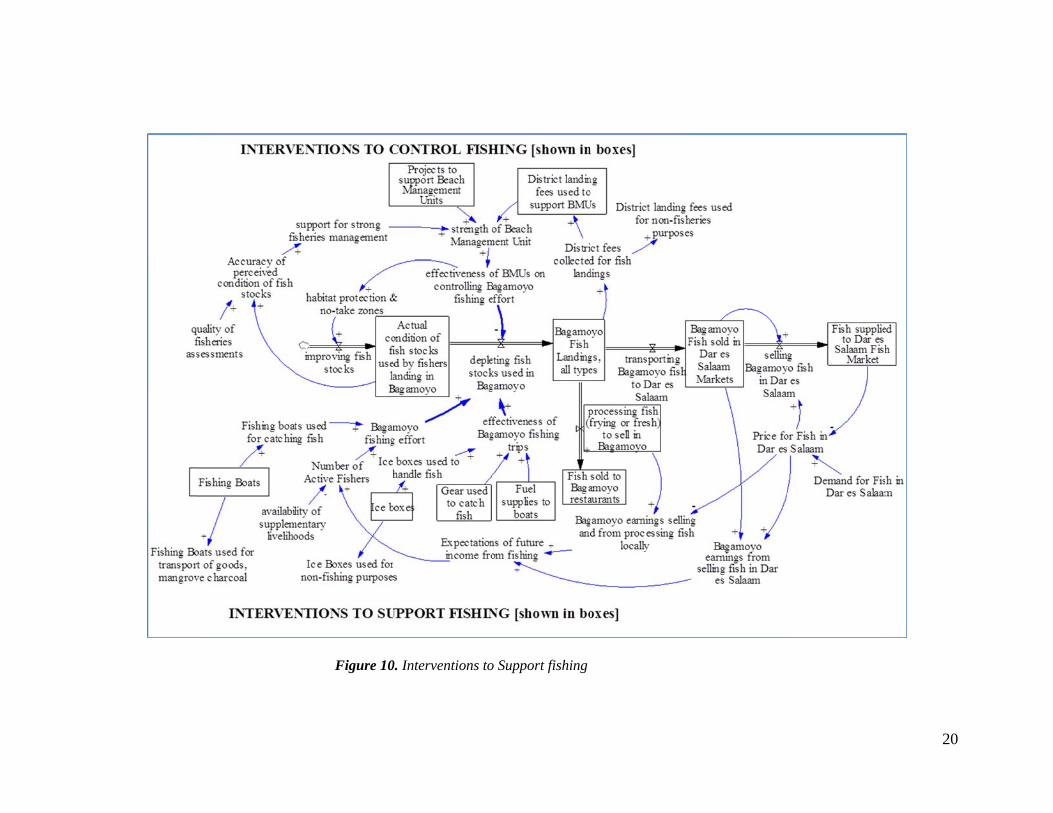
Figure 100. Interventions too Support fishing
20

In addition to fish resource conservation, this VCA has found that savings and credit schemes, cold storage, marketing, and sale of fish are areas of opportunity to improve value added to the sector. Other recommendations that emerge from this study include the following:
• Work with existing fisher associations to form SACCOs in major landing sites, such as Dunda and Mlingotini to enable fishers to access small loans to support fishing operating costs
• Improve hotel and restaurant fish marketing in Bagamoyo town by forming a Fishers’ Association that channels high quality fish to hotels and restaurants on a reliable basis. The Association would act as a wholesale fresh fish source, delivering fish to clients and dividing revenues among Association members according to their catch.
• Form a Fish Marketing Association in Changwahela where traders from Dar es Salaam and surrounding urban areas come to purchase fish. The Association would seek to improve the organization of fish buying and unite fishers to enable them to capture a higher fresh fish sales price.
• Provide training in group and conflict management skill training for the fishery groups because of the challenges that threaten the progress of the groups
• Provide training and technical assistance in entrepreneurship for those groups that have enough deposits to start non-fishing businesses (for example, some of the groups have up to 2.3 million Tsh in banked savings).
21

7. References
BD (2009), The Bagamoyo District Profile. Bagamoyo District, Tanzania.
CRC (2005), Community-based Fisheries Management Plan, July 2005 – July 2006. Manuscript. Coastal Resources Center, University of Rhode Island, 28 pp.
MLDF (2010a), Marine Fisheries Frame Survey Results. Ministry of Livestock Development and Fisheries, Fisheries Division, United Republic of Tanzania
MLDF (2010b), “Report on the Training of BMU’s on Catch Assessment for 14 Coastal Districts,” Ministry of Livestock Development and Fisheries, Fisheries Division, United Republic of Tanzania, 24 pp.
MLDF (2009), Annual Fisheries Statistic Report for 2007. Ministry of Livestock Development and Fisheries, Fisheries Division, United Republic of Tanzania.
MLDF (2007), Annual Fisheries Statistic Report for 2007. Ministry of Livestock Development and Fisheries, Fisheries Division, United Republic of Tanzania.
Msumi, G., Y. Mgaya, M. Muruke, and A. Semesi (1999), “The Artisanal Fishery in Bagamoyo: A Case Study of Mbegani”, in Jiddawi, N. and R. Stanley (1999), editors, “Fisheries Stock Assessment in the Traditional Fishery Sector: The Information Needs,” Proceedings of the National Workshop on the Artisanal Fisheries Sector, Zanzibar, September 22-24, 1997, Zanzibar, Tanzania.
TCMP (2007), Ecological monitoring of coral reef in no-take and fished zones off Bagamoyo and Mkuranga coasts, Tanzania Coastal Management Partnership and the Coastal Resources Center, University of Rhode Island.
22

Annex 1: Guide to Names of Fish Species
Common Name, Swaheli
Common Name, English
Scientific Name Habitat
Changu Emperor Lethrinus spp., Lutjanus spp.
Reef
Chewa Grouper Epinephelus spp. Reef Gayogayo Hongwe Catfish Arius spp. Estuaries; mangroves Jodari Tuna Euthynnus sp.,
Thunnus sp. Pelagic
Kanda Karamamba
Kolekole Pompano Trachynotus sp. Pelagic Mkizi Mullet Mugil cephalus Pelagic
Mzia/Msusa Barracuda Nguru Mackeral Scomberomorus
commerson Pelagic
Pandu Pono Parrotfish Leptoscarus spp. Reef
Prawn Prawn Pweza Octopus Reef
Saladini Sardinella gibbosa Pelagic Swordfish
Tasi Rabbitfish Siganus spp. Reef Vibua Mackeral Rastrelinger kanagurta Pelagic – sandy
23


![IMPLICATIONS OF VAT BILL, 2014 ON OIL, GAS AND MINERALS [BAGAMOYO]](https://img.pdfslide.net/doc/110x75/58779bb11a28ab0f778b6f97/implications-of-vat-bill-2014-on-oil-gas-and-minerals-bagamoyo.jpg)


