Embed Size (px)
Citation preview
FISSION PRODUCT RANGE EFFECTS ON HEU FISSILE GAS MONITORING FOR UF, GAS
J. K. Munro, Jr., T. E. Valentine, R. B. Perez, J. K. Mattingly, J. March-Leuba, J. T. Mihalczo
Oak Ridge National Laboratory* Oak Ridge, Tennessee 37831-6010
Paper to be presented at the 38th Annual Meeting of the
Institute of Nuclear Materials Management Phoenix, Arizona July 20-24, 1997
“The submitted manuscript has been authored by a contractor of the U.S. Government under
Contract No. DE-AC05-960R22464. Accordingly, the U.S. Government retains a
nonexclusive, royalty-free license to publish or reproduce the published form of this
contribution, or allow others to do so, for U.S. Government purposes.”
* Managed by Lockheed Martin Energy Research Corp. for the U.S. Department of Energy under contract number DE-AC05-960R22464.
~~~~~~~~
1
Fission Product Range Effects on HEU Fissile Gas Monitoring for UF6 Gas
John K. Munro, Jr., T. E. Valentine, R. 6. Perez, J. K. Mattingly, J. March-Leuba, and J. T. Mihalczo
INTRODUCTION
The amount of 235U in u F 6 flowing in a pipe can be monitored by counting gamma rays emitted from fission fragments carried along by the flowing gas. Neutron sources are mounted in an annular sleeve that is filled with moderator material and surrounds the pipe. This provides a source of thermal neutrons to produce the fission fragments. Those fragments that remain in the gas stream following fission are carried past a gamma detector. A typical fragment will be quite unstable, giving up energy as it decays to a more stable isotope with a significant amount of this energy being emitted in the form of gamma rays. A given fragment can emit several gamma rays over its lifetime. The gamma ray emission activity level of a distribution of fission fragments decreases with time. The monitoring system software uses models of these processes to interpret the gamma radiation counting data measured by the gamma detectors.
r APPROACH Fission fragment range distributions were constructed from a combination of measured heavy ion stopping powers in various chemical elements (solids and gases) as a function of energy and from measured fission fragment yields as a function of fragment velocity for heavy and light fragments. The fragment ranges were also corrected for gas pressure and molecular composition. Ranges of many fragments are long enough to cause a significant loss at the process pipe wall. Fragment wall absorption also depends on a fragment’s radial location and direction of travel when it is born.
‘
Data used to calculate range effects were collected from a variety of sources [ 1-51. Some of the data were measured much more recently than others, with some of the “classic” work dating back 40-50 years. Mass and energy resolution of measured distributions is thus quite variable or limited due to the measurement technology available at the time the experiments were done.
Fission Fragment Ranges in UF6 The path lengths of fission fragments in UF6 gas were determined using measured ranges as published in the Nuclear Data Tables[ 11. Range values given in these tables are the integrated path lengths (in units of mgkm’) of heavy charged particles traversing various media. Range values in units of cm can be obtained from the conversion
Range(mg I cm2 ) p ( m g I cm3)
R(cm) =
where p is the density of the media traversed by the charged particles. Fission fragment ranges were calculated separately for uranium, with the density of uranium in UF6 given by
and for fluorine by
(there are 6 moles of fluorine for each mole of UF6) where Au, AF, and A U F ~ are the atomic weights of uranium, fluorine, and UF6, respectively. A useful summary of physico-chemical properties of uF6 is available in a technical report by R. DeWitt [2]
The Nuclear Data Tables do not give range values for charged particles in fluorine, so these must be obtained by interpolation using data for elements having greater and lesser numbers of protons (Z) than fluorine (e.g., 0 and Ne), as follows
RF = Ro + ( A F - Ao) ( f i e - Ro) / ( A N = - Ao) (4)
where RF is the range in fluorine, and AN^ are the atomic weights of fluorine, oxygen, and neon, respectively. The mean stopping power for a molecule is the sui& of the products of molecular fraction of an element and that element’s stopping power [3]:
is the range in oxygen, R N ~ is the range in neon, and AF, Ao,
s,, = nisi element 1
Stopping power is inversely proportional to range, giving eventually
Data from the Nuclear Data Tables used to calculate ranges do not take into account multiple scattering and straggling effects. According to measurements of Niday[4], the tabulated values need to be reduced by approximately 15%. Other references (e.g., Segre [5]) give a 10% uncertainty to account for straggling. A decision was made to use the latter value for the work described in this report.
Fission Fragment Range Calculations Fragment range values in fluorine were determined by interpolation of the data for oxygen and neon. Fission fragment ranges in UF6 for five additional fission fragments (isotopes) from the high yield part of the fission fragment distribution curves were also calculated using data in the Nuclear Data Tables. These range values are needed to check values oTparameters in analytic expressions used to model the distribution of fission fragments created by the neutron source (i.e., creation of gamma emitting precursors).
~

* .
c
Details of the range calculations are significant because approximately two-thirds of the light fragments will leave the gas stream and accumulate on the pipe wall for the operating parameters finally chosen (pressure of 45 mmHg, operating temperature 25 deg. C, and pipe diameter of 10 cm). These losses also change significantly with changes in the gas pressure and pipe diameter in the neighborhoods of these values, as will be shown below.
Fission Fragment Range Probability Distributions Pipe diameter and UFg gas pressure are two critical parameters for making the most effective material flow measurements. If the diameter is too small or the gas pressure too low, most of the fission fragments are lost to the pipe wall. Criticality safety considerations impose an upper limit to pipe diameter of about 12 cm. As gas pressure rises, ideal gas law behavior is lost. This is undesirable since the models used assume ideal gas law behavior.
When the uranium nucleus fissions, two massive fragmenls (usually of unequal mass) are created which travel in opposite directions. The light fragments have higher velocities than the heavy fragments, so have greater path lengths in the gas. A much larger portion of them are lost to the pipe wall than the heavy fragments. Measured fission fragment yields, often tabulated or plotted as functions of fragment velocity,,energy, or mass, typically have a double humped distribution. These fragments usually have energy which they lose by emitting gamma and x-rays. The emitted gamma rays are the basis for the monitoring system described in this report. Variable numbers of neutrons are also emitted when fission occurs. Since the energy liberated in the fission process is divided in different ways among the particles which are created, the breakup process has a statistical character. Hence, the fission fragments generated for use in the process models must be characterized by probability distributions.
Several transformations of functions are required to be able to use the data in functional forms that relate directly to the process models used. The basic task is to represent or express the measured fission fragment yield distributions (given in this case as a function of fragment energy) in terms of the numbers of fragments with particular path lengths. Instead of the association of a fragment with an energy, the association is with a path length; hence fragment yield is expressed as a “path length yield.” Only fragments with path lengths compatible with the location and orientation of fragment creation relative to the pipe geometry will remain in the gas. All others will be lost to the pipe wall.
The transformations were made using a combination of linear interpolation of data and functional forms fitted to some of the data. All these calculations were done using Microsoft Excel spreadsheets. A brief description of each step in the process of obtaining the desired functional form is given below.
Step 1.
Express heavy (light) fragment yield as a functiorof fraEment path length. There is not much data available to do this; only three candidates were found: ‘32Xe, 133Cs, and I4’Ce.
Xe was chosen to represent the proto-typical heavy fragment for the sequence of 132

"
calculations. The limited data available suggests this choice is reasonable since heavy fragment ranges for a given energy do not vary by more than a few percent across the range of fragment energies for fragments giving the largest yields. Two tables of data were constructed: (a) fragment path length in UFg as a function of energy and (b) fragment yield as a function of energy. Interpolation permits eliminating the energy dependence, leaving a table of numbers giving fragment yield as a function of heavy fragment path length. The graph of this new functional relationship has a Gaussian shape so a function of the form shown in Eq. (7) was used to represent it.
where N is a normalizing factor, R the fragment path length, Ro the fragment path length at the mid-point of the distribution, and CY the width of the Gaussian at half height.
Four isotopes are possible candidates to represent light fragments: "Rb, "Sr, 98M0, and lo2Ru. %r was used to represent light fragments and a Gaussian shape used to fit the table of numbers of yield as a function of path length. The complete expression used in the model is
where N , = 1 I (2 0) f i ) , Nh = 1 / (20h 6) , GI and
Gaussian distributions for light and heavy fragments, respectively; RI and Rh the fragment path lengths at the midpoint of the Gaussians for light and heavy fragments, respectively. Table 1 summarizes the parameter values obtained from two independent calculations (to provide verification of the accuracy when different sources of data were used). Parameter values are expressed in terms that allow for adjustments in the final value of the gas pressure.
the full-width at half maximum for each of the
Table 1. Comparison of results obtained from two independent analyses.
Calculation RI (mm) 01 (-) R h (mm) o h (mm) Original 4291 I p (mmHg) 155 I p (mmHg) 3154 I p (mmHg) 248 I p (mmHg)
Verification Review 4174 I p (mmHg) 183 I p (mmHg) 3145 I p (mmHg) 236 I p (mmHg)
Data for fission fragment yields as a function of light and heavy fragment energies for 233U (instead of 235U) were used to generate tables for yields as functions of fragment range. The data for yield as a function of fragment energy could not be found for 235U. The general shapes of the yield distributions for these two isotopes are very similar except for the peak yields where the distribution is peaked more toward symmetric fission than for 233U. Fitting the data with a Gaussian distribution, however, washes out these differences in details.
235u

"
Step 2.
Calculate fragment losses due to absorption bv the Pipe wall. Equation (8) gives a prescription for specifying the number of fission fragments created at each radial position (radial computational node) in a pipe, having a particular path length and path orientation. The next step is to calculate which path lengths keep a fragment in the pipe and which ones send a fragment into the wall. This is a purely geometrical problem which was solved originally using modules from a Monte-Carlo program [6 ] . The results from that calculation were then fitted to an analytic expression which gives the fraction of fission fragments that are absorbed by the pipe wall.
Step 3.
Account for the fraction of fragments that remain in the gas flow E< and contribute to the delayed gammas meastfred bv the detectors by modifying (with a factor) values from the absorption calculation expression. This factor and the absorption expression are then used (in a series of spreadsheet calculations) to give the radial distribution of fission fragments that remain in the UF6 gas. Calculation of the factor uses the fission fragment yield as a function of path length. Two corrections are made to the path length: (a) a decrease of 15% due to multiple scattering and nuclear scattering which contribute along the entire slowing down trajectory and (b) a correction for range straggling, differences in total path length for identical fragments with the same initial energy. The distribution in total path length due to range straggling can be characterized by a Gaussian distribution.
Reference books and published papers give different values for the range straggling corrections. For fission fragments the range is 7-12 96 [2,4]. Detailed theoretical calculations [7] done first in the 1970s support the low end of the range value for range straggling correction, Le., a G 0.07R.
The range straggling correction should be made using a Gaussian distribution
with an appropriate width (standard deviation) a. This correction should be added to the corrected (for multiple scattering) path length, Pc(R ' ) = 0.15Pr(R') , where

An acceptable alternative [3] is to replace 01 and Oh in Eq. (1 1) by
(12) 7 7 C T , . ~ ~ =o,’ +a2 and B ~ , ~ ~ =oh- +a-
where a is the width of the range straggling Gaussian in Eq. (10). Figure 1 shows the results of adding the multiple scattering and straggling corrections to the nominal fragment range probability distribution for light and heavy fragments. The source “effectiveness” is reduced by nearly two- thirds. By comparison for UF6 gas at 1.1 psi flowing in a pipe with 8” OD, the source effectiveness is reduced by only one-third.
0.07
0.06
>
Q m P
.- 0.05
0.04 Q)
c m
S 0
m
5 0.03 E E 0.02 LL
0.01
0
--I 15% Avg range reduction, 7% straggling
Eff. Source = 28%
Eff. Source = 36%
0 20 40 60 80 100 120
Range (mm)
Figure 1. Probability distribution function (per mm.) for fission fragment range in uranium hexafluoride at 0.87 psi in a 4“ OD pipe.
An initial exponential growth correlation used to fit the calculated “effectiveness” as a function of the product of gas pressure and pipe OD was chosen to cover a much wider range of these parameters than will be necessary for normal operation. That correlation did not fit the calculated values well in the range in which most of the operation &-the equipment is now expected to occur. Several alternate functional forms were tried before finding a sigmoid form
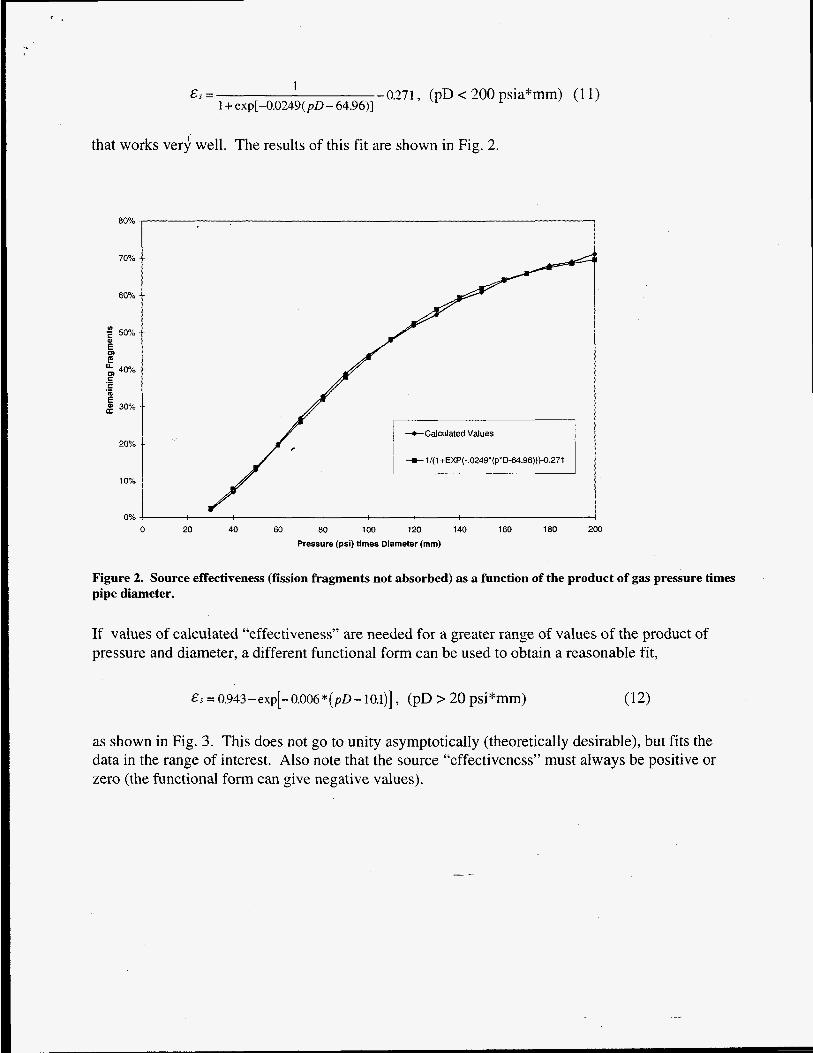
E , = 1 1 + exp[-0.0249(pD - 64.9611
-0.271 , (pD e 200 psia*mm) ( I 1)
that works ver; well. The results of this fit are shown in Fig. 2.
80%
+Calculated Values
t 1/( 1 +EXP(-.0249’(p’O-64.96)))-0.271
0 20 40 60 80 100 120 140 160 180 200
Pressure (psi) times Diameter (mm)
Figure 2. Source effectiveness (fission fragments not absorbed) as a function of the product of gas pressure times pipe diameter.
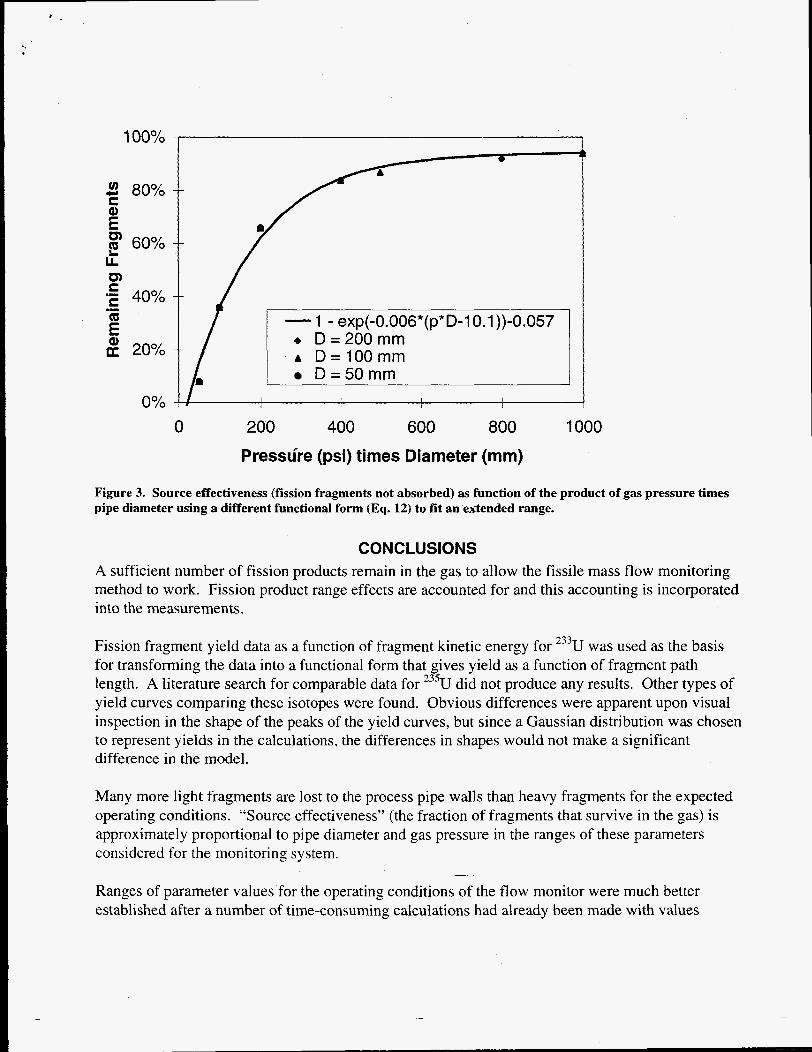
If values of calculated “effectiveness” are needed for a greater range of values of the product of pressure and diameter, a different functional form can be used to obtain a reasonable fit,
E.$ = 0.943 - exp[- 0.006 * ( p~ - 10.1)] , (pD > 20 psi*mm)
as shown in Fig. 3. This does not go to unity asymptotically (theoretically desirable), but fits the data in the range of interest. Also note that the source “effectiveness” must always be positive or zero (the functional form can give negative values).
3 80% S
ii 60%
4 P) S .- S 40% -- .I
E 8 20% --
D=50mm I I I
I
- 1 - exp(-0.006*(p*D-10.1))-0.057 + D=200mm A D=100mm
0 200 400 600 800 1000
Pressure (psi) times Diameter (mm)
Figure 3. Source effectiveness (fission fragments not absorbed) as function of the product of gas pressure times pipe diameter using a different functional form (Eq. 12) to fit an extended range.
CONCLUSIONS A sufficient number of fission products remain in the gas to allow the fissile mass flow monitoring method to work. Fission product range effects are accounted for and this accounting is incorporated into the measurements.
Fission fragment yield data as a function of fragment kinetic energy for 233U was used as the basis for transforming the data into a functional form that gives yield as a function of fragment path length. A literature search for comparable data for 235U did not produce any results. Other types of yield curves comparing these isotopes were found. Obvious differences were apparent upon visual inspection in the shape of the peaks of the yield curves, but since a Gaussian distribution was chosen to represent yields in the calculations, the differences in shapes would not make a significant difference in the model.
Many more light fragments are lost to the process pipe walls than heavy fragments for the expected operating conditions. “Source effectiveness” (the fraction of fragments that survive in the gas) is approximately proportional to pipe diameter and gas pressure in the ranges of these parameters considered for the monitoring system.
Ranges of parameter values for the operating conditions of the flow monitor were much better established after a number of time-consuming calculations had already been made with values
--
based on assumed operating conditions. Monte-Carlo calculations used in the early stages of development to characterize source and detector geometries covered large ranges of parameter values. Curves used to fit data and results of these calculations do not fit as well in some ranges of parameter values as others, so they were re-evaluated. The “source effectiveness” (see Figs. 2 and 3) function was one case where improvement from choosing a different functional form could (and did) make a significant difference.
L. C. Northcliffe and R. F. Schilling, “Range and Stopping-Power Tables for Heavy Ions,” Nuclear Data Tables, 7 ,
R. DeWitt, “Uranium Hexafluoride: A Survey of the Physico-Chemical Properties,” GAT-280, Goodyear Atomic Numbers 3-4 (Section A), Academic Press, January 1970, p.233ff.
Corporation, Portsmouth, OH, August 12, 1960. 2
R.D. Evans. The Atomic Nucleus. McGraw-Hill. 1955. P.646ff.
James B. Niday, “Radiochemical Study of the Ranges in Metallic Uranium of the Fragments from Thermal Neutron Fission,”Phys. Rev. Vol 121, No.5, 1961. 4
E. Segre (Ed.). Experimental Nuclear Physics, Vol. I. John Wiley and Sons, New York. 1953. 5
Judith F. Briesmeister (Ed.), “MCNPTM-A General Monte Carlo N-Particle Transport Code, Version 4A”, LA-12625- M, November 1993. r
D. Allan Bromley (Ed.). Treatise on Heavy-Ion Science, Vol. 6: Astrophysics, Chemistry, and Condensed Matter. 7
Plenum Press, New York, (1985). Review article by James F. Ziegler and Jochen P. Biersack, “The Stopping and Range of Ions in Matter,” pp. 95- 129.
DISCLAIMER
This report was prepared as an account of work sponsored by an agency of the United States Government. Neither the United Statcs Government nor any agency thermf, nor any of their employees, makcs any warranty, express or implid, or assumes any legal liability or responsi- bility for the accuracy, completeness, or usefulness of any information, apparatus, product. or process disclosed, or represents that its use would not infringe privately owned rights. Refer- ence herein to any specific commercial product, proccss, or service by trade name, trademark, manufacturer, or otherwise docs not ncccssarily constitute or imply its endorsement. recom- mendation, or favoring by the United Statcs Government or any agency thereof. The views and opinions of authors expressed herein do not necessarily state or reflect t h e of the United States Government or any agency thereof.
-4
Fission Product Range Effects
John K. Munro, Jr.
John K. Munro, Jr., T.E. Valentine, R.B. Perez, J.K. Mattingly,
J-March-Leuba, and J.T. Mihalczo
Oak Ridge National Laboratory INMM 38, July 22. 1997 OBMl
.....
John K. M T.E. Ualentine,
R.B. Perez, J.K. Mattingly,
J.March-leuba, J.T. Mihalczo
OAK RIDGE NATIONAL LABORATORY
7
-r Fission Product Range Effects
John K. Munro, Jr.
FISSION RANGE
ON HEU MONITORING
r
PRODUCT EFFECTS FISSILE MASS FOR UF6 GAS
2
Fission Product Range Effects
INTRODUCTION
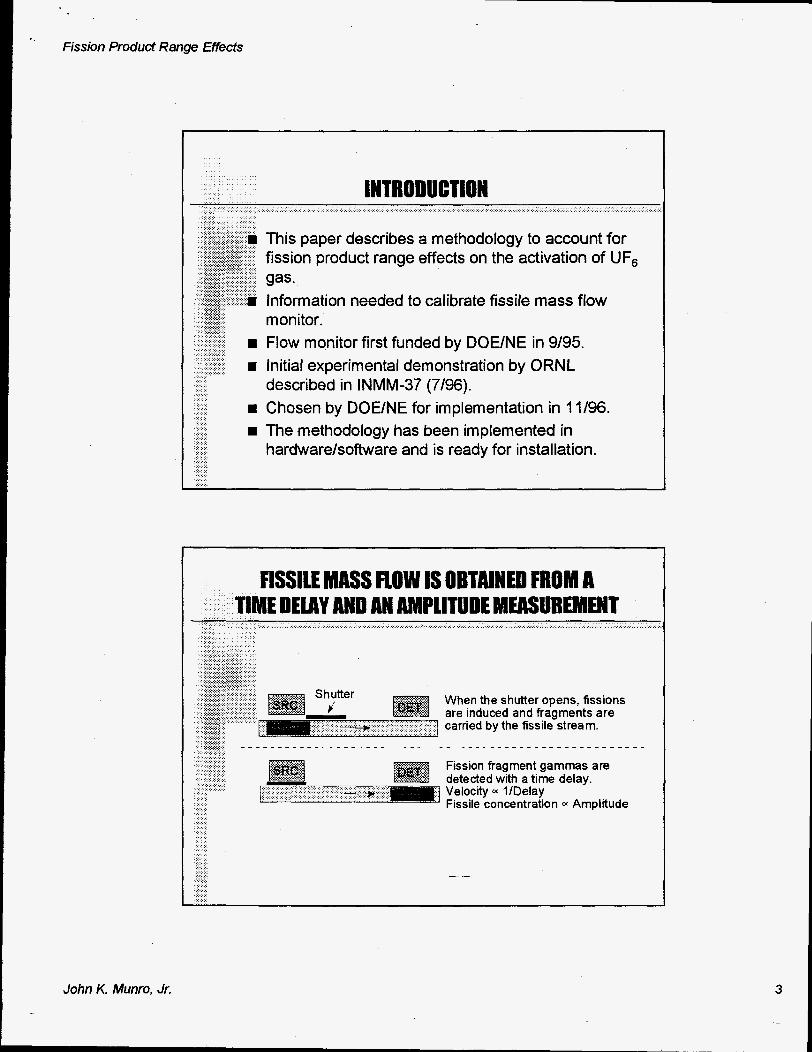
This paper describes a methodology to account for fission product range effects on the activation of UF, gas. Information needed to calibrate fissile mass flow monitor.’
w Flow monitor first funded by DOE/NE in 9/95. w Initial experimental demonstration by ORNL
w Chosen by DOE/NE for implementation in 11/96. described in INMM-37 (7/96).
... .... .... . . .. .. ..... ..... ,.... .. .. ... ..:. . ....... .. . . .:: .... ..... ..... . .. .... ..... ..... ..... ..... .. .. ..... ..... ... ..... ..... .....
.. . . ..
.. . .. . ... . . ..._ ..... .... .... . .. . .:: .
w The methodology has been implemented in hardware/software and is ready for installation.
....
When the shutter opens, fissions are induced and fragments are carried by the fissile stream.
. . . . . . . . .
Fission fragment gammas are detected with a time delay. Veloctty I/Delay Fissile concentration D: Amplitude
John K. Munro, Jr.

. ’ Fission Product Range Effecfs
I Gas Row Was Simulated by Moving a 235U Fission Chamber Between Source & Det
c
Fissile Mass Flow Monitoring System
I
John K. Munro, Jr. 4
., Fission Product Range Effects
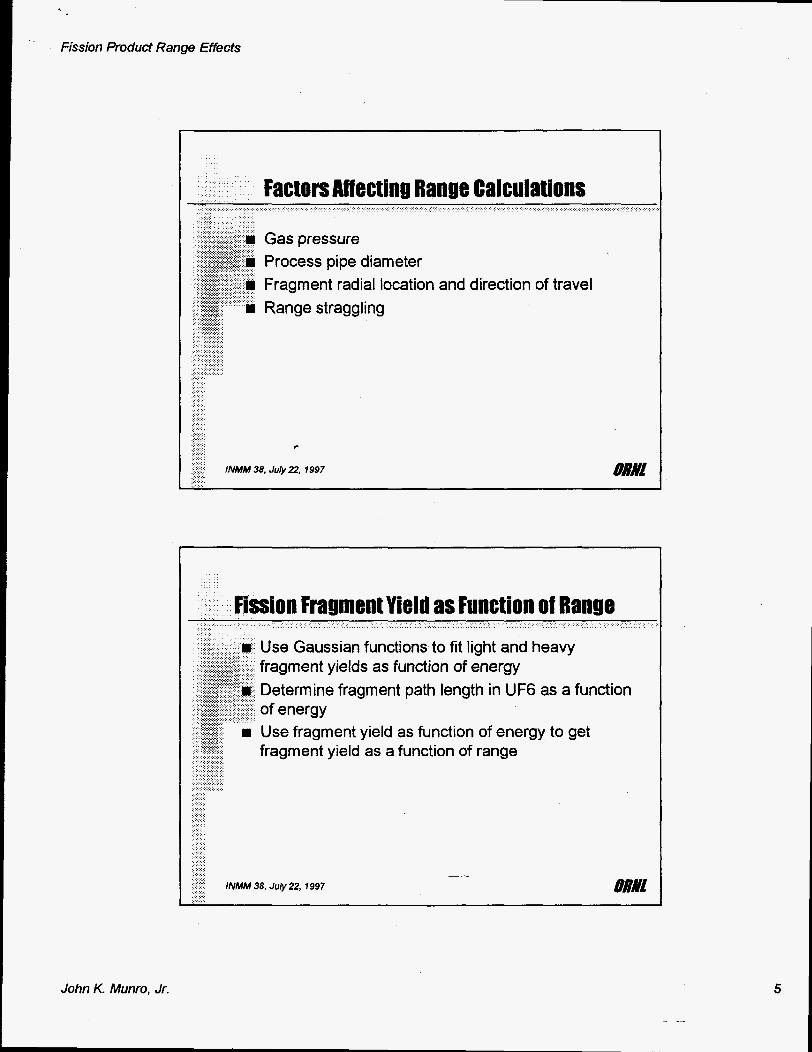
Factors Aff ecting Range Calculations
Gas pressure Process pipe diameter Fragment radial location and direction of travel Range straggling
z-
INMM 38, July 22, 1997 . ...
@!Ml
Fission Fragment Yield as Function of Range Use Gaussian functions to fit light and heavy fragment yields as function of energy Determine fragment path length in UF6 as a function of energy Use fragment yield as function of energy to get fragment yield as a function of range
INMM 38, Ju/y 22, 1997 ORMl
John K. Munro, Jr.

Fission Product Range Effects
Fission Fragment Distribution in Ui, is a Function of Gas Pressure
. .
The fragment ranges of pressure (mmHg)
P
4174 P
P
R, = -
u, = - I a3
( R - RhP
+ - 1 e 0:
2 u h 6
(mm) are function
31 45 P
Rh = -
236 U h = -
P
0 30% = J p 25%
UJ
Q)
.- L * ii 2.0w
2
L P
1.5%
* 1.00% c Q)
E 0.5%
IL 0 0%
The Range of Fission Fragments in UF, is Inversely Pronortional to Pressure
-1 psi - 0.5 psi -0.2 si
0 50 100 150 200 250 300 350 400 450 500 Range (mm) --
John K. Munro, Jr.

1, fission Product Range Effects
Fragment Absorntion by Pine Wall is a Function of Fragment Path length &Geometry
- 100% 200% A(R, 0) = 1.116
1 + ex*[-*.,,( ;) ]
R = fragment path length D = pipe wall diameter
Correlation based on a series of Monte Carlo
Simulations with different pipe diameters f
When Fragment Range *Pipe Diameter, Fragment Distribution in Homogeneous
100%
-0.5 -0.3 0.0 0.3 0.5 Normalized Radius (55-= pipe wall)
John K. Munro, Jr. 7
- * Fission Product Range Effects
9%
Q, 5% 0 C a 4%
OL
0%
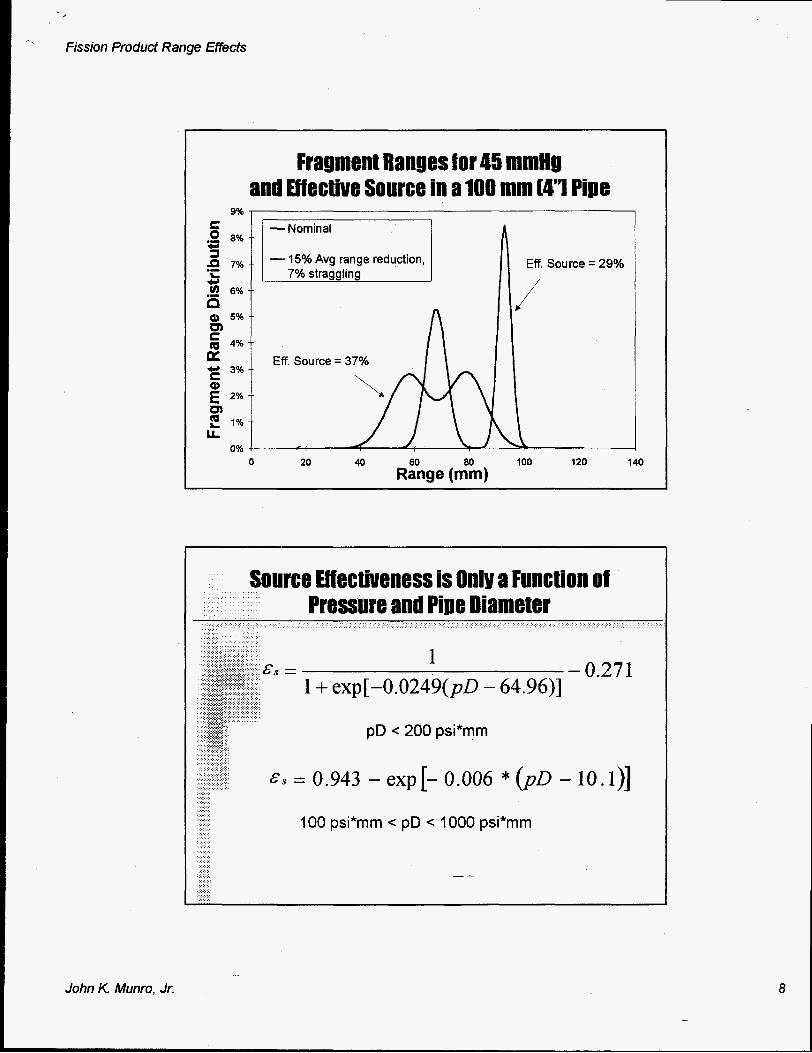
Fragment Ranges for 45 mmH# and Effective Source in a 100 mm (4'1 Pipe
- 15% Avg range reduction, Eff. Source = 29%
Eff. Source = 37%
- - L 7% straggling LII. """lur - L" I"
iv 0 20 40 60 80 I00 120 140
Range (mm)
Source Effectiveness is Only a Function of
1 I €3 = - 0.271
1 + exp[-O.O249(pD - 64.96)]
pD c 200 psi*mm
E S = 0.943 - exp [- 0.006 * (pD - 10. l)]
100 psi*mm c pD < 1000 psi*mm
_ -
John K. Munro, Jr.

80%
70%
2 60% al Fn 50% E u. a, 40% E .E 30% .- f 2 20%
10%
0%
Source Eff ectiueness Correlation for 235U Fission Fragments in UF,
ID 200 psi*mm
Calculated Values
0 Typical Operating Point - 1/(1+EXP(-.0249*(p*D-64.96)))-0.271
I
0 50 100 150 200
Pressure (psi) times Diameter (mm) c
Source Effectiveness Correlation for Extended Pressure Range
oo% 100 psi’mm c pD < 1000 p i*m
2 80% --
E 8 60% -- u.
. D=200mm A D=lOOmm
0 200 400 600 800 1000 Pressure (psi) times Diameter (mm)
John K. Munro, Jr.

Fission Product Range Effects
Conclusions
A correlation for source effectiveness due to fission fragment range has been developed Source effectiveness (fraction of fragments that remain in the gas) is proportional only to pipe diameter and gas pressure
w A sufficient number of fission products remain in the gas to allow for this method of fissile mass flow monitoring to work and these effects are included in the measurements
r
lNMM 38, July 22,1997 URNI . .
John K. Munro, Jr,