Embed Size (px)
Citation preview

Fission Product Transport Models and Experimental Results
Paul HumrickhouseStaff Scientist
Gas-Cooled Reactor Program Review MeetingMay 8, 2018, at Idaho National Laboratory
Outline
• AGR-3/4 experiment and objectives• Description of AGR-3/4 modeling approach and inputs
Source term (release from particles)
Temperature profiles
Diffusion through concentric rings
Adsorption across gaps between rings
• Pre-test predictions• Simplified analytical methods for obtaining diffusion coefficients from measured
data• Reconstruction of fission product distributions from gamma tomography data
2
The AGR-3/4 Experiment
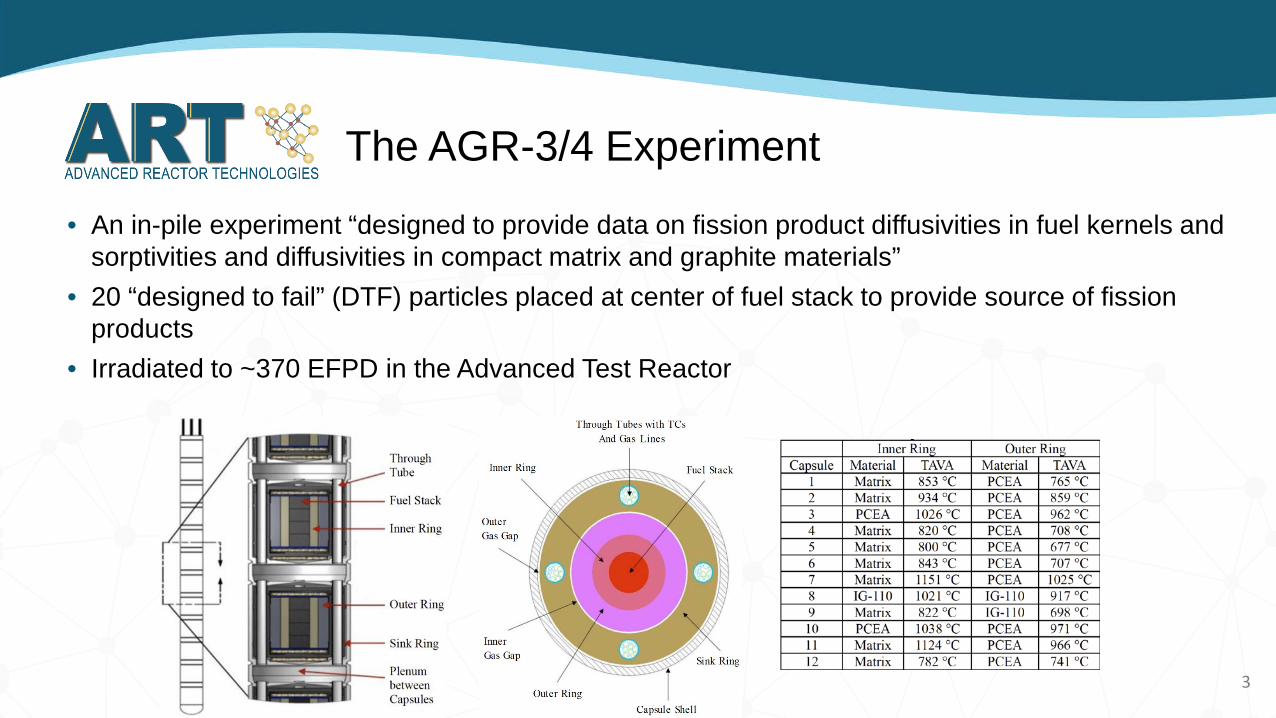
• An in-pile experiment “designed to provide data on fission product diffusivities in fuel kernels and sorptivities and diffusivities in compact matrix and graphite materials”
• 20 “designed to fail” (DTF) particles placed at center of fuel stack to provide source of fission products
• Irradiated to ~370 EFPD in the Advanced Test Reactor
3
Modeling approach and objectives
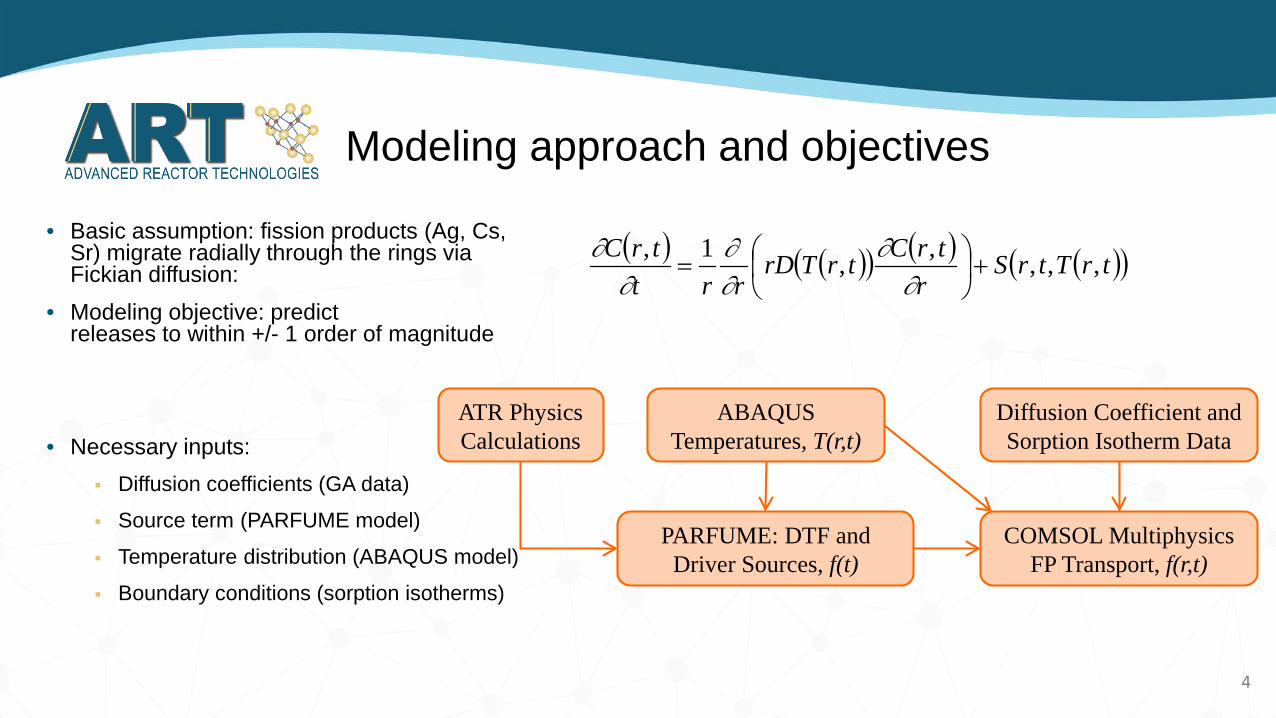
• Basic assumption: fission products (Ag, Cs, Sr) migrate radially through the rings via Fickian diffusion:
• Modeling objective: predict releases to within +/- 1 order of magnitude
• Necessary inputs: Diffusion coefficients (GA data)
Source term (PARFUME model)
Temperature distribution (ABAQUS model)
Boundary conditions (sorption isotherms)
( ) ( )( ) ( ) ( )( )trTtrSr
trCtrTrDrrt
trC ,,,,,1,+
=
∂∂
∂∂
∂∂
ABAQUSTemperatures, T(r,t)
PARFUME: DTF and Driver Sources, f(t)
COMSOL MultiphysicsFP Transport, f(r,t)
Diffusion Coefficient and Sorption Isotherm Data
ATR Physics Calculations
4
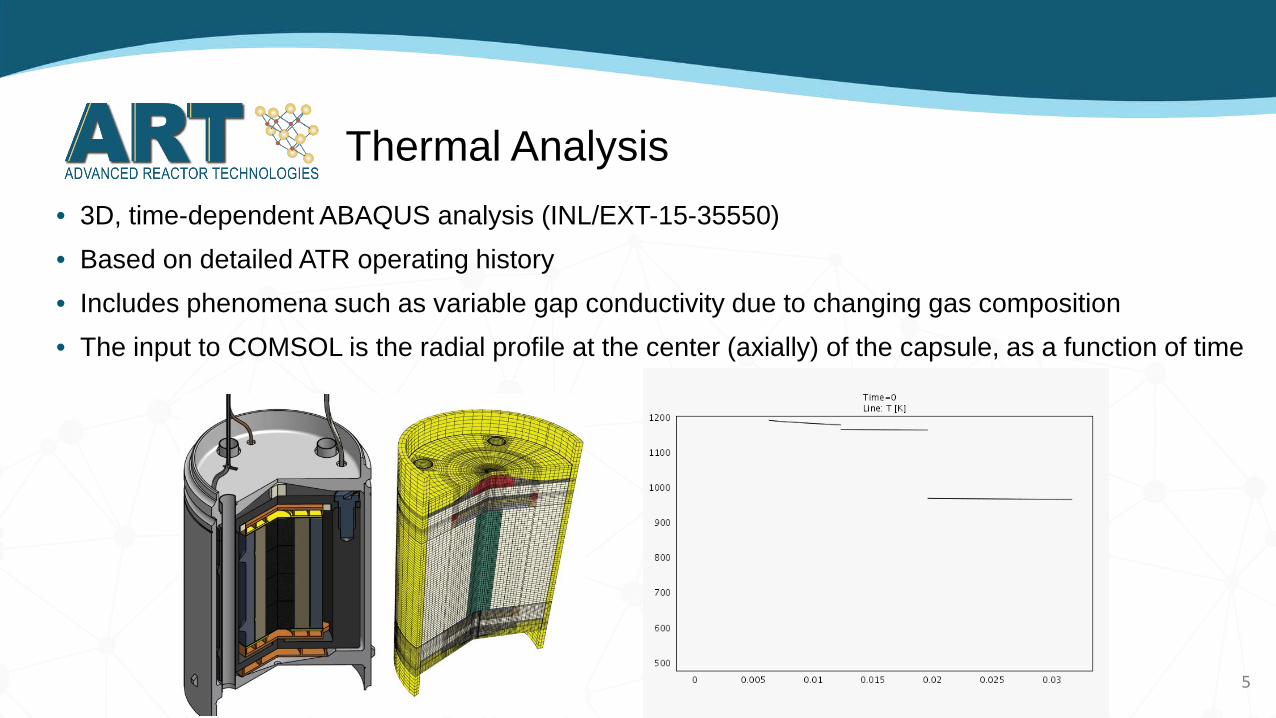
Thermal Analysis• 3D, time-dependent ABAQUS analysis (INL/EXT-15-35550)• Based on detailed ATR operating history• Includes phenomena such as variable gap conductivity due to changing gas composition• The input to COMSOL is the radial profile at the center (axially) of the capsule, as a function of time
5
PARFUME Source Term
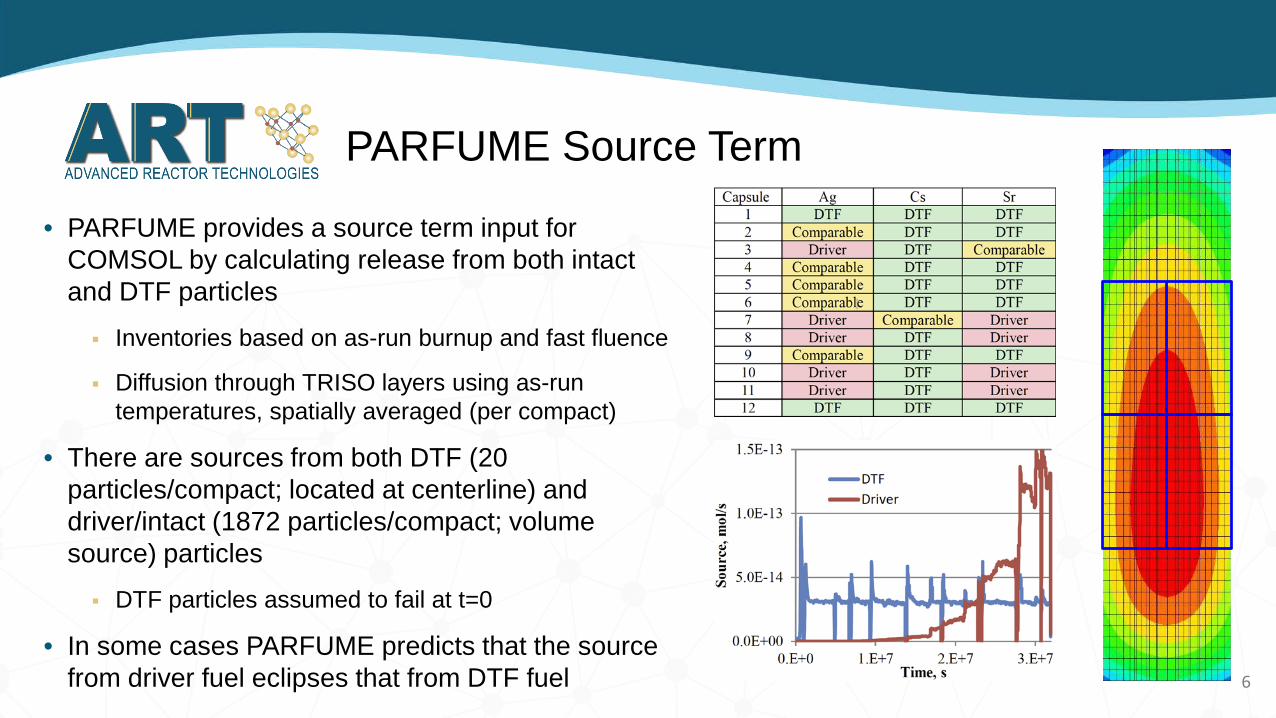
• PARFUME provides a source term input for COMSOL by calculating release from both intact and DTF particles
Inventories based on as-run burnup and fast fluence
Diffusion through TRISO layers using as-run temperatures, spatially averaged (per compact)
• There are sources from both DTF (20 particles/compact; located at centerline) and driver/intact (1872 particles/compact; volume source) particles
DTF particles assumed to fail at t=0
• In some cases PARFUME predicts that the source from driver fuel eclipses that from DTF fuel 6
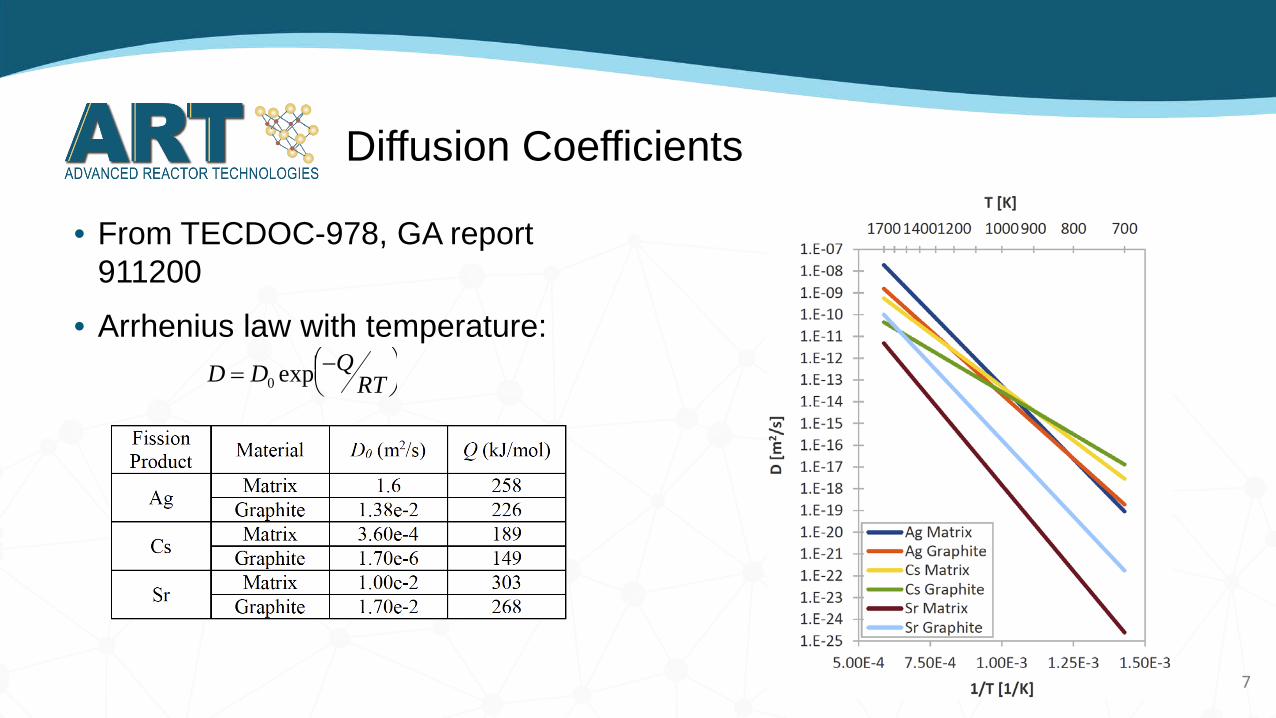
Diffusion Coefficients
• From TECDOC-978, GA report 911200
• Arrhenius law with temperature:
D = D0 exp −QRT
7
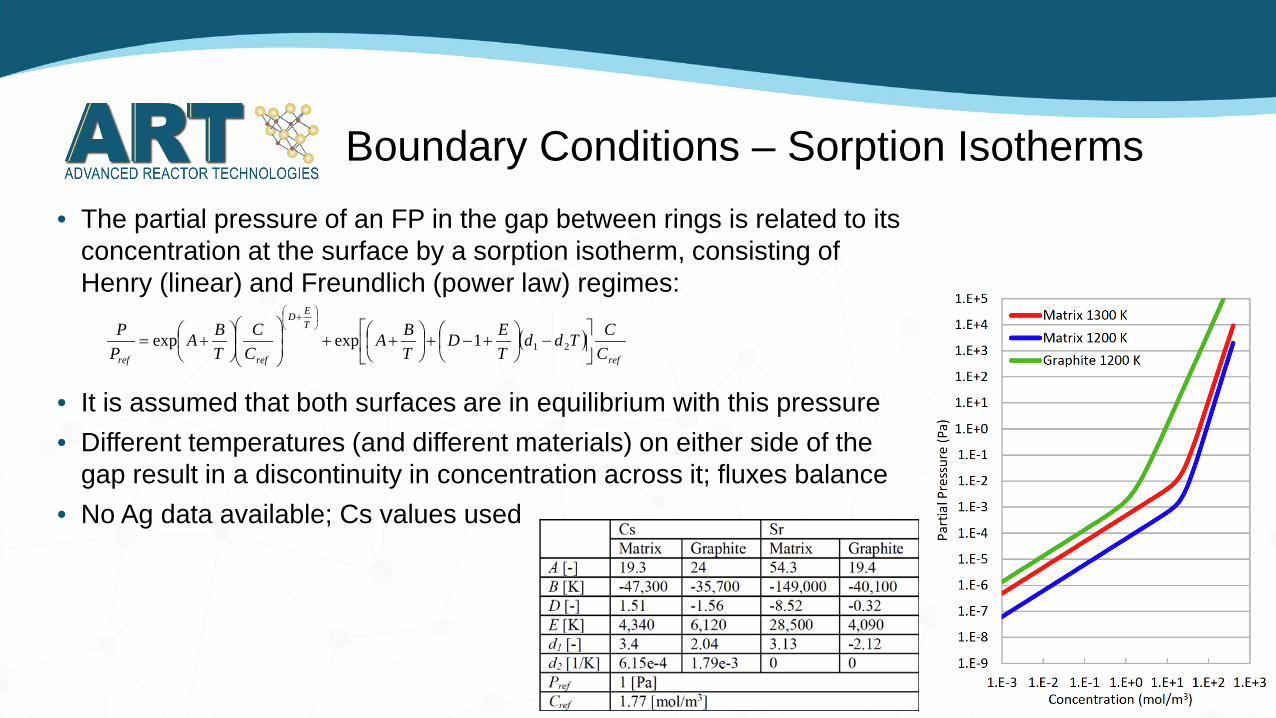
Boundary Conditions – Sorption Isotherms• The partial pressure of an FP in the gap between rings is related to its
concentration at the surface by a sorption isotherm, consisting of Henry (linear) and Freundlich (power law) regimes:
• It is assumed that both surfaces are in equilibrium with this pressure• Different temperatures (and different materials) on either side of the
gap result in a discontinuity in concentration across it; fluxes balance• No Ag data available; Cs values used
( )ref
TED
refref CCTdd
TED
TBA
CC
TBA
PP
−
+−+
++
+=
+
211expexp
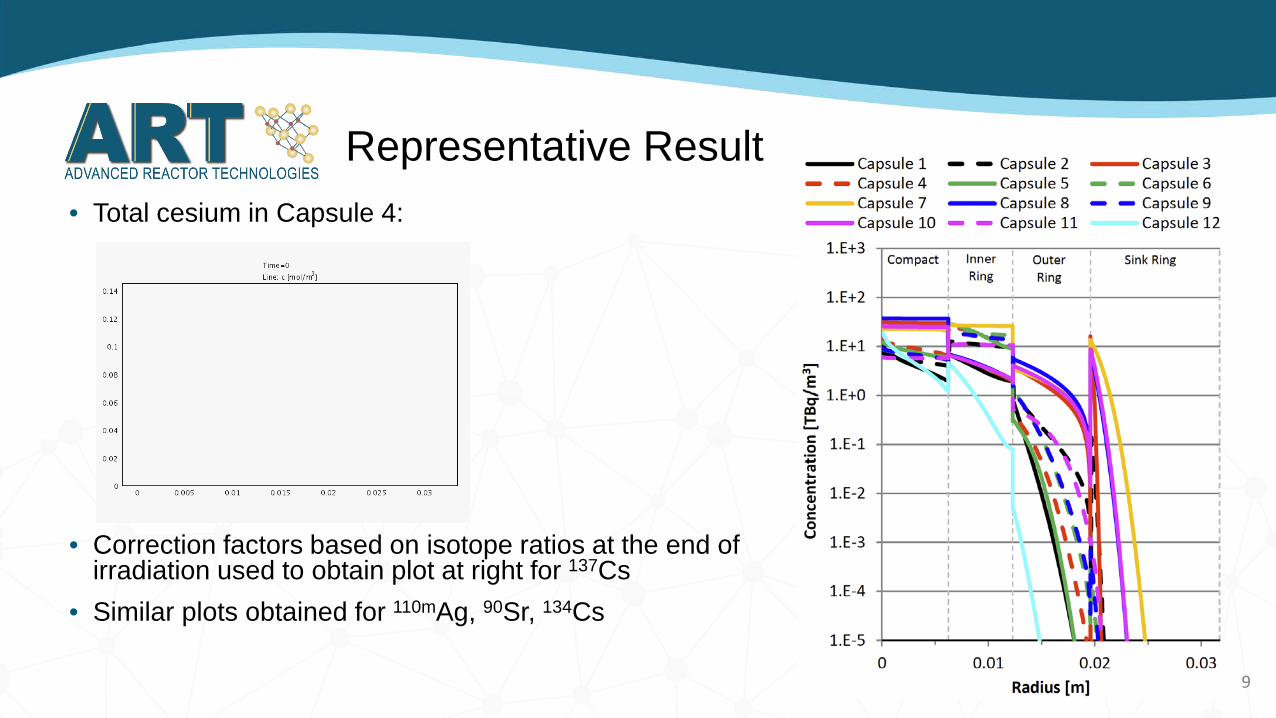
Representative Result• Total cesium in Capsule 4:
• Correction factors based on isotope ratios at the end of irradiation used to obtain plot at right for 137Cs
• Similar plots obtained for 110mAg, 90Sr, 134Cs
9
Estimating Diffusion Coefficients Based on Data
• Thus far we have been discussing a modeling process that takes known diffusion coefficients and predicts concentration profiles
• In the end we want to do the opposite: use measured concentration profiles to predict diffusion coefficients
• This will be hard to do directly with the models- there are at least 26 parameters that need to be determined across multiple computer codes
• To make more direct use of the experiment data, a simplified analytical description of a ring has been developed
10
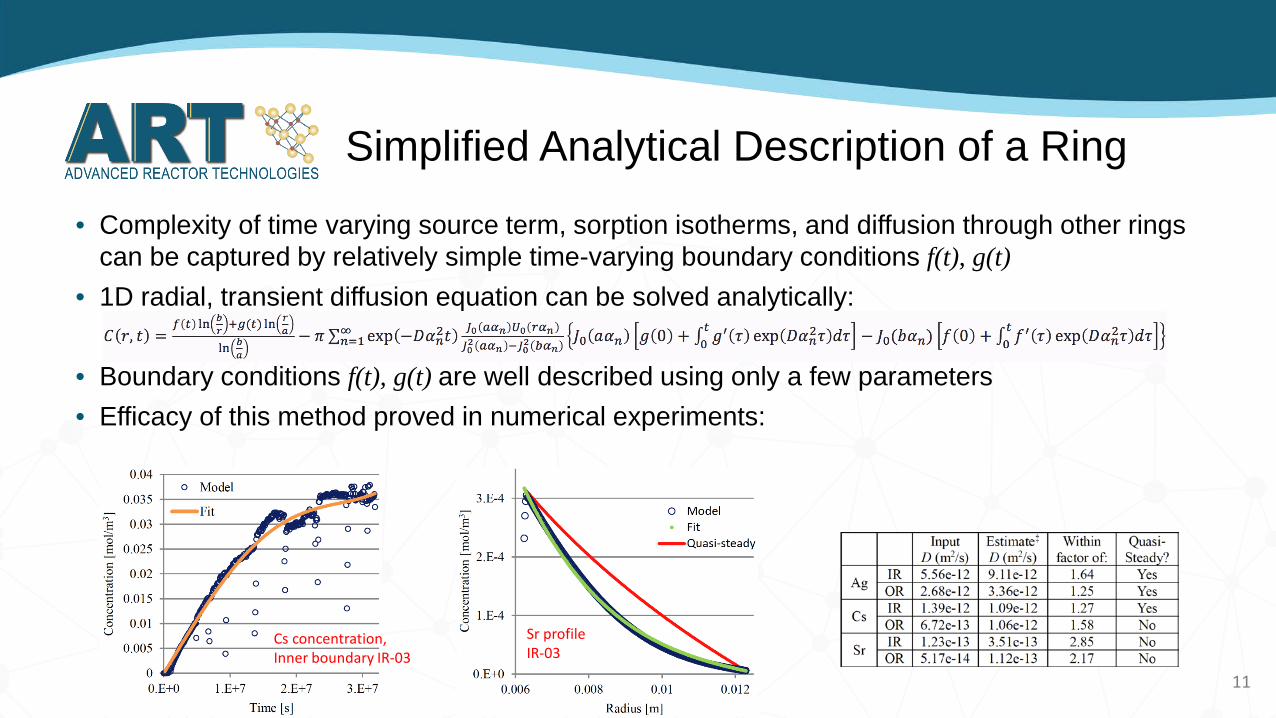
Simplified Analytical Description of a Ring
• Complexity of time varying source term, sorption isotherms, and diffusion through other rings can be captured by relatively simple time-varying boundary conditions f(t), g(t)
• 1D radial, transient diffusion equation can be solved analytically:
• Boundary conditions f(t), g(t) are well described using only a few parameters• Efficacy of this method proved in numerical experiments:
Cs concentration, Inner boundary IR-03
Sr profile IR-03
11
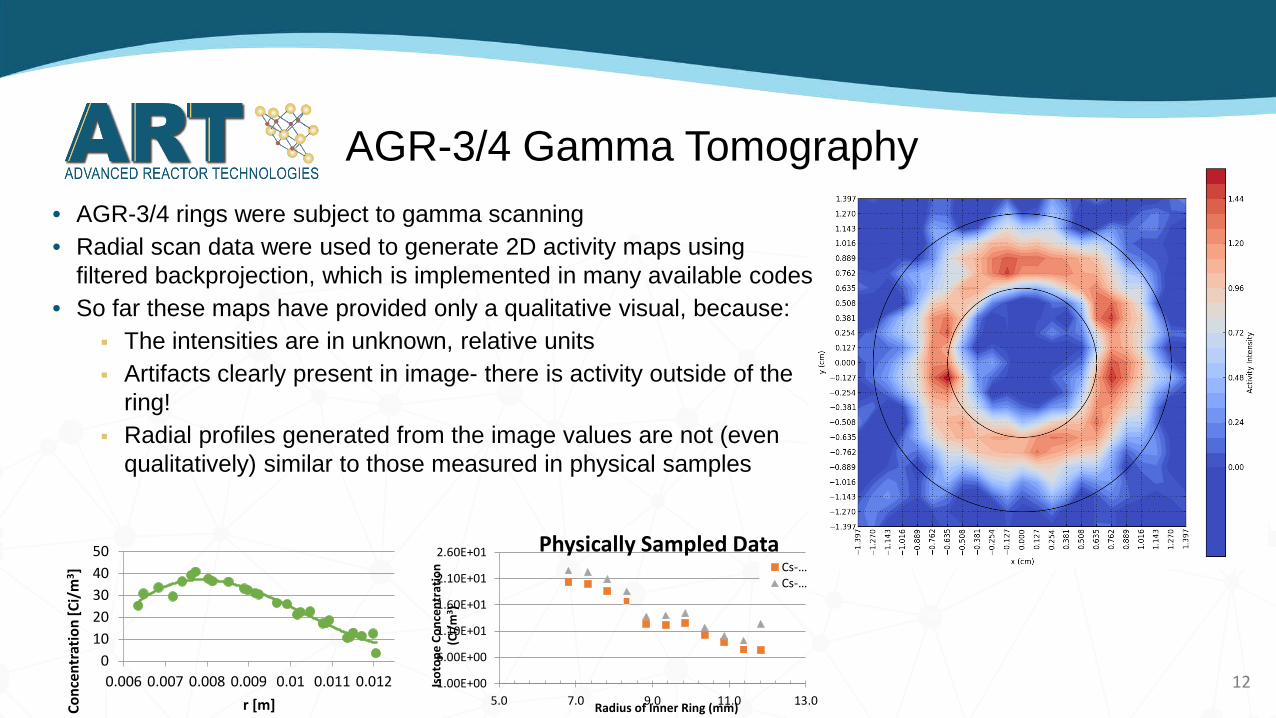
AGR-3/4 Gamma Tomography• AGR-3/4 rings were subject to gamma scanning• Radial scan data were used to generate 2D activity maps using
filtered backprojection, which is implemented in many available codes• So far these maps have provided only a qualitative visual, because:
The intensities are in unknown, relative units Artifacts clearly present in image- there is activity outside of the
ring! Radial profiles generated from the image values are not (even
qualitatively) similar to those measured in physical samples
1.00E+00
6.00E+00
1.10E+01
1.60E+01
2.10E+01
2.60E+01
5.0 7.0 9.0 11.0 13.0
Isot
ope
Conc
entr
atio
n (C
i/m
3 )
Radius of Inner Ring (mm)
Physically Sampled DataCs-…Cs-…
01020304050
0.006 0.007 0.008 0.009 0.01 0.011 0.012
Conc
entr
atio
n [C
i/m
3 ]
r [m]12
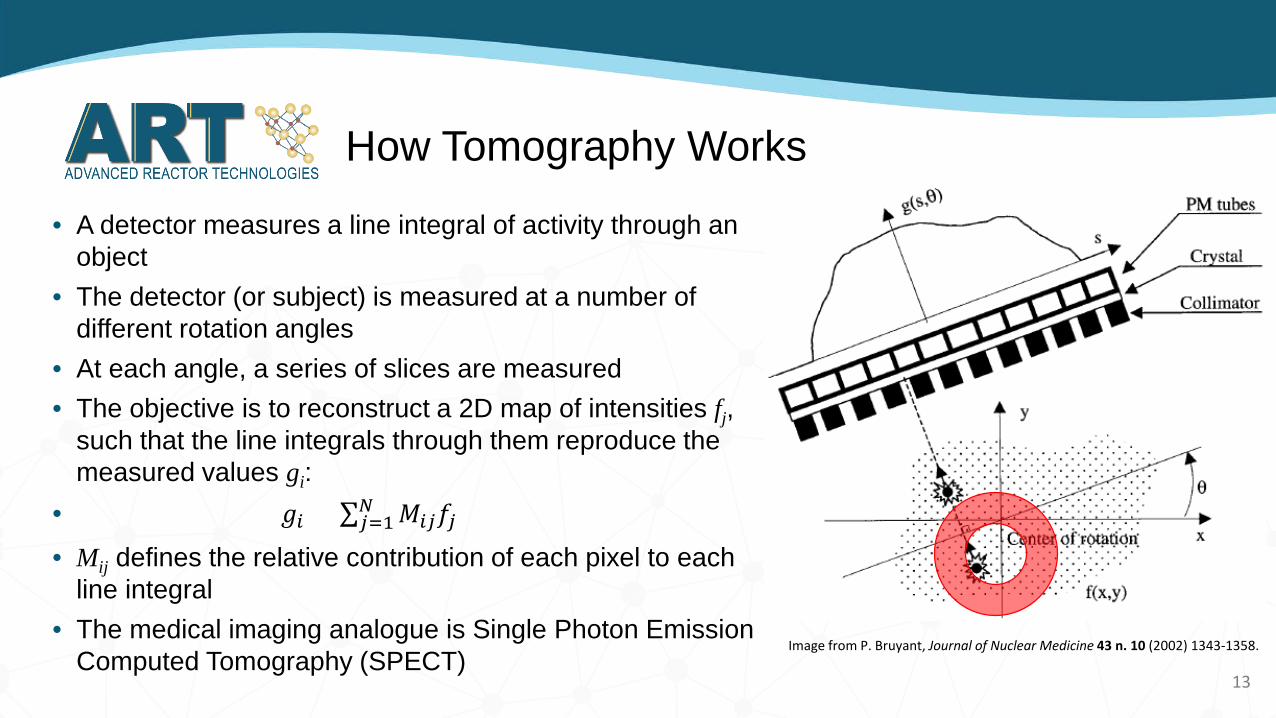
How Tomography Works
• A detector measures a line integral of activity through an object
• The detector (or subject) is measured at a number of different rotation angles
• At each angle, a series of slices are measured• The objective is to reconstruct a 2D map of intensities fj,
such that the line integrals through them reproduce the measured values gi:
• 𝑔𝑔𝑖𝑖 = ∑𝑗𝑗=1𝑁𝑁 𝑀𝑀𝑖𝑖𝑗𝑗𝑓𝑓𝑗𝑗• Mij defines the relative contribution of each pixel to each
line integral• The medical imaging analogue is Single Photon Emission
Computed Tomography (SPECT)Image from P. Bruyant, Journal of Nuclear Medicine 43 n. 10 (2002) 1343-1358.
13
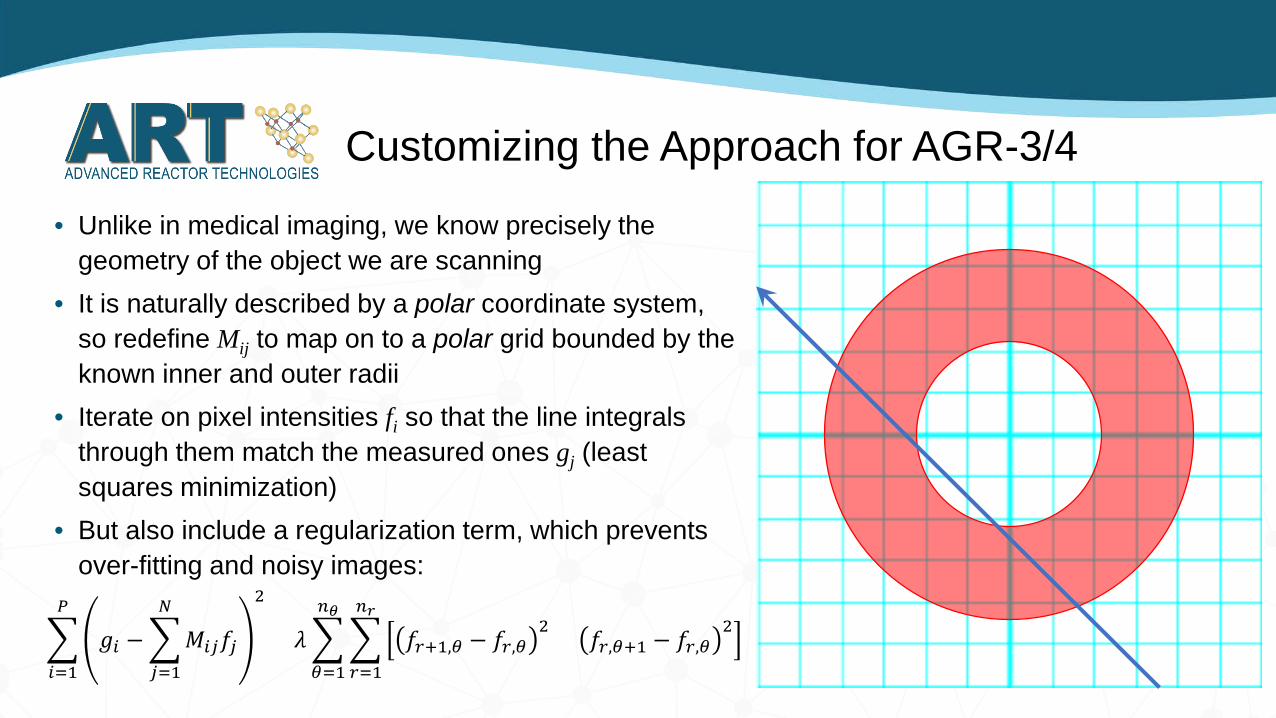
Customizing the Approach for AGR-3/4
• Unlike in medical imaging, we know precisely the geometry of the object we are scanning
• It is naturally described by a polar coordinate system, so redefine Mij to map on to a polar grid bounded by the known inner and outer radii
• Iterate on pixel intensities fi so that the line integrals through them match the measured ones gj (least squares minimization)
• But also include a regularization term, which prevents over-fitting and noisy images:
�𝑖𝑖=1
𝑃𝑃
𝑔𝑔𝑖𝑖 −�𝑗𝑗=1
𝑁𝑁
𝑀𝑀𝑖𝑖𝑗𝑗𝑓𝑓𝑗𝑗
2
+ 𝜆𝜆�𝜃𝜃=1
𝑛𝑛𝜃𝜃
�𝑟𝑟=1
𝑛𝑛𝑟𝑟
𝑓𝑓𝑟𝑟+1,𝜃𝜃 − 𝑓𝑓𝑟𝑟,𝜃𝜃2 + 𝑓𝑓𝑟𝑟,𝜃𝜃+1 − 𝑓𝑓𝑟𝑟,𝜃𝜃
2
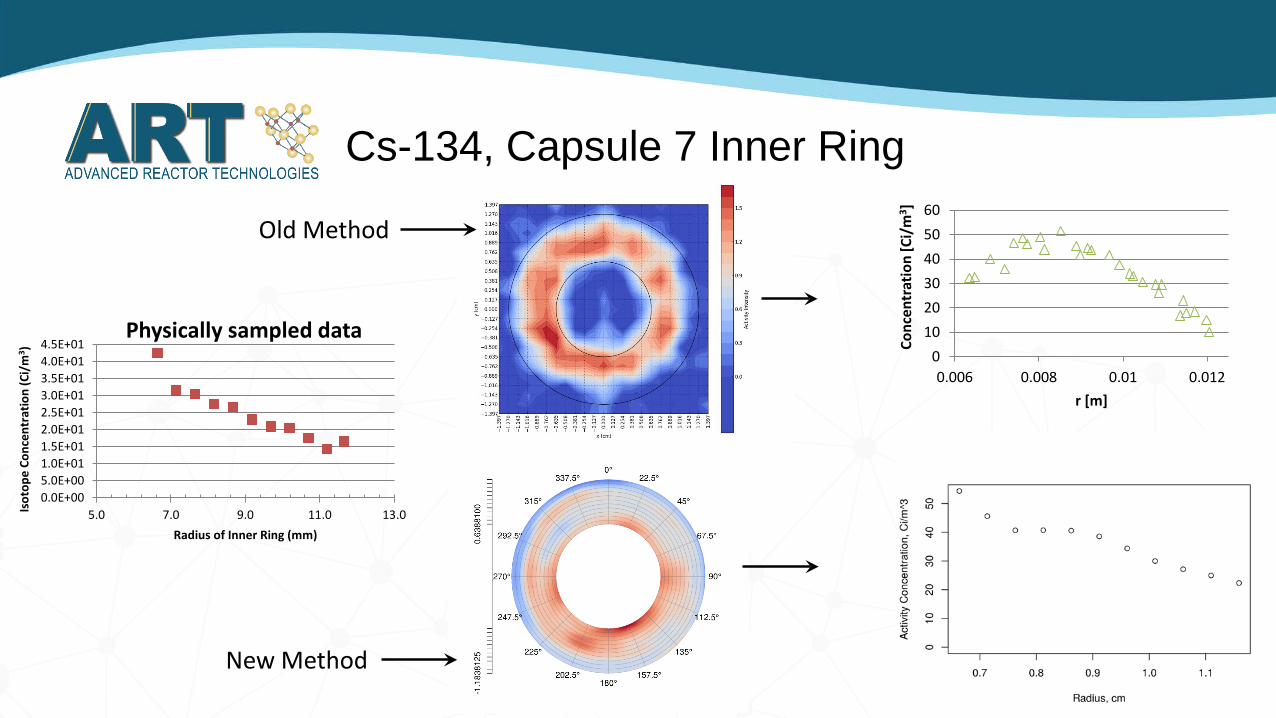
Cs-134, Capsule 7 Inner Ring
Old Method
New Method
0.0E+005.0E+001.0E+011.5E+012.0E+012.5E+013.0E+013.5E+014.0E+014.5E+01
5.0 7.0 9.0 11.0 13.0Isot
ope
Conc
entr
atio
n (C
i/m
3 )
Radius of Inner Ring (mm)
Physically sampled data0
102030405060
0.006 0.008 0.01 0.012
Conc
entr
atio
n [C
i/m
3 ]
r [m]
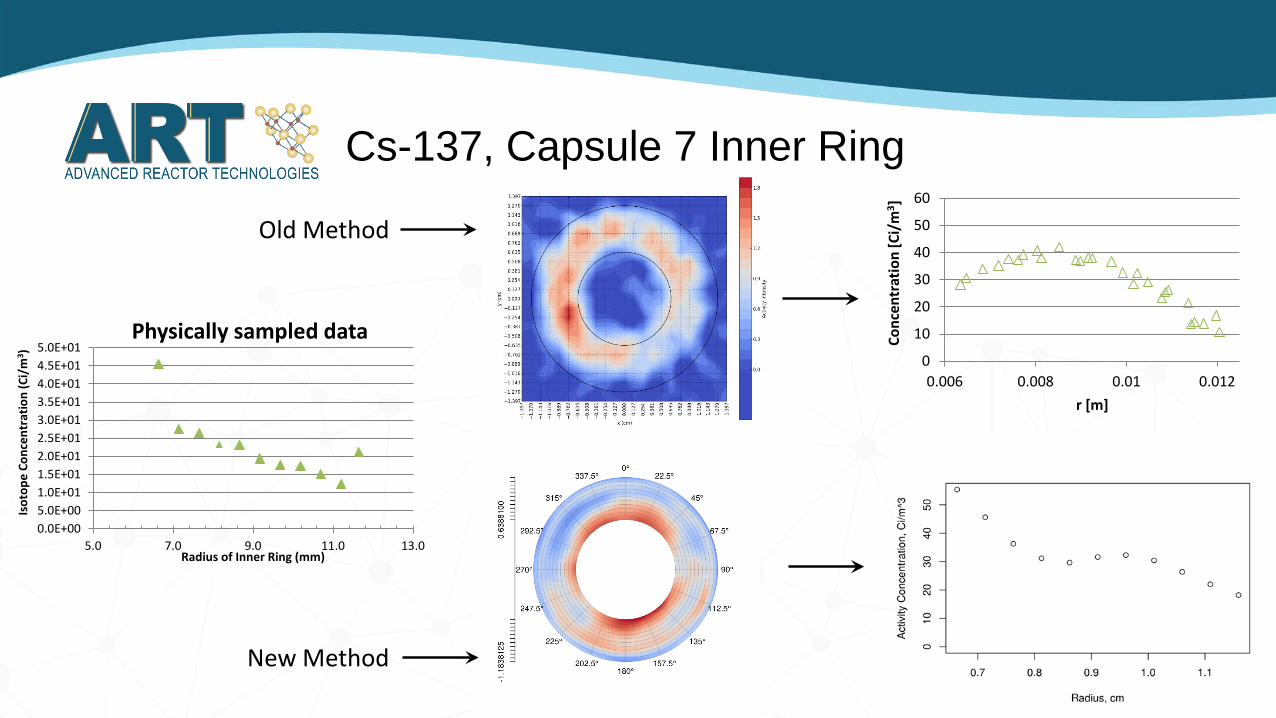
Cs-137, Capsule 7 Inner Ring
Old Method
New Method
0.0E+005.0E+001.0E+011.5E+012.0E+012.5E+013.0E+013.5E+014.0E+014.5E+015.0E+01
5.0 7.0 9.0 11.0 13.0
Isot
ope
Conc
entr
atio
n (C
i/m
3 )
Radius of Inner Ring (mm)
Physically sampled data0
10
20
30
40
50
60
0.006 0.008 0.01 0.012
Conc
entr
atio
n [C
i/m
3 ]
r [m]
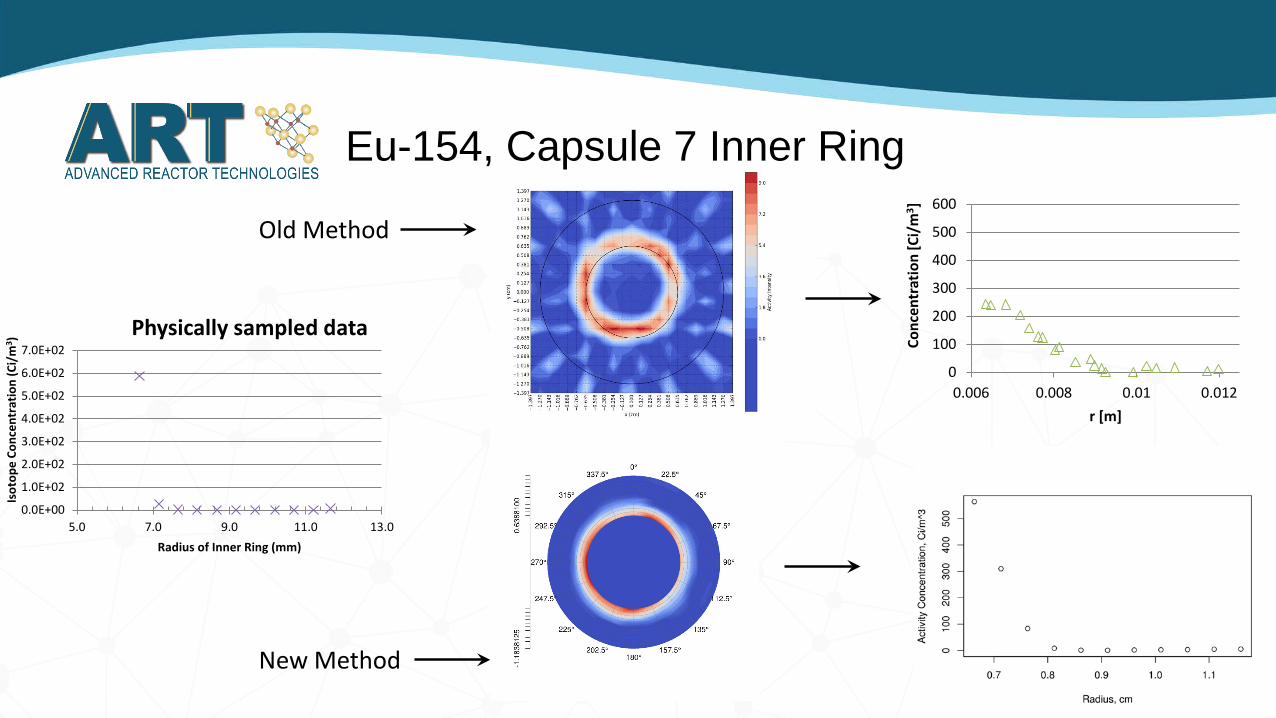
Eu-154, Capsule 7 Inner Ring
Old Method
New Method
0.0E+00
1.0E+02
2.0E+02
3.0E+02
4.0E+02
5.0E+02
6.0E+02
7.0E+02
5.0 7.0 9.0 11.0 13.0
Isot
ope
Conc
entr
atio
n (C
i/m
3 )
Radius of Inner Ring (mm)
Physically sampled data
0
100
200
300
400
500
600
0.006 0.008 0.01 0.012
Conc
entr
atio
n [C
i/m
3 ]
r [m]
Conclusions
• Using a combination of modeling tools and our best currently available models and parameters, we have made predictions of Ag, Cs, and Sr transport in the AGR-3/4 experiment
• We have outlined a simplified method for estimating diffusion coefficients from experiment data based on a transient analytical solution with time-varying boundary conditions
• A new image reconstruction technique has been developed and is successfully reproducing fission product distributions in accord with data from physical sampling
• As the above techniques are refined and as further PIE data are obtained, the model will be updated so as to successfully predict AGR-3/4 fission product profiles to within +/- 1 order of magnitude
18