Embed Size (px)
Citation preview
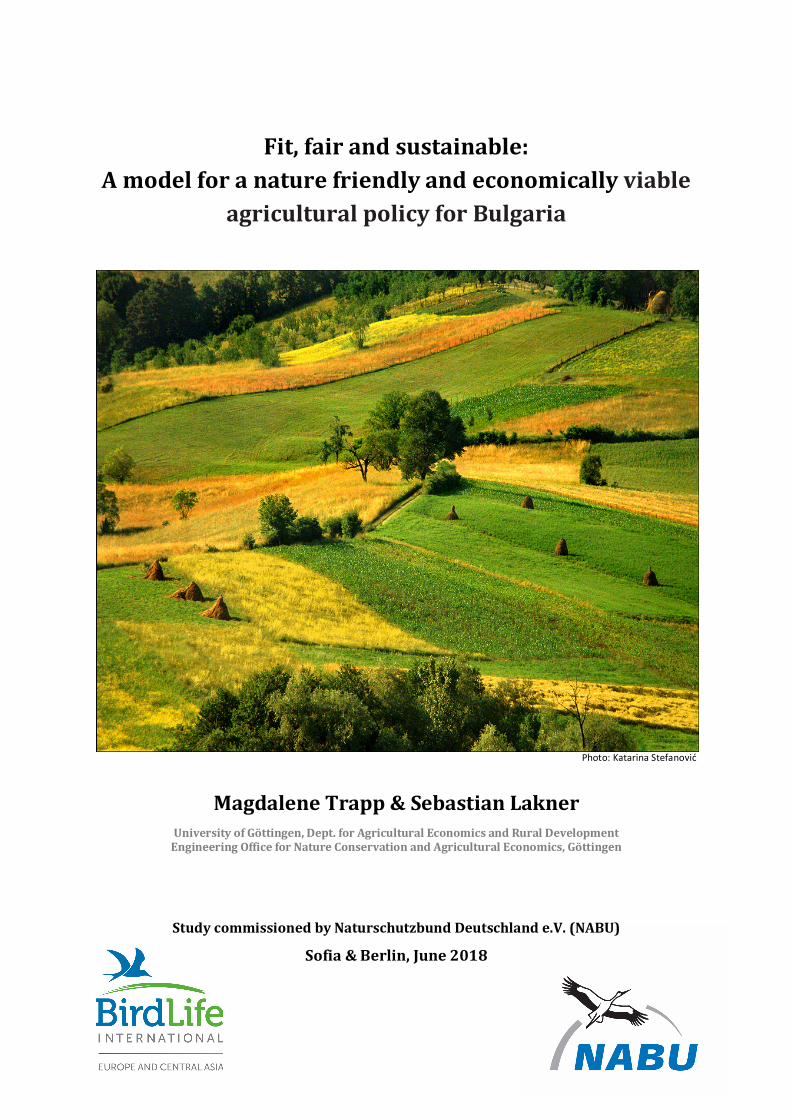
Fit,fairandsustainable:
AmodelforanaturefriendlyandeconomicallyviableagriculturalpolicyforBulgaria
MagdaleneTrapp&SebastianLaknerUniversityofGöttingen,Dept.forAgriculturalEconomicsandRuralDevelopmentEngineeringOfficeforNatureConservationandAgriculturalEconomics,Göttingen
StudycommissionedbyNaturschutzbundDeutschlande.V.(NABU)
Sofia&Berlin,June2018
Photo: Katarina Stefanović
i
How to cite:
Magdalene Trapp & Sebastian Lakner (2018): Fit, fair and sustainable: A model for a nature friendly and economically viable agricultural policy for Bulgaria; Study commissioned by Naturschutzbund e.V. Germany (NABU), Berlin & Sofia.
Acknowledgements:
The authors would like to thank Irina Mateeva from the Bulgarian Society for the Protection of Birds (BSPB) for her great support and for the organization of interviews and field trip in March 2018. Furthermore, a great thank also to the BSPB-team in Plovdiv, Sofia, and Varna, who helped in organization, transportation, translation and coffee. Without your help, it wouldn’t have been possible!
We would also like to express our thanks to Angelika Lischka, André Prescher and Konstantin Kreiser from NABU Germany for constructively supporting this study from the very beginning. We would like to thank Nicky Petkov, Vladimir Dobrev and Nikolay Valkanov for their constructive feedback on the final version of this study.
We would like to thank all our interview-partners, who took the time and talked to us, which gave us a number of valuable insights on the agricultural sector in Bulgaria.
The photo on the frontpage was done by Katarina Stefanović. We are grateful for the allowance to use this photo. More of her work can be seen here: https://www.flickr.com/photos/jup3nep/sets/72157603856136177
FinancedbytheGermanFederalMinistryfortheEnvironment,NatureConservationandNuclearSafety(BMU)
ii
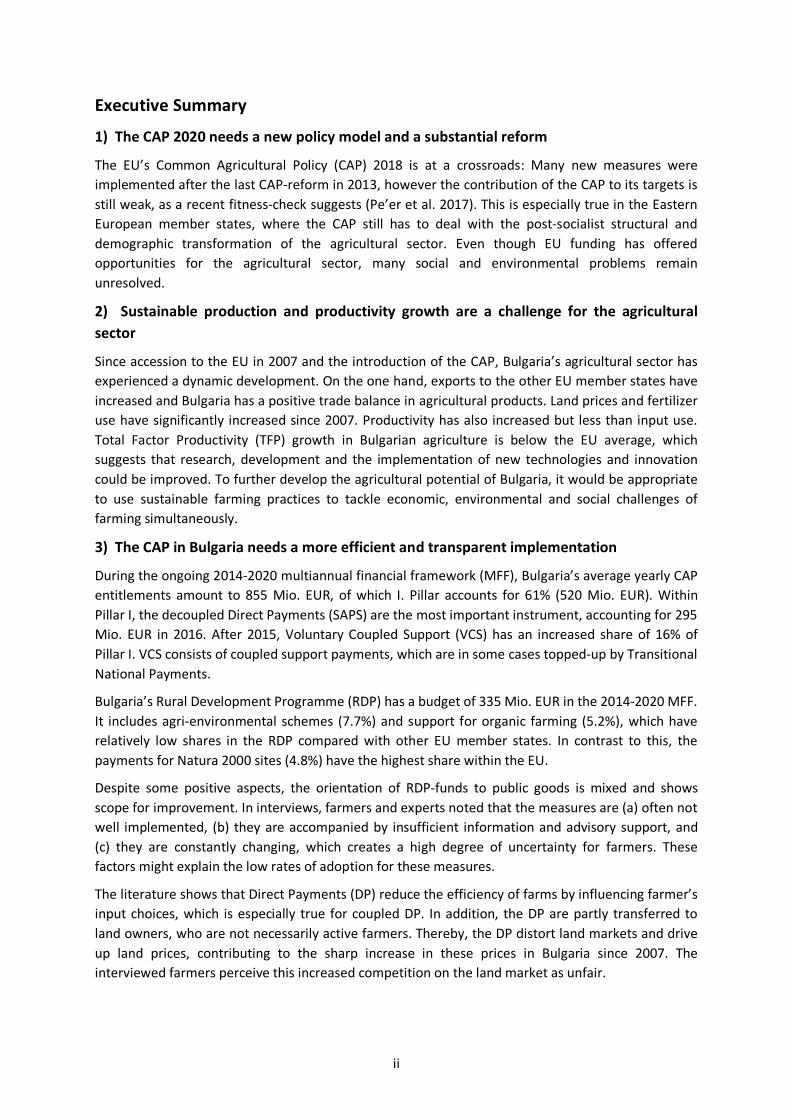
Executive Summary
1) The CAP 2020 needs a new policy model and a substantial reform
The EU’s Common Agricultural Policy (CAP) 2018 is at a crossroads: Many new measures were implemented after the last CAP-reform in 2013, however the contribution of the CAP to its targets is still weak, as a recent fitness-check suggests (Pe’er et al. 2017). This is especially true in the Eastern European member states, where the CAP still has to deal with the post-socialist structural and demographic transformation of the agricultural sector. Even though EU funding has offered opportunities for the agricultural sector, many social and environmental problems remain unresolved.
2) Sustainable production and productivity growth are a challenge for the agricultural sector
Since accession to the EU in 2007 and the introduction of the CAP, Bulgaria’s agricultural sector has experienced a dynamic development. On the one hand, exports to the other EU member states have increased and Bulgaria has a positive trade balance in agricultural products. Land prices and fertilizer use have significantly increased since 2007. Productivity has also increased but less than input use. Total Factor Productivity (TFP) growth in Bulgarian agriculture is below the EU average, which suggests that research, development and the implementation of new technologies and innovation could be improved. To further develop the agricultural potential of Bulgaria, it would be appropriate to use sustainable farming practices to tackle economic, environmental and social challenges of farming simultaneously.
3) The CAP in Bulgaria needs a more efficient and transparent implementation
During the ongoing 2014-2020 multiannual financial framework (MFF), Bulgaria’s average yearly CAP entitlements amount to 855 Mio. EUR, of which I. Pillar accounts for 61% (520 Mio. EUR). Within Pillar I, the decoupled Direct Payments (SAPS) are the most important instrument, accounting for 295 Mio. EUR in 2016. After 2015, Voluntary Coupled Support (VCS) has an increased share of 16% of Pillar I. VCS consists of coupled support payments, which are in some cases topped-up by Transitional National Payments.
Bulgaria’s Rural Development Programme (RDP) has a budget of 335 Mio. EUR in the 2014-2020 MFF. It includes agri-environmental schemes (7.7%) and support for organic farming (5.2%), which have relatively low shares in the RDP compared with other EU member states. In contrast to this, the payments for Natura 2000 sites (4.8%) have the highest share within the EU.
Despite some positive aspects, the orientation of RDP-funds to public goods is mixed and shows scope for improvement. In interviews, farmers and experts noted that the measures are (a) often not well implemented, (b) they are accompanied by insufficient information and advisory support, and (c) they are constantly changing, which creates a high degree of uncertainty for farmers. These factors might explain the low rates of adoption for these measures.
The literature shows that Direct Payments (DP) reduce the efficiency of farms by influencing farmer’s input choices, which is especially true for coupled DP. In addition, the DP are partly transferred to land owners, who are not necessarily active farmers. Thereby, the DP distort land markets and drive up land prices, contributing to the sharp increase in these prices in Bulgaria since 2007. The interviewed farmers perceive this increased competition on the land market as unfair.
iii
Voluntary coupled support (VCS) increases the complexity of agricultural support without a clear target or benefit. It encourages lobbyism and rent-seeking behaviour by farmers associations seeking to maximize support for their specific member groups.
Overall, CAP implementation in Bulgaria for 2014-2020 builds on many complex payments which do not necessarily contribute to the development of the sector, but rather generate rents for specific sectors. Furthermore, the coupled and decoupled DP are a highly inefficient and not well justified. We therefore recommend that the DP be phased out.
4) The CAP needs to address the environmental challenges
Bulgaria’s natural environment is rich in species and habitats, many of which are protected within the Natura 2000 network. Our study provides a comprehensive overview of the potential damage of the CAP on biodiversity. The farmland birds index declined by 21% between 2005 and 2013. The report on the implementation of the habitat directive from 2014 shows that only 11% of the habitats are in a favourable status. The situation of species protected by the habitat directive is better, with the report concluding that 54% of the species are in a favourable status. Agriculture is the one of the main causes of the deterioration of habitats, and therefore agricultural policy is a key instrument to improve farmland biodiversity.
Our study also analyses the environmental effects of the DP. Among other things, the DP incentivize farmers to convert grassland to arable land. As a result, Bulgaria has experienced one of the strongest reductions in grassland area in the EU. Some rules under the Land Identification System (LPIS) encourage farmers to remove landscape elements such as trees or shrubs, which negatively affects the breeding and forage behaviour of farmland birds and might lead to increased soil erosion.
5) Institution and Property Rights are weak and need enforcement
The interviews with Bulgarian farmers reveal that legal enforcement and fraudulent behaviour are perceived as major obstacles for the development of the agricultural sector. These single observations are coherent with the reports of the EU’s European Anti-Fraud Office (OLAF). This suggests that enforcement of legal regulations and controls within the agricultural sector needs to be improved.
6) The BirdLife Reform Model as an opportunity for the environment and farmer’s incomes
The Birdlife reform model is based on two main principles: First, the DP in Pillar I should be phased out or transformed into a sustainability payment linked to public goods. Second, the BirdLife reform model offers a number of voluntary targeted measures which address environmental challenges and simultaneously provide income opportunities for farms that provide public goods. The “Nature and Biodiversity Instrument” can be applied to maintain and protect biodiversity in Bulgaria. “Space for Nature” offers a simple instrument to support measures such as fallow land, and the “Transition Instrument for Sustainable farming” can help to support farm transformation towards sustainable farming practices, including e.g. the support of organic farming and advisory services. The scenario model in our study shows that farms adopt these agri-environmental measures can profit and improve their income situation.
The scenario model presented in our study also shows that phasing out VCS might be politically challenging because it would cause reductions in farm incomes which cannot be fully equalized by the BirdLife model. Our results also show that incorporating additional incentives for organic farming into the BirdLife would support a sustainable farming system.
iv
7) Recommendations for the future Agricultural Policy in Bulgaria
1) Reduce and phase out Direct Payments in the medium term.
2) Phase out voluntary coupled payments and Transitional National Payments in the short term.
3) Clarify objectives and priorities within the I. Pillar. Solve the demographic and social challenges of the agricultural sector by applying improved social and taxation policies.
4) Adjust the Land Parcel Identification System (LPIS) to the grassland systems in Bulgaria and reduce negative environmental side effects of LPIS.
5) Strengthen legal enforcement and controls in the agricultural sector. This is specifically true for the environmental legislation and controls, where fraud and illegal appropriation can cause environmental deterioration.
6) Strengthen and improve Agri-Environmental Measures with respect their efficiency and applicability and financial resources
7) Make use of the Birdlife model as a possible alternative for improved agri-environmental programs, adopting the measures regionally and doing pre-evaluations before implementing them.
8) Align agri-environmental programs to the Natura 2000 objectives.
9) Improve advisory services, information and education for the agricultural sector.
v
Table of Content 1 Introduction ..............................................................................................................................................................1
2 Background: The Farming Sector and State of Environment in Bulgaria .......................................................................3
2.1 Farm Structures and Structural Change in Bulgaria ..........................................................................................3
2.2 Farm size and structural change ......................................................................................................................7
2.3 Agricultural Production in Bulgaria and regional differences ............................................................................7
2.4 State of biodiversity in Bulgaria and the impact of the CAP ..............................................................................9
3 Background: The Common Agricultural Policy (CAP) in Bulgaria ................................................................................ 12
3.1 The general instruments of the CAP in financial terms ................................................................................... 12
3.2 Implementation of Direct Payments (DP)2008-2016 ...................................................................................... 13
3.3 Transitional National Payments ..................................................................................................................... 20
4 Results from interviews with Bulgarian farmers ........................................................................................................ 20
4.1 Problems and challenges on farms and in rural areas ..................................................................................... 21
4.2 Perceived changes in agriculture since introduction of CAP in 2007 ................................................................ 22
4.3 Plans for the future and stated behavior if CAP changes ................................................................................ 26
4.4 Suggestions for improvement of the CAP by Bulgarian farmers ...................................................................... 27
4.5 Expert interview on the status of the agro-ecosystems .................................................................................. 29
5 The development of an alternative model to increase sustainability of the CAP using the BirdLife model ................... 31
5.1 Development of the model ........................................................................................................................... 31
5.2 Methods: The design of “Typical Regional Farms” and calculation methodology ............................................. 34
5.3 Results ......................................................................................................................................................... 36
6 Discussion ............................................................................................................................................................... 40
6.1 The BirdLife Reform Model as an opportunity for the environment and farm incomes ................................... 40
6.2 Sustainable Production as main challenge for Bulgaria ................................................................................... 41
6.3 The agricultural sector in Bulgaria has to face some socio-economic challenges ............................................. 41
6.4 Institutions and property rights ..................................................................................................................... 42
6.5 The CAP in Bulgaria needs a more efficient and transparent implementation ................................................. 42
6.6 The CAP needs to address the environmental challenges ............................................................................... 43
7 Conclusions ............................................................................................................................................................. 44
7.1 The I. Pillar of the CAP needs a substantial reform: ........................................................................................ 44
7.2 The agri-environmental policies need more support ...................................................................................... 45
Sources: ........................................................................................................................................................................... 47
Appendix 1: Regional agricultural production focus in Bulgaria .......................................................................................... 50
Appendix: 2: Information on the status of Natura 2000 in Bulgaria (BSPB 2017) ................................................................. 51
Appendix 3: Legal basis of coupled support in the CAP-reforms 2009 and 2013 .................................................................. 52
Appendix 4: Purchasing price index in Bulgaria and Germany ............................................................................................. 54
Appendix 5: Scenario of typical farms including voluntary coupled payments ..................................................................... 54
Appendix 6: Payment Rates of the I. Pillar and Transitional National Payments in Bulgaria ................................................. 55
vi
List of Abbreviations Abbreviation Full term AEM Agri-Environmental Measures AECM Agri-Environmental & Climate Measures ANC Areas with Natural Constraints BSPB Bulgarian Society for the Protection of Birds CAP Common Agricultural Policy CCM Corn Cob Mix COP Cereals Oilseed and Protein crops DG General directorate DP Direct Payments EAFRD European Agricultural Fund for Rural Development EC European Commission EFA Ecological Focus Area ESO European Standard Output ESPG Environmentally sensitive permanent grassland EU European Union F.A.D.N. Farm Accounting Data Network GFC General Field Cropping GM Regionalized Gross Margins KTBL Kuratorium für Technik und Bauwesen in der Landwirtschaft LPIS Land Parcel Information System LU Livestock Unit MARD Ministry for Agriculture and Rural Development in Bulgaria NFC Nitrogen-fixing crop RDP Rural Development Program SCI Sites of Community Interests SGM Standard Gross Margin UAA Utilized Agricultural Area TFP Total Factor Productivity VCS Voluntary Coupled Support
vii
List of Tables
Table 1: The distribution of farm sizes in Bulgaria (2005, 2010 and 2016) .............................................................................7
Table 2: Total crop production (in tons) in the different regions of Bulgaria (2014) ...............................................................8
Table 3: The financial support of the CAP including the Transitional National Payments 2015/16 ........................................ 13
Table 4: Voluntary coupled support in different sectors in Bulgaria 2017-2020 ................................................................... 17
Table 5: Spending according the RDP-priorities in Bulgaria 2014-2020 ................................................................................ 18
Table 6: Payments within the RDP related to public services for environment and animal welfare ...................................... 18
Table 7: Area under Agri-Environmental Measures (AEM) in Bulgaria 2007-2013 ................................................................ 19
Table 8: Overview on Transitional National Payments 2015-2017 (in 1,000 EUR) ................................................................ 20
Table 9: Farmer’s views on the adoption possible Agroecological measures ....................................................................... 26
Table 10: Specification of the scenarios calculated ............................................................................................................. 33
Table 11: Average yield levels (2014-2016) assumed for the example farms ....................................................................... 35
Table 12:Total current payments obtained by the selected farms and the share of subsidies on total farm income ............. 37
Table 13: Average change in incomes in the different scenarios ......................................................................................... 39
Table 14: Purchasing price level index for food and beverages in the EU-28 2007-2016 ...................................................... 54
Table 15: Used payment rates for the model calculations .................................................................................................. 55
Table 16: Payments rates in I. Pillar in Bulgaria .................................................................................................................. 55
Table 17: Selected Payments rates in II. Pillar in Bulgaria ................................................................................................... 56
viii
List of Figures Figure 1: Development of the Agricultural Sector in Bulgaria 1991-2016 .............................................................................. 3
Figure 2: Development of yields for different field crops in Bulgaria 2010-2017 .................................................................... 4
Figure 3: Nitrogen fertilizer consumption by agriculture, EU-28, NO and CH, 2006-2015 in t/ha UAA .................................... 4
Figure 4: Development of land prices for arable land in Bulgaria 2000-2016 ......................................................................... 5
Figure 5: Development of the imports of agricultural products to Germany (Index with 1993=100%) .................................... 6
Figure 6: Share of Agricultural output from different production branches (2014-2016 average) .......................................... 8
Figure 7: Conservation status of species and habitats protected by the EU Habitat Directive ................................................ 9
Figure 8: Habitat assessments reported as being affected by one or more 'high' importance pressures or threats in Bulgaria 2007-2013 ..................................................................................................................................................... 10
Figure 9: Development of the birds-index for forest, farmland species in Bulgaria .............................................................. 11
Figure 10: Financial allocations to Direct Payments, market measures and the Rural Development Programs (RDP) in Bulgaria 2009-2020 ..................................................................................................................................................... 12
Figure 11: CAP-budget within the I. Pillar in Bulgaria between 2008 and 2016 .................................................................... 13
Figure 12: Level of decoupled Direct Payments in Bulgaria 2010-2016 ................................................................................ 14
Figure 13: Distribution of Direct Payments in Bulgaria 2008-2016 measured by the Gini-coefficient .................................... 16
Figure 14: Main problems and challenges on farms and in rural areas according to farmers ................................................ 21
Figure 15: Problems and opportunities resulting from the CAP described by farmers.......................................................... 25
Figure 16: Farm development and farmer’s stated behaviour if CAP changes ..................................................................... 26
Figure 17: Farmer’s ideas for improvement of the CAP ...................................................................................................... 28
Figure 18: The main funding instruments of the new CAP-policy; ....................................................................................... 31
Figure 19: Selected farms for the modelling located in the six planning regions in Bulgaria ................................................. 35
Figure 20: Influence of the different scenarios on farmer’s income situation in comparison to the status quo (in %) without VCS in status quo ........................................................................................................................................... 38
Figure 21: Total crop production (in tons) in North West Bulgaria (2014) ............................................................................ 50
Figure 22: Total crop production (in tons) in South Central Bulgaria (2014) ........................................................................ 50
Figure 23: Influence of the different scenarios on farmer’s income situation in comparison to the status quo (in %), including coupled support payments ........................................................................................................................... 54
Fit, fair and sustainable: A model for a nature friendly and economically viable agricultural policy for Bulgaria
1
1 Introduction
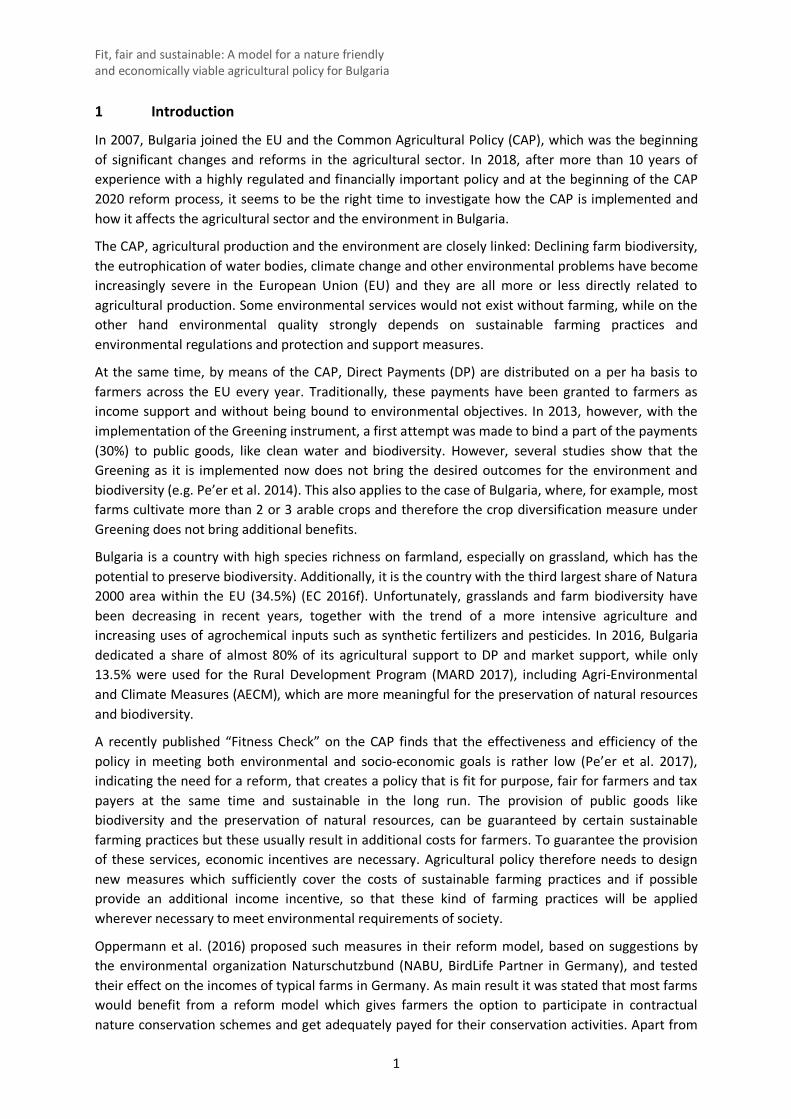
In 2007, Bulgaria joined the EU and the Common Agricultural Policy (CAP), which was the beginning of significant changes and reforms in the agricultural sector. In 2018, after more than 10 years of experience with a highly regulated and financially important policy and at the beginning of the CAP 2020 reform process, it seems to be the right time to investigate how the CAP is implemented and how it affects the agricultural sector and the environment in Bulgaria.
The CAP, agricultural production and the environment are closely linked: Declining farm biodiversity, the eutrophication of water bodies, climate change and other environmental problems have become increasingly severe in the European Union (EU) and they are all more or less directly related to agricultural production. Some environmental services would not exist without farming, while on the other hand environmental quality strongly depends on sustainable farming practices and environmental regulations and protection and support measures.
At the same time, by means of the CAP, Direct Payments (DP) are distributed on a per ha basis to farmers across the EU every year. Traditionally, these payments have been granted to farmers as income support and without being bound to environmental objectives. In 2013, however, with the implementation of the Greening instrument, a first attempt was made to bind a part of the payments (30%) to public goods, like clean water and biodiversity. However, several studies show that the Greening as it is implemented now does not bring the desired outcomes for the environment and biodiversity (e.g. Pe’er et al. 2014). This also applies to the case of Bulgaria, where, for example, most farms cultivate more than 2 or 3 arable crops and therefore the crop diversification measure under Greening does not bring additional benefits.
Bulgaria is a country with high species richness on farmland, especially on grassland, which has the potential to preserve biodiversity. Additionally, it is the country with the third largest share of Natura 2000 area within the EU (34.5%) (EC 2016f). Unfortunately, grasslands and farm biodiversity have been decreasing in recent years, together with the trend of a more intensive agriculture and increasing uses of agrochemical inputs such as synthetic fertilizers and pesticides. In 2016, Bulgaria dedicated a share of almost 80% of its agricultural support to DP and market support, while only 13.5% were used for the Rural Development Program (MARD 2017), including Agri-Environmental and Climate Measures (AECM), which are more meaningful for the preservation of natural resources and biodiversity.
A recently published “Fitness Check” on the CAP finds that the effectiveness and efficiency of the policy in meeting both environmental and socio-economic goals is rather low (Pe’er et al. 2017), indicating the need for a reform, that creates a policy that is fit for purpose, fair for farmers and tax payers at the same time and sustainable in the long run. The provision of public goods like biodiversity and the preservation of natural resources, can be guaranteed by certain sustainable farming practices but these usually result in additional costs for farmers. To guarantee the provision of these services, economic incentives are necessary. Agricultural policy therefore needs to design new measures which sufficiently cover the costs of sustainable farming practices and if possible provide an additional income incentive, so that these kind of farming practices will be applied wherever necessary to meet environmental requirements of society.
Oppermann et al. (2016) proposed such measures in their reform model, based on suggestions by the environmental organization Naturschutzbund (NABU, BirdLife Partner in Germany), and tested their effect on the incomes of typical farms in Germany. As main result it was stated that most farms would benefit from a reform model which gives farmers the option to participate in contractual nature conservation schemes and get adequately payed for their conservation activities. Apart from
Fit, fair and sustainable: A model for a nature friendly and economically viable agricultural policy for Bulgaria
2
understanding the environmental situation in Bulgaria and the application of the CAP, the study at hand aims at adopting and further developing the proposed reform model of Oppermann et al. (2016) for the case of Bulgaria, using and further specifying key political measures suggested by BirdLife International (2017) for the CAP post 2020.
The following research questions will be addressed:
(1) How is the state of environment, with specific focus on biodiversity, in Bulgaria and what are specific environmental challenges?
(2) How is the CAP implemented in Bulgaria? What are particular challenges and opportunities? (3) How is the CAP affecting incomes of typical farms in Bulgaria at present? (4) How would farm incomes be affected by the application of an alternative reform model after
2020?
Trying to approach the complexity of the topic in the best possible way, a combination of different methods was chosen (a) the use of scientific literature and political documents (b) execution of interviews with 11 farmers and three experts in Bulgaria and (c) the use of data on Bulgarian farms obtained by Farm Accountancy Data Network (FADN), Eurostat and other databases. .The later were used to model the effects of the current CAP on farm incomes as well as the effects of the alternative model provided by BirdLife.
Conservation measures on arable land are necessary to preserve biodiversity. At the same time, the participation rates in AECM on arable land are low. AECM measures on arable land are not attractive, information is not well distributed and financial incentives are low. Therefore, this study is focused on environmental measures on arable land and our model scenarios refer to typical arable and horticultural farms. For a detailed analysis of the support of permanent grassland in Bulgaria, we refer to Stefanova & Kazakova (2015).
The remainder of this study is organized as follows. Chapter 2 gives an overview of Bulgaria’s farming sector and the state of environment in the country, in chapter 3, the main instruments of the current agricultural policy in Bulgaria are described and explained, chapter 4 presents the results of the interviews with farmers, followed by chapter 5 the development of the new reform model is illustrated and results of the calculations are presented. Chapter 6 discusses the findings and chapter 7 gives some very brief and general conclusions.
Fit, fair and sustainable: A model for a nature friendly and economically viable agricultural policy for Bulgaria
3
2 Background: The Farming Sector and State of Environment in Bulgaria
2.1 Farm Structures and Structural Change in Bulgaria
Bulgaria is a country in Southeast Europe with a population of 7.2 Million inhabitants, of which the majority is living in rural areas, with a trend of people moving mainly to the four biggest cities Sofia, Plovdiv, Varna and Burgas. 46.1% of the total land area of 110,000 km2 is used by agriculture (EC 2017a). The agricultural value added of farming is about 2.16 bn. US$ (current prices), which is 102 US$ /worker (in 2010-prices) and ca. 1% of the EU agricultural value added1. Farming contributes 4.7% to the Gross Domestic Product (GDP), which is above the average of the EU-28 of 1.6%. The share of labour force employed in agriculture is about 7.1% (2014), exceeding the average of EU-28, which is 4.5% (World Bank 2018).
Bulgaria has a farming sector with 202,720 farms using 5,021,412 hectares of utilized agricultural area (UAA); which is 45.2% of country’s territory. The largest part (3,480,991 ha) is agricultural land with a share of 69.3% of the UAA, which also includes horticultural land and private gardens. Grassland has a share of 27.6%. Perennial crops and viniculture have shares of 2.8% and 1.0%, respectively (MARD 2017). Within the Land Parcel Identification System (LPIS) 94,750 farmers are registered and eligible for Direct Payments.
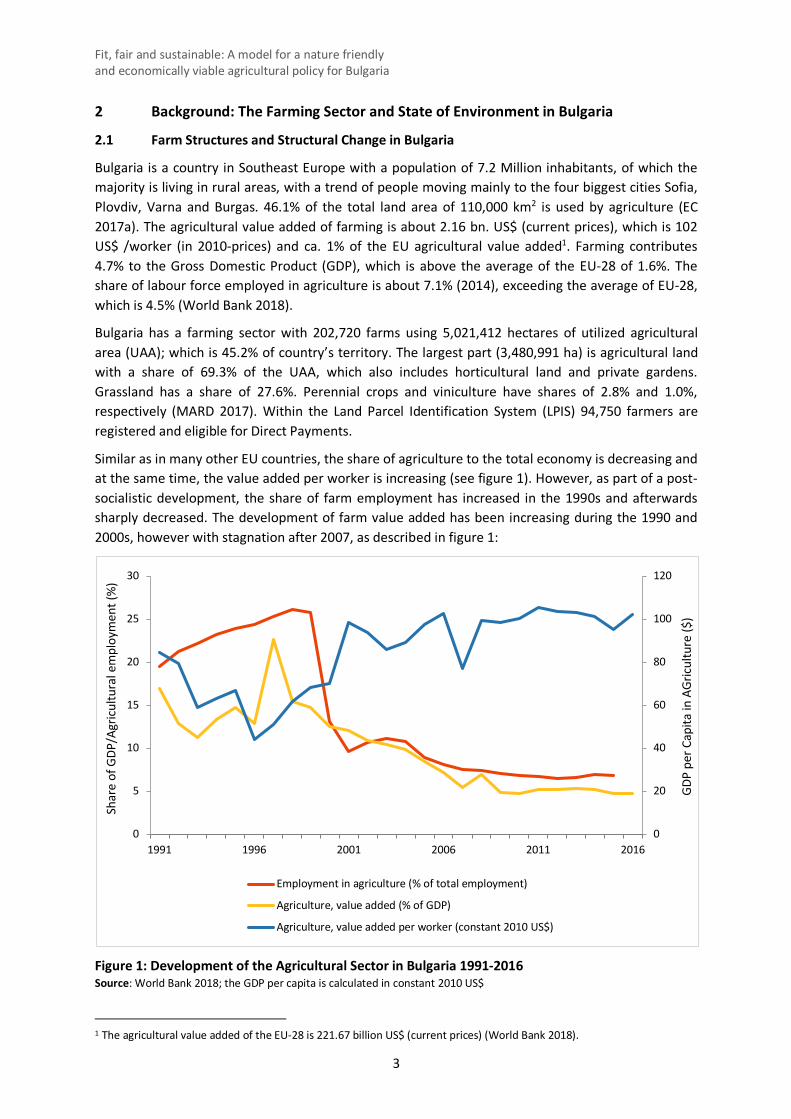
Similar as in many other EU countries, the share of agriculture to the total economy is decreasing and at the same time, the value added per worker is increasing (see figure 1). However, as part of a post-socialistic development, the share of farm employment has increased in the 1990s and afterwards sharply decreased. The development of farm value added has been increasing during the 1990 and 2000s, however with stagnation after 2007, as described in figure 1:
Figure 1: Development of the Agricultural Sector in Bulgaria 1991-2016 Source: World Bank 2018; the GDP per capita is calculated in constant 2010 US$
1 The agricultural value added of the EU-28 is 221.67 billion US$ (current prices) (World Bank 2018).
0
20
40
60
80
100
120
0
5
10
15
20
25
30
1991 1996 2001 2006 2011 2016
GDP
per C
apita
in A
Gric
ultu
re ($
)
Shar
e of
GDP
/Agr
icul
tura
l em
ploy
men
t (%
)
Employment in agriculture (% of total employment)
Agriculture, value added (% of GDP)
Agriculture, value added per worker (constant 2010 US$)
Fit, fair and sustainable: A model for a nature friendly and economically viable agricultural policy for Bulgaria
4
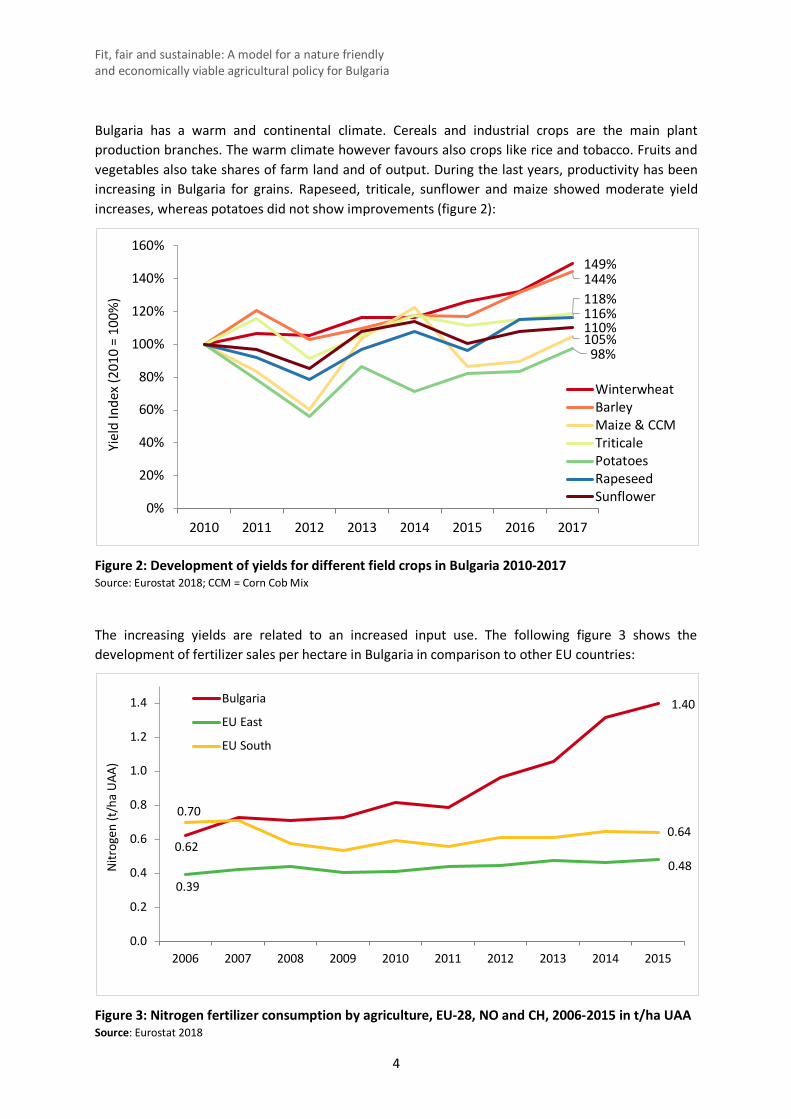
Bulgaria has a warm and continental climate. Cereals and industrial crops are the main plant production branches. The warm climate however favours also crops like rice and tobacco. Fruits and vegetables also take shares of farm land and of output. During the last years, productivity has been increasing in Bulgaria for grains. Rapeseed, triticale, sunflower and maize showed moderate yield increases, whereas potatoes did not show improvements (figure 2):
Figure 2: Development of yields for different field crops in Bulgaria 2010-2017 Source: Eurostat 2018; CCM = Corn Cob Mix
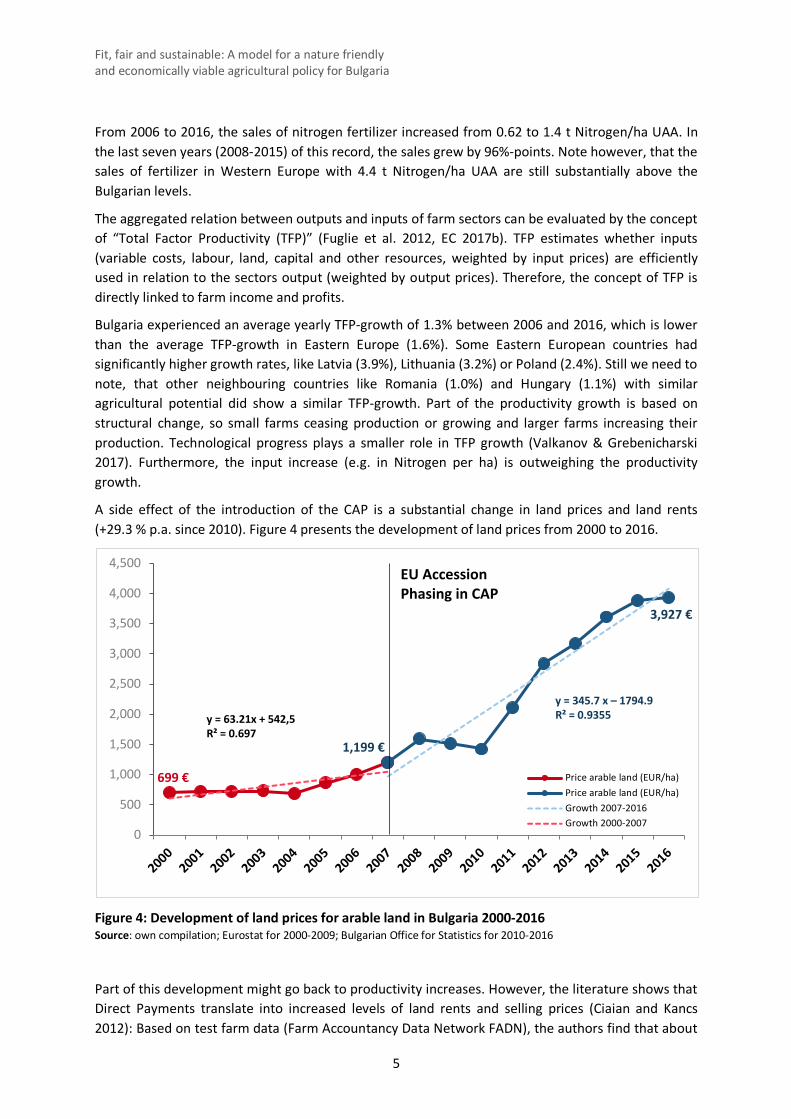
The increasing yields are related to an increased input use. The following figure 3 shows the development of fertilizer sales per hectare in Bulgaria in comparison to other EU countries:
Figure 3: Nitrogen fertilizer consumption by agriculture, EU-28, NO and CH, 2006-2015 in t/ha UAA Source: Eurostat 2018
149%144%
105%
118%
98%
116%110%
0%
20%
40%
60%
80%
100%
120%
140%
160%
2010 2011 2012 2013 2014 2015 2016 2017
Yiel
d In
dex
(201
0 =
100%
)
WinterwheatBarleyMaize & CCMTriticalePotatoesRapeseedSunflower
0.62
1.40
0.39 0.48
0.70 0.64
0.0
0.2
0.4
0.6
0.8
1.0
1.2
1.4
2006 2007 2008 2009 2010 2011 2012 2013 2014 2015
Nitr
ogen
(t/h
a U
AA)
Bulgaria
EU East
EU South
Fit, fair and sustainable: A model for a nature friendly and economically viable agricultural policy for Bulgaria
5
From 2006 to 2016, the sales of nitrogen fertilizer increased from 0.62 to 1.4 t Nitrogen/ha UAA. In the last seven years (2008-2015) of this record, the sales grew by 96%-points. Note however, that the sales of fertilizer in Western Europe with 4.4 t Nitrogen/ha UAA are still substantially above the Bulgarian levels.
The aggregated relation between outputs and inputs of farm sectors can be evaluated by the concept of “Total Factor Productivity (TFP)” (Fuglie et al. 2012, EC 2017b). TFP estimates whether inputs (variable costs, labour, land, capital and other resources, weighted by input prices) are efficiently used in relation to the sectors output (weighted by output prices). Therefore, the concept of TFP is directly linked to farm income and profits.
Bulgaria experienced an average yearly TFP-growth of 1.3% between 2006 and 2016, which is lower than the average TFP-growth in Eastern Europe (1.6%). Some Eastern European countries had significantly higher growth rates, like Latvia (3.9%), Lithuania (3.2%) or Poland (2.4%). Still we need to note, that other neighbouring countries like Romania (1.0%) and Hungary (1.1%) with similar agricultural potential did show a similar TFP-growth. Part of the productivity growth is based on structural change, so small farms ceasing production or growing and larger farms increasing their production. Technological progress plays a smaller role in TFP growth (Valkanov & Grebenicharski 2017). Furthermore, the input increase (e.g. in Nitrogen per ha) is outweighing the productivity growth.
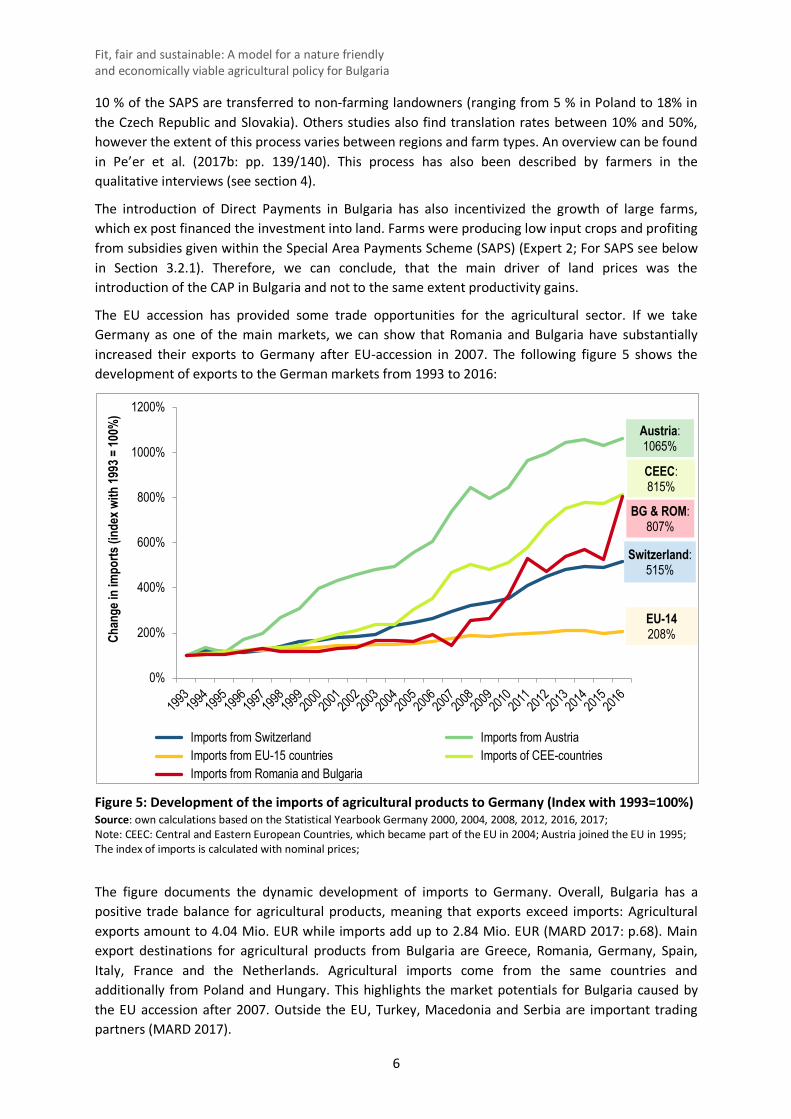
A side effect of the introduction of the CAP is a substantial change in land prices and land rents (+29.3 % p.a. since 2010). Figure 4 presents the development of land prices from 2000 to 2016.
Figure 4: Development of land prices for arable land in Bulgaria 2000-2016 Source: own compilation; Eurostat for 2000-2009; Bulgarian Office for Statistics for 2010-2016
Part of this development might go back to productivity increases. However, the literature shows that Direct Payments translate into increased levels of land rents and selling prices (Ciaian and Kancs 2012): Based on test farm data (Farm Accountancy Data Network FADN), the authors find that about
699 €
1,199 €
3,927 €
0
500
1,000
1,500
2,000
2,500
3,000
3,500
4,000
4,500
20002001
20022003
20042005
20062007
20082009
20102011
20122013
20142015
2016
Price arable land (EUR/ha)Price arable land (EUR/ha)Growth 2007-2016Growth 2000-2007
EU AccessionPhasing in CAP
y = 63.21x + 542,5 R² = 0.697
y = 345.7 x – 1794.9 R² = 0.9355
Fit, fair and sustainable: A model for a nature friendly and economically viable agricultural policy for Bulgaria
6
10 % of the SAPS are transferred to non-farming landowners (ranging from 5 % in Poland to 18% in the Czech Republic and Slovakia). Others studies also find translation rates between 10% and 50%, however the extent of this process varies between regions and farm types. An overview can be found in Pe’er et al. (2017b: pp. 139/140). This process has also been described by farmers in the qualitative interviews (see section 4).
The introduction of Direct Payments in Bulgaria has also incentivized the growth of large farms, which ex post financed the investment into land. Farms were producing low input crops and profiting from subsidies given within the Special Area Payments Scheme (SAPS) (Expert 2; For SAPS see below in Section 3.2.1). Therefore, we can conclude, that the main driver of land prices was the introduction of the CAP in Bulgaria and not to the same extent productivity gains.
The EU accession has provided some trade opportunities for the agricultural sector. If we take Germany as one of the main markets, we can show that Romania and Bulgaria have substantially increased their exports to Germany after EU-accession in 2007. The following figure 5 shows the development of exports to the German markets from 1993 to 2016:
Figure 5: Development of the imports of agricultural products to Germany (Index with 1993=100%) Source: own calculations based on the Statistical Yearbook Germany 2000, 2004, 2008, 2012, 2016, 2017; Note: CEEC: Central and Eastern European Countries, which became part of the EU in 2004; Austria joined the EU in 1995; The index of imports is calculated with nominal prices;
The figure documents the dynamic development of imports to Germany. Overall, Bulgaria has a positive trade balance for agricultural products, meaning that exports exceed imports: Agricultural exports amount to 4.04 Mio. EUR while imports add up to 2.84 Mio. EUR (MARD 2017: p.68). Main export destinations for agricultural products from Bulgaria are Greece, Romania, Germany, Spain, Italy, France and the Netherlands. Agricultural imports come from the same countries and additionally from Poland and Hungary. This highlights the market potentials for Bulgaria caused by the EU accession after 2007. Outside the EU, Turkey, Macedonia and Serbia are important trading partners (MARD 2017).
Switzerland:515%
Austria:1065%
EU-14208%
CEEC: 815%
BG & ROM:807%
0%
200%
400%
600%
800%
1000%
1200%
1993199
4199
5199
6199
7199
8199
9200
0200
1200
2200
3200
4200
5200
6200
7200
8200
9201
0201
1201
2201
3201
4201
5201
6
Chan
ge in
impo
rts (i
ndex
with
1993
= 10
0%)
Imports from Switzerland Imports from Austria Imports from EU-15 countries Imports of CEE-countries Imports from Romania and Bulgaria
Fit, fair and sustainable: A model for a nature friendly and economically viable agricultural policy for Bulgaria
7
The exports of plant products have a higher share within the exports, whereas animal products are more important for imports. Product wise, wheat and wheat products, sunflower, rapeseed and maize are the main export crops. Meat is the most important import commodity (MARD 2017: pp. 78/79).
2.2 Farm size and structural change
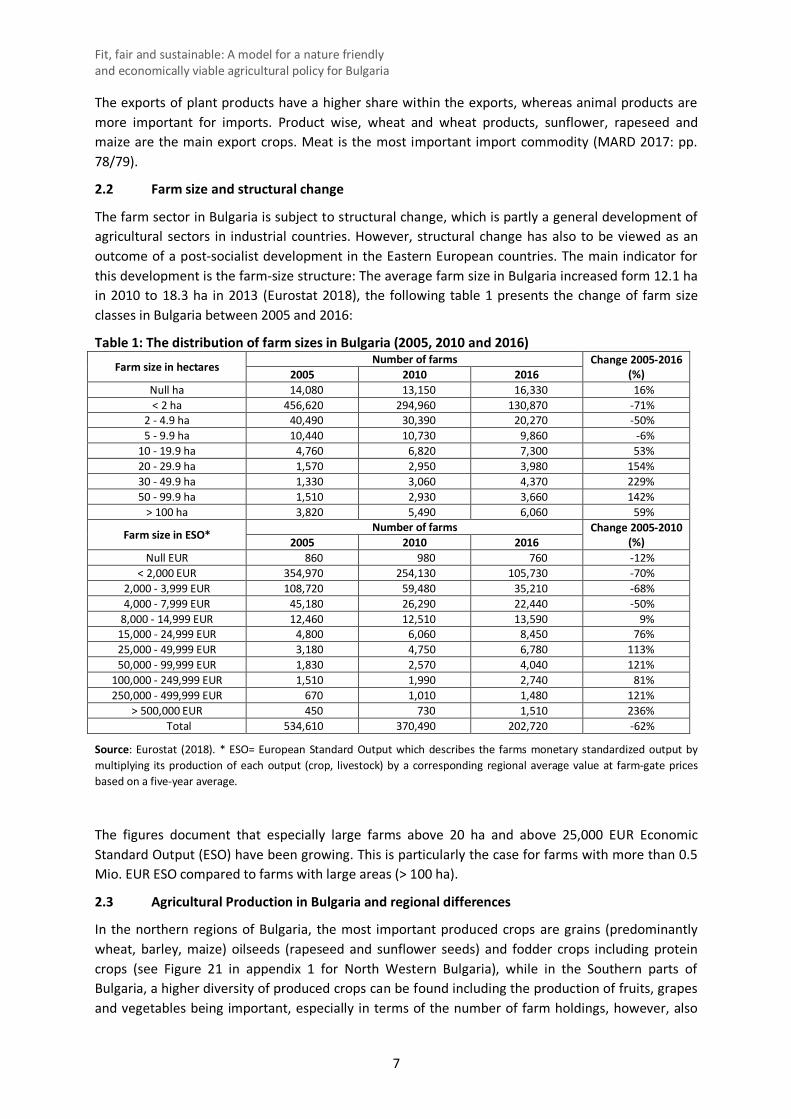
The farm sector in Bulgaria is subject to structural change, which is partly a general development of agricultural sectors in industrial countries. However, structural change has also to be viewed as an outcome of a post-socialist development in the Eastern European countries. The main indicator for this development is the farm-size structure: The average farm size in Bulgaria increased form 12.1 ha in 2010 to 18.3 ha in 2013 (Eurostat 2018), the following table 1 presents the change of farm size classes in Bulgaria between 2005 and 2016:
Table 1: The distribution of farm sizes in Bulgaria (2005, 2010 and 2016)
Farm size in hectares Number of farms Change 2005-2016 (%) 2005 2010 2016
Null ha 14,080 13,150 16,330 16% < 2 ha 456,620 294,960 130,870 -71%
2 - 4.9 ha 40,490 30,390 20,270 -50% 5 - 9.9 ha 10,440 10,730 9,860 -6%
10 - 19.9 ha 4,760 6,820 7,300 53% 20 - 29.9 ha 1,570 2,950 3,980 154% 30 - 49.9 ha 1,330 3,060 4,370 229% 50 - 99.9 ha 1,510 2,930 3,660 142%
> 100 ha 3,820 5,490 6,060 59%
Farm size in ESO* Number of farms Change 2005-2010 (%) 2005 2010 2016
Null EUR 860 980 760 -12% < 2,000 EUR 354,970 254,130 105,730 -70%
2,000 - 3,999 EUR 108,720 59,480 35,210 -68% 4,000 - 7,999 EUR 45,180 26,290 22,440 -50%
8,000 - 14,999 EUR 12,460 12,510 13,590 9% 15,000 - 24,999 EUR 4,800 6,060 8,450 76% 25,000 - 49,999 EUR 3,180 4,750 6,780 113% 50,000 - 99,999 EUR 1,830 2,570 4,040 121%
100,000 - 249,999 EUR 1,510 1,990 2,740 81% 250,000 - 499,999 EUR 670 1,010 1,480 121%
> 500,000 EUR 450 730 1,510 236% Total 534,610 370,490 202,720 -62%
Source: Eurostat (2018). * ESO= European Standard Output which describes the farms monetary standardized output by multiplying its production of each output (crop, livestock) by a corresponding regional average value at farm-gate prices based on a five-year average.
The figures document that especially large farms above 20 ha and above 25,000 EUR Economic Standard Output (ESO) have been growing. This is particularly the case for farms with more than 0.5 Mio. EUR ESO compared to farms with large areas (> 100 ha).
2.3 Agricultural Production in Bulgaria and regional differences
In the northern regions of Bulgaria, the most important produced crops are grains (predominantly wheat, barley, maize) oilseeds (rapeseed and sunflower seeds) and fodder crops including protein crops (see Figure 21 in appendix 1 for North Western Bulgaria), while in the Southern parts of Bulgaria, a higher diversity of produced crops can be found including the production of fruits, grapes and vegetables being important, especially in terms of the number of farm holdings, however, also
Fit, fair and sustainable: A model for a nature friendly and economically viable agricultural policy for Bulgaria
8
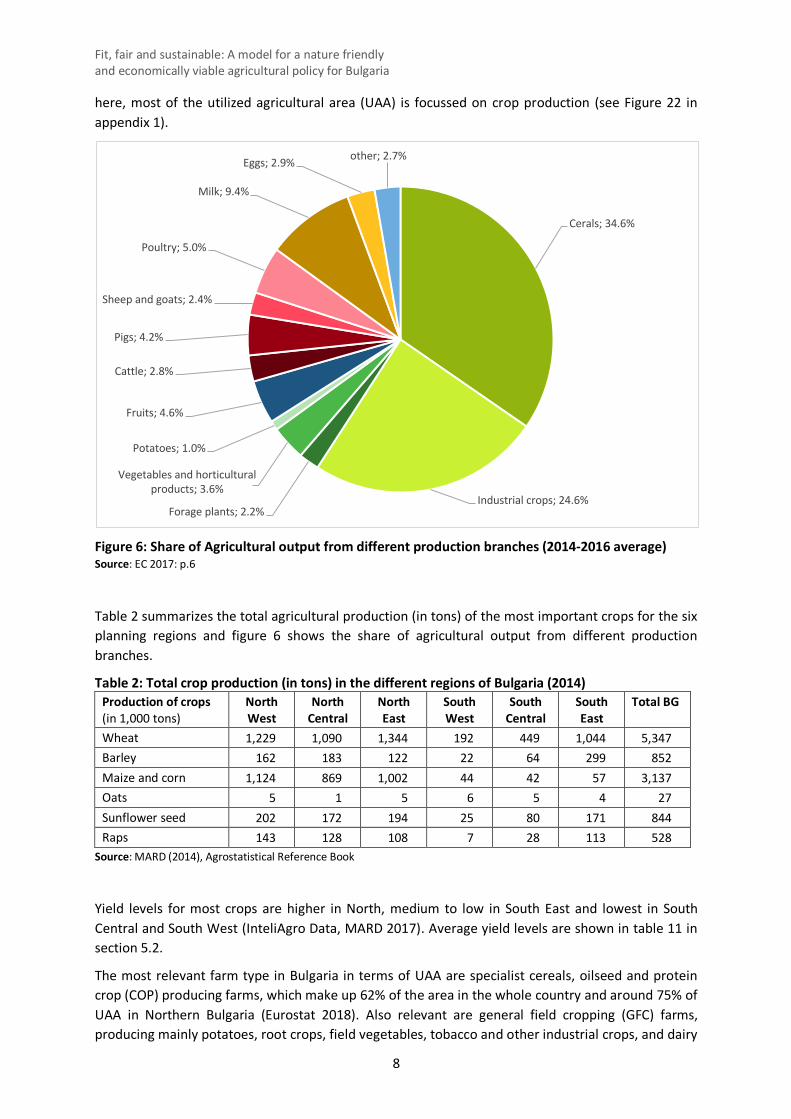
here, most of the utilized agricultural area (UAA) is focussed on crop production (see Figure 22 in appendix 1).
Figure 6: Share of Agricultural output from different production branches (2014-2016 average) Source: EC 2017: p.6
Table 2 summarizes the total agricultural production (in tons) of the most important crops for the six planning regions and figure 6 shows the share of agricultural output from different production branches.
Table 2: Total crop production (in tons) in the different regions of Bulgaria (2014) Production of crops (in 1,000 tons)
North West
North Central
North East
South West
South Central
South East
Total BG
Wheat 1,229 1,090 1,344 192 449 1,044 5,347 Barley 162 183 122 22 64 299 852 Maize and corn 1,124 869 1,002 44 42 57 3,137 Oats 5 1 5 6 5 4 27 Sunflower seed 202 172 194 25 80 171 844 Raps 143 128 108 7 28 113 528
Source: MARD (2014), Agrostatistical Reference Book
Yield levels for most crops are higher in North, medium to low in South East and lowest in South Central and South West (InteliAgro Data, MARD 2017). Average yield levels are shown in table 11 in section 5.2.
The most relevant farm type in Bulgaria in terms of UAA are specialist cereals, oilseed and protein crop (COP) producing farms, which make up 62% of the area in the whole country and around 75% of UAA in Northern Bulgaria (Eurostat 2018). Also relevant are general field cropping (GFC) farms, producing mainly potatoes, root crops, field vegetables, tobacco and other industrial crops, and dairy
Cerals; 34.6%
Industrial crops; 24.6%Forage plants; 2.2%
Vegetables and horticultural products; 3.6%
Potatoes; 1.0%
Fruits; 4.6%
Cattle; 2.8%
Pigs; 4.2%
Sheep and goats; 2.4%
Poultry; 5.0%
Milk; 9.4%
Eggs; 2.9% other; 2.7%
Fit, fair and sustainable: A model for a nature friendly and economically viable agricultural policy for Bulgaria
9
farms. When looking at production quantities and utilized UAA cropping farms have a high importance. In terms of the number of agricultural holdings however, the picture looks a bit different: the most frequent types of holdings in Bulgaria are mixed farms combining livestock, general field cropping farms, specialist dairy farms and farms keeping sheep or goats. These farms are on average much smaller than the specialized cropping farms.
2.4 State of biodiversity in Bulgaria and the impact of the CAP
The main EU instruments for the protection of biodiversity are the EU Nature Directives, consisting of the Birds Directive (Directive 2009/147/EC adopted in April 1979) and the Habitats Directive (Council Directive 92/43/EEC of 21 May 1992). In the following we will focus on the Habitat Directive, which aims at restoring or maintaining a significant number of listed habitats and (non-bird) species of EU importance at a “favourable conservation status”. The main tool of this legislation is Natura 2000, by now the world’s largest network of sites identified by EU Member States and designated as Sites of Community Importance (SCIs) by the European Commission. Once designated, Member States have to ensure legal protection and adequate management within six years. Sites classified under the EU Birds Directive also belong to the Natura 2000 network that covers almost 20 % of the EU’s terrestrial territory with more than 27,000 sites. In Bulgaria, about 30% of the land area is covered by SCIs which is substantially above the EU-average of 13.8% (EC 2016f).
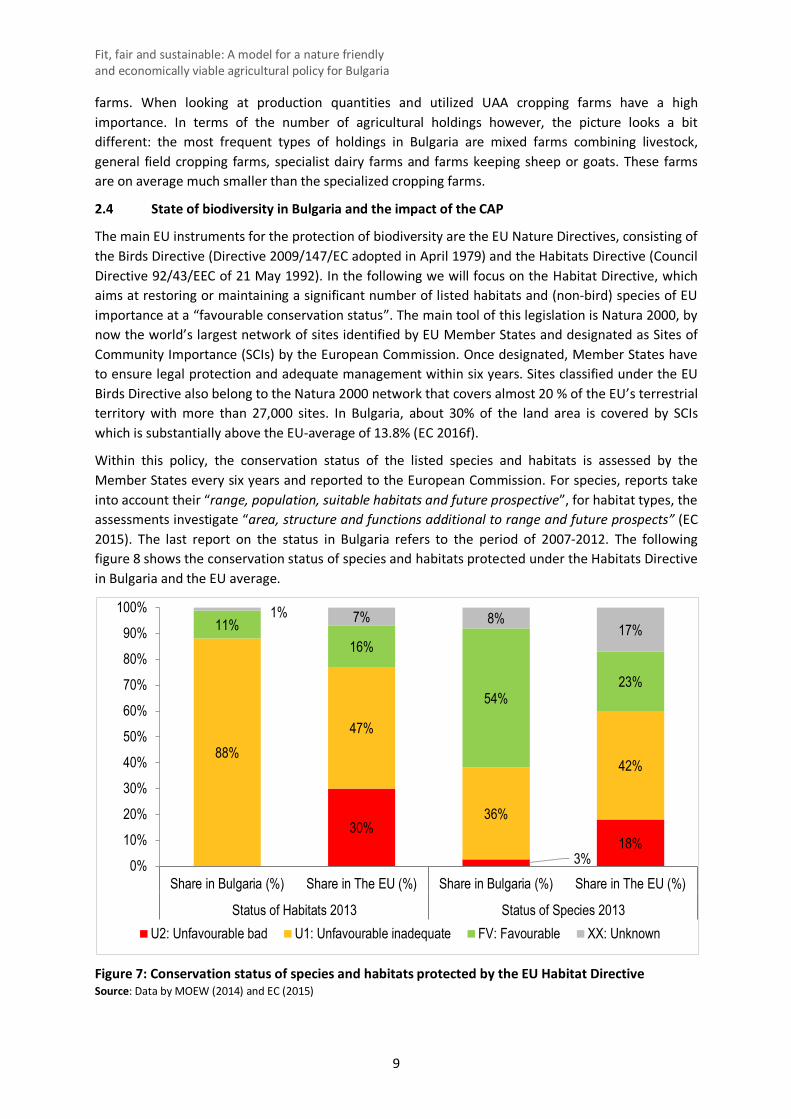
Within this policy, the conservation status of the listed species and habitats is assessed by the Member States every six years and reported to the European Commission. For species, reports take into account their “range, population, suitable habitats and future prospective”, for habitat types, the assessments investigate “area, structure and functions additional to range and future prospects” (EC 2015). The last report on the status in Bulgaria refers to the period of 2007-2012. The following figure 8 shows the conservation status of species and habitats protected under the Habitats Directive in Bulgaria and the EU average.
Figure 7: Conservation status of species and habitats protected by the EU Habitat Directive Source: Data by MOEW (2014) and EC (2015)
30%
3%18%
88%47%
36%
42%
11%16%
54%23%
1% 7% 8%17%
0%
10%
20%
30%
40%
50%
60%
70%
80%
90%
100%
Share in Bulgaria (%) Share in The EU (%) Share in Bulgaria (%) Share in The EU (%)
Status of Habitats 2013 Status of Species 2013U2: Unfavourable bad U1: Unfavourable inadequate FV: Favourable XX: Unknown
Fit, fair and sustainable: A model for a nature friendly and economically viable agricultural policy for Bulgaria
10
The figure 7 suggests, that especially the status of habitats (of which grassland is the most important) is problematic: Only 11% of the habitats are in a favourable conditions. The status of species is found in a better situation, here a favourable status is found for 54% of assessed species, which is substantially above the EU-average. With respect to the type of habitat, grassland-habitats are among the most important. 85% of the grassland habitats are in an “unfavourable bad status”. However, some types of grassland-habitats have a favourable status, specifically 6510 “Lowland hay meadows”; 6420 “Mediterranean tall humid grasslands of the Molinio-Holoschlönion” and 6410 “Molinia meadows on calcareous, peaty or clayey-silt-laden soils”. The other grassland types are in unfavourable status (MOEW 2015).
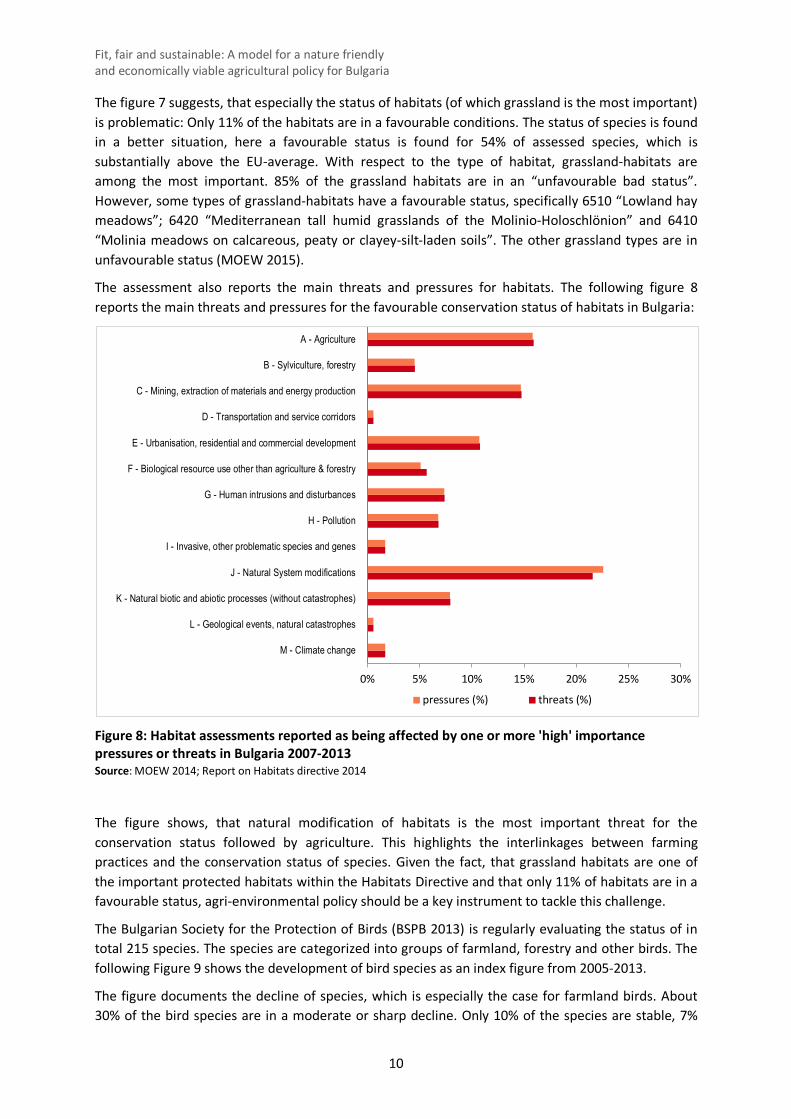
The assessment also reports the main threats and pressures for habitats. The following figure 8 reports the main threats and pressures for the favourable conservation status of habitats in Bulgaria:
Figure 8: Habitat assessments reported as being affected by one or more 'high' importance pressures or threats in Bulgaria 2007-2013 Source: MOEW 2014; Report on Habitats directive 2014
The figure shows, that natural modification of habitats is the most important threat for the conservation status followed by agriculture. This highlights the interlinkages between farming practices and the conservation status of species. Given the fact, that grassland habitats are one of the important protected habitats within the Habitats Directive and that only 11% of habitats are in a favourable status, agri-environmental policy should be a key instrument to tackle this challenge.
The Bulgarian Society for the Protection of Birds (BSPB 2013) is regularly evaluating the status of in total 215 species. The species are categorized into groups of farmland, forestry and other birds. The following Figure 9 shows the development of bird species as an index figure from 2005-2013.
The figure documents the decline of species, which is especially the case for farmland birds. About 30% of the bird species are in a moderate or sharp decline. Only 10% of the species are stable, 7%
0% 5% 10% 15% 20% 25% 30%
M - Climate change
L - Geological events, natural catastrophes
K - Natural biotic and abiotic processes (without catastrophes)
J - Natural System modifications
I - Invasive, other problematic species and genes
H - Pollution
G - Human intrusions and disturbances
F - Biological resource use other than agriculture & forestry
E - Urbanisation, residential and commercial development
D - Transportation and service corridors
C - Mining, extraction of materials and energy production
B - Sylviculture, forestry
A - Agriculture
pressures (%) threats (%)
Fit, fair and sustainable: A model for a nature friendly and economically viable agricultural policy for Bulgaria
11
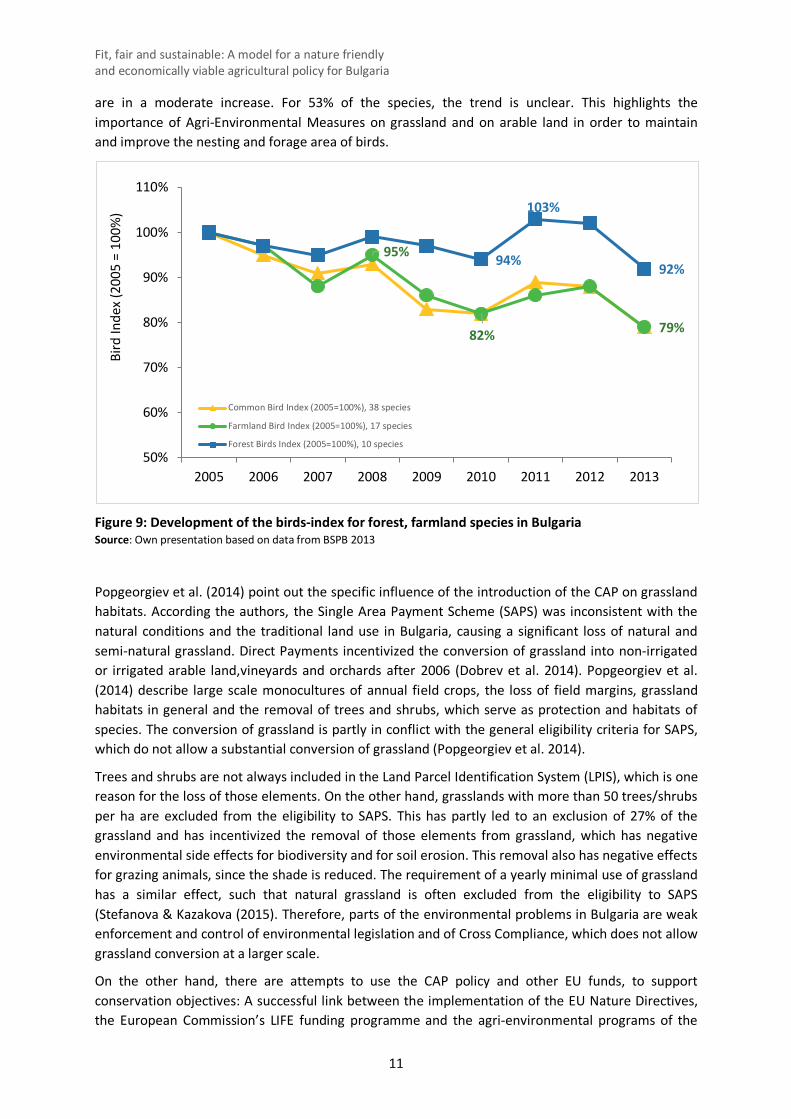
are in a moderate increase. For 53% of the species, the trend is unclear. This highlights the importance of Agri-Environmental Measures on grassland and on arable land in order to maintain and improve the nesting and forage area of birds.
Figure 9: Development of the birds-index for forest, farmland species in Bulgaria Source: Own presentation based on data from BSPB 2013
Popgeorgiev et al. (2014) point out the specific influence of the introduction of the CAP on grassland habitats. According the authors, the Single Area Payment Scheme (SAPS) was inconsistent with the natural conditions and the traditional land use in Bulgaria, causing a significant loss of natural and semi-natural grassland. Direct Payments incentivized the conversion of grassland into non-irrigated or irrigated arable land,vineyards and orchards after 2006 (Dobrev et al. 2014). Popgeorgiev et al. (2014) describe large scale monocultures of annual field crops, the loss of field margins, grassland habitats in general and the removal of trees and shrubs, which serve as protection and habitats of species. The conversion of grassland is partly in conflict with the general eligibility criteria for SAPS, which do not allow a substantial conversion of grassland (Popgeorgiev et al. 2014).
Trees and shrubs are not always included in the Land Parcel Identification System (LPIS), which is one reason for the loss of those elements. On the other hand, grasslands with more than 50 trees/shrubs per ha are excluded from the eligibility to SAPS. This has partly led to an exclusion of 27% of the grassland and has incentivized the removal of those elements from grassland, which has negative environmental side effects for biodiversity and for soil erosion. This removal also has negative effects for grazing animals, since the shade is reduced. The requirement of a yearly minimal use of grassland has a similar effect, such that natural grassland is often excluded from the eligibility to SAPS (Stefanova & Kazakova (2015). Therefore, parts of the environmental problems in Bulgaria are weak enforcement and control of environmental legislation and of Cross Compliance, which does not allow grassland conversion at a larger scale.
On the other hand, there are attempts to use the CAP policy and other EU funds, to support conservation objectives: A successful link between the implementation of the EU Nature Directives, the European Commission’s LIFE funding programme and the agri-environmental programs of the
95%
82% 79%
94%
103%
92%
50%
60%
70%
80%
90%
100%
110%
2005 2006 2007 2008 2009 2010 2011 2012 2013
Bird
Inde
x (2
005
= 10
0%)
Common Bird Index (2005=100%), 38 species
Farmland Bird Index (2005=100%), 17 species
Forest Birds Index (2005=100%), 10 species
Fit, fair and sustainable: A model for a nature friendly and economically viable agricultural policy for Bulgaria
12
CAP is a scheme to help conservation of the Red-breasted goose (Branta ruficollis) on arable land. 240 farmers applied to participate with 18.000 ha, financed with 1.8 Mio. EUR to support the wintering of this protected species (EC 2018b).
3 Background: The Common Agricultural Policy (CAP) in Bulgaria
3.1 The general instruments of the CAP in financial terms
Bulgaria became member of the European Union in 2007. As in other new EU member states, the support of the Common Agricultural Policy (CAP) was phased in over the period from 2007 to 2015. At the moment, there are three types of support applied in Bulgaria:
1) The measures of the so called I. Pillar, which consist of Direct Payments (DP) and market support and which are completely financed by the EU,
2) The rural development programs (RDP) of the so called II. Pillar, which are partly financed by the EU (80%) and partly by the Bulgarian government (20%) and
3) the Transitional National Payments, which are fully financed by the national government and which still play a minor role in the agricultural support.
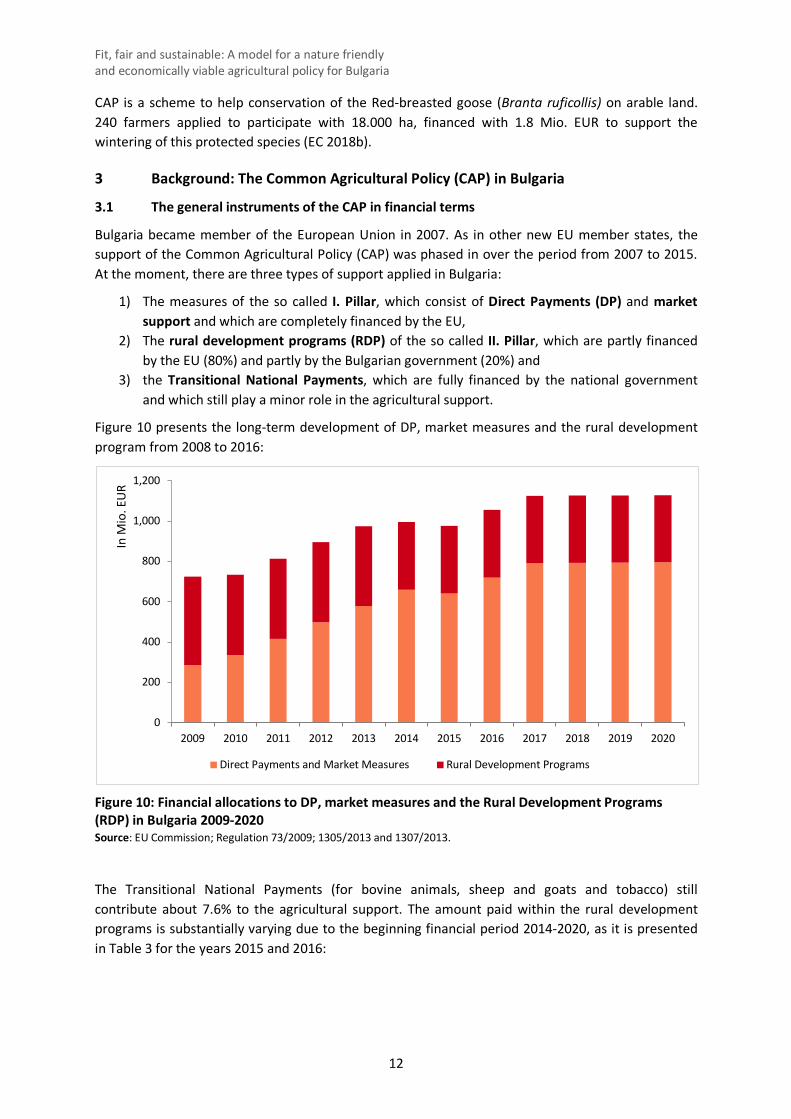
Figure 10 presents the long-term development of DP, market measures and the rural development program from 2008 to 2016:
Figure 10: Financial allocations to DP, market measures and the Rural Development Programs (RDP) in Bulgaria 2009-2020 Source: EU Commission; Regulation 73/2009; 1305/2013 and 1307/2013.
The Transitional National Payments (for bovine animals, sheep and goats and tobacco) still contribute about 7.6% to the agricultural support. The amount paid within the rural development programs is substantially varying due to the beginning financial period 2014-2020, as it is presented in Table 3 for the years 2015 and 2016:
0
200
400
600
800
1,000
1,200
2009 2010 2011 2012 2013 2014 2015 2016 2017 2018 2019 2020
In M
io. E
UR
Direct Payments and Market Measures Rural Development Programs
Fit, fair and sustainable: A model for a nature friendly and economically viable agricultural policy for Bulgaria
13
Table 3: The financial support of the CAP including the Transitional National Payments 2015/16
Payments 2015 Payments 2016
in Mio. EUR Share (%) in Mio. EUR Share (%)
I. Pillar: Direct Payments and market measures 1,189.51 88.1% 1,260,20 78.8% II. Pillar of rural development 18.57 1.4% 216,49 13.5% Total support of the CAP 1,208.08 1,476,69 Transitional National Payments 142.46 10.5% 122.11 7.6% Total agricultural support 1,350.54 1,598.80 Source: MARD; Agricultural Report 2016 and 2017
3.2 Implementation of Direct Payments (DP)2008-2016
The instruments of the I. Pillar have been changed within the last CAP-reform 2013, which added a number of new flexible instruments, on which the member states had to decide on. The CAP 2014-2020 introduced the following elements
- Greening - Redistributive payments - Support for young farmers - Support for small farmers - Voluntary coupled payments
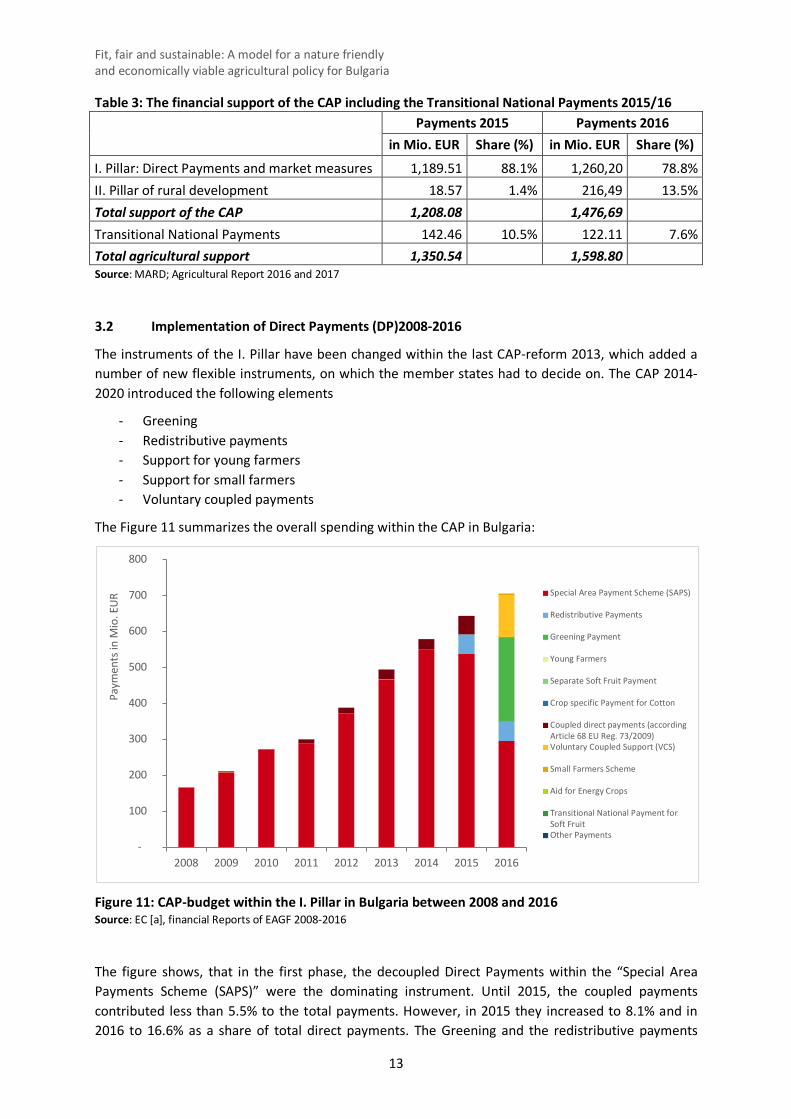
The Figure 11 summarizes the overall spending within the CAP in Bulgaria:
Figure 11: CAP-budget within the I. Pillar in Bulgaria between 2008 and 2016 Source: EC [a], financial Reports of EAGF 2008-2016
The figure shows, that in the first phase, the decoupled Direct Payments within the “Special Area Payments Scheme (SAPS)” were the dominating instrument. Until 2015, the coupled payments contributed less than 5.5% to the total payments. However, in 2015 they increased to 8.1% and in 2016 to 16.6% as a share of total direct payments. The Greening and the redistributive payments
-
100
200
300
400
500
600
700
800
2008 2009 2010 2011 2012 2013 2014 2015 2016
Paym
ents
in M
io. E
UR Special Area Payment Scheme (SAPS)
Redistributive Payments
Greening Payment
Young Farmers
Separate Soft Fruit Payment
Crop specific Payment for Cotton
Coupled direct payments (accordingArticle 68 EU Reg. 73/2009)Voluntary Coupled Support (VCS)
Small Farmers Scheme
Aid for Energy Crops
Transitional National Payment forSoft FruitOther Payments
Fit, fair and sustainable: A model for a nature friendly and economically viable agricultural policy for Bulgaria
14
changed the I. Pillar and thereby reduced the financial allocation to the decoupled DP (now basic payments), which were reduced from 158 EUR/ha in 2013 to 103 EUR/ha until 2016. In the following we will give a short overview on the measures implemented with the CAP-reform 2013.
3.2.1 Special Area Payment Scheme (SAPS) and basic payments
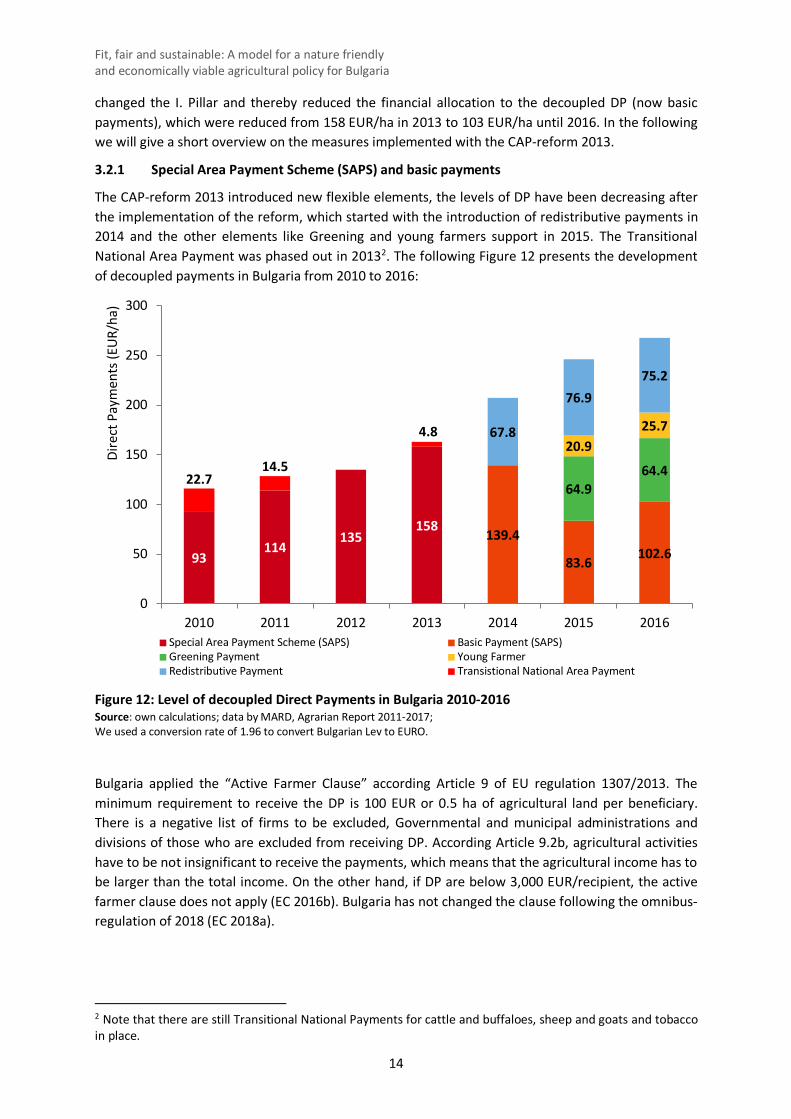
The CAP-reform 2013 introduced new flexible elements, the levels of DP have been decreasing after the implementation of the reform, which started with the introduction of redistributive payments in 2014 and the other elements like Greening and young farmers support in 2015. The Transitional National Area Payment was phased out in 20132. The following Figure 12 presents the development of decoupled payments in Bulgaria from 2010 to 2016:
Figure 12: Level of decoupled Direct Payments in Bulgaria 2010-2016 Source: own calculations; data by MARD, Agrarian Report 2011-2017; We used a conversion rate of 1.96 to convert Bulgarian Lev to EURO.
Bulgaria applied the “Active Farmer Clause” according Article 9 of EU regulation 1307/2013. The minimum requirement to receive the DP is 100 EUR or 0.5 ha of agricultural land per beneficiary. There is a negative list of firms to be excluded, Governmental and municipal administrations and divisions of those who are excluded from receiving DP. According Article 9.2b, agricultural activities have to be not insignificant to receive the payments, which means that the agricultural income has to be larger than the total income. On the other hand, if DP are below 3,000 EUR/recipient, the active farmer clause does not apply (EC 2016b). Bulgaria has not changed the clause following the omnibus-regulation of 2018 (EC 2018a).
2 Note that there are still Transitional National Payments for cattle and buffaloes, sheep and goats and tobacco in place.
93114
135158 139.4
83.6 102.6
64.964.4
20.925.767.8
76.975.2
22.714.5
4.8
0
50
100
150
200
250
300
2010 2011 2012 2013 2014 2015 2016
Dire
ct P
aym
ents
(EU
R/ha
)
Special Area Payment Scheme (SAPS) Basic Payment (SAPS)Greening Payment Young FarmerRedistributive Payment Transistional National Area Payment
Fit, fair and sustainable: A model for a nature friendly and economically viable agricultural policy for Bulgaria
15
3.2.2 Greening
Greening was implemented in 2015 with a unit Greening component of 65 EUR/ha. Farmers have to comply to crop diversification, the maintenance of sensitive grassland and farms larger than 30 ha have to provide 5% of their arable land to the ecological focus area (EFA).
• Crop diversification requires farms 10 -30 ha arable land, to have at least two crops and farms > 30 ha to produce at least three crops. The first crop shall not be more than 75% of the arable land and the first two crops shall not exceed 95% of the arable land. Farms with more than 75% permanent grassland or fodder production are exempted, if the remaining arable land is more than 30 ha.
• Maintenance of permanent grassland means that the share of permanent grassland shall not decrease more than 5% to the reference year 2012 and that environmentally sensitive grassland is protected.
• Ecological focus area (EFA) means that farms larger than 15 ha use 5% of their arable land for the ecological focus area. There are different options for the EFA with different weighting factors, which determine the net area contributing to EFA. Farms with high share of grassland or arable fodder production or fallow land or leguminous plants are exempted if the remaining arable land is lower than 30 ha.
The official “Greening-report” of the European Commission of 2016 provides a number of insights on the effectiveness of the Greening requirements in Bulgaria:
• Crop diversification: 90% of the arable land is subject to crop diversification. 10% of arable land is exempted from crop diversification since it is farmed by small farms <10 ha or due to high shares of grassland, field fodder production or fallow land (EC 2016: p.7).
• Maintenance of sensitive grassland: In Bulgaria about 29% of the permanent grassland is declared as “environmentally sensitive permanent grassland (ESPG)”, which are protected from the conversion to arable land. The average rate of ESPG is 16% within the EU. Bulgaria has also declared about 90% of their Natura 2000 grassland as ESPG, which also exceeds the EU-average of 40% (EC 2016c: Annex II: pp. 25-28). It should be noted, that Bulgaria is one of the few member states or regions with losses of permanent grassland larger than 10% within the period of 2007-2014 (EC 2016c: Annex II, p. 36). Substantial shares of the grassland habitats (with and without bushes) have been converted into non-irrigated and irrigated arable land from 2006-2010, which corresponds to a significant decrease in species abundance and richness on grassland habitats (Popgeorgiev et al. 2014).
• Ecological Focus Area (EFA): 90% of the arable land in Bulgaria is subject to the EFA requirement, which is a high share among MS. Bulgaria offered 14 EFA options (including options like terraces and ponds), which is above the EU-average, however not maximal as in Germany, France, Italy, Hungary and Romania, where 17/18 options are offered (EC 2016: Annex III; p.21). Again, farm size is the most important reason for an exemption of EFA (EC 2016: Annex II; p.37/38). Fallow land (ca. 62% after applying weighting factors) and nitrogen fixing crops (ca. 31%) are the most important chosen options. Due to the introduction of Greening, fallow land has doubled (+108%). Before the introduction of Greening, fallow land had a share of 2.7% to arable land, however it is unclear, how much area of fallow land was not registered within LPIS. The area of nitrogen fixing crops has increased by 596%, however starting from an extremely low level. Nowadays, fallow land and nitrogen fixing crops have a share to the total arable land of 5.5% and 1.0% respectively (MARD 2017). Within EFA, catch crops play a small role (ca. 3-4%), buffer strips (0.8%) and landscape elements have shares below 1% (EC 2016: Annex II: p.41).
Fit, fair and sustainable: A model for a nature friendly and economically viable agricultural policy for Bulgaria
16
3.2.3 Redistributive payments
Bulgaria combined a payment for the first hectares with capping. The Redistributive Payments were implemented in 2014 and paid for the first 30 hectares with an additional amount of 68€/ha (2014), 77 €/ha (15) and 75 €/ha (16). Additionally, Bulgaria reduced payments beyond 150,000 €/ha by 5% and applied capping for payments beyond 300,000 €/farm. Large farms were allowed to subtract their labour costs from the amount to be reduced (EC 2016c: pp. 10/21).
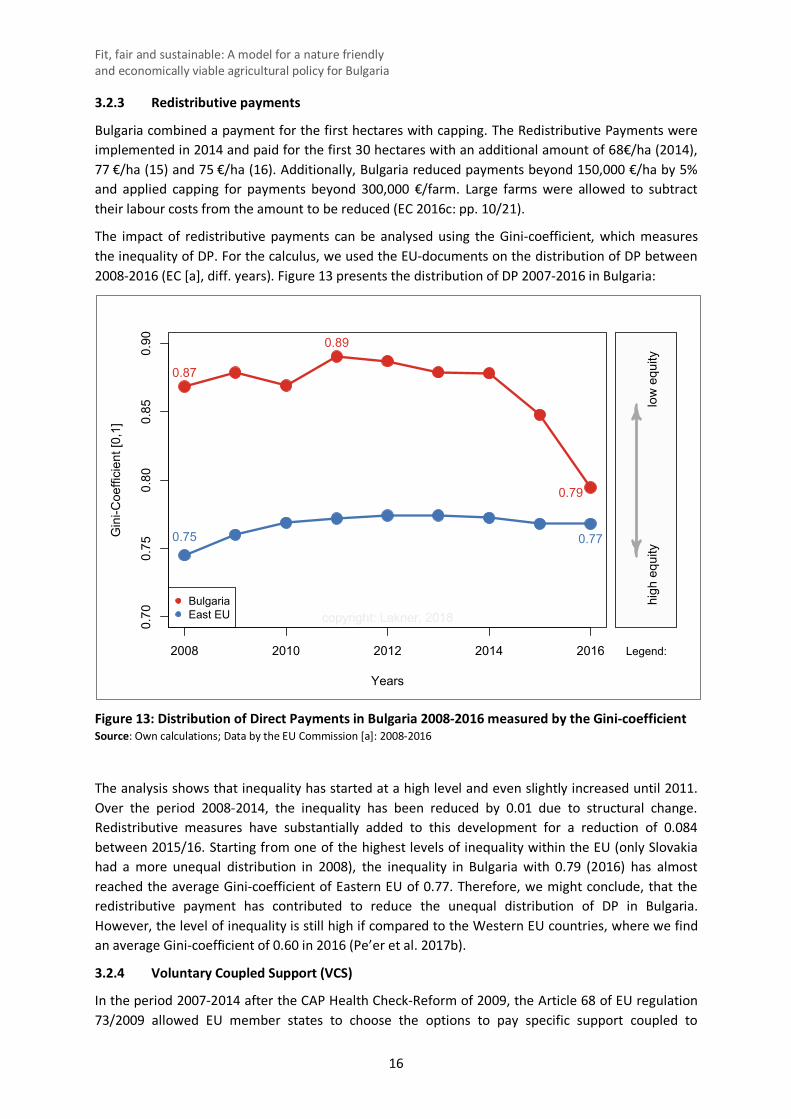
The impact of redistributive payments can be analysed using the Gini-coefficient, which measures the inequality of DP. For the calculus, we used the EU-documents on the distribution of DP between 2008-2016 (EC [a], diff. years). Figure 13 presents the distribution of DP 2007-2016 in Bulgaria:
Figure 13: Distribution of Direct Payments in Bulgaria 2008-2016 measured by the Gini-coefficient Source: Own calculations; Data by the EU Commission [a]: 2008-2016
The analysis shows that inequality has started at a high level and even slightly increased until 2011. Over the period 2008-2014, the inequality has been reduced by 0.01 due to structural change. Redistributive measures have substantially added to this development for a reduction of 0.084 between 2015/16. Starting from one of the highest levels of inequality within the EU (only Slovakia had a more unequal distribution in 2008), the inequality in Bulgaria with 0.79 (2016) has almost reached the average Gini-coefficient of Eastern EU of 0.77. Therefore, we might conclude, that the redistributive payment has contributed to reduce the unequal distribution of DP in Bulgaria. However, the level of inequality is still high if compared to the Western EU countries, where we find an average Gini-coefficient of 0.60 in 2016 (Pe’er et al. 2017b).
3.2.4 Voluntary Coupled Support (VCS)
In the period 2007-2014 after the CAP Health Check-Reform of 2009, the Article 68 of EU regulation 73/2009 allowed EU member states to choose the options to pay specific support coupled to
2008 2010 2012 2014 2016
0.70
0.75
0.80
0.85
0.90
Years
Gin
i-Coe
ffici
ent [
0,1]
low
equ
ityhi
gh e
quity
Legend:
0.87
0.75
0.89
0.79
0.77
BulgariaEast EU copyright: Lakner, 2018
Fit, fair and sustainable: A model for a nature friendly and economically viable agricultural policy for Bulgaria
17
production systems which were regarded as economically vulnerable sectors or markets. This was relevant for dairy, beef and veal, sheep meat and goat meat and the rice sectors. The specific allowance rules (See Appendix 3: Legal basis of coupled support in the CAP-reforms 2009 and 2013) was, that member states could use up to 10% of their national ceilings (Article 69), however, during the years 2009-2014, these payments were below 5.5% of the total CAP-budget in Bulgaria.
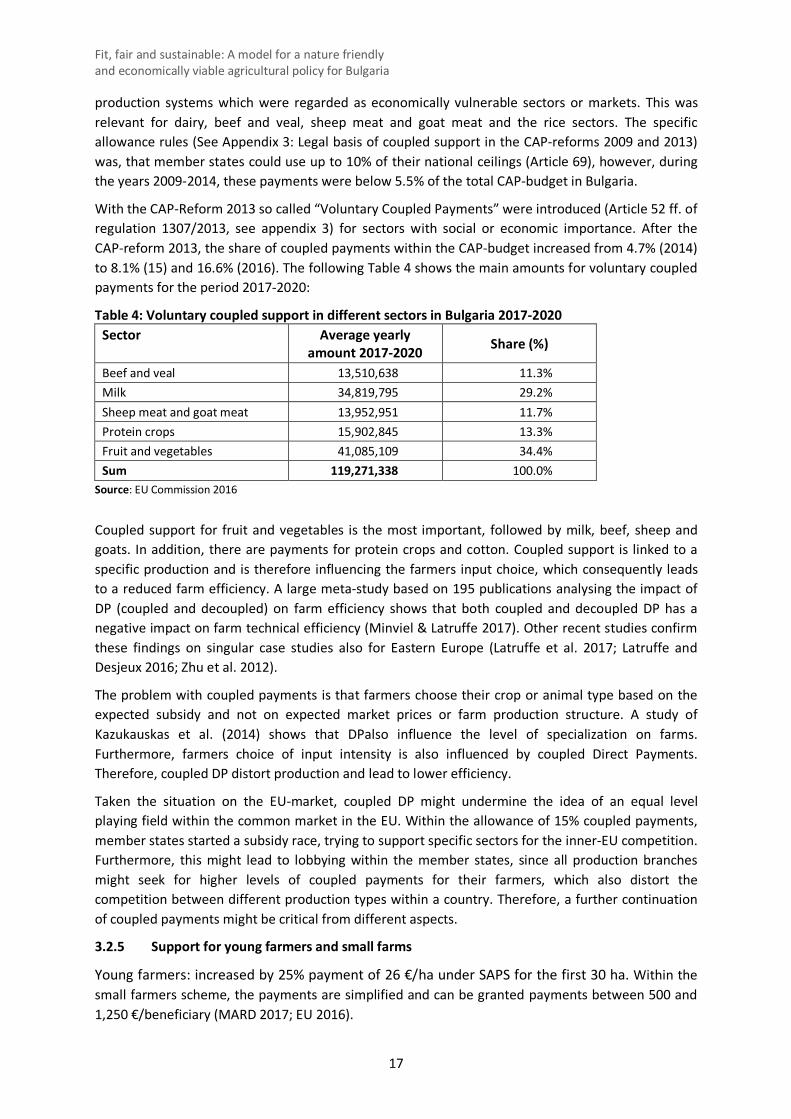
With the CAP-Reform 2013 so called “Voluntary Coupled Payments” were introduced (Article 52 ff. of regulation 1307/2013, see appendix 3) for sectors with social or economic importance. After the CAP-reform 2013, the share of coupled payments within the CAP-budget increased from 4.7% (2014) to 8.1% (15) and 16.6% (2016). The following Table 4 shows the main amounts for voluntary coupled payments for the period 2017-2020:
Table 4: Voluntary coupled support in different sectors in Bulgaria 2017-2020 Sector Average yearly
amount 2017-2020 Share (%)
Beef and veal 13,510,638 11.3% Milk 34,819,795 29.2% Sheep meat and goat meat 13,952,951 11.7% Protein crops 15,902,845 13.3% Fruit and vegetables 41,085,109 34.4% Sum 119,271,338 100.0%
Source: EU Commission 2016
Coupled support for fruit and vegetables is the most important, followed by milk, beef, sheep and goats. In addition, there are payments for protein crops and cotton. Coupled support is linked to a specific production and is therefore influencing the farmers input choice, which consequently leads to a reduced farm efficiency. A large meta-study based on 195 publications analysing the impact of DP (coupled and decoupled) on farm efficiency shows that both coupled and decoupled DP has a negative impact on farm technical efficiency (Minviel & Latruffe 2017). Other recent studies confirm these findings on singular case studies also for Eastern Europe (Latruffe et al. 2017; Latruffe and Desjeux 2016; Zhu et al. 2012).
The problem with coupled payments is that farmers choose their crop or animal type based on the expected subsidy and not on expected market prices or farm production structure. A study of Kazukauskas et al. (2014) shows that DPalso influence the level of specialization on farms. Furthermore, farmers choice of input intensity is also influenced by coupled Direct Payments. Therefore, coupled DP distort production and lead to lower efficiency.
Taken the situation on the EU-market, coupled DP might undermine the idea of an equal level playing field within the common market in the EU. Within the allowance of 15% coupled payments, member states started a subsidy race, trying to support specific sectors for the inner-EU competition. Furthermore, this might lead to lobbying within the member states, since all production branches might seek for higher levels of coupled payments for their farmers, which also distort the competition between different production types within a country. Therefore, a further continuation of coupled payments might be critical from different aspects.
3.2.5 Support for young farmers and small farms
Young farmers: increased by 25% payment of 26 €/ha under SAPS for the first 30 ha. Within the small farmers scheme, the payments are simplified and can be granted payments between 500 and 1,250 €/beneficiary (MARD 2017; EU 2016).
Fit, fair and sustainable: A model for a nature friendly and economically viable agricultural policy for Bulgaria
18
3.2.6 The Rural Development Programs (Pillar II)
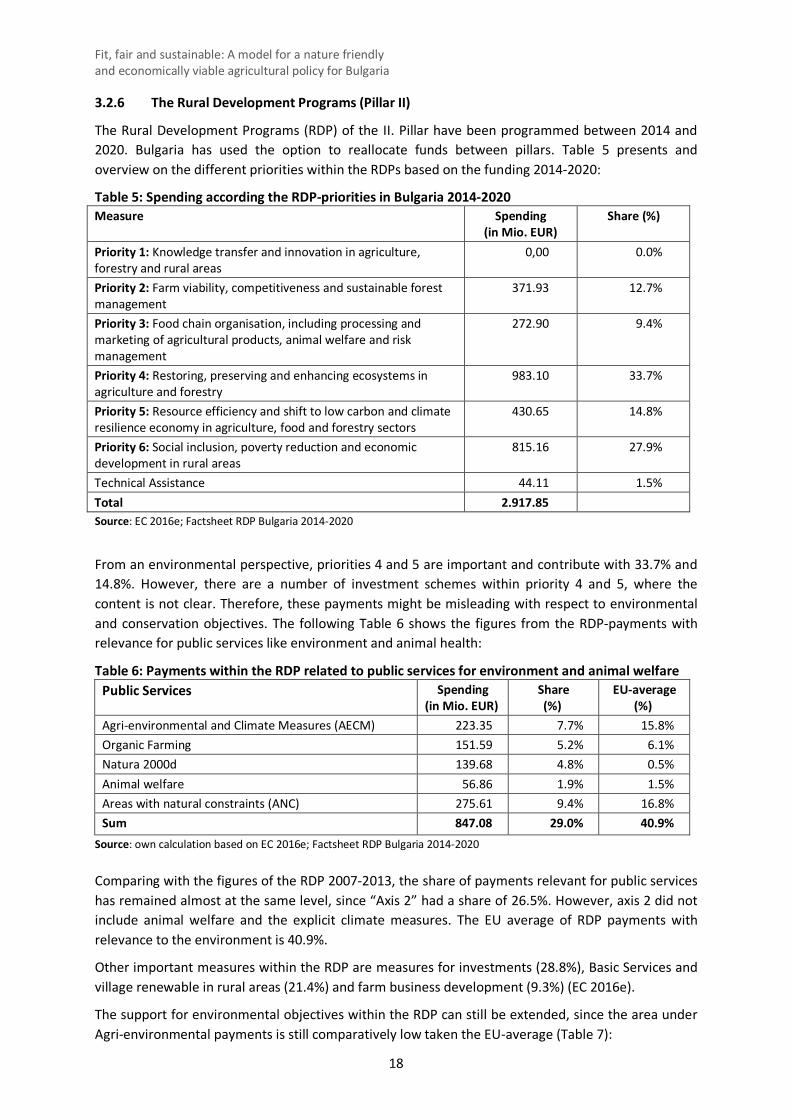
The Rural Development Programs (RDP) of the II. Pillar have been programmed between 2014 and 2020. Bulgaria has used the option to reallocate funds between pillars. Table 5 presents and overview on the different priorities within the RDPs based on the funding 2014-2020:
Table 5: Spending according the RDP-priorities in Bulgaria 2014-2020 Measure Spending
(in Mio. EUR) Share (%)
Priority 1: Knowledge transfer and innovation in agriculture, forestry and rural areas
0,00 0.0%
Priority 2: Farm viability, competitiveness and sustainable forest management
371.93 12.7%
Priority 3: Food chain organisation, including processing and marketing of agricultural products, animal welfare and risk management
272.90 9.4%
Priority 4: Restoring, preserving and enhancing ecosystems in agriculture and forestry
983.10 33.7%
Priority 5: Resource efficiency and shift to low carbon and climate resilience economy in agriculture, food and forestry sectors
430.65 14.8%
Priority 6: Social inclusion, poverty reduction and economic development in rural areas
815.16 27.9%
Technical Assistance 44.11 1.5% Total 2.917.85 Source: EC 2016e; Factsheet RDP Bulgaria 2014-2020
From an environmental perspective, priorities 4 and 5 are important and contribute with 33.7% and 14.8%. However, there are a number of investment schemes within priority 4 and 5, where the content is not clear. Therefore, these payments might be misleading with respect to environmental and conservation objectives. The following Table 6 shows the figures from the RDP-payments with relevance for public services like environment and animal health:
Table 6: Payments within the RDP related to public services for environment and animal welfare Public Services Spending
(in Mio. EUR) Share (%)
EU-average (%)
Agri-environmental and Climate Measures (AECM) 223.35 7.7% 15.8% Organic Farming 151.59 5.2% 6.1% Natura 2000d 139.68 4.8% 0.5% Animal welfare 56.86 1.9% 1.5% Areas with natural constraints (ANC) 275.61 9.4% 16.8% Sum 847.08 29.0% 40.9%
Source: own calculation based on EC 2016e; Factsheet RDP Bulgaria 2014-2020
Comparing with the figures of the RDP 2007-2013, the share of payments relevant for public services has remained almost at the same level, since “Axis 2” had a share of 26.5%. However, axis 2 did not include animal welfare and the explicit climate measures. The EU average of RDP payments with relevance to the environment is 40.9%.
Other important measures within the RDP are measures for investments (28.8%), Basic Services and village renewable in rural areas (21.4%) and farm business development (9.3%) (EC 2016e).
The support for environmental objectives within the RDP can still be extended, since the area under Agri-environmental payments is still comparatively low taken the EU-average (Table 7):
Fit, fair and sustainable: A model for a nature friendly and economically viable agricultural policy for Bulgaria
19
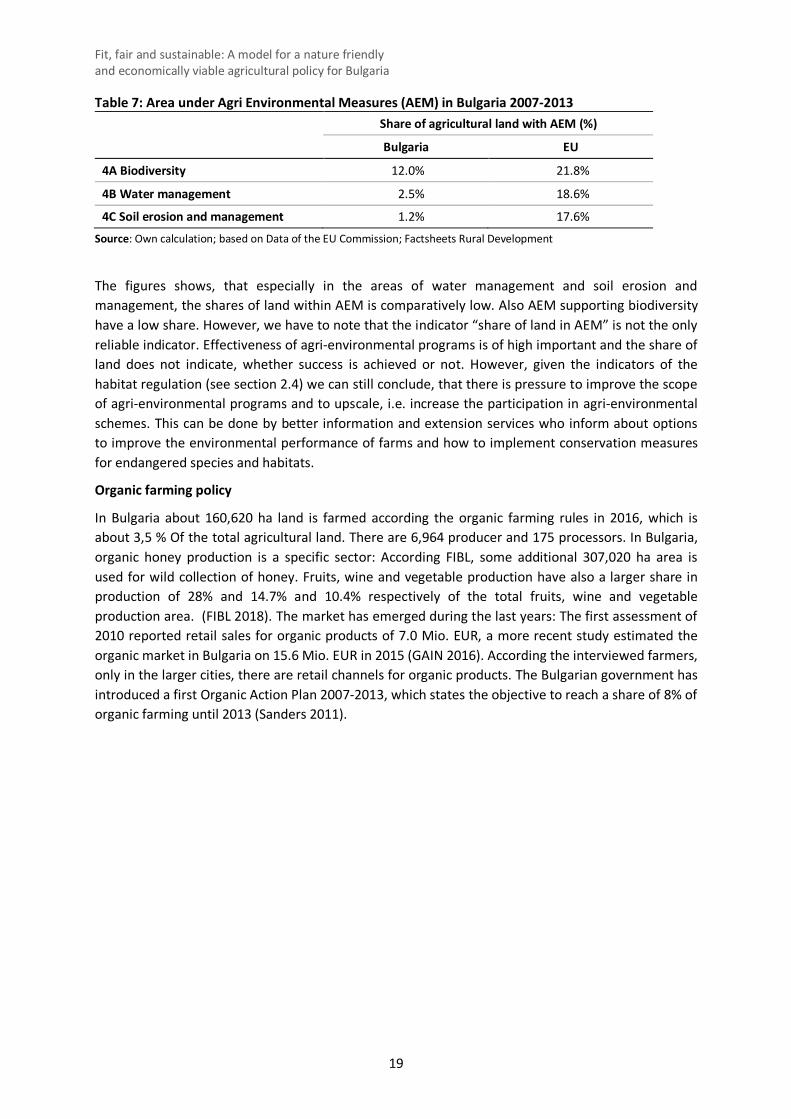
Table 7: Area under Agri Environmental Measures (AEM) in Bulgaria 2007-2013 Share of agricultural land with AEM (%)
Bulgaria EU
4A Biodiversity 12.0% 21.8%
4B Water management 2.5% 18.6%
4C Soil erosion and management 1.2% 17.6%
Source: Own calculation; based on Data of the EU Commission; Factsheets Rural Development
The figures shows, that especially in the areas of water management and soil erosion and management, the shares of land within AEM is comparatively low. Also AEM supporting biodiversity have a low share. However, we have to note that the indicator “share of land in AEM” is not the only reliable indicator. Effectiveness of agri-environmental programs is of high important and the share of land does not indicate, whether success is achieved or not. However, given the indicators of the habitat regulation (see section 2.4) we can still conclude, that there is pressure to improve the scope of agri-environmental programs and to upscale, i.e. increase the participation in agri-environmental schemes. This can be done by better information and extension services who inform about options to improve the environmental performance of farms and how to implement conservation measures for endangered species and habitats.
Organic farming policy
In Bulgaria about 160,620 ha land is farmed according the organic farming rules in 2016, which is about 3,5 % Of the total agricultural land. There are 6,964 producer and 175 processors. In Bulgaria, organic honey production is a specific sector: According FIBL, some additional 307,020 ha area is used for wild collection of honey. Fruits, wine and vegetable production have also a larger share in production of 28% and 14.7% and 10.4% respectively of the total fruits, wine and vegetable production area. (FIBL 2018). The market has emerged during the last years: The first assessment of 2010 reported retail sales for organic products of 7.0 Mio. EUR, a more recent study estimated the organic market in Bulgaria on 15.6 Mio. EUR in 2015 (GAIN 2016). According the interviewed farmers, only in the larger cities, there are retail channels for organic products. The Bulgarian government has introduced a first Organic Action Plan 2007-2013, which states the objective to reach a share of 8% of organic farming until 2013 (Sanders 2011).
Fit, fair and sustainable: A model for a nature friendly and economically viable agricultural policy for Bulgaria
20
3.3 Transitional National Payments
In the first years of the introduction of the CAP, Bulgaria was granted the option to use Transitional National Payments for farmers, in order to compensate for the lower levels of Direct Payments in the first years of the CAP. During the first years, this was relevant for the soft fruit sector (producers of strawberries and raspberries for processing) in 2008-2011 as coupled payments and 2012-2013 decoupled. Additionally, energy crops were supported (2007-2009) (Karchanova 2012). Bulgaria also paid additional decoupled area payments.
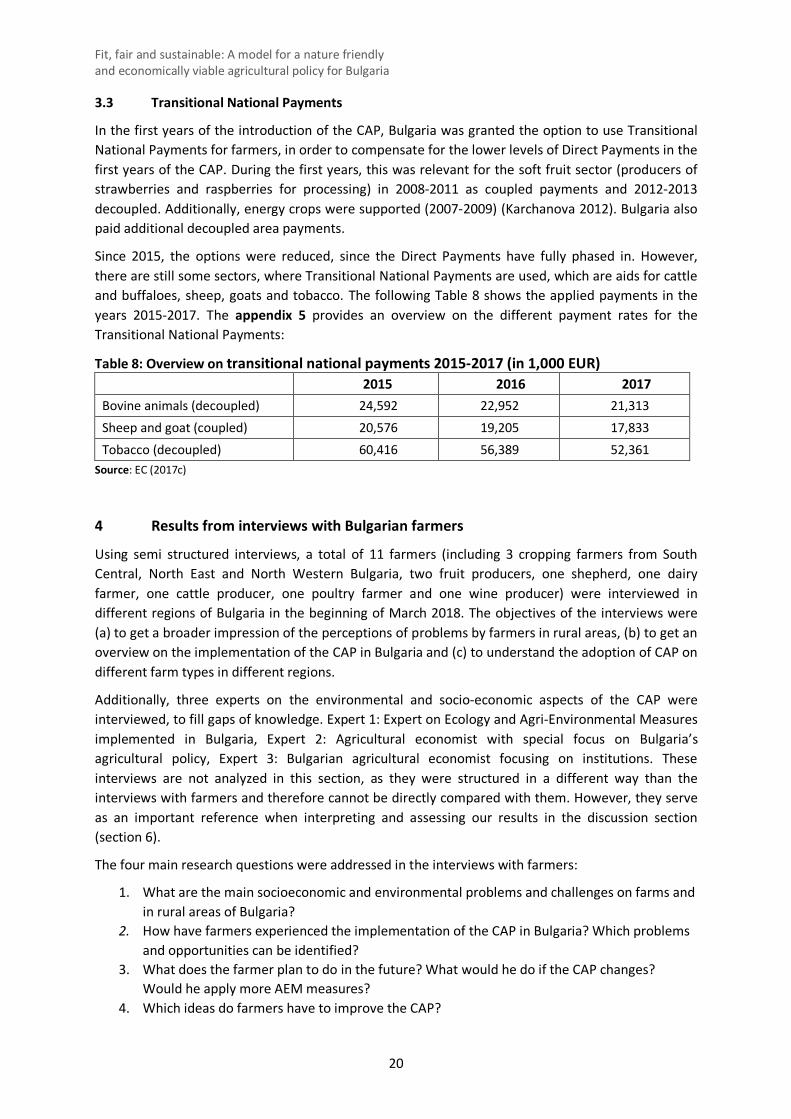
Since 2015, the options were reduced, since the Direct Payments have fully phased in. However, there are still some sectors, where Transitional National Payments are used, which are aids for cattle and buffaloes, sheep, goats and tobacco. The following Table 8 shows the applied payments in the years 2015-2017. The appendix 5 provides an overview on the different payment rates for the Transitional National Payments:
Table 8: Overview on transitional national payments 2015-2017 (in 1,000 EUR)
2015 2016 2017 Bovine animals (decoupled) 24,592 22,952 21,313 Sheep and goat (coupled) 20,576 19,205 17,833 Tobacco (decoupled) 60,416 56,389 52,361
Source: EC (2017c)
4 Results from interviews with Bulgarian farmers
Using semi structured interviews, a total of 11 farmers (including 3 cropping farmers from South Central, North East and North Western Bulgaria, two fruit producers, one shepherd, one dairy farmer, one cattle producer, one poultry farmer and one wine producer) were interviewed in different regions of Bulgaria in the beginning of March 2018. The objectives of the interviews were (a) to get a broader impression of the perceptions of problems by farmers in rural areas, (b) to get an overview on the implementation of the CAP in Bulgaria and (c) to understand the adoption of CAP on different farm types in different regions.
Additionally, three experts on the environmental and socio-economic aspects of the CAP were interviewed, to fill gaps of knowledge. Expert 1: Expert on Ecology and Agri-Environmental Measures implemented in Bulgaria, Expert 2: Agricultural economist with special focus on Bulgaria’s agricultural policy, Expert 3: Bulgarian agricultural economist focusing on institutions. These interviews are not analyzed in this section, as they were structured in a different way than the interviews with farmers and therefore cannot be directly compared with them. However, they serve as an important reference when interpreting and assessing our results in the discussion section (section 6).
The four main research questions were addressed in the interviews with farmers:
1. What are the main socioeconomic and environmental problems and challenges on farms and in rural areas of Bulgaria?
2. How have farmers experienced the implementation of the CAP in Bulgaria? Which problems and opportunities can be identified?
3. What does the farmer plan to do in the future? What would he do if the CAP changes? Would he apply more AEM measures?
4. Which ideas do farmers have to improve the CAP?
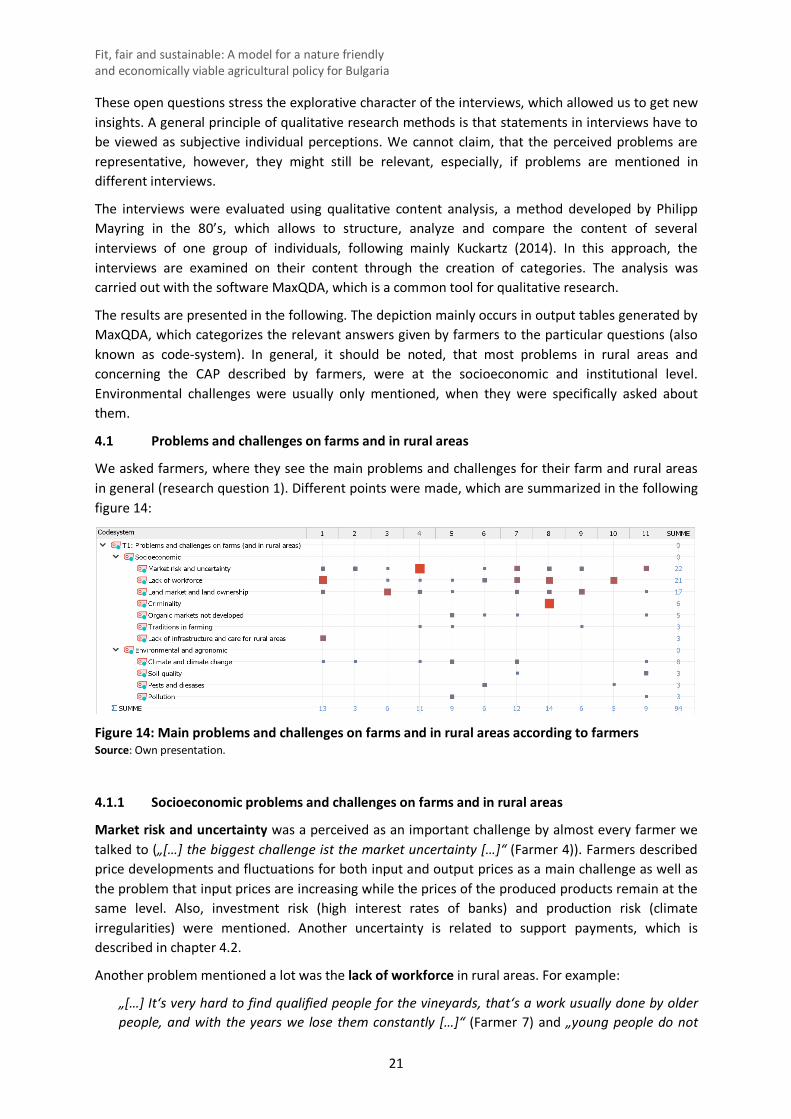
Fit, fair and sustainable: A model for a nature friendly and economically viable agricultural policy for Bulgaria
21
These open questions stress the explorative character of the interviews, which allowed us to get new insights. A general principle of qualitative research methods is that statements in interviews have to be viewed as subjective individual perceptions. We cannot claim, that the perceived problems are representative, however, they might still be relevant, especially, if problems are mentioned in different interviews.
The interviews were evaluated using qualitative content analysis, a method developed by Philipp Mayring in the 80’s, which allows to structure, analyze and compare the content of several interviews of one group of individuals, following mainly Kuckartz (2014). In this approach, the interviews are examined on their content through the creation of categories. The analysis was carried out with the software MaxQDA, which is a common tool for qualitative research.
The results are presented in the following. The depiction mainly occurs in output tables generated by MaxQDA, which categorizes the relevant answers given by farmers to the particular questions (also known as code-system). In general, it should be noted, that most problems in rural areas and concerning the CAP described by farmers, were at the socioeconomic and institutional level. Environmental challenges were usually only mentioned, when they were specifically asked about them.
4.1 Problems and challenges on farms and in rural areas
We asked farmers, where they see the main problems and challenges for their farm and rural areas in general (research question 1). Different points were made, which are summarized in the following figure 14:
Figure 14: Main problems and challenges on farms and in rural areas according to farmers Source: Own presentation.
4.1.1 Socioeconomic problems and challenges on farms and in rural areas
Market risk and uncertainty was a perceived as an important challenge by almost every farmer we talked to („[…] the biggest challenge ist the market uncertainty […]“ (Farmer 4)). Farmers described price developments and fluctuations for both input and output prices as a main challenge as well as the problem that input prices are increasing while the prices of the produced products remain at the same level. Also, investment risk (high interest rates of banks) and production risk (climate irregularities) were mentioned. Another uncertainty is related to support payments, which is described in chapter 4.2.
Another problem mentioned a lot was the lack of workforce in rural areas. For example:
„[…] It‘s very hard to find qualified people for the vineyards, that‘s a work usually done by older people, and with the years we lose them constantly […]“ (Farmer 7) and „young people do not
Fit, fair and sustainable: A model for a nature friendly and economically viable agricultural policy for Bulgaria
22
want to work in the rural areas in the villages… they prefer the city […] the principle in Bulgaria is just to get a good education and escape the village“ (Farmer 10)
This can be summarized in the main statements:
• It is difficult to find employees, especially young and qualified ones • Rural areas are not attractive • Migration of young people to cities • People do not like to work in farming
Reasons for people to leave rural areas might be caused by the negative image of rural areas and towards farmers which still exists in Bulgarian society and which was also mentioned several times. Furthermore, one farmer criticized the lack of infrastructure and care for rural areas. Different problems related to the land market and land ownership in Bulgaria were mentioned, for example the structure of land ownership: “[…] the land is owned by many people so sometimes it is very difficult to cultivate something because there is some owner who disagrees to offer his land […] if you want to use the whole block [field] you may not be able to plant something […]” (Farmer 11).
Many of the statements related to this topic were also closely related to the EU accession and therefore these problems will be discussed in chapter 4.2.
Criminality and a lack of justice in rural North West Bulgaria was described by one farmer. After being asked for examples, he explained that it is a common thing to happen, that crops are stolen (harvested) from the fields and in his point of view, and delinquents are not detected in most of the cases.
For organic farmers or those who are interested in obtaining the organic certification, it is a problem that the markets for organic and high quality products are not yet well developed in Bulgaria, neither for inputs such as fodder, nor for the outputs. Only in the cities where people have more financial resources, a small market exists for organic products.
The lack of traditions in farming in Bulgaria and the difference to Western European countries was mentioned by several farmers as well: Since land was owned by the State for many years the traditions were broken.
4.1.2 Environmental and agronomic problems
Several farmers realized a changing climate and talked about this when asked about environmental problems: “ The climate, yes, it’s getting warmer and warmer […] very big extremities, we almost lost the four seasons” (Farmer 7). The main problems are droughts and more frequent occurrence of extreme rainfalls, as well as unusual temperatures. Low soil quality and the problem of soil erosion were mentioned as challenges: “[…] the soil is weak here and we have drought and the cultivation sometimes is destroyed because of the dry periods, if you don’t apply additional measures to support the cultivation […] the production is really low because the fruits don’t grow… (Farmer 11).
Pests and diseases were only mentioned by two farmers. Another problem mentioned by organic farmers was the risk of pollution through neighboring farms.
4.2 Perceived changes in agriculture since introduction of CAP in 2007
We asked farmers, if they felt any changes since the CAP was introduced in Bulgaria in 2007. These were classified in opportunities and challenges or problems that farmers perceived with regard to the agricultural policy.
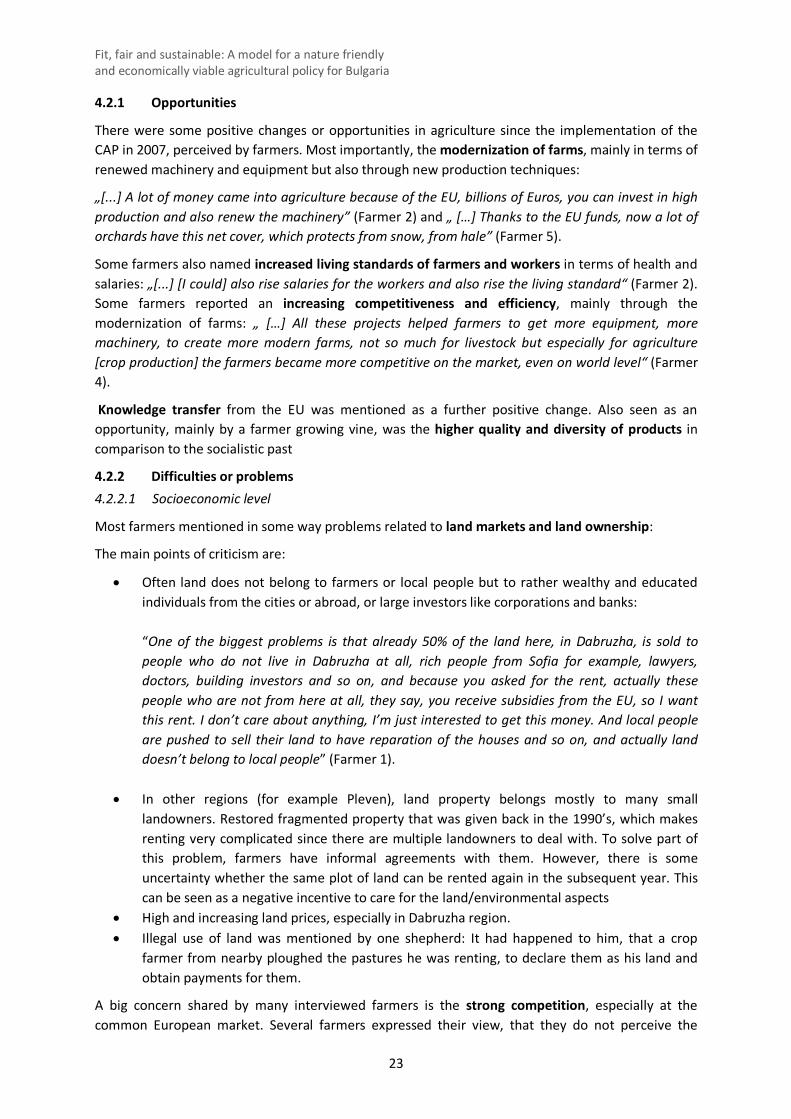
Fit, fair and sustainable: A model for a nature friendly and economically viable agricultural policy for Bulgaria
23
4.2.1 Opportunities
There were some positive changes or opportunities in agriculture since the implementation of the CAP in 2007, perceived by farmers. Most importantly, the modernization of farms, mainly in terms of renewed machinery and equipment but also through new production techniques:
„[...] A lot of money came into agriculture because of the EU, billions of Euros, you can invest in high production and also renew the machinery” (Farmer 2) and „ […] Thanks to the EU funds, now a lot of orchards have this net cover, which protects from snow, from hale” (Farmer 5).
Some farmers also named increased living standards of farmers and workers in terms of health and salaries: „[...] [I could] also rise salaries for the workers and also rise the living standard“ (Farmer 2). Some farmers reported an increasing competitiveness and efficiency, mainly through the modernization of farms: „ […] All these projects helped farmers to get more equipment, more machinery, to create more modern farms, not so much for livestock but especially for agriculture [crop production] the farmers became more competitive on the market, even on world level“ (Farmer 4).
Knowledge transfer from the EU was mentioned as a further positive change. Also seen as an opportunity, mainly by a farmer growing vine, was the higher quality and diversity of products in comparison to the socialistic past
4.2.2 Difficulties or problems 4.2.2.1 Socioeconomic level
Most farmers mentioned in some way problems related to land markets and land ownership:
The main points of criticism are:
• Often land does not belong to farmers or local people but to rather wealthy and educated individuals from the cities or abroad, or large investors like corporations and banks:
“One of the biggest problems is that already 50% of the land here, in Dabruzha, is sold to people who do not live in Dabruzha at all, rich people from Sofia for example, lawyers, doctors, building investors and so on, and because you asked for the rent, actually these people who are not from here at all, they say, you receive subsidies from the EU, so I want this rent. I don’t care about anything, I’m just interested to get this money. And local people are pushed to sell their land to have reparation of the houses and so on, and actually land doesn’t belong to local people” (Farmer 1).
• In other regions (for example Pleven), land property belongs mostly to many small
landowners. Restored fragmented property that was given back in the 1990’s, which makes renting very complicated since there are multiple landowners to deal with. To solve part of this problem, farmers have informal agreements with them. However, there is some uncertainty whether the same plot of land can be rented again in the subsequent year. This can be seen as a negative incentive to care for the land/environmental aspects
• High and increasing land prices, especially in Dabruzha region. • Illegal use of land was mentioned by one shepherd: It had happened to him, that a crop
farmer from nearby ploughed the pastures he was renting, to declare them as his land and obtain payments for them.
A big concern shared by many interviewed farmers is the strong competition, especially at the common European market. Several farmers expressed their view, that they do not perceive the
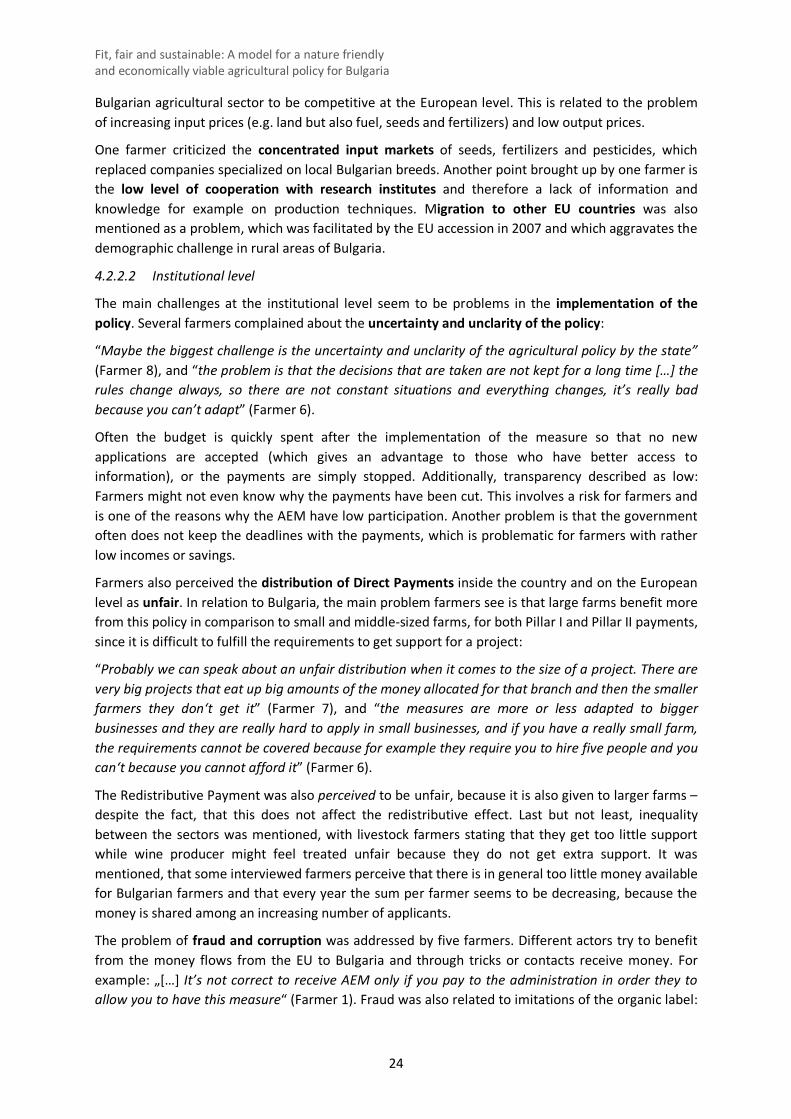
Fit, fair and sustainable: A model for a nature friendly and economically viable agricultural policy for Bulgaria
24
Bulgarian agricultural sector to be competitive at the European level. This is related to the problem of increasing input prices (e.g. land but also fuel, seeds and fertilizers) and low output prices.
One farmer criticized the concentrated input markets of seeds, fertilizers and pesticides, which replaced companies specialized on local Bulgarian breeds. Another point brought up by one farmer is the low level of cooperation with research institutes and therefore a lack of information and knowledge for example on production techniques. Migration to other EU countries was also mentioned as a problem, which was facilitated by the EU accession in 2007 and which aggravates the demographic challenge in rural areas of Bulgaria.
4.2.2.2 Institutional level
The main challenges at the institutional level seem to be problems in the implementation of the policy. Several farmers complained about the uncertainty and unclarity of the policy:
“Maybe the biggest challenge is the uncertainty and unclarity of the agricultural policy by the state” (Farmer 8), and “the problem is that the decisions that are taken are not kept for a long time […] the rules change always, so there are not constant situations and everything changes, it’s really bad because you can’t adapt” (Farmer 6).
Often the budget is quickly spent after the implementation of the measure so that no new applications are accepted (which gives an advantage to those who have better access to information), or the payments are simply stopped. Additionally, transparency described as low: Farmers might not even know why the payments have been cut. This involves a risk for farmers and is one of the reasons why the AEM have low participation. Another problem is that the government often does not keep the deadlines with the payments, which is problematic for farmers with rather low incomes or savings.
Farmers also perceived the distribution of Direct Payments inside the country and on the European level as unfair. In relation to Bulgaria, the main problem farmers see is that large farms benefit more from this policy in comparison to small and middle-sized farms, for both Pillar I and Pillar II payments, since it is difficult to fulfill the requirements to get support for a project:
“Probably we can speak about an unfair distribution when it comes to the size of a project. There are very big projects that eat up big amounts of the money allocated for that branch and then the smaller farmers they don‘t get it” (Farmer 7), and “the measures are more or less adapted to bigger businesses and they are really hard to apply in small businesses, and if you have a really small farm, the requirements cannot be covered because for example they require you to hire five people and you can‘t because you cannot afford it” (Farmer 6).
The Redistributive Payment was also perceived to be unfair, because it is also given to larger farms – despite the fact, that this does not affect the redistributive effect. Last but not least, inequality between the sectors was mentioned, with livestock farmers stating that they get too little support while wine producer might feel treated unfair because they do not get extra support. It was mentioned, that some interviewed farmers perceive that there is in general too little money available for Bulgarian farmers and that every year the sum per farmer seems to be decreasing, because the money is shared among an increasing number of applicants.
The problem of fraud and corruption was addressed by five farmers. Different actors try to benefit from the money flows from the EU to Bulgaria and through tricks or contacts receive money. For example: „[…] It’s not correct to receive AEM only if you pay to the administration in order they to allow you to have this measure“ (Farmer 1). Fraud was also related to imitations of the organic label:
Fit, fair and sustainable: A model for a nature friendly and economically viable agricultural policy for Bulgaria
25
“Actually recently, the label of organic became used more, but in a fake way, an imitation” (Farmer 5).
Note that these statements are perceptions and it is not clear to what extent these observations are true or not. Still, it is important to acknowledge, that farmers perceive the CAP-system as fraudulent.
The strong EU regulations and restrictions were criticized by two farmers, especially with regard to small farmers who are not able to keep them and fall out of the legal market and are not able to get subsidies.
Farmers stated that the administrative burden is still too high, even if one farmer also indicated improvements.
Figure 15: Problems and opportunities resulting from the CAP described by farmers Source: own presentation.
4.2.2.3 Environmental and agronomic level
The main problem at the environmental level is the mismanagement of pastures which has been favored by the AEM for restoration of pastures. Farmers complain that they have to cut too many bushes and trees, which favors soil erosion in the mountainous areas and a lack of shadow for the animals in summer:
“It’s best to not push them [farmers] to clear the bushes and the trees from the pastures because here there are not so many and important to stay […] On any place where they cut the bushes or trees, all the soil is going down” (Farmer 9).
Another problem mentioned was that local breeds are not being used and sold anymore. After EU accession, most people were more interested in the western high yielding varieties and the local breeding companies got bankrupted. This was different for the wine sector, where there seems to be a trend back to the old local varieties, which were used before the communistic time of the country.
One poultry producer was complaining that there is no difference in payments if chicken are raised freely, even if this is a higher animal welfare standard.
Fit, fair and sustainable: A model for a nature friendly and economically viable agricultural policy for Bulgaria
26
4.3 Plans for the future and stated behavior if CAP changes
In T3 a, the farmers were asked for their plans for the future on the farm. The vast majority stated that they plan to expand, most of them by investing in new machinery, equipment, farm infrastructure, buildings or land, but also in terms of diversification of products, accessing new markets and an increased quality: „We want to produce more quality production, production for direct consumption, but also processed products, we want to expand“ (Farmer 5).
Some farmers also expressed their wish to increase efficiency and competitiveness on the market: “They want to keep it like it is now, as a scale, but increase the crop production, the efficiency” (Farmer 2).
Figure 16: Farm development and farmer’s stated behaviour if CAP changes Source: own presentation.
Four farmers mentioned that their development in the future depends on the support payments. This fits well to the picture we get from the subsequent question (T3 b in figure 16), where farmers were asked what they thought of an abolishment of the CAP. Some explained, that support payments for the agricultural sector are absolutely necessary but at the same time, most of them would continue their farm without support, but some probably at a smaller scale.
In T3 c, we wanted to understand farmers attitudes towards different suggested AEM and if they could imagine to adopt them on their farm. The results are shown in table 9.
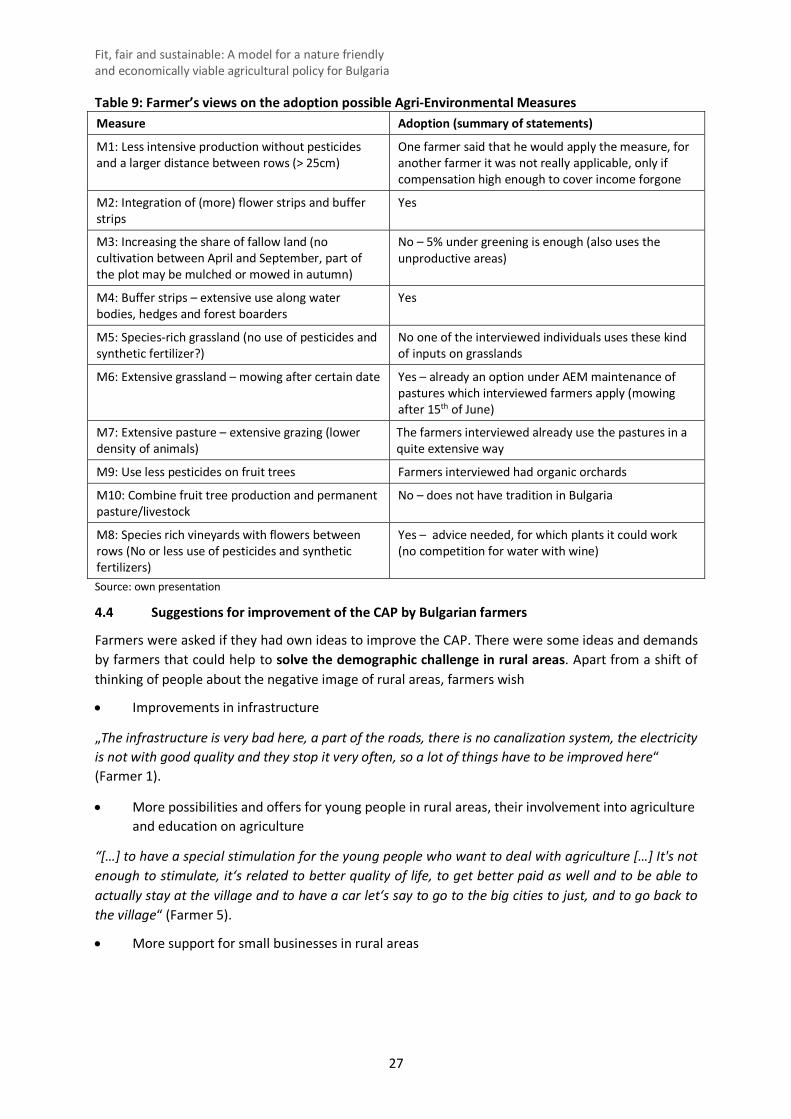
Fit, fair and sustainable: A model for a nature friendly and economically viable agricultural policy for Bulgaria
27
Table 9: Farmer’s views on the adoption possible Agri-Environmental Measures Measure Adoption (summary of statements)
M1: Less intensive production without pesticides and a larger distance between rows (> 25cm)
One farmer said that he would apply the measure, for another farmer it was not really applicable, only if compensation high enough to cover income forgone
M2: Integration of (more) flower strips and buffer strips
Yes
M3: Increasing the share of fallow land (no cultivation between April and September, part of the plot may be mulched or mowed in autumn)
No – 5% under greening is enough (also uses the unproductive areas)
M4: Buffer strips – extensive use along water bodies, hedges and forest boarders
Yes
M5: Species-rich grassland (no use of pesticides and synthetic fertilizer?)
No one of the interviewed individuals uses these kind of inputs on grasslands
M6: Extensive grassland – mowing after certain date Yes – already an option under AEM maintenance of pastures which interviewed farmers apply (mowing after 15th of June)
M7: Extensive pasture – extensive grazing (lower density of animals)
The farmers interviewed already use the pastures in a quite extensive way
M9: Use less pesticides on fruit trees Farmers interviewed had organic orchards
M10: Combine fruit tree production and permanent pasture/livestock
No – does not have tradition in Bulgaria
M8: Species rich vineyards with flowers between rows (No or less use of pesticides and synthetic fertilizers)
Yes – advice needed, for which plants it could work (no competition for water with wine)
Source: own presentation
4.4 Suggestions for improvement of the CAP by Bulgarian farmers
Farmers were asked if they had own ideas to improve the CAP. There were some ideas and demands by farmers that could help to solve the demographic challenge in rural areas. Apart from a shift of thinking of people about the negative image of rural areas, farmers wish
• Improvements in infrastructure
„The infrastructure is very bad here, a part of the roads, there is no canalization system, the electricity is not with good quality and they stop it very often, so a lot of things have to be improved here“ (Farmer 1).
• More possibilities and offers for young people in rural areas, their involvement into agriculture and education on agriculture
“[…] to have a special stimulation for the young people who want to deal with agriculture […] It's not enough to stimulate, it‘s related to better quality of life, to get better paid as well and to be able to actually stay at the village and to have a car let‘s say to go to the big cities to just, and to go back to the village“ (Farmer 5).
• More support for small businesses in rural areas
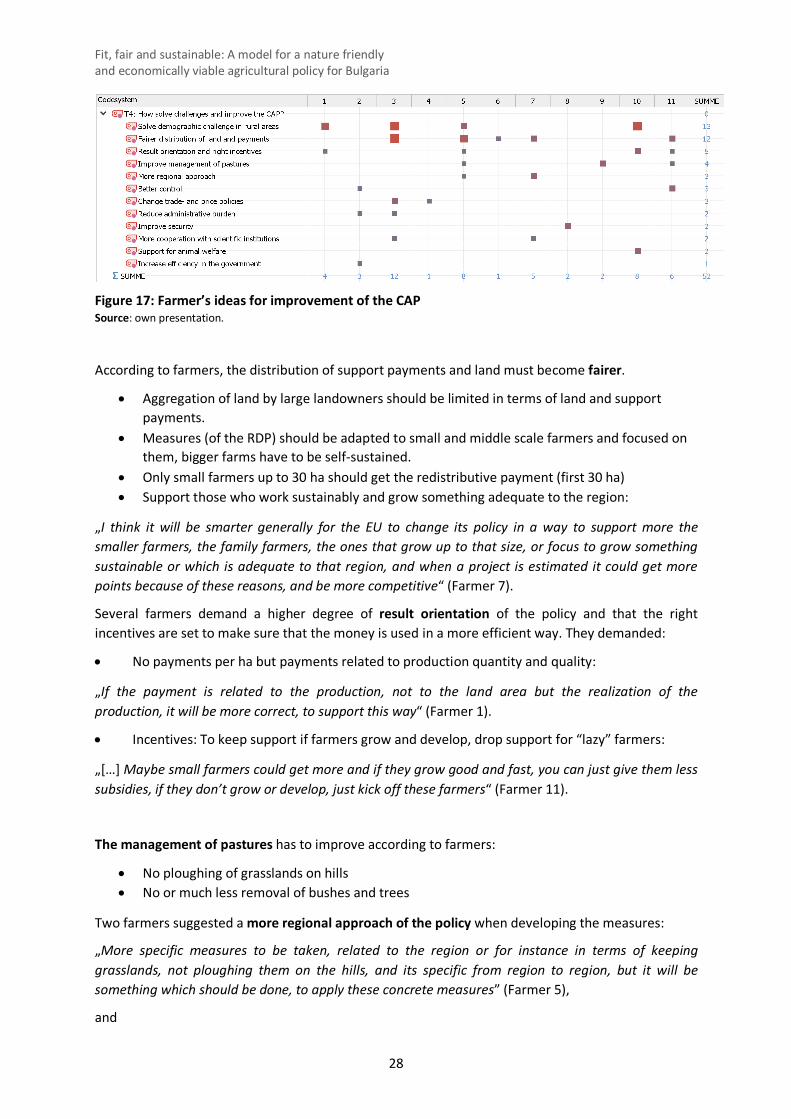
Fit, fair and sustainable: A model for a nature friendly and economically viable agricultural policy for Bulgaria
28
Figure 17: Farmer’s ideas for improvement of the CAP Source: own presentation.
According to farmers, the distribution of support payments and land must become fairer.
• Aggregation of land by large landowners should be limited in terms of land and support payments.
• Measures (of the RDP) should be adapted to small and middle scale farmers and focused on them, bigger farms have to be self-sustained.
• Only small farmers up to 30 ha should get the redistributive payment (first 30 ha) • Support those who work sustainably and grow something adequate to the region:
„I think it will be smarter generally for the EU to change its policy in a way to support more the smaller farmers, the family farmers, the ones that grow up to that size, or focus to grow something sustainable or which is adequate to that region, and when a project is estimated it could get more points because of these reasons, and be more competitive“ (Farmer 7).
Several farmers demand a higher degree of result orientation of the policy and that the right incentives are set to make sure that the money is used in a more efficient way. They demanded:
• No payments per ha but payments related to production quantity and quality:
„If the payment is related to the production, not to the land area but the realization of the production, it will be more correct, to support this way“ (Farmer 1).
• Incentives: To keep support if farmers grow and develop, drop support for “lazy” farmers:
„[…] Maybe small farmers could get more and if they grow good and fast, you can just give them less subsidies, if they don’t grow or develop, just kick off these farmers“ (Farmer 11).
The management of pastures has to improve according to farmers:
• No ploughing of grasslands on hills • No or much less removal of bushes and trees
Two farmers suggested a more regional approach of the policy when developing the measures:
„More specific measures to be taken, related to the region or for instance in terms of keeping grasslands, not ploughing them on the hills, and its specific from region to region, but it will be something which should be done, to apply these concrete measures” (Farmer 5),
and
Fit, fair and sustainable: A model for a nature friendly and economically viable agricultural policy for Bulgaria
29
“probably there should be more flexibility about the regional approach, and when you estimate the weight of a project, you should consider where it comes from, you may not support a vineyard in Northern BG or in the mountains but support a project around Harmanli“ (Farmer 7).
A stricter control was demanded by two farmers, to prevent misuse of public money:
„[…] to have a stricter control, not to have misuse of the money, because in the beginning there were a lot of stealing money, now the control is better but still needs to be stronger.“
and to ensure for example environmental standards:
„The farmer should be controlled if they keep the rules and keep the land in these good environmental conditions […] they should use the land in a good way, in a proper way, natural friendly“ (Farmer 11).
Further, it was said that the institutional challenges of implementation have to be solved, the administrative burden has to be reduced and efficiency in the government has to increase. Some farmers suggested a stronger protection of Bulgarian farmers by changing trade- and price policies, like guaranteed market prices or a stricter regulation of imports from the EU.
The improvement of security was demanded, especially for North Western Bulgaria.
Farmers also require an increased cooperation with scientific institutes, as well as more sophisticated animal welfare payments, i.e., it would be fair for farmers to get support payments for free raised chicken:
„[…] when the chicken are raised freely you have more expenses, and when they are in the cells its less, so it‘s fair to get subsidies for free raised chickens“ (Farmer 10).
4.5 Expert interview on the status of the agro-ecosystems
As previously mentioned, we additionally interviewed one ecologist and two agricultural economists in order to understand the impacts of the CAP in Bulgaria and fill gaps of knowledge. The interviews were done with a similar qualitative approach, therefore, statements of the experts are subjective perceptions of problems as well. However, we should note that some of the observations can also be found in scientific articles (Popgeorgiev et al. 2014; Dobrev et al. 2014), which suggests that some of the findings can be generalized.
The removal of grassland and landscape elements has been criticized. The Direct Payments (DP) and the eligibility criteria on LPIS incentivize the removal of trees, bushes and shrubs (see section 2.4). Farmers remove these elements even though there is often no use for those grasslands. The removal also leads to a loss of breeding opportunities for birds. Often the cutting is done during the breeding season of e.g. the Corn crake (Crex crex):
“They apply this pasture cleaning or mowing measure scheme and every year the keep on cutting shrubs, they don’t grow like this they just enter into areas which have never been pastures, turn them into pastures just to take the subsidies for this. And the problem is that going with the shredders, everyone says that they leave everything there, there is no grazing on the top of these areas and the bushes just start growing everywhere the next year, so it’s one permanent bush cutting process just for the sake of the subsidies” (Expert 1).
And if the grassland is used, there are significant impacts on the quality of grassland: Shade trees are missing for the animals. One shepherd complained, that DP for grassland is linked to the removal of bushes, since it reduces the quality of grassland for the sheep. According Stevanova & Kazakova
Fit, fair and sustainable: A model for a nature friendly and economically viable agricultural policy for Bulgaria
30
(2016) it is recommendable to keep the landscape elements on the grassland and thereby keep agronomic and ecological quality.
Also, the conversion of grassland into arable land was described as a key problem. DP were described as a main incentive to convert grassland to arable land by ploughing in. This correlates to a sharp decline of grassland in Bulgaria described in Section 2.4. This is done without the intention to utilize arable land, since this would involve costs.
"Yes, it’s more efforts, it’s a big high payment but more efforts and if you use it for farming, you plough it very often when they plough pastures, they just plough it, they don’t sow anything because they’ll have the satellite imaginary showing that it has been ploughed, for being processed” (Expert 1).
The DP are perceived as the direct cause for this conversion: “These general payments have done a lot of damages because it increases the demand for land, arable land, there are big consortiums that are buying or renting out land everywhere just to take the subsidies, because so far there was no limitation on the top limit, one of the biggest land owners in Europe is in Northeast Bulgaria with 1 Mio. ha or something” (Expert 1).
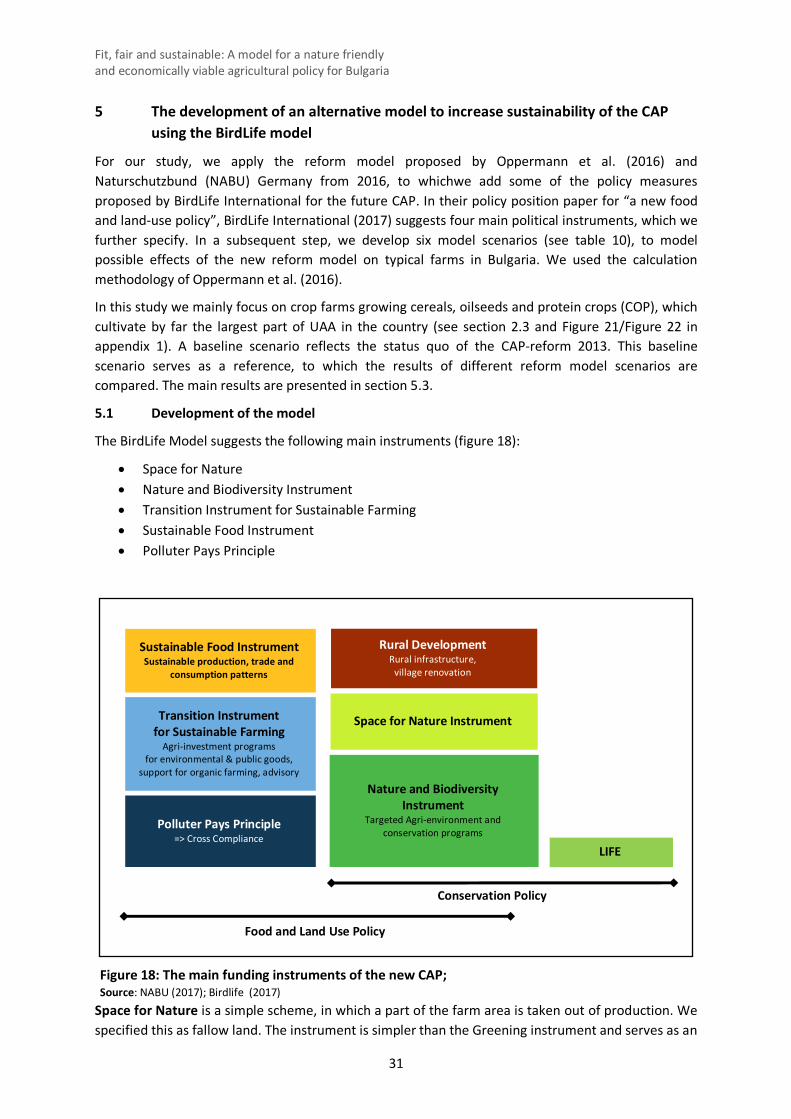
Fit, fair and sustainable: A model for a nature friendly and economically viable agricultural policy for Bulgaria
31
5 The development of an alternative model to increase sustainability of the CAP using the BirdLife model
For our study, we apply the reform model proposed by Oppermann et al. (2016) and Naturschutzbund (NABU) Germany from 2016, to whichwe add some of the policy measures proposed by BirdLife International for the future CAP. In their policy position paper for “a new food and land-use policy”, BirdLife International (2017) suggests four main political instruments, which we further specify. In a subsequent step, we develop six model scenarios (see table 10), to model possible effects of the new reform model on typical farms in Bulgaria. We used the calculation methodology of Oppermann et al. (2016).
In this study we mainly focus on crop farms growing cereals, oilseeds and protein crops (COP), which cultivate by far the largest part of UAA in the country (see section 2.3 and Figure 21/Figure 22 in appendix 1). A baseline scenario reflects the status quo of the CAP-reform 2013. This baseline scenario serves as a reference, to which the results of different reform model scenarios are compared. The main results are presented in section 5.3.
5.1 Development of the model
The BirdLife Model suggests the following main instruments (figure 18):
• Space for Nature • Nature and Biodiversity Instrument • Transition Instrument for Sustainable Farming • Sustainable Food Instrument • Polluter Pays Principle
Space for Nature is a simple scheme, in which a part of the farm area is taken out of production. We specified this as fallow land. The instrument is simpler than the Greening instrument and serves as an
Food and Land Use Policy
Figure 18: The main funding instruments of the new CAP; Source: NABU (2017); Birdlife (2017)
Conservation Policy
LIFE
Sustainable Food Instrument Sustainable production, trade and
consumption patterns
Transition Instrument for Sustainable Farming
Agri-investment programs for environmental & public goods,
support for organic farming, advisory
Polluter Pays Principle => Cross Compliance
Rural Development Rural infrastructure,
village renovation
Space for Nature Instrument
Nature and Biodiversity Instrument
Targeted Agri-environment and conservation programs
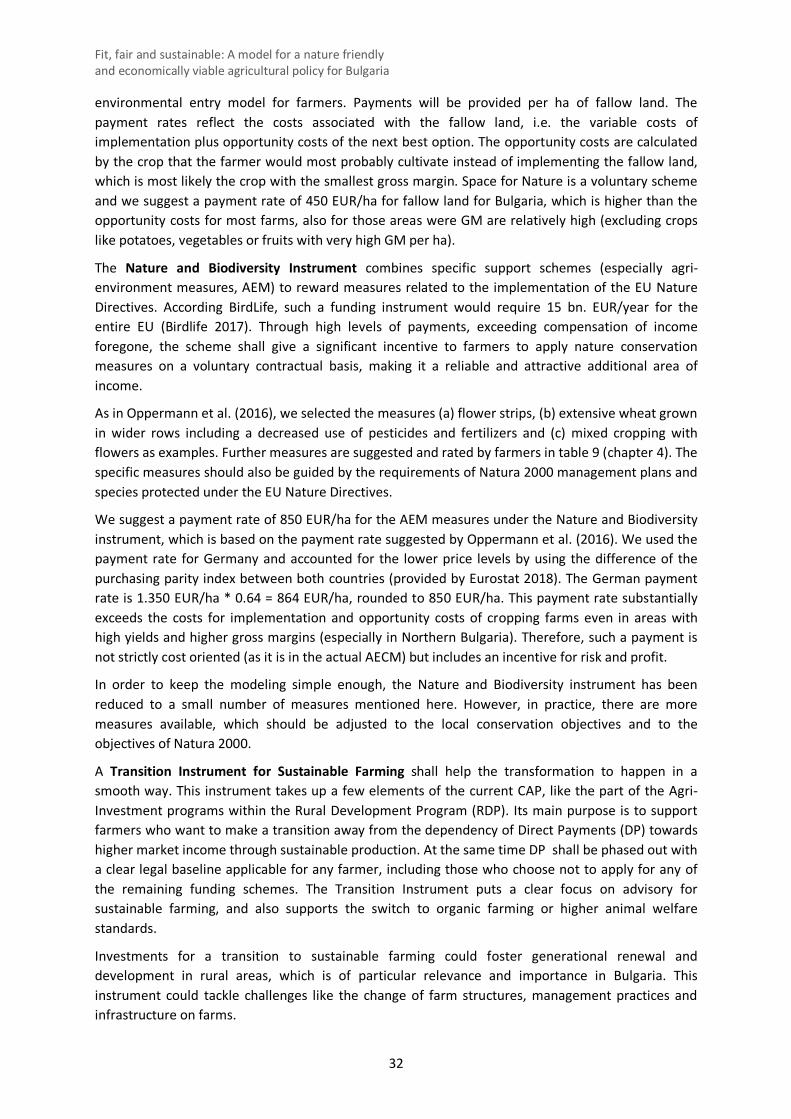
Fit, fair and sustainable: A model for a nature friendly and economically viable agricultural policy for Bulgaria
32
environmental entry model for farmers. Payments will be provided per ha of fallow land. The payment rates reflect the costs associated with the fallow land, i.e. the variable costs of implementation plus opportunity costs of the next best option. The opportunity costs are calculated by the crop that the farmer would most probably cultivate instead of implementing the fallow land, which is most likely the crop with the smallest gross margin. Space for Nature is a voluntary scheme and we suggest a payment rate of 450 EUR/ha for fallow land for Bulgaria, which is higher than the opportunity costs for most farms, also for those areas were GM are relatively high (excluding crops like potatoes, vegetables or fruits with very high GM per ha).
The Nature and Biodiversity Instrument combines specific support schemes (especially agri-environment measures, AEM) to reward measures related to the implementation of the EU Nature Directives. According BirdLife, such a funding instrument would require 15 bn. EUR/year for the entire EU (Birdlife 2017). Through high levels of payments, exceeding compensation of income foregone, the scheme shall give a significant incentive to farmers to apply nature conservation measures on a voluntary contractual basis, making it a reliable and attractive additional area of income.
As in Oppermann et al. (2016), we selected the measures (a) flower strips, (b) extensive wheat grown in wider rows including a decreased use of pesticides and fertilizers and (c) mixed cropping with flowers as examples. Further measures are suggested and rated by farmers in table 9 (chapter 4). The specific measures should also be guided by the requirements of Natura 2000 management plans and species protected under the EU Nature Directives.
We suggest a payment rate of 850 EUR/ha for the AEM measures under the Nature and Biodiversity instrument, which is based on the payment rate suggested by Oppermann et al. (2016). We used the payment rate for Germany and accounted for the lower price levels by using the difference of the purchasing parity index between both countries (provided by Eurostat 2018). The German payment rate is 1.350 EUR/ha * 0.64 = 864 EUR/ha, rounded to 850 EUR/ha. This payment rate substantially exceeds the costs for implementation and opportunity costs of cropping farms even in areas with high yields and higher gross margins (especially in Northern Bulgaria). Therefore, such a payment is not strictly cost oriented (as it is in the actual AECM) but includes an incentive for risk and profit.
In order to keep the modeling simple enough, the Nature and Biodiversity instrument has been reduced to a small number of measures mentioned here. However, in practice, there are more measures available, which should be adjusted to the local conservation objectives and to the objectives of Natura 2000.
A Transition Instrument for Sustainable Farming shall help the transformation to happen in a smooth way. This instrument takes up a few elements of the current CAP, like the part of the Agri-Investment programs within the Rural Development Program (RDP). Its main purpose is to support farmers who want to make a transition away from the dependency of Direct Payments (DP) towards higher market income through sustainable production. At the same time DP shall be phased out with a clear legal baseline applicable for any farmer, including those who choose not to apply for any of the remaining funding schemes. The Transition Instrument puts a clear focus on advisory for sustainable farming, and also supports the switch to organic farming or higher animal welfare standards.
Investments for a transition to sustainable farming could foster generational renewal and development in rural areas, which is of particular relevance and importance in Bulgaria. This instrument could tackle challenges like the change of farm structures, management practices and infrastructure on farms.
Fit, fair and sustainable: A model for a nature friendly and economically viable agricultural policy for Bulgaria
33
All these dimensions are important in the design of a new reform model. For our calculations, however, we simplified the Transition Instrument as an area-based payment scheme, of which the payment rate shall decrease over the years and phase out e.g. over the next ten years. We calculate with an amount of 100 EUR/ha in 2020, which is lower than the current 167 EUR/ha for SAPS in Bulgaria and shall then slowly decrease and completely phase out around 2030. In case of organic farming, we keep the current support payments in place, increasing the payment rates by 30%.
The last instrument suggested by BirdLife is a Sustainable Food Instrument, which follows the idea of a policy that addresses the whole food chain with the aim of sustainable production, trade and consumption patterns. The instrument should support shortening of food chains through direct or regional marketing initiatives, education and information programs on sustainable nutrition as well as support the demand for sustainable food by schools or initiatives against food waste.
In the long run, they can be expected to have a positive effect on farmers’ incomes by leading to a higher demand and willingness to pay for sustainably produced food. However, in our calculations we will focus on income effects occurring shortly after the application of the new reform model, which is why this instrument will not be considered.
Additionally to the above specified premiums, we apply an Advisory and Management premium (similar to the one used by Oppermann et al. 2016), which applies to all farms applying conservation practices on 10% of their area or more. Is set to 250 EUR for every ha under conservation.
Using the above specified instruments, we calculate six scenarios containing different combination possibilities, to show the effects on typical cropping farms in Bulgaria, presented in table 10.
Table 10: Specification of the scenarios calculated Scenario Specification Payment rates 1. No CAP/Exit No support payments at all - 2. Transition to sustainable farming/ No conservation
Transition instrument for sustainable farming is applied 100 EUR/ha Transition instrument
3. Very low level of conservation
Transition Instrument for sustainable farming Space for Nature (fallow land) on 5% of area
100 EUR/ha Transition instrument 450 EUR/ha Space for Nature
4. Low level of conservation
Transition Instrument for sustainable farming Space for Nature (fallow land) on 10% of area Advisory and management payment for conservation activities
100 EUR/ha Transition instrument 450 EUR/ha Space for Nature 250 EUR/ha Management
5. Medium level of conservation
Transition Instrument for sustainable farming Space for Nature (fallow land) on 5% of area Nature and Biodiversity Instrument on 5% of area
2% of flower strips 3% of extensive wheat; wider rows and low input use 5% of flower strips for vegetable and fruit farms
Advisory & management payment for conservation activities
100 EUR/ha Transition instrument 450 EUR/ha Fallow land 850 EUR/ha Biodiversity Instrument
(flower strips & extensive wheat) 250 EUR/ha Management
6. High level of conservation
Transition Instrument for sustainable farming Nature and Biodiversity Instrument on 15% of area
5% of flower strips 5% of extensive wheat with wider rows; low input use 5% of flowering, mixed crops for the crop farms, 15% of flower strips for vegetable and fruit farms
Advisory & management payment for conservation activities
100 EUR/ha Transition instrument 850 EUR/ha Biodiversity Instrument
(flower strips, extensive wheat, flowering mixed crops)
250 EUR/ha Management
Source: Own presentation
Fit, fair and sustainable: A model for a nature friendly and economically viable agricultural policy for Bulgaria
34
5.2 Methods: The design of “Typical Regional Farms” and calculation methodology
For the selection of typical regional farms in a first step, data from the farm structure survey 2013 by Eurostat was used to point out the relevance of different farm types in the six planning regions of Bulgaria (see Figure 19). The farms are classified and assigned to the different categories according to the share of economic output they generate from a certain production activity as contribution to their total standard output (Eurostat 2018). To be able to capture the most important farm types, the share of UAA (see figures for North West and South Central in appendix 1), number of holdings (see figure appendix) and standard economic output for the different farm types per region was calculated.
In terms of UAA, COP (Cereals, Oilseeds and Protein crops) farms and General Field Cropping (GFC) farms take the largest share in all six planning regions of Bulgaria. In northern Bulgaria, COP farms take around 75 – 80% of UAA, in South Eastern Bulgaria 64% and in the central and western parts of Southern Bulgaria, this farm type makes up 38% and 21%, respectively. In Southwest Bulgaria, GFC farms, which includes farms specialized on potatoes and root crops as well as field vegetables, tobacco and other industrial crops, makes up 59% of the UAA, in South Central Bulgaria 38%. Relevance of horticulture, fruit and vine production in terms of UAA is rather low. E.g. in South Central Bulgaria, farms specialized on vineyards make of 1.5% of the UAA and specialist fruit and citrus fruit 1%. However, in terms of the number of holdings realizing this kind of production, the numbers are slightly higher: 5.7% of the holdings are counted as vineyards and around 3.1% orchards.
Generally, in terms of number of holdings the picture is much more diverse: Dairy farms, sheep and goat keepers, mixed farming systems as well as the already mentioned fruit and wine producers are relevant for Bulgaria. In terms of standard output, apart from the farms already mentioned, specialized granivore farms play also a role, mainly specialist poultry.
In our calculations we will focus on the most relevant farm types per region in terms of UAA, since this is the most important criterion when discussing land use policies. Additionally, we will include two different farms (a small organic vegetable farm in South West Bulgaria and a small fruit orchard in South Central Bulgaria) to have a reference of other relevant farm types in Bulgaria, with a different structure and different production focus than the generally rather large COP farms.
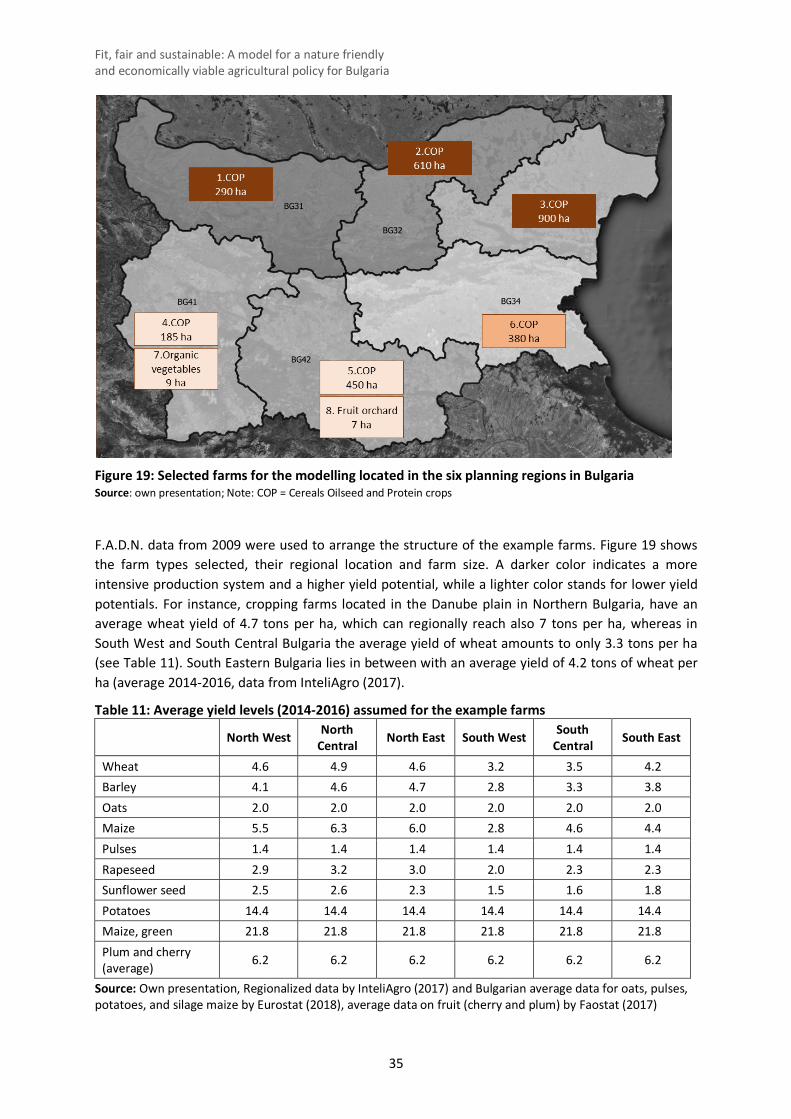
Fit, fair and sustainable: A model for a nature friendly and economically viable agricultural policy for Bulgaria
35
Figure 19: Selected farms for the modelling located in the six planning regions in Bulgaria Source: own presentation; Note: COP = Cereals Oilseed and Protein crops
F.A.D.N. data from 2009 were used to arrange the structure of the example farms. Figure 19 shows the farm types selected, their regional location and farm size. A darker color indicates a more intensive production system and a higher yield potential, while a lighter color stands for lower yield potentials. For instance, cropping farms located in the Danube plain in Northern Bulgaria, have an average wheat yield of 4.7 tons per ha, which can regionally reach also 7 tons per ha, whereas in South West and South Central Bulgaria the average yield of wheat amounts to only 3.3 tons per ha (see Table 11). South Eastern Bulgaria lies in between with an average yield of 4.2 tons of wheat per ha (average 2014-2016, data from InteliAgro (2017).
Table 11: Average yield levels (2014-2016) assumed for the example farms North West North
Central North East South West South Central South East
Wheat 4.6 4.9 4.6 3.2 3.5 4.2 Barley 4.1 4.6 4.7 2.8 3.3 3.8 Oats 2.0 2.0 2.0 2.0 2.0 2.0 Maize 5.5 6.3 6.0 2.8 4.6 4.4 Pulses 1.4 1.4 1.4 1.4 1.4 1.4 Rapeseed 2.9 3.2 3.0 2.0 2.3 2.3 Sunflower seed 2.5 2.6 2.3 1.5 1.6 1.8 Potatoes 14.4 14.4 14.4 14.4 14.4 14.4 Maize, green 21.8 21.8 21.8 21.8 21.8 21.8 Plum and cherry (average) 6.2 6.2 6.2 6.2 6.2 6.2
Source: Own presentation, Regionalized data by InteliAgro (2017) and Bulgarian average data for oats, pulses, potatoes, and silage maize by Eurostat (2018), average data on fruit (cherry and plum) by Faostat (2017)
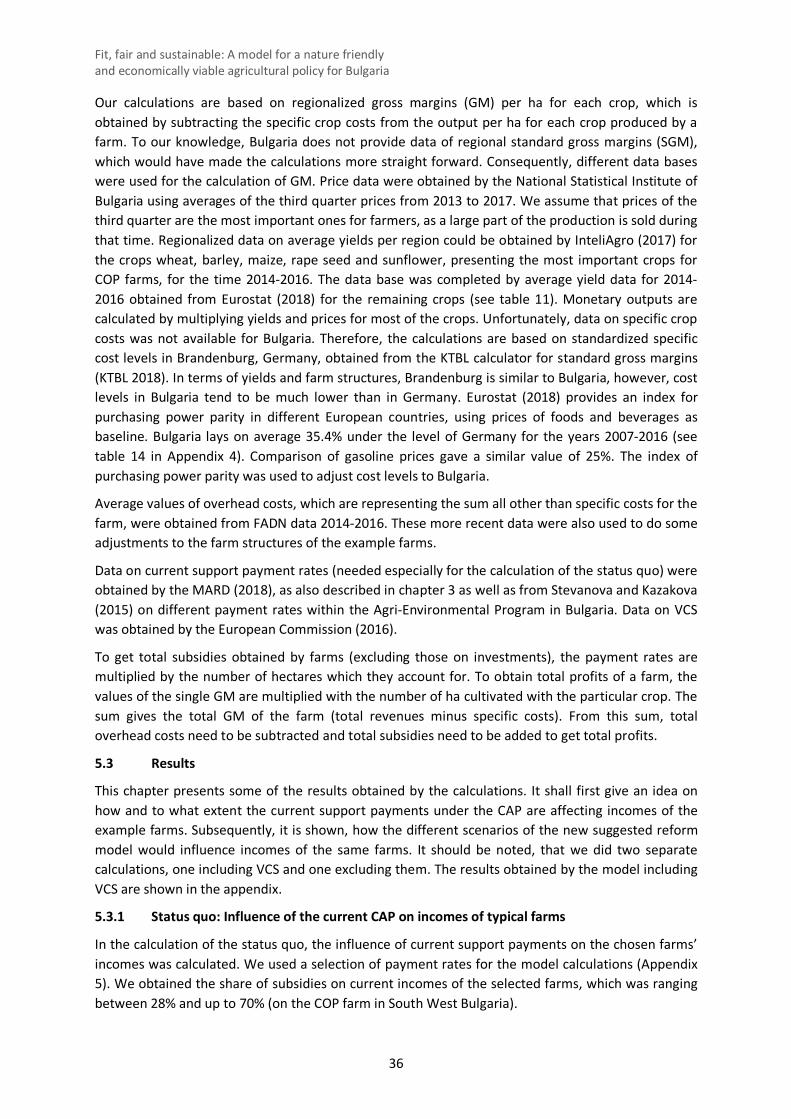
Fit, fair and sustainable: A model for a nature friendly and economically viable agricultural policy for Bulgaria
36
Our calculations are based on regionalized gross margins (GM) per ha for each crop, which is obtained by subtracting the specific crop costs from the output per ha for each crop produced by a farm. To our knowledge, Bulgaria does not provide data of regional standard gross margins (SGM), which would have made the calculations more straight forward. Consequently, different data bases were used for the calculation of GM. Price data were obtained by the National Statistical Institute of Bulgaria using averages of the third quarter prices from 2013 to 2017. We assume that prices of the third quarter are the most important ones for farmers, as a large part of the production is sold during that time. Regionalized data on average yields per region could be obtained by InteliAgro (2017) for the crops wheat, barley, maize, rape seed and sunflower, presenting the most important crops for COP farms, for the time 2014-2016. The data base was completed by average yield data for 2014-2016 obtained from Eurostat (2018) for the remaining crops (see table 11). Monetary outputs are calculated by multiplying yields and prices for most of the crops. Unfortunately, data on specific crop costs was not available for Bulgaria. Therefore, the calculations are based on standardized specific cost levels in Brandenburg, Germany, obtained from the KTBL calculator for standard gross margins (KTBL 2018). In terms of yields and farm structures, Brandenburg is similar to Bulgaria, however, cost levels in Bulgaria tend to be much lower than in Germany. Eurostat (2018) provides an index for purchasing power parity in different European countries, using prices of foods and beverages as baseline. Bulgaria lays on average 35.4% under the level of Germany for the years 2007-2016 (see table 14 in Appendix 4). Comparison of gasoline prices gave a similar value of 25%. The index of purchasing power parity was used to adjust cost levels to Bulgaria.
Average values of overhead costs, which are representing the sum all other than specific costs for the farm, were obtained from FADN data 2014-2016. These more recent data were also used to do some adjustments to the farm structures of the example farms.
Data on current support payment rates (needed especially for the calculation of the status quo) were obtained by the MARD (2018), as also described in chapter 3 as well as from Stevanova and Kazakova (2015) on different payment rates within the Agri-Environmental Program in Bulgaria. Data on VCS was obtained by the European Commission (2016).
To get total subsidies obtained by farms (excluding those on investments), the payment rates are multiplied by the number of hectares which they account for. To obtain total profits of a farm, the values of the single GM are multiplied with the number of ha cultivated with the particular crop. The sum gives the total GM of the farm (total revenues minus specific costs). From this sum, total overhead costs need to be subtracted and total subsidies need to be added to get total profits.
5.3 Results
This chapter presents some of the results obtained by the calculations. It shall first give an idea on how and to what extent the current support payments under the CAP are affecting incomes of the example farms. Subsequently, it is shown, how the different scenarios of the new suggested reform model would influence incomes of the same farms. It should be noted, that we did two separate calculations, one including VCS and one excluding them. The results obtained by the model including VCS are shown in the appendix.
5.3.1 Status quo: Influence of the current CAP on incomes of typical farms
In the calculation of the status quo, the influence of current support payments on the chosen farms’ incomes was calculated. We used a selection of payment rates for the model calculations (Appendix 5). We obtained the share of subsidies on current incomes of the selected farms, which was ranging between 28% and up to 70% (on the COP farm in South West Bulgaria).
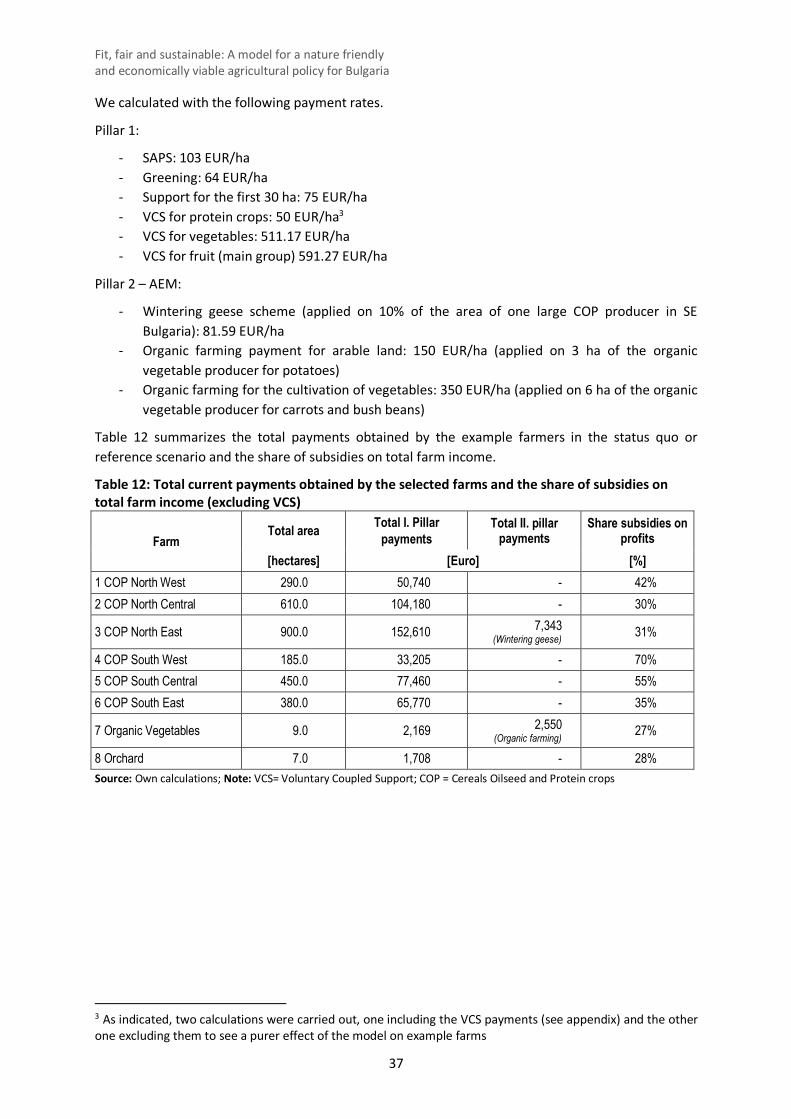
Fit, fair and sustainable: A model for a nature friendly and economically viable agricultural policy for Bulgaria
37
We calculated with the following payment rates.
Pillar 1:
- SAPS: 103 EUR/ha - Greening: 64 EUR/ha - Support for the first 30 ha: 75 EUR/ha - VCS for protein crops: 50 EUR/ha3 - VCS for vegetables: 511.17 EUR/ha - VCS for fruit (main group) 591.27 EUR/ha
Pillar 2 – AEM:
- Wintering geese scheme (applied on 10% of the area of one large COP producer in SE Bulgaria): 81.59 EUR/ha
- Organic farming payment for arable land: 150 EUR/ha (applied on 3 ha of the organic vegetable producer for potatoes)
- Organic farming for the cultivation of vegetables: 350 EUR/ha (applied on 6 ha of the organic vegetable producer for carrots and bush beans)
Table 12 summarizes the total payments obtained by the example farmers in the status quo or reference scenario and the share of subsidies on total farm income.
Table 12: Total current payments obtained by the selected farms and the share of subsidies on total farm income (excluding VCS)
Farm Total area Total I. Pillar
payments Total II. pillar
payments Share subsidies on
profits [hectares] [Euro] [%]
1 COP North West 290.0 50,740 - 42% 2 COP North Central 610.0 104,180 - 30%
3 COP North East 900.0 152,610 7,343 (Wintering geese) 31%
4 COP South West 185.0 33,205 - 70% 5 COP South Central 450.0 77,460 - 55% 6 COP South East 380.0 65,770 - 35%
7 Organic Vegetables 9.0 2,169 2,550 (Organic farming) 27%
8 Orchard 7.0 1,708 - 28% Source: Own calculations; Note: VCS= Voluntary Coupled Support; COP = Cereals Oilseed and Protein crops
3 As indicated, two calculations were carried out, one including the VCS payments (see appendix) and the other one excluding them to see a purer effect of the model on example farms
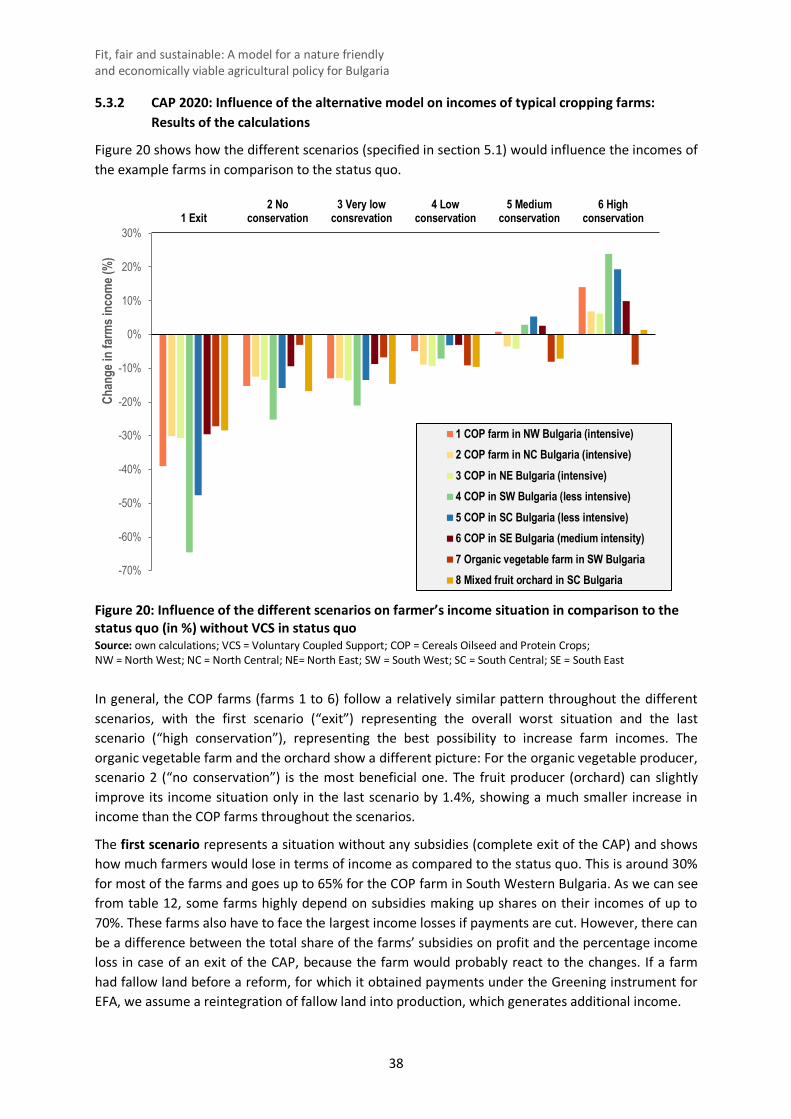
Fit, fair and sustainable: A model for a nature friendly and economically viable agricultural policy for Bulgaria
38
5.3.2 CAP 2020: Influence of the alternative model on incomes of typical cropping farms: Results of the calculations
Figure 20 shows how the different scenarios (specified in section 5.1) would influence the incomes of the example farms in comparison to the status quo.
Figure 20: Influence of the different scenarios on farmer’s income situation in comparison to the status quo (in %) without VCS in status quo Source: own calculations; VCS = Voluntary Coupled Support; COP = Cereals Oilseed and Protein Crops; NW = North West; NC = North Central; NE= North East; SW = South West; SC = South Central; SE = South East
In general, the COP farms (farms 1 to 6) follow a relatively similar pattern throughout the different scenarios, with the first scenario (“exit”) representing the overall worst situation and the last scenario (“high conservation”), representing the best possibility to increase farm incomes. The organic vegetable farm and the orchard show a different picture: For the organic vegetable producer, scenario 2 (“no conservation”) is the most beneficial one. The fruit producer (orchard) can slightly improve its income situation only in the last scenario by 1.4%, showing a much smaller increase in income than the COP farms throughout the scenarios.
The first scenario represents a situation without any subsidies (complete exit of the CAP) and shows how much farmers would lose in terms of income as compared to the status quo. This is around 30% for most of the farms and goes up to 65% for the COP farm in South Western Bulgaria. As we can see from table 12, some farms highly depend on subsidies making up shares on their incomes of up to 70%. These farms also have to face the largest income losses if payments are cut. However, there can be a difference between the total share of the farms’ subsidies on profit and the percentage income loss in case of an exit of the CAP, because the farm would probably react to the changes. If a farm had fallow land before a reform, for which it obtained payments under the Greening instrument for EFA, we assume a reintegration of fallow land into production, which generates additional income.
-70%
-60%
-50%
-40%
-30%
-20%
-10%
0%
10%
20%
30%1 Exit
2 Noconservation
3 Very lowconsrevation
4 Lowconservation
5 Mediumconservation
6 Highconservation
Chan
ge in
farm
s inc
ome (
%)
1 COP farm in NW Bulgaria (intensive)2 COP farm in NC Bulgaria (intensive)3 COP in NE Bulgaria (intensive)4 COP in SW Bulgaria (less intensive)5 COP in SC Bulgaria (less intensive)6 COP in SE Bulgaria (medium intensity)7 Organic vegetable farm in SW Bulgaria8 Mixed fruit orchard in SC Bulgaria
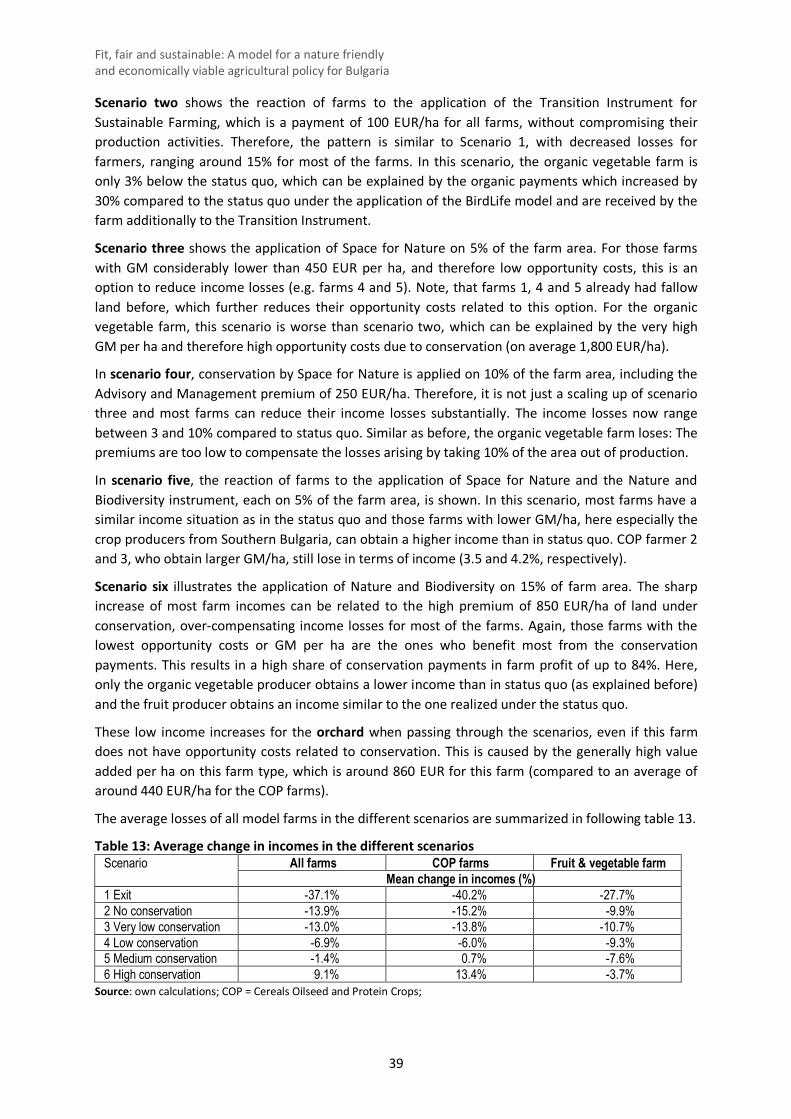
Fit, fair and sustainable: A model for a nature friendly and economically viable agricultural policy for Bulgaria
39
Scenario two shows the reaction of farms to the application of the Transition Instrument for Sustainable Farming, which is a payment of 100 EUR/ha for all farms, without compromising their production activities. Therefore, the pattern is similar to Scenario 1, with decreased losses for farmers, ranging around 15% for most of the farms. In this scenario, the organic vegetable farm is only 3% below the status quo, which can be explained by the organic payments which increased by 30% compared to the status quo under the application of the BirdLife model and are received by the farm additionally to the Transition Instrument.
Scenario three shows the application of Space for Nature on 5% of the farm area. For those farms with GM considerably lower than 450 EUR per ha, and therefore low opportunity costs, this is an option to reduce income losses (e.g. farms 4 and 5). Note, that farms 1, 4 and 5 already had fallow land before, which further reduces their opportunity costs related to this option. For the organic vegetable farm, this scenario is worse than scenario two, which can be explained by the very high GM per ha and therefore high opportunity costs due to conservation (on average 1,800 EUR/ha).
In scenario four, conservation by Space for Nature is applied on 10% of the farm area, including the Advisory and Management premium of 250 EUR/ha. Therefore, it is not just a scaling up of scenario three and most farms can reduce their income losses substantially. The income losses now range between 3 and 10% compared to status quo. Similar as before, the organic vegetable farm loses: The premiums are too low to compensate the losses arising by taking 10% of the area out of production.
In scenario five, the reaction of farms to the application of Space for Nature and the Nature and Biodiversity instrument, each on 5% of the farm area, is shown. In this scenario, most farms have a similar income situation as in the status quo and those farms with lower GM/ha, here especially the crop producers from Southern Bulgaria, can obtain a higher income than in status quo. COP farmer 2 and 3, who obtain larger GM/ha, still lose in terms of income (3.5 and 4.2%, respectively).
Scenario six illustrates the application of Nature and Biodiversity on 15% of farm area. The sharp increase of most farm incomes can be related to the high premium of 850 EUR/ha of land under conservation, over-compensating income losses for most of the farms. Again, those farms with the lowest opportunity costs or GM per ha are the ones who benefit most from the conservation payments. This results in a high share of conservation payments in farm profit of up to 84%. Here, only the organic vegetable producer obtains a lower income than in status quo (as explained before) and the fruit producer obtains an income similar to the one realized under the status quo.
These low income increases for the orchard when passing through the scenarios, even if this farm does not have opportunity costs related to conservation. This is caused by the generally high value added per ha on this farm type, which is around 860 EUR for this farm (compared to an average of around 440 EUR/ha for the COP farms).
The average losses of all model farms in the different scenarios are summarized in following table 13.
Table 13: Average change in incomes in the different scenarios Scenario All farms COP farms Fruit & vegetable farm
Mean change in incomes (%) 1 Exit -37.1% -40.2% -27.7% 2 No conservation -13.9% -15.2% -9.9% 3 Very low conservation -13.0% -13.8% -10.7% 4 Low conservation -6.9% -6.0% -9.3% 5 Medium conservation -1.4% 0.7% -7.6% 6 High conservation 9.1% 13.4% -3.7%
Source: own calculations; COP = Cereals Oilseed and Protein Crops;
Fit, fair and sustainable: A model for a nature friendly and economically viable agricultural policy for Bulgaria
40
6 Discussion
The present study provides some insights into the problems, challenges and opportunities for the agricultural sector in Bulgaria from an agronomic and environmental perspective. In the following two sections, we will discuss our findings and develop some conclusions.
6.1 The BirdLife Reform Model as an opportunity for the environment and farm incomes
The model calculations show that the COP producers would benefit from doing conservation on contract applied with the Nature and Biodiversity Instrument (as suggested in scenario 5 and 6). The model can contribute to the provision of environmental public goods interesting for COP producers, which are responsible for the cultivation of a largest part of agricultural land in Bulgaria. Therefore, the model could help to increase overall biodiversity in Bulgarians landscapes and reduce input intensity. However, this must not necessarily compromise productivity, since the proposed measures are on a voluntary basis. Farmer can choose between a pure market orientation and a sustainable and less intensive farming, where agricultural products and biodiversity are produced at the same time.
However, one critical point is, that those farms producing crops associated with high gross margins (like vegetable, fruit, tobacco and wine producers) do actually not benefit much from this model when doing nature conservation for a certain price on a certain area of land. In the scenario analysis, small fruit and vegetable producers have to face income losses, which cannot be compensated by higher payments for environmental services. This shows that the crop mix applied by the farm strongly influences the outcome of the calculations, that is, how farm incomes will be affected by the different conservation scenarios.
This might lead to the impression, that some types of farms could be excluded from such a reform-model. Additionally, in Bulgaria COP farms tend to be very large, while vegetable and fruit producers tend to be rather small (Eurostat, FADN), therefore one concern can also be that large farms will benefit more from the conservation schemes. Therefore, other locally adjusted solutions are necessary for those farms producing crops with high value added per area (i.e. GM/ha), for whom conservation on contract cannot be profitable, even with high rates of payments per ha. One possible solution that we pointed out in our calculation is that of organic farming: If the payment rates are increased by 30 or 40% compared to the present, those farms producing in a more sustainable way on their overall farm area, could benefit as well. Furthermore, specific environmental measures for vegetable, fruit and wine production need to be designed, which would include payment rates, that reflect the high value added per hectare. However, specific solutions have to be aligned with the perceived problems of missing transparency and fraud.
The results presented in 5.3.2 look different if we include the Voluntary Coupled Support (VCS) payments for eligible farms (see figure 23 in Appendix 5). In that case, the picture of the COP producers does not change much, but the organic vegetable producer as well as the fruit orchard would lose substantially in all scenarios. The main cause for this result is the high level of coupled payment in the reference scenario. In the long run however, it should be an objective to move away from the VCS payments because of their distorting effects. One option for Bulgaria and other EU countries who implemented these schemes, would be a phasing out of VCS via the Transition Instrument of Sustainable Farming. This would give farms the possibility to adapt to the new situation and over time orient towards sustainable farming practices.
Fit, fair and sustainable: A model for a nature friendly and economically viable agricultural policy for Bulgaria
41
6.2 Sustainable Production as main challenge for Bulgaria
The initial figures show, that agricultural production in Bulgaria has changed after the EU accession in 2007, particularly with regard to the use of land and e.g. fertilizer. This has led to an increased productivity. However, if we relate e.g. the yield growth to input growth, we might already get some insights into some of the major agricultural problems: The yield growth was largest in the grain sectors, where increases of +49% for wheat and 44% for barley were the best results achieved in seven years of observation (2010-2017). Other crops like rape seed, triticale, maize or potato grew only between 5% and 20% (See Figure 2). In contrast to this, the input use substantially increased: The sales of mineral fertilizer grew by 96% during the last seven years (2008-2015; Figure 3), also land prices increased, partly driven by the incentives of the Direct Payments (DP), which support land owners (Figure 4). This was an important point made during the interviews with farmers, particularly with regard to the Dobruzha region in North Eastern Bulgaria, were a large-scale structure of agricultural holdings (most consisting of COP farms) is prevalent. The productivity problem was also confirmed by the expert 2 (2018). It seems as if there is a mismatch between input and output, leading to only a moderate growth of the total factor productivity (TFP), which is EU-wide at the lower end with just 1.3% yearly growth between 2011 and 2016 (Eurostat 2018, see also section 2.1, page 5). Also, one of the farmers from the region just mentioned, realized this on his farm: He described an increasing input use, which is necessary to grow the crop varieties that he is using today, and in his opinion, the higher yields obtained do not compensate the higher input use financially. He related this problem to a very concentrated input market (e.g. fertilizers and pesticides) with a few big actors which overtook the market in Bulgaria.
This suggests, that there is there is still scope for improvement of productivity. Farmers need to find the optimal input-output mix. This is even more true for the objective of a sustainable production: Farming need to provide food and raw products without compromising environmental and social objectives. Within the BirdLife-model, the Transition Instrument for Sustainable Farming could help to support farming techniques and systems, which are less compromising for biodiversity, water and soil fertility. This will include all available techniques, using both, seed with high yield potential as well as locally adopted and therefore more sustainable breeds. This instrument might also help to transform animal husbandry to a more sustainable and animal friendly type of production by means of support for animal welfare, which was also demanded by one of the farmers. Animal welfare can also be expected to achieve more attention by society in the long medium term in Bulgaria.
Organic farming is a sustainable farming system, which simultaneously provides environmental goods and which complements the targeted measures of the BirdLife model. The detail result on the organic vegetable producer also highlights the necessity to improve the support for organic producer. Organic farming can be one solution for a development of the agricultural sector towards more sustainability.
6.3 The agricultural sector in Bulgaria has to face some socio-economic challenges
The interviews also revealed a number of socio-economic problems, which can partly be addressed by agricultural policy, but which are at the same time a challenge for social and tax policies in Bulgaria. The demographic structure of agriculture and the bifurcated agricultural sector, with a large number of very small, partly semi-subsistence farms and on the other hand, a small number of extremely large commercial farms pose a lot of income and equity challenges for farming. It might be an appropriate solution to think about a systematic inclusion of the farming sector into the social security net, since the CAP and the Transitional National Payments cannot completely solve social problems for the small farming sector without producing a number of unwanted side effects such as inefficiency of DP and incentives for an intensive competition on the land market.
Fit, fair and sustainable: A model for a nature friendly and economically viable agricultural policy for Bulgaria
42
Within the actual system of DP, landownership is the main key to receive subsidies. As soon as this is replaced by an appropriate social policy, ownership will not be an obstacle for an improved agricultural structure for medium-size farms. Furthermore, the negative side effects might be reduced. And finally agricultural payments can be focused on the provision of public goods.
The demographic structure might suggest to support young farmers. However, it might be noteworthy, that investment aids (such as the support for young farmers) are evaluated as problematic from an economic perspective, since they also create windfall gains within the sector.
6.4 Institutions and property rights
The interviews with farmers have highlighted the importance of property rights and legal enforcement. The topic of fraud and corruption was mentioned by five out of eleven farmers. Farmers report that different actors try to benefit from public money from the EU to Bulgaria. Fraud was also related to the imitations of the organic label. At the same time, some farmers criticized the strict EU regulations and restrictions with the argument that mainly small farmers who are not able to keep them and fall out of the legal market and are not able to get subsidies.
Farmers and experts report, that the environmental rules were not enforced. Institutions were perceived as weak and there was little trust in control mechanisms and the functioning of institutions (Expert 1 2018, Expert 2 2018 and Expert 3 2018).
The European Anti-Fraud Office (OLAF) reports about fraudulent cases in the area of agricultural and structural funds. This is especially the case for the EU pre-accession program SAPARD (OLAF 2015: p.29) and for the European Agricultural Fund for Rural Development (EAFRD) (OLAF 2016: p.14). It is still important to notice, that Bulgaria is among a number of other EU countries, where fraudulent cases have been reported, namely from Hungary, Slovakia, Romania, Malta, Spain, Greece and Italy (OLAF 2017: p.31). In addition, Kerelov (2018) reports on illegal land occupation and collusion among large farmers in order to get local monopolies, which allow them to pay low land rents to smallholder. He compares this type of illegal land appropriation and exploitation of land of small holders with Mafia methods. He also reports about a combination of subsidies, fraud and corruption.
Altogether, this still highlights the importance of institutions and compliance, which can enforce a policy. If institutions in the contrary case fail, farmers lose trust in the CAP. Therefore, it is crucial to improve the enforcement of the legal rules of the policy, which will strengthen participation and ownership of farmers towards the CAP-measures.
6.5 The CAP in Bulgaria needs a more efficient and transparent implementation
The recent implementation and policy design of the CAP-reform 2013 doesn’t support the development of the agricultural sector in Bulgaria in many respects. DP (coupled more than decoupled) influence farmers decisions on the choice of their specific production system and on inputs. After the implementation of the CAP-reform, the coupled payments have increased from 4.7% to 16.1% within two years, which distorts the agricultural production. For Bulgaria, the Transitional National Payments add to this problem, since they increase the distortive impacts of coupled DP.
In addition to this, the Direct Payments are not well justified: It is unclear, what the purpose of this instrument is. After the introduction in 1992, they were paid as full compensation of the decrease of intervention prices in 1992 and as partial compensation of the price decreases in 2000. However, this is more than 25 years ago and the Eastern European countries never had this level of high intervention prices. Therefore, the purpose of this policy instrument is unclear. Still as instrument of income policies, it is highly inefficient (Pe’er et al. 2017b), since parts of the DP are translated to land
Fit, fair and sustainable: A model for a nature friendly and economically viable agricultural policy for Bulgaria
43
owners, which are not necessarily farmers. This has also been described by experts and farmers mainly for North Eastern Bulgaria. Therefore, this subsidy only partly supports the active farmer.
Another side effect of the DP is described by the farmers and experts as increased and unfair competition on the land markets. Some (often large) farms use a strategy of subsidy maximization and capitalize subsidies on vast amounts of land (e.g. Expert 2).
A consequence of this strategy is an aggressive rental strategy by large farmers. Some farmer even describe these practices as partly or completely illegal. We did not find full evidence for illegal behaviour, however, the figures support this finding, since the increases in land prices are far beyond the productivity increases. Therefore, a large part of the increases in land prices are due to DP. This aggressive renting strategy for large farms is a problem for small famers, without the financial background to compete against the land bids of large farms. A reduction or phasing out of DP might at least reduce the intensity of competition.
The DP also incentivize the expansion of arable land by any means, which is a reason for the loss of grassland and landscape elements. Therefore, the incentives of DP have also negative environmental side effects – even if it is unclear, to what extent these anecdotal effects are representative.
The interviewed farmers also reported the distribution of DP to be unfair. Our calculations of Gini-Coefficients confirm this observation. The redistributive payments, introduced in 2014, have to a certain extent reduced inequality, which is still high in comparison to other EU countries. The first best option to address this problem is to clarify the objectives of DP. If public goods (based on cross compliance and Greening) are the main justification, inequality is a smaller problem, whereas if income would be the main justification, DP are inefficient to address this objective. Redistributive payments or capping at 60,000 EUR (as suggested for the next CAP-reform 2020) will not solve this inefficiency problem.
6.6 The CAP needs to address the environmental challenges
The literature and the interviews with the farmers and experts indicate that the implementation of the CAP had negative side effect on the environment. The eligibility criterium for DP states that grassland has to have less than 50 trees/shrubs per ha to receive agricultural funding. This has effectively lead to a large-scale removal of those landscape elements. It was also reported, that DP lead to conversion of grassland to arable land in order to receive SAPS-funding (Expert 1, 2018). This fits to the findings of Dobrev et al. (2014) who report on ploughing of grasslands even in Natura 2000 sites. These effects have to be addressed by the next reform in order to avoid to lose the natural landscapes, where landscape elements are integral element of farming.
In addition to this, the BSPB reports, that there were 14 infringement procedures for non-compliance with the Habitat directive (BSPB 2017, see also appendix 2). The BSPB also criticises the implementation of Agri-Environmental Measures: The uptake of measure for High-Nature Value (HNV) farmland is too low due to a lack of information and high administrative burdens. Furthermore, there is a lack of interest among large scale farms. BSPB recommends to improve the attractiveness of Agri-Environmental Measures especially for large scale farms, since there is a need for large scale implementation of measures dedicated to conservation and to restoration of natural grasslands and meadows. This is specifically true for birds habitats. Furthermore, the BSPB suggests to evaluate the specific role of changing arable production systems and further intensification of the management of arable land on the abundance of farmland birds (BSPB 2013).
Greening: The introduction of Greening and EFA has incentivized the use of area as fallow land and nitrogen fixing crops. According Pe’er et al. (2017a), fallow land, buffer and flowering strips and landscape elements are the effective EFA, whereas catch crops and nitrogen fixing crops were
Fit, fair and sustainable: A model for a nature friendly and economically viable agricultural policy for Bulgaria
44
evaluated by ecologists as rather ineffective (Pe’er et al. 2017a). In Bulgaria, fallow land has 62% of the total EFA, representing one of the largest values within the EU. The EU Commission has proposed that with the CAP-reform 2020, Greening will be replaced by a new environmental instrument, which is however quite vague and unclear. This poses the question, whether the phasing out of Greening might lead to a loss of conservation area. On the other hand, fallow land can also be supported by other Agri-Environmental Measures, which highlights again the necessity for a substantial CAP-reform, which supports environmental measures.
Conservation policy: With regards to Natura 2000 and the implementation of the EU Nature Directives, the balance is mixed. On first glance, a high proportion of area is declared as Sites of Community Interest (SCI) under the Habitats Directive. Furthermore, the Bulgarian government has used about 4,8% of the funds of the Rural Development Programs to support Natura 2000 and the Habitats Directive (see Factsheet RDP Bulgaria; EC 2016e), which is the largest share EU-wide and even in absolute terms the second largest budget used. However, there is still scope for improvement, especially if we take into account, that the largest share of area within the habitat regulation is in an unfavourable status. Furthermore, a large share of natural and semi-natural grassland was lost in the first years of the CAP. Therefore, it is crucial to continue the alignment of agri-environmental and conservation policy on the objectives of Natura 2000.
The provision of public goods other than environmental, like infrastructure and knowledge transfer/research in rural areas of Bulgaria has been mentioned as an important point during the different interviews with experts and farmers. This is something that could be tackled under the Rural Development Program, which, under the new reform model should stay in place but adapted better to local conditions of each EU country.
7 Conclusions
7.1 The I. Pillar of the CAP needs a substantial reform:
The implementation of the CAP-reform 2013 has introduced a number of inefficiencies by continuing the system of decoupled Direct Payments (DP), by extensively using the instrument of voluntary coupled payments and continuing the Transitional National Payments.
1) Reduce and phase out Direct Payments: The Bulgarian government should reduce and finally phase out the DP of I. Pillar. DP overall are poorly targeted and inefficient. In addition, we can observe a number of negative ecological side effects of DP in Bulgaria, as the conversion of grassland to arable land (without the intention to use this arable land and in order to maximize subsidies). In addition, the LPIS incentivises the removal of landscape elements, which has negative environmental side effects for biodiversity and for soil erosion. Furthermore this removal also affects the use as grazing ground for animals. DP distort markets and production and reduce the efficiency of farms. DP are transferred to land owner and distort land prices, as shown is Figure 4.
2) Phase out coupled payments and Transitional National Payments: The distortive effect of coupled payments is even stronger than with decoupled payments. There is a significant negative effect of coupled DP on farms technical efficiency. Coupled payments influence the production plan of farmers and thereby affect and distort markets and it makes the system of CAP payments complex and intransparent. Coupled DP also open the door for lobbyism and rent-seeking behaviour, where representatives of the small associations of specific production branches seek to increase the specific payments for their specific members. The idea of an equal level playing field suggests, that the same production system finds the same requirements and support within the EU. It is also important to avoid a subsidy race to the bottom, where every country tries to pay the highest coupled payments
Fit, fair and sustainable: A model for a nature friendly and economically viable agricultural policy for Bulgaria
45
to the farmers. Therefore, the Bulgarian government should undertake any efforts to phase out these payments.
3) Clarify objectives and priorities within the I. Pillar: The bifurcated size structure of farms and the demographic structure in the agricultural sector needs a clear view on social responsibilities: If the CAP is part of a system of social security especially for small and semi-subsistence farmers, then this should be taken into account when designing the system of DP. It might be appropriate to extend the small famers scheme. If coupled payments for animals are designed to support farmers with small incomes, then capping and higher rates for the first hectares/animals might be recommendable.
In the long run, the Bulgarian government should clarify, to what extent DP still serve social purposes to organize a demographic transformation. It is recommendable, to use the instruments of the general tax and social policy to support small and semi-subsistence farmers in Bulgaria instead of paying subsidies to the sector. In the long run, agricultural policy should be oriented to the principle that tax-payers money should support the provision of public goods in agriculture.
4) Adjust the Land Parcel Identification System (LPIS) to the grassland systems in Bulgaria: Dobrev et al. (2014) recommend to enforce the Land Parcel Identification System (LPIS) to capture also semi-natural and natural grassland and landscape elements. According Stefanova & Kazakova (2015), trees and shrubs are not included in LIPIS, which is one cause for the loss of those landscape elements.
5) Strengthen legal enforcement: The outcome of the interviews with farmers reveal that institutions and property rights do not work properly. Farmers perceive half illegal actions (as e.g. the conversion of grassland or the removal of landscape elements) as problematic. It has also been reported on stolen harvests and illegal land expropriation, which leads to mistrust of farmers towards the agricultural policy in specifically and the political system in general. The Bulgarian government should investigate such cases and think about the enforcement of property rights and institutional control.
7.2 The agri-environmental policies need more support
6) Strengthen Agri-Environmental Measures: The status of biodiversity has degraded during the last ten years, as it was shown based on the report of the habitat regulation (section 2.4) and the BSPB birds index (see Figure 9). The agri-environmental schemes and the organic farming support receive relatively low funds within the agri-environmental schemes. In addition, some farmers criticised missing information and accessibility to contracts. Information and extension can also contribute to higher participation rates of AEM. Regional and local adjustment of Agri-environmental schemes are important, therefore it might be appropriate to differentiate payments according e.g. regional yield potentials. Agri-environmental programs need to get more funding, alongside with more transparency, information and advisory on the measures, in order to increase the participation rate and to improve the environmental situation in Bulgaria.
7) The Birdlife model provides alternatives for improved agri-environmental programs: The voluntary schemes allow more targeted measures with higher payment rates. At the same time, the model can help to improve the income situation of farms providing environmental goods and services. The Space for Nature is a simple entry level support scheme with little administration costs, while the Nature and Biodiversity Instrument offers complex and targeted measures, which will help to protect endangered species and habitats. The advisory and management payment can support via extensions and thereby the local implementation of agri-environmental programs on the farms.
8) Align agri-environmental programs to Natura 2000: Bulgaria has a rich biodiversity, which is reflected by the large share of Natura 2000 Sites of Community Interest (SCI) of 30%. However, the largest share of habitats and species are in an unfavourable status. Furthermore, the abundance of
Fit, fair and sustainable: A model for a nature friendly and economically viable agricultural policy for Bulgaria
46
farmland birds has declined by 21% between 2005 and 2013. Therefore, it is important to align the agri-environmental programs to the objectives of Natura 2000. Dobrev et al. (2014) recommends a consideration of conservation practices and sustainable use of grassland protected by Natura 2000 by state institutions (Dobrev et al. 2014). The Bulgarian government has used 4.8% of the RDP-funds for Natura 2000, which is the largest proportion of funds for biodiversity within the EU. With the application of the BirdLife model, the support for biodiversity within Natura 2000 could be strengthened and improved.
9) Enforce environmental legislation and controls: Some interviewed farmers criticised missing controls and monitoring. The criticism on missing property rights also applies to environmental laws: If farmers perceive legislation as intransparent, the implementation of environmental measures suffers from mistrust and missing “ownership” (i.e. motivation) by farmers. Therefore, functioning legislation is a precondition for higher uptake and better results of agri-environmental policies. The Bulgarian government might also evaluate the implementation of environmental legislation and the negative environmental side effects of the CAP implementation, in order to address the described problems.
10) Improve extension, information and education: Extension services, knowledge and education can help to improve all the listed problems by helping farmers to choose the best available techniques and make optimal production choices. Sustainable farming and optimal input requires knowledge. Extension services, information and education will also be a crucial factor to improve the environmental quality of farming and to support the maintenance and support of biodiversity in Bulgaria.
Fit, fair and sustainable: A model for a nature friendly and economically viable agricultural policy for Bulgaria
47
Sources:
Birdlife International (2017): Towards a new European Food and Land Use Policy; Position paper of the Birdlife International in October 2017; Brussels, Belgium. url: https://www.birdlife.org/sites/default/files/attachments/cap_position_paper_v6_final.pdf (last access 27.05.2017)
BSPB (2017): Natura 2000; Website of the Bulgarian Society for the Protection of Birds (BSPB); Sofia. Url: http://bspb.org/en/natura.html (last access 26.04.2018).
BSPB (2013): The State of Bulgaria’s Common Birds; Report by the Bulgarian Society for the Protection of Birds (BSPB); Sofia; url: http://bspb.org/monitoring/en/reports.html (last access 30.05.2018).
Ciaian, P. & d’A. Kancs (2012): The Capitalization of Area Payments into Farmland Rents: Micro Evidence from the New EU Member States Canadian Journal of Agricultural Economics 60: 517–540 ; doi: 10.1111/j.1744-7976.2012.01256.x
Karchanova, D. (2012): CAP and its implementation in Bulgaria; Presentation of the Ministry of Agriculture and Food of Bulgaria, url: http://cap.europe.bg/upload/docs/2012-06/02_karchanova_EN.pdf (last access 28.05.2018)
Dobrev, V, G. Popgeorgiev & D. Plachiyski (2014): Effects of the Common Agricultural Policy on the coverage of grassland habitats in Besaparski Ridove Special Protection Area (Natura 2000), southern Bulgaria. Acta Zoologica Bulgarica, Supplement 5: 147-155.
EC (2015): The State of Nature in the EU - Reporting under the EU Habitats and Birds Directives 2007–2012; Report by the European Commission (EC); DG Environment
EC (2016a): Greening after one year, Commission Staff Working Document; SWD (2016) 2018 final, Part 1, 3 and 4; Brussels
EC (2016b): Direct Payments 2015-2020 - Decisions taken by Member States: State of play as at June 2016; Information note by the EU Commission (EC), DG Agricultural and Rural Development; Brussels, url:
EC (2016e): Rural development Programs 2014-2020: Country files; Website of the EU Commission (EC); Brussels; url: https://ec.europa.eu/agriculture/rural-development-2014-2020/country-files_en
EC (2016f): Natura 2000 Barometer; Information of the EU Commission (EC), DG Environment; url: http://ec.europa.eu/environment/nature/natura2000/barometer/index_en.htm (last access 20.04.2018)
EC (2017a): CAP your country – Bulgaria, Factsheet by the European Commission (EC), June 2017; Brussels, url: https://ec.europa.eu/agriculture/sites/agriculture/files/cap-in-your-country/pdf/bg_en.pdf (last access 21.04.2018).
EC (2017b): CAP context indicators 2014-2020 – No. 27 Total Factor Productivity; Documentation of the context indictor by the European Commission (EC), DG Agriculture and Rural Development, Brussels, url. https://ec.europa.eu/agriculture/cap-indicators/context/2017/c27_en.pdf (last access 21.05.2018).
EC (2017c): Direct Payments: Single Area Payment Scheme and Transitional National Aid; Factsheet by the European Commission (EC), DG Agriculture and Rural Development, Brussels; June 2017; url: https://ec.europa.eu/agriculture/sites/agriculture/files/direct-support/direct-payments/docs/single-payment-scheme-and-transitional-aid_en.pdf (last access 23.05.2018).
EC (2018a): Active Farmer - Decisions taken by Member States following the entry into force of the Omnibus Regulation April 2018. Information note by the European Commission (EC), DG Agriculture and Rural Development, Brussels; url: https://ec.europa.eu/agriculture/sites/agriculture/files/direct-support/direct-payments/docs/simplementation-decisions-ms-2016_en.pdf
Fit, fair and sustainable: A model for a nature friendly and economically viable agricultural policy for Bulgaria
48
EC (2018b): Natura 2000 Newsletter; Information by the European Commission (EC), DG Environment, Brussels, 02/2018. url: http://ec.europa.eu/environment/nature/info/pubs/docs/nat2000newsl/nat43_en.pdf (last access 24.05.2018).
EC [a]: Indicative figures on the distribution of aid, by size-class of aid, received in the context of direct aid paid to the producers according to council regulation (EC) No. 73/2009; Report by the EU Commission, Brussels, 2008-2016. url:
Eurostat (2018): Database Agriculture, Luxembourg; url: http://ec.europa.eu/eurostat/data/database (last access 22.05.2018).
Faostat (2017): Data on Production; url: http://www.fao.org/faostat/en/#data (last access 28.05.2018).
Fuglie, K. O. 2012. Productivity Growth and Technology Capital in the Global Agricultural Economy. In: Fuglie, K. O., Wang, S. L. and Ball, V. E. (eds) Productivity Growth in Agriculture: An International Perspective. CAB International, Oxfordshire, UK, 335–368.
InteliAgro (2017): Database on crop products; url: http://inteliagro.bg/category/22/DataBase (last access 26.05.2018).
Kazukauskas, A., C. Newman & J. Sauer (2014): The impact of decoupled subsidies on productivity in agriculture: a cross-country analysis using microdata. Agricultural Economics 45: pp. 327-336.
Kerelov, G. (2018): Mafia rules in Bulgarian agriculture with the help of EU subsidies; Web article on the website of the Bulgarian EU Presidency, 18.January 2018; url: http://bulgarianpresidency.eu/mafia-rules-bulgarian-agriculture-help-eu-subsidies/ (last access 30.05.2018)
KTBL (2018): Cost – Revenue online Calculator; Online tool provided by Kuratorium für Technik und Bauwesen in der Landwirtschaft (KTBL); Darmstadt, Germany; url: https://www.ktbl.de/online-anwendungen0/ (last access 22.05.2018)
Kuckartz, U. (2014): Qualitative Inhaltsanalyse. Methoden, Praxis, Computerunterstützung. 2. Edition. Beltz Juventa, Weinheim & Basel, Germany.
Latruffe, L., & Y. Desjeux (2016): Common Agricultural Policy support, technical efficiency and productivity change in French agriculture. Review of Agricultural, Food and Environmental Studies 97: pp. 15-28
Latruffe, L., B.E. Bravo-Ureta, A. Carpentier, Y. Desjeux & V.H. Moreira (2017): Subsidies and technical efficiency in agriculture: Evidence from European dairy farms. American Journal of Agricultural Economics 99: pp. 783-799.
MARD [a] Agricultural Report 2011-2017; Ministry for Agriculture and Rural Development Bulgaria (MARD); Sofia; url: http://www.mzh.government.bg/en/policies-and-programs/reports/agricultural-report/ (last access 26.05.2018).
MARD (2014): Agrostatistical Reference Book; Report provided by the Ministry for Agriculture and Rural Development Bulgaria (MARD); Sofia; url: http://www.mzh.government.bg/bg/media/ (last access 15.02.2018)
Minviel, J.J. & L. Latruffe (2017): Effect of public subsidies on farm technical efficiency: a meta-analysis of empirical results. Applied Economics 49: pp. 213-226.
MOEW (2015): National Summary for Article 17; Report on the conservation status according the habitat regulation by the Ministry of Environment and Water Bulgaria (MOEW); Sofia; url: https://circabc.europa.eu/sd/a/c3d5d7f4-fc6f-4f0e-ad96-9522d398d3b6/BG_20140528.pdf (last access 26.05.2018).
OLAF 2015: The OLAF report 2014; Fifteenth report of the European Anti-Fraud Office, 1 January to 31 December 2014; Brussels, Belgium
Fit, fair and sustainable: A model for a nature friendly and economically viable agricultural policy for Bulgaria
49
OLAF 2016: The OLAF Report 2015; Sixteenth report of the European Anti-Fraud Office, 1 January to 31 December 2015; Brussels, Belgium
OLAF 2017: The OLAF Report 2016; Seventeenth report of the European Anti-Fraud Office, 1 January to 31 December 2016; Brussels, Belgium
Oppermann, R., A. Fried, N. Lepp, T. Lepp & S. Lakner (2016): Fit, fair and sustainable – Proposals for a new EU Agricultural Policy (in German), Study for Naturschutzbund e.V., Berlin, in Germany.
Pe’er, G., L. V. Dicks, P. Visconti, R. Arlettaz, A. Báldi, T. G. Benton, S. Collins, M. Dieterich, R. D. Gregory, F. Hartig, K. Henle, P. R. Hobson, D. Kleijn, R. K. Neumann, T. Robijns, J. Schmidt, A. Shwartz, W.J. Sutherland, A. Turbé, F. Wulf and A. V. Scott (2014): EU agricultural reform fails on biodiversity, Science 344, 6188, pp. 1090-1092, doi: 10.1126/science.1253425
Pe'er, G., Y. Zinngrebe, J. Hauck, S. Schindler, A. Dittrich, S. Zingg, T. Tscharntke, R. Oppermann, L. Sutcliffe, C. Sirami, J. Schmidt, C. Hoyer, C. Schleyer and S. Lakner (2017a): Adding some green to the Greening: improving the EU's Ecological Focus Areas for biodiversity and farmers, Conservation Letters 10 (5): 517–530, DOI: 10.1111/conl.12333.
Pe’er, G., S. Lakner, R. Müller, G. Passoni, V. Bontzorlos, D. Clough, F. Moreira, C. Azam, J. Berger, P. Bezak, A. Bonn, B. Hansjürgens, L. Hartmann, J. Kleemann, A. Lomba, A. Sahrbacher, S. Schindler, C. Schleyer, J. Schmidt, S. Schüler, C. Sirami, M. von Meyer-Höfer, Y. Zinngrebe (2017b): Is the CAP Fit for purpose? An evidence-based fitness-check assessment, Report, published by iDiv Leipzig, Birdlife Brussels and NABU Berlin.
Petkov, N., A.L. Harrison, A. Stamenov & G.M. Hilton (2016): The impact of wintering geese on crop yields in Bulgarian Dobrudzha: implications for agri-environment schemes; European Journal of Wildlife Research 63: 66. https://doi.org/10.1007/s10344-017-1119-0
Popgeorgiev, G., N. Tzankov, Y. Kornilev, D. Plachiyski, B. Naumov, A. Stoyanov (2014): Changes in Agri-environmental Practices Pose a Threat to the Herpetofauna: a Case Study from Besaparski Ridove Special Protection Area (Natura 2000), Southern Bulgaria, Acta Zoologica Bulgarica Suppl. 5: 157-169.
Sanders, J., M. Stolze & S. Padel (2011): Use and efficiency of public support measures addressing organic farming; Report by the Thünen Institute for Farm Economics, Braunschweig, Germany, url:
Stefanova, V. & Y. Kazakova (2015): Country report on the implementation of the new CAP and its possible effects on permanent pastures: Bulgaria; Report for the European Forum on Nature Conservation and Pastoralism; Lampeter, United Kingdom.
GAIN (2016): Bulgaria - Organic Sector and Trade Update; Report of 14/02/2016 provided by the foreign service of the United states department for agriculture, the Global Agricultural Information Network (GAIN); Washington, USA. Url: https://gain.fas.usda.gov/Recent%20GAIN%20Publications/Organic%20Sector%20and%20Trade%20Update_Sofia_Bulgaria_12-14-2016.pdf (last access 28.05.2018).
Valkanov, N. & S. Grebenicharski (2017): CAP: 10 years in Bulgaria – Does the European Common Agricultural Policy meet its goal. Study by InteliAgro; Sofia, Bulgaria.
World Bank (2018): the World Bank data base, url: https://data.worldbank.org (last access 21.05.2018).
Zhu, X., R. M. Demeter, & A.O. Lansink (2012): Technical efficiency and productivity differentials of dairy farms in three EU countries: the role of CAP subsidies. Agricultural Economics Review 13-66.
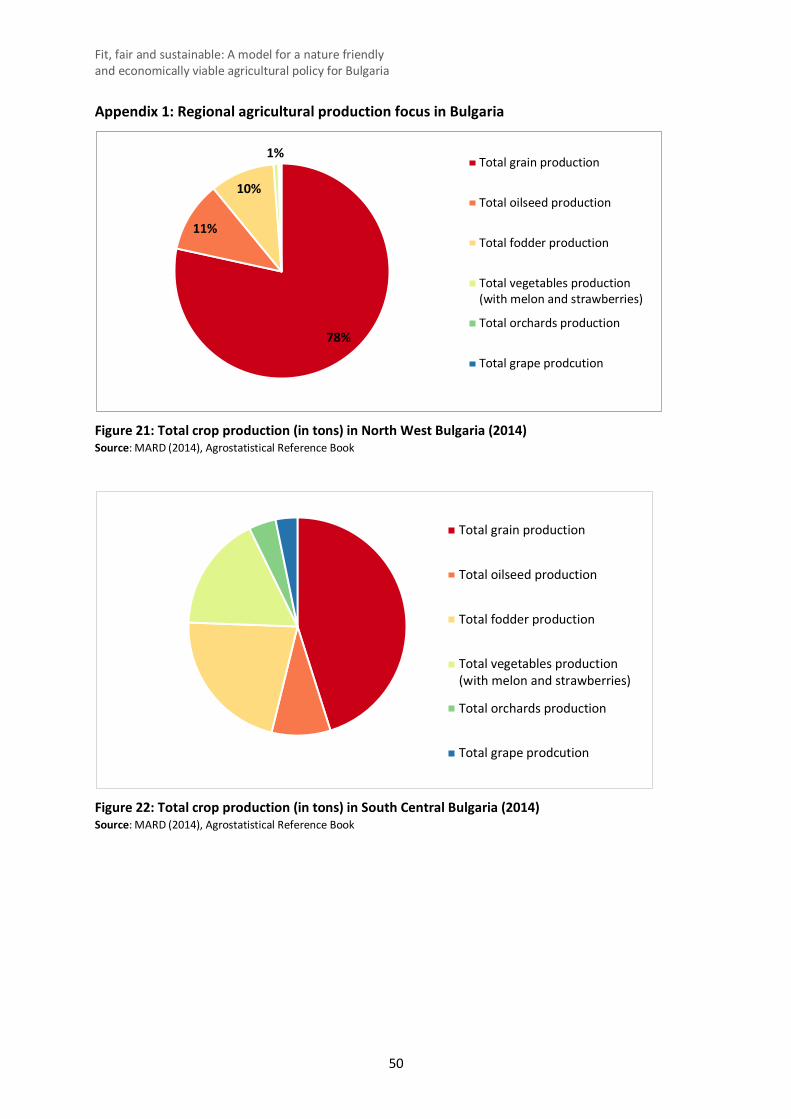
Fit, fair and sustainable: A model for a nature friendly and economically viable agricultural policy for Bulgaria
50
Appendix 1: Regional agricultural production focus in Bulgaria
Figure 21: Total crop production (in tons) in North West Bulgaria (2014) Source: MARD (2014), Agrostatistical Reference Book
Figure 22: Total crop production (in tons) in South Central Bulgaria (2014) Source: MARD (2014), Agrostatistical Reference Book
78%
11%
10%
1%Total grain production
Total oilseed production
Total fodder production
Total vegetables production(with melon and strawberries)
Total orchards production
Total grape prodcution
Total grain production
Total oilseed production
Total fodder production
Total vegetables production(with melon and strawberries)
Total orchards production
Total grape prodcution
Fit, fair and sustainable: A model for a nature friendly and economically viable agricultural policy for Bulgaria
51
Appendix: 2: Information on the status of Natura 2000 in Bulgaria (BSPB 2017)
What percentage of the territory of a member state should be included in the NATURA 2000 network?
“The Directives are not indicative as to the percentage of land or water area to be included in the NATURA 2000 network. That depends on the biological diversity of the particular region. For example, if a certain member state has a great diversity of species and respectively a great number of places inhabited by them, it is logical that the size of the protected areas correspond to the richness of biological species.
Bulgaria has one of the highest levels of biodiversity in Europe. Here the areas which are of the greatest importance for the birds and conform to the standardized criteria for the European Union include about 23.6% of the territory of the country; almost the entire area (22.7%) has been included in the NATURA 2000 network. Outside the NATURA 2000 comes the territory of Rila Important Bird Area which falls outside the boundaries of the national park and the nature park. The Council of Ministers has approved protected areas under the Directive on habitats on a territory measuring 30% of the territory of the country. Due to the significant overlap of the two types of protected areas the total coverage of the NATURA 2000 network in Bulgaria is 34.4% of its territory. Also, NATURA 2000 includes the coastal marine area which is important for the conservation of endangered species and habitats.”
“According to information of the Ministry of Environment and Water in October 2013 there were 14 infringement procedures for non-compliance with the European environmental legislation. Some of those resulted from infringement of the Directive on birds and the Directive on habitats. In October 2013 the EU decreed to bring Bulgaria to court for the ineffective protection of Kaliakra Protected Area.”
Text is a direct quotation from BSPB (2017).
Fit, fair and sustainable: A model for a nature friendly and economically viable agricultural policy for Bulgaria
52
Appendix 3: Legal basis of coupled support in the CAP-reforms 2009 and 2013
EU Regulation 73/2009 (Health check)
Article 68
1. Member States may grant specific support to farmers under the conditions laid down in this Chapter:
(a) for:
(i) specific types of farming which are important for the protection or enhancement of the environment;
(ii) improving the quality of agricultural products; (iii) improving the marketing of agricultural products; (iv) practising enhanced animal welfare standards; (v) specific agricultural activities entailing additional agri-environment benefits;
(b) To address specific disadvantages affecting farmers in the dairy, beef and veal, sheep meat and goatmeat and rice sectors in economically vulnerable or environmentally sensitive areas, or, in the same sectors, for economically vulnerable types of farming;
Article 69
Financial provisions for specific support 1. Member States may decide, by 1 August 2009, 1 August 2010 or 1 August 2011, to use from the year following that decision up to 10 % of their national ceiling referred to in Article 40, or, in the case of Malta, the amount of EUR 2 000 000 for the specific support provided for in Article 68(1).
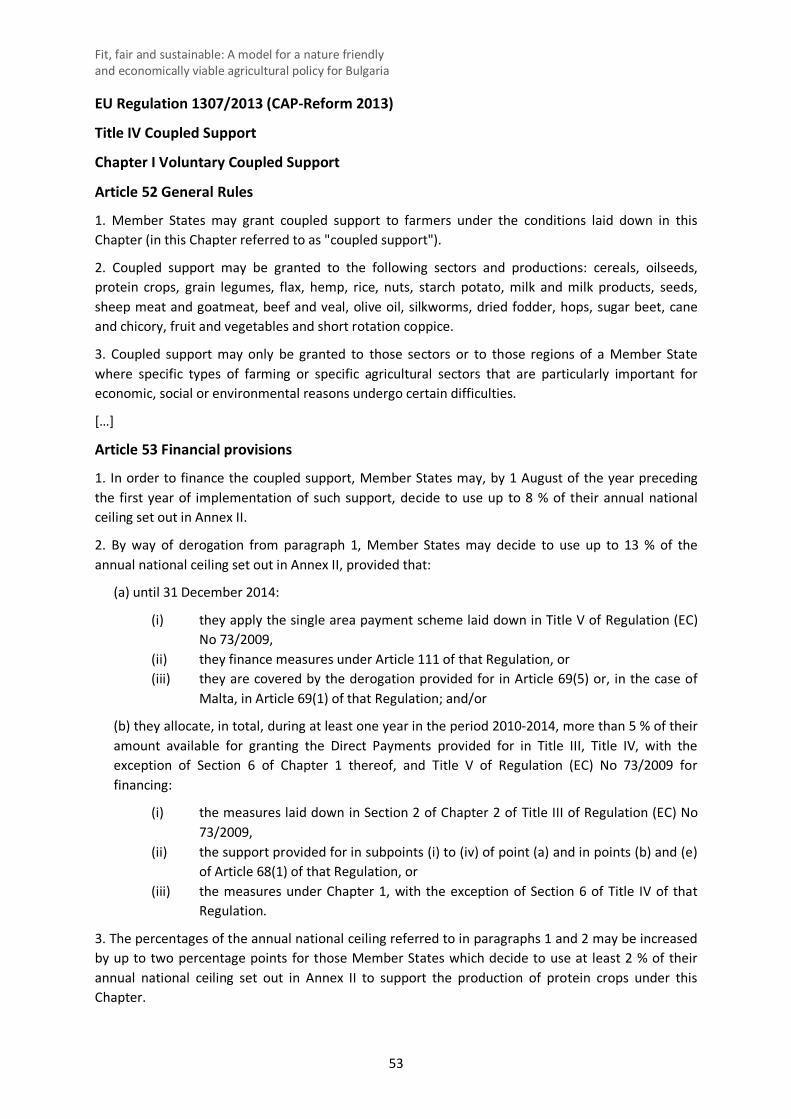
Fit, fair and sustainable: A model for a nature friendly and economically viable agricultural policy for Bulgaria
53
EU Regulation 1307/2013 (CAP-Reform 2013)
Title IV Coupled Support
Chapter I Voluntary Coupled Support
Article 52 General Rules
1. Member States may grant coupled support to farmers under the conditions laid down in this Chapter (in this Chapter referred to as "coupled support").
2. Coupled support may be granted to the following sectors and productions: cereals, oilseeds, protein crops, grain legumes, flax, hemp, rice, nuts, starch potato, milk and milk products, seeds, sheep meat and goatmeat, beef and veal, olive oil, silkworms, dried fodder, hops, sugar beet, cane and chicory, fruit and vegetables and short rotation coppice.
3. Coupled support may only be granted to those sectors or to those regions of a Member State where specific types of farming or specific agricultural sectors that are particularly important for economic, social or environmental reasons undergo certain difficulties.
[…]
Article 53 Financial provisions
1. In order to finance the coupled support, Member States may, by 1 August of the year preceding the first year of implementation of such support, decide to use up to 8 % of their annual national ceiling set out in Annex II.
2. By way of derogation from paragraph 1, Member States may decide to use up to 13 % of the annual national ceiling set out in Annex II, provided that:
(a) until 31 December 2014:
(i) they apply the single area payment scheme laid down in Title V of Regulation (EC) No 73/2009,
(ii) they finance measures under Article 111 of that Regulation, or (iii) they are covered by the derogation provided for in Article 69(5) or, in the case of
Malta, in Article 69(1) of that Regulation; and/or
(b) they allocate, in total, during at least one year in the period 2010-2014, more than 5 % of their amount available for granting the Direct Payments provided for in Title III, Title IV, with the exception of Section 6 of Chapter 1 thereof, and Title V of Regulation (EC) No 73/2009 for financing:
(i) the measures laid down in Section 2 of Chapter 2 of Title III of Regulation (EC) No 73/2009,
(ii) the support provided for in subpoints (i) to (iv) of point (a) and in points (b) and (e) of Article 68(1) of that Regulation, or
(iii) the measures under Chapter 1, with the exception of Section 6 of Title IV of that Regulation.
3. The percentages of the annual national ceiling referred to in paragraphs 1 and 2 may be increased by up to two percentage points for those Member States which decide to use at least 2 % of their annual national ceiling set out in Annex II to support the production of protein crops under this Chapter.
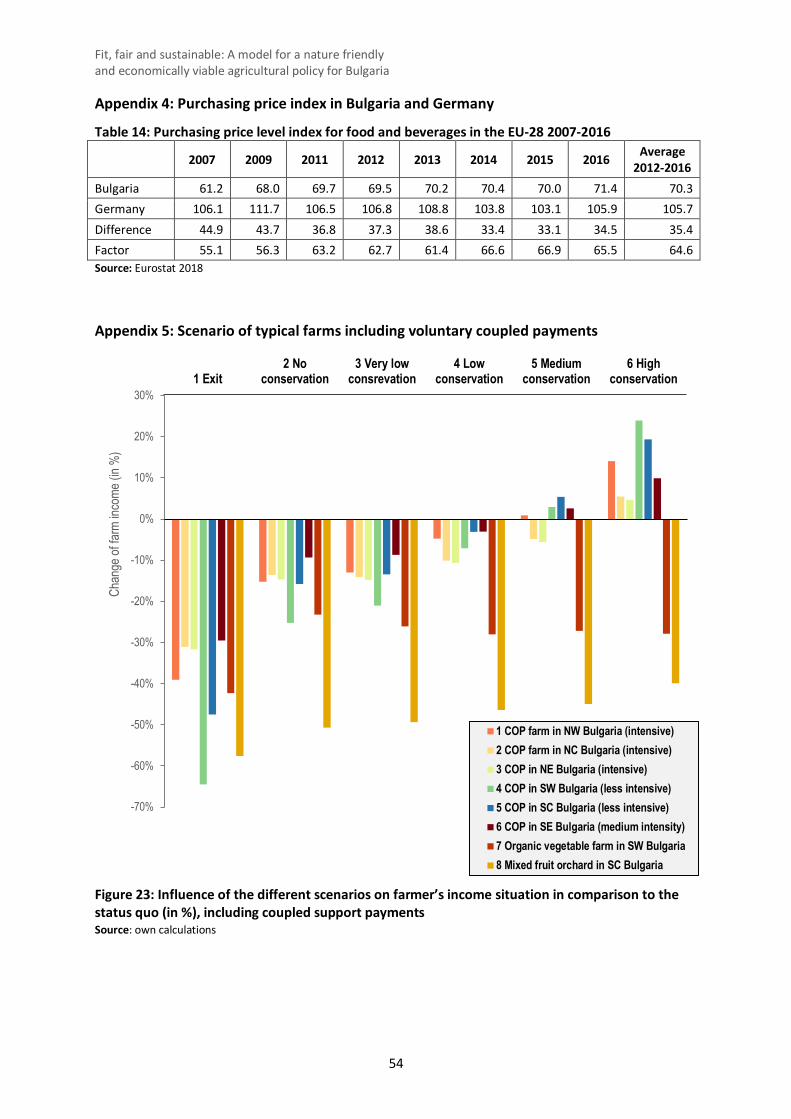
Fit, fair and sustainable: A model for a nature friendly and economically viable agricultural policy for Bulgaria
54
Appendix 4: Purchasing price index in Bulgaria and Germany
Table 14: Purchasing price level index for food and beverages in the EU-28 2007-2016 2007 2009 2011 2012 2013 2014 2015 2016 Average
2012-2016 Bulgaria 61.2 68.0 69.7 69.5 70.2 70.4 70.0 71.4 70.3 Germany 106.1 111.7 106.5 106.8 108.8 103.8 103.1 105.9 105.7 Difference 44.9 43.7 36.8 37.3 38.6 33.4 33.1 34.5 35.4 Factor 55.1 56.3 63.2 62.7 61.4 66.6 66.9 65.5 64.6 Source: Eurostat 2018
Appendix 5: Scenario of typical farms including voluntary coupled payments
Figure 23: Influence of the different scenarios on farmer’s income situation in comparison to the status quo (in %), including coupled support payments Source: own calculations
-70%
-60%
-50%
-40%
-30%
-20%
-10%
0%
10%
20%
30%1 Exit
2 Noconservation
3 Very lowconsrevation
4 Lowconservation
5 Mediumconservation
6 Highconservation
Chan
ge of
farm
inco
me (in
%)
1 COP farm in NW Bulgaria (intensive)2 COP farm in NC Bulgaria (intensive)3 COP in NE Bulgaria (intensive)4 COP in SW Bulgaria (less intensive)5 COP in SC Bulgaria (less intensive)6 COP in SE Bulgaria (medium intensity)7 Organic vegetable farm in SW Bulgaria8 Mixed fruit orchard in SC Bulgaria
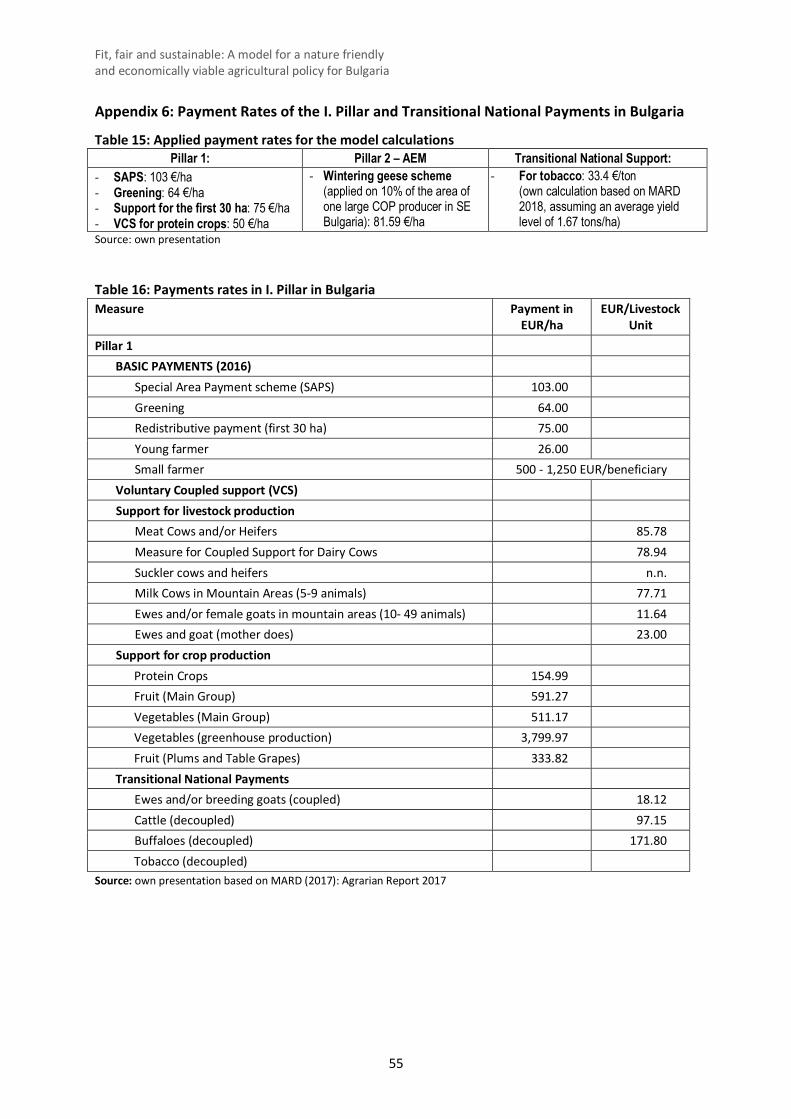
Fit, fair and sustainable: A model for a nature friendly and economically viable agricultural policy for Bulgaria
55
Appendix 6: Payment Rates of the I. Pillar and Transitional National Payments in Bulgaria
Table 15: Applied payment rates for the model calculations Pillar 1: Pillar 2 – AEM Transitional National Support:
- SAPS: 103 €/ha - Greening: 64 €/ha - Support for the first 30 ha: 75 €/ha - VCS for protein crops: 50 €/ha
- Wintering geese scheme (applied on 10% of the area of one large COP producer in SE Bulgaria): 81.59 €/ha
- For tobacco: 33.4 €/ton (own calculation based on MARD 2018, assuming an average yield level of 1.67 tons/ha)
Source: own presentation
Table 16: Payments rates in I. Pillar in Bulgaria Measure Payment in
EUR/ha EUR/Livestock
Unit Pillar 1
BASIC PAYMENTS (2016) Special Area Payment scheme (SAPS) 103.00 Greening 64.00 Redistributive payment (first 30 ha) 75.00 Young farmer 26.00 Small farmer 500 - 1,250 EUR/beneficiary
Voluntary Coupled support (VCS) Support for livestock production
Meat Cows and/or Heifers 85.78 Measure for Coupled Support for Dairy Cows 78.94 Suckler cows and heifers n.n. Milk Cows in Mountain Areas (5-9 animals) 77.71 Ewes and/or female goats in mountain areas (10- 49 animals) 11.64 Ewes and goat (mother does) 23.00
Support for crop production Protein Crops 154.99 Fruit (Main Group) 591.27 Vegetables (Main Group) 511.17 Vegetables (greenhouse production) 3,799.97 Fruit (Plums and Table Grapes) 333.82
Transitional National Payments Ewes and/or breeding goats (coupled) 18.12 Cattle (decoupled) 97.15 Buffaloes (decoupled) 171.80 Tobacco (decoupled)
Source: own presentation based on MARD (2017): Agrarian Report 2017
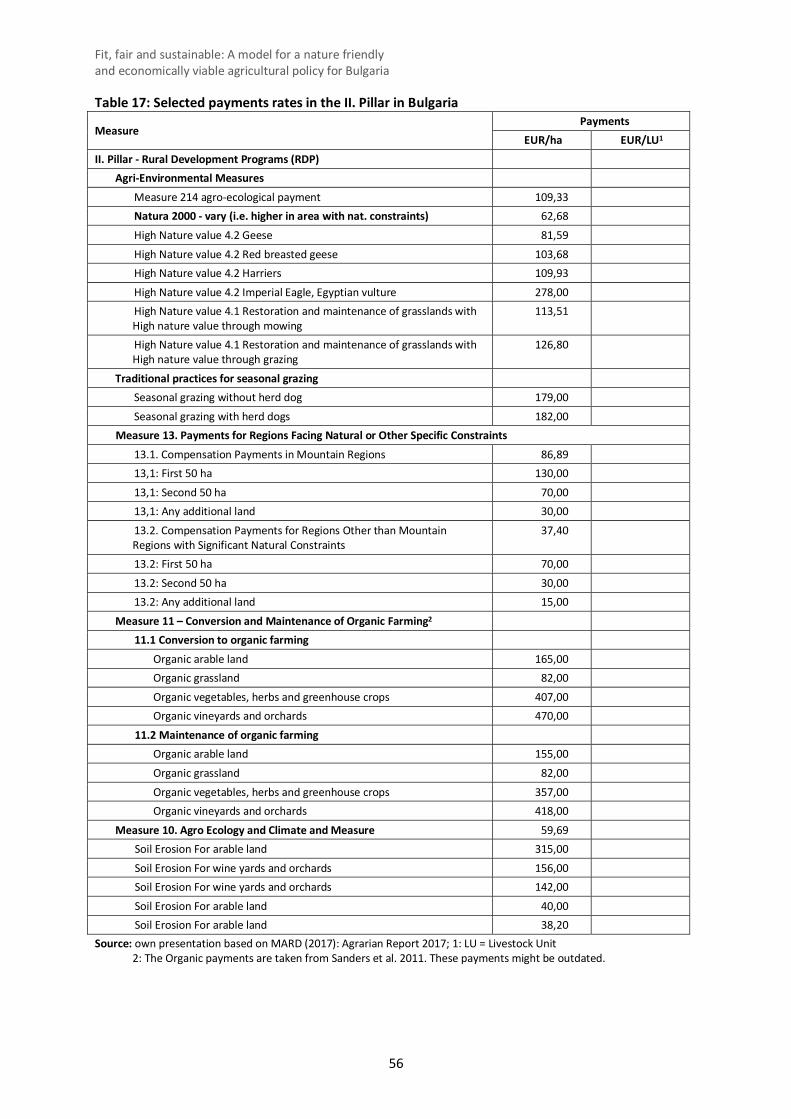
Fit, fair and sustainable: A model for a nature friendly and economically viable agricultural policy for Bulgaria
56
Table 17: Selected payments rates in the II. Pillar in Bulgaria
Measure Payments
EUR/ha EUR/LU1 II. Pillar - Rural Development Programs (RDP)
Agri-Environmental Measures Measure 214 agro-ecological payment 109,33 Natura 2000 - vary (i.e. higher in area with nat. constraints) 62,68 High Nature value 4.2 Geese 81,59 High Nature value 4.2 Red breasted geese 103,68 High Nature value 4.2 Harriers 109,93 High Nature value 4.2 Imperial Eagle, Egyptian vulture 278,00 High Nature value 4.1 Restoration and maintenance of grasslands with High nature value through mowing
113,51
High Nature value 4.1 Restoration and maintenance of grasslands with High nature value through grazing
126,80
Traditional practices for seasonal grazing Seasonal grazing without herd dog 179,00 Seasonal grazing with herd dogs 182,00
Measure 13. Payments for Regions Facing Natural or Other Specific Constraints 13.1. Compensation Payments in Mountain Regions 86,89 13,1: First 50 ha 130,00 13,1: Second 50 ha 70,00 13,1: Any additional land 30,00 13.2. Compensation Payments for Regions Other than Mountain Regions with Significant Natural Constraints
37,40
13.2: First 50 ha 70,00 13.2: Second 50 ha 30,00 13.2: Any additional land 15,00
Measure 11 – Conversion and Maintenance of Organic Farming2 11.1 Conversion to organic farming
Organic arable land 165,00 Organic grassland 82,00 Organic vegetables, herbs and greenhouse crops 407,00 Organic vineyards and orchards 470,00
11.2 Maintenance of organic farming Organic arable land 155,00 Organic grassland 82,00 Organic vegetables, herbs and greenhouse crops 357,00 Organic vineyards and orchards 418,00
Measure 10. Agro Ecology and Climate and Measure 59,69 Soil Erosion For arable land 315,00 Soil Erosion For wine yards and orchards 156,00 Soil Erosion For wine yards and orchards 142,00 Soil Erosion For arable land 40,00 Soil Erosion For arable land 38,20
Source: own presentation based on MARD (2017): Agrarian Report 2017; 1: LU = Livestock Unit 2: The Organic payments are taken from Sanders et al. 2011. These payments might be outdated.