Embed Size (px)
Citation preview
Tanya Langman
April 2018
Fitch Analytical Comparative Tool (FACT): U.S. Toll Roads
Criteria Overview and FACT Walkthrough
1
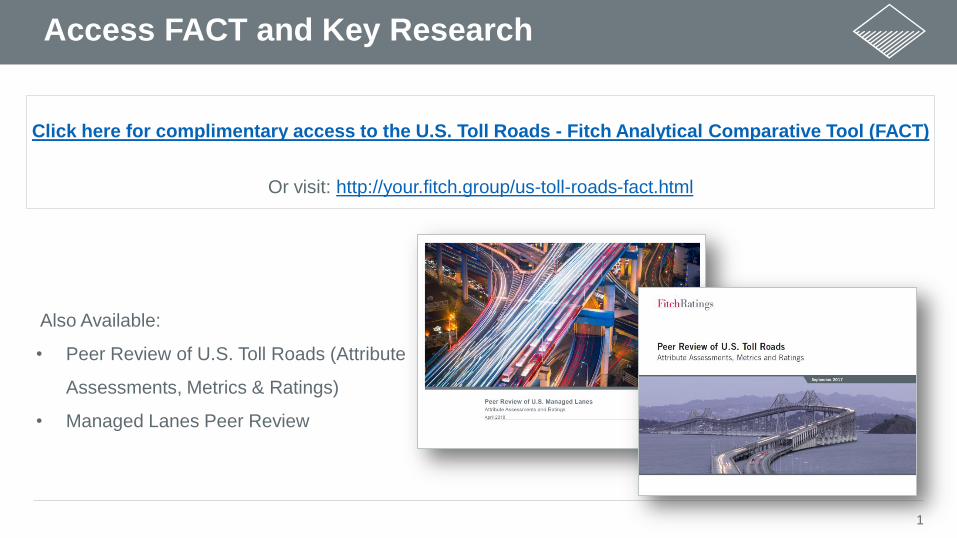
Access FACT and Key Research
Click here for complimentary access to the U.S. Toll Roads - Fitch Analytical Comparative Tool (FACT)
Or visit: http://your.fitch.group/us-toll-roads-fact.html
Also Available:
• Peer Review of U.S. Toll Roads (Attribute
Assessments, Metrics & Ratings)
• Managed Lanes Peer Review
2
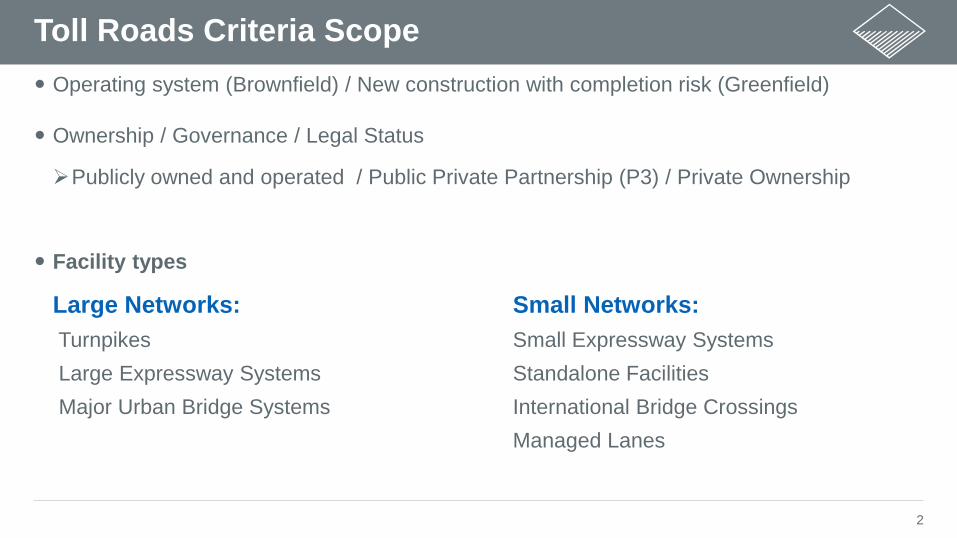
Toll Roads Criteria Scope
Operating system (Brownfield) / New construction with completion risk (Greenfield)
Ownership / Governance / Legal Status
Publicly owned and operated / Public Private Partnership (P3) / Private Ownership
Facility types
Large Networks: Small Networks:
Turnpikes Small Expressway Systems
Large Expressway Systems Standalone Facilities
Major Urban Bridge Systems International Bridge Crossings
Managed Lanes
3
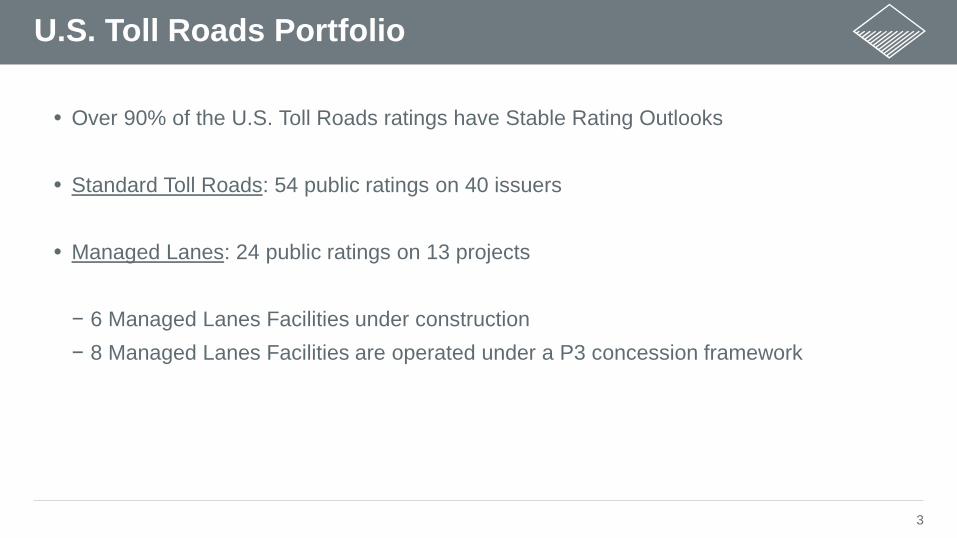
U.S. Toll Roads Portfolio
Over 90% of the U.S. Toll Roads ratings have Stable Rating Outlooks
Standard Toll Roads: 54 public ratings on 40 issuers
Managed Lanes: 24 public ratings on 13 projects
− 6 Managed Lanes Facilities under construction
− 8 Managed Lanes Facilities are operated under a P3 concession framework
4
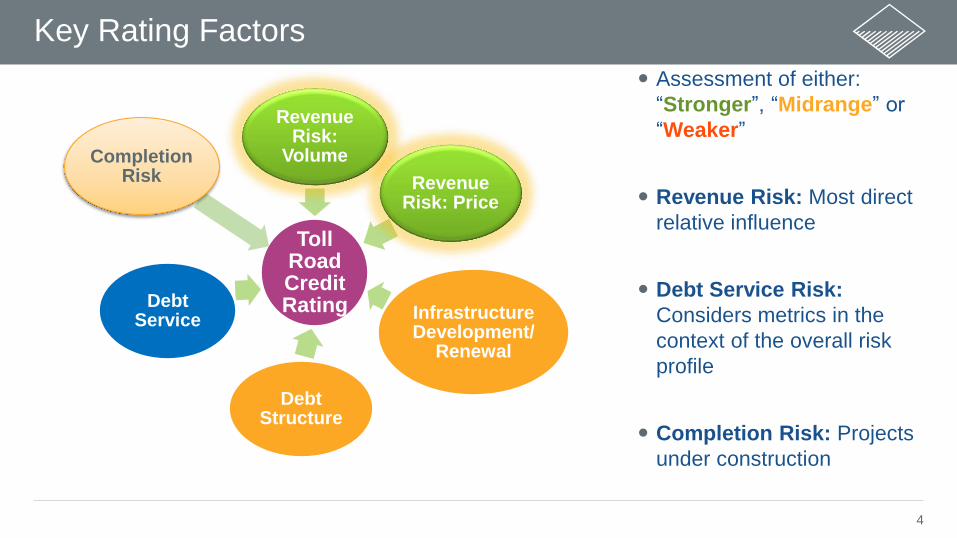
Key Rating Factors
Toll Road Credit Rating
Revenue Risk:
Volume
Revenue Risk: Price
Infrastructure Development/
Renewal
Debt Structure
Debt Service
Completion Risk
Assessment of either:
“Stronger”, “Midrange” or
“Weaker”
Revenue Risk: Most direct
relative influence
Debt Service Risk:
Considers metrics in the
context of the overall risk
profile
Completion Risk: Projects
under construction
5
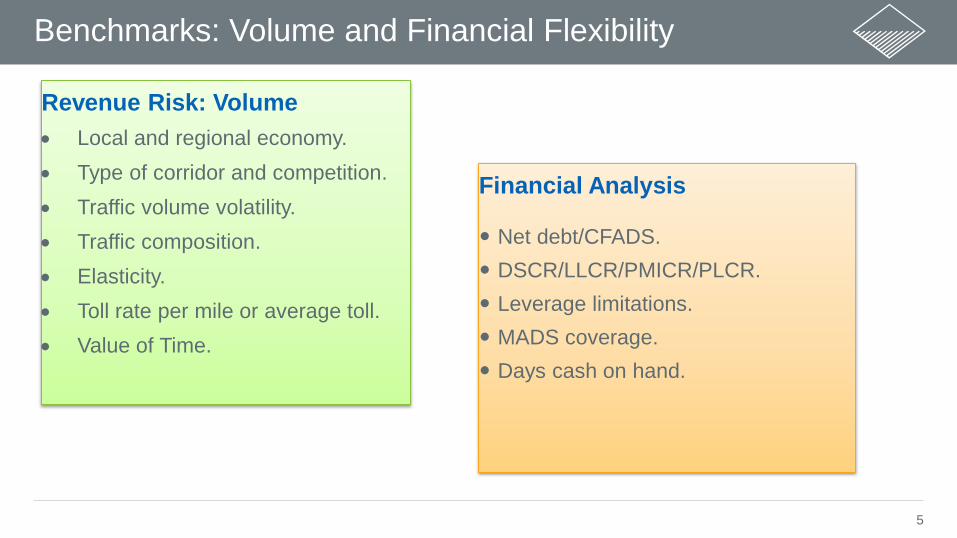
Benchmarks: Volume and Financial Flexibility
Revenue Risk: Volume Local and regional economy. Type of corridor and competition.
Traffic volume volatility.
Traffic composition.
Elasticity.
Toll rate per mile or average toll.
Value of Time.
Financial Analysis
Net debt/CFADS.
DSCR/LLCR/PMICR/PLCR.
Leverage limitations.
MADS coverage.
Days cash on hand.
6
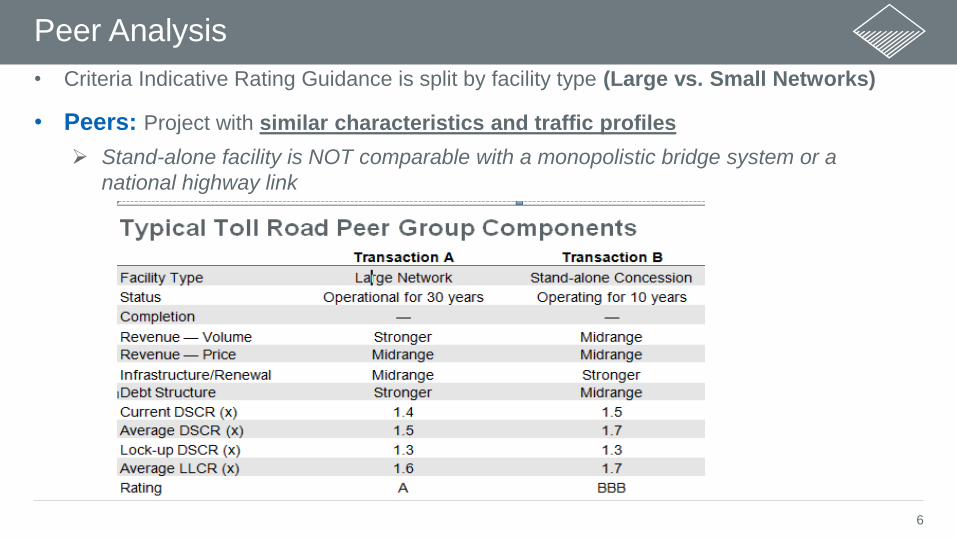
Peer Analysis
• Criteria Indicative Rating Guidance is split by facility type (Large vs. Small Networks)
• Peers: Project with similar characteristics and traffic profiles
Stand-alone facility is NOT comparable with a monopolistic bridge system or a
national highway link

7
FACT Overview
8
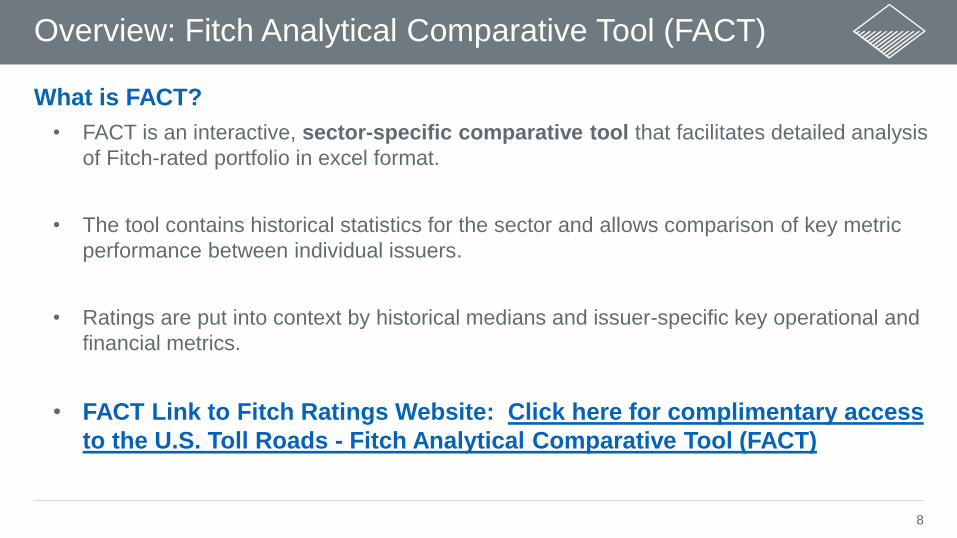
What is FACT?
• FACT is an interactive, sector-specific comparative tool that facilitates detailed analysis
of Fitch-rated portfolio in excel format.
• The tool contains historical statistics for the sector and allows comparison of key metric
performance between individual issuers.
• Ratings are put into context by historical medians and issuer-specific key operational and
financial metrics.
• FACT Link to Fitch Ratings Website: Click here for complimentary access
to the U.S. Toll Roads - Fitch Analytical Comparative Tool (FACT)
Overview: Fitch Analytical Comparative Tool (FACT)
9
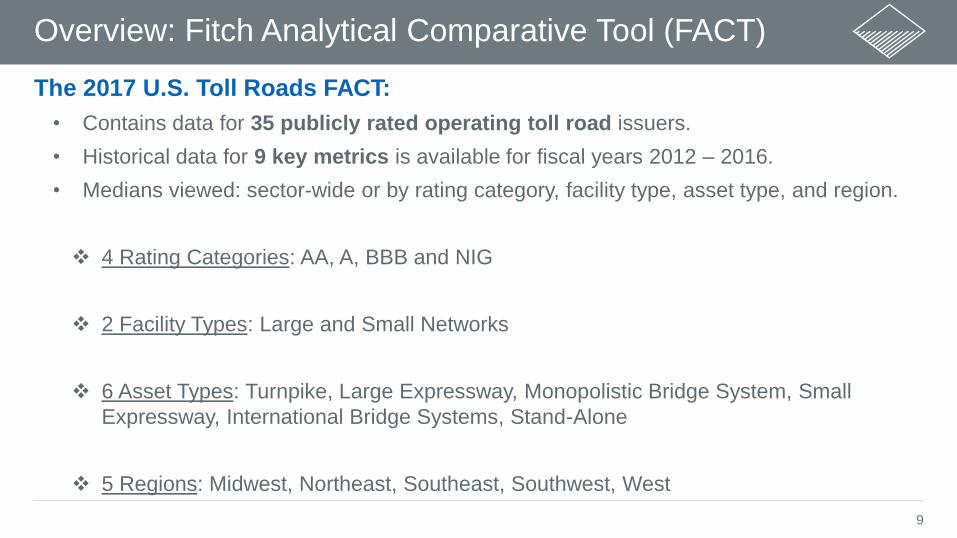
The 2017 U.S. Toll Roads FACT:
• Contains data for 35 publicly rated operating toll road issuers.
• Historical data for 9 key metrics is available for fiscal years 2012 – 2016.
• Medians viewed: sector-wide or by rating category, facility type, asset type, and region.
4 Rating Categories: AA, A, BBB and NIG
2 Facility Types: Large and Small Networks
6 Asset Types: Turnpike, Large Expressway, Monopolistic Bridge System, Small
Expressway, International Bridge Systems, Stand-Alone
5 Regions: Midwest, Northeast, Southeast, Southwest, West
Overview: Fitch Analytical Comparative Tool (FACT)
10
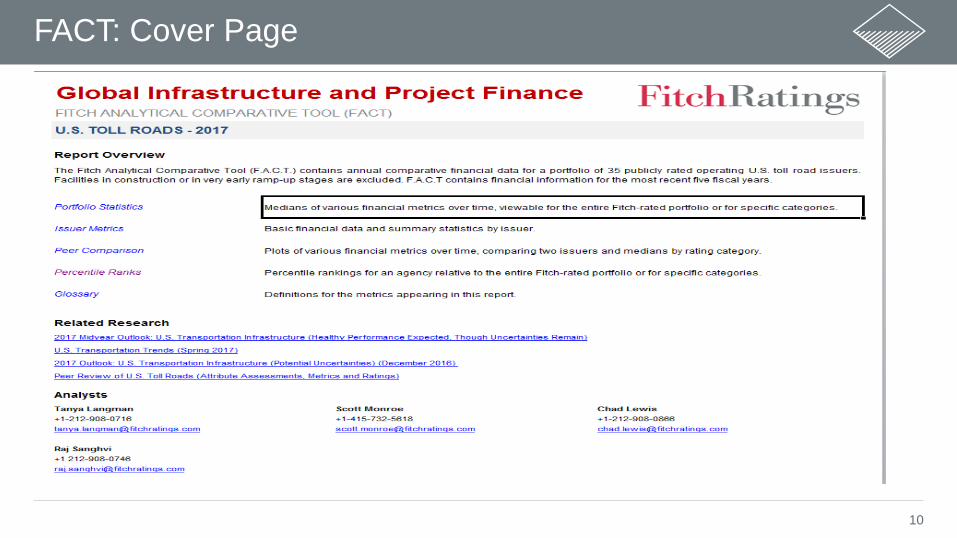
FACT: Cover Page

11
Tab 1: Portfolio Statistics
12
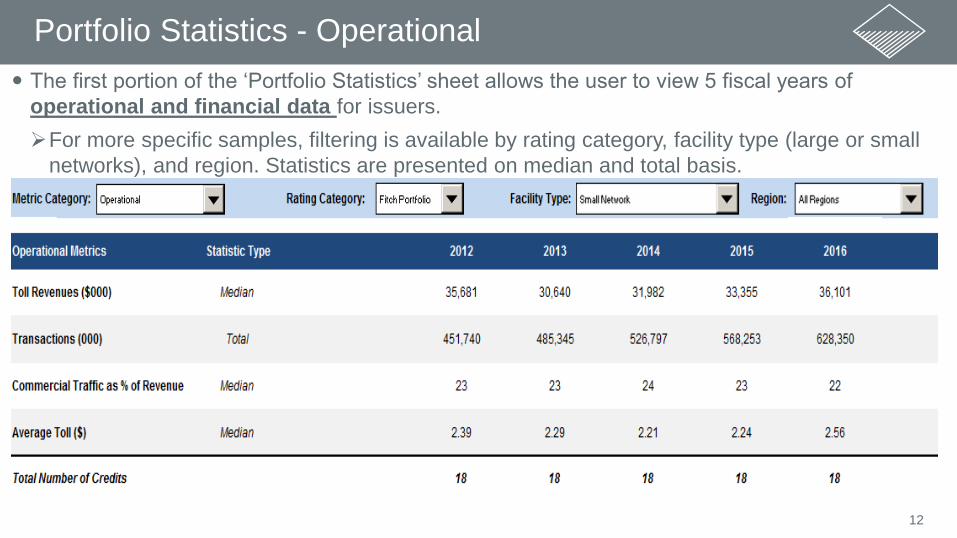
Portfolio Statistics - Operational
The first portion of the ‘Portfolio Statistics’ sheet allows the user to view 5 fiscal years of
operational and financial data for issuers.
For more specific samples, filtering is available by rating category, facility type (large or small
networks), and region. Statistics are presented on median and total basis.
13
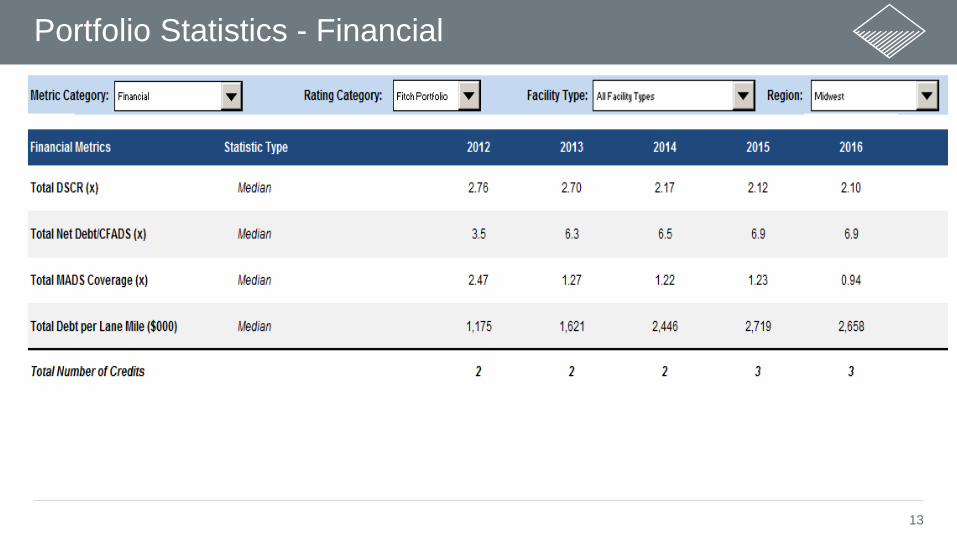
Portfolio Statistics - Financial
14
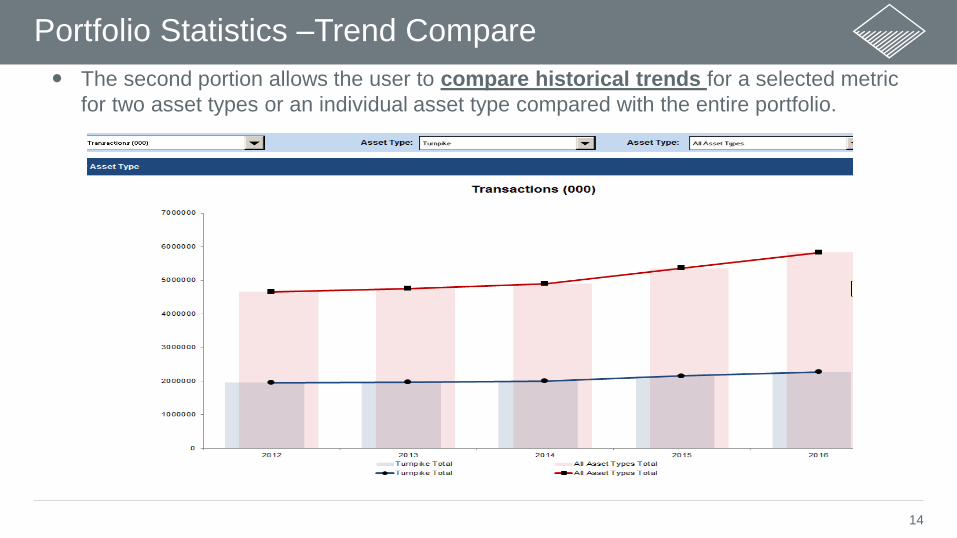
Portfolio Statistics –Trend Compare
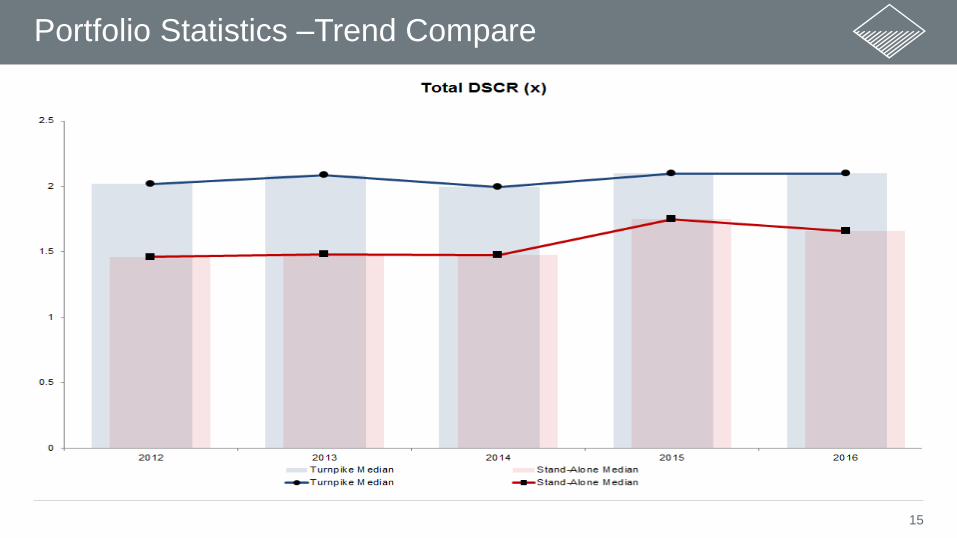
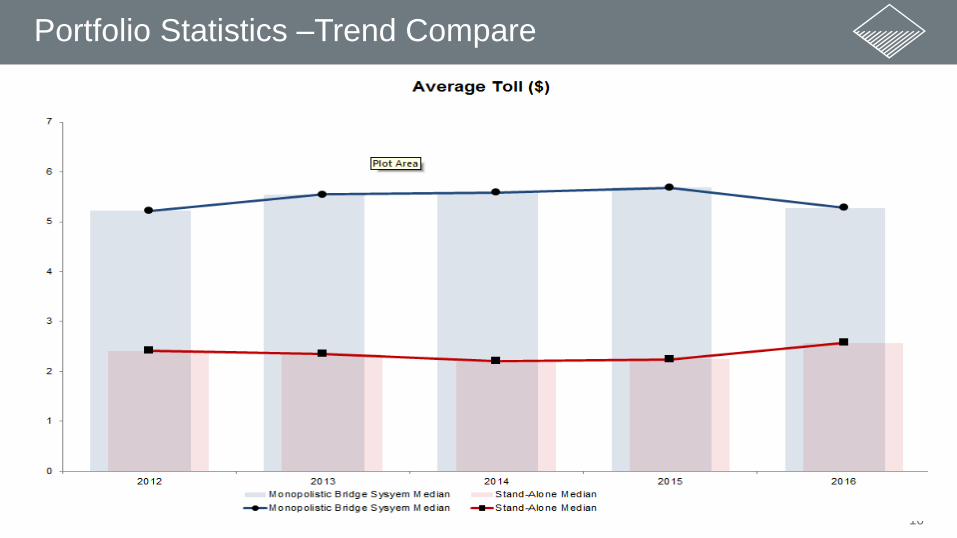
The second portion allows the user to compare historical trends for a selected metric
for two asset types or an individual asset type compared with the entire portfolio.
15
Portfolio Statistics –Trend Compare
16
Portfolio Statistics –Trend Compare
17
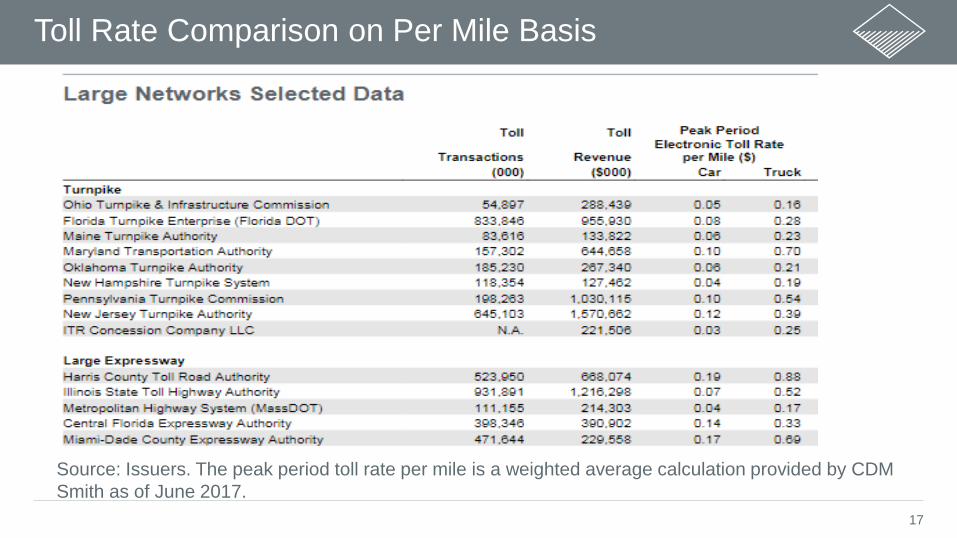
Toll Rate Comparison on Per Mile Basis
Source: Issuers. The peak period toll rate per mile is a weighted average calculation provided by CDM
Smith as of June 2017.

18
Tab 2: Issuer Metrics
19
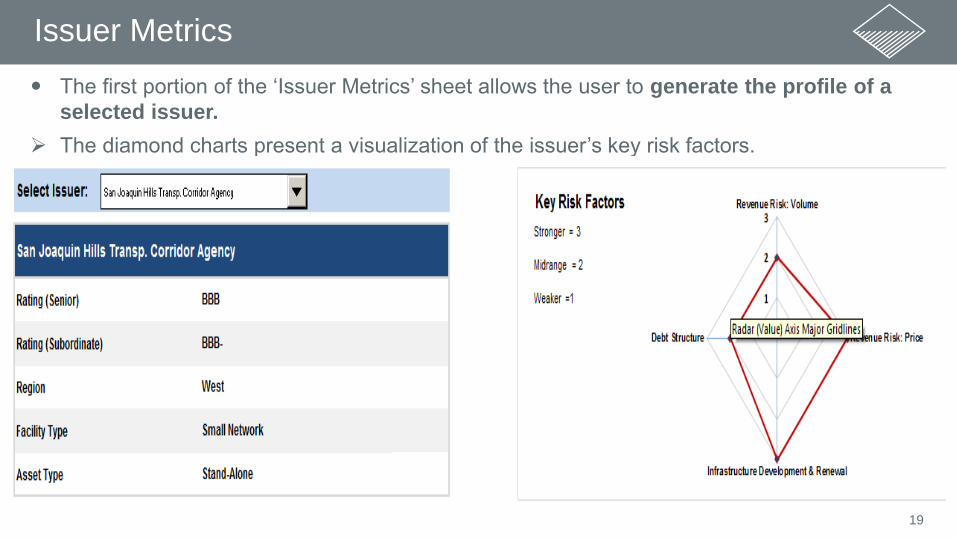
Issuer Metrics
The first portion of the ‘Issuer Metrics’ sheet allows the user to generate the profile of a
selected issuer.
The diamond charts present a visualization of the issuer’s key risk factors.
20
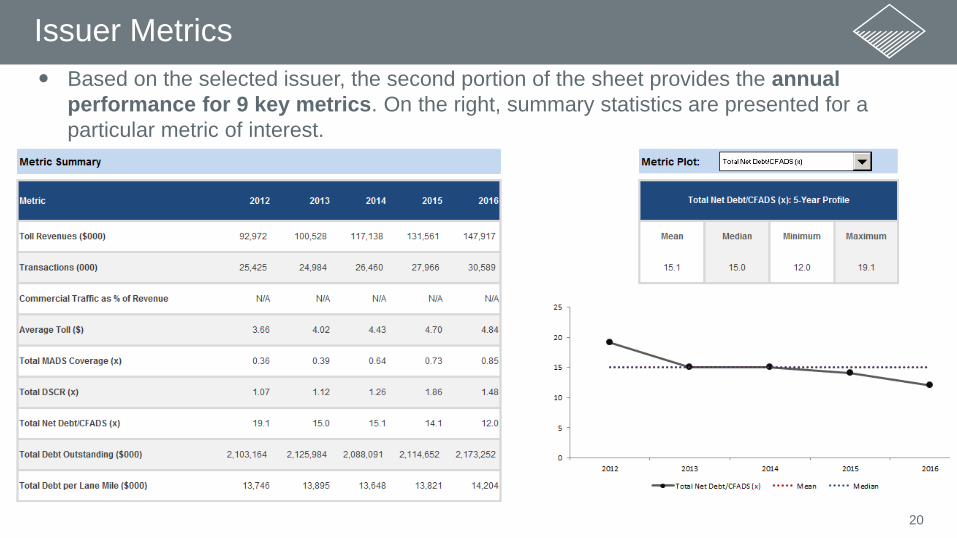
Issuer Metrics
Based on the selected issuer, the second portion of the sheet provides the annual
performance for 9 key metrics. On the right, summary statistics are presented for a
particular metric of interest.

21
Tab 3: Peer Comparison
22
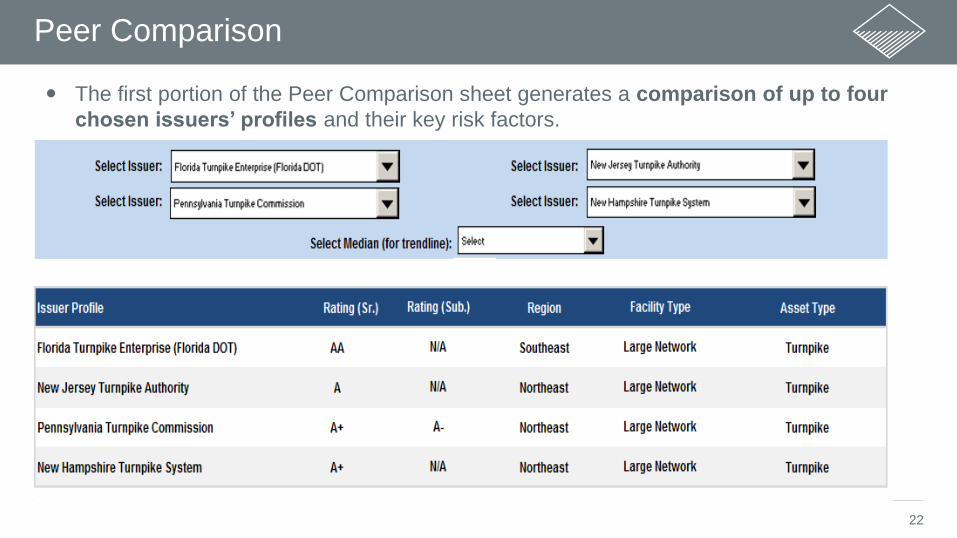
Peer Comparison
The first portion of the Peer Comparison sheet generates a comparison of up to four
chosen issuers’ profiles and their key risk factors.
23
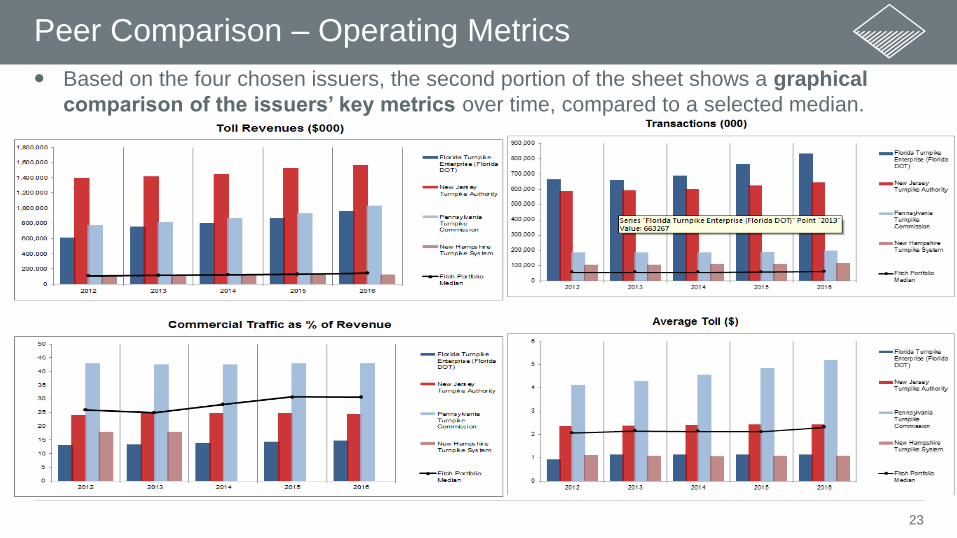
Peer Comparison – Operating Metrics
Based on the four chosen issuers, the second portion of the sheet shows a graphical
comparison of the issuers’ key metrics over time, compared to a selected median.
24
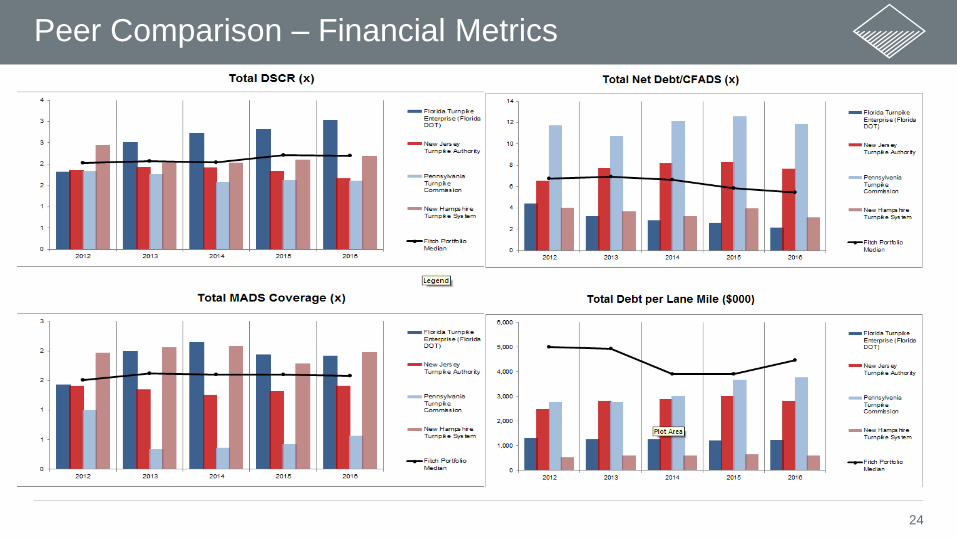
Peer Comparison – Financial Metrics
25
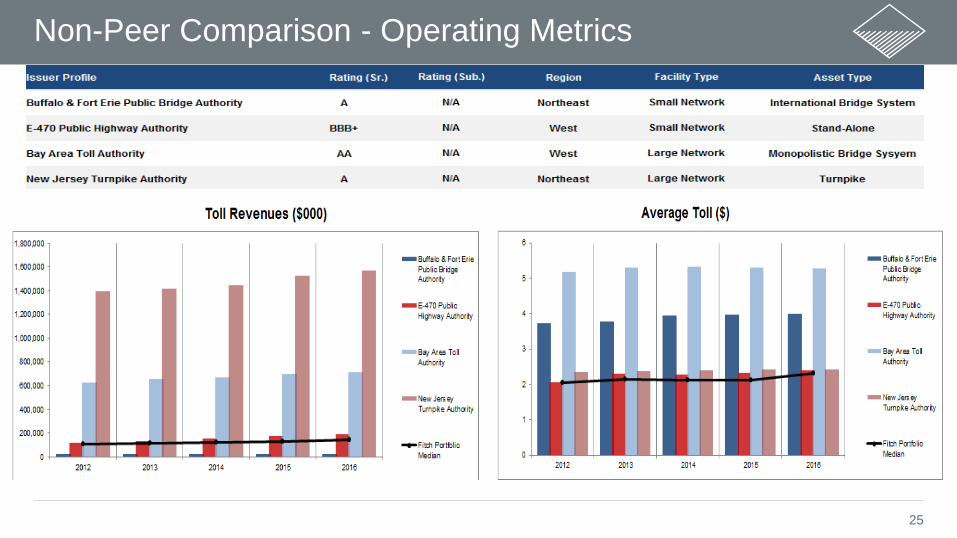
Non-Peer Comparison - Operating Metrics
26
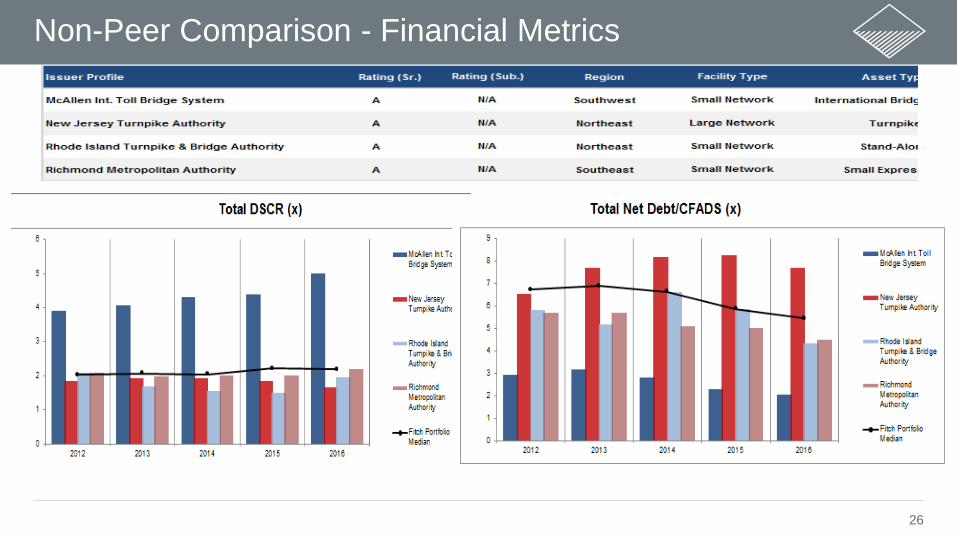
Non-Peer Comparison - Financial Metrics

27
Tab 4: Percentile Ranks
28
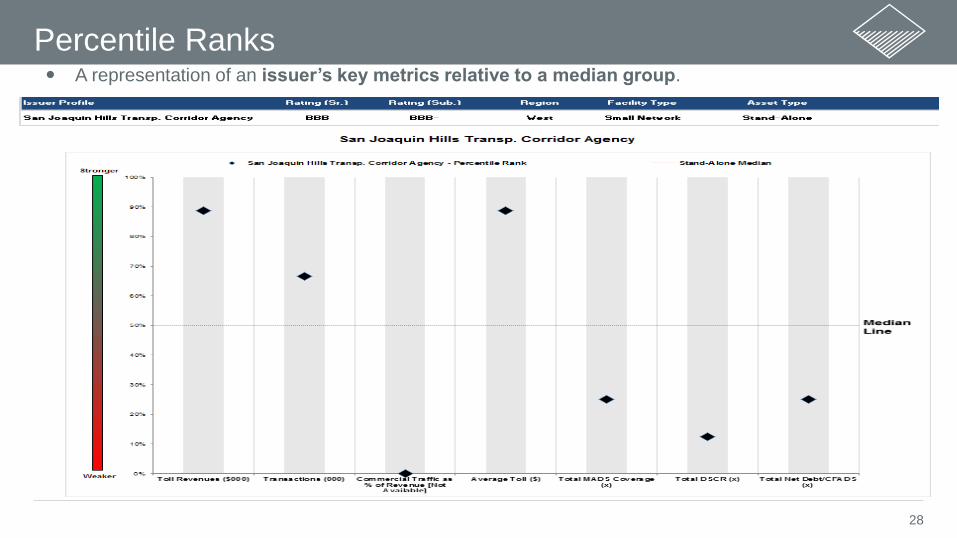
Percentile Ranks A representation of an issuer’s key metrics relative to a median group.

29
Tab 5: Glossary 6
30
Glossary
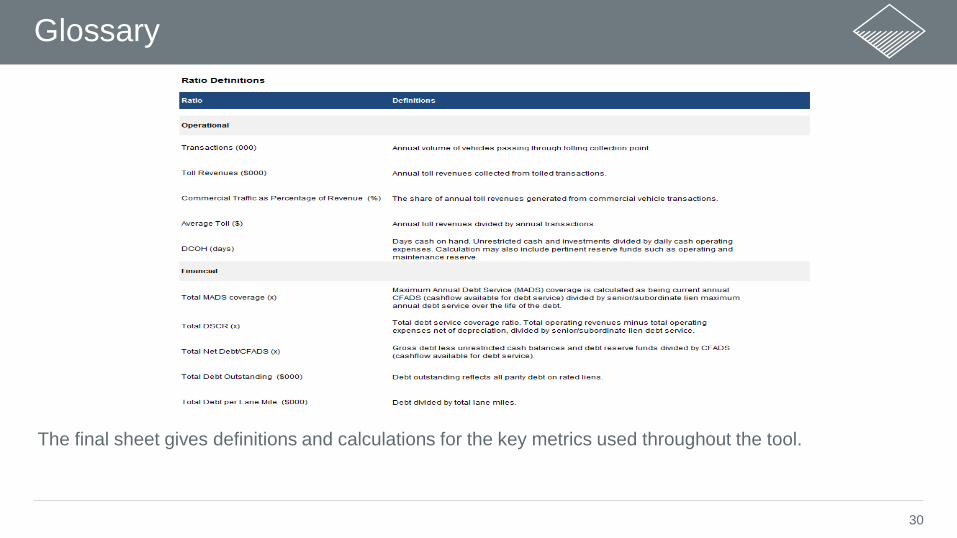
The final sheet gives definitions and calculations for the key metrics used throughout the tool.

@fitchratings fitchratings.com