Embed Size (px)
Citation preview
Fitting parabolic and exponential curves
Curve fitting
1
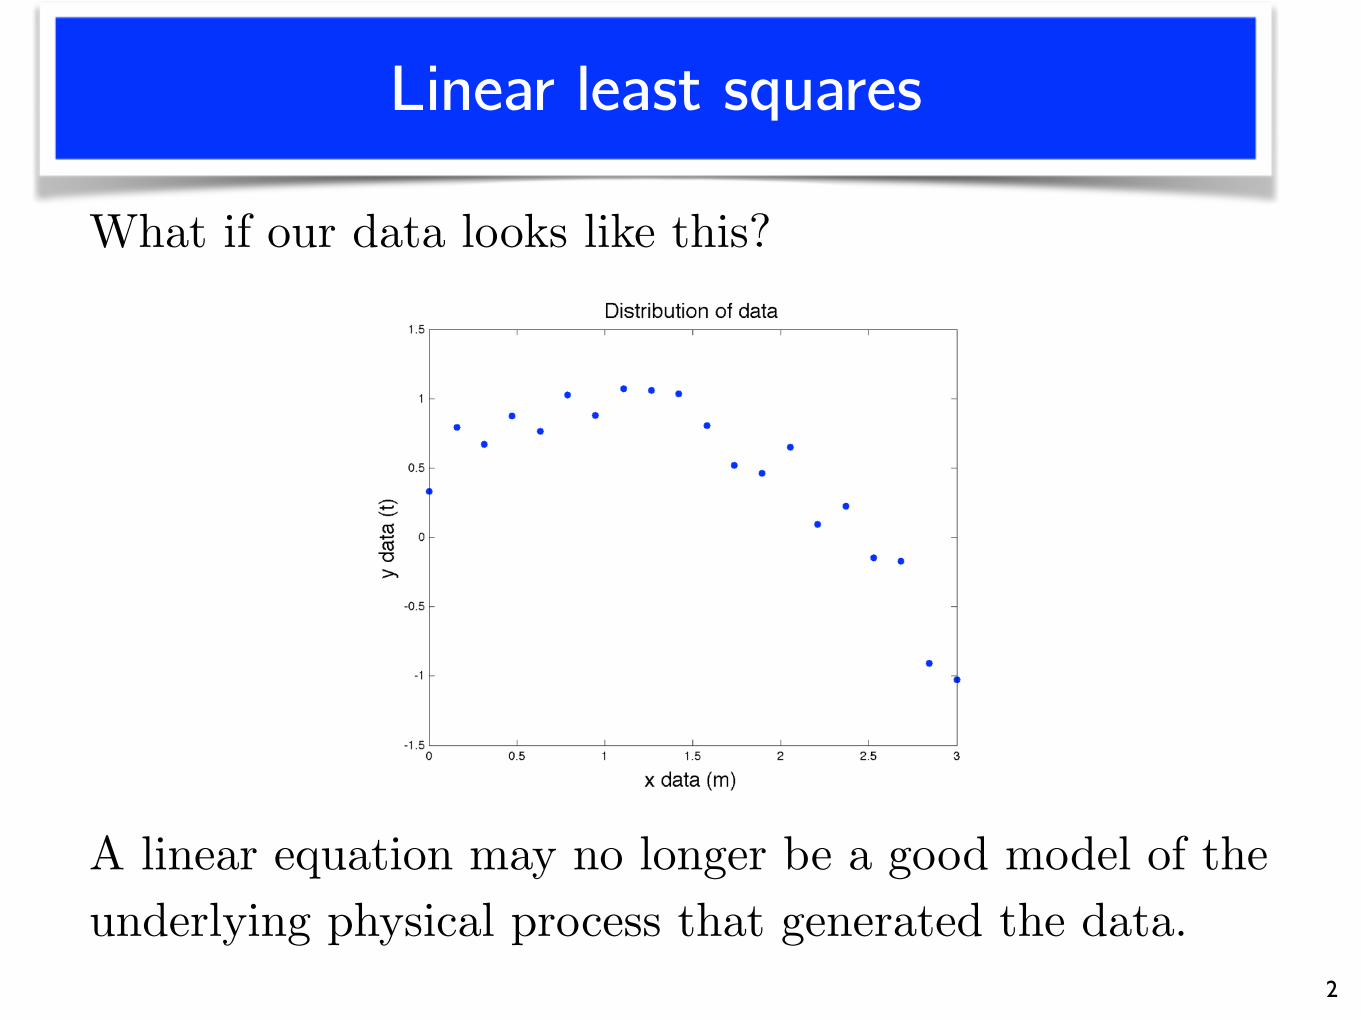
Linear least squares
2
What if our data looks like this?
A linear equation may no longer be a good model of the underlying physical process that generated the data.
Parabolic model
A better fit might be
3
y = ax
2 + bx+ c
How do you know what is a good model?
Depends on what you are trying to do. In many cases, you have an understanding of the physical processes that produced the data, and so you can develop a model based on the physical assumptions.
Question :
Answer :
Fitting a parabola
4
y = ax
2 + bx+ c
Again, we are seeking model parameters. In this model, the unknown coefficients are a, b, and c.
Just as in the linear case, we write down an expression for each data point, assuming that the data point “solves” the model :
yi = ax
2i + bxi + c, i = 1, 2, . . . , N
Given data points (xi, yi), we assume
Notice that the system is still linear in a,b, and c.
Fitting a parabola
5
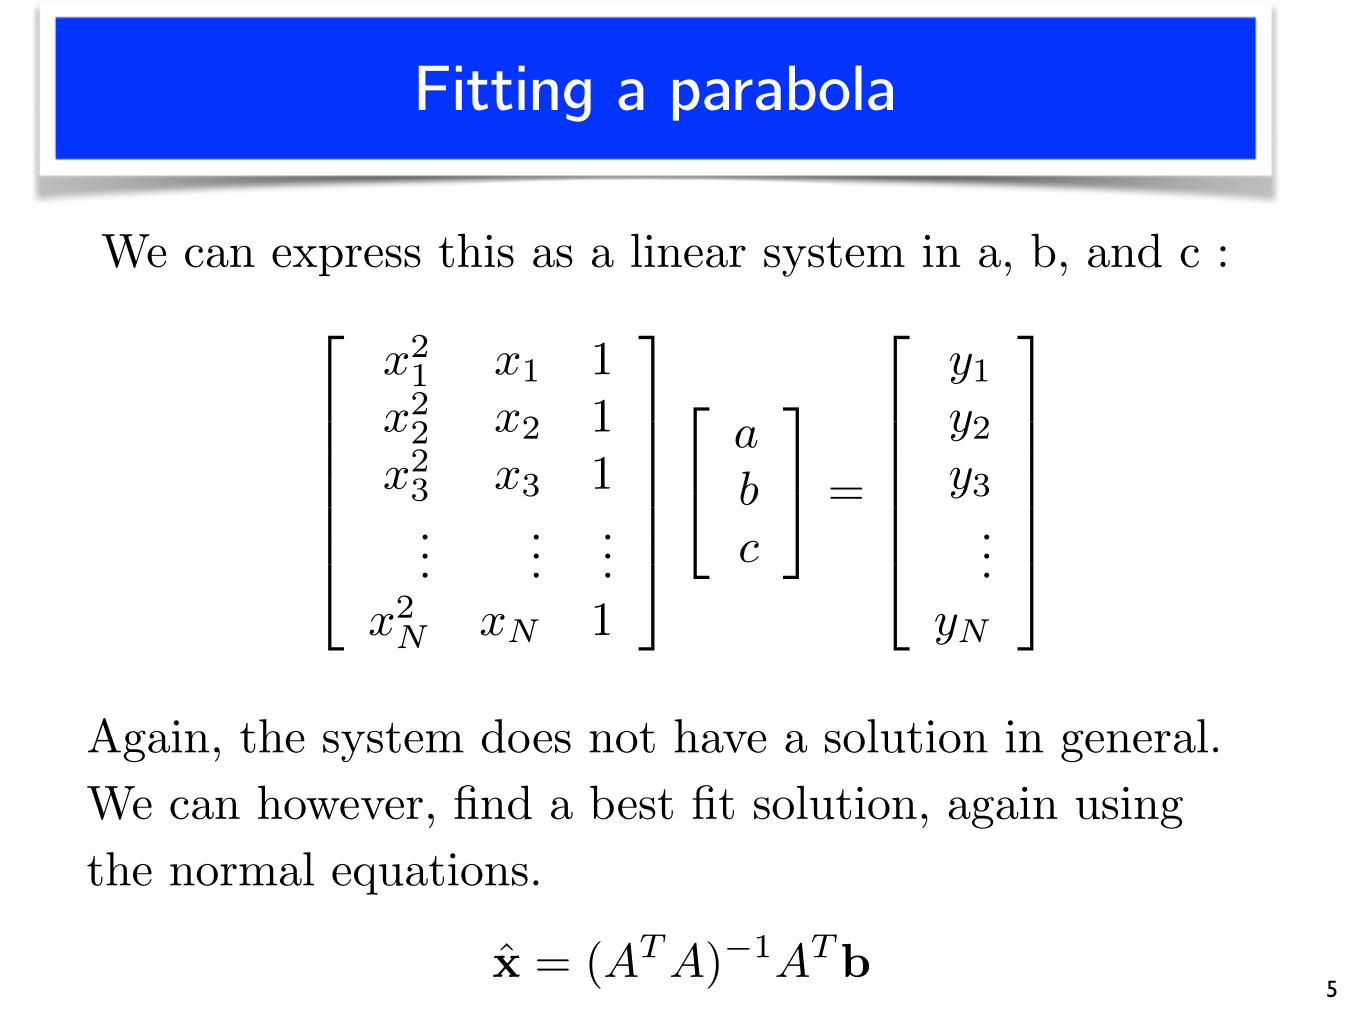
We can express this as a linear system in a, b, and c : 2
666664
x
21 x1 1
x
22 x2 1
x
23 x3 1...
......
x
2N xN 1
3
777775
2
4a
b
c
3
5 =
2
666664
y1
y2
y3...
yN
3
777775
Again, the system does not have a solution in general. We can however, find a best fit solution, again using the normal equations.
x̂ = (ATA)�1ATb

Best fit parabola
6a = -0.519047; b = 1.074011; c = 0.438339
y = ax
2 + bx+ c

Fitting general polynomials
7
General polynomials can be fit using linear least squares.
y = anxn + an�1x
n�1 + . . .+ a1x+ a0
One must be careful, however, as the linear systems will become increasingly ill-conditioned as the n increases.
where it is assumed that the number of data points Nis at least n+ 1.
Fitting an exponential curve
8
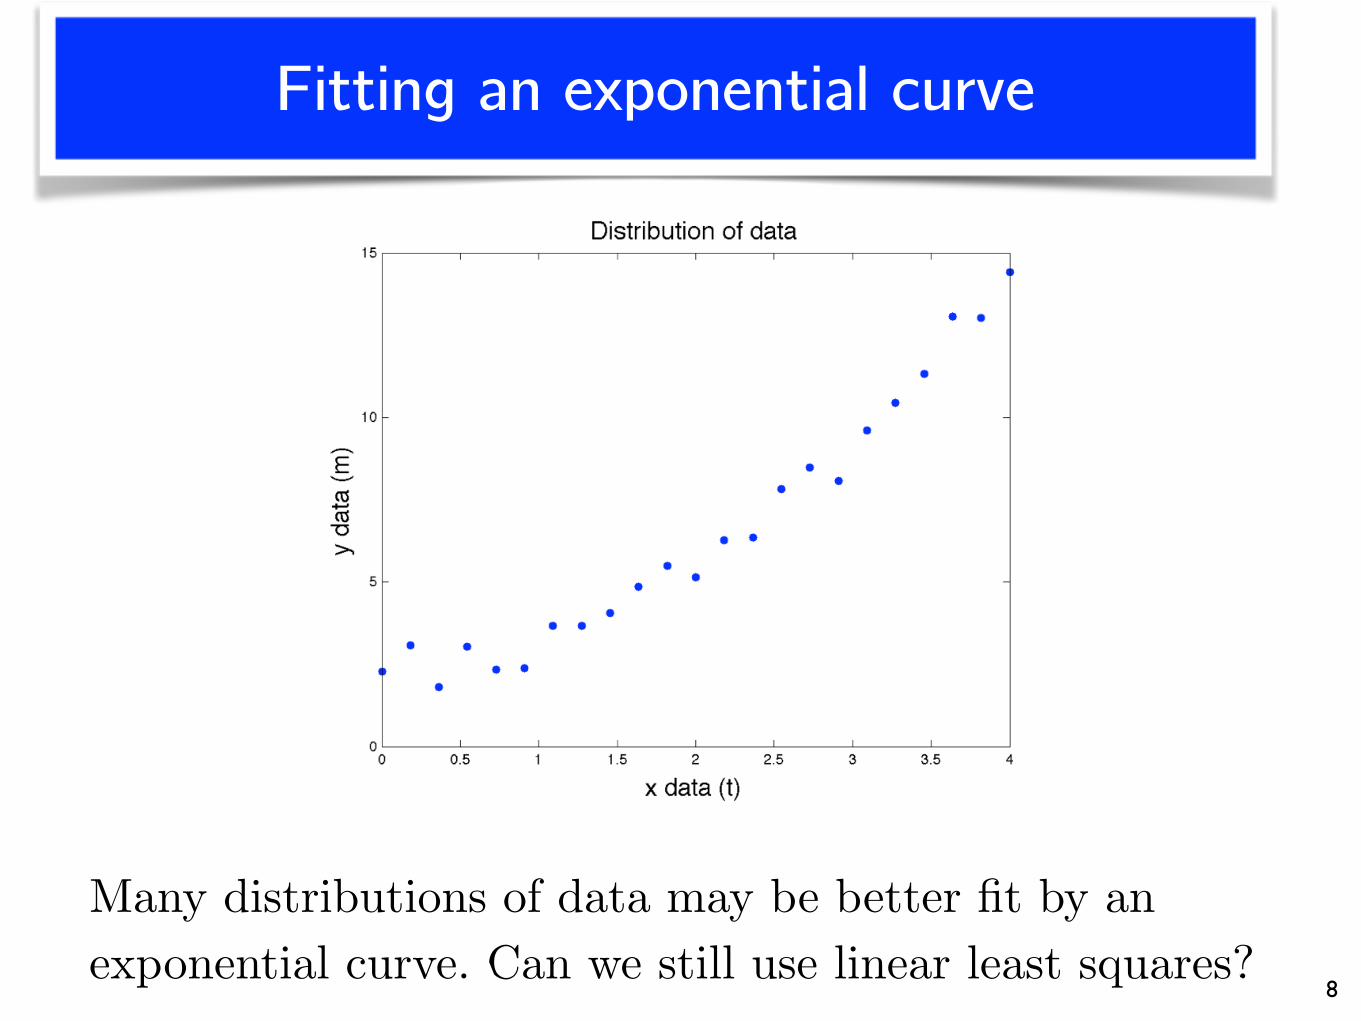
Many distributions of data may be better fit by an exponential curve. Can we still use linear least squares?
Fitting an exponential curve
9
An exponential model is :
But the model is not linear in the parameters a and b.How are we going to use linear least squares?
The trick is to take the natural logarithm of both sides
to get :
ln(y) = ln(a) + bx
The model is now linear in b and ln(a).
y = aebx

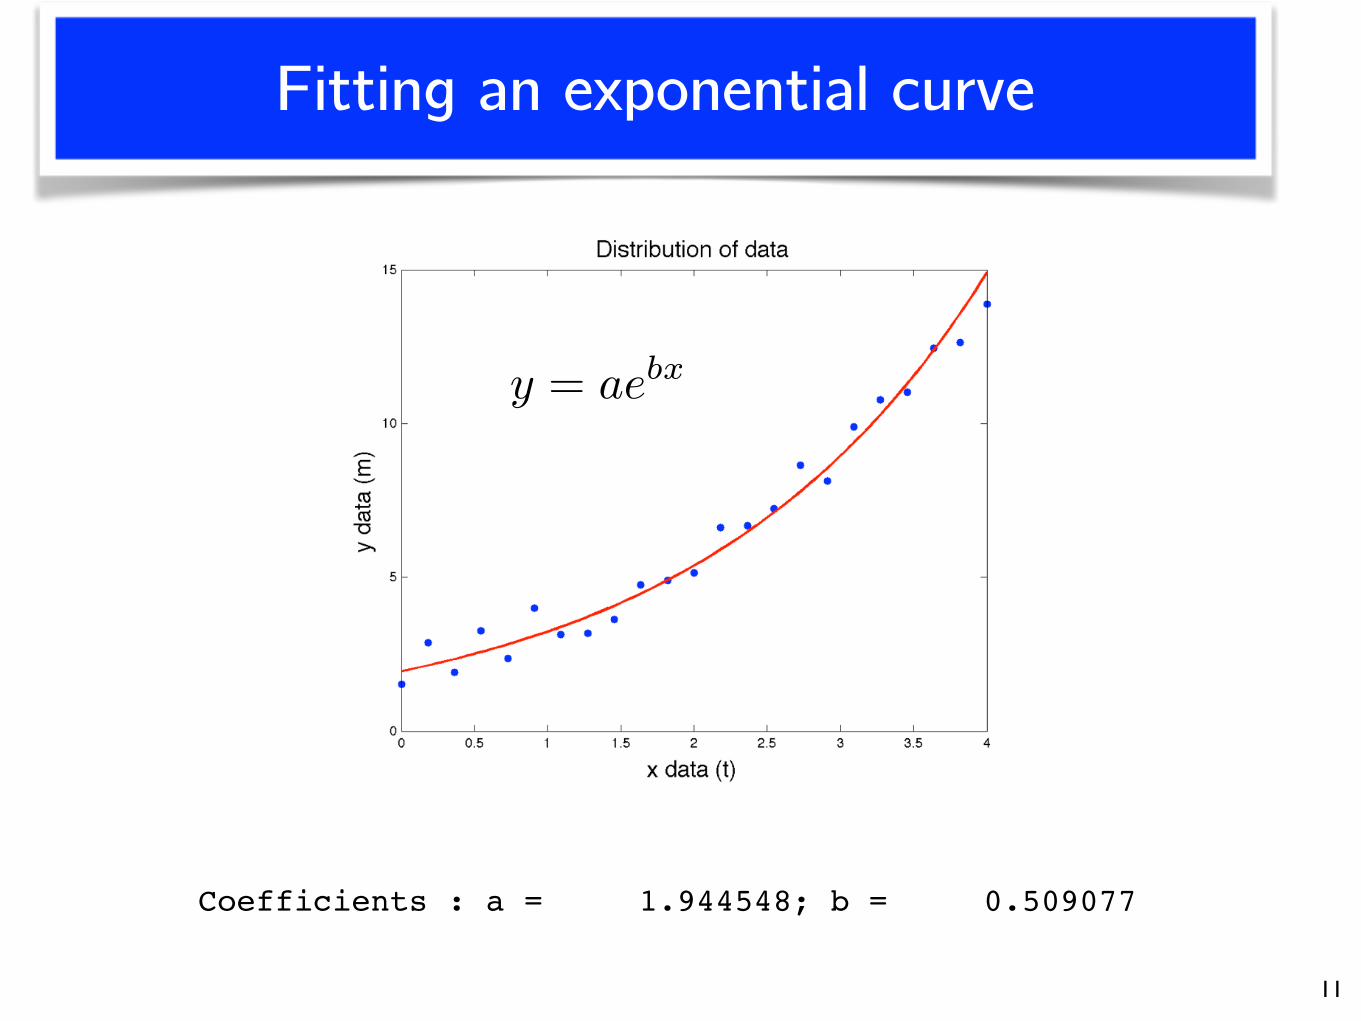
Fitting an exponential curve
10
2
666664
x1 1x2 1x3 1...
...xN 1
3
777775
"b
ea
#=
2
666664
ln(y1)ln(y2)ln(y3)
...ln(yN )
3
777775, ea = ln(a)
Again, we can set up a linear system :
We can then compute a = eea.
Fitting an exponential curve
11
Coefficients : a = 1.944548; b = 0.509077
y = aebx

Example
12G. Recktenwald, page 515
The temperature dependence of the reaction rate coef-
ficient of a chemical reaction is often modeled by the
Arrhenius equation
k = A exp(�Ea/RT )
where k is the reaction rate, A is the preexponential
factor, Ea is the activation energy, R is the univer-
sal gas constant, and T is the absolute temperature.
Experimental data for a particular reaction yield the
following results.
T (K) 773 786 797 810 810 820 834
k 1.63 2.95 4.19 8.13 8.19 14.9 22.2
Use a least-squares fit of this data to obtain values for
A and Ea for the reaction. Take R = 8314J/kg/K.