Embed Size (px)
Citation preview

Five Challenging Problems for A/B/n Tests
Slides at http://bit.ly/DSS2015Kohavi
(Follow-on talk to KDD 2015 keynote on Online Controlled Experiments: Lessons from Running A/B/n Tests for 12 years at http://bit.ly/KDD2015Kohavi)
Ron Kohavi, Distinguished Engineer, General Manager, Analysis and Experimentation, Microsoft

2
Australia: Learning from Daintree Forest
Ronny Kohavi
• Anyone know what this heart-shaped leaf, which Ted and I saw yesterday,is called? Why it is interesting?
• Stinging bush (Dendrocnide moroides)
• Silica hairs deliver a potent neurotoxin
• The sting can last months
• Wikipedia references articles about• Horses jumping off cliffs after being stung• An Australian officer shot himself to escape
the pain of a sting
• What you don’t know CAN kill you here
3Ronny Kohavi
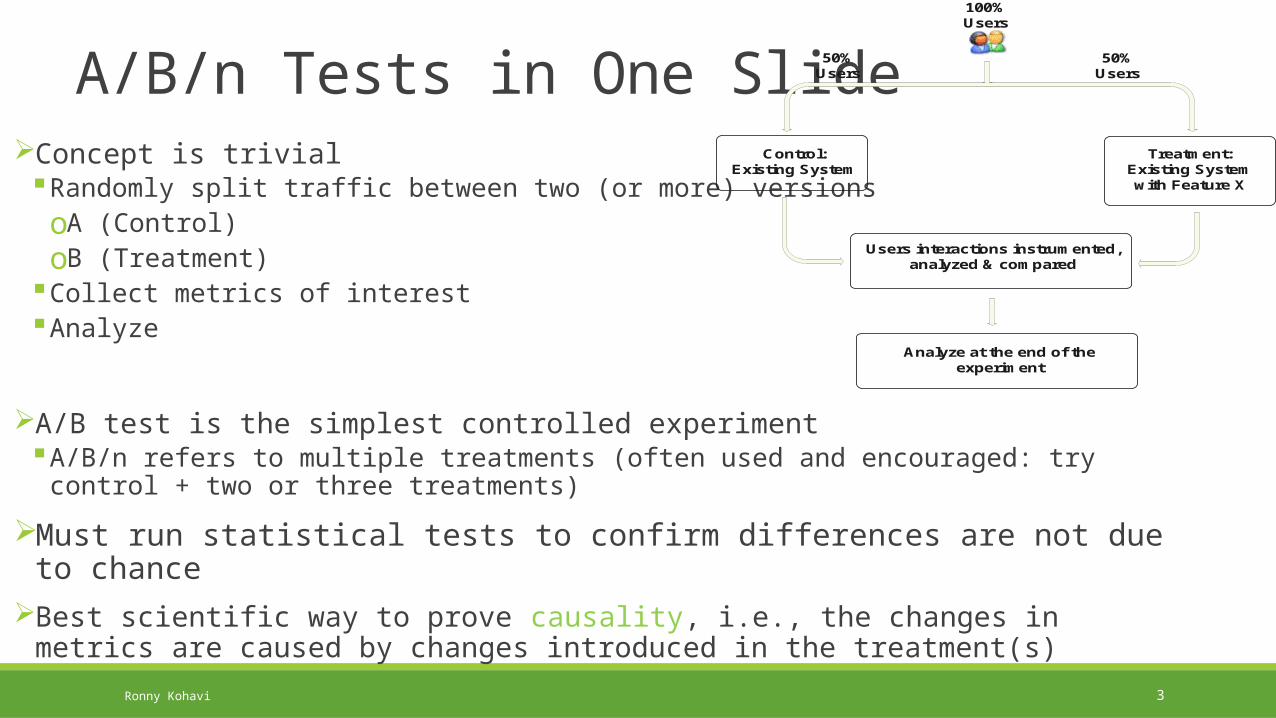
A/B/n Tests in One SlideConcept is trivialRandomly split traffic between two (or more) versionsoA (Control)oB (Treatment)
Collect metrics of interestAnalyze
A/B test is the simplest controlled experimentA/B/n refers to multiple treatments (often used and encouraged: try control + two or three
treatments)
Must run statistical tests to confirm differences are not due to chanceBest scientific way to prove causality, i.e., the changes in metrics are caused by changes
introduced in the treatment(s)
100%Users
50%Users
50%Users
Control:Existing System
Treatment:Existing System with Feature X
Users interactions instrumented, analyzed & compared
Analyze at the end of the experiment

4
Challenge 1: Sessions/User as MetricSearch engines (Bing, Google) are evaluated on query share (distinct queries) and
revenue as long-term goalsObservation: A ranking bug in an experiment resulted in very poor search results Degraded (algorithmic) search results cause users to search more to complete their task, and ads appear
more relevant Distinct queries went up over 10%, and revenue went up over 30%
What metrics should we use as the OEC (Overall Evaluation Criterion) for search engine?
Ronny Kohavi

5
OEC for Search EnginesAnalyzing queries per month, we have
where a session begins with a query and ends with 30-minutes of inactivity. (Ideally, we would look at tasks, not sessions).
Key observation: we want users to find answers and complete tasks quickly, so queries/session should be smaller
In a controlled experiment, the variants get (approximately) the same number of users by design, so the last term is about equal
The OEC should therefore include the middle term: sessions/userThis seems like ideal metric for many sites, not just Bing: increased sessions/visits
Ronny Kohavi

Challenge: Statistical PowerThe t-statistic used to evaluate stat-sig is defined as , where is the difference between a metric for the two variants, and is the (estimated) standard deviation of the difference
is , whereCV is the coefficient of variation of the metricn is the sample sizeNormally, as the experiment runs longer and more users are admitted, the confidence interval should shrink
Here is a graph of the relative confidence interval size for Sessions/User over a month
It is NOT shrinking as expectedCV, normally fixed, is growing at the same rate
as

7
Why is this Important?Given that this metric is Bing’s “north star,” everyone tries to improve this metricDegradations in Sessions/User (commonly due to serious bugs) are quickly stat-sig,
indicating abandonmentPositive movements are extremely rare About two ideas a year are “certified” as having moved Sessions/user positively (out of 10K experiments,
about 1,000-2,000 are successful on other OEC metrics), so 0.02% of the time Certification involves very low p-value (rare) and more commonly replication
Challenges Can we improve the sensitivity?
We published a paper on using pre-experiment data: CUPED, which really helped here. Other ideas? Is there a similar metric that is more sensitive? Is it possible that this metric just can’t be moved much?
Unlikely. Comscore reports Sessions/User for Bing and Google and there’s a factor of two gap
Ronny Kohavi

8
Challenge 2: NHST and P-valuesNHST = Null Hypothesis Statistical Testing, the “standard” model commonly usedP-value <= 0.05 is the “standard” for rejecting the Null hypothesisP-value is often mis-interpreted. Here are some incorrect statements from Steve
Goodman’s A Dirty Dozen1. If P = .05, the null hypothesis has only a 5% chance of being true2. A non-significant difference (e.g., P >.05) means there is no difference between groups3. P = .05 means that we have observed data that would occur only 5% of the time under the null
hypothesis4. P = .05 means that if you reject the null hypothesis, the probability of a type I error (false positive) is
only 5%
The problem is that p-value gives us Prob (X >= x | H_0), whereas what we want isProb (H_0 | X >= x)
Ronny Kohavi

9
Why is this Important?Take Sessions/User, a metric that historically moves positively 0.02% of the time at BingWith standard p-value computations, 5% of experiments will show stat-sig movement,
half of those positive. 99.6% of the time, a stat-sig movement with p-value = 0.05 does not mean that the idea
improved Sesssions/UserInitial way to address this: Bayesian. See Objective Bayesian Two Sample Hypothesis Testing for Online Controlled Experiments at
http://exp-platform.com for recent work by Alex DengBasically, we use historical data to set priors. But this assumes the new idea behaves like prior ones.
Ronny Kohavi

10
Challenge 3: Interesting SegmentsWhen an A/B experiment completes, can we provide interesting insights by finding
segments of users where the delta was much larger or smaller than the mean?We should be able to apply machine learning methodsInitial ideas, such as Susan Athey’s keynote, create high-variance labelsIssues with multiple hypothesis testing / overfitting
Ronny Kohavi

11
Challenge 4: Duration / Novelty EffectsHow long do experiments need to run? We normally run for one week When we suspect novelty (or primacy) effects, we run longer At Bing, despite running some experiments for 3 months, we rarely see significant changes.
Never saw stat-sig turn into negative stat-sig, for example
Google reported significant long-term impact of showing more ads For example, KDD 2015 paper by Henning etal. on Focusing on the Long-term: It’s Good for Users and
Business We ran the same experiment and have very different conclusionsoWe saw Sessions/user decline. When that happens, most metrics are invalid, as users are abandoningoLong-term experiments on cookie-based user-identification have strong selection bias, as they require the same
user to visit over a long-period. Users erase cookies, lose cookies, etc.
Ronny Kohavi

12
Challenge 5: Leaks Due to Shared ResourcesShared resources are a problem for controlled experimentsExample: LRU caches are used often (least-recently-used elements are replaced) Caches must be experiment aware, as the cached elements often depend on experiments (e.g., search
output depends on query term + backend experiments).The experiments a user is in is therefore part of the cache key
If control and treatment are of different size (e.g., control is 90%, treatment is 10%), then control has a big advantage because its elements are cached more often in an LRU cache
We usually run experiments with equal sizes because of this (e.g., 10% vs. 10%, even if control could be 90% and we would reduce variance)
Ronny Kohavi

13
Challenge 5: Leaks Due to Shared ResourcesUnsolved examples Treatment has a bug and uses disk I/O much more heavily. As the disk is a shared resource, this slows
down control (a leak) and the delta in many metrics is not reflecting the issue Real example: treatment causes the server to crash. As the system is distributed and reasonably resilient
to crashes, requests are routed to other servers and the overall system survives, as long as crashes are not too common.However, in this example the treatment crashed often, bringing Bing down after several hours.You don’t see it in the experiment scorecard, i.e., the metrics look similar
Solutions are not obvious Deploy experiments to subset of machines to look for impact on the machines?
This would work if there were a few experiments, but there are 300 concurrent experiments running Deploy to single data center and then scale out. This is what we do today, but the crashes took several
hours to impact the overall system, so the near-real-time monitoring did not catch this
Ronny Kohavi

14
Challenges not RaisedOEC is the Overall Evaluation CriterionDesiderata:oA single (weighted) metric that determines whether to ship a new feature (or not)oMeasurable using short-term metrics, but predictive of long-term goals (e.g., lifetime value)
What are properties of good OECs?oHard example: support.microsoft.com as a web site.
Is more time better or worse? oIs there an OEC for Word? Excel? Or do these have to be feature specific?
Experiments in social-network settings (Facebook, LinkedIn).Papers are being published on these.I have very limited experience
User identifiers changing (unlogged-in-user logs in)See Ya Xu’s papers in the main conference and Social Recommender Systems workshop:
A/B testing challenges in social networksRonny Kohavi