Embed Size (px)
Citation preview

Five-year Fiscal Sustainability Plan
October 2014

The Changed World Around Us• Imperative to educate more people
– 65% of new jobs in the next decade require some post-secondary training
– Preparing students for work, community and responsible citizenship
• Student demographic changes – more variability, less social capital
• Need to respond to hard questions about the value of higher education– $24K debt load
• Convey the value of research• Vastly increased competition
Requires a radically distinctive approach2
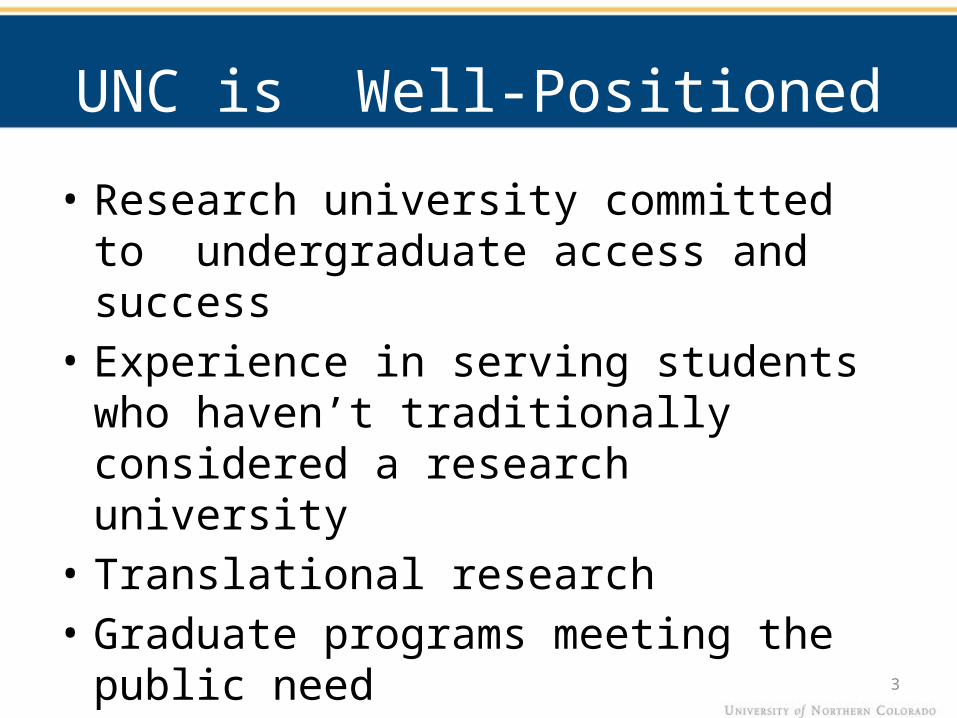
UNC is Well-Positioned
• Research university committed to undergraduate access and success
• Experience in serving students who haven’t traditionally considered a research university
• Translational research• Graduate programs meeting the public need• One-stop+ student support
3

New context = new financial management
• Shift from fund accounting to “strategic deployment of resources to support the mission”1
– River of revenue– Building Reserves /Investing Reserves (attachment 1)– Capital
• Align price with value proposition (transformative education)– Institutional financial aid (attachment 2)– ~70% of our funding is from students1. Strategic Financial Analysis for Higher Education, KPMG
4

Multiyear Strategic Financial Management
5
Enrollment and Revenue
Growth FY16- FY19
Investing ReservesFY14 and FY15
Building Reserves
FY09- FY13
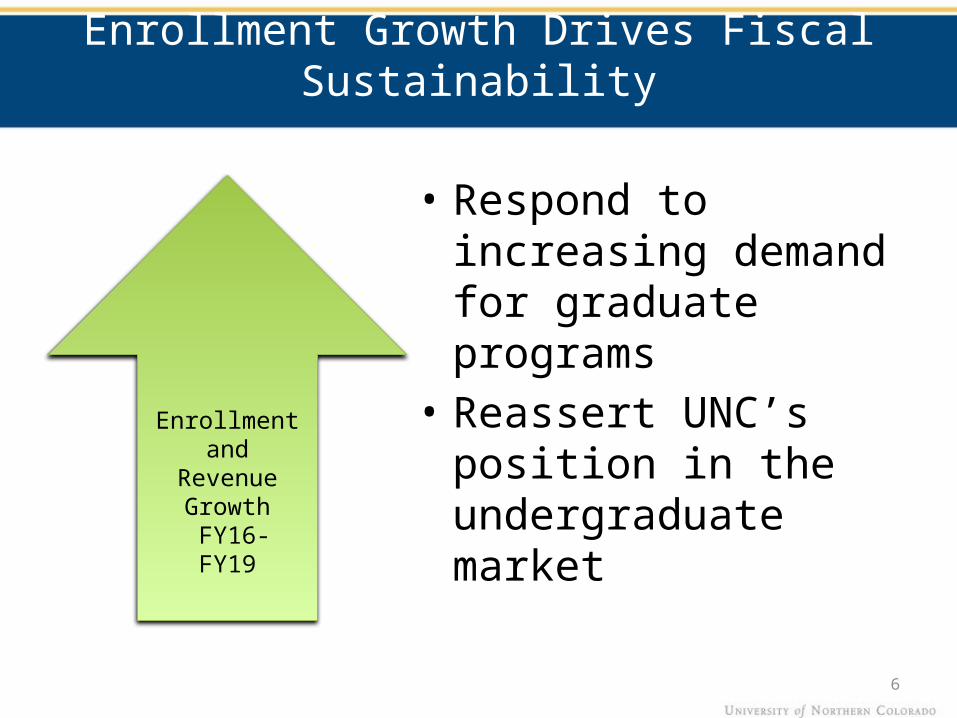
Enrollment Growth Drives Fiscal Sustainability
• Respond to increasing demand for graduate programs
• Reassert UNC’s position in the undergraduate market
6
Enrollment and Revenue
Growth FY16- FY19

Strategic Actions
7

Timing of Strategic Actions
8
Business practices
(sustainable cost savings)
Program
enrollment targets
(vacant capacity)
Program marketing(Targeted marketing)
Program enrollment targets
(Add cohorts in Extended Campus programs)
New programs(I@UNC initiatives)
New student markets (International recruiting – China)
Fundraising
priorities Workload and
course enrollment
Undergraduate and graduate admissions processes
New programs, new markets
(I@UNC initiatives)
Student support(Student Success Collaborative)
Business practices (centralizing to gain efficiencies)
Summer Session strategy
Image Marketing(UNC academic image)
Student support(One-Stop+/Campus Commons)
Fa s te rFY ’15 FY ’18
S l o w e r r

9
Campus Commons
• Will increase the number of students who enroll at UNC.
• Will increase the number of students who succeed to graduation.
• Will address critical curricular needs.• Will create a central connecting point for UNC and
the broader community.
9
Radically distinctive approach

Campus Commons Finances
10
• $ 73.6 million building-114,000 sq ft• $40 million state• $10 million donor• $24 million bonds backed by student fee ($160
annual fee)
• Operating effect $2.3 million• $400 thousand revenue• $1.6 million debt• $1.1 million utilities, facilities staff, other operating
cost

Fiscal Sustainability: Key Points
11
State of the University Address1. 15,000 students by Fall 20182. Increase the proportion of
graduate students from 20% to 25%
3. Increase undergraduate persistence by 2 pct points to 83% by Fall 2018
4. Identify $2.4 million in sustainable cost savings
5. Break ground on Campus Commons summer 2016
• Growth strategy• Commitment to
compensation identity• No overall staffing growth• Student affordability:
strategic pricing and discounting• Leverage reserves for timing and flexibility• Stewardship of capital and debt management
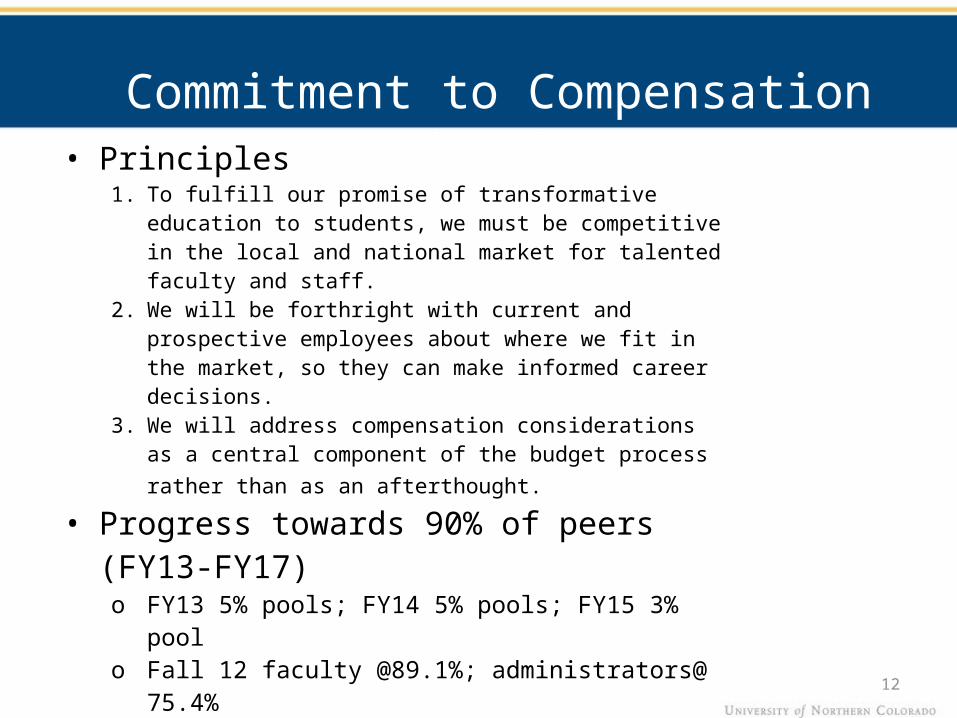
Commitment to Compensation Identity
12
• Principles1. To fulfill our promise of transformative education to students, we
must be competitive in the local and national market for talented faculty and staff.
2. We will be forthright with current and prospective employees about where we fit in the market, so they can make informed career decisions.
3. We will address compensation considerations as a central component of the budget process rather than as an afterthought.
• Progress towards 90% of peers (FY13-FY17)o FY13 5% pools; FY14 5% pools; FY15 3% poolo Fall 12 faculty @89.1%; administrators@ 75.4%o Fall 13 Data concerns discussed with Salary Equity
NCHEMS vs Doctoral-All: small sample size NCHEMS Faculty @87.9%; Doctoral-All 83.4%
o Salary Equity distribution model: 50% parity, 40% MOE, 5% compression, 5% discretion
• Next steps: discussion of peers, standardized reporting

No Overall Staffing Growth
13
• 9 Core plans drive decisionso University-wide staffing plan for faculty and staff

Student Affordability
14
Institution
FY 2009-10 Resident Tuition &
Fees (30CR)
FY 2014-15 Resident Tuition &
Fees (30CR)
5 Year $ Increase Tuition &
Fees
5 Year % Increase Tuition &
FeesMetro 3,640$ 6,070$ 2,430$ 66.8%Fort Lewis 4,646$ 7,252$ 2,606$ 56.1%Colorado Mesa 5,396$ 7,625$ 2,229$ 41.3%UNC 5,451$ 7,733$ 2,282$ 41.9%CSU-Pueblo 5,209$ 7,834$ 2,625$ 50.4%Western State 4,064$ 7,874$ 3,810$ 93.8%Adams 4,454$ 8,015$ 3,561$ 80.0%UCCS 6,057$ 8,983$ 2,926$ 48.3%CU-Denver 6,542$ 9,838$ 3,296$ 50.4%CSU 6,318$ 9,897$ 3,579$ 56.6%CU-Boulder 7,932$ 10,789$ 2,857$ 36.0%Mines 12,244$ 16,918$ 4,674$ 38.2%

Leverage Reserves: Attachment 3 Model
15
FY14
Forecast FY14 ActualFY14
Variance FY15 BudgetFY16
ProjectionFY17
ProjectionFY18
ProjectionFY19
Projection
Revenues and ExpendituresRevenue
Net Student Revenue 117,360,148 117,171,422 (188,726) 120,420,000 130,330,000 140,370,000 150,560,000 159,020,000State Funding 33,638,140 33,640,060 1,920 37,360,000 37,360,000 37,360,000 37,360,000 37,360,000All Other Revenue 22,761,800 24,211,233 1,449,433 22,920,000 22,920,000 23,060,000 23,200,000 23,370,000
Total Net Revenue 173,760,088 175,022,715 1,262,627 180,700,000 190,610,000 200,790,000 211,120,000 219,750,000
Personnel Expenses Faculty, Exempt, Classified 84,379,400 83,766,938 612,462 88,900,000 91,500,000 94,930,000 97,860,000 100,800,000TA/GA, Student & Other 10,086,438 10,224,476 (138,038) 10,190,000 10,320,000 10,320,000 10,320,000 10,320,000Fringe Benefits 24,423,265 24,531,574 (108,309) 26,640,000 28,280,000 30,020,000 31,570,000 33,110,000
118,889,103 118,522,988 366,115 125,730,000 130,100,000 135,270,000 139,750,000 144,230,000 Non-Personnel Expense / Debt
All Non-Personnel 42,005,200 41,338,730 666,470 44,740,000 45,580,000 47,010,000 48,260,000 49,750,000Debt Service / Capital Lease 11,018,382 10,443,980 574,402 11,140,000 11,140,000 12,770,000 12,770,000 12,770,000
53,023,582 51,782,710 1,240,872 55,880,000 56,720,000 59,780,000 61,030,000 62,520,000 Strategic Investment & Capital
Strategic Investments 6,600,000 6,072,143 527,857 6,410,000 4,880,000 4,180,000 4,210,000 4,210,000Capital 11,413,085 8,780,028 * 2,633,057 13,770,000 7,000,000 6,200,000 7,800,000 7,800,000
18,013,085 14,852,171 3,160,914 20,180,000 11,880,000 10,380,000 12,010,000 12,010,000
Total Expenditures 189,925,770 185,157,869 4,767,901 201,790,000 198,700,000 205,430,000 212,790,000 218,760,000
($16,165,682) ($10,135,154) 6,030,528 ($21,090,000) ($8,090,000) ($4,640,000) ($1,670,000) $990,000
Operating 26,083,372 23,816,752 25,565,680 1,748,928 20,000,000 20,000,000 20,000,000 19,220,242 20,000,000 Strategic Investments 9,165,522 5,212,272 5,953,716 741,444 1,641,899 1,222,770 1,307,702 1,387,634 1,467,566 Capital Projects 14,793,010 7,994,505 12,470,925 4,476,420 2,000,000 - - - - Capital Reserves 3,313,522 9,456,564 4,536,859 (4,919,705) 9,064,669 4,064,669 5,252,774 4,840,879 4,840,879 University Reserves 23,190,283 14,463,167 17,820,559 3,357,392 7,142,187 6,471,316 558,279 - 130,310 Other Reserves 4,095,000 4,095,000 3,770,000 (325,000) 4,095,000 4,095,000 4,095,000 4,095,000 4,095,000
$80,640,709 $65,038,260 $70,117,739 $5,079,479 (7) $43,943,755 $35,853,755 $31,213,755 $29,543,755 $30,533,755
* $8.8 million capital funded with university revenues +0.3 million debt funded + $1.7 million state funded = $10.8 million FY14 capital expenditures
June 30, 2019 Projection
June 30, 2016 Projection
June 30, 2017 Projection
June 30, 2018 Projection
OUTYEARS FISCAL SUSTAINABILITY MODEL (6/13/2014)
FY14 FORECAST TO ACTUAL
Cash Balances @ June 30
CashJune 30, 2013
ActualJune 30, 2014
ForecastJune 30, 2014
Actual VarianceJune 30, 2015
Projection
Revenue Greater Than/(Less Than) Expenditures

UNC Budget Structure
16
Operating Budget
Annual, river of revenue,
$180M
Strategic Investment
BudgetSpecific
opportunities, multiyear $5M
Capital Budget
SOME state funds,
multiyear $8M
Restricted Grants and
Financial Aid$8M sponsored
programs. $20M fed/state student grants
Approved Budget (June Book) and Quarterly Financial Reports
Summer, Schlrshp Allow, Capitalization,
Debt, Other Adjustments
Annual Report(Audited financial
statements & supplemental information

Capital and Debt
17
• Capital: $716M replacement value, $151M deferred maintenance
• Debt ~$143 million– Moody’s A1; Standard & Poors A– 2014A $52M refunding 3.7%
• Where are we with Campus Commons?• $ 73.6 million building-114,000 sq ft: $40 million state; $10
million donor;$24 million bonds backed by student fee ($160 annual fee)
• CCHE prioritization; CDC December

Multiyear Strategic Financial Management
18
Enrollment and Revenue
Growth FY16- FY19
Investing ReservesFY14 and FY15
Building Reserves
FY09- FY13
Growth Strategy Targets
1. 15,000 students by Fall 20182. Increase the proportion of graduate students
from 20% to 25%3. Increase undergraduate persistence by 2 pct
points to 83% by Fall 20184. Identify $2.4 million in sustainable cost savings5. Break ground on Campus Commons summer
2016
19