Embed Size (px)
Citation preview
UNITED STATES ENVIRONMENTAL PROTECTION AGENCY REGION 5
77 WEST JACKSON BOULEVARD CHICAGO, IL 60604-3590
SR-6J
Ms. Jane Powell Fernald Preserve Site Manager DOE-LM-20.1 10995 Hamilton Cleves Highway Harrison, Ohio 45030
RE: Feed Materials Production Center Third Five Year Review Report
Dear Ms. Powell:
The United States Environmental Protection Agency (U.S. EPA) has completed its review of the United States Department of Energy's (U.S. DOE) Draft Final version ofthe Third Five-Year Review Report dated September 2011, for the subject site also known as the Fernald Preserve. EPA concurs with the protectiveness statement and the report is hereby approved.
U.S. EPA appreciates the efforts of U.S. DOE staff in conducting this review. Please contact Timothy J. Fischer of my staff at (312) 886-5787 if you have any questions.
Sincerely,
~c )U, Richard C. Karl, Director Superfund Division
cc: Tom Schneider, OEPA-SWDO
LMS/FERlS07045
Five-Year Review Report
Third Five-Year Review Repol·t
for the
Fernald Preserve
Butler and Hamilton Counties, Ohio
September 2011
PREPARED BY:
U.S. Department ofEnergy Office of Legacy Management
Grand Junction, Colorado
Date:
e owell aId Preserve Manager
D E-LM-20.1
-------------.-------------
This page intentionally left blank
Contents
-------------.-----------
Acronyms ........................................................................................................................................ v Executive Summary ...................................................................................................................... vii Five-Year Review Summary Form ................................................................................................ ix 1.0 Introduction ........................................................................................................................... 1 2.0 Site Chronology ..................................................................................................................... 2 3.0 Background ........................................................................................................................... 3
3.1 Physical Characteristics ................................................................................................3 3.2 Land and Resource Use ................................................................................................3 3.3 History of Contamination .............................................................................................4 3.4 Initial Response ............................................................................................................4 3.5 Basis for Taking Action ............................................................................................... .4
4.0 Remedial Actions .................................................................................................................. 6 4.1 Remedy Selection .........................................................................................................6 4.2 Remedy Implementation ...............................................................................................9
4.2.1 OUI Remedial Actions .....................................................................................9 4.2.2 OU2 Remedial Actions ................................................................................... 10 4.2.3 OU3 Remedial Actions .................................................... · ............................... 11 4.2.4 OU4 Remedial Actions ................................................................................... 12 4.2.5 OU5 Remedial Actions ................................................................................... 13 4.2.6 Site-Wide Remedial Actions .......................................................................... 14
4.3 System Operation ........................................................................................................ 16 5.0 Five-Year Review Process .................................................................................................. 18
5.1 Community Notification and Involvement.. ............................................................... 18 5.2 Document Review ...................................................................................................... 18 5.3 Data Revie\v ................................................................................................................ 18
5.3.1 OSDF Performance Monitoring ..................................................................... 18 5.3.2 Groundwater Monitoring ................................................................................ 19 5.3.3 Surface Water Monitoring ..............................................................................19 5.3.4 Sediment Monitoring ......................................................................................20 5.3.5 Air Monitoring ................................................................................................20 5.3.6 Radon Monitoring ...........................................................................................20
5.4 Site Inspection ............................................................................................................20 6.0 Technical Assessment ......................................................................................................... 22
6.1 Question A: Remedy Function ...................................................................................22 6.1.1 OUI - Waste Pits ............................................................................................22 6.1.2 OU2 - Other Waste Units ...............................................................................22 6.1.3 OU3 - Production Area Facilities ...................................................................22 6.1.4 OU4 - Silos.....................................................................................................22 6.1.5 OU5 - Groundwater, OSDF, Soils, and Sediments ........................................23 6.1.6 Status of the Groundwater Remediation ........................................................ .23 6.1.7 Implementation of Institutional Controls and Other Measures ......................25 6.1.8 Operational Efficiency ....................................................................................25 6.1.9 Capture ofthe Uranium Plume .......................................................................26 6.1.10 Uranium Concentration Predictions ...............................................................26 6.1.11 Uranium Removal Predictions ........................................................................27 6.1.12 Groundwater Treatment ..................................................................................27
U.s. Department of Energy Third F,ve·Year Review Report for the Fernald Preserve September 20 II Doc No. S07045-Final
Page i
6.1.13 Status of OSDF Leachate/Leak Detection ......................................................28 6.1.14 Status ofOSDF Cap........................................................................................28 6.1.15 Status of Soils and Sediments Remediation ...................................................29
6.2 Question B: Assumptions Validity .............................................................................29 6.2.1 Review of Post-Remedial Action Contaminant Toxicity Assumptions .........29 6.2.2 Human Health Risks and Remedial Design ....................................................30 6.2.3 Cancer Slope Factors (CSFs) ..........................................................................31 6.2.4 Chemical Reference Dose ...............................................................................31 6.2.5 Changes in Slope Factors and Reference Doses .............................................31 6.2.6 Comparison of October 2010 RAIS CSF and RID Values to IRRA ..............32 6.2.7 2010 Risk Calculations for the Undeveloped Park User ................................37 6.2.8 Ecological Risk ...............................................................................................53 6.2.9 Review of Maximum Contaminant Levels (MCLs) ....................................... 53
6.3 Question C: New Information .................................................................................... 56 6.3.1 Technical Assessment Summary ....................................................................56
7.0 Issues ................................................................................................................................... 57 7.1 Issue 1 - Not Achieving Model-Predicted Aquifer Remediation Cleanup Times ..... 57
7.1.1 Sorbed Uranium Contamination in the Vadose Zone of the Aquifer .............57 7.1.2 Stagnation Zones within the Uranium Plume ..................................................58 7.1.3 Preferential Flushing Pathways within the Uranium Plume ........................... 58
7.2 Issue 2 - Elevated Uranium Concentrations in Surface Water West of Former Waste Pit 3 ..................................................................................................................58
7.3 Issue 3 - Debris Management Program ......................................................................59 8.0 Recommendations and Follow-Up Actions ........................................................................ 60 9.0 Protectiveness Statement(s) ................................................................................................. 61 10.0 Next Review ........................................................................................................................ 62 11.0 References ........................................................................................................................... 63
Tables
Table 1. Chronology of Site Events .............................................................................................2
Table 12. Undeveloped Park User in Zone 5 - Summation of All Pathways for Individual
Table 13. Undeveloped Park User in Zone 5 - Summation of All Pathways for Individual
Table 2. Annual Groundwater System O&M Costs .................................................................. 17 Table 3. Annual OSDF Leachate System O&M Costs .............................................................. 17 Table 4. Annual OSDF Cap System O&M Costs ...................................................................... 17 Table 5. Aquifer Restoration System Operational Summary Sheet.. ......................................... 23 Table 6. Actual Total Uranium Residuals vs. Model Predicted Concentrations .......................27 Table 7. Comparison ofIRRA (2007) and Present Risk for the Undeveloped Park User in
Zone 5 of the Fernald Preserve ....................................................................................32 Table 8. Comparison of Cancer Slope Factors (CSF) for Chemicals ........................................32 Table 9. Comparison of Cancer Slope Factor (CSF) for Radionuclides .................................... 35 Table 10. Comparison of Reference Dose (RiD) for Chemicals .................................................35 Table 11. Undeveloped Park User in Zone 5 - Summation of All Pathways ..............................37
Nuclides ................... : ................................................................................................... 38
Chemicals .....................................................................................................................39 Table 14. Undeveloped Park User in Zone 5 - Inhalation Pathway; Chemicals ........................ .41
Third Five-Year Review Report for the Fernald Preserve u.s. Department of Energy Doc No. S07045-Final September 2011 Page ii
Table 15. Undeveloped Park User in Zone 5 - Dennal Soil Contact; Chemicals ...................... .43 Table 16. Undeveloped Park User in Zone 5 - Ingestion of Soil; Chemicals ............................ .45 Table 17. Undeveloped Park User in Zone 5 - Dennal Surface-Water Contact; Chemicals ..... .47 Table 18. Undeveloped Park User in Zone 5 - Ingestion of Surface Water; Chemicals ............ .49 Table 19. Undeveloped Park User in Zone 5 - Inhalation Pathway; Radionuclides ................... 51 Table 20. Undeveloped Park User in Zone 5 - Ingestion of Soil; Radionuclides ....................... 51 Table 21. Undeveloped Park User in Zone 5 - Ingestion of Surface Water; Radionuclides ....... 52 Table 22. Undeveloped Park User in Zone 5 - External Radiation; Radionuclides .................... 52 Table 23. Updated Soil Ecological BTVs .................................................................................... 54 Table 24. Updated Surface Water Ecological BTVs ................................................................... 55 Table 25. Issues ............................................................................................................................ 57 Table 26. Recommendations and Follow-Up Actions ................................................................. 60
Attachments
Attachment 1 Fernald Preserve and Vicinity Attachment 2 Fernald Preserve Site Configuration Attachment 3 Initial Public Notice Attachment 4 Public Questionnaire Attachment 5 Fernald Preserve Inspection Schedule Attachment 6 Site Inspection Photographs from Select Locations Attachment 7 Monitoring Wells with 2009 Exceedances for Total Uranium with Up, Down, or
No Significant Trends Attachment 8 Hamilton County Health Department Aquifer Restoration Notification Letter Attachment 9 Total Groundwater Extracted, Injected, and Net Extracted from GMA
(FY 1993 through FY 2010) Attachment 10 Uranium Extracted, Injected, and Net from GMA (1993-2010) Attachment 11 Routine Groundwater Elevation Map, Fourth Quarter 2009
(October 12 and October 13) Attachment 12 Percent Complete Estimate Based on Uranium Removal (2006-2009) Attachment 13 Groundwater Treated: Planned and Actual (FY 1995-FY 2010) Attachment 14 Groundwater Not Treated (1997-2010) Attachment 15 Percent of Groundwater Pumped that was Treated and Average Monthly
Uranium Discharge Concentration vs. Time (January 2004--September 2010) Attachment 16 Water Levels in Monitoring Well 62433 (May 25, 2007-January 3, 2011) Attachment 17 Waste Storage Area (Phase II) Design Remediation Footprint
U.s. Department of Energy Third Five-Year Review Report for the Fernald Preserve September 2011 Doc No. S07045-Final
Page iii
This page intentionally left blank
Third Five-Year Review Report for the Fernald Preserve U.S. Department of Energy Doc No. S07045-Final September 20 II Pageiv
Acronyms
AOC
ARAR
A\VWT
BRSR
BTV
CAWWT
CD
CERCLA
CFR
CRARE
CSF
D&D
DOE
EPA
ESD
FFCA
FMPC
FRL
FY
Gl'vlA
gpad
gpm
HI
HTW
IEMP
ILCR
IRIS
IROD
IRRA
lbs
LCS
LDS
Area of Concern
applicable or relevant and appropriate requirement
Advanced Wastewater Treatment
Baseline Remedial Strategy Report
benchmark toxicity value
Converted Advanced Wastewater Treatment
Consent Decree
Comprehensive Environmental Response, Compensation, and Liability Act
Code of Federal Regulations
Comprehensive Response Action Risk Evaluation
cancer slope factor
decontamination and dismantling
U.S. Department of Energy
U.S. Environmental Protection Agency
Explanation of Significant Differences
Federal Facility Compliance Agreement
Feed Materials Production Center
Final Remediation Level
fiscal year
Great Miami Aquifer
gallons per acre per day
gallons per minute
Hazard Index
horizontal till well
Integrated Environmental Monitoring Plan
Incremental Lifetime Cancer Risk
Integrated Risk Information System
Record of Decision for Interim Action
Interim Residual Risk Assessment
pounds
leachate collection system
leak detection system
u.s. Department of Energy Third Five-Year Review Report for the Fernald Preserve September 20 II Doc No. S07045-Final
Page v
LMICP
M gal
MCL
MCLG
/lg/L
mg/L
NPDES
NPL
NTS
O&M
OEPA
OSDF
OSWER
au PCB
pCi/g
pCi/L
PPRTV
RAIS
RCRA
RID
RI
RIfFS
ROD
SDWA
SEP
SER
TBD
WAC
Comprehensive Legacy Management and Institutional Controls Plan
million gallons
Maximum Contaminant Level
Maximum Contaminant Level Goals
micrograms per liter
milligrams per liter
National Pollutant Discharge Elimination System
National Priorities List
Nevada Test Site
operations and maintenance
Ohio Environmental Protection Agency
On-Site Disposal Facility
Office of Solid Waste and Emergency Response
Operable Unit
polychlorinated biphenyl
picocuries per gram
picocuries per liter
Provisional Peer Reviewed Toxicity Value
Risk Assessment Information System
Resource Conservation Recovery Act
reference dose
Remedial Investigation
Remedial Investigation/Feasibility Study
Record of Decision
Safe Drinking Water Act
Site-Wide Excavation Plan
Site Environmental Report
To Be Determined
Waste Acceptance Criteria
Third Five-Year Review Report for the Fernald Preserve u.s. Department of Energy Doc No. S07045-Final September 2011 Page vi
Executive Summary
This third five-year review is the first to be conducted after physical completion of remedial actions at the Fernald Preserve in Harrison, Ohio, on October 29,2006. At that time, remedial actions for Operable Units (OUs) 1 through 4 were complete while the groundwater remedy being implemented under OU5 was determined operational and functional. OUs I through 4 were considered source OUs, while OU5 addressed the contaminated media affected by past site operations and waste disposal practices. The OUs were defined as follows:
• OUI, Waste Pit Area: Waste Pits I through 6, Clearwell, Bum Pit, berms, liners, and affected soil residing within the au boundary.
• OU2, Other Waste Units. The Active and Inactive Flyash Piles, the South Field disposal area, north and south Lime Sludge Ponds, the Solid Waste Landfill, and the berms, liners, and affected soil residing within the au boundary.
• OU3, Former Production Area: Former production and production-associated facilities and equipment including all above- and below-grade improvements.
• OU4, Silos I through 4: Contents of Silos 1, 2, 3 (Silo 4 has remained empty); the silo structures, berms, decant sump tank system, and affected soil residing within the au boundary.
• OUS, Environmental Media: Groundwater, surface water, all soil not included in the definitions ofOUs I through 4, sediment, and flora and fauna.
The focus of this five-year review is to ensure that the remedies completed for OUs 1 through 4 remain protective of human health and the environment, the performance of the On-Site Disposal Facility meets design criteria, the ongoing groundwater remedy is performing to design expectations, and the required institutional controls are being implemented and are effective. A review of all available operational data, environmental monitoring data, and site inspection reports since November 2006 are the basis of the following conclusions:
• The remedies completed for OUs 1,2,3, and 4 continue to be protective ofhuman health and the environment.
• The groundwater remedy conducted under OU5 is anticipated to be protective of human health and the environment upon completion and, in the interim, exposures to groundwater contamination that could result in unacceptable risks are being controlled.
U.S. Department of Energy Third Five-Year Review Report for the Fernald Preserve September 2011 Doc No. S07045-Final
Page vii

This page intentionally left blank
Third Five-Year Review Report for the Fernald Preserve u.s. Department of Energy Doc No. S07045-Final September 20 II Page viii
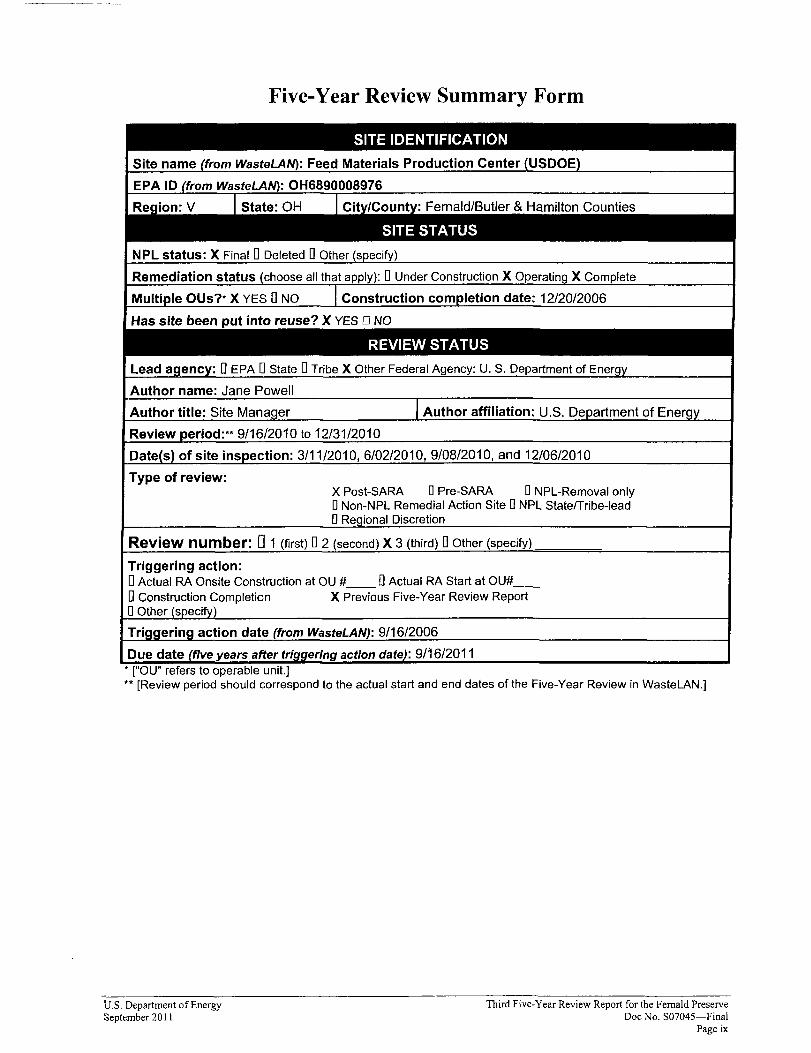
Five-Year Review Summary Form
SITE IDENTIFICATION
: Feed Materials Production Center
Remediation status choose all that
Multi OUs?* X YES 0 NO
Has site been put into reuse? X YES 0 NO
REVIEW STATUS
Lead agency: 0 EPA 0 State 0 Tribe X Other Federal Agency: U. S. Department of Energy
Author name: Jane Powell
Author title: Site Manager IAuthor affiliation: U.S. Department of Energy
Review period:** 9/16/2010 to 12/31/2010
Date(s) of site inspection: 3/11/2010, 6/02/2010, 9/08/2010, and 12/06/2010
Type of review: X Post-SARA oPre-SARA oNPL-Removal only oNon-NPL Remedial Action Site 0 NPL StatelTribe-lead oRegional Discretion
Review number: 0 1 (first) 0 2 (second) X 3 (third) 0 Other (specify)
Triggering action: oActual RA Onsite Construction at OU #__ oActual RA Start at OU# __
oConstruction Completion X Previous Five-Year Review Report oOther (specify)
Triggering action date (from WasteLAN): 9/16/2006
Due date (five years after triggering action date): 9/16/2011 " "* [OU refers to operable Unit.]
** [Review period should correspond to the actual start and end dates of the Five-Year Review in WasteLAN.]
u.s. Department of Energy Third Five-Year Review Report for the Fernald Preserve September 2011 Doc No. S07045-Final
Pageix
Five-Year Review Summary Form, cont'd.
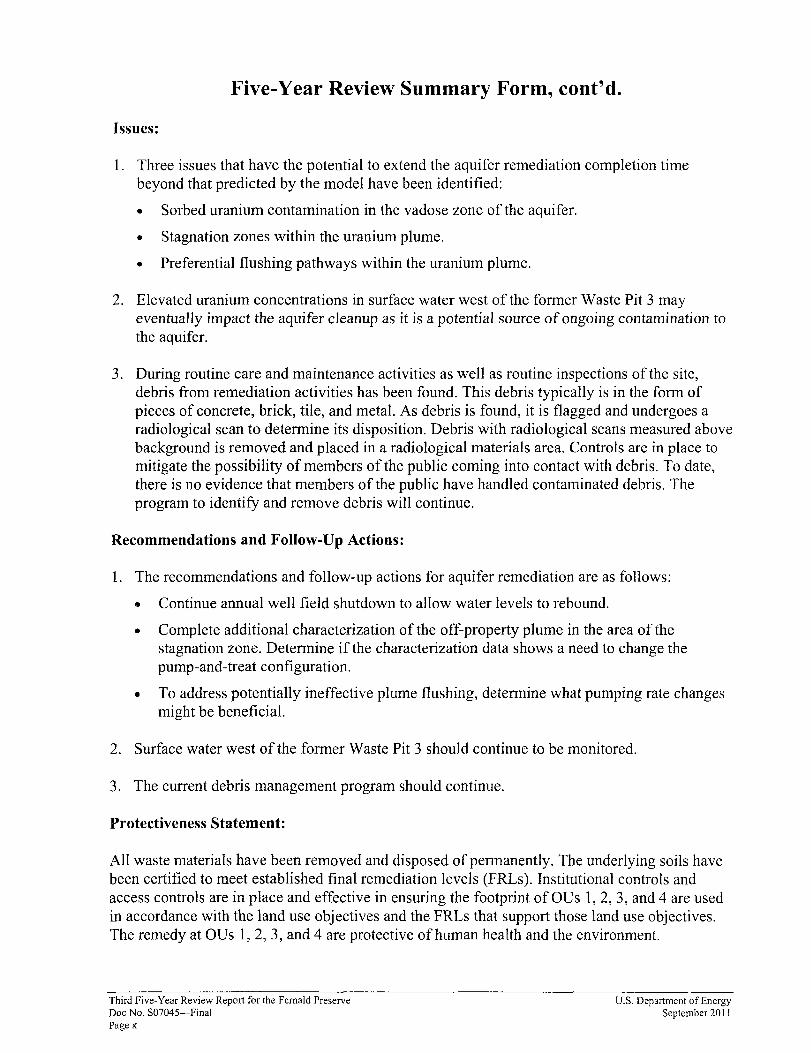
Issues:
1. Three issues that have the potential to extend the aquifer remediation completion time beyond that predicted by the model have been identified:
• Sorbed uranium contamination in the vadose zone of the aquifer.
• Stagnation zones within the uranium plume.
• Preferential flushing pathways within the uranium plume.
2. Elevated uranium concentrations in surface water west of the former Waste Pit 3 may eventually impact the aquifer cleanup as it is a potential source of ongoing contamination to the aquifer.
3. During routine care and maintenance activities as well as routine inspections of the site, debris from remediation activities has been found. This debris typically is in the form of pieces of concrete, brick, tile, and metal. As debris is found, it is flagged and undergoes a radiological scan to determine its disposition. Debris with radiological scans measured above background is removed and placed in a radiological materials area. Controls are in place to mitigate the possibility of members of the public coming into contact with debris. To date, there is no evidence that members of the public have handled contaminated debris. The program to identify and remove debris will continue.
Recommendations and Follow-Up Actions:
1. The recommendations and follow-up actions for aquifer remediation are as follows:
• Continue annual well field shutdown to allow water levels to rebound.
• Complete additional characterization of the off-property plume in the area of the stagnation zone. Determine if the characterization data shows a need to change the pump-and-treat configuration.
• To address potentially ineffective plume flushing, determine what pumping rate changes might be beneficial.
2. Surface water west of the former Waste Pit 3 should continue to be monitored.
3. The current debris management program should continue.
Protectiveness Statement:
All waste materials have been removed and disposed of permanently. The underlying soils have been certified to meet established final remediation levels (FRLs). Institutional controls and access controls are in place and effective in ensuring the footprint of GUs 1,2,3, and 4 are used in accordance with the land use objectives and the FRLs that support those land use objectives. The remedy at OUs 1,2,3, and 4 are protective of human health and the environment.
Third Five-Year Review Report for the Fernald Preserve u.s. Department of Energy Doc No. S07045-Final September 20 II Page x
The remedy at OUS is expected to be protective of human health and the environment and, in the interim, exposure pathways that could result in unacceptable risks are being controlled. Current groundwater monitoring data indicate the groundwater remedy is functioning as required to achieve groundwater FRLs. The cap and liner systems of the OSDF are functioning as designed and are successfully containing disposed waste materials. The volume of leachate generated from the OSDF is continuing to decline, and the leachate is being effectively collected and treated to minimize impacts to human health and the environment.
u.s. Department of Energy Third Five-Year Review Report for the Fernald Preserve September 20 II Doc No. S07045-Final
Page xi

This page intentionally left blank
Third Five-Year Review Report for the Fernald Preserve u.s. Department of Energy Doc No. S07045-Final September 20 II Page xii
1.0 Introduction
Section 121 (c) of the Comprehensive Environmental Response, Compensation, and Liability Act (CERCLA) requires that selected National Priorities List (NPL) sites conduct a five-year review of remedial actions. The five-year review is a statutory requirement for NPL sites, such as the Fernald Preserve (formerly known as the Fernald Closure Project), that implement remedial actions to reduce hazardous substances, pollutants, or contaminants at the site to levels below those allowed for unlimited use and unrestricted exposure. For sites where the U.S. Department of Energy (DOE) is the lead agency, and where a statutory review is required, DOE is responsible for conducting the review every 5 years after the initiation of the selected remedial action. The findings are documented in Five-Year Review reports to the U.S. Environmental Protection Agency (EPA), as cited in CERCLA (Section 120 and 121 as well as Executive Order 12580, Superfund Implementation).
The purpose of five-year reviews is to determine whether the remedy at a site is protective of human health and the environment. The methods, findings, and conclusions of reviews are documented in Five-Year Review reports. In addition, Five-Year Review reports identifY issues found during the review, if any, and recommendations to address them.
DOE ensures that the remedy at the Fernald Preserve remains protective ofhuman health and the environment through the continued implementation of the Legacy Management and Institutional Controls Plan (LMICP) (DOE 201Oa). The LMICP documents the requirements for the long-term care and maintenance of the Fernald Preserve. The plan outlines the institutional controls including routine inspections, permits, continuing groundwater remedial activities, routine maintenance and monitoring, and leachate management practices.
DOE is responsible for conducting the five-year review at sites under its jurisdiction, while EPA is responsible for concurrence with the review. DOE and its contractor, the S.M. Stoller Corporation (Stoller), conducted the five-year review of the remedy implemented at the Fernald Preserve near Harrison, Ohio. As defined by the prime contract, Stoller is responsible for management of the site. This review was conducted for the entire site from September 2010 through December 2010. This report documents the results of the review.
This is the third five-year review for the Fernald Preserve. It documents the status of the remedial actions implemented for each of the five operable units (OUs) at the Fernald Preserve. For sites with multiple OUs, the five-year review clock is triggered by the onset of construction for the first OU remedial action that will result in hazardous substances, pollutants, or contaminants remaining at the site above levels that allow for unlimited use and unrestricted exposure. Of all the OUs, the site preparation construction to support the Waste Pit Remedial Action Project under the OUI Record of Decision (DOE 1995c) was the first such action. This construction began on April 1, 1996; consequently, the first five-year review report had a due date of April 1, 2001. Per EPA guidance, the trigger date for subsequent five-year reviews is the signature date of the previous Five-Year Review report. For reviews led by other Federal agencies (e.g., DOE) where EPA has a concurrence role, the trigger for subsequent reviews corresponds to EPA's concurrence signature date of the preceding Five-Year Review report. The EP A concurrence date for the previous Five-Year Review report was September 16, 2006. Therefore, the due date for the current Five-Year Review report is September 16, 2011.
U.s. Department of Energy Third Five-Year Review Report for the Fernald Preserve September 2011 Doc No. S07045-Final
Page 1
2.0 Site Chronology
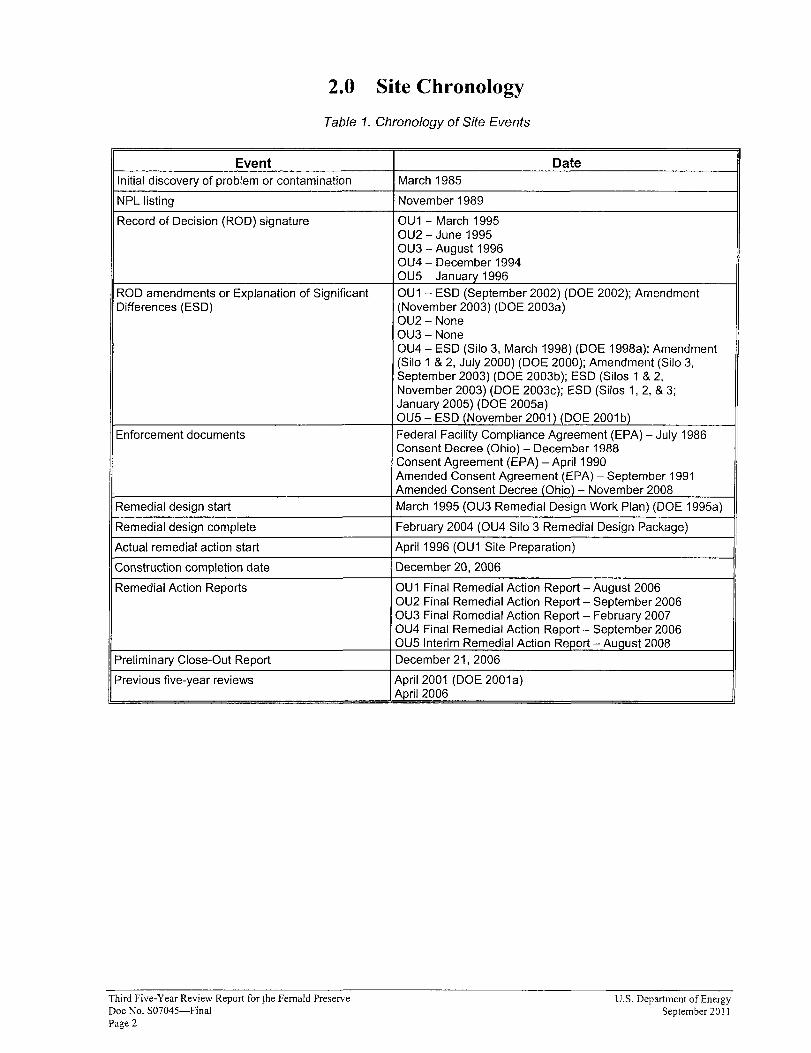
Table 1. Chronology of Site Events
DateEvent Initial discovery of problem or contamination March 1985
NPL listing November 1989
Record of Decision (ROD) signature OU1 - March 1995 OU2 - June 1995 OU3 - August 1996 OU4 - December 1994 OU5 - January 1996
ROD amendments or Explanation of Significant OU1 - ESD (September 2002) (DOE 2002); Amendment Differences (ESD) (November 2003) (DOE 2003a)
OU2 - None OU3 - None OU4 - ESD (Silo 3, March 1998) (DOE 1998a); Amendment (Silo 1 & 2, July 2000) (DOE 2000); Amendment (Silo 3, September 2003) (DOE 2003b); ESD (Silos 1 &2, November 2003) (DOE 2003c); ESD (Silos 1, 2, &3; January 2005) (DOE 2005a) OU5 - ESD (November 2001) (DOE 2001 b)
Enforcement documents Federal Facility Compliance Agreement (EPA) - July 1986 Consent Decree (Ohio) - December 1988
: Consent Agreement (EPA) - April 1990 Amended Consent Agreement (EPA) - September 1991 Amended Consent Decree (Ohio) - November 2008
Remedial design start March 1995 (OU3 Remedial Design Work Plan) (DOE 1995a)
Remedial design complete February 2004 (OU4 Silo 3 Remedial Design Package) iActual remedial action start April 1996 (OU1 Site Preparation) I
December 20,2006
Remedial Action Reports
Construction completion date
OU1 Final Remedial Action Report - August 2006 OU2 Final Remedial Action Report - September 2006 OU3 Final Remedial Action Report - February 2007 OU4 Final Remedial Action Report - September 2006 OU5 Interim Remedial Action Report - August 2008
Preliminary Close-Out Report December 21, 2006
Previous five-year reviews April 2001 (DOE 2001 a) April 2006
Third Five-Year Review Report for the Fernald Preserve u.s. Department of Energy Doc No. S07045-Final September 2011 Page 2
3.0 Background
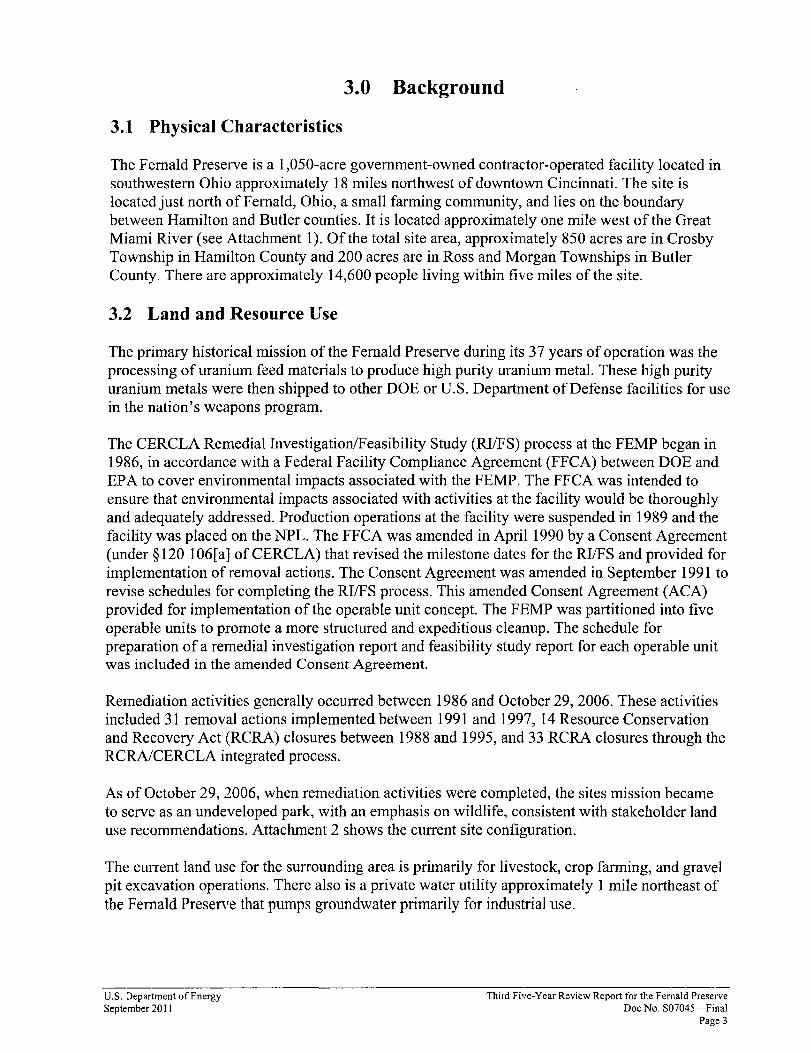
3.1 Physical Characteristics
The Fernald Preserve is a 1 ,050-acre government-owned contractor-operated facility located in southwestern Ohio approximately 18 miles northwest of downtown Cincinnati. The site is located just north of Fernald, Ohio, a small farming community, and lies on the boundary between Hamilton and Butler counties. It is located approximately one mile west of the Great Miami River (see Attachment 1). Of the total site area, approximately 850 acres are in Crosby Township in Hamilton County and 200 acres are in Ross and Morgan Townships in Butler County. There are approximately 14,600 people living within five miles of the site.
3.2 Land and Resource Use
The primary historical mission of the Fernald Preserve during its 37 years of operation was the processing of uranium feed materials to produce high purity uranium metal. These high purity uranium metals were then shipped to other DOE or U.S. Department of Defense facilities for use in the nation's weapons program.
The CERCLA Remedial Investigation/Feasibility Study (RIIFS) process at the FEMP began in 1986, in accordance with a Federal Facility Compliance Agreement (FFCA) between DOE and EPA to cover environmental impacts associated with the FEMP. The FFCA was intended to ensure that environmental impacts associated with activities at the facility would be thoroughly and adequately addressed. Production operations at the facility were suspended in 1989 and the facility was placed on the NPL. The FFCA was amended in April 1990 by a Consent Agreement (under § 120 106[a] ofCERCLA) that revised the milestone dates for the RIlFS and provided for implementation of removal actions. The Consent Agreement was amended in September 1991 to revise schedules for completing the RVFS process. This amended Consent Agreement (ACA) provided for implementation of the operable unit concept. The FEMP was partitioned into five operable units to promote a more structured and expeditious cleanup. The schedule for preparation of a remedial investigation report and feasibility study report for each operable unit was included in the amended Consent Agreement.
Remediation activities generally occurred between 1986 and October 29, 2006. These activities included 31 removal actions implemented between 1991 and 1997, 14 Resource Conservation and Recovery Act (RCRA) closures between 1988 and 1995, and 33 RCRA closures through the RCRAICERCLA integrated process.
As of October 29, 2006, when remediation activities were completed, the sites mission became to serve as an undeveloped park, with an emphasis on wildlife, consistent with stakeholder land use recommendations. Attachment 2 shows the current site configuration.
The current land use for the surrounding area is primarily for livestock, crop farming, and gravel pit excavation operations. There also is a private water utility approximately 1 mile northeast of the Fernald Preserve that pumps groundwater primarily for industrial use.
u.s. Department of Energy Third Five-Year Review Report for the Fernald Preserve September 20 II Doc No. S07045-Final
Page 3
The portion of the Great Miami Aquifer (GMA) underlying the site is currently not used as a drinking water source. The dominant groundwater flow direction is from west to east beneath the site then to the south and southeast toward the Great Miami River.
3.3 History of Contamination
Manufacture of the uranium metal products generally occurred in seven of the Fernald Preserve's more than 50 production, storage, and support buildings that comprised what was known as the 140-acre Production Area. During the 37 years of production operations, nearly 500 million pounds of uranium metal products were produced. The site also served as the nation's key federal repository for thorium-related nuclear products, and it also recycled uranium used in the reactors at the Hanford Site in the state ofWashington. These recycled reactor returns were the source oftechnetium-99, a radiological contaminant that was prevalent at the site.
Liquid and solid wastes were generated by the various operations between 1952 and 1989. Before 1984, solid and slurried wastes from Fernald processes were deposited in the on-property Waste Storage Area. This area, located west of the former Production Area, included six low-level radioactive waste storage pits; two earthen-bermed concrete silos containing K-65 residues; one concrete silo containing metal oxides; one unused concrete silo; two lime sludge ponds; a bum pit; a clearwell; the Solid Waste Landfill; and a lagoon known as the bio-surge lagoon to treat wastewater. After 1984, wastes produced from operations were containerized for eventual off-site disposal. Contaminants from material processing and related activities were released into the environment through air emissions, wastewater discharges, stormwater runoff, leaks and spills.
3.4 Initial Response
On March 9, 1985, EPA issued a Notice of Noncompliance to DOE, identifying concerns about environmental impacts associated with Fernald's past and ongoing operations. Ohio Environmental Protection Agency (OEPA) sued DOE and National Lead of Ohio for violations of hazardous waste and water pollution laws in 1986. In response, DOE initiated the CERCLA process that same year to characterize the nature and extent of contamination at the Fernald Feed Materials Production Center (FMPC), establish risk-based cleanup standards, and select the appropriate remediation technologies to achieve those standards. In November 1989, EPA placed the Fernald site on the NPL. By 1991, the site mission had officially changed from uranium production to environmental remediation and site restoration under CERCLA.
There were 31 removal actions, 17 underground storage tank removals, and 14 closures conducted under RCRA to stabilize site operations and address imminent or ongoing releases of hazardous substances.
3.5 Basis for Taking Action
The sources of contamination located within each of the source OUs represented a continuing release of hazardous substances. The resultant contamination of the soils, groundwater, surface water, sediments, and air emissions represented an unacceptable risk to human health and the environment as well as to ecological receptors.
Third Five-Year Review Report for the Fernald Preserve u.s. Department of Energy Doc No. S07045-Final September 20 II Page 4
Extensive sampling of soil, groundwater, surface water, and sediments was conducted during the remedial investigation to characterize the nature and extent of contamination resulting from past operations. Findings included the following:
• Data from the OU5 Remedial Investigation (RI) (DOE 1995b) indicated that uranium contamination of soil was widespread on Fernald property, including both surface soils and subsurface soils. Radium-226 and thorium contaminants were predominant. The extent of the uranium contamination boundaries generally included all other contaminants, including inorganic and organic contaminants. The predominant inorganic contaminants were cadmium and beryllium, but other heavy metals were found as well. The primary organic contaminants included volatile organic contaminants (related to chlorinated solvents), semi-volatile contaminants, and polychlorinated biphenyls (PCBs). Off-property uranium contamination was also found above background levels due to air emissions from plant stacks.
• It was found that contamination of the groundwater had resulted from infiltration through the bed ofPaddys Run, the Storm Sewer Outfall Ditch, and the Pilot Plant Drainage Ditch. In portions of these drainages, the glacial overburden was eroded, and the sand and gravel of the aquifer was in direct contact with uranium contaminated surface water from the site. To a lesser degree, groundwater contamination also resulted where past excavations (such as the waste pits) or deep building foundations removed some of the protective clay contained in the glacial overburden and exposed the aquifer to contamination.
• Uranium contamination was found in the uppermost portions of the GMA as well as in perched groundwater zones throughout the former Production Area. As with soil, the uranium contamination boundary generally included all other contaminants detected above background. Predominant contaminants found in perched groundwater included uranium, technetium, heavy metals, and volatile organics. Predominant contamination in the aquifer included uranium, technetium, and heavy metals. Groundwater contamination was found off-site to the south of the Fernald property. At the time of the RI it was found that approximately 172 acres of the GMA had uranium contamination above 20 parts per billion (Ppb).
• Elevated levels of uranium were found in the primary uncontrolled site surface water drainage channels including the Storm Sewer Outfall Ditch and the Pilot Plant Drainage Ditch. Concentrations of uranium in the Great Miami River were detected above background but quickly diminished downstream of the outfall line. On-property sediment sampling predominantly detected uranium and radium along with some volatile and semivolatile organics. Only uranium contamination was found in off-property sediment sampling.
u.s. Department of Energy Third Fi'le-Year Review Report for the Fernald Preserve September 20 II Doc No. S07045-Final
Page 5
4.0 Remedial Actions
4.1 Remedy Selection
For purposes of investigation and study, the remedial issues and concerns that were similar in location, history, type/level of contamination, and inherent characteristics were grouped into OUs under the 1991 Amended Consent Agreement. Specifically, the site was divided into five OUs. Four of the OUs (1 through 4) are considered contaminant "source" OUs as they represent the physical sources of contamination that have affected the site's environmental media. The fifth operable unit (OU5) is considered the "environmental media" OU as it represents the environmental media affected by (1) past production operations and waste disposal practices (i.e., beyond the contaminant "source" OU boundaries) and (2) the pathways of contaminant migration at the site. The four contaminant "source" OUs and the fifth environmental media OU are described below:
• OUI, Waste Pit Area: Waste Pits 1 through 6, a clearwell, a bum pit, berms, liners, and affected soil residing within the OU boundary.
• OU2, Other Waste Units: Fly ash piles, other South Field disposal areas, lime sludge ponds, the Solid Waste Landfill, berms, liners, and affected soil residing within the OU boundary.
• OU3, Former Production Area: Former production and production-associated facilities and equipment (including all above- and below-grade improvements), includIng, but not limited to, all structures, equipment, utilities, drums, tanks, solid waste, waste, product, thorium, effluent lines, a portion of the K-65 transfer line, wastewater treatment facilities, fire training facilities, scrap metal piles, feedstocks, and a coal pile. Note that all affected soil beneath the facilities falls within OU5.
• OU4, Silos I through 4: Contents of Silos 1, 2, 3 (Silo 4 has remained empty); the silo structures, berms, decant sump tank system, and affected soil residing within the OU boundary.
• OUS, Environmental Media: Affected groundwater; surface water; soil not included in the definitions of OUs 1, 2, and 4; sediment, and flora and fauna.
During the time period 1994 to 1996, DOE and EPA signed the final Records of Decision (RODs) for each OU, in cooperation with the OEPA and the Fernald Citizen's Advisory Board. The RODs specified the major cleanup requirements and approaches that collectively define the Fernald cleanup. The RODs employed a combination of off-site and on-site disposal, under which an estimated 77 percent of the remedial waste volume (the site's lower-concentration, higher-volume materials) was to be disposed of in the engineered OSDF while approximately 23 percent of the waste volume (the site's higher-concentration, lower-volume materials) was to be sent off site for disposal, primarily at permitted facilities in Utah, Nevada, and Texas.
At the time the RI/FS activities were completed and the RODs put in place, an estimated 31 million pounds of uranium products, 2.5 billion pounds of waste, 255 buildings and structures, and 2.75 million cubic yards of contaminated soil and debris were identified as requiring action. In addition, a 223-acre portion of the GMA was found to be contaminated at levels above radiological drinking water standards. Under the site-wide approach, the final remedial actions contained in the OU RODs were:
Third Five·Year Review Report for the Fernald Preserve u.s. Department of Energy Doc No. S07045-Final September 20 I I Page 6
• Production and support facility decontamination and dismantling (D&D).
• On-site disposal of the quantities of contaminated soil, above-and below-grade debris, and OU2 waste unit materials that could be disposed of in accordance with OSDF waste acceptance criteria (WAC).
• Off-site disposal of the contents of the silos, waste pit materials, nuclear product inventories, containerized low-level and mixed waste inventories, and the quantities of soil and debris that did not meet OSDF WAC.
o Extraction and treatment of contaminated groundwater to restore the contaminated portions of the GMA to meet Safe Drinking Water Act (SDWA) requirements.
At completion, approximately 975 acres of the 1 ,050-acre property were to be restored for use as an undeveloped park (i.e., the target land use selected in the OUS ROD), and approximately 75 acres were to be dedicated to the footprint of the OSDF. The GMA was to be restored to drinking water standards, with long-term stewardship actions and requisite institutional controls consistent with the target land use.
Taken together, the individual RODs for the OUs provided a site-wide cleanup approach that encompasses all contaminant source areas and all affected environmental media at the site. Collectively, the RODs provide a natural link between the remediation of the sources of contamination and the media affected. Each ROD progressively built on the decisions of the earlier RODs, yielding a cohesive and comprehensive remedy for Fernald. The ROD signature dates and progressive sequence of decisions adopted under the RODs (including ROD amendments and explanation of significant differences [ESD]) are described below:
• OU3 ROD for Interim Remedial Action (July 22,1994): Provided accelerated approval for the D&D ofFemald's buildings and structures (DOE 1994a).
• OU4 ROD for Final Remedial Action (December 7, 1994): Provided for the remediation of Silos I through 4, affected soil within the OU boundary, and other sources of contamination within the boundary. The D&D of all remedial facilities constructed for the OU4 remedial action are to be addressed as part of OU3 (DOE 1994b). There were five post-ROD decision changes for OU 4:
- Explanation ofSignificant Differences for Operable Unit 4 Silo 3 Remediation Action (DOE 1998a), signed and effective March 27, 1998, modified the treatment component of the Silo 3 remedy to onsite or offsite treatment by chemical stabilization or polymer encapsulation, and allowed the option for disposal at a permitted commercial disposal facility in addition to the NTS.
- Final Record ofDecision Amendment for Operable Unit 4 Silos 1 and 2 Remedial Actions (DOE 2000), signed and effective on July 13,2000, modified the treatment component of the Silos 1 and 2 remedy to onsite treatment by chemical stabilization.
- Final Record ofDecision Amendment for Operable Unit 4 Silo 3 Remedial Action (DOE 2003b), signed and effective on September 24,2003, modified the treatment component of the Silo 3 remedy to treatment, to the degree reasonably implementable, to address materialdispersability and metals mobility.
u.s. Department of Energy Third Five-Year Review Report for the Fernald Preserve September 20 II Doc No. S07045-Final
Page 7
- Explanation o/Significant Differences/or Operable Unit 4 Silos 1 and 2 Remedial Action (DOE 2003c), signed and effective November 24,2003, removed the RCRA Toxicity Characteristic Leaching Procedure (TCLP) test as a performance standard for the chemical stabilization process (maintaining the requirement to treat by chemical stabilization to meet disposal facility waste acceptance criteria), and allowed the option for disposal at a permitted commercial disposal facility in addition to the disposal at the NTS.
- Explanation o/Significant Differencesfor Operable Unit 4 (DOE 2005a), signed and effective January 18,2005, allowed the option for temporary offsite storage of treated Silos 1, 2, and 3 materials prior to permanent off-site disposal.
• OUI ROD for Final Remedial Action (March 1, 1995): Provided for the remediation of the waste pit contents, caps, and liners, affected soil within the OU boundary, and other sources of contamination within the boundary. The D&D of all remedial facilities constructed for the OUI remedial action are to be addressed as part ofOU3 (DOE 1995c). There were two post-ROD decision changes for OU I:
- ESD was prepared to document the cost effectiveness and safety advantages associated with using the OU I remedial infrastructure to process for disposal, other waste streams originating outside ofOU 1. The Final ESD for Operable Unit 1 was approved in September 2002 (DOE 2002).
- Amendment to the Operable Unit 1 ROD was prepared to address the following changes:
~ Aligning the surface and subsurface soil Final Remediation Levels (FRLs) found in the Operable Unit 1 ROD with the approved FRLs for soil in the Operable Unit 5 ROD.
~ Placement of Pit 4 soil cover materials meeting on-site waste acceptance criteria into the OSDF for pelmanent disposal.
~ Aligning the final cover design for the waste pit area as originally designated in the Operable Unit 1 Feasibility Study and ROD, with the current design from the July 1998 "Draft Final Natural Resource Impact Assessment and Natural Resource Restoration Plan" for the site.
~ Along with these changes, the ROD Amendment also provided clarification to terminology.
- The Final Record ofDecision Amendment for Operable Unit 1 Remedial Actions, reflecting the above, was signed in November 2003 (DOE 2003a).
• OU2 ROD for Final Remedial Action (June 8,1995): Provided for the remediation of the active and inactive fly ash piles, the South Field disposal area, lime sludge ponds, the Solid Waste Landfill, affected soil within the OU boundary, and other sources of contamination within the boundary. This decision set in motion the approval of on-site disposal at Fernald and construction of the OSDF. However, at the time it was formally limited to the disposal of the OU2 wastes since the OU5 and OU3 decisions related to waste disposition (on-site or off-site) were not yet final (DOE 1995d).
Third Five-Year Review Report for the Fernald Preserve u.s. Department of Energy Doc No. S07045-Final September 2011 Page 8
• OUS ROD for Final Remedial Action (January 31,1996): Provided for the remediation of Fernald's on-site and off-site environmental media. This ROD addressed the cleanup of the GMA at all locations, and the remediation of affected site-wide soil and sediment outside the source OU boundaries. It also addressed the monitoring of air, surface water, groundwater, sediment, and biota. The OU5 ROD finalized the concept of a site-wide OSDF, and further incorporated the "balanced approach" concept into Fernald on-site and off-site waste disposition decisions. The D&D of all remedial facilities constructed to support the OU5 groundwater remedial action were to be addressed as part of OU3 (DOE 1996a).
- There was one post-ROD change for Operable Unit 5. The ESD changed the groundwater FRL for uranium from 20 Ilg/L to 30 Ilg/L and to revise the performance based monthly average concentration limit for discharge to the Great Miami River from 20 Ilg/L to 30 Ilg/L (DOE 200lb). The original Operable Unit 5 ROD had adopted the proposed SDWA Maximum Contaminant Levels (MCLs) for uranium of20 Ilg/L. In December 2000, the United States Environmental Protection Agency adopted 30 Ilg/L as the final MCL; prompting the change in the groundwater FRL for uranium.
• OU3 ROD for Final Remedial Action (September 24, 1996): Provided a final disposition decision for the D&D materials generated through the Interim Remedial Action ROD. Consistent with the OU5 decision, this final decision document adopted on-site disposal as the selected remedy for disposition ofthe D&D debris. It also adopted earlier decisions as part of the "balanced approach" to send Fernald's containerized waste inventories and nuclear materials off site. The ROD also acknowledged that the D&D of new remedial facilities constructed at the site would be addressed as part of OU3 (DOE 1996b).
4.2 Remedy Implementation
The following provides a brief description of the remedial actions undertaken under each of the five RODs. Interim and Final Remedial Action Reports, as appropriate, have been completed for each OU in accordance with the EPA Office of Solid Waste and Emergency Response (OSWER) Directive No. 9320.2-09A-P, Closeout Procedures for National Priorities List Sites.
4.2.1 OU1 Remedial Actions
The OU1 remedy as identified in the OU1 ROD was: removal, treatment, and off-site disposal of the waste pit material at a permitted commercial disposal facility. Remedial actions were initiated in April 1996. The following components describe the approach used for remediation ofOU1.
• Construction of waste processing and loading facilities and equipment.
• Removal ofwater from open waste pits for treatment at the site's wastewater treatment facility.
• Removal of waste pit contents, caps, and liners, and excavation of surrounding contaminated soil.
• Preparation (e.g., sorting, crushing, shredding) of waste.
• Treatment of the waste by thermal drying as required to meet Envirocare WAC. (Envirocare in Clive, Utah, was the selected off-site disposal facility. It has since been purchased by EnergySolutions, Inc.)
U.s. Department of Energy Third Five·Year Review Report for the Fernald Preserve September 2011 Doc No. S07045-Final
Page 9
Q Waste sampling and analysis prior to shipment to ensure that the off-site disposal facility WAC are met.
• Off-site shipment of waste for disposal at Envirocare.
• Decommissioning and removal of the drying treatment unit and associated facilities, as well as miscellaneous structures and facilities within the OU.
• Disposition of remaining OUI residual contaminated soils in the OSDF, consistent with the selected remedy for contaminated process area soils as documented in the OU5 ROD.
The Final Remedial Action Report for OU1 (DOE 2006a) provides a complete history of the remedial action undertaken.
4.2.2 OU2 Remedial Actions
As identified in the OU2 ROD, key components of the selected remedy for OU2 are listed below. Remedial actions were initiated in June 1997.
• Construction of the engineered OSDF.
Q Excavation of the OU2 subunits to the required depth established by the OU2 Rl and FS Reports to remove materials with contaminant concentrations above the cleanup levels.
• Verification sampling and testing in the excavated area to confirm that material with contaminant concentrations above the cleanup levels have been removed.
• Segregation of debris (e.g., concrete, steel, pallets) from OU2 subunits and processing for size reduction, as necessary, before disposal in the OSDF.
• Collection and treatment of water from the OU2 subunits and OSDF construction areas.
• Transportation and on-site disposal of excavated material with a concentration at or below 346 picocuries per gram (PCi/g) ofuranium-238 or 1,030 milligrams per liter (mg/L) of total uranium.
• Transportation and off-site disposal of approximately 3,100 cubic yards of excavated material with concentrations above 346 pCi/g ofuranium-238 or 1,030 mg/L of total uranium.
• Excavation, treatment, and off-site disposal of approximately 300 cubic yards of leadcontaining soil from the South Field firing range (handled as mixed waste).
• Restoration (including grading, seeding, fencing, and installation of monitoring wells) of OU2 subunits after excavation and verification sampling and testing.
• Implementation of institutional controls such as access restrictions (fencing) and groundwater monitoring at the OU2 subunits and OSDF.
• Maintenance of OU2 subunits after restoration, and maintenance and monitoring of the OSDF for at least 30 years following closure of the OSDF.
Readers should note that the OU2 ROD preceded the ROD decisions for OU5 and OU3 by nearly a year. As a result, the costs, waste volumes, size, and configuration of the OSDF represented in the OU2 ROD are specific to OU2 materials only, since the on-site disposal decisions for OU5 and OU3 had not yet been formally made. Ultimately, once the OUs 5 and 3 on-site disposal decisions were finalized, the OSDF was sized and designed to accommodate all
Third Five-Year Review Report for the Fernald Preserve U.s. Department of Energy Doc No. S07045-Final September 20 II Page IO
three OUs, resulting in a greater economy of scale and a combined site-wide design, siting, and implementation approach.
The Final Remedial Action Report for OU2 (DOE 2006b) provides a complete history of the remedial actions undertaken.
4.2.3 OU3 Remedial Actions
At the time that uranium production operations ceased at Fernald, the former production buildings were at or beyond their design lives, and no viable future mission existed for the aging buildings and structures. As a result, DOE and EPA officially decided that all ofFernald's buildings and structures would be dismantled, and that the resulting dismantlement debris would be placed in interim storage. The initial dismantlement and interim storage decision was formally documented in the July 1994 Operable Unit 3 ROD for Interim Action (IROD). The IROD also provided that a subsequent final remedial action ROD would establish the final disposition strategy and locations for the materials generated by the interim remedial action. The first-step remedial activities approved through the IROD are listed below. Remedial action was initiated in August 1995.
• Surface decontamination of the buildings and structures by removing/fixing loose contamination.
• Dismantlement of the above-grade buildings and structures.
• Removal of foundations, storage pads, ponds, basins, and underground utilities and other atand below-grade structures.
• Off-site disposal, of up to ten percent by volume, of the nonrecoverable waste and debris generated from structural 0&0, pending issuance of the final remedial action ROD.
• Interim storage of the remaining waste and debris until a final disposition decision is identified in the final remedial action ROD.
The final remedial action ROD adopted the remedy of selected material treatment, on-property disposal, and off-site disposition, as the selected remedy for final dispositioning of the OU3 materials. The key components of the selected remedy for final remedial action are listed below in two categories.
Adoption of Previous OU3 Decisions
• Incorporation of the facility and structural D&D decisions contained in the IROD so as to provide for an integrated implementation of the interim and final decisions.
• Adoption of the procedures and off-site disposition decisions (primarily Removal Actions 9 and 12) to continue the off-site disposition of the containerized wastes, products, residues, and nuclear materials generated during historical site operations.
• Adoption of the prior procedures and decisions for the management of safe shutdown (Removal Action 12), management of asbestos abatement (Removal Action 26), and management of debris (Removal Action 17).
• Approval of alternatives to disposal, which included permitting the restricted/unrestricted release of materials, as economically feasible, for recycling or reuse.
u.s. Department of Energy Third Five-Year Review Report for the Fernald Preserve September 2011 Doc No. S07045-Final
Page 11
fI Treatment ofOU3 materials, which permitted the treatment of materials to meet the OSDF WAC and/or off-site disposal facility WAC.
CI Off-site disposal of materials above the OSDF WAC.
.. Requiring the off-site disposal of process residues, product materials, and process-related metals generated during D&D activities.
.. Requiring off-site disposition of acid-resistant brick, lead sheeting, and concrete from four designated locations to further minimize the total quantities oftechnetium-99 contaminated materials (including the top inch of concrete from two areas in Plant 9, an area in Plant 8, and an area in the Pilot Plant) placed in the OSDF, and any other materials exceeding the OSDF physical and numerical WAC.
On-Property Disposal- Materials Eligible for Placement in the OSDF
• Determining whether the remaining quantities of OU3 D&D materials are eligible for disposal in the OSDF, and requiring that the materials pass visual inspections for the presence of process residues during implementation.
• Recognizing the need for institutional controls at the completion of the remedy (consistent with OUS).
• Recognizing the need for long-term monitoring and maintenance of the OSDF and operation of a groundwater-monitoring network to evaluate performance of the OSDF consistent with OUS. (Note: The scope for the long-term monitoring and maintenance of the OSDF, and the implementation of the site's institutional controls, are part ofFemald's post-closure longterm stewardship program and are not part ofOU3.)
The Final Remedial Action Report for OU3 (DOE 2007a) provides a complete history of the remedial actions undertaken.
4.2.4 OU4 Remedial Actions
The final remedy implemented for OU4 defined by the OU4 ROD and its subsequent modifications consisted of the components listed below.
• Removal of the contents of Silos 1 and 2 and the decant sump tank system sludge from the silos. Transfer to the transfer tank area for storage pending subsequent transfer to the Silos 1 and 2 remediation facility for treatment using chemical stabilization to attain the disposal facility WAC.
• Removal of material from Silo 3 by pneumatic andlor mechanical processes, followed by treatment to the extent practical by addition of a chemical stabilization reagent and a reagent to reduce dispersability. Then off-site disposal at Nevada Test Site (NTS) or a permitted commercial disposal facility. (Note: The NTS was renamed the Nevada National Security Site in August 2010.)
• Off-site shipment and disposal of the treated Silos 1 and 2 materials at the NTS andlor an appropriately permitted commercial disposal facility; or, temporary off-site storage for a maximum of two years from the initiation of storage activities, if required, prior to permanent offsite disposal.
Third Five-Year Review Report for the Fernald Preserve u.s. Department of Energy Doc No. S07045-Final September 20 II Page 12
• Gross decontamination, demolition, size reduction, and packaging of the Silos 1, 2, and 3 structures and remediation facilities in accordance with the OU3 ROD.
• Shipment of the concrete from the Silos I and 2 structures for off-site disposal at the NTS or an appropriately permitted commercial disposal facility.
• Disposal of contaminated soil and debris, excluding concrete from Silos 1 and 2 structures, either (l) on site in accordance with Fernald OSDF WAC, or (2) at an appropriate off-site disposal facility, such as the NTS or a permitted commercial disposal facility.
• Removal of the earthen berms and excavation of the contaminated soils within the OU4 boundary to achieve the soil remediation levels outlined in the OU5 ROD.
• Appropriate treatment and disposal of all secondary wastes at either the NTS or an appropriately permitted commercial disposal facility.
• Collection ofperched water encountered during remedial activities for treatment in on-site treatment facilities installed under OU5.
Silo 3 materials have been disposed of at the EnergySolutions (formerly Envirocare) facility in Clive, Utah. The final permanent disposal of Silos I and 2 treated waste material began on October 7,2009, at Waste Control Specialists LLC in Andrews, Texas. The last container was placed on November 2,2009. The Final Remedial Action Report for OU4 (DOE 2006c) provides a complete history of the remedial actions undertaken.
4.2.S OUS Remedial Actions
The remedial strategy adopted for OU5 was necessarily a multifaceted approach to protect existing and future human and environmental receptors through implementing extensive soils excavations, excavating contaminated sediments and perched water zones containing concentrations above established FRLs, on-property disposal of excavated material in the OSDF (in compliance with established OSDF WAC), and restoration of the GMA through pump-and-treat technologies. In addition, the remedy required treatment of collected stormwater and process wastewater throughout remedial activities.
Key components of the au5 remedy related to groundwater restoration included the following:
Perched Water
• Excavation of perched water zones necessary to ensure the continued protection of the regional groundwater aquifer.
• Disposition of the soils generated during the removal of the impacted perched water zones in a manner consistent with the methods defined for soils.
• Treatment, as required, of contaminated perched water and stormwater collected during excavation operations. The treatment envisioned was via the Advanced Wastewater Treatment (A WWT) facility. For zones contaminated by volatile organic compounds, the water was to be treated through activated carbon absorption.
Great Miami Aquifer Restoration
• Extraction of contaminated groundwater until such time as FRLs are attained at all points in the impacted areas of the GMA. The basis of the groundwater FRLs and the associated selection process was to utilize the SDW A-established MCLs, proposed MCLs, or nonzero
u.s. Department of Energy Third Five·Year Review Report for the Fernald Preserve September 2011 Doc No. S07045-Final
Page 13
Maximum Contaminant Level Goals (MCLG). When these standards were not available for a specific contaminant, other criteria were used to establish the necessary FRL (e.g., 1 x 10⁻⁵ Incremental Lifetime Cancer Risk [ILCR] for carcinogens; 0.2 Hazard Quotient for noncarcinogens).
• Performance of an engineering study to examine the economic and technical viability of applying reinjection techniques to enhance containment recovery from the aquifer system and to enhance groundwater restoration activities.
• Collection of recovered groundwater for treatment and/or discharge to the Great Miami River or reinjection (if deemed appropriate).
Treatment of Discharges
• Treatment of collected stormwater, wastewater, and recovered groundwater before discharge to the Great Miami River to the extent necessary to not exceed FRLs for surface water in the Great Miami River.
• Treatment of wastewater, stormwater, and groundwater to the extent necessary to ensure that the maximum annual mass discharge of uranium to the Great Miami River from the effluent does not exceed 600 pounds. (The 600 pounds-per-year limit was effective upon issuance of the OUS ROD in January 1996.)
• Treatment of the necessary wastewater, stormwater, and groundwater to the extent necessary to ensure that the maximum concentration of total uranium in the blended effluent discharged to the Great Miami River does not exceed 20 micrograms per liter (flg/L), based upon a monthly average concentration. (This standard was later revised to 30 flg/L per the 2001 OUS ESD.)
• Expansion of the A WWT facility within the confines of the existing Building 51 to provide a minimum additional design capacity of 1,800 gallons per minute (gpm).
• Disposal of treatment sludges generated from the treatment of wastewater, stormwater, and groundwater in the OSDF if established waste acceptance criteria can be attained; otherwise, disposal of the sludges at an appropriate off-site disposal facility.
Recognizing the ongoing implementation of the groundwater remedy and the required long-term monitoring of the OSDF required by the OU2 ROD, an Interim Remedial Action Report for Operable Unit S was prepared.
4.2.6 Site-Wide Remedial Actions
Site-Wide Soil and Sediment
Key components of the selected remedy for site-wide soil and sediment included the following:
• Excavation, using conventional construction equipment, of contaminated soil and sediment to the extent necessary to establish statistically, with reasonable certainty, that the concentrations of contaminants at the entire site are below FRLs.
• Excavation, using conventional construction equipment, of contaminated soil containing perched water that presents an unacceptable threat, through contaminant migration, to the underlying aquifer.
Third Five-Year Review Report for the Fernald Preserve U.s. Department of Energy Doc No. S07045-Final September 20 II Page 14
• Placement of contaminated soil and sediment, which do not exceed concentration-based WAC, in an on-property disposal facility. Soil exhibiting nonradiological contaminant concentrations exceeding the WAC (e.g., soil contaminated with organic constituents) will be treated before placement in the on-property disposal facility or shipped off site for disposal at an appropriate commercial or federal disposal facility. Soil exhibiting radiological contaminant concentrations exceeding the WAC will be shipped off site for disposal. Soil from six designated areas where a reasonable potential exists for the presence of characteristic waste (as defined by RCRA) will be treated, as needed, before disposition.
• Site-wide restoration of impacted areas following excavation and certification sampling. Restoration will include regrading (to blend with the surrounding topography and to promote positive drainage), seeding, fencing, and reestablishment of wetlands, as required.
• Application of institutional controls, such as access controls, deed restrictions, and alternate water supplies, during and after remedial activities to minimize the potential for human exposure to site-introduced contaminants and ensure the continued protection of human health. (Note: The deed to the site property has not been amended to show restrictions. DOE does not intend to add restrictions to the deed since they will maintain ownership in perpetuity.)
• Implementation of a long-term environmental monitoring program and a maintenance program to ensure the continued protectiveness of the remedy, including the integrity of the on-property disposal facility.
On-Site Disposal
As identified in the OU2 ROD, the OU5 ROD, and the OU3 ROD for Final Remedial Action, key components of the on-site disposal selected remedy included the following:
• Construction of the engineered OSDF.
• Establishment of maximum WAC for the OSDF.
• On-site disposal of materials from OUs 2, 3, and 5 that meet the OSDF WAC (including RCRA-regulated materials using the Corrective Action Management Unit mechanism).
• Selected on-site disposal of soils from OUs I and 4.
• Implementation of institutional controls such as access restrictions (fencing) and groundwater monitoring at the OSDF, for at least 30 years following closure.
• Maintenance of the OSDF, including the final cover system and leachate collection system. Because this remedy results in contaminants remaining on site in an engineered disposal facility, a review will be conducted no less often than every 5 years after the initiation of remedial action in accordance with CERCLA Section 121(c) to ensure that the remedy continues to provide adequate protection of human health and the environment. This review will continue until determined that it is no longer needed to maintain protectiveness of the disposal facility.
• In order to construct the OSDF over a sole-source aquifer capable of sustaining a yield of 100 gallons per minute, an OEP A exemption or an EPA CERCLA waiver was needed from the State of Ohio siting prohibitions. It was determined that a CERCLA waiver was the appropriate regulatory strategy. The waiver request was based on the ability of the selected remedial action to attain a standard of performance that is equivalent to that required by the
U.S. Department of Energy Third Five-Year Review Report for the Fernald Preserve September 2011 Doc No. S07045-Final
Page IS
applicable or relevant and appropriate requirements (ARARs). The criteria in determining a CERCLA ARAR waiver based on equivalent standard of performance were degree of protection, level of performance, reliability into the future, and time required to achieve remedial action objectives (40 Code ofFederal Regulations [CFR] 300.430 (f)(l)(ii)(C)(4)). CERCLA waivers were requested, justified, and granted through the approval of the OU2, OU3, and OU5 RODs. Therefore, EPA granted three CERCLA waivers to allow construction of the OSDF at Fernald and on-site disposition of materials from OUs 2, 3, and 5 (and selected materials from OUs I and 4).
In general, application of the WAC allowed certain materials from each of the OUs to be disposed of in the OSDF as described below:
OUI
• Waste Pit 4 cover material
• Impacted soils below or outside the waste pits that otherwise meet the OSDF WAC
OU2
• Waste materials meeting the OSDF WAC from the north and south lime sludge ponds, the Solid Waste Landfill, the inactive fly ash pile, the active fly ash pile, and the South Field area
OU3
• D&D debris meeting the OSDF WAC and not otherwise prohibited
OU4
• Impacted soils and debris not containing silo materials that otherwise meet the OSDF WAC
• D&D debris from Silo 4
OUS
• Site-wide impacted soils, sediments, and debris meeting the OSDF WAC and not otherwise prohibited
4.3 System Operation
System costs are reported as operation and maintenance costs combined. Costs are presented for operation and maintenance (O&M) of the groundwater remediation system (including the extraction well infrastructure and the Converted Advanced Wastewater Treatment [CAWWT] facility), OSDF leachate, and the OSDF cap. Costs are presented on a fiscal year (FY) basis (October through September). The work under the DOE's Office of Legacy Management went through a rebaselining effort that was completed in March 2008. This rebaselining effort changed how costs were captured so direct comparisons to previous years is difficult. Costs presented below for the groundwater remediation system include all site utilities, but the groundwater remediation system is the predominant utility user. Actual costs experienced are significantly less than estimated at the time of transition to Legacy Management.
Third Five-Year Review Report for the Fernald Preserve u.s. Department of Energy Doc No. S07045-Final September 20 I I Page 16
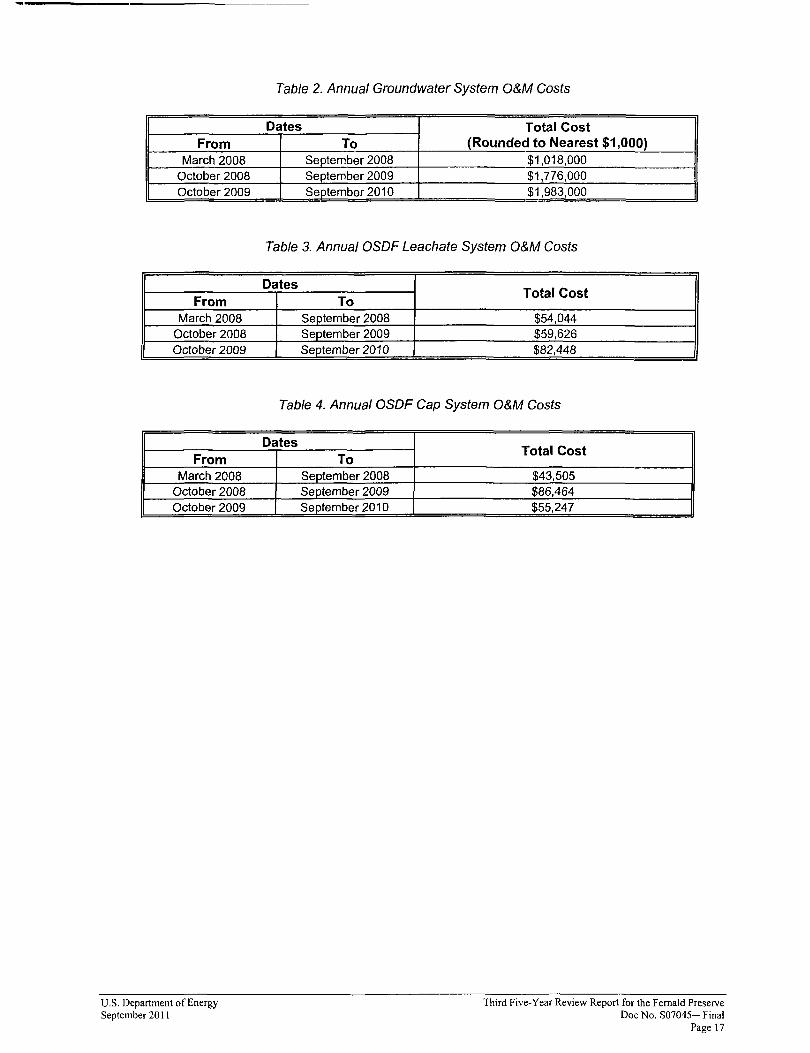
Table 2. Annual Groundwater System O&M Costs
Dates Total Cost (Rounded to Nearest $1,000) From To
March 2008 September 2008 $1,018,000 October 2008 September 2009 $1,776,000 October 2009 Se~ember 2010 $1,983,000
Table 3. Annual OSDF Leachate System O&M Costs
Dates Total Cost
From To March 2008 September 2008 $54,044
October 2008 September 2009 $59,626 October 2009 September 2010 $82,448
Table 4. Annual OSDF Cap System O&M Costs
Dates Total Cost
From To March 2008 September 2008 $43,505
October 2008 September 2009 $86,464 October 2009 September 2010 $55,247
u.s. Department of Energy Third Five-Year Review Report for the Fernald Preserve September 20 I I Doc No. S07045-Final
Page 17
5.0 Five-Year Review Process
5.1 Community Notification and Involvement
The five-year review process was initiated on September 26, 2010, when public notices were published in the Cincinnati Enquirer and Hamilton Journal News newspapers notifying the public that a CERCLA five-year review was being conducted at the Fernald Preserve. A copy of the initial public notice text is in Attachment 3. Additionally, a public meeting was held at the Fernald Preserve on October 13,2010. Questionnaires were made available to members of the public at the public meeting and on the Fernald Preserve web page asking for feedback and input to the CERCLA five-year review process. One questionnaire was received from a member of the public (Attachment 4).
5.2 Document Review
The following documents were reviewed and evaluated during the preparation of this five-year review:
• Legacy Management and Institutional Controls Plan, Revision 4, April 2010
• Annual Site Environmental Reports (SERs) for 2006 (DOE 2007b), 2007 (DOE 2008), 2008 (DOE 2009), and 2009 (DOE 2010b)
• Quarterly OSOF Inspection Reports conducted during FY 2007, FY 2008, FY 2009, and FY 2010
• Quarterly Site Inspection Reports conducted during FY 2007, FY 2008, FY 2009, and FY 2010
• OUS ROD
• Interim Residual Risk Assessment (DOE 2007c)
The OUS ROD includes all pertinent cleanup levels (i.e., FRLs). Analytical data collected and reviewed have been compared to these FRLs.
5.3 Data Review
Environmental and OSDF performance monitoring data continue to be collected at the Fernald Preserve. Environmental data are collected for groundwater, surface water, and sediment. The air particulates monitoring program was discontinued on January 4,2010. The radon monitoring program was discontinued on December 31, 2008. In the first half of each year, all of the monitoring data collected in the previous year are reviewed, evaluated, and reported as part of the annual SER. Below is a summary of the data reviewed since the last five-year review.
5.3.1 OSDF Performance Monitoring
The OSDF consists of eight individual disposal cells. OSOF performance monitoring is conducted for each cell to: (1) track the quantity of liquid produced within the leachate collection system (LCS) and leak detection system (LDS) over time to determine if enough hydraulic head is present to drive leachate through a potential liner breach, and (2) track the water quality of the LCS and LDS liquid, the perched groundwater, and groundwater in the GMA. The controlling
Third Five-Year Review Report for the Fernald Preserve U.s. Department of Energy Doc No. S07045-Final September 20 II Page 18
document for OSDF performance monitoring is the Groundwater/Leak Detection and Leachate Monitoring Plan (Attachment C of the LMICP [DOE 201Oa]).
The volume of leachate generated from the OSDF continues to decline. Flow volumes in the LDS of each cell are tracked against an initial response leakage rate of20 gallons per acre per day (gpad). An initial response leakage rate indicates that hydraulic conditions are 1110 of the rate needed by design to have one foot of hydraulic head within the base of the facility. If flow in the LDS of any cell reaches the initial response leakage rate of 20 gpad, DOE will begin the process of determining if the cell is no longer functioning as designed. In 2009, the highest rate of flow in the LDS was measured in Cell 5 (0.48 gpad), only 2.4 percent of the initial response leakage rate.
Water quality in the LCS, LDS, horizontal till well (HTW), and GMA wells of each cell is routinely monitored. Sampling frequencies vary from quarterly to annually, depending upon the monitoring horizon and the cell. Data is reviewed throughout the year and reported annually in the SERs. Water quality assessment tools include control charts, concentration trend plots, and bivariate plots.
5.3.2 Groundwater Monitoring
Groundwater monitoring was conducted during the past 5 years as prescribed in the Integrated Environmental Monitoring Plan (IEMP) (Attachment D of the LMICP [DOE 20 10a]) as part of the pump-and-treat stage of the groundwater certification process presented in the Fernald Groundwater Certification Plan (DOE 2006d).
Data from 140 wells are used to assess water quality, and 178 wells are used to measure groundwater elevations. In addition, each year a select number of direct-push samples are collected to supplement data collected at the fixed well sampling locations.
An integrated data evaluation process is used to review and analyze data collected from the wells and direct-push sampling locations to determine capture and restoration of the uranium plume, to determine capture and restoration ofnon-uranium FRL constituents, and to determine if there is a need to modify the remedy. Data is also analyzed to determine what impact, if any, the groundwater remedy is having on a separate groundwater restoration effort south of the uranium plume (i.e., the Paddys Run Road site plume). This separate plume, which is unrelated to the Fernald Preserve, resulted from industrial activities south of the Fernald Preserve along Paddys Run Road. Data and evaluation oftbe results are reported annually in the SERs. No remedy changes have been warranted or made in the last 5 years. Data also indicate that the Fernald groundwater remedy is not impacting the Paddys Run Road site plume.
5.3.3 Surface Water Monitoring
Data from 23 surface water sampling locations are used to fulfill surveillance and/or compliance monitoring functions. The data are routinely evaluated to identify any unacceptable trends and to trigger corrective actions when needed to ensure protection of these critical environmental pathways. Since the last five-year review:
• There have been no National Pollutant Discharge Elimination System (NPDES) compliance issues.
U.s. Department of Energy Third Five-Year Review Report for the Fernald Preserve September 20 II Doc No. S07045-Final
Page 19
o Samples collected from two locations west of the fonner Waste Storage Area have been exceeding the surface water FRL for uranium (530 )lg/L) since monitoring began in 2007. None of the other 21 sampling locations have had a FRL exceedance.
o Samples are collected for uranium at eight locations to monitor the cross-media impact of surface water infiltrating into the aquifer. The results of these samples are compared to the groundwater FRL for uranium (30 )lg/L). Four of the eight locations periodically exceed the groundwater FRL. Uranium results at these locations have decreased since the completion of soil remediation in 2006.
5.3.4 Sediment Monitoring
Sediment samples are collected in the Great Miami River from two sampling locations. One location is upstream of the Fernald Preserve treated effluent discharge line and the other is located downstream. Sediment sampling results have been indiscernible from background.
5.3.5 Air Monitoring
The final year of soil remediation at the Fernald Preserve was 2006. By the end of October 2006, all major sources of airborne contamination were removed from the site or placed in the OSDF. Therefore, the number of air monitoring stations was decreased from 17 to 11 in April 2006, and from 11 to 6 in November 2006. The six remaining monitors were located at five boundary locations and one background location. They were used to demonstrate that wind erosion of the remediated soil and air emissions from controlled bums (conducted in 2009) pose no significant threat to the public or the environment. An evaluation of the data collected from the air monitoring stations between 2007 and the end of 2009 demonstrated that radiological concentrations in air remain low (i.e., at or near background). Based on (1) the data indicating emissions are at or near background and (2) the detennination by the EPA Office of Air and Radiation that three years of air monitoring following closure was appropriate, DOE ended the boundary air monitoring program on January 4, 2010.
5.3.6 Radon Monitoring
The radon monitoring program was discontinued at the end of 2008 because the results in the previous 10 years were below the proposed 10 CFR 834 limit of 0.5 picocuries per liter (PCi/L) above background. Because the 0.5 pCi/L limit in that period was not exceeded and no significant surface source for radon remains on site, EPA agreed to DOE's request to discontinue radon monitoring in 2009.
5.4 Site Inspection
Site inspections are conducted quarterly at the Fernald Preserve, in accordance with the LMICP (DOE 201Oa). A separate inspection process is outlined for both the site and the OSDF. Site inspections involve a field walkdown over a portion of the site. For OSDF inspections, some or all of the vegetated caps are walked down. In addition to the field walkdowns for each inspection, all institutional controls are evaluated and reported. Attachment 5 shows the sequence of quarterly field walkdowns.
The site and OSDF are inspected for evidence of unauthorized uses of the site, the effectiveness of institutional controls, and the need for repairs. The OSDF cap is also evaluated to ensure integrity of the design. Ecologically restored areas are evaluated for the condition of
Third Five-Year Review Report for the Fernald Preserve U.s. Department of Energy Doc No. S07045-Final September 2011 Page 20
vegetation and soil stabilization. The most recent site and OSDF inspections were conducted between December 1 and December 7, 2010. Inspections are led by DOE contractor personnel, with participation from state and federal regulators, including OEP A and the Ohio Department of Health.
All inspection documents are made available to the public on the Fernald Preserve website at http://www.lm.doe.gov/landlsites/ohlfernaldlfernald.htm. In addition, an annual summary of inspection findings is included in the Fernald Preserve SERs. Annual inspection photographs are also taken across the site. The most recent inspection photographs were taken in September 2010. A representative set of these photographs and a figure showing the location of the photographs is provided in Attachment 6. All annual inspection photographs taken at the Fernald Preserve are available on the DOE Office of Legacy Management Geospatial Environmental Mapping System at http://gems.lm.doe.govlimflext/gems/jsp/launch.jsp.
Inspections in 2010 demonstrated that institutional controls at the Fernald Preserve are functioning as intended. Very few instances ofprohibited activities have been observed, including the discovery of deer stands, and the occasional hiker wandering off trail. Institutional controls are in place and properly maintained. If the frequency of prohibited activities increases, further evaluation will be necessary. OSDF findings mostly related to the presence ofwoody vegetation on the cap and the need for several minor fence repairs. These items are addressed as part of routine maintenance of the site.
One consistent finding in portions of the site is the presence of remediation-related debris. Frost heave action and surface erosion have uncovered a variety of items that have the potential for fixed radiological contamination. Suspect debris includes concrete, glazed tile, and metal. Most debris is not contaminated and is disposed in a commercial landfill. Approximately 3 percent of the debris has had fixed contamination. Since site closure, 292 pieces of contaminated debris have been found at the Fernald Preserve. This debris is removed from the field and dispositioned in a Radiological Materials Storage Area pending permanent disposal at a licensed low-level waste disposal facility.
Debris locations were mapped in 2007 to determine the extent of the issue. It appeared that debris findings were concentrated in several locations within the former Production Area and the former waste pits area. Subsequent trail design and institutional controls are effective in preventing the public from encountering contaminated debris.
Ecological restoration of the site is progressing well. The quarterly site inspections, along with additional monitoring specific to restored areas, demonstrate continued establishment of prairie communities, created wetlands and open water habitats, and forested expansion of the Paddys Run riparian corridor and northern portions of the site. Site-wide ecological restoration and associated monitoring activities were set forth in the Natural Resource Restoration Plan.
Challenges for ecological restoration have mostly shifted from vegetation establishment to invasive species control. Resources are required to reduce the spread of several non-native herbaceous and woody plants, including Canada thistle, bush honeysuckle, reed canary grass, and more recently, callery pear.
u.s. Department of Energy Third Five-Year Review Report for the Fernald Preserve September 20 II Doc No. S07045-Final
Page 21
6.0 Technical Assessment
6.1 Question A: Remedy Function
Question A: Is the remedy fimctioning as intended by the decision documents?
6.1.1 OUI - Waste Pits
Remedial actions involved the excavation, drying as neceSSaIY, transportation by rail, and disposal of waste pit materials at the EnergySolutions (formerly Envirocare) facility in Clive, Utah. Remedial actions for QUI involving the excavation and shipment of waste pit materials were completed in June 2005. The D&D of remedial action infrastructure was completed in October 2005. The Final Remedial Action Report, which documents completion of remedial actions under OUI, was approved in August 2006. The seeps in the western portion ofOUI (with elevated uranium concentrations) will continue to be monitored and institutional controls will continue to be implemented to prevent direct human exposure in this area. The remedial actions for OUI are complete as intended by the OUI Record of Decision.
6.1.2 OU2 - Other Waste Units
Remedial actions involved the excavation, treatment as necessary, and disposal of waste materials contained within the Other Waste Units as defined in the OU2 Record of Decision. Remedial actions were completed in November 2003. The Final Remedial Action Report, which documents completion of remedial actions under OU2, was approved in September 2006. The remedial actions for OU2 are complete as intended by the OU2 Record of Decision.
6.1.3 OU3 - Production Area Facilities
Remedial actions involved the decontamination and dismantlement of all production facilities, remedial action facilities, and all appurtenant facilities and infrastructure as well as the disposal of all D&D material, nuclear materials, and legacy wastes. Remedial actions were completed in October 2006. The Final Remedial Action Report, which documents completion of remedial actions under OU3, was approved in February 2007. The remedial actions for OU3 are complete as intended by the OU3 Record of Decision.
6.1.4 OU4 - Silos
Remedial actions involved the removal, stabilization, and off-site disposal of waste materials within Silos 1, 2, and 3 as well as the off-site disposal of the silo structures. Off-site disposal was to be in an appropriately licensed facility. Remedial actions related to Silo 3 were completed in April 2006 with the final disposal of Silo 3 materials at the EnergySolutions (fonnerly Envirocare) facility in Clive, Utah. Remedial actions related to Silos 1 and 2 were completed in May 2006 with the final shipment, and materials were temporarily stored at the Waste Control Specialists facility in Andrews, Texas. (Final disposal of Silos I and 2 materials occurred in July 2010). D&D of the OU4 remediation facilities was completed in August 2006. The Final Remedial Action Report, which documents completion of remedial actions under OU4, was approved in September 2006. The remedial actions for OU4 are complete as intended by the OU4 Record of Decision.
Third Five-Year Review Report for the Fernald Preserve U.s. Department of Energy Doc No. S07045-Final September 201 1 Page 22
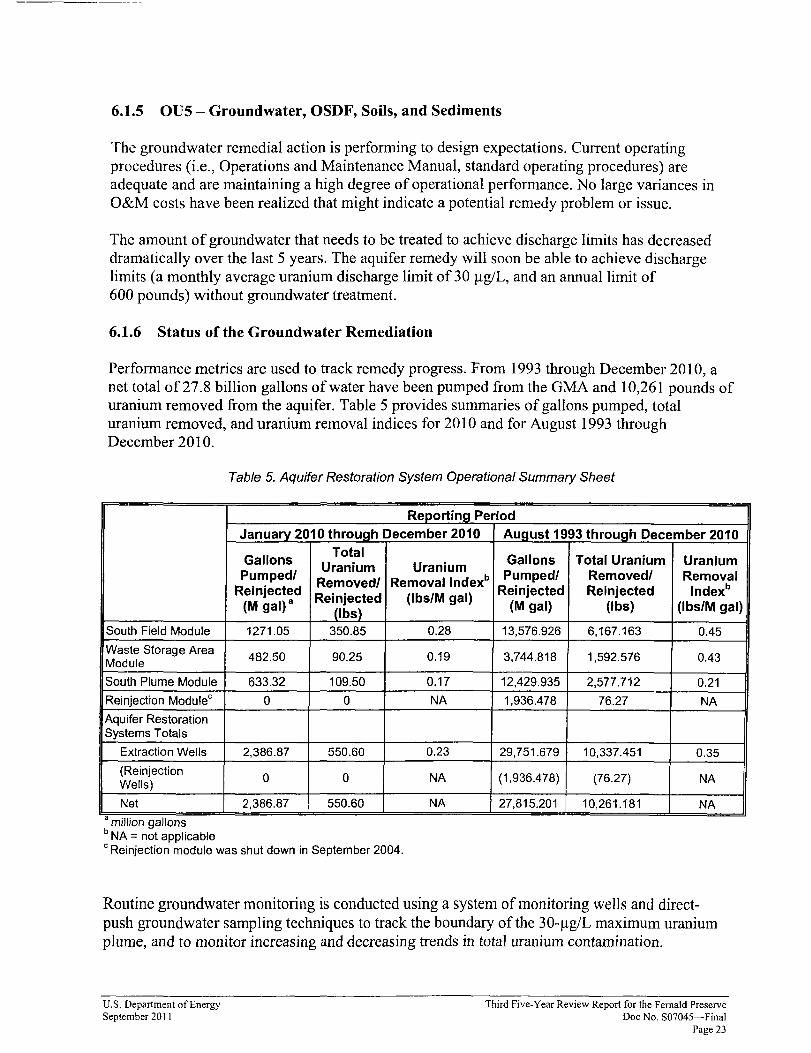
6.1.5 OUS - Groundwater, OSDF, Soils, and Sediments
The groundwater remedial action is performing to design expectations. CUlTent operating procedures (i.e., Operations and Maintenance Manual, standard operating procedures) are adequate and are maintaining a high degree of operational performance. No large variances in O&M costs have been realized that might indicate a potential remedy problem or issue.
The amount of groundwater that needs to be treated to achieve discharge limits has decreased dramatically over the last 5 years. The aquifer remedy will soon be able to achieve discharge limits (a monthly average uranium discharge limit of 30 /lg/L, and an annual limit of 600 pounds) without groundwater treatment.
6.1.6 Status of the Groundwater Remediation
Performance metrics are used to track remedy progress. From 1993 through December 2010, a net total of27.8 billion gallons ofwater have been pumped from the GMA and 10,261 pounds of uranium removed from the aquifer. Table 5 provides summaries of gallons pumped, total uranium removed, and uranium removal indices for 2010 and for August 1993 through December 2010.
Table 5. Aquifer Restoration System Operational Summary Sheet
Reporting Period January 2010 through December 2010 August 1993 through December 2010
TotalGallons Gallons Total Uranium UraniumUranium Uranium PumpedlPumpedl Removedl RemovalRemoval IndexbRemovedlReinjected Reinjected Reinjected Indexb
(lbs/M gal) Reinjected(M gal)a (M gal) (Ibs) (lbs/M gal) JIbs) South Field Module 0.281271.05 350.85 13,576.926 6,167.163 0.45
Waste Storage Area 0.19 3,744.818482.50 90.25 1,592.576 0.43Module
South Plume Module 109.50 0.17633.32 12,429.935 2,577.712 0.21
Reinjection Modulec NA0 1,936.4780 76.27 NA
Aquifer Restoration Systems Totals
Extraction Wells 550.60 0.232,386.87 29,751.679 10,337.451 0.35
(Reinjection NA0 0 (1,936.478) (76.27) NAWells)
Net NA2,386.87 550.60 27,815.201 10,261.181 NA ..a mIllion gallons
b NA = not applicable C Reinjection module was shut down in September 2004.
Routine groundwater monitoring is conducted using a system of monitoring wells and directpush groundwater sampling techniques to track the boundary ofthe 30-llg/L maximum uranium plume, and to monitor increasing and decreasing trends in total uranium contamination.
U.S. Department of Energy Third Five-Year Review Report for the Fernald Preserve September 2011 Doc No. S07045-Final
Page 23
The boundary of the maximum uranium plume is determined semiannually and reported in the annual SER. The boundary interpretation is very conservative and represents a worst-case scenario in that uranium contamination measured at any depth in the aquifer is projected onto a single horizontal plane of reference.
The boundary of the maximum uranium plume in June 2010 (186.6 acres) was approximately 9.5 acres smaller than the size of the plume at the beginning of 2005 (196.1 acres). Uranium concentrations within the plume boundary continue to decrease. Concentration versus time plots for monitoring wells within the plume are published annually in the SER. Attachment 7 summarizes uranium concentration trends as recorded in 2009. The figure indicates that uranium concentrations within the maximum uranium plume footprint are decreasing in most of the wells as a result of pumping operations. Because sources of uranium contamination have been remediated, the uranium concentration increase in some wells within the plume is attributed to the movement of pre-existing uranium contamination towards extraction wells.
Non-uranium constituents are also monitored to evaluate aquifer concentrations relative to FRLs established in the ROD. Forty-nine non-uranium constituents were evaluated through a detailed selection process presented in Appendix A of the IEMP (DOE 2006e). Currently, 35 of 50 chemical constituents have never exceeded their FRL, and one constituent has had a single exceedance. As documented in the Groundwater Certification Plan, these 36 parameters will be monitored during groundwater certification to determine if they remain below their FRL. The remaining 14 constituents are currently monitored semiannually and concentrations are reported in the annual SER.
Most of the locations where non-uranium constituents are present at concentrations above their FRL lie within the 10-year, uranium-based restoration footprint. However, sporadic FRL exceedances have been detected outside of the lO-year, uranium-based restoration footprint (e.g., zinc, manganese). Monitoring results for the last 14 years have failed to identify a plume outside of the restoration footprint. In many instances, FRL exceedances detected one year are well below the FRL the next year. Exceedances for zinc and manganese in the aquifer could be the result of natural conditions within the aquifer, or caused by bio-fouling around the monitoring wells being sampled.
Continued monitoring and evaluation of non-uranium constituents is reported annually in Appendix A of the SERs. Monitoring results indicate that no changes to the uranium-based aquifer remedy are necessary to address sporadic non-uranium FRL exceedances outside of the defined restoration footprint for the aquifer remediation.
Review of groundwater remedy progress reveals that the remedy remains on track to be protective of human health and the environment. Specifically:
• Institutional controls remain in place and prevent exposure.
• A high degree of operational efficiency is being maintained.
• Capture of the uranium plume is being maintained.
• Modeled uranium concentration predictions are consistent with monitoring data.
• Uranium removal is consistent with model predictions.
• Groundwater treatment is no longer required to meet uranium discharge limits.
Third Five-Year Review Report for the Fernald Preserve u.s. Department of Energy Doc No. S07045-Final September 20 I I Page 24
6.1.7 Implementation of Institutional Controls and Other Measures
Access restrictions and other institutional controls have been established at the Fernald Preserve pursuant to the LMICP. These controls have been effective at ensuring remedy protection. There have been no instances where personnel have compromised site remediation or been exposed to contaminants. The OSDF is fenced in, posted, and access gates remain locked unless authorized personnel are within the fenced area.
The well field is not contained within a fenced area, but individual extraction well controls are enclosed in locked well houses to prevent access by the public. All monitoring wells are kept locked. Consistent with the target land use objective for the on-property area (restricted use as an undeveloped park); institutional control measures have been implemented to prevent the use of the aquifer as an on-property drinking water supply. Institutional controls, designed to preclude the use of groundwater in the off-property area where groundwater contamination is greater than the 30 ~glL uranium FRL, remain in place and consist of:
• A DOE-funded public water system, which provides an alternate water supply for residents in the areas affected by groundwater contamination from the Fernald Site.
• The Hamilton County water well permitting process. Drinking water wells cannot be installed until a permit has been obtained from the Hamilton County Health Department. DOE will ensure that the Health Department is aware of the off-property areas where groundwater contamination is greater than 30 }.!g/L of uranium. DOE has sent a letter and map documenting the contaminated area to the Hamilton County Health Department and requested that no permits be issued in this area, given the contamination and the ongoing aquifer remediation (Attachment 8). Additionally, the letter requests that DOE be notified of any proposed drilling activities in the vicinity of the ph.ime. If DOE is made aware of any drilling activities in the area of the off-site plume, the regulators must be notified.
• Daily well field operational inspections and routine groundwater sampling. Operational personnel make daily rounds of the South Plume well field and are instructed to notifY management of any unusual activity in the area (e.g., well drilling). Groundwater sampling personnel are also in the area of the South Plume for routine groundwater monitoring and are instructed to notifY management of any unusual activities.
• Prohibited activities by the public are observed from time to time, but these are usually minor infractions such as hiking with a pet or wandering off-trail. A few acts of vandalism to site signage have occurred, and evidence of hunting activity has been discovered on a couple of occasions. Generally, though, community members are very understanding of the purpose and need for institutional controls.
6.1.8 Operational Efficiency
Performance metrics provide insight into how efficiently the remediation is being managed. Performance metrics indicate that a high degree of operational efficiency is being maintained. Performance predictions for the finalized baseline strategy were presented in Section 5.3 of the Baseline Remedial Strategy Report (BRSR) (DOE 1997). The BRSR strategy predicted that the remediation schedule could be shortened from that presented in the Feasibility Study Report for OU5 (DOE 1995e) from 27 years to a period between 10 and 20 years. As aquifer restoration modules were installed, remediation design updates were issued based on more up-to-date aquifer data collected in the area where the modules were being installed. The additional data led
U.s. Department of Energy Third F've-Year Review Report for the Fernald Preserve September 2011 Doc No. S07045-Final
Page 25
to enhanced designs that slightly modified the design presented in the BRSR. The last such design enhancement was presented in the Waste Storage Area (Phase II) Design Report, issued in 2005 (DOE 2005b).
When the performance predicted in the BRSR and the Waste Storage Area (Phase II) Design is compared to the actual millions of gallons of groundwater pumped from the aquifer and the actual pounds of uranium removed from the aquifer, it reveals how closely actual operational performance has matched predicted operational performance. Attachment 8 provides a comparison of the actual versus predicted gallons of groundwater extracted from the GMA from FY 1993 through FY 2010. Attachment 10 provides a comparison of the actual versus predicted pounds of uranium extracted from the GMA from FY 1993 through FY 2010.
6.1.9 Capture of the Uranium Plume
An important objective of the groundwater remediation is to maintain hydraulic control of the uranium plume. This is being accomplished through a combination of natural flow directions within the aquifer basin coupled with the water level drawdown created by pumping the twentythree extraction wells used in the pump-and-treat remedy.
Groundwater elevations in the aquifer are measured quarterly, and then water elevation maps for the aquifer are prepared and compared against the footprint of the uranium plume in the aquifer to verify that capture of the uranium plume is being maintained. An example of a quarterly water level map is provided in Attachment 11. Quarterly water level maps and the associated plume capture analysis are published annually in the SERs.
Since pump-and-treat operations began, quarterly groundwater elevation maps have consistently shown that capture of the uranium plume has been maintained by pump-and-treat operations. There has also been good agreement between the modeled capture zone and the measured capture zone for the pump-and-treat remedy.
6.1.10 Uranium Concentration Predictions
A residual assessment of uranium concentrations (observed concentrations versus model predicted concentrations) evaluates how reasonable groundwater model concentration predictions remain over time. Two assessments have been conducted. The first assessment was conducted in 2005 and reported in the 2005 SER, and the second assessment was conducted in 2010. The second assessment details will be provided in the 2010 SER and the results are discussed below.
Table 6 provides the total uranium residuals observed in the first half of 2010 with model predicted concentrations for April 1, 2010. As the data indicate, the total uranium concentration mean residual for 2010 was 29.42 /lg/L. The maximum individual well residual for 2010 was 299.58 /lg/L. As shown below, the mean residual calculated in 2010 is similar to the mean residual calculated back in 2005 (29.42 /lg/L vs. 30.54 Jlg/L).
Third Five-Year Review Report for the Fernald Preserve u.s. Department of Energy Doc No. S07045-Final September 20 I I Page 26
Table 6. Actual Total Uranium Residuals vs. Model Predicted Concentrations
Statistics
First Residual Assessment {2005}
Second Residual Assessment {2010}
2nd Half 2005 Vs. Model Predicted
4/1/2006
1sl Half 2010 Vs. Model Predicted
4/1/2010 Mean Residual 30.54 29.42
Standard Deviation 87.91 75.64
Maximum Residual 330.00 299.58
Minimum Residual -130.50 -85.06
Residual Range 460.50 384.63
The small change in the mean residual of observed and modeled concentrations between 2005 and 2010 indicates that groundwater model predictions remain reasonable.
6.1.11 Uranium Removal Predictions
Both the BRSR and Waste Storage Area (Phase-II) remediation designs produced predictions for the amount of uranium to be recovered from the aquifer in order to achieve concentration-based cleanup goals. Water samples are collected monthly from extraction wells and analyzed for total uranium. The total uranium concentrations are used to calculate the mass of uranium removed by the well. The actual pounds of uranium removed from the aquifer are compared against the total predicted pounds to be removed from the aquifer, and a percent remedy completion estimate is calculated. The results are presented in the annual SERs.
Attachment 12 is a plot showing the percent complete estimates for the last four years based on pounds of uranium removed from the aquifer. As shown in Attachment 11, the actual pounds removed compares closely to the pounds predicted to be removed by the groundwater model. The data indicates that in the last four years the percent complete rose by approximately 13 percent.
A logarithmic regression of the data shows how the data are trending. The resulting trend line indicates that it will take approximately 13 more years of continued pumping to achieve an additional 13 percent completion based on predicted pounds of uranium to be removed from the aquifer. The trend of both the actual data and the model predictions are consistent. The trend prqjection indicates that the efficiency of the pump-and-treat operation is decreasing. This situation is common to pump-and-treat remediations.
6.1.12 Groundwater Treatment
There is no longer a need to treat groundwater prior to discharge to the Great Miami River in order to meet uranium discharge limits.
The reduced need for groundwater treatment is illustrated in Attachments 13 and 14. Attachment 13 provides a comparison between the actual versus predicted gallons of groundwater treated between FY 1995 and FY 2010. Attachment 14 provides a comparison between the actual versus predicted gallons ofgroundwater that was not treated between
u.s. Department of Energy Third Five-Year Review Report for the Fernald Preserve September 2011 Doc No. S07045-Final
Page 27
FY 1997 and FY 2010. Attachment 15 shows the percent treated and average monthly uranium discharge concentration versus time from January 2004 through September 20 IO. As shown in Attachment 15, the amount of groundwater that needs to be treated to maintain compliance with the monthly average uranium discharge concentration limit has decreased dramatically over the last 5 years. The aquifer remedy can now achieve the uranium discharge limits (i.e., average monthly concentration of less than 30 Ilg/L, and 600 pounds annually) established in the OU5 ROD, without groundwater treatment.
6.1.13 Status of OSDF Leachate/Leak Detection
The OSDF is essentially a potential contamination source located above a dirty background making it difficult to detennine (on water quality alone) whether changing water quality conditions beneath the facility are caused by a leak from the facility or some other source. DOE has been working with OEP A to select the interpretation techniques used to assess the nature and cause of changing water quality beneath the facility. Three techniques are currently being used: control charts, bivariate plots, and concentration trend plots. Data are evaluated and reported annually through the SER.
The water quality of the leachate from the facility and the groundwater located beneath the facility are the key components of the OSDF leak detection program. The LCS and LDS flow data collected over the past 5 years show that the engineered drainage features within the OSDF continue to perfonn as designed. The highest LDS maximum accumulation rate recorded in 2009 was 0.48 gpad in Cell 5, which is less than 3 percent of the initial response leakage rate of20 gpad.
In 2009, fifty increasing concentration trends were identified in the horizontal till wells (HTWs) and/or the downgradient GMA wells of Cells 1-8 of the OSDF. Through the use of bivariate plots, the increasing concentration trends were detennined to be caused by pre-existing conditions and not a leak from the facility.
6.1.14 Status of OSDF Cap
Quarterly inspections of the OSDF cap have demonstrated that the vegetated cover is stable and perfonning as designed. In the last 5 years, findings have generally shifted from minor erosion and vegetation establishment to the presence of woody vegetation and noxious weed control. Several items of note have been observed during quarterly inspections. These issues are summarized below.
Following closure in 2006, some concern was raised regarding the condition of the Cell 8 cap. A series of ridges were observed along the south face. These depressions were caused by construction equipment during the final seedbed preparation steps when the cap was seeded in October 2006. Following an engineering evaluation, it was detennined that the ridges should subside over time and that no further action was needed outside of continued monitoring and repair of erosion as necessary. Subsequent quarterly inspections con finned this evaluation, and the ridges were not visible in 2010.
The Cell I cap was reseeded in October 2007. An herbicide, Plateau®, was applied on the Cell 1 cap earlier in the year. This herbicide can be useful for prairie restoration projects because it protects wann-season native grasses and wildflowers while killing cool-season grasses and
Third Five-Year Review Report for the Fernald Preserve u.s. Department of Energy Doc No. S07045-Final September 2011 Page 28
weeds. The application was successful in reducing the amount of weeds on the cap; however, it also killed much of the cool-season grasses that had volunteered on the cap. The reseeding effort was successful in re-establishing native grasses and forbs. However, a number of erosion rills required repair in 2008. The most recent inspection in 2010 showed stable conditions and continued establishment of native vegetation.
In 2009, concern was raised regarding potential seeps along the eastern toe of the OSDF. Cattails were observed on the side of the rip rap drainage in several locations. An engineering evaluation was conducted, which determined that finer-grained material was retarding flow in these locations. The interval and position of these areas indicated that the fines were a result of access roads that were used during the final cover construction. A subsequent review of design calculations for the east channel revealed that the vegetation does not impact the performance of the channel.
6.1.15 Status of Soils and Sediments Remediation
As stated in Section 4, all soils and sediments at the Fernald Preserve, with the exception of groundwater restoration and treatment infrastructure, have been remediated and certified to ensure that area-specific contaminants of concern do not exceed soil FRLs specified in the relevant RODs. When groundwater remediation activities are complete (projected in the year 2026), the remediation infrastructure will be removed and the soil beneath will be remediated (if necessary) and certified. The groundwater treatment facility will likely be removed much sooner than 2026 since it will no longer be needed in the near future.
6.2 Question B: Assumptions Validity
Question B: Are the exposure assumptions, toxicity data, cleanup levels, and remedial action objectives used at the time ofremedy selection still valid?
6.2.1 Review of Post-Remedial Action Contaminant Toxicity Assumptions
The EPA five-year review guidance documents suggest the following evaluation:
"Evaluate those assumptions critical to the effectiveness of remedial measures on the protection of human health and the environment (made at the time of the remedial decision) to determine, given current information, whether these assumptions are still valid."
In the second five-year review (DOE 2006f), the 2006 cancer slope factors (CSFs) and reference doses were obtained from the EPA website (i.e., radionuclide tables and Integrated Risk Information System [IRIS] database) and were used in the risk calculations presented in Attachment IV of the Comprehensive Response Action Risk Evaluation (CRARE), which Appendix H of Feasibility Study Report for OU5 for the undeveloped park user, off-property farm adult, and off-property farm child. All pathways were evaluated and summed to produce the results in Table 6-3 of the second five-year review, and the 2006 results indicated that the original risk assumptions upon which the Fernald remedy was based remain valid.
After the release of the second five-year review, the Interim Residual Risk Assessment (IRRA) was prepared to assess the risk to human health and the environment from post-remediation
U.s. Department of Energy Third Five-Year Review Report for the Fernald Preserve September 2011 Doc No. S07045--Final
Page 29
contaminants in the air, soil, and surface-water media at the fonner FMPC. Groundwater remediation is ongoing, and a final risk assessment will be perfonned when the groundwater restoration goals have been achieved for the GMA. The IRRA calculations documented that the soil remedial actions at the Fernald site were adequate to reduce contaminant concentrations in soil and surface water to levels that are protective of human health and the environment.
The present five-year review examined the 2010 CSFs and reference doses (RIDs) and compared them to values used in the 2007 IRRA to identify values that had changed and detennine if those changed values had produced significant changes in human-health risk to the receptors evaluated in the IRRA. In the 2007 IRRA, the highest risk was to the undeveloped park user who recreates in Zone 5 of the Fernald Preserve (DOE 2007c). Therefore, risk calculations were perfonned with 2010 values for CSFs and RIDs and the same exposure scenario for the undeveloped park user in Zone 5. Results presented in this five-year review indicate a slight decrease in human-health risk relative to the IRRA, and the risk assumptions remain valid for the OU5 post-remedial conditions.
6.2.2 Human Health Risks and Remedial Design
In the OU5 Baseline Risk Assessment (Appendix A of the OU5 Remedial Investigation Report), risk was calculated for a series of modeled human receptors representing a variety of possible land uses. The risk to the modeled receptor had to be less than 1 E-04 for the ILCR and less than one for the hazard index (HI) to ensure that the selected remedy was protective of human health and the environment. The OU5 Baseline Risk Assessment considered all radionuclides and chemicals that passed a preliminary screening for their presence or absence on site (Tables A.4-I and A.4-3 of the OU5 Remedial Investigation Report [DOE 1995bJ).
In Appendix H of the Feasibility Study Report for OU5, the CRARE was perfonned for the remedial alternatives to evaluate the risk imposed on target receptors from contaminants remaining under post-remedial conditions. The target receptors evaluated in the CRARE supported the OU5 selected remedies of: (1) undeveloped park user; (2) off-property fann adult; and (3) off-property fann child. Calculated post-remedial risks to these receptors were evaluated using projected residual concentrations of constituents of concerns (the projected residual concentrations became the OU5 ROD FRLs for soil, sediment, surface water, and groundwater). The human health risk to these receptors met the CERCLA upper-bound limit of less than IE-04 for ILCR and less than 1 for HI.
After the 2006 completion of the OU5 soil remedy, the IRRA was prepared to assess the risk to on-site receptors by post-remediation (i.e., residual) contaminant concentrations in air, soil, and surface-water media within eight exposure zones that comprise the fonner FMPC site. Exposure pathways for the receptors included inhalation of gas and particulate, dennal contact with soil and surface water, ingestion of soil and surface water, and external radiation. Receptors, exposure parameters, reference doses, and CSFs were updated relative to values presented in the CRARE. The IRRA report evaluated the receptor risk due to exposure to measured post-remediation contaminant concentrations in air, soil, and surface water on the site, whereas the CRARE evaluated risk using the OU5 Remedial Investigation data set, background data, and air models to estimate post-remediation contaminant concentrations in air, soil, and surface-water media. Target receptors in the CRARE were selected for the on-site undeveloped park and off-site fann land-use scenarios. However, the IRRA calculations presented only the
Third Five-Year Review Report for the Fernald Preserve u.s. Department of Energy Doc No. S07045-Final September 2011 Page 30
receptors for the on-site undeveloped park, as groundwater remediation is ongoing and the evaluation of the off-site farm scenario is dependent on the groundwater pathway for ingestion of water by humans and livestock and irrigation of crops. Groundwater and food pathways for the off-site receptors will be covered when the final risk assessment report is submitted to the regulatory agencies.
6.2.3 Cancer Slope Factors (CSFs)
CSFs are published values that specify a cancer morbidity value (risk) to a receptor for a given quantity of contaminant intake, referred to as an ILCR. The resulting value determines whether post-remedial concentrations of contaminants will result in a cancer risk that is in compliance with CERCLA guidance (i.e., ILCR risk ofless than lE-04). EPA publishes cancer slope factors for most radionuclides and some nonradionuclide chemicals that are proven or suspected carCInogens.
6.2.4 Chemical Reference Dose
Non-cancer health risks, due to exposure to nonradiological chemicals, are evaluated by application of a reference dose for oral and inhalation exposure routes. Reference doses estimate the upper-bound chronic dose of a chemical that a human receptor can be exposed to without suffering ill effects. The contaminant intake for a receptor is divided by the appropriate reference dose factor to yield the HI. If the HI is greater than 1, a negative health impact to the receptor is anticipated. The EPA's IRIS database contains the reference dose factors.
6.2.5 Changes in Slope Factors and Reference Doses
As the body of knowledge regarding radiological and chemical toxicity increases, EPA occasionally finds it necessary to change the cancer slope factors and/or reference doses. For this five-year review, the Risk Assessment Information System (RAIS), maintained by the DOE Oak Ridge Operations Office (http://rais.oml.gov/), was queried to obtain the most recent CSFs and RIDs for each exposure pathway (i.e., inhalation, ingestion, and external radiation) and the absorption factors and permeability factors for the dermal exposure pathway. This database is a comprehensive source for toxicity data compiled from the EPA IRIS, the EPA Health Effects Assessment Summary Tables (radionuclide table), and the EPA Provisional Peer Reviewed Toxicity Values (PPRTVs). The RAIS toxicity values are reviewed monthly and updated as new values are added to the individual EPA source databases. The CSFs and RIDs used in this five-year review were extracted from RAIS on October 17,2010. A comparison of the October 2010 CSF and RID values extracted from RAIS to the values used in the IRRA are shown in Section 6.2.6.
In the 2007 IRRA, the highest risk was to the undeveloped park user who recreates in Zone 5 of the Fernald Preserve. Therefore, risk calculations were performed with (1) 2010 values for CSFs and RiDs and (2) the same exposure scenario for the undeveloped park user in Zone 5. Calculations and comprehensive results are provided in Section 6.2.6. All pathways tabulated in Section 6.2.6 were evaluated and summed to produce the results in Table 7. Background risk is included with the reported results.
u.s. Department of Energy Third Five-Year Review Report for the Fernald Preserve September 2011 Doc No. S07045-Final
Page 31
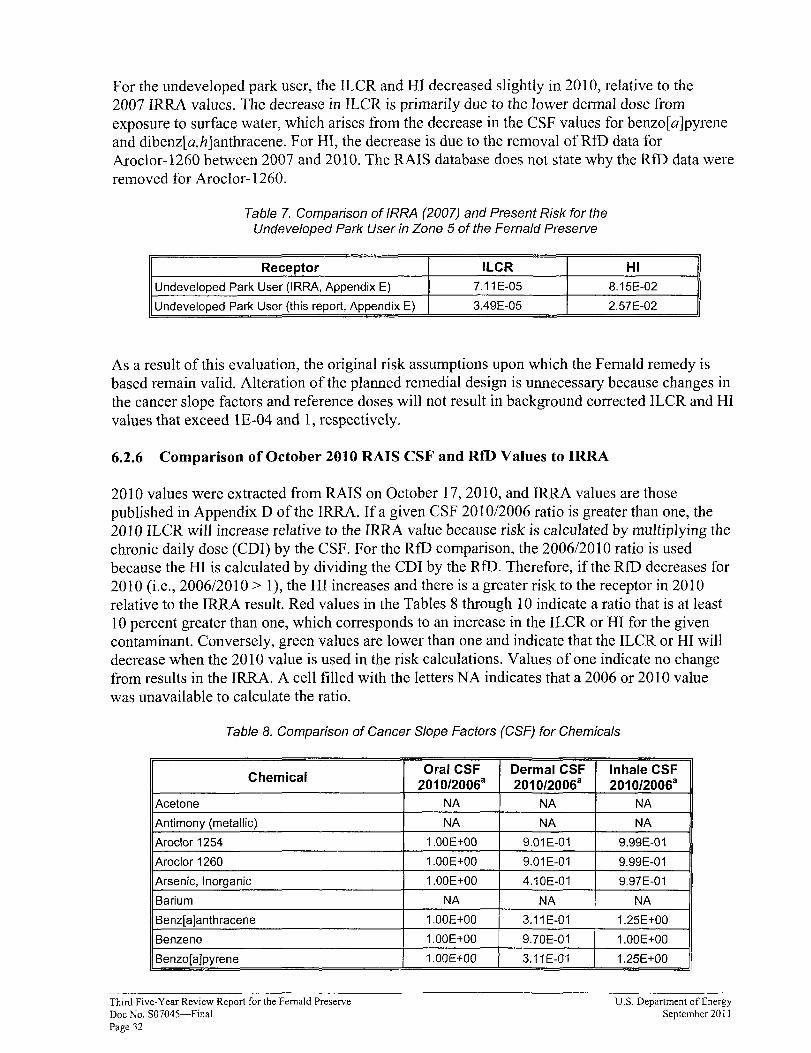
For the undeveloped park user, the ILCR and HI decreased slightly in 2010, relative to the 2007 IRRA values. The decrease in ILCR is primarily due to the lower delmal dose from exposure to surface water, which arises from the decrease in the CSF values for benzo[a]pyrene and dibenz[a,h]anthracene. For HI, the decrease is due to the removal ofRfD data for Aroclor-1260 between 2007 and 2010. The RAIS database does not state why the RID data were removed for Aroclor-1260.
Table 7. Comparison of IRRA (2007) and Present Risk for the Undeveloped Park User in Zone 5 of the Fernald Preserve
Receptor Undeveloped Park User (IRRA, Appendix E)
Undeveloped Park User (this report, Appendix E)
ILCR
7.11 E-05
3.49E-05
HI
B.15E-02
2.57E-02
As a result of this evaluation, the original risk assumptions upon which the Fernald remedy is based remain valid. Alteration of the planned remedial design is unnecessary because changes in the cancer slope factors and reference doses will not result in background corrected ILCR and HI values that exceed lE-04 and 1, respectively.
6.2.6 Comparison of October 2010 RAIS CSF and RID Values to IRRA
2010 values were extracted from RAIS on October 17,2010, and IRRA values are those published in Appendix D of the IRRA. If a given CSF 2010/2006 ratio is greater than one, the 2010 ILCR will increase relative to the IRRA value because risk is calculated by multiplying the chronic daily dose (CDI) by the CSF. For the RID comparison, the 2006/2010 ratio is used because the HI is calculated by dividing the CDI by the RID. Therefore, if the RID decreases for 2010 (i.e., 2006/2010 > 1), the HI increases and there is a greater risk to the receptor in 2010 relative to the IRRA result. Red values in the Tables 8 through 10 indicate a ratio that is at least 10 percent greater than one, which corresponds to an increase in the ILCR or HI for the given contaminant. Conversely, green values are lower than one and indicate that the ILCR or HI will decrease when the 2010 value is used in the risk calculations. Values of one indicate no change from results in the IRRA' A cell filled with the letters NA indicates that a 2006 or 2010 value was unavailable to calculate the ratio.
Table 8. Comparison of Cancer Slope Factors (CSF) for Chemicals
Chemical Oral CSF
2010/200Sa Dermal CSF 2010/200Sa
Inhale CSF 2010/200Sa
Acetone NA NA NA
Antimony (metallic) NA NA NA
Aroclor 1254 1.00E+00 9.01E-01 9.99E-01
Aroclor 1260 1.00E+00 9.01 E-01 9.99E-01
Arsenic, Inorganic 1.00E+OO 4.10E-01 9.97E-01
Barium NA NA NA
Benz[a]anthracene 1.00E+OO 3.11E-01 1.25E+OO
Benzene 1.00E+OO 9.70E-01 1.00E+OO
Benzo[aJpyrene 1.00E+OO 3.11E-01 1.25E+OO
Third Five-Year Review Report for the Fernald Preserve U.S. Department of Energy Doc No. S07045-Final September 20 II Page 32
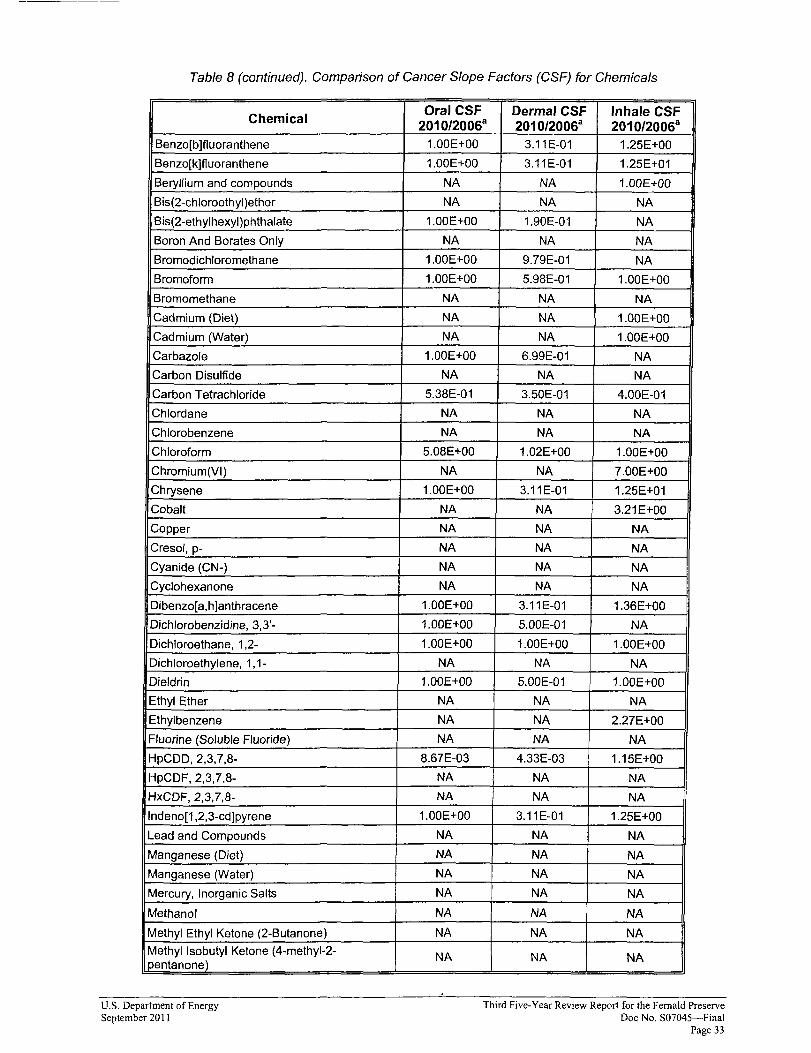
Table 8 (continued). Comparison of Cancer Slope Factors (CSF) for Chemicals
Chemical Oral CSF
2010/2006a Dermal CSF 2010/2006a
Inhale CSF 2010/2006a
1.25E+OOBenzo[b]f1uoranthene 1.00E+OO 3.11 E-01
Benzo[k]f1uoranthene 1.00E+OO 3.11E-01 1.25E+01
Beryllium and compounds NA NA 1.00E+OO
Bis(2-chloroethyl )ether NA NA NA
Bis(2-ethylhexyl)phthalate 1.00E+OO 1.90E-01 NA
Boron And Borates Only NA NA NA
Bromodichloromethane 1.00E+OO 9.79E-01 NA
Bromoform 1.00E+OO 5.98E-01 1.00E+OO
Bromomethane NA NA NA
Cadmium (Diet) NA NA 1.00E+OO
Cadmium (Water) NA NA 1.00E+OO
Carbazole 1.00E+OO 6.99E-01 NA
Carbon Disulfide NA NA NA
Carbon Tetrachloride 5.38E-01 3.50E-01 4.00E-01
Chlordane NA NA NA
Chlorobenzene NA NA NA
Chloroform 5.08E+OO 1.02E+OO 1.00E+OO
Chromium(VI) NA NA 7.00E+OO
Chrysene 1.00E+OO 3.11 E-01 1.25E+01
Cobalt NA NA 3.21E+OO
Copper NA NA NA
Cresol, p- NA NA NA
Cyanide (CN-) NA NA NA
Cyciohexanone NA NA NA
Dibenzo[a,h]anthracene 1.00E+OO 3.11E-01 1.36E+OO
Dichlorobenzidine, 3,3'- 1.00E+OO 5.00E-01 NA
Dichloroethane, 1,2- 1.00E+OO 1.00E+OO 1.00E+OO
Dichloroethylene, 1,1- NA NA NA
Dieldrin 1.00E+OO 5.00E-01 1.00E+OO
Ethyl Ether NA NA NA
Ethylbenzene NA NA 2.27E+OO
Fluorine (Soluble Fluoride) NA NA NA
HpCDD,2,3,7,8 8.67E-03 4.33E-03 1.15E+OO
HpCDF,2,3,7,8- NA NA NA
HxCDF,2,3,7,8- NA NA NA
Indeno[1,2,3-cd]pyrene 1.00E+OO 3.11 E-01 1.25E+OO
Lead and Compounds NA NA NA
Manganese (Diet) NA NA NA
Manganese (Water) NA NA NA
Mercury, Inorganic Salts NA NA NA
Methanol NA NA NA Methyl Ethyl Ketone (2-Butanone) NA NA NA
Methyl Isobutyl Ketone (4-methyl-2. penta none)
NA NA NA
U.S. Department of Energy Third Five-Year Review Report for the Fernald Preserve September 2011 Doc No. S07045-Final
Page 33
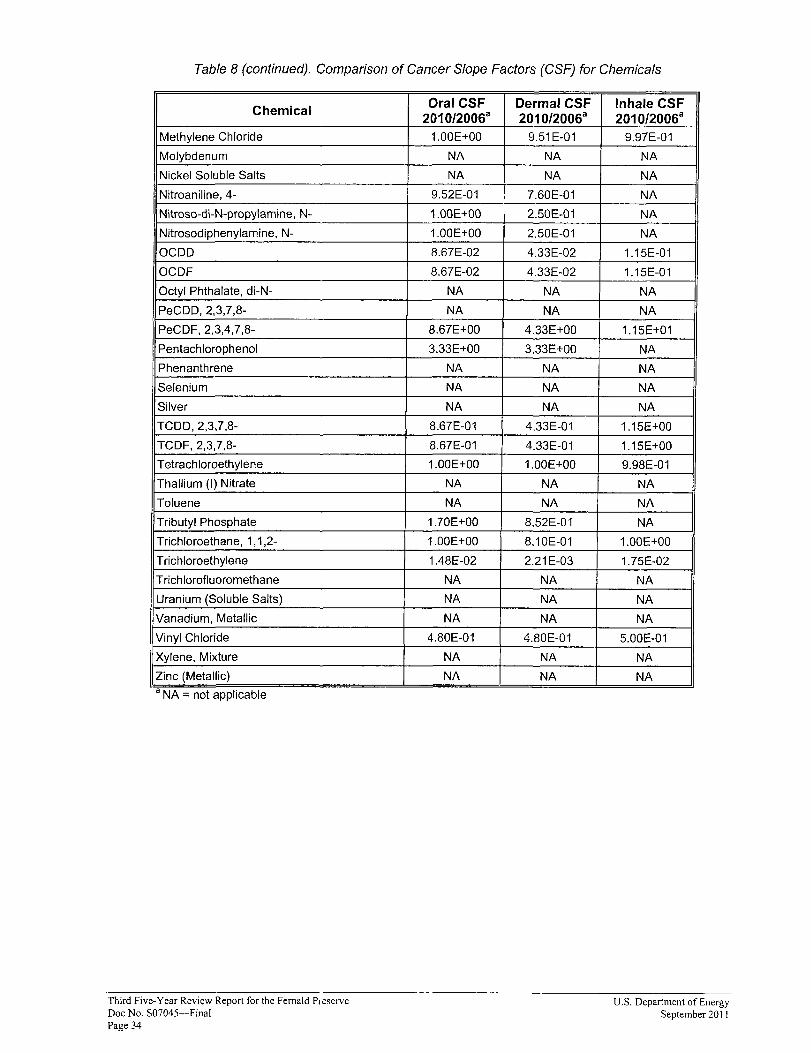
Table 8 (continued). Comparison of Cancer Slope Factors (CSF) for Chemicals
Chemical Oral CSF 2010/2006a
Dermal CSF 2010/2006a
Inhale CSF 2010/2006a
Methylene Chloride 1.00E+OO 9.51 E-01 9.97E-01
Molybdenum NA NA NA
Nickel Soluble Salts NA NA NA
Nitroaniline, 4 9.52E-01 7.60E-01 NA
Nitroso-di-N-propylamine, N- 1.00E+OO 2.50E-01 NA
Nitrosodiphenylamine, N- 1.00E+OO 2.50E-01 NA
OCDD 8.67E-02 4.33E-02 1.15E-01
OCDF 8.67E-02 4.33E-02 1.15E-01
Octyl Phthalate, di-N- NA NA NA
PeCDD, 2,3,7,8- NA NA NA
PeCDF,2,3,4,7,8- 8.67E+OO 4.33E+OO 1.15E+01
Pentachlorophenol 3.33E+OO 3.33E+OO NA
Phenanthrene NA NA NA
Selenium NA NA NA
Silver NA NA NA
TCDD,2,3,7,8 8.67E-01 4.33E-01 1.1SE+OO
TCDF,2,3,7,8 8.67E-01 4.33E-01 1.1SE+OO
Tetrachloroethylene 1.00E+OO 1.00E+OO 9.98E-01
Thallium (I) Nitrate NA NA NA
Toluene NA NA NA
Tributyl Phosphate 1.70E+OO 8.S2E-01 NA
Trichloroethane, 1,1,2- 1.00E+OO 8.10E-01 1.00E+OO
Trichloroethylene 1.48E-02 2.21E-03 1.7SE-02
Trichlorofluoromethane NA NA NA
Uranium (Soluble Salts) NA NA NA
Vanadium, Metallic NA NA NA
I Vinyl Chloride 4.80E-01 4.80E-01 5.00E-01
Xylene, Mixture NA NA NA
Zinc (Metallic) NA NA NA a NA - not applicable
Third Five-Year Review Report for the Fernald Preserve U.S. Department of Energy Doc No. S07045-Final September 20 I I Page 34
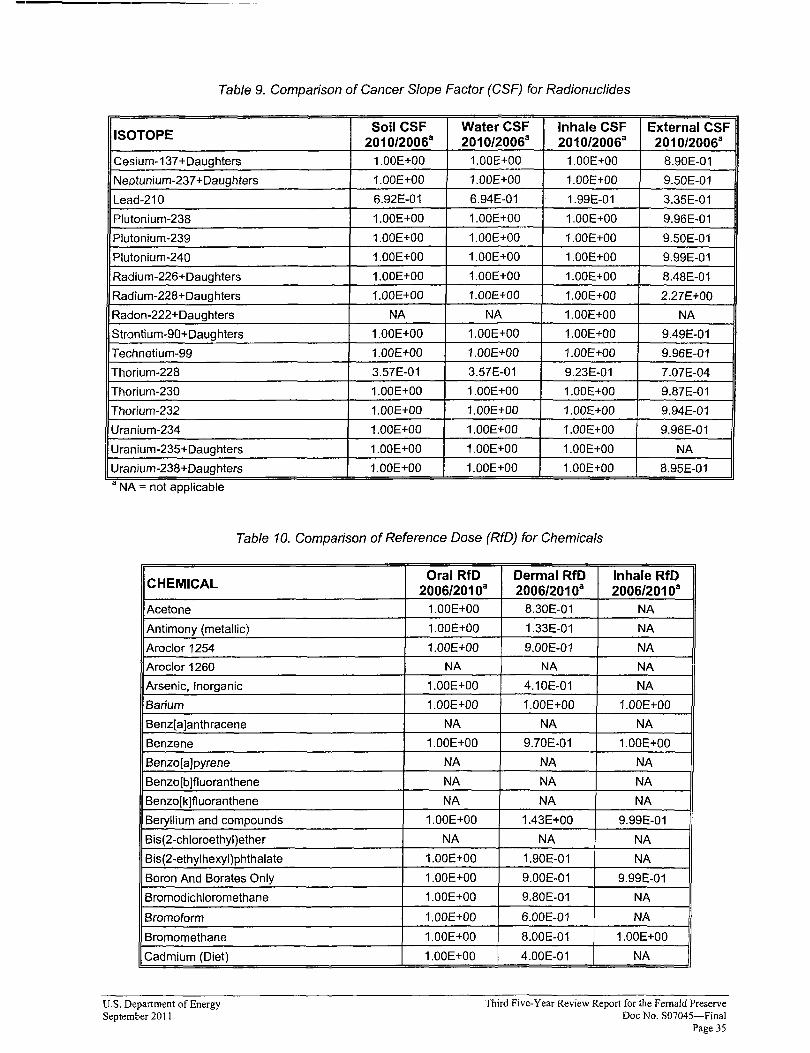
Table 9. Comparison of Cancer Slope Factor (CSF) for Radionuclides
ISOTOPE Soil CSF
2010/2006a Water CSF 2010/2006a
Inhale CSF 2010/2006a
External CSF 2010/2006a
Cesium-137 +Daughters 1.00E+00 1.00E+00 1.00E+00 8.90E-01
Neptunium-237+Daughters 1.00E+00 1.00E+00 1.00E+00 9.50E-01
Lead-210 6.92E-01 6.94E-01 1.99E-01 3.3SE-01
Plutonium-238 1.00E+00 1.00E+00 1.00E+OO 9.96E-01
Plutonium-239 1.00E+00 1.00E+00 1.00E+00 9.S0E-01
Plutonium-240 1.00E+00 1.00E+00 1.00E+00 9.99E-01
Radium-226+Daughters 1.00E+00 1.00E+00 1.00E+OO 8.48E-01
Radium-228+Daughters 1.00E+00 1.00E+00 1.00E+00 2.27E+OO
Radon-222+Daughters NA NA 1.00E+00 NA
Strontium-9O+Daughters 1.00E+OO 1.00E+OO 1.00E+OO 9.49E-01
Technetium-99 1.00E+00 1.00E+OO 1.00E+OO 9.96E-01
Thorium-228 3.S7E-01 3.57E-01 9.23E-01 7.07E-04
Thorium-230 1.00E+00 1.00E+00 1.00E+00 9.87E-01
Thorium-232 1.00E+OO 1.00E+00 1.00E+00 9.94E-01
Uranium-234 1.00E+00 1.00E+OO 1.00E+OO 9.96E-01
Uranium-23S+Daughters 1.00E+OO 1.00E+OO 1.00E+OO NA
Uranium-238+Daughters 1.00E+00 1.00E+00 1.00E+OO B.9SE-01
a NA =not applicable
Table 10. Comparison of Reference Dose (RfD) for Chemicals
CHEMICAL Oral RfD
2006/2010a Dermal RfD 2006/2010a
Inhale RfD 2006/2010a
Acetone 1.00E+OO 8.30E-01 NA
Antimony (metallic) 1.00E+OO 1.33E-01 NA
Aroclor 1254 1.00E+OO 9.00E-01 NA
Aroclor 1260 NA NA NA
Arsenic, Inorganic 1.00E+OO 4.10E-01 NA
Barium 1.00E+OO 1.00E+OO 1.00E+OO
Benz[ajanthracene NA NA NA
Benzene 1.00E+OO 9.70E-01 1.00E+OO
Benzo[ajpyrene NA NA NA
Benzo[b]fluoranthene NA NA NA
Benzo[k]fluoranthene NA NA NA
Beryllium and compounds 1.00E+00 1.43E+00 9.99E-01
Bis(2-chloroethyl)ether NA NA NA
Bis(2-ethylhexyl)phthalate 1.00E+OO 1.90E-01 NA
Boron And Borates Only 1.00E+OO 9.00E-01 9.99E-01
Bromodichloromethane 1.00E+OO 9.80E-01 NA
Bromoform 1.00E+OO 6.00E-01 NA
Bromomethane 1.00E+00 B.OOE-01 1.00E+OO
Cadmium (Diet) 1.00E+OO 4.00E-01 NA
U.S. Department of Energy Third Five-Year Review Report for the Fernald Preserve September 20 II Doc No. S07045-Final
Page 35
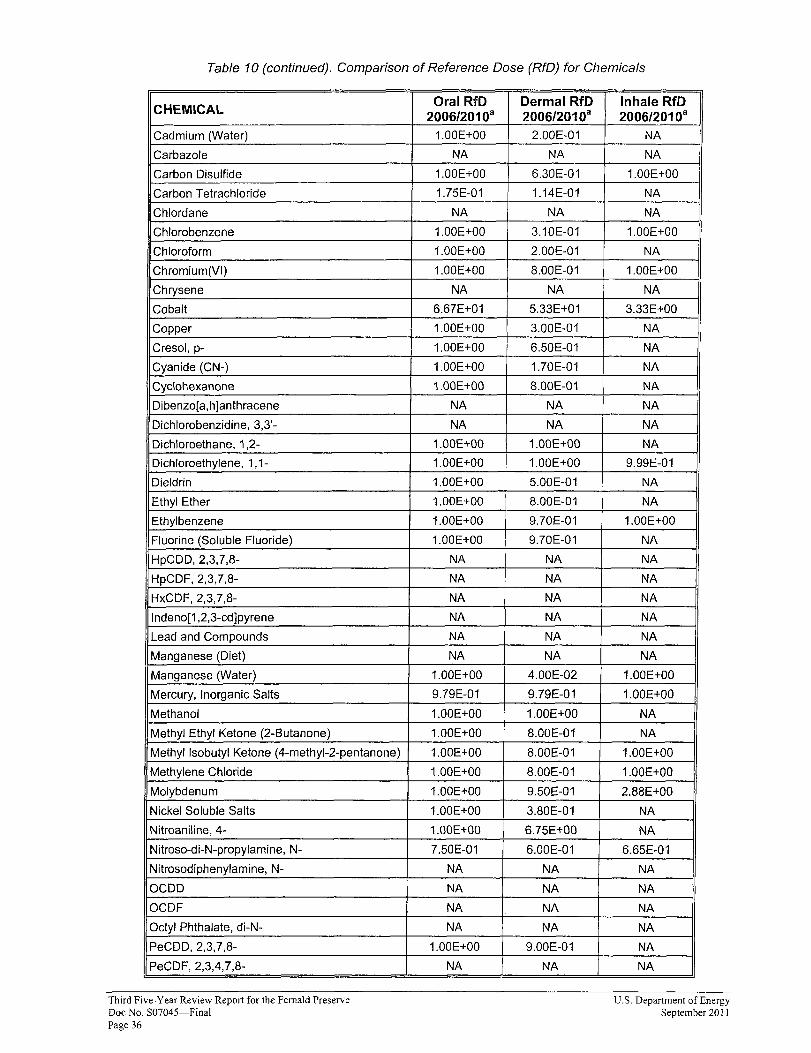
Table 10 (continued). Comparison of Reference Dose (RfD) for Chemicals
CHEMICAL Oral RfD
2006/2010a Dermal RfD 2006/2010a
Inhale RfD 2006/2010a
Cadmium (Water) 1.00E+OO 2.00E-01 NA
Carbazole NA NA NA
Carbon Disulfide 1.00E+OO 6.30E-01 1.00E+OO
Carbon Tetrachloride 1.75E-01 1.14E-01 NA
Chlordane NA NA NA
Chlorobenzene 1.00E+OO 3.10E-01 1.00E+OO
Chloroform 1.00E+OO 2.00E-01 NA
Chromium(VI) 1.00E+OO S.OOE-01 1.00E+OO
Chrysene NA NA NA
Cobalt 6.67E+01 5.33E+01 3.33E+OO
Copper 1.00E+OO 3.00E-01 NA
Cresol, p- 1.00E+OO 6.50E-01 NA
Cyanide (CN-) 1.00E+OO 1.70E-01 NA
Cyclohexanone 1.00E+OO 8.00E-01 NA
Dibenzo[a,hlanthracene NA NA NA
Dichlorobenzidine, 3,3'- NA NA NA
Dichloroethane, 1,2- 1.00E+OO 1.00E+OO NA
Dichloroethylene, 1,1- 1.00E+OO 1.00E+OO 9.99E-01
Dieldrin 1.00E+OO I 5.00E-01 NA
Ethyl Ether 1.00E+OO I
8.00E-01 NA
Ethylbenzene 1.00E+OO 9.70E-01 1.00E+OO
Fluorine (Soluble Fluoride) 1.00E+OO 9.70E-01 NA
HpCDD,2,3,7,8- NA NA NA
HpCDF,2,3,7,S- NA NA NA
HxCDF,2,3,7,8- NA NA NA
Indeno[1,2,3-cdlpyrene NA NA NA
Lead and Compounds NA NA NA
Manganese (Diet) NA NA NA
Manganese (Water) 1.00E+OO 4.00E-02 1.00E+OO
Mercury, Inorganic Salts 9.79E-01 9.79E-01 1.00E+OO
Methanol 1.00E+OO 1.00E+OO NA
Methyl Ethyl Ketone (2-Butanone) 1.00E+OO 8.00E-01 NA
Methyl Isobutyl Ketone (4-methyl-2-pentanone) 1.00E+OO 8.00E-01 1.00E+OO
Methylene Chloride 1.00E+OO 8.00E-01 1.00E+OO
Molybdenum 1.00E+OO 9.50E-01 2.8SE+OO
Nickel Soluble Salts 1.00E+OO 3.80E-01 NA
Nitroaniline, 4- 1.00E+OO 6.75E+OO NA
Nitroso-di-N-propylamine, N 7.50E-01 6.00E-01 6.65E-01
Nitrosodiphenylamine, N- NA NA NA
OCDD NA NA NA
OCDF NA NA NA
Octyl Phthalate, di-N- NA NA NA
PeCDD,2,3,7,8- 1.00E+OO 9.00E-01 NA
PeCDF,2,3,4,7,S- NA NA NA
Third Five-Year Review Report for the Fernald Preserve U.S. Department of Energy Doc No. S07045-Final September 20 II Page 36
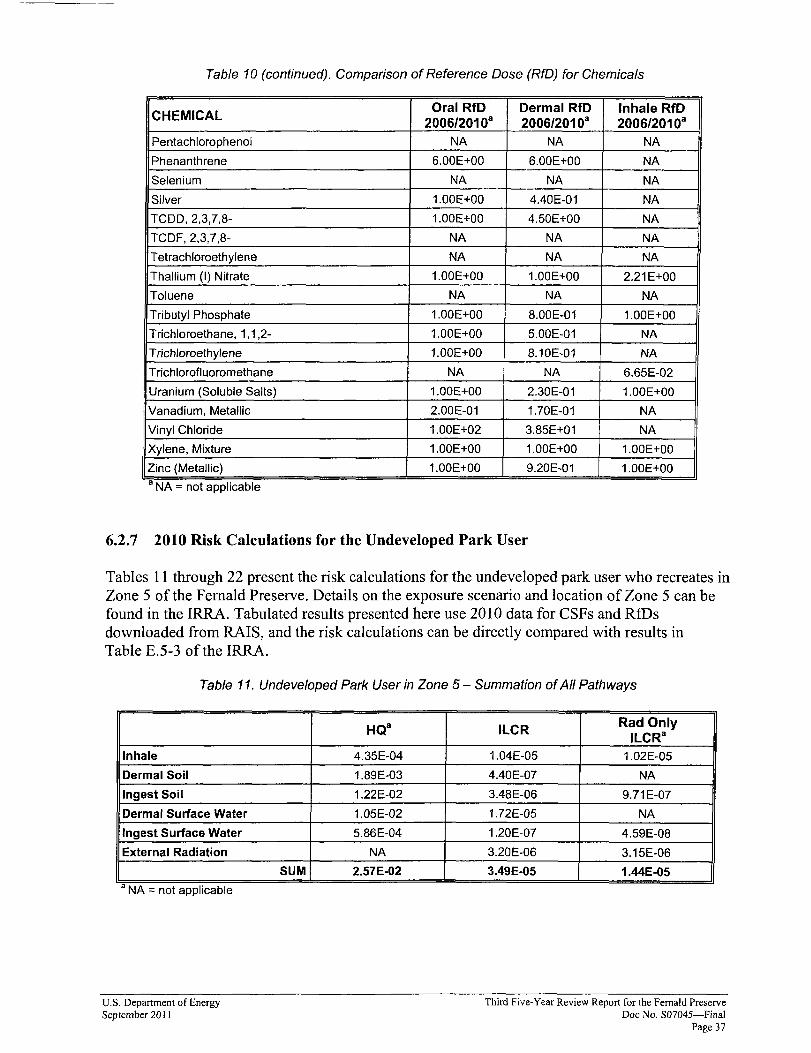
Table 10 (continued). Comparison of Reference Dose (RfD) for Chemicals
CHEMICAL Oral RfD
2006/2010a Dermal RfD 2006/2010a
Inhale RfD 2006/2010a
Pentachlorophenol NA NA NA
Phenanthrene 6.00E+OO 6.00E+OO NA
Selenium NA NA NA
Silver 1.00E+OO 4.4OE-01 NA
TCDD, 2,3,7,8- 1.00E+OO 4.SOE+OO NA
TCDF,2,3,7,8- NA NA NA
Tetrachloroethylene NA NA NA
Thallium (I) Nitrate 1.00E+OO 1.00E+OO 2.21E+OO
Toluene NA NA NA
Tributyl Phosphate 1.00E+OO 8.00E-01 1.00E+OO
Trichloroethane, 1,1,2- 1.00E+OO S.OOE-01 NA
Trichloroethylene 1.00E+OO 8.10E-01 NA
Trichlorofluoromethane NA NA 6.6SE-02
Uranium (Soluble Salts) 1.00E+OO 2.30E-01 1.00E+OO
IVanadium, Metallic 2.00E-01 1.70E-01 NA
I Vinyl Chloride 1.00E+02 3.8SE+01 NA I
II Xylene, Mixture 1.00E+OO 1.00E+OO 1.00E+OO
IIZinc (Metallic) 1.00E+OO 9.20E-01 1.00E+OO
a NA =not applicable
6.2.7 2010 Risk Calculations for the Undeveloped Park User
Tables 11 through 22 present the risk calculations for the undeveloped park user who recreates in Zone 5 of the Fernald Preserve. Details on the exposure scenario and location of Zone 5 can be found in the IRRA. Tabulated results presented here use 2010 data for CSFs and RIDs downloaded from RAIS, and the risk calculations can be directly compared with results in Table E.5-3 of the IRRA.
Table 11. Undeveloped Park User in Zone 5 - Summation ofAll Pathways
HQa ILCR Rad Only ILCRa
Inhale 4.3SE-04 1.04E-OS 1.02E-OS
Dermal Soil 1.89E-03 4.40E-07 NA
Ingest Soil 1.22E-02 3.48E-06 9.71 E-07
Dermal Surface Water 1.0SE-02 1.72E-OS NA
Ingest Surface Water S.86E-04 1.20E-07 4.S9E-08
External Radiation NA 3.20E-06 3.1SE-06
SUM 2.S7E-02 3.49E-OS 1.44E-OS a NA - not applicable
u.s. Department of Energy Third Five-Year Review Report for the Fernald Preserve September 2011 Doc No. S07045-Final
Page 37
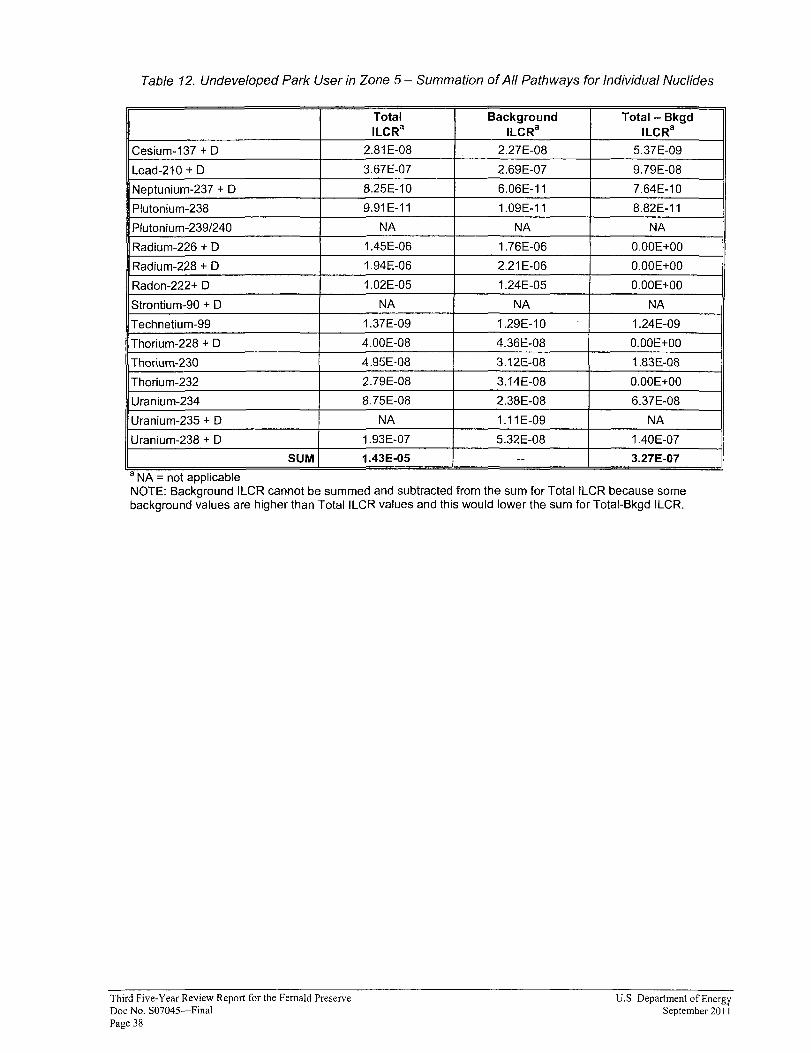
Table 12. Undeveloped Park User in Zone 5 - Summation ofAll Pathways for Individual Nuclides
Total Background Total- Bkgd ILCRa ILCRa ILCRa
Cesium-137 + D 2.B1E-OB 2.27E-OB 5.37E-09
Lead-210 + D 3.67E-07 2.69E-07 9.79E-OB
Neptunium-237 + D 8.25E-10 6.06E-11 7.64E-10
Plutonium-23B 9.91E-11 1.09E-11 B.B2E-11
Plutonium-239/240 NA NA NA
Radium-226 + D 1.45E-06 1.76E-06 O.OOE+OO
Radium-22B + D 1.94E-06 2.21 E-06 O.OOE+OO
Radon-222+ D 1.02E-05 1.24E-05 O.OOE+OO
Strontium-90 + D NA NA NA
Technetium-99 1.37E-09 1.29E-10 1.24E-09
Thorium-22B + D 4.00E-OB 4.36E-OB O.OOE+OO
Thorium-230 4.95E-08 3.12E-08 1.83E-OB
Thorium-232 2.79E-OB 3.14E-OB O.OOE+OO
Uranium-234 8.75E-OB 2.3BE-OB 6.37E-OB
Uranium-235 + D NA 1.11E-09 NA
Uranium-238 + D 1.93E-07 5.32E-OB 1.40E-07
SUM 1.43E-05 - 3.27E-07
a NA =not applicable NOTE: Background I LCR cannot be summed and subtracted from the sum for Total ILCR because some background values are higher than Total ILCR values and this would lower the sum for Total-Bkgd ILCR.
Third Five· Year Review Report for the Fernald Preserve U.S. Department of Energ¥ Doc No. S07045-Final September 20 II Page 38
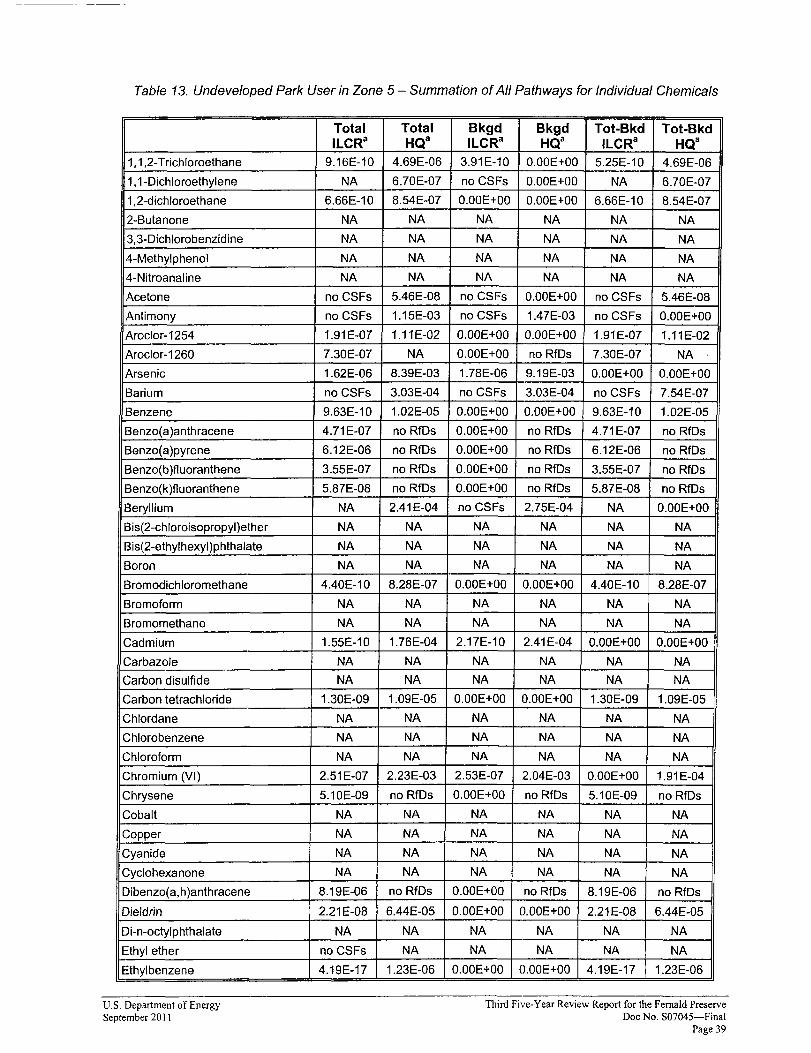
Table 13. Undeveloped Park User in Zone 5 - Summation ofAll Pathways for Individual Chemicals
Total ILCRa
Total HQa
Bkgd ILCRa
Bkgd HQa
Tot-Bkd ILCRa
Tot-Bkd HQa
1,1,2-Trichloroethane 9.16E-10 4.69E-06 3.91 E-10 O.OOE+OO 5.25E-10 4.69E-06
1,1-Dichloroethylene NA 6.70E-07 no CSFs O.OOE+OO NA 6.70E-07
1,2-dichloroethane 6.66E-10 8.54E-07 O.OOE+OO O.OOE+OO 6.66E-10 8.54E-07
2-Butanone NA NA NA NA NA NA
3,3-Dichlorobenzidine NA NA NA NA NA NA
4-Methylphenol NA NA NA NA NA NA
4-Nitroanaline NA NA NA NA NA NA
Acetone no CSFs 5.46E-08 no CSFs O.OOE+OO no CSFs S.46E-08
Antimony no CSFs 1.1SE-03 no CSFs 1.47E-03 no CSFs O.OOE+OO
Aroclor-1254 1.91E-07 1.11E-02 O.OOE+OO O.OOE+OO 1.91E-07 1.11 E-02
Aroclor-1260 7.30E-07 NA O.OOE+OO no RfDs 7.30E-07 NA
Arsenic 1.62E-06 8.39E-03 1.78E-06 9.19E-03 O.OOE+OO O.OOE+OO
Barium no CSFs 3.03E-04 no CSFs 3.03E-04 no CSFs 7.54E-07
Benzene 9.63E-10 1.02E-OS O.OOE+OO O.OOE+OO 9.63E-10 1.02E-05
Benzo(a)anthracene 4.71 E-07 no RfDs O.OOE+OO no RfDs 4.71 E-07 no RfDs
Benzo( a )pyrene 6.12E-06 no RfDs O.OOE+OO no RfDs 6.12E-06 no RfDs
Benzo(b )fluoranthene 3.SSE-07 no RfDs O.OOE+OO no RfDs 3.5SE-07 no RfDs
Benzo(k)fluoranthene 5.87E-08 no RfDs O.OOE+OO no RfDs 5.87E-08 no RfDs
Beryllium NA 2.41E-04 no CSFs 2.7SE-04 NA O.OOE+OO
Bis(2-chloroisopropyl)ether NA NA NA NA NA NA
Bis(2-ethylhexyl)phthalate NA NA NA NA NA NA
Boron NA NA NA NA NA NA
Bromodichloromethane 4.40E-10 8.28E-07 O.OOE+OO O.OOE+OO 4.40E-10 8.28E-07
Bromofonn NA NA NA NA NA NA
Bromomethane NA NA NA NA NA NA
Cadmium 1.55E-10 1.76E-04 2.17E-10 2.41E-04 O.OOE+OO O.OOE+OO
Carbazole NA NA NA NA NA NA
Carbon disulfide NA NA NA NA NA NA
Carbon tetrachloride 1.30E-09 1.09E-05 O.OOE+OO O.OOE+OO 1.30E-09 1.09E-05
Chlordane NA NA NA NA NA NA
Chlorobenzene NA NA NA NA NA NA
Chloroform NA NA NA NA NA NA
Chromium (VI) 2.51 E-07 2.23E-03 2.53E-07 2.04E-03 O.OOE+OO 1.91E-04
Chrysene 5.10E-09 no RfDs O.OOE+OO no RfDs 5.10E-09 no RfDs
Cobalt NA NA NA NA NA NA
Copper NA NA NA NA NA NA
Cyanide NA NA NA NA NA NA
Cydohexanone NA NA NA NA NA NA
Dibenzo(a,h)anthracene 8.19E-06 no RfDs O.OOE+OO no RfDs 8.19E-06 no RfDs
Dieldrin 2.21E-08 6.44E-05 O.OOE+OO O.OOE+OO 2.21E-08 6.44E-OS
Di-n-octylphthalate NA NA NA NA NA NA
Ethyl ether no CSFs NA NA NA NA NA
Ethylbenzene 4.19E-17 1.23E-06 O.OOE+OO O.OOE+OO 4.19E-17 1.23E-06
U.S. Department of Energy Third Five-Year Review Report for the Fernald Preserve September 2011 Doc No. S07045-Final
Page 39
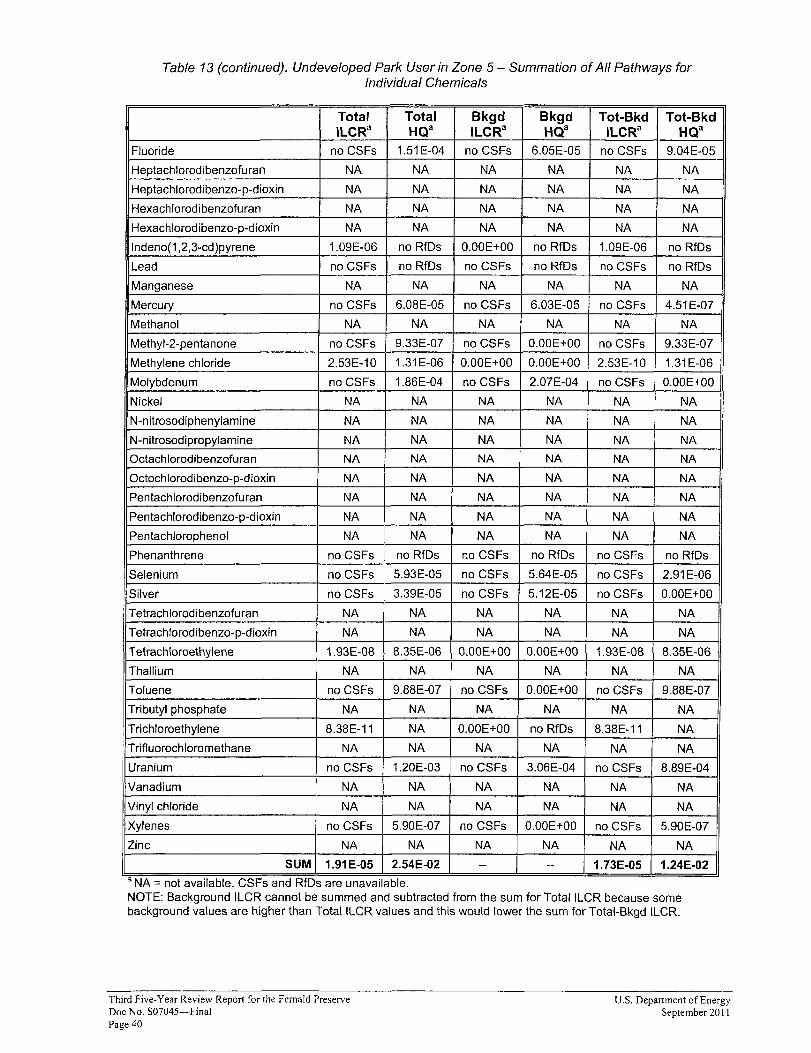
Table 13 (continued). Undeveloped Park User in Zone 5 - Summation of All Pathways for Individual Chemicals
Total Total Bkgd Bkgd Tot-Bkd Tot-Bkd ILCRa HQa ILCRa HQa ILCRa HQa
Fluoride no CSFs 1.51 E-04 no CSFs 6.05E-05 no CSFs 9.04E-05
Heptachlorodibenzofuran NA NA NA NA NA NA
Heptachlorodibenzo-p-dioxin NA NA NA NA NA NA
Hexachlorodibenzofuran NA NA NA NA NA NA
Hexachlorodibenzo-p-dioxin NA NA NA NA NA NA
Indeno(1,2,3-cd)pyrene 1.09E-06 no RfDs O.OOE+OO no RfDs 1.09E-06 no RfDs
Lead no CSFs no RfDs no CSFs no RfDs no CSFs no RfDs
Manganese NA NA NA NA NA NA
Mercury no CSFs 6.0SE-05 no CSFs 6.03E-05 no CSFs 4.51 E-07
Methanol NA NA NA NA NA NA
Methyl-2-pentanone no CSFs 9.33E-07 no CSFs O.OOE+OO no CSFs 9.33E-07
Methylene chloride 2.53E-10 1.31 E-06 O.OOE+OO O.OOE+OO 2.53E-10 1.31 E-06
Molybdenum no CSFs 1.S6E-04 no CSFs 2.07E-04 no CSFs O.OOE+OO
Nickel NA NA NA NA NA NA
N-nitrosodiphenylamine NA NA NA NA NA NA
N-nitrosodipropylamine NA NA NA NA NA NA
Octachlorodibenzofuran NA NA NA NA NA NA
Octochlorodibenzo-p-dioxin NA NA NA NA NA NA
Pentachlorodibenzofuran NA NA NA NA NA NA
Pentachlorodibenzo-p-dioxin NA NA NA NA NA NA
Pentachlorophenol NA NA NA NA NA NA
Phenanthrene no CSFs ; no RfDs no CSFs no RfDs no CSFs no RfDs
Selenium no CSFs 5.93E-05 no CSFs 5.64E-05 no CSFs 2.91 E-06
Silver no CSFs 3.39E-05 no CSFs 5.12E-05 no CSFs O.OOE+OO
Tetrachlorodibenzofuran il NA NA NA NA NA NAJ Tetrachlorodibenzo-p-dioxin i NA NA NA NA NA NA
, Tetrachloroethylene 1.93E-08 8.35E-06 O.OOE+OO O.OOE+OO 1.93E-OS 8.35E-06
Thallium NA NA NA NA NA NA
Toluene no CSFs 9.SSE-07 no CSFs O.OOE+OO no CSFs 9.SSE-07
, Tributyl phosphate NA NA NA NA NA NA
; Trichloroethylene S.3SE-11 NA O.OOE+OO no RfDs S.3SE-11 NA
: Trifluorochloromethane NA NA NA NA NA NA
Uranium no CSFs 1.20E-03 no CSFs 3.06E-04 no CSFs S.S9E-04
Vanadium NA NA, NA NA NA NA
Vinyl chloride NA NA NA NA NA NA
Xylenes no CSFs 5.90E-07 no CSFs O.OOE+OO no CSFs 5.90E-07
Zinc NA NA NA NA NA NA
SUM 1.91E-05 2.54E-02 - - 1.73E-05 1.24E-02
aNA = not available. CSFs and RfDs are unavailable. NOTE: Background ILCR cannot be summed and subtracted from the sum for Total ILCR because some background values are higher than TotallLCR values and this would lower the sum for Total-Bkgd ILCR.
Third Five-Year Review Report for the Fernald Preserve U.S. Department of Energy Doc No. S07045-Final September 20 II Page 40
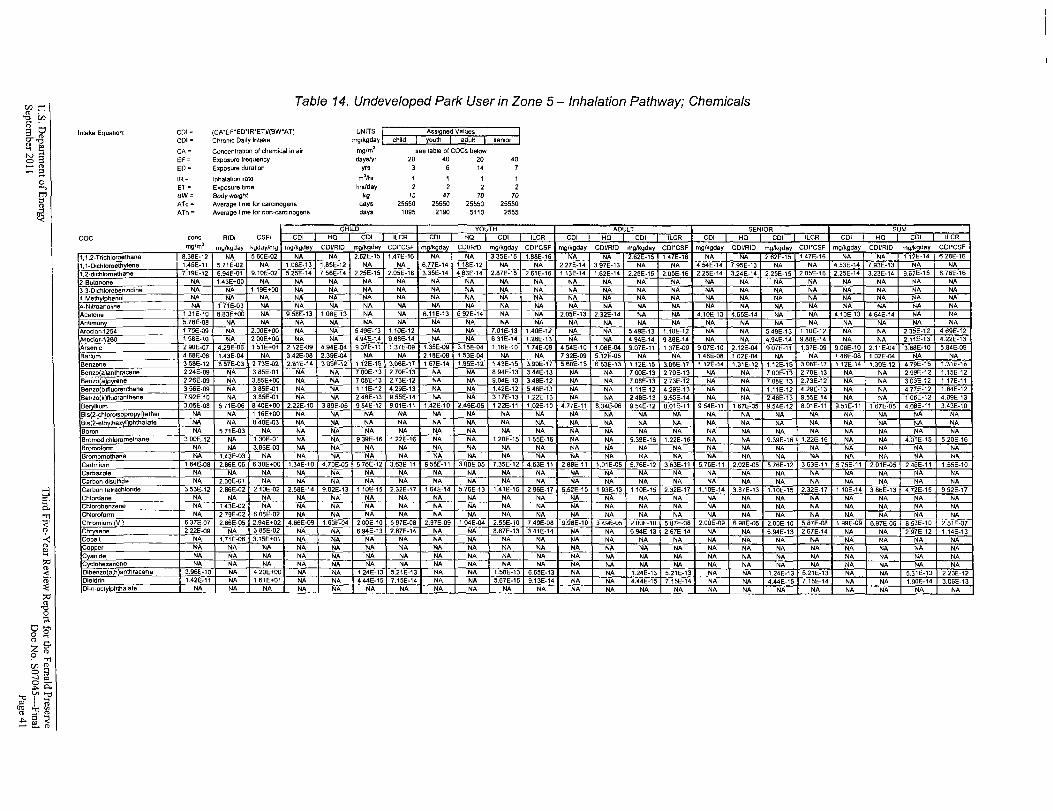
Table 14" Undeveloped Park User in Zone 5 - Inhalation Pathway; Chemicals
Intake Equation: CDI = (CA"EF"ED"IR"ETY(BW"ATj UNITS Ass. ned Values
CDI = ChrOnic Dally Intake mg/kgday child Quth adult semor
CA = Concenlrallon of chemical in air mg/mJ see lable of COGs below
EF = Exposure frequency days/yr 20 40 20 40
ED = Exposure duration yrs 6 14 7
IR= lnhalaltan rate mJ/hr I ET = Exposure time hrs/dey BW= Bodywetgh! kg 15 47 70 70 ATc = Average lime for carCinogens da.ys 25550 25550 25550 255S0 ATn = Average lime for non-carcinogens days 1095 21S0 SilO 2SSS
-l
[ ::r'
'TI<. " .<: " ~ ;;tl
<: " iii· ~ ;;tl
CHILD YOUTH AOULT SENIOR SUM
COC cone RfDi CSFi CDI HO COl IlCR CDI HQ COl ILCR CDI HD CDI ILeR COl HD CDI ILeR CDI HD GOI ILCR mg/ml
11I~/k!::lddy kyudy/my my/kyday COURfD mg/kgday CDI"CSF mg/kgday COl/RID mg/kgday CDt"CSF mg/kgday Col/RtO mglkgday COI"CSF mglkgday CDI/RID mg/kgday CDI"CSF mg/kgday COIIRrD mg/l(gday COI"CSF
1 1 2-Trichloroelhane B.38E·12 NA 560E-02 NA NA 2.62E-15 1.47E-16 NA NA 33SE·1S I.BBE-16 NA NA 2.62E-IS 147E-'6 NA NA 2 fi2E-1fi , 47F.-lfi NA NA 1 17E-14 15 2eE-1S
~elhylene 1.45E-l1 5.11E-02 NA 1.06E·13 1.8SE:'2 NA NA 6.77E-14 1.18E-12 NA NA 2.27E-14 397E-13 NA NA 4.54E-14 1.SSE-I3 NA NA 4.S3E-14 7.93E-13 NA NA
1.2-dlchloroethane 7.19E-12 6.94E-01 9.'OE-02 5.25E-14 7 S6E-14 2.25E-1S 2.0SE-16 3.3SE-14 4.B3E-14 2.B7E-1S 2.61E-16 , 13E-14 1.62E-14 2.25E-IS 2.0SE-16 2.2SE-14 3.24E-14 2.2SE-iS 2.0SE-16 2.2SE-14 3.23E-14 9.G2E-15 S.7GE-16
2-Bulanone NA 1.43E+OO NA NA NA NA NA NA NA NA NA NA NA NA NA NA NA NA NA NA NA NA NA
3.3-Dlchlorooenzldine NA NA 1.19E+OO NA NA NA NA NA NA NA NA NA NA NA NA NA NA NA NA NA NA NA NA 4-Meth Iphenol NA NA NA NA NA NA NA NA NA NA NA NA NA NA NA NA NA NA NA NA NA NA NA
4-Nitroanalme NA 1 lIE-03 NA NA NA NA NA NA NA NA NA NA NA NA NA NA NA NA NA NA NA NA NA
Acetone 131E.10 B.83E+OO NA S.SBE-13 108E-13 NA NA 6.11E-13 6 S2E-14 NA NA 2.05E-13 2.32E-14 NA NA 4.10E-13 4.65E-14 NA NA 4.10E-13 464E-14 NA NA
Antimony 5.78E-08 NA NA NA NA NA NA NA NA NA NA NA NA NA NA NA NA NA NA NA NA NA NA
Aroclor-1254 1.75E·09 NA 2.00E+OO NA NA 549E-13 1.10E-12 NA NA 7.01E-13 1.40E-12 NA NA 5.4SE-13 1.10E-12 NA NA 549E-13 1.10E-12 NA NA 235E-12 469E-12
ArocIOJ-126Q 1 SSE.10 NI'. 200E+OO NI'. NI'. 4.94E-14 9 88E-14 NA NA 631E-14 1.26E-13 NI'. NA 494E-14 988E-14 NA NA 4.94E-14 9.88E-14 NA NA 211E-13 4.22E-13
Arsenic 2 SOE"07 4.29E-06 1 S1E+01 2.12E.()S 4.94E-04 901E-11 1.37E-09 1.3SE·OS 3.1SE-04 1.16E-l0 1 74E-09 4.S4E-l0 1.06E-04 9.07E-11 1 37E-09 S.07E·l0 2.12E-04 9.07E-11 1.37E-09 9.06E-10 2.11E-04 3.88E·l0 S.84E-OS
Barium 468E"06 1.43E-04 NA 3.42E-OS 2.39E_04 NA NA 2.1SE-OS 1.S3E-04 NA NA 7.32E·OS S.12E·OS NA NA 1.46E-08 1.02E-04 NA NA 1.46E-OB 1.02E-04 NA NA
Benzene 3.S8E-12 B.S7E-03 273E-02 2.61E-14 305E-12 1.'I2E-1S 3.06E-17 1.67E-14 1.9SE.-'I2 'I 43E-1S 3.90E-17 S.6QE-1S 653E-13 1,2E-1S 3.06E-11 '.12E-,4 1.'31E-12 U2E-1S 3.0SE-17 , 12E-14 1.30E-12 4.79E-1S 1.31E-1S
Benzo(a)anlhracene 2.24E·OS NA 38SE·Ol NA NA 7.00E·13 2.70E·13 NA NA 8.94E-13 3.44E·13 NA NA 700E·13 2.70E·13 NA NA 700E-13 2.70E-13 NA NA 2.99E·12 1.ISE·12 Benzo a)pyrene 226E·OS NA 3.S5E+OO NA NA 7.0BE·13 2.73E-12 NA NA 9.D4E-13 3.4BE-12 NA NA 7.08E-13 273E·12 NA NA 7.08E-'3 2.73E-12 NA NA 3.03E·12 1 17E-11
Ben2o(b)fluoranthene 3 S6E·OS NA 3.BSE-01 NA NA 1.11E-12 4.2SE·13 NA NA 1.42E·12 548E-13 NA NA 1.11E-12 4.29E-13 NA NA 1.11E-12 4.29E-13 NA NA 4.71E-12 1.84E-12
Benzo(k)lluoranthene 7.92E-l0 NA 3.85E-01 NA NA 248E-13 9 S5E-14 NA NA 317E-13 1.22E-13 NA NA 24BE-13 9.55E-14 NA NA 2.4BE-13 9.55E-14 NA NA 106E-12 4.0SE-13 Beryllium 3.05E·OB S 71E-06 B 40E+OO 2.22E·l0 38SE·OS 9.S4E·12 B.OIE·l1 1.42E-l0 2.49E-05 122E·ll 1.02E·l0 4.77E-11 B.34E-06 S.54E·12 B.01E-11 954E-11 1 67E-OS 9.54E·12 8.01E-11 9.51E-11 167E·OS 4.08E-11 3.43E·10 Bis 2-chloroisopropyl ether NA NA 1 16E+OO NA NA NA NA NA NA NA NA NA NA NA NA NA NA NA NA NA NA NA NA Bis 2-ethylhexyl hthalate NA NA 840E-03 NA NA NA NA NA NA NA NA NA NA NA NA NA NA NA NI'. NA NA NA NA
Boron NA S.71E-03 NA NA NA NA NA NA NA NA NA NA NA NA NA NA NA NA NA NA NA NA NA Bromodichloromethane 3.00E-12 NA 1.30E-01 NA NA S 39E·16 122E-16 NA NA 1.20E-15 155E·16 NA NA 9.39E·16 1.22E-16 NA NA 9.39E-16 1.22E-16 NA NA 4.01E-15 S.20E-16
Bromofonn NA NA 3.B5E-03 NA NA NA NA NA NA NA NA NA NA NA NA NA NA NA NA NA NA NA NA Bromomethane NA 1.43E-03 NA NA NA NA NA NA NA NA NA NA NA NA NA NA NA NA NA NA NA NA NA Cadmium 1 B4E·OB 2.B6E·06 S 30E+00 1.34E-10 4.70E·OS 576E-12 3.63E-11 B 5BE-ll 3.00E-OS 7.35E-12 4.63E·11 2.88E-11 1.0IE·OS S.76E-12 3.63E-11 S.76E-ll 2.02E-05 S 76E-12 363E,'1 575E-11 2.01E-OS 2.46E-11 1.S5E-10
Carbazole NA NA NA NA NA NA NA NA NA NA NA NA NA NA NA NA NA NA NA NA NA NA NA Carbon disulfide NA 2.00E-01 NA NA NA NA NA NA NA NA NA NA NA NA NA NA NA NA NA NA NA NA NA Carbon tetrachloride 353E-12 2.B6E-02 2.10E-02 2.S8E-14 9.02E-13 , 1DE-1S 2.32E-17 1.64E-14 S.76E·13 1.41E-15 2 S6E·17 5.52E-1S 193E-13 110E-15 2.32E-17 1.10E-14 3.87E-13 1.10E-1S 2.32E-17 1 10E-14 3 B6E-13 4.7ZE-1S 992E-17 Chlordane NA NA NA NA NA NA NA NA NA NA NA NA NA NA NA NA NA NA NA NA NA NA NA Chlorobenzene NA 1.43E-02 NA NA NA NA NA NA NA NA NA NA NA NA NA NA NA NA NA NA NA NA NA Chloroform NA 279E-02 B.05E·02 NA NA NA NA NA NA NA NA NA NA NA NA NA NA NA NA NA NA NA NA Chromium (VI' 6.37E 07 2.86E·OS 2.94E.,.02 4.66E-09 1.63E·04 2.00E-l0 5 B7E-OB 2.97E-09 1 04E-04 2.5SE-IO 7.49E-OB S.SBE·l0 3.49E-O:> ~.UUE:-1U 5.H71:-0B 2.00E-09 6.9SE-OS 2.00E-l0 S.B7E-OB 1.99E-09 6.97E-05 B5:3E-10- 2~51E-:-07 Chrysene 2.22E·OS NA 3.8SE·02 NA NA 6.94E·13 2.67E-14 NA NA 8.87E-13 3.41E-14 NA NA 6.94E-13 2.67E-14 NA NA 6.94E-13 2.67E-14 NA NA 2.91E-I2 1.14E-13 Cobalt NA 1.71E-06 3.1SE+01 NA NA NA NA NA NA NA NA NA NA NA NA NA NA NA NA NA NA NA NA Copper NA NA NA NA NA NA NA NA NA NA NA NA NA NA NA NA NA NA NA NA NA NA NA Cyanide NA NA NA NA NA NA NA NA NA NA NA NA NA NA NA NA NA NA NA NA NA NA NA Cyctohexanone NA NA NA NA NA NA NA NA NA NA NA NA NA NA NA NA NA NA NA NA NA NA NA Dibenzo a,h anthracene 3.S6E·l0 NA 4.20E+00 NA NA 124E-13 S.21E-13 NA NA 1.58E-13 6.6SE-13 NA NA 1.24E-13 S.21E-13 NA NA 1.24E-13 S.21E-13 NA NA 5.31E-13 2.23E-12 Dieldrin 1.42E-l1 NA 161E+01 NA NA 444E-15 7.15E-14 NA NA 5.67E-15 S.I3E·14 NA NA 4.44E-15 7.15E-14 NA NA 4.44E-15 7.15E-14 NA NA 1.90E-14 3.06E·13 Di-n-octylphthalate NA NA NA NA NA NA NA NA NA NA NA NA NA NA NA NA NA NA NA NA NA NA NA
"0" a :l
0 a Q' (")
Z So ? " 'TI [Jl"0::3 -.J",0.;.c:l. V>'"C
'"C I (i1'" 'TI'"cro -. " ".;. ::s ~ ~'"
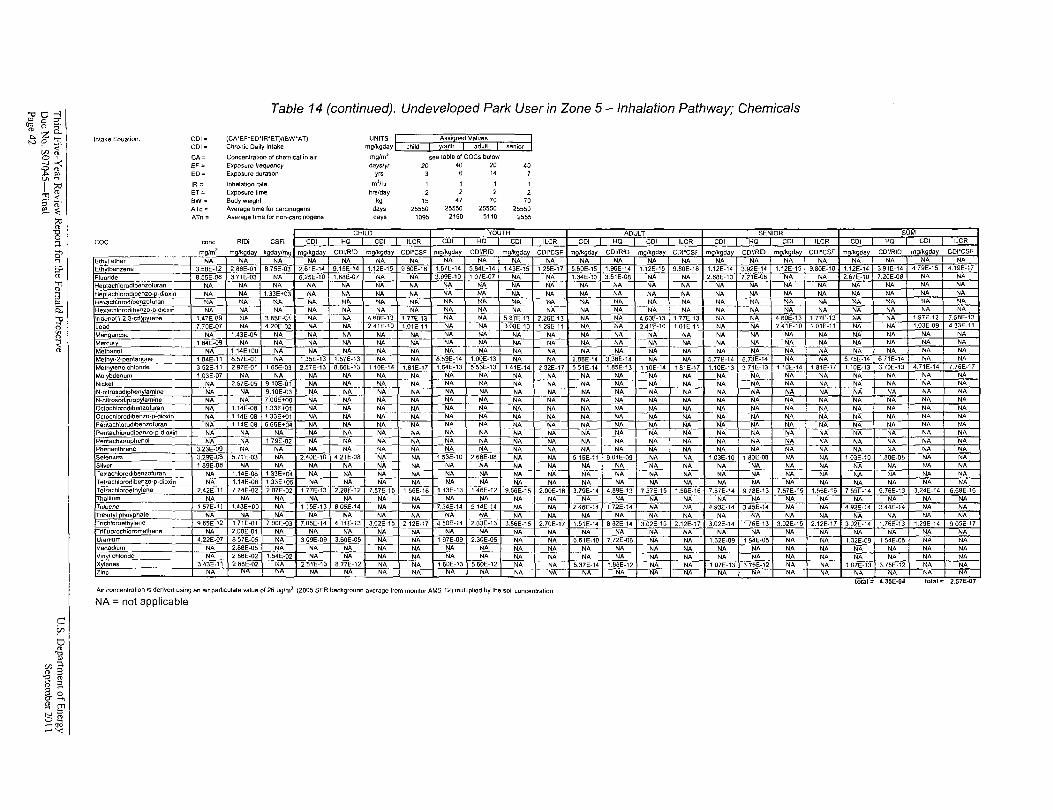
Table 14 (continued), Undeveloped Park User in Zone 5 -Inhalation Pathway; Chemicals
Intake Equation. COl = COl =
ICA'EF'EO'IR'ET)IIBW'AT) Chronic Daily Intake
UNITS mg/kgday child
Assi ned Values oulh adult senior
CA= Concentrahon of chemical in air mglm3 see table of COGs below EF = EO=
Exposure frequency Exposure duration
days!yr yrs
20 40 6
20 14
40
IR = Inhalation rale mJ/hr
ET = Exposure lime hl"5/day BW= ATe =
Body weight Average lime for carCll10gens
kg days
15 25550
47 25550
70 25550
70 25550
ATn = Average time for non-carcinogens days 1095 2190 5110 2555
CHILD YOUTH AOULT SENIOR SUM
COC cone RfOi CSFi COl HQ COl IlCR COl HQ COl ILCR CDI HQ COl ILCR COl HQ COl ILCR COl HQ COl ILCR
mg/mJ mglkoday kodaylmq mglkgday CDI/RfD mglkgday CDI-CSF mglkgday COl/RID mgll<Qday Col'CSF mg/kgday GDl/RfD m Ikoday Col'CSF mglkgday COl/RID mglkgda CDI"CSF m Ikoday COI/RfO m /kgday CDI'CSF
E~tI ether NA NA NA NA NA NA NA NA NA NA NA NA NA NA NA NA NA NA NA NA NA NA NA
Elh Ibenzene 3.58E-12 2.86E-01 8.7SE-03 2.61E-1A 9.1SE-14 1.12E-15 980E-18 1.67E·14 5.84E-14 1.43E-15 1.25E-17 5.60E-15 1.96E-14 1.12E-15 9.80E-18 ~,2E-14 3.92E-14 1.12E-15 9.BOE-18 1.12E-14 3.91E-14 479E-15 4.19E-17
Fluoride 8.55E·08 3.71E-0"3 NA 6.25E-l0 1.6eE-07 NA NA 3.99E-10 1 07E-07 NA NA 1.34E-10 3.61E·08 NA NA 2.68E-10 7.21E-08 NA NA 2.67E-10 7.20E-08 NA NA
Heplachlorodibenzofuran NA NA NA NA NA NA NA NA NA NA NA NA NA NA NA NA NA NA NA NA NA NA NA
Heplachlorodlbenzccp-dioxin NA NA 1.33E+03 NA NA NA NA NA NA NA NA NA NA ~~ NA NA NA NA NA NA NA NA NA
Hexachlorodibenzofuran N" N" N" '''' N" N" N" Nt.. N" N" N" NA N" -.~ ~ - NA NA NA NA NA NA NA
Hexachlorodibenzo·p·dloxln NA NA NA NA NA NA NA NA NA NA NA NA NA NA NA NA '-~--'NA- NA NA NA NA NA NA
lndeno 1.2,3-cdMrero.e 1.47E-09 NA 3.B5E·Ol NA NA 4.60E-'-3 , 77E.-13- NA NA 5.87E-13 2.26E-13 NA NA 4.60E-13 177E-13 NA -~ 4.60E·13 1.77E-13 NA NA 1.97E·12 7.58E·13
Lead 7.70E-07 NA 4.20E·02 NA NA 2.41E·10 1.01E·l1 NA NA 3.08E-10 129E-l1 NA NA 2.41E-l0 101E-l1 NA NA 2.41E·l0 1.01E-11 NA NA 1.03E·09 433E·11
ManQanese NA 1.43E-0!) NA NA NA NA NA NA NA NA NA NA NA NA NA NA NA NA NA NA NA NA NA
Mercury 184E-09 NA NA NA NA NA NA NA NA NA NA NA NA NA NA NA NA NA NA NA NA NA NA -~
Methanol NA 1 14E+00 NA NA NA NA NA NA NA NA NA NA NA NA NA NA NA NA NA NA NA NA NA
Melh I·2·penlanone 1.84E_11 8.57E-01 NA 1.35E-13 1.57E-13 NA NA 8.59E·14 1.00E·13 NA NA 2.88E·14 3.36E·14 NA NA 5.77E-14 6.73E·14 NA NA 5.75E-14 671E-14 NA NA
Melh lene chloride 352E·11 2.97E·01 165E·03 2.57E-13 8.66E-13 110E-14 1.81E·17 1.64E-13 553E·13 141E·14 "132E-17 551E·14 1.85E·13 110E·14 181E·17 1.10E-13 371E·13 1 10E-14 1.81E-17 1.10E-13 3.70E-13 4.71E·14 7.76E·17
Mol bdenum 1.03E·07 NA NA NA NA NA NA NA NA NA NA NA NA NA NA NA NA NA NA NA NA NA NA Nickel NA 2.57E-05 91OE-01 NA NA NA NA
.-NA NA NA ~~-- NA NA NA NA NA NA NA NA NA NA NA NA
N·nilrosodl hen lamine NA NA 9.10E-03 NA NiC- NA NA NA NA NA --
NA NA NA NA NA NA NA NA NA NA NA NA N·nilrosodi rop~amine NA NA 7.00E+00 NA NA NA NA NA NA NA NA NA NA NA NA NA NA NA NA NA NA NA NA Oclochlorodlbenzofuran NA 1.14E·08 1.33E+01 NA NA NA NA NA NA NA NA NA NA NA NA NA NA NA NA NA NA NA NA Octochlorod,benzo-p-dioxin NA 1.14E·08 1.33E+Ol NA NA NA -~ NA NA NA NA NA NA NA NA
.-oNA NA NA NA NA NA NA NA Pentac.hlorodlbenzofuran NA 114E·08 665E+04 NA NA NA NA NA NA NA NA NA NA NA NA NA N" NA NA NA NA NA NA Penlachlorodibenzo-p·dloxin NA NA NA NA NA NA NA NA NA -NA -----'NA-
NA NA NA NA NA NA NA NA NA NA NA NA Pentac.hlorophenol NA NA 1.79E-02 NA NA NA NA NA NA NA NA NA I NA I NA NA NA NA NA NA NA NA NA NA Phenanlhrene 3.23E-09 NA NA NA NA NA NA NA NA NA NA NA NA NA NA NA NA NA NA NA NA NA NA Selenium 3.29£.-08 5.71E-03 NA 2.40E-10 4.21E·08 NA NA 153E-10 268E-08 NA NA 515E-11 9.01E-09 NA NA 1.03E·l0 180E-08 NA NA 103E-10 1.80E-08 NA NA Silver 189E-08 NA NA NA NA NA NA NA NA NA NA NA NA NA NA NA NA NA NA NA NA NA NA Tetrachlorodlbenzofuran NA 114E-08 1 33E"04 NA NA NA NA NA NA NA NA NA NA NA NA NA NA NA NA NA NA NA NA
-Telrachlorodibenzo-p·dioxin NA 1.14E-08 1.33E"05 NA NA NA NA 11~ NA NA NA NA NA NA NA NA NA NA NA NA NA NA NA T €trachloroelh lene 2.42E-l1 7.74E-02 2.07E-02 177E-13 2.28E-12 7.57E-15 , 56E-16 f4-6E-12 9.66E-15 2.00E-16 3.79E-14 4.89E-13 7.57E-15 1.56E·16 7.57E-14 9.78E-13 7.57E-15 1.56E-16 755E-14 9.76E-13 3.24E-14 6.69E-16 Thallium NA NA NA NA NA NA NA NA NA NA I NA NA NA NA NA NA NA NA NA NA NA NA NA
~-Phale 157E-11 L43E+00 NA 1 15E-13 8.05£-14 NA NA 7.34E-14 5.1-IIE-14 NA NA 2.46E-14 1.72E-14 NA NA 4.93E-14 345E-14 NA NA 4.9.<£-14 3.44E-14 NA NA
NA NA NA NA NA NA NA NA NA NA NA NA NA NA NA NA NA NA NA NA NA NA NA ~~loroe~lene 965E-12 171E-Ol 700E-03 7.05E·14 4.11E·13 3.02E-15 212E-17 450E-14 2.63E-13 3.86E-15 2.70E-17 1.51E-14 882E-14 3.02E-15 2.12E-17 3.02E-14 '-76E-13 3.02E-15 2.12E-1-7 302E-14 1.76E-13 1.29E-14 905E-17 Trifluorochloromelhane NA 2.00E-Ol NA NA NA NA NA NA NA NA NA NA NA NA NA NA NA NA NA NA NA NA NA UranIum 4.22E·07 857E-05 NA 3.09E-09 3.60E-05 NA NA 1 97E·09 2.30E-05 NA NA 6.61E·l0 7.72E-06 NA NA 1.32E·09 154E·05 NA NA 1.32E-09 1 54E·05 NA NA Vanadium NA 2.86E-05 NA NA NA NA NA NA NA NA NA NA NA NA NA NA NA NA NA NA NA NA NA Vin I chloride NA 286E-02 1.54E·02 NA NA NA NA NA NA NA NA NA NA NA NA NA NA NA NA NA NA NA NA Xylenes 3.43E-11 286E-02 NA 251E·13 8.77E-12· NA NA 160E-13 560E-12 NA NA 5.37E-14 1.88E-12 NA NA 107E-13 376E-12 NA NA 107E-13 3.75E·12 NA NA Zinc NA '" NA NA NA NA NA NA NA -·-NA .. NA NA NA NA NA NA NA NA NA NA NA NA
total=- 4.J5E 04 =total 2.57E.(}7
Air concenlrOllion IS derived using an air particulate value of 26 ug/mJ (200S SER background average from monitor AMS-12) multiplied by the soil concentration
NA = not applicable
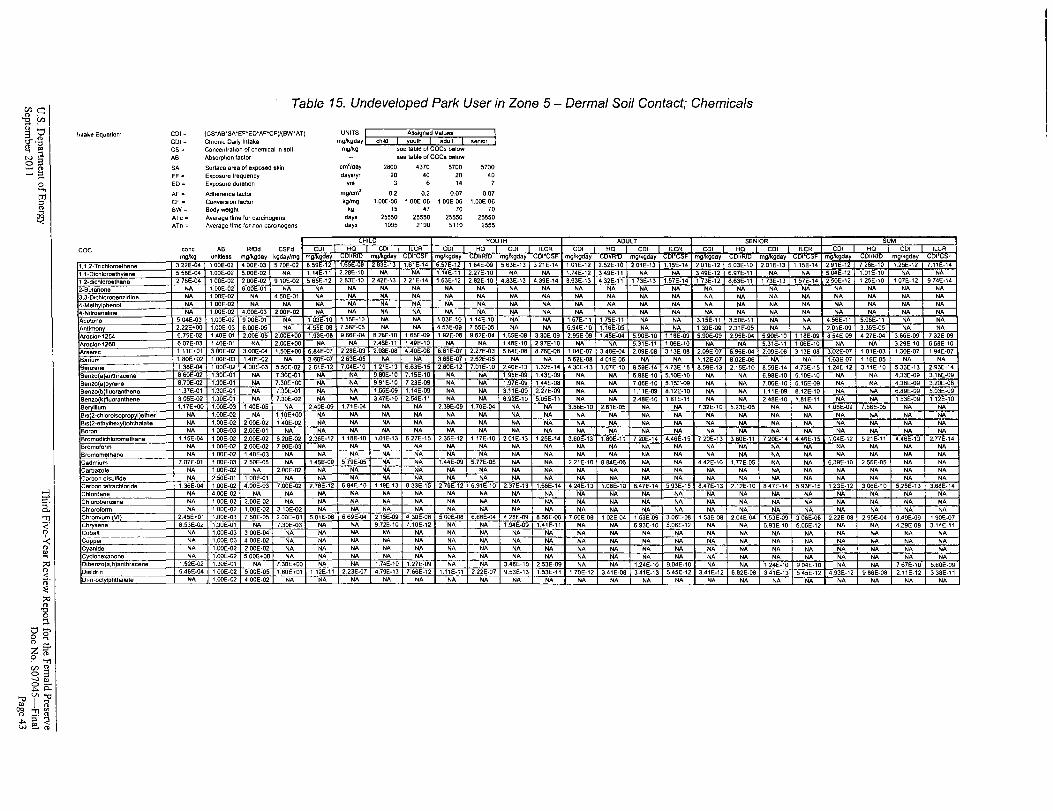
Table 15. Undeveloped Park User in Zone 5 - Dermal Soil Contact; Chemicals
Inlake Equation' COl = (CS"AB"SAOEPEO*APCF)/(BW"AT) UNITS Assl ned Values
COl ... Chronic Dally Intake mg/kgday child Qulh adult
CS:. Concentration of chemical In soil mg/ltg see table 01 COCs bl!!llow
AS Absorption factor see lable of COCs below
SA Surface artl8 of exposed skin cm1/day 2800 4370 5700 5700
EF· Exposure frequency dayslyr 20 40 20 40 ED::: Exposure durallon yco 3 6 '4 7
AF' Adherence laclor mgfcm2 0.2 0.2 0.07 0.07 CF = Conversion leclor kglmg 1.00E-06 1.00E-06 100E-06 1.00E-06 BW= Body weight '0 15 47 70 70 ATc .: Average time lor carcinogens days 25550 25550 25550 25550 ATn ':: Average limo for non-cnfclnogens days 1095 2190 5110 2555
..., ::r [ 'T):;:. r1>
.<: r1>
~ ;:<:I r1>
n''"
H1L~ YOUTH ADULT SENIOR SUM
COC cone AS RIDd CSFd COl HO COl ILCR CDI HQ CDI ILCR CDI HO CDI ILCR COl HQ CDI ILCR CDI HO CDI ILCR mg/kg unltless mglkgday kgday/mg mgl>gdsy CUIiKru mglltgllay C;UI'~", mglkgday 'DIIRI mg/kgllay DI CSF mg kgday UIIR mg kgday I CSF mgfkgday ColiRID mg kgday CDI'CSF mg kgday IR mg/kgday CDI~",
1.1.2-Trlchloroethane 3.22E-04 100E-02 400E·03 570E-0' 6.59 -1 1.65E-09 2.63E-13 1.61E-14 6.57E-12 164E-09 563E-13 321E-14 1.01E-12 2.52E-1 .01E-1 1.15E-14 2.01E-12 5.03E-10 2.01E-13 115E-14 2.91E-12 728E·l0 1.25E·12 7.11E-14
1.1-Dichloroeth lene 558E-04 1.00E-02 5.00E·02 NA 1.14E-11 2.28E·10 NA NA 1.14E-11 2.27E·l0 NA NA 1.74E-12 349E-l1 NA NA 3.49E-12 6.97E-11 NA NA 5.04E-12 1.Q1E·l0 NA NA
1.2-dichloroethane 276E-04 100E·02 2.00E-02 910E-02 565E-12 2.83E-l0 2.42E-13 221E-14 5.63E·12 2.82E-l0 4.83E-13 4.39E-14 8.63E-13 4.32E·l1 173E_13 1.57E-14 173E-12 8.63E-11 173E-13 157E-14 250E-12 125E-1O 107£-12 974E-14
2-Butanona NA 1.00E·02 6.00E-Ol NA NA NA NA NA NA NA NA NA NA NA NA NA NA NA NA NA NA NA NA NA
3.3-Dlchlorobanzidina NA 100E-02 NA 4.50E-Ol NA NA NA NA NA NA NA NA NA NA NA NA NA NA NA NA NA NA NA NA
4-Meth~lphanol NA 100E-02 NA NA NA NA NA NA NA NA NA NA NA NA NA NA NA NA NA NA NA NA NA NA
4-Nltroanahne NA 1.ooE-02 4.00E-03 2.00E-02 NA NA NA NA NA NA NA NA NA NA NA NA NA NA NA NA NA NA NA NA
Acetone 5.04E-03 1.00E-02 900E-Ot NA 103E-l0 1.1SE-l0 NA NA 1.03E-10 114E-10 NA NA 157E·l1 175E-l1 NA NA 3.15E·11 3.50E-11 NA NA 4.56E-l1 5.06E-l1 NA NA
Antimony 2.22E+00 1.00E·03 6.00E·05 NA 4.55E-09 758E-05 NA NA 4.53E·09 7.55E-05 NA NA S.94E·10 1.16E-05 NA NA 1.39E-09 2.31E-05 NA NA 2.01E·09 3.3SE-05 NA NA
Aroclor-1254 6.75£-02 1.40E-01 2.00E-05 2.00E+00 1.93E-08 9.66E-04 8.28E-10 1.6SE-09 1.92E-08 9.62E-04 1.65E-09 3.30E-09 2.95E-09 1.48E-04 5.90E-10 1.18E-09 5.90E-09 2.95E-04 5.9OE-l0 1.18E-09 854E-09 4.27E·04 3.66E-09 7.32E-09
Aroclor·1260 607E-03 140E·Ol NA 2.00E+00 NA NA 7.45E·l1 , 49E·10 NA NA 148E-l0 297E-l0 NA NA 5.31E-11 1.06E-l0 NA NA 5.31E-11 1.06E-l0 NA NA 3.29E-l0 6.58E-10
Arsenic 1.11E+01 3.00E-02 3.00E-04 1.50E+00 6.84E-07 2.28E-03 2.93E-08 4,40E-08 6.81E-07 2.27E-03 5.84E-08 8.76E-08 1.04E-07 348E-04 2.09E-08 3.13E-08 2.09E-07 6.96E-04 2.09E·08 3.13E-08 3.02E-07 1.01E-03 1.30E·07 194E-07
Barium 1.80E+02 100E-03 140E-02 NA 3.66E-07 263E-05 NA NA 3.66E-07 2.62E-05 NA NA 5.62E-08 401E-06 NA NA 1.12E-07 8.02E-06 NA NA 1.63E-07 1.16E-05 NA NA
Benzene 1.38E-04 100E-02 4.00£·03 5.50E·02 2.81E·12 7.04E-10 1.21E-13 6.63E-15 2.80E-12 7.01E·10 2.40E-13 1.32E-14 4.30E-13 1.07E-l0 8.59E-14 4.73E-15 8.59E-13 2.15E-l0 8.59E·14 4.73E-15 1.24E-12 3.11E-l0 5.33E-13 2.93E·14
Senzo a)enlhracene B 60E-02 1.30E-01 NA 7.30E-0' NA NA 9.80E-l0 7.15E-l0 NA NA 195E-09 1.43E-09 NA NA 6.98E-l0 5.10E-l0 NA NA 6.9SE-l0 S.10E-10 NA NA 4.33E-09 3.16E-09 Benzo B)pyrene 8.70E-02 1.30E-01 NA 7.30E+00 NA NA 9.91E-l0 723E-09 NA NA 1.97E-09 144E-08 NA NA 7.06E-l0 5.15E-09 NA NA 7.06E-l0 5.15E-09 NA NA 4.38E-09 3.20E-08
Benzo b~luoranthene 1.37E-Ol '.30E·0' NA 7.30E-01 NA NA 1.56E-09 1.14E-09 NA NA 3.11E-09 2.27E-09 NA NA 1.11E-09 8.12E-l0 NA NA 1.11E-09 8.12E-l0 NA NA 6.89E-09 5.03E-09
8enzo(k fluoranthene 305E-02 1.30E·01 NA 7.30E-02 NA NA 3.47E·10 2.54E-l1 NA NA 6.92E-tO 5.05E-11 NA NA 2.48E-10 181E-11 NA NA 248E-l0 1.81E-l1 NA NA 153E-09 112E-l0
Beryllium 1.17E+00 1.00E-03 1.40E-05 NA 2.40E-09 1.71E-04 NA NA 2.39E-09 1.70E-04 NA NA 3.66E-10 2.61E-05 NA NA 7.32E-10 5.23E·05 NA NA 1.0SE-09 7.SSE-05 NA NA
BIS 2-chloroisopropyl}elher NA '.00E·02 NA 1.10E+00 NA NA NA NA NA NA NA NA NA NA NA NA NA NA NA NA NA NA NA NA BIS 2-ath Ihex oI)phlhalate NA 1.00E-02 2.00E·02 140E-02 NA NA NA NA NA NA NA NA NA NA NA NA NA NA NA NA NA NA NA NA
Boron NA 100E-03 2.00E-01 NA NA NA NA NA NA NA NA NA NA NA NA NA NA NA NA NA NA NA NA NA
Bromodichloromethane 1.15E-04 100E-02 2.00E-02 6.20E·02 2.36E-12 118E-10 1.01E-13 6.27E-15 2.35E-12 1.HE-l0 201E-13 1.25E-14 3.60E-13 1.80E-l1 720E-14 4.46E-15 720E-13 360E-l1 7.20E-14 4.46E-15 1.04E-12 521E-l1 4.46E-13 2.77E·14 Bromoform NA 100E-02 2.00E-02 7.90E-03 NA NA NA NA NA NA NA NA NA NA NA NA NA NA NA NA NA NA NA NA Bromomethane NA 100E-02 1.40E-03 NA NA NA NA NA NA NA NA NA NA NA NA NA NA NA NA NA NA NA NA NA
Cadmium 7.07E-Ot 1.00E-03 2.50E-OS NA 1.45E-09 5.79E-05 NA NA 1.44E-09 5.77E-05 NA NA 2.21E·10 8.84E-06 NA NA 442E·10 1.77E·05 NA NA 6.39E-l0 2.S6E-05 NA NA Carbazole NA 1.00E-02 NA 2.00E-02 NA NA NA NA NA NA NA NA NA NA NA NA NA NA NA NA NA NA NA NA Carbon disullide NA 2.50E-Ol 100E·Ol NA NA NA NA NA NA NA NA NA NA NA NA NA NA NA NA NA NA NA NA NA Cerbon tetrachlOride 1.36E·04 1.00E-02 4.ooE-03 7.00E-02 2.76E·12 6.94E-10 1.19E-13 833E-15 2.76E-12 6.91E-l0 2.37E-13 1.6SE-14 4.24E-13 1.06E-l0 8.47E-14 5.93E-15 8.47E-13 2.12E·10 847E-14 5.93E-15 1.23E-12 3.06E·10 5.25E·13 3.68E·14 Chlordane NA 4.00E-02 NA NA NA NA NA NA NA NA NA NA NA NA NA NA NA NA NA NA NA NA NA NA Chlorobenzene NA 100E-02 2.00E-02 NA NA NA NA NA NA NA NA NA NA NA NA NA NA NA NA NA NA NA NA NA Chloroform NA 100E-02 1.00E-02 310E-02 NA NA NA NA NA NA NA NA NA NA NA NA NA NA NA NA NA NA NA NA Chromium VI 2.45E+Ol 1.00E-03 750E-05 2.00E+Ol 5.01E-08 669E-04 215E-09 430E·08 5.00E-06 6.66E-04 428E-09 8.56E-08 7.S6E·09 1 02E-04 1.53E-09 3.06E-08 153E-08 2.04E-04 1.53E-09 306E-08 222E-08 295E-04 9.49E-09 190E·07 Chrysene 8.53E-02 1.30E-01 NA 1.301::-03 NA NA 9.72E-to I.l0E-12 NA NA 1.94E-09 1.41E-11 NA NA 6.93E-l0 5.06E-12 NA NA S.93E-l0 5.06E-12 NA NA 4.29E-09 3.14E-11 Cobalt NA 1.00E-03 3.00E-04 NA NA NA NA NA NA NA NA NA NA NA NA NA NA NA NA NA NA NA NA NA Co or NA 1.00E·03 4.00E-02 NA NA NA NA NA NA NA NA NA NA NA NA NA NA NA NA NA NA NA NA NA Cyanide NA 1.00E·02 2'.00E-02 NA NA NA NA NA NA NA NA NA NA NA NA NA NA NA NA NA NA NA NA NA Cxclohexanone NA 1.00E-02 5.00E+00 NA NA NA NA NA NA NA NA NA NA NA NA NA NA NA NA NA NA NA NA NA Dlbenzo a.h anlhracene 1.52E-02 1.30E-01 NA 7.30E+00 NA NA 1.74E-10 1.27E-09 NA NA 3.46E·l0 2.53E-09 NA NA 1.24E·l0 9.04E·l0 NA NA 1.24E-10 904E·l0 NA NA 767E-10 5.60E·09 Dieldrin 5.46E-04 100E-02 5.00E-05 1.60E+01 112E-11 2.23E-07 4.79E·13 7.66E-12 1.11E-11 2.22E-07 9.53E-13 1.53E-11 170E-12 3.41E·08 341E-13 5.45E-12 3.41E-12 6.62E-08 341E-13 545E-12 4.93E-12 986E-08 2.11E-12 338E-11 Di·n·oct ,Iphthalate NA 1.00E-02 400E-02 NA NA NA NA NA NA NA NA NA NA NA NA NA NA NA NA NA NA NA NA NA
~ ;:<:I r1>
"0 0 ::I.
00' o ...." ~ z::r o r1> . 'T)
C/l'"03 -.l",0 .. 0. v.",
I ~ ()q'" '" 'T)'"
'".. s· ~ W ~r1>
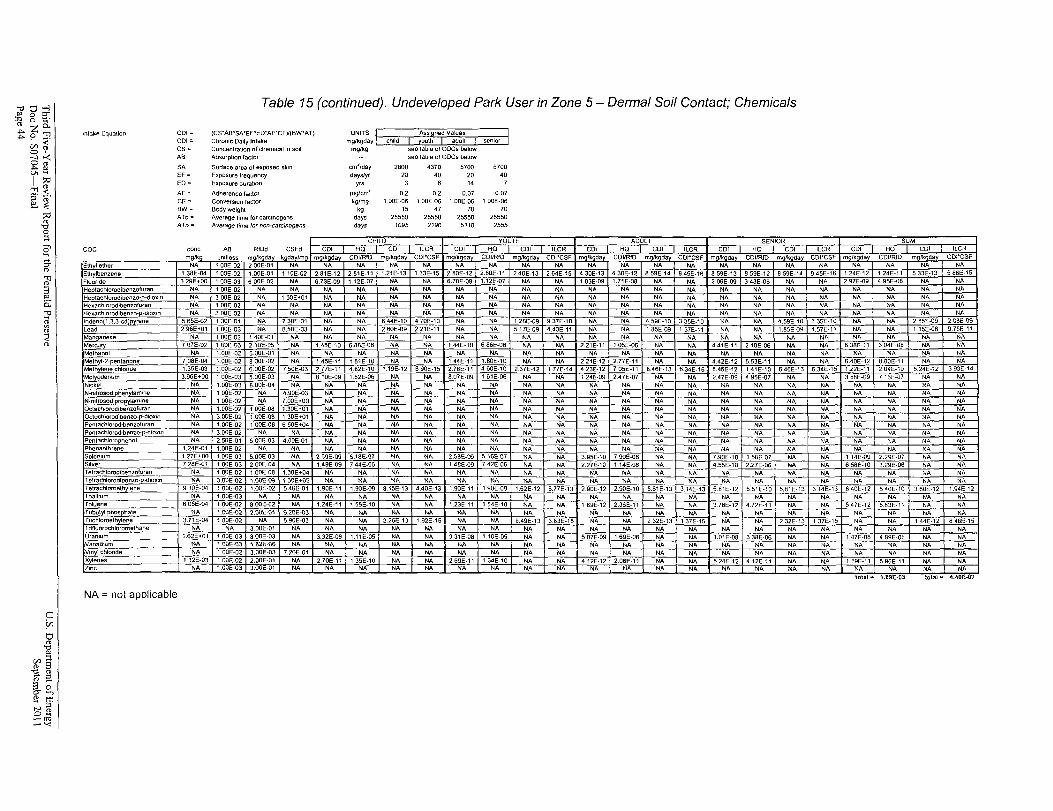
Table 15 (continued), Undeveloped Park User in Zone 5 - Dermal Soil Contact; Chemicals
Intake Equation. COl = (CS'AS'SA'EF'ED"AF'CF)/(BW'AT) UNITS Assl ned Values
COl = Chronic Dally Intake mgfkgday child oulh adult senior
GS =' Concentration of chemical In 5011 mg/kg see lable of COGs below
AS Absorption fadar see lable of COGs below
SA EF,
Sufiace area 01 exposed skin
Exposure frequency
cm 2/day
days/yr 2800
20 4370
40 5700
20 5700
40 ED == Exposure duration yes 3 6 14 7
AF '" Adherence factor mg/cm2 0.2 0.2 0.07 0.07 CF == ConverSion factor kg/mg 1.00E-06 1.00E-06 1.00E-06 1 DOE-06 BW == BOdy weight kg 15 47 70 70 ATe = Average time for carcinogens days 25550 25550 25550 25550 ATn = Ave/age time for non-carcinogens days 1095 2190 5110 2555
CHILD YOUTH ADULT HQSETOR
CD -1
SUM
COC cone AS RfDd CSFd COl HQ COl ILCR COl HQ CDI ILCR COl HQ COl ILCR CDI ILCR COl HO CDI IlGR mgiko umtless m '''2<'''l' kgd."l""'lL m!Jlkgda CDI/RID mglkgdav CD1"CSF mg/kqday CDllRfD mQlkgd?lY CDI·CSF mg/kQda CDlfRfD mQ/kQdav CDt~CSF "'lLikgda}' CD1IRfD mgikgda,. CDI'CSF mglkQday COl/RIO m IkQday CDl'CSF
E\h I ether NA 100E-02 2 00E-01 NA NA NA NA NA NA NA NA NA NA NA NA NA NA NA NA NA NA NA NA NA
Elh Jbenzene 1.38E-04 100E-02 1.00E-01 1.10E-02 281E-12 2.81E-11 1.21E-13 133E-15 280E-12 2.80E-11 2.40E-13 2.64E-15 4.30E-13 (l30E-12 8.59E-14 9.45E-16 8S9E-13 859E-12 859E-14 945E-16 124E·12 124E-11 533E-13 586E:-15
Fluoride 3.29E+OO 100E-03 6 00E-02 NA 6.73E-09 1.12E-07 NA NA 6.70E-09 1.12E-07 NA NA 1.03E-09 1.71E-08 NA NA 206E-09 343E-08 NA NA 297E-09 49SE-OB NA NA
Heplachlorodibenzo!uran NA 1 OOE-02 NA NA NA NA NA NA NA NA NA NA NA NA NA NA NA NA NA NA NA NA NA NA
Heplachlorodibenzo:e~dioxln NA 300E-02 NA 130E+01 NA NA NA NA NA NA NA NA NA NA NA NA NA NA NA NA NA NA NA NA Hex3chlorodibenzoluran NA 1.00E-02 NA NA NA NA NA NA NA NA NA NA NA NA NA NA NA NA NA NA NA NA NA NA Hexachlorodibenzo-p-dIQx,n NA J.00E-02 NA NA NA NA NA NA NA NA NA NA NA NA NA NA NA NA NA NA NA NA NA NA Indeno 1,2.3-cd)pyrene S.6SE-02 1.30E-01 NA 730E-01 NA NA 644E-10 470E-1O NA NA 1 28E-09 937E-10 NA NA 4.59E-10 335E-10 NA NA 4.59E-10 335E-l0 NA NA 285E-09 20BE-09
Lead 2.96E+Ol 1.00E-03 NA 8.50E-03 NA NA 260E-09 221E-11 NA NA 5 HE-09 4.40E-11 NA NA 1 85E-09 157E-11 NA NA 1.85E-09 1.57E·11 NA NA 1.15E-08 9.75E-l1 ~ ~
Manganese NA 1.00E·03 1.40E-01 NA NA NA NA NA NA NA NA NA NA NA NA NA NA NA NA NA NA NA NA NA-Mercury 707E-02 100E·D3 2.10E-05 NA 1.45E·10 6.88E-06 NA NA 144E-l0 686E-06 NA NA 2.21E-11 105E-06 NA NA 441E-11 210E-06 NA NA 6.38E·11 304E·06 NA NA
Methanol NA 1.00E-02 5.00E-01 NA NA NA NA NA NA NA NA NA NA NA NA NA NA NA NA NA NA NA NA NA Meth 1-2· entanone 708E-04 1.00E-02 8 00E-02 NA 1.45E-11 181E-10 NA NA 144E·11 1.80E-10 NA NA 221E-12 2.77E-11 NA NA 4.42E-12 5.53E-11 NA NA 6.40E-12 8.00E-11 NA NA Meftl lene chlonde 1.35E-03 1.00E-02 6.00E-02 7.50E-03 2.77E-11 4.62E-10 1.19E-12 890E·15 2.76E-11 460E-10 2.37E-12 177E-14 423E-12 705E-l1 8.46E-13 6.34E·15 8.46E-12 141E-10 8.46E-13 6.34E-15 1.22E-11 2.04E-10 5.24E-12 393E-14
Mol bdanum 3.96E+OO 1 00E-03 5.ooE-03 NA 8.10E-09 1.62E-D6 NA NA 8.07E-09 161E-06 NA NA 1.2-4E-09 2.47E-07 NA NA 2.47E-09 495E-cii NA NA 358E-09 716E-07 NA NA Nickel NA 1.00E-03 8.00E-04 NA NA NA NA NA NA NA NA NA NA NA NA NA NA NA NA NA NA NA NA NA N-nlfrosodJp~en lamme NA 1 00E-02 NA 4.S0E-03 NA NA NA NA NA NA NA NA NA NA NA NA NA NA NA NA NA NA NA NA N-n,trosodl ropylamine NA 1 00E-02 NA 7.00E+00 NA NA NA NA NA NA NA NA NA NA NA NA NA NA NA NA NA NA NA NA Octachlorodibenzofuran NA 1.00E-02 1 DOE-OS 1.30E+01 NA NA NA NA NA NA NA NA NA NA NA NA NA NA NA NA NA NA NA NA Oclochlorodibenzo-p-dioxin NA 3.00E·02 100E-08 1 30E+01 NA NA NA NA NA NA NA NA NA NA NA NA NA NA NA NA NA NA NA NA Pentachlorod,benzofuran NA 1.00E·02 100E-08 650E+04 NA NA NA NA NA NA NA NA NA NA NA NA NA NA NA NA NA NA NA NA Pentachlorodlbenzo-p-dioxln NA 3.00E·02 NA NA NA NA NA NA NA NA NA NA NA NA NA NA NA NA NA NA NA NA NA NA Pentachlorophenol NA 2.50E-01 500E-03 4.00E-Ol NA NA NA NA NA NA NA NA NA NA NA NA NA NA I NA NA NA NA NA NA Phenanlhrene 1.24E-01 1.00E-02 NA NA NA NA NA NA NA NA NA NA NA NA NA NA NA NA NA NA NA NA NA NA Selen,um 1.27E+00 1.00E-03 500E·03 NA 259E-09 5.18E-07 NA NA 2.58£-09 5.16E-07 NA NA 3.95E-10 790E-08 NA NA 7.90E-l0 158E·07 NA NA 114E-09 2.2SE-07 NA NA Silver 7.28E-01 1.00E-03 2.00E-04 NA 1.49E-OS 7.44E-06 NA NA 1.48E·09 7.42E-06 NA NA 2.27E-l0 1.14E-06 NA NA 4.55E-10 2.27E-06 NA NA 658E-10 3.29E-06 NA NA T etrachlorodi benzofura n NA 1.00E-02 1.00E-OS 1.30E+04 NA NA NA NA NA NA NA NA NA NA NA NA NA NA NA NA NA NA NA NA TelrClchlorodibenzo -dIoxin NA 3.00E-02 1.00E-09 1.30E+05 NA NA NA NA NA NA NA NA NA NA NA NA NA NA NA NA NA NA NA NA Tetrachlofoeth lene 9.30E-04 100E-02 1.00E-02 S 40E-Ol 1.90E-l1 1.S0E-OS B.1SE-13 4.40E-13 1.90E·11 1 SOE-09 1.62E-12 B.77E-13 2.90E-12 2.S0E-10 5.B1E-13 J.14E-13 5.81E-12 5.81E-10 5.81E·13 J 14E-13 8.40E-12 840E-10 360E-12 1.94E-12 Thallium NA 1.00E-03 NA NA NA NA NA NA NA NA NA NA NA NA NA NA NA NA NA NA NA NA NA NA Toluene 6.0SE·04 1 00E-02 800E·02 NA 1.24E-11 155E-10 NA NA 1.23E-ll 154E-10 NA NA 18SE-12 2.36E-l1 NA NA 3.78E-12 4.72E-11 NA NA 5.47E-12 6.83E-11 NA NA Tilburyl phosphate -~ -f"""OOE-02 200E-01 9.20E-03 NA NA NA NA NA NA NA NA NA NA NA NA NA NA NA ~A NA NA NA NA Tnchloroeth lene 3.71E-04 1 00E-02 NA 5.90E-OJ NA NA 3.26E 13 1.92E-15 NA NA 6.49E-1J 3.83E-15 NA NA 2 J2E-1J 137E-15 NA NA 232E-13 137E-15 NA NA 144E-12 84BE-15 Trinuorochloromethane NA NA J OOE-Ol NA NA NA NA NA NA NA NA NA NA NA NA NA NA NA NA NA NA NA NA NA Uran,um 1.62E+01 1.00E-03 300E-03 NA 3.32E-08 1.11E-05 NA NA 331E-08 1.10E-05 NA NA 507E-OS 169E-06 NA NA 1.01E-08 J 38E·06 NA NA 147E-08 48SE-06 NA NA VanadIum NA 100E-03 .., B2E-OG NA NA NA NA NA NA NA NA NA NA NA NA NA NA NA NA NA NA NA NA NA-VInyl chlonde NA 1 00E-02 3 DOE-OJ 7.20E·01 NA NA NA NA NA NA NA NA NA NA NA NA NA NA NA NA NA NA NA NA Xylenes 132E-03 1.00E-02 2.00E-01 NA 2.70E-11 135E-l0 NA NA '169E-l1 134E-10 NA NA 4.12E-12 2.06E-l1 NA NA 8.24E·12 4.12E-11 NA NA 119E-ll 596E-11 NA NA Zinc NA 1.00E·03 3.00E-Ol NA NA NA NA NA NA NA NA NA NA NA NA NA NA NA NA NA NA NA NA NA
=total 1.B9E·03 total 0:. 4.40E-07
NA = not applicable
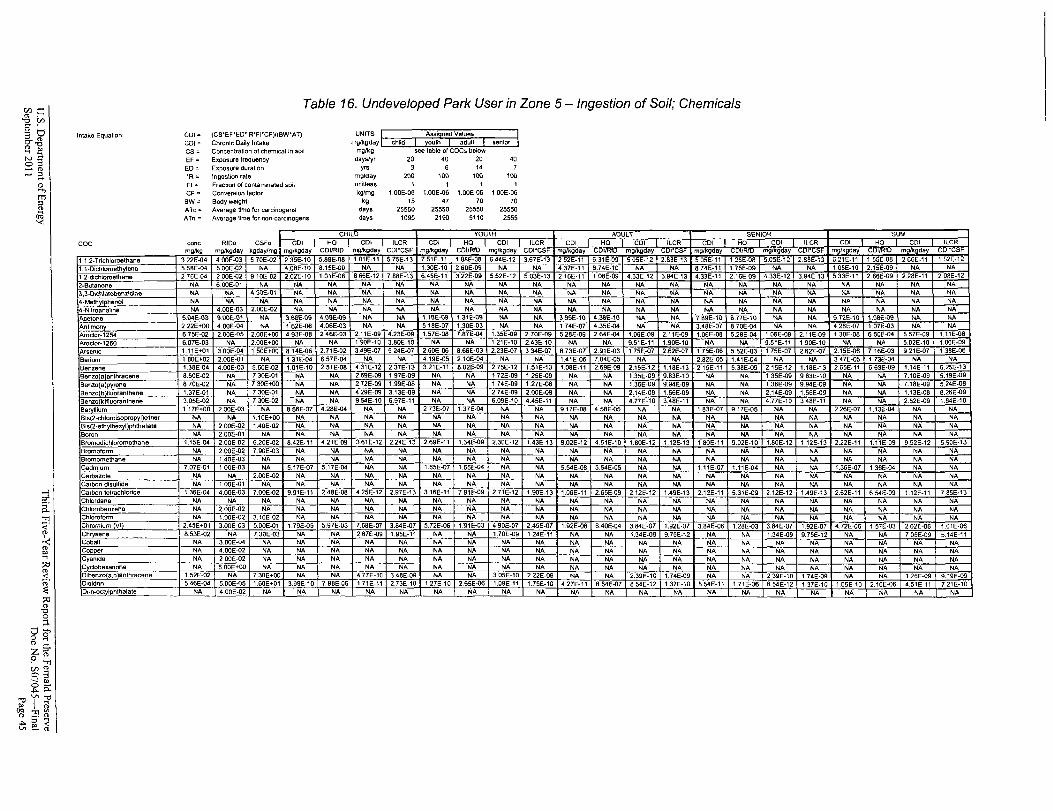
Table 16" Undeveloped Park User in Zone 5 -Ingestion of Soil; Chemicals
Intake Equation: COl =
COl = (CS"EF"EO"IR"FI"CF)'(BW"AT) Chronic Daily Intake
UNITS Illy/kyUdy child
Ass; ned Values
oulh adull senior
CS = Concentration of chemical In soil mg/kg see table or COGs below EF = Exposure frequency days/V' 20 40 20 40
ED 0 Exposure duration y,. 3 6 14 7
IR 0 Ingestion fate mg/day 200 100 100 100 FI ;;; Fraction of contaminated soil unille55 1 1 1
CF = Conversion factor kg/mg 1.00E"06 1.00E-06 1.00E-06 1 OOE·06 BW= Body weight kg 15 47 70 70 ATc = Average lime for carcinogens days 25550 25550 25550 25550 ATn = Average lime for non-carCinogens days 1095 2190 5110 2555
CHILD YOUTH ADULT SENIOR SUM
COC cone RIDo CSFo mg~~~ay I CO~~fD I mg;~~8Y I C~~;C~F COl HO COl ILeR COl HQ COl ILeR COl HQ COl lleR COl HQ WI Ilr:R mglkg mg/kgday kgday/mg mg/kgday COl/RID mg/kgday COI"C," mg/kgday _"'LJ"~'u m9/Kgaay ",u,"",," mg/t":goay l,.;ul/t'<.IU m~y mg/kgday CDI/Rf mglkgday CPI"C'
1 1.2-Trichloroethane 3.22E-04 400E-03 5.70E-02 235E-10 5.S9E-OB ., 01E-11 575E-n 7 !i1F-11 1 SAF-OB 644E-12 3.67E-13 252E-11 6.31E:09 505E12 2.BBE 13 5.05E·11 1 26E-OB 5.05E-12 2.88E-13 6.21E-11 1 55(-08 2 GGE·11 102[-12
1.1-0ichloroeth lene 5.5BE-04 S.OOE-02 NA 4.0BE-10 B.1SE-09 NA NA 1.30E-10 2.60E-D9 NA NA 4.37E-11 B.74E-10 NA NA 874E-11 1.75E-09 NA NA 1.0BE-10 2.1SE-09 NA NA
1,2-dichloroelhane 276E-04 200E-02 9.10E-02 2.02E-l0 1.D1E-08 B 66E-12 7.BBE-13 S,45E-11 3.22E-09 5.52E-12 5.03E-13 216E-11 10BE-09 4.33E-12 3.94E-13 4.33E-11 2.16E-09 4.33E-12 3.94E-13 5.33E-11 2.66E-09 2.2BE-11 20BE-12
2-Bulanone NA 6.0DE-01 NA NA NA NA NA NA NA NA NA NA NA NA NA NA NA NA NA NA NA NA NA
3,'3-0\chlorobenzidine NA NA -450E.-01 NA NA NA NA NA NA NA NA NA NA NA NA NA NA NA NA NA NA NA NA
4-MBthyll hetr10l NA NA NA NA NA NA NA NA NA NA NA NA NA NA NA NA NA NA NA NA NA NA NA
4-Nllroanahne NA 400E-03 2.00E-02 NA NA NA NA NA NA NA NA NA NA NA NA NA NA NA NA NA NA NA NA
Acetone 5.04E-03 9.00E-Ol NA 3.6BE-09 4.09E-09 NA NA '.lBE-09 1.31E.-09 NA NA 3.95E-l0 4.38E-10 NA NA 7 B9E-'O B.71E-10 NA NA 9.12E-10 1.0BE-09 NA NA
Antimony 222E+OO 4.00E-04 NA 1 62E-06 4.06E-03 NA NA 51BE-07 1.30E-03 NA NA 174E-07 4.35E-04 NA NA 3.4BE-07 B.70E-04 NA NA 4.28E-07 1.07E-03 NA NA
Aroclor-1254 6.7SE-02 2.DOE-OS 2.00E+OO 493E-08 2,46E-03 2.11E-09 4.23E-09 1.S7E-OB 7.B7E-04 1.3SE-09 2.70E-09 S.2BE-09 2.S4E-04 1.0SE-09 2.llE-09 1.06E-OB S.2BE-04 1 OSE-09 2.llE-09 1.30E-OB S SOE-04 S.S7E-09 1.llE-OB
Aroclor-12S0 6.07E-03 NA 2.00E+OO NA NA 1.90E-l0 3.BOE-l0 NA NA 1.21E-l0 2.43E-l0 NA NA 9.S1E-1l 1.90E-10 NA NA 9.S1E-1l '.90E-10 NA NA S.02E-10 1.00E-09
Arsenic 1.11E+O' 3.00E-04 1 SOE+OO 8.14E-OS 2.71E-02 3.49E-07 524E-07 2.60E-06 B 66E-03 2.23E-07 334E-07 B.73E-07 2.91E-03 1.75E-07 2.62E-07 1. 75E-Q6 5.82E-03 1.75E-07 2.62E-07 2.1SE-Q6 7.1SE.-03 9.21E-07 1.3BE-06
Barium 1 80E+02 2.00E-01 NA 131E-04 6.S7E-04 NA NA 4.19E-05 2.10E-04 NA NA 1.41E-05 7.04E-OS NA NA 2.B2E-05 1.41E-04 NA NA 347E-05 1.73E-04 NA NA
Benzene 1.3BE-04 4.00E-03 5.50E-02 1.01E-10 2.S1E-08 4.31E-12 237E-13 3.21E-11 B.02E-09 2.75E-12 1.51E-13 1.0BE-11 2.69E-09 2.1SE-12 1.1BE-'3 2l5E-l1 5.3BE-09 2.15E-12 1.1BE-13 2.6SE-l1 6.63E-09 1.l4E-ll S.2SE-13
Benzo a anthracene B.60E-02 NA 730E-01 NA NA 2.69E-09 197E-09 NA NA 1.72E-09 , 25E-09 NA NA 1.3SE-09 9.B3E-10 NA NA 1 3SE-09 983E-10 NA NA 7.10E-09 S.19E-09
Benzo a)pyrene B 70E-02 NA 730E+OO NA NA 272E-09 1.99E-OB NA NA 174E-09 1.27E-08 NA NA 1.36E-09 9.94E-09 NA NA 1.3SE-09 9.94E-09 NA NA 7.1BE-09 S.24E-OB
Benzo b fiuoranlhene 1.37E-Ol NA 7.30E-01 NA NA 4.29E-09 3.l3E-OQ NA NA 274E-09 2.00E-09 NA NA 2.14E-09 1.56E-09 NA NA 2.14E-09 1.56E-09 NA NA 1.l3E-OB B.26E-09
Benzo k fluoranthene 3.05E-02 NA 7.30E-02 NA NA 9.54E-'0 6.97E-11 NA NA 6.09E-'0 4.4SE-l1 NA NA 4.77E-10 3.4BE-ll NA NA 4.77E-l0 348E-11 NA NA 2.52E-09 1.B4E-10
Beryllium 1.l7E+OO 2.00E-03 NA B S5E-07 4.2BE-04 NA NA 273E-07 1.37E-04 NA NA 9.17E-08 4.58E-OS NA NA 1 83E-07 917E-OS NA NA 2.26E-07 1.13E-04 NA NA
Bls(2-chloroisopropyl ether NA NA 1.10E+OO NA NA NA NA NA NA NA NA NA NA NA NA NA NA NA NA NA NA NA NA
Bis(2-eth Ihexyl phthalate NA 2.00E-02 1.40E-02 NA NA NA NA NA NA NA NA NA NA NA NA NA NA NA NA NA NA NA NA
Boron NA 2.00E-01 NA NA NA NA NA NA NA NA NA NA NA NA NA NA NA NA NA NA NA NA NA Bromodichloromelhane 1.l5E-04 2.00E-02 6.20E-02 B.42E-1l 4.21E-09 3.S1E-12 2.24E-13 2.69E-l1 1.34E-09 2.30E-12 1.43E-13 9.02E-12 4.51E-l0 1.80E-12 1.l2E-13 1 BOE-ll 9.02E-10 1.BOE-12 1.12E-13 2.22E-11 1.llE-09 9.52E-12 590E"'3 Bromoform NA 2.00E-02 7.90E-03 NA NA NA NA NA NA NA NA NA NA NA NA NA NA NA NA NA NA NA NA Bromomelhane NA 1.40E-03 NA NA NA NA NA NA NA NA NA NA NA NA NA NA NA NA NA NA NA NA NA Cadmium 7.07E-01 100E-03 NA 5.17E-07 S.17E-04 NA NA 1.65E-07 1.65E-04 NA NA 5.54E-OB 5.54E-05 NA NA 1.l1E-07 1.llE-04 NA NA 1.36E-07 1.3SE-04 NA NA Carbazole NA NA 2.00E-02 NA NA NA NA NA NA NA NA NA NA NA NA NA NA NA NA NA NA NA NA Carbon disulfide NA 100E-Ol NA NA NA NA NA NA NA NA NA NA NA NA NA NA NA NA NA NA NA NA NA Carbon tetrachloride 1.3SE-04 4.00E-03 7.00E-02 9.91E-11 2.4BE-OB 4.2SE-12 2.97E-13 3.16E-1l 791E-09 2.71E-12 1.90E-13 1.0SE-ll 2.65E-09 2.l2E-12 1.49E-13 2.l2E-l1 5.31E-09 2.12E-12 1.49E-13 2.62E-ll 6.54E-09 1.12E-ll 78SE-13 Chlordane NA NA NA NA NA NA NA NA NA NA NA NA NA NA NA NA NA NA NA NA NA NA NA Chlorobenzene NA 2.00E-02 NA NA NA NA NA NA NA NA NA NA NA NA NA NA NA NA NA NA NA NA NA Chloroform NA 1.00E-02 3.10E-02 NA NA NA NA NA NA NA NA NA NA NA NA NA NA NA NA NA NA NA NA Chromium 'VI' 2.45E+Ol 3.00E-03 5.00E-Ol 1.79E-05 5.971:-U3 7.SBE-07 3.B4E-07 5.72E-OS 1.B,E-03 4.90E-07 2.45E-07 1.92E-06 S.40E-04 3.ME-07 1.92E-07 3.B4E-06 1.2BE-03 3.B4E-07 1.92E-07 '.72E-06 1 57E-03 2.02E-06 1.01E-06 Chrysene B.53E-02 NA 7.30E-03 NA NA 267E-09 1.95E-11 NA NA 1.70E-09 , 24E-1l NA NA 1.34E-09 9.75E-12 NA NA 1.34E-09 9.7SE-12 NA NA 70SE-09 5.l4E-ll Cobalt NA 3.00E-04 NA NA NA NA NA NA NA NA NA NA NA NA NA NA NA NA NA NA NA NA NA Copper NA 4.00E-02 NA NA NA NA NA NA NA NA NA NA NA NA NA NA NA NA NA NA NA NA NA Cyamde NA 200E-02 NA NA NA NA NA NA NA NA NA NA NA NA NA NA NA NA NA NA NA NA NA C clohaxanone NA 5.00E+OO NA NA NA NA NA NA NA NA NA NA NA NA NA NA NA NA NA NA NA NA NA Dibenzo a,h anthracene 1.52E-02 NA 7.30E+OO NA NA 477E-10 348E-09 NA NA 30SE-10 2.22E-09 NA NA 2.39E-l0 1.74E-09 NA NA 239E-l0 1.74E-09 NA NA , 26E-09 9.l9E-09 Ol91dnn 5.46E-04 5.00E-05 1.60E+Ol 3.99E-l0 79BE-06 171E-1l 2.73E-10 1.27E-10 2.55E-06 1.09E-11 1.75E-l0 4.27E-ll B.54E-07 8.54E-12 1.37E-10 B 54E-11 1.71E-OS B 54E-12 137E·l0 1.05E-10 2.10E-06 4.51E-ll 721E-10 DI-n-oc!llphlhalale NA 4.00E-02 NA NA NA NA NA NA NA NA NA NA NA NA NA NA NA NA NA NA NA NA NA
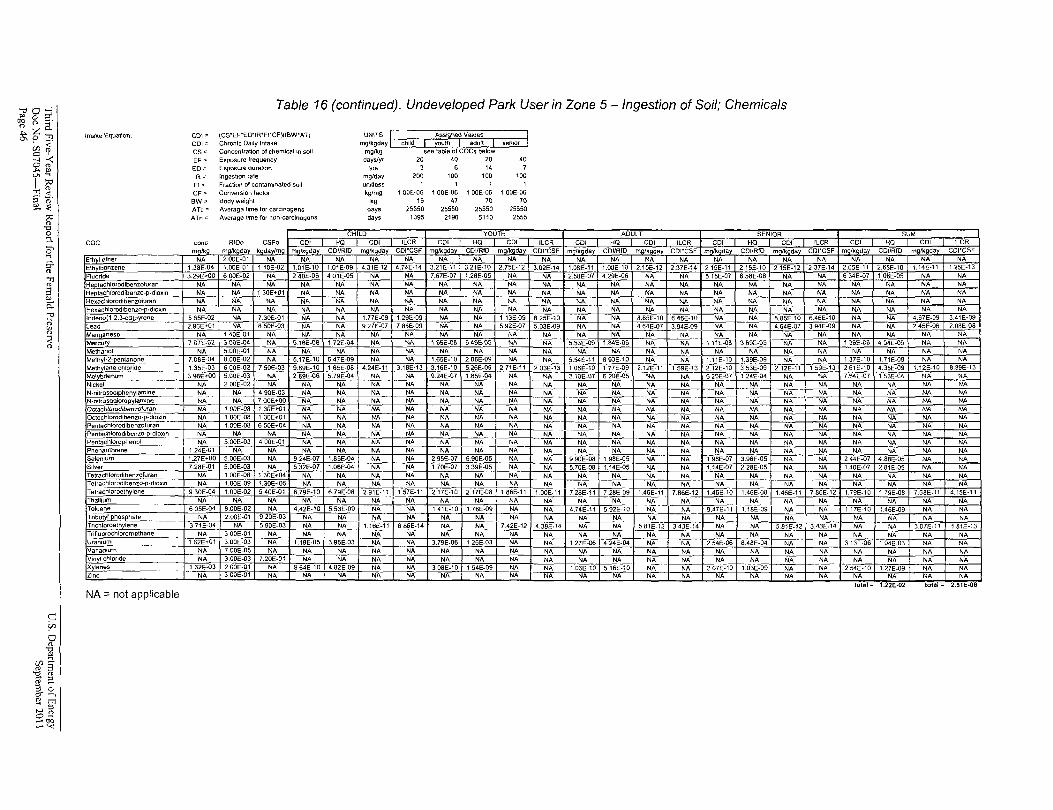
Table 16 (continued). Undeveloped Park User in Zone 5 -Ingestion of Soil; Chemicals
Inla'K.e Equation. COl<=: (CS*EF*E.O"'R*F'"CF}I{BW*AT) UNITS Assi ned Values
COl.:=. Chronic Dally Intake mg/kgday child outh adult
CS> Concentration of chemical In soil mg/kg see lable 01 COCs below EF> Exposure frequency days/yr 20 40 20 40
ED· IR·
Exposure duration Ingesllon rate
yes mg/day 200
6 100
14 100 100
FI :;; Fraction 01 contaminated 5011 unltless 1 1 CF== Conversion factor kg/mg 100E-06 1 OOE-06 1 OOE-06 1 OOE-06
BW' Body weight kg 15 47 70 70 ATe::: Average time for carcinogens days 25550 25550 25550 25550 ATn ::::: Average time for non-carcinogens days 1095 2190 5110 2555
CHILD YOUTH ADULT SENIOR SUM
CDC conC RfOo CSFo COl HQ COl ILCR COl HQ COl ILCR COl HQ COl ILCR COl HQ COl ILCR COl HQ COl ILCR
mglkg mglkgday kgda Img mg/kgday COl/RID mg/kgday COI·CSF mg/kgday COl/RID m Ikgday CD'"CSF mg/kQda COI/RfO mg/kgday CD'"CSF mQ/kgday COI/RfD mq!k.qday CDI"CSF mgfkgda CDIfRfD m Ik day CDI"CSF
Elh I elher NA 2.00E·01 NA NA NA NA NA NA NA NA NA NA NA NA NA NA NA NA NA NA NA NA NA Ethylbsnzene 1.3BE-04 1.00E-01 1.10E-02 1.01E-l0 1.01E·09 4.31E-12 4.74E-14 3.21E-11 3.21E-10 2.7SE-12 3.02E-14 1.0BE-1l 1.0BE·10 2.15E-12 2.37E-14 215E-l1 2.1SE-l0 215E·12 2.37E-14 2.6SE-11 2.65E·10 1.14E-ll 1.2SE-13
Fluoride 3.29E"'OO 6.00E·02 NA 240E-06 4 OlE-OS NA NA 7.67E-07 1.2BE-OS NA NA 2.5BE·07 4.2SE-06 NA NA S.lSE-Ol B.5BE·OB NA NA B 34E·07 1 OBE·05 NA NA He lachlorodibenzofuran NA NA NA NA NA NA NA NA NA NA NA NA NA NA NA NA NA NA NA NA NA NA NA Heptachlorodibenzo-p-dloxln NA NA 130E"'Ol NA NA NA NA NA NA NA NA NA NA NA NA NA NA NA NA NA NA NA NA Hexachlorodibenzofuran NA NA NA NA NA NA NA NA NA NA NA ~ N" N" NA N" ~~- - N" NA NA NA NA NA Hexachlorodlbenzo-p·dloxln NA NA NA NA NA NA NA NA NA NA NA NA - - NA NA NA
;NA-- NA- NA NA NA NA NA Indeno 1 ,2.3-Cd p rene S 6SE-02 NA 7.30E-01 NA NA 1.nE-09 1.29E-OS NA NA 1.l3E-OS B.25E·l0 NA NA B.SSE·l0 6.46E-l0 NA NA 8.85E-10 6.46E-10 NA NA 4.6lE·OS 3.41E-OS
-.~-
lead 2.96Et01 NA B.50E-03 NA NA 9.27E-07 7.S8E-09 NA NA S.S2E-07 5.03E-OS NA NA 464E-07 3.S4E·09 NA NA 4.64E·07 3.94E-OS NA NA 245E·06 2.0SE-OS
Manganese NA 140E·Ol NA NA NA NA NA NA NA NA NA NA NA NA NA NA NA NA NA NA NA NA NA Mereu 7 Q7E-Q2 300E-04 N" 5.1BE-OB ,.hE-04 NA NA 16SE-OB 549E-OS NA
-NA S.53E-09 1.ME-05 NA NA , 11E-Oa 369E-OS NA NA l36E-08 454E-Q5 NA NA
Methanol NA S.OOE-01 NA NA NA NA NA NA NA NA NA NA NA NA NA NA NA NA NA NA NA NA NA Melhyl-2-pentanon_e_ 7.0BE-04 B.OOE·02 NA S.17E-10 6.47E-09 NA NA 165E-10 2.0GE-09 NA NA 5.54E-11 693E-10 NA NA 1.11E-10 1.3SE-09 NA NA 1.37E-l0 1.71E-OS NA NA MethyJ~ne chloride 1.3SE-03 600E·02 7.S0E-03 S.B9E-10 1.6SE-OB 4.24E-l1 3.1BE-13 3.l6E-10 5.26E-OS 271E-11 203E·13 106E-10 177E-OS 2.12E-11 1.5SE-l3 2.12E-l0 3.53E-OS 2.12E-11 1 SSE-1J 261E·l0 4.JSE-OS 1.12E-l0 B.3SE-13
Molybdenum 3961:::+00 S.OOE-OJ NA 2.89E·06 5.79E-04 NA NA 9.24E-07 1.B5E·04 NA N" 3.10E-07 620E-D5 NA N" 6 20E-D7 1.24E-04 N" NA 7.64E·07 1 53E-04 NA NA Nickel NA 200E-02 NA NA NA NA NA NA NA NA I- NA N" NA NA NA NA NA NA NA NA NA NA NA N-nitrosodlphen lamine NA NA 4 SOE·03 NA NA NA NA NA NA NA NA NA NA NA NA NA NA ~NA NA NA NA NA NA-. N-nltrosodipropylamlne NA NA 700E"'OO NA NA NA NA NA NA NA NA NA NA NA NA NA NA NA NA NA NA NA NA Ocrachlorodibenzafuran NA 100E-Oa 130E.,..01 NA NA NA NA NA NA NA NA NA Nil. NA NA Nil. NA Nil. Nil. NA NA Nil. NA Octochlorod ibenzo-p-dlOxi n _ NA 1 DOE-DB l30E"'Ol NA NA NA NA NA NA NA NA NA NA NA NA NA NA NA NA NA NA NA NA Penlachlorodibenzofuran NA 1.00E-OB 6 SOE ...04 NA NA ~~-~" NA NA NA NA ~- NA NA NA NA NA NA NA NA NA NA NA Penlac:hlorodlbent.o-p-dioxln NA NA NA NA NA NA NA NA NA NA NA NA NA NA NA NA NA NA NA NA NA NA... Pcnlachlor9phenol NA S.OOE-03 4 OOE~Ol NA NA NA NA NA ~~ _I NA NA NA NA NA NA NA NA NA NA NA NA NA NA Phenanthrene 1.24&0-, NA NA NA NA NA NA NA NA NA NA NA NA NA NA NA NA NA NA NA NA NA Selenium 1.27E"'OO S.OOE·OJ NA S 24E-07 1.B5E·04 NA NA 2.95E·07 5.90E·05 NA NA S 9OE-OB 1.SBE-OS Nil. NA 1.9BE-07 3.S6E-05 NA NA 244E-07 4.88E-DS NA NA Silver 7.2BE·01 5.00E·03 NA S.32E-07 1.06E~04 NA NA 170E-07 3.3SE-OS NA NA 5.70E-OB 1.14E-05 NA NA 1.14E·07 22BE·05 NA NA l.4DE-O? 2 SlE-OS NA NA Tetrachlorodibenzofuran NA 1.00E-OS 1.30E... 04 NA NA NA NA NA NA NA NA NA NA NA NA NA NA NA _.NA NA NA NA NA
- -Telrachlorodibenzo-p-dloxln NA 1.0DE-09 1.30E"'OS NA NA NA NA NA NA NA NA NA NA NA NA NA NA NA NA NA NA NA NA Tetrachloroel~ylene 930E-04 1.00E-02 S 40E-Ol 6.7SE-l0 B.79E·OB 2.91E·11 1.S1E-ll 217E-10 2.l7E·08 1.86E-l1 1.00E·l1 7~2BE-1l 7.2BE·09 1.46E-ll 7.86E-12 1.46E-l0 1.46E-OB 1.46E-1l 786E·12 1.79E-l0 17SE·OB 7.68E·1l 4.1SE-11
---Thallium NA NA NA NA NA NA NA NA NA NA NA NA NA NA NA NA NA NA NA NA NA NA NA Toluene 60SE-04 B.OOE·02 NA 4.42E-10 5.53E-09 NA NA l41E-l0 1.76E-09 NA NA 4.74E-1l S.92E-10 NA NA 9.47E-1l 1.1BE-OS NA NA 1.17E-10 1.46E-09 NA NA Tnbul I phosphate NA 2.00E·01 9.20E·03 NA NA NA NA NA NA NA NA NA NA NA NA NA NA NA NA NA NA NA NA Trichloroethylene 371E-04 NA S.SOE-03 NA NA +~:!~!-11 686E·14 NA NA 7.42E-12 4.3BE-14 NA NA 581E_12 343E-14 NA NA 5.B1E~12 3.43E-14 NA NA J..07E·11 1.S1E-1J Trifluorochloromethane NA 300E-Ol NA NA NA NA NA N" NA NA NA NA NA NA NA NA NA NA NA NA NA NA Uramum l62E...Ol 3.00E-03 N" 1.19E·05 3.96E~03 NA NA 3.79E-06 1 26E-03 NA NA l27E-06 4.24E-04 NA NA 2.54E·06 B.4BE-04 NA NA 3l3E-06 104E-03 NA NA Vanadium NA 7.00E-D5 NA NA NA NA NA NA NA NA NA NA NA NA NA NA NA NA NA NA NA NA NA Vin I chlOride NA 3.00E-03 7.20E-01 NA NA NA NA NA NA NA NA NA NA NA NA NA NA NA NA NA NA NA NA X lenes 1 32E-03 200E-01 NA 964E-10 4.S2E-OS NA NA 30BE-10 1 S4E-OS NA NA_. 1.03E-10 5l6E-l0 NA NA 207E-10 1.03E-09 NA NA 2.S4E-10 1.27E·09 NA NA Zinc NA 300E-01 NA NA NA NA NA NA NA NA NA NA NA NA NA NA NA NA NA NA NA NA NA
total - 1.22E 02 total - 2.51E 06
NA == not applicable
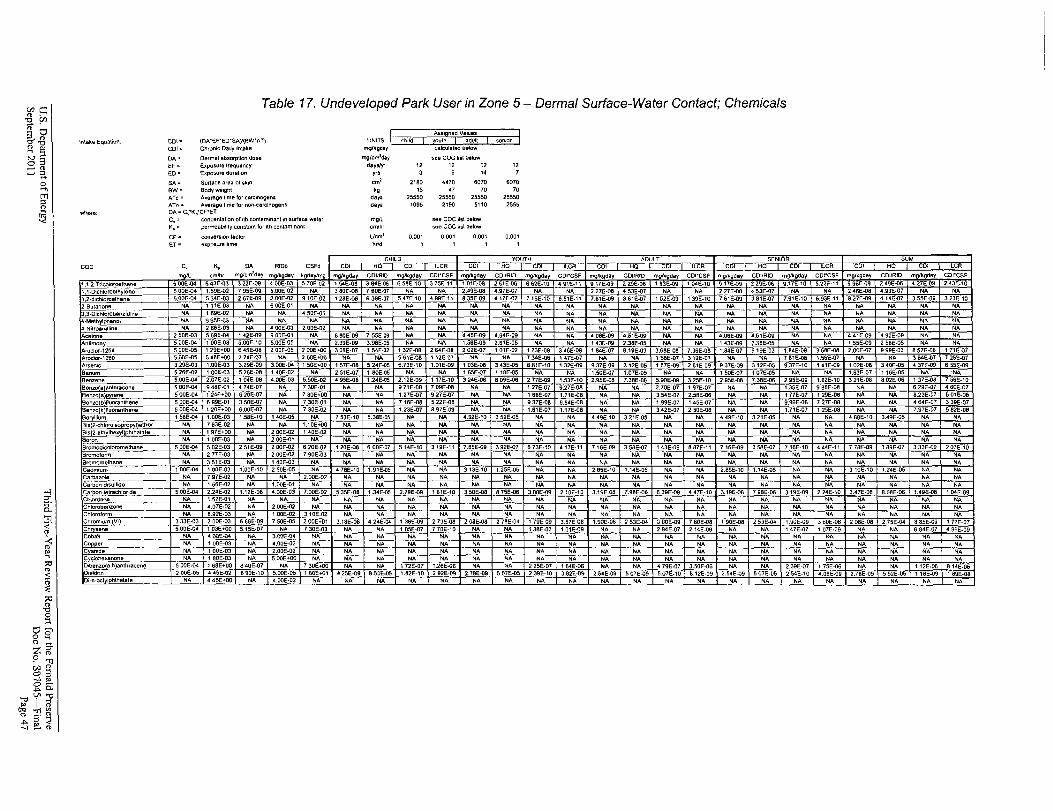
Table 17. Undeveloped Park User in Zone 5 - Dermal Surface-Water Contact; Chemicals
Assigned Valua!!
Intake EQuation. COl: (O",oUOEO"SAY(BW"AT) UNITS r.hild ~outh adull !OonlorI I I COl'" Chronic Dally InlBkB mglkgday calculAlad below
DA" DerfTlal absorpUon dose mg/cmlday sea coe lis' below EF= Ellposure Iraquancy deySlyr 12 12 12 12
ED" Exposure duration y" 3 14
SA= Surface are .. afskl" em' 2160 4470 6070 6070 8W: Body weight k, 15 47 70 70 ATc = Average time for carCinogens days 25550 25550 25550 25550 AT(I'" Aver1iilge lime for non-carcinogens daY' 1095 2190 5110 2555 01>. = Cy"Kp'CFoET
C~ " conc&nlalion of ilh contaminant I" surface water mg/l see coe lilt below
K. < permea.bliity con:;\;1nl for IIh contaminant cm/hr !lottO COC lu.1 below
CF' conversion faClor Vern' 0.001 0001 0.001 0.001
ET" exposure lime hrfd
CHILD YOIITH ADULT SCNI 0- SUM
CDC C. K. DA RIOd CSFd COl I H COl ILCR COl HO COl ILCR COl HO COl ILCR COl HQ "lJI ICC C I H I IC
m,1l cmlhr mglcrn'day mglkgday kgdaylmg mglkgday COIIRID mg/kgday CDI"CSF mglkgday COl/RIO mglkgday CD'"CSF mglkgday COl/RID mglkgday COI"CSF mg/kgdllY COl/RIO mglitgday CD'"CSF mg/kgday COl/RID mg/kgday COI"CSF
1 ,1 ,2-T riC!'lloroeUUIon8 500E-O~ 6 ~3E-OJ 322E-09 400E-OJ 570E-O:2 154E-06 J 64E-06 6SBE-10 375E-ll t.OtE-OB :251E-06 86:2E-'O o49'E-l' 9 17E..(J9 :2 Z9E-OS 1a3E-09 1004E-IO q t7E-09 2 Z9E-06 9.17E-tO S.22E-ll 996E"()9 Z49E-06 4.27E-09 2A3E_l0
1,1 -Oichloroath lene S.DOE-004 1.59E-OZ 79SE-09 S.00E-02 NA 3aDE-Oe 760E-07 NA NA 2.o49E-08 4.97E-07 NA NA 2.27E-OB ~.S3E-07 NA NA 2.27E..(JB 4SJE-07 NA NA 2A6E-OB ~.93E-07 NA NA
1,2·dlchloroelhane S.OOE-004 S 34E-03 267E-09 2.00E-OZ 9.10E·QZ 128E-OB G.38E-Or S.o47E-l0 498E-l1 83SE-09 417E-07 716E·l0 6.StE-ll 7.S1E..o9 3.B1E-07 1S2E-09 139E-l0 761E..()9 JB1E·07 7.B1E-l0 6.93E-l1 8.27E-09 o4.14E-07 3.5SE-09 3 Z3E-l0
2-Bulano(ie NA l11E-03 NA 600E-Ol NA NA NA NA NA NA NA NA NA NA NA NA NA NA NA NA NA NA NA NA NA J,3-Dlc!'llorobanzldlne NA tS9E-02 NA NA 4 SOE-Ol NA NA NA NA NA NA NA NA NA NA NA NA NA NA NA NA NA NA NA NA
4-Me\h hltnol .. 99SE-03 NA "" NA NA NA NA NA NA NA NA N. NA NA NA NA NA NA NA N' N' NA N' NA
4-Nilroanlilina NA 26SE·OJ NA 400E-OJ ZOOE-OZ NA NA NA NA NA NA NA NA NA NA NA NA NA NA NA NA NA NA NA NA
Acelone 2.S0E-OJ 5 B9E-004 1."'2E-09 900E-Ol NA 6 BOE-09 7.SSE-09 NA NA 4045E-09 "'.94E-09 NA N' 40SE-09 o4.51E-09 NA NA 4.0SE-09 4.StE-OS NA NA 4.o41E-09 4.9DE-09 NA NA
Anlimon SOOE-04 lODE-OJ 5.OQE-l0 6.ODE-OS NA 2.J9E-09 3.98E-OS NA NA 1.56E-09 2.6IE-05 NA NA to43E-OQ 2.38E-05 NA NA 143E..()9 2.38E-05 NA NA 1.5SE-09 2 S6E-05 NA NA
Aroclor-1Z54 S.OOE-OS 129E+OO 64SE-OB 200E-OS 200E+OO J.06E-07 1.504E-02 I.J2E-08 264E-OB 20ZE-07 1.01E-OZ 173E-OB 346E-08 1.B4E-07 9.19E-03 3.68E-OB 7.JSE-OB I.B4E-07 919E-03 I.B4E-08 J.SBE-08 2.00E-07 999E·03 B.57E-Oa 1.71E-07
Aroclor-12S0 S.OOE-OS So4BE+OO 274E-07 NA 2 ooe"OO NA NA 5 SIE-OB 1.12E-07 NA NA 7."34E-08 , 47E-07 NA NA , SSE-07 "312E-07 NA NA 7ME-OB '.56E·Q7 NA NA 364E-07 72eE-tlT
ArseniC 3.29E-OJ 1.00E-03 J.29E-09 3.00E-D-4 150E"OO 157E-Oa 5204E-05 6.73E·10 1.01E-09 1.oJE-08 3.43E-05 8.S1E-l0 1.32E-09 937E-09 3.1ZE-05 1.B7E-09 2 SIE-09 937E-09 l.12E-OS 9.J7E-l0 1.41E-09 1.02E-08 l40E-OS 437E-09 S SSE-09
Banum 526E-02 1.00E-03 S 26E-08 140E-02 NA 251E-07 1.80E-OS NA NA 1.S5E-07 ltBE-05 NA NA 1.50E-07 1.07E-05 NA NA 150E-07 107E..()S NA NA I.S3E-07 liSE-OS NA ·NA
Benzenlt S.OOE-004 2.07E·02 , 04E-08 4.00E-OJ S.50E·OZ 49SE-OS 1.24E-05 2.1ZE-09 117E-l0 3.204E-08 8 09E-06 277E-09 1.S3E-l0 Z.9SE-OB 7.38E-06 5.90E-09 32SE-l0 2.9SE-08 7.38E-06 295E-09 1.62E-tO J21E-08 a 02E-OS I.J7E-oa 7S6E_l0
Banzo a ;!.nthracena 5.00E-O" 9.48E-01 .. 704E-07 NA 7.JOE-01 NA NA 9.7IE-OB 709E-OB NA NA 127E-07 9.27E-08 NA NA l.70E-07 197E-07 NA NA 1.3SE·07 98SE-OB NA NA 629E-07 4 SOt-07
Benzo a)pyrene 500E-004 , 24E+00 620E·07 NA 730E___OQ NA NA 1.27E-07 9.27E-07 NA NA 166E-07 1.21E-06 NA NA 3.So4E-07 2.SeE-06 NA NA 1 nE-07 12SE-06 NA NA B.23E-07 SOlE-06
Benzo b fluoranlhene 500E-04 6.99E-01 3.S0E-07 NA 7 JOE·Ol NA NA 7.16E-OS S.22E-OB NA NA 9.37E-08 B.84E-08 NA NA 1.99E-07 14SE-07 NA NA 9.9SE-08 727E-OB NA NA 4.64E-07 339E-07
Benzo k lIuoranlhane 500E-04 120E+OO S.00E-07 NA 7.JOE-02 NA NA 1.23E-07 8.97E-OS NA NA I.B1E-07 1.17E-08 NA NA 3.o4ZE-07 2 SOE-oa NA NA 1.71E-07 1.25E-OB NA NA 7.97E-07 582E-OS
Beryllium 15BE-04 1.00E-03 1.58E-10 1040E-05 NA 753E-10 5.3BE-OS NA NA ".92E-10 3 52E-05 NA NA 4.4SE-l0 3.21E-OS NA NA 4.49E-l0 :3 21E·OS NA NA 4.B8E-l0 :3.49E-OS NA NA Bis 2-chlorOiSOprop I ethor NA 7 S3E-OZ NA NA 1.IOE-+-OO NA NA NA NA NA NA NA NA NA NA NA NA NA NA NA NA NA NA NA NA
Bis 2-elh Ihell I hlhalnto NA 197E+OO NA 200E-02 140E·02 NA NA NA NA NA NA NA NA NA NA NA NA NA NA NA NA NA NA NA NA
Boron NA 100E-03 NA 200E-01 NA NA NA NA NA NA NA NA NA NA NA NA NA NA NA NA NA NA NA NA NA
Bromodichloromelhilne SOOE-04 50ZE-OJ 251E-09 200E-OZ S.20E-02 120E-OS 6.00E-07 514E-l0 319E-11 7.BSE-09 3.92E-07 6.7JE-10 417E-11 7 '6E-09 3.5BE-07 t.43E-09 8.a7E-11 7.16E-OS :3 58E-07 716E-l0 444E-ll 778E-09 3 B9E-07 :3 33E-09 207E-10 Bromolorm NA 277E-03 NA 2.00E-02 7.90E-OJ NA NA NA NA NA NA NA NA NA NA NA NA NA NA NA NA NA NA NA NA
Bromomelhane NA 351E-OJ NA 140E-03 NA NA NA NA NA NA NA NA NA NA NA NA NA NA NA NA NA NA NA NA NA Cadmium 100E-04 t OOE-03 1.00E·l0 Z SOE-OS NA .. 78E-tO 1.9tE-OS NA NA 3.1JE-10 1.25E-05 NA NA Z 8SE-10 1.14E_OS NA NA 2.8SE-l0 1.1o4E-OS NA NA 310E-l0 1.24E-OS NA NA Carbazole NA 797E-OZ NA NA 2.00E_O:? NA NA NA NA NA NA NA NA NA NA NA NA NA NA NA NA NA NA NA NA
Carbon disulfide NA 1 S6E-02 NA 1.00E-Ot NA NA NA NA NA NA NA NA NA NA NA NA NA NA NA NA NA NA NA NA NA Carbon letrachlorode SOOE-04 2.24E-02 t.12E·08 400E-03 7.00E·02 535E-OB 1.34E-05 2.29E-09 1 SIE-10 350E-OB B 75E-06 3.00E-09 2.10E-10 3.19E-Oa 7.98E-06 639E-09 447E-10 3.19E-OB 79BE-OB J.19E-09 224E-10 J.47E·08 a.SBE·OS 1.49E-OB 1.04E-09 Ch\or{\a.ne NA , 57E·01 NA NA NA NA NA NA NA NA NA NA NA NA NA NA N. NA NA NA NA NA NA NA N. Chlorobenzene NA 4.07E-02 NA Z.OOE-02 NA NA NA NA NA NA NA NA NA NA NA NA NA NA NA NA NA NA NA NA NA Chlorolorm NA a.92E-OJ NA 1.00E-OZ 3.10E_OZ NA NA NA NA NA NA NA NA NA NA NA NA NA NA NA NA NA NA NA NA Chromium VI --~~~E-OJ 2 ODE-OJ S SSE-09 7.50E-05 200E+Ol 3.ISE-OS 4204E-04 136E-09 2.73E-06 208E-OS 27BE-04 1 79E 09 3.57E 08 1.~OE-08 253[-04 J OOE-{l9 760E-08 190E-08 253E-04 1.~UI::·U!:l j tlUI::-U8 ;1 OSE-08 Z.7SE-04 B 85E-09 t 77E-07 Chrysene SOOE-04 103E+OO 5.15E-07 NA 7.JOE·03 NA NA 10SE-07 770E-l0 NA NA 13BE-07 1.01E-09 NA NA 294E-07 214E-09 NA NA 147E·07 1.07E-09 NA NA 6.84E-07 ".99E-09 Cobalt NA 400E-04 NA "3.00E.·04 NA NA NA N' NA NA NA NA NA NA NA NA NA NA NA NA NA NA NA NA NA Copper NA 100E-03 NA 4.00E-02 NA NA NA NA NA NA NA NA NA NA NA NA NA NA NA NA NA NA NA NA NA C anlde NA 100E-03 NA 2.00E-OZ NA NA NA NA NA NA NA NA NA NA NA NA NA NA NA NA NA NA NA NA NA C c!ohel!8none NA 1 aOE-03 NA 5.00E+00 NA NA NA NA NA NA NA NA NA NA NA NA NA NA NA NA NA NA NA NA NA D,benzo s.h anthracene 500E-04 t 68E+00 a 40E-07 NA 7 JOE+OO NA NA '72E-07 1.26E-06 NA NA 2 ZSE-07 1.64E-OS NA NA o479E-07 3.50E-OS NA NA 2.39E-07 1.7SE-OS NA NA lIZE-06 B.14E_06 Dieldnn 200E.-OS ....5E-02: B 90E-l0 5.00E-05 160E+Ol .2SE-09 a.SOE.-OS 1.62:E-l0 2: 92E-09 2.78E-09 557E-05 2.39E-10 3.62E-09 2.54E-09 S07E-OS S.07E-10 8.12E-09 2:.S4E-09 S07E-OS 2S4E-l0 4.0SE-09 2.76E-09 S 52E-05 1.laE-09 1 agE-OS Oi-n-oct I h(hal8le NA 44SE+OO NA 4.00E-02 NA NA NA NA NA NA NA NA NA NA NA NA NA NA NA NA NA NA NA NA NA
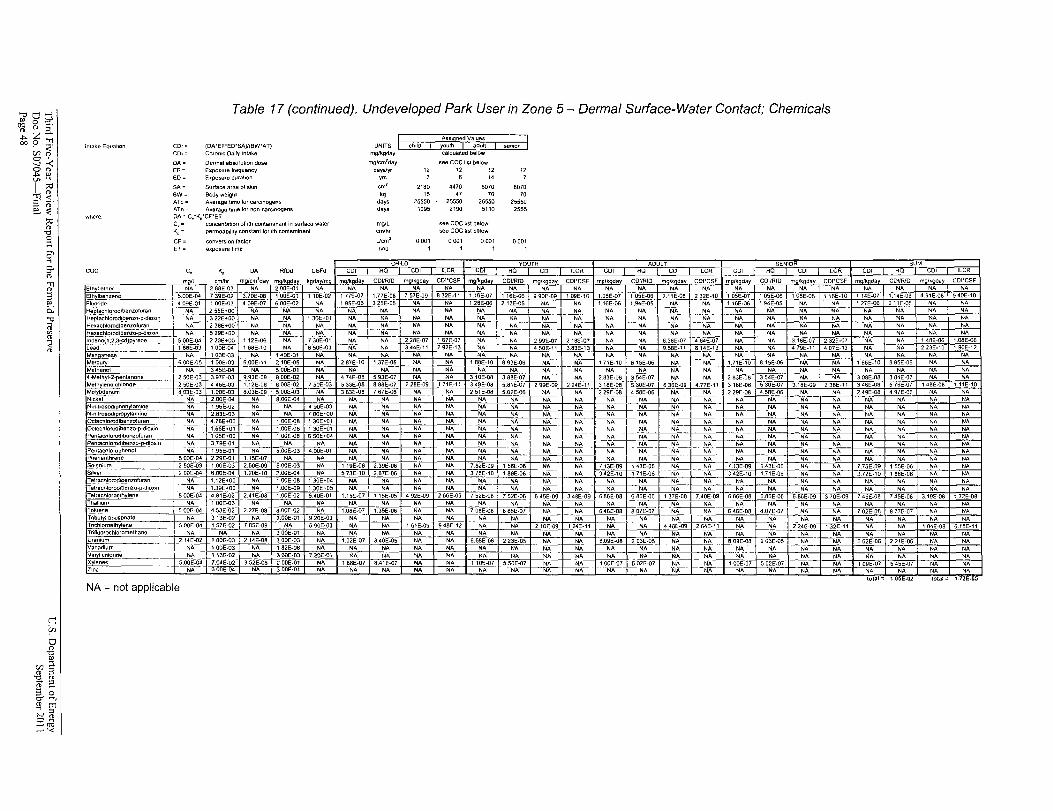
Table 17 (continued). Undeveloped Park User in Zone 5 - Dermal Surface-Water Contact; Chemicals
I AssIgned Values Inlake Equation CDI" (DA'EF'EO"SA)J(BW'ATj UNITS child youth I adult semor I
CDI= ChroniC Dally Intake mg/kgday calculated below
DA= Dermal absorption dose mg/cm1day see CDC list below EF = Exposure frequency days/yr 12 12 12
ED = Exposure durahon yrs 3 6 ", SA = Surface area of skin om' 2180 4470 6070 6070 BW::; Body weighl kg '5 47 70 70 ATc = Average lime for carClnoge.,s days 25550 25550 25550 25550 ATn'" Average time lor non-carCInogens days 1095 2190 5110 2555
where. DA"" C:Kp'CF'ET C. = concen\allon of I\h contaminant in surface .....ater mglL see COC list below
Ko = permeability constant lor Ith contaminant em/hr see COC list below
CF = conversion faclor Ucm l 0001 0001 0.001 0001 ET = exposure lime Md
cae C. K~ DA RfOd C5Fd ~~C~D~';=;:~HQ~c3H'~LD5c~D'~I;~Il~C~R;t~C~D~';=;~H~Q;y~aU~T~H~ciD~';~'L~C~R~~~CD~'=C~H~Q~A~DfU~LT5c~D~';:=;'~Lc~R~~~-~f-;c~D'~II~H~Q~S;E~N,~a=R~CD~'=C'~LC~R~l=~C~D~';=;:~HQg;S§UeM5c~D'~I;~Il~C~R~ mg/L cmlhr mg/cm 2day mglkgday kgda Img mg/kgd~)' COllRro m I~ C01"CSF mQ/kad~y COIIRro mg/kgday CDI'CSF rng1kgda COURfO m Ikgday CDI'cSFI mg~Ik'~'d:--'Y-'-I-=CcCD'""R'::'D::--'--m--'",,","'d-"Y..LC:-'DO;;'·"cc"s'+m-"'.::''''''-"o,,-'--:C:CD"'I/R:-:ID=-'-m--'''''::.;o'd:-'''...J....::::,·::c=-s:i,CD
Eth I ether NA 2 BBE-03 NA 2 OOE-Ot NA NA NA NA NA NA NA NA NA NA NA_~~ I NA NA NA NA NA NA NA NA Ethlbenzenc 5.00E·OA 739E-02 3.70E-OB tOOE-Ot 110E·02 t77E-07 177E06 757E-09 B32E·tl 1.1BE-07 t16E-06 990E-09 109E·tO t05E-07 105E.il.!5.12.ttE..:-OB~232E-tO -10SE-07 105E-06 10SE-OB 116E-tO I 14E-07 1.14E-06 4.91E-OB .540E-l0
ii==M -+'~NA"""-G1-O;O.OE"()3 NA 140E-Ol NA NA NA NA NA NA NA NNAA NA NA 8,N5EA_06 NNAA- _"N"A-- ,.,N,AE10
8.'"5EA-06 NA NA NA NA NA NA••;;g;,O.'~~'~;--- _
Methanol~I fiOOE-OS 345E-04 B.OOE·II 210E-055.00E·Ol 2B7E-l0NA 1.37E-05 NANA lSIlE-lONA S93E-06 NA _ NA t I NA 1}~!~ffiii~~N!A~tiNiA~i'B816iE-~'O~;8;85~E~-OE6E~NIA~t~NJA~NA NA NA NANA 100E·03 NA NANA NA NANA NA NANA 17tE-l0 NA NA . . NA NA NA NA ~enlanOnE! - --L...
~ ~~~:~~ :.:~~:~~ ~:~~~:6: :.66~:~~ 7S~~03 : ~~~:6: ~ :~~:~; 22~;-O9 17~~-11 ~.~~t6: I ~.:~~~; NA NA 2.S3E·O_S_ - ~~~~~~;. t 6 3~;.09 I 4.7~;-11 1 ~ ~~~~: ~-~~~:~; 3.'~:.09 23~;-11 ~.~:~:~~ ~ ~:~:~; 14~:.08 1 1~;-10~N:'O:k~.b,de8~neu:'londe --- "S03E-03 1.00E-03 S.03E-09 S.OOE-03 NA 3S3E-OB 767E-06 NA NA 251E-OS -S.02E-06 2...2~~_ ~N_~A-l1.- ~~:~:b: 458E-06 I _NNAA il NNAA 1229NEA-OS 4.SSE-06 NA NA 2.49E-08 497E·OB NA NA
NA 2.00E-04 NA S.OOE·04 NA NA NA NA NA NA NA NA NA NA NA NA NA NA NA NA NA
~:~::~~:=:~:;~:~~: --j-7.~7A-hC~:~:~"'~"':b~;+--7.'~:C-+--7.~7~-+-7;"';~"'~,,:~"'~+--7.'~:~-+ - ~: ~: ~: ~: ~: ~: ~: ~: ~: I ~~ -+ ~: + ~:-- ~~: ~: ~: ~: ~: ~: ~: Oclachlorodibenzofuran ':__LJ-N~A~E4~.'~8E~.~OOEE3N~A=B'~00~E~.0~8:E'~3~OE~·iO'a=3N~A~E=N~AEf3N!A=E=~N~A~EJN~AEf3NAfTiN~A- r- IOctOChlorodibenzo-p-dioxin NA 1.65E-+Ol NA 1.00E-OS 130E+Ol NA NA NA NA NA NA t NA NANA I NANA I. NANA NANA NANA NANA NANA NANA NANA NANA NANA NANA NANA
IParliaChiorod,bonzofuran 106E+OO 100E-OS 6S0E+04 I NA-- -'~3.NiA~F.~N~A~E~N~A~f3NiA~EiN~A~EjNIA~I3N~A~EiN~A~EjNIAEI3N~A~E~N~A~EjN~AE~~Ibenzo-p-dio~in NANA 3.79E-OI NANA NA NA NANA NANA NANA NANA NANA NANA I NANA NA NA NA NA NA NA NA NA NA NA NA NA NA Pentachloro henol NA - 1.9SE-Ol NA S.OOE-03 4.00E-Ol NA NA NA NA NA NA NA NA NA NA NA NA NA NA NA NA NA NA NA NA Phenanthrene 5OOE-OA 2 29E-Ol 1.1SE-07 NA NA NA NA NA NA NA NA NA NA NA NA NA NA NA NA NA NA NA NA NA NA
~_.- ~ 6~~:~; ~:6~~:b~ ~:;b~:~~ ;:~~~:b: ~: ~;~~~~b ~:~;~:~~ ~: ~: ~.~;~:~~ ~ ~~~~6~ ~: ~: ~::~~~~~ ~ ~~~:~~ ~: ~: ~.~~~:~~ ~.~~~:~:+-;:~:;:~-+-"';~",,:C-+-';,":;~~~;':O"',~+"'~~':;~:;;~~-"b:,-t---i~",,~:"""'+--7.'~:C--I Tetrachlorodlbenzofuran NA 1.12E-+OO NA 100E-OB 130E+04 NA NA NA NA NA NA NA NA NA NA NA NA NA NA NA NA NA NA NA NA ~~enzo-p-dlo~'n NA 1.39E+OO NA 1.00E-09 1.30E+05 NA NA NA NA NA NA NA L NA NA NA NA NA NA NA NA NA NA NA NA NA
Thallium NA 1OOE-03 NA NA NA NA NA NA NA NA NA N" NA NA NA NA NA ~~ NA NA NA NA NA NA NA Toluene 500E-04 4.S3E-02 2.27E-OB S.OOE-02 NA 1.0SE-07 U5E-06 NA NA 708E-OS BaSE-07 NA NA 646E-OS S07E-07 NA NA B46E·OS S.07E-07 NA NA 702E-08 SnE-07 NA NATI"'j"ihi,o,,"!''''Y"jh~'.:",~~~:!;5~00!E!-0:'1 '4~.8i'Er·01'}';.4~'!Ej.!0;a:8:!!'1·0~OiEI-Oi'jl51·410~E!-~ot'tr~'~·I'5IE~-0~'I~'~'15EI-~0~51c4~91'~E!-<J~9~!~2~6l6IE"-0~91l'l5~'IEI-0~8ls'~5i2~Ei-:§i0~6~~I6~i415!E].~O;O-:9~~3.l4BIE!_0~9t6~816E!_0:8t6~8l6IE_~06~,'l3'IE~.0;8f'".4iOE!-0~9t6~816iE-~081;6·l86iE~-0;6r6~.'-!6E(_0:9 3 7OE·09 745E-08 7I1SE·06 3.19E-08 1 nE-OBTnbut Iphosphate NA 313E-02 NA 2.00E-Ol 9.20E-03 NA NA NA NA NA NA NA NA NA NA NA NA NA NA NA NA NA NA NA NA
[,;~7.~:~i":~=o:oc::o.S~~'!:O:=:~:::""hc:c'":::.__-+.":5-":0Z'C~C'-0'"4+15~~-02 78~~-09 30~:-OI 59~~.03 ~~ ~: 16~~-09 94~~-12 ~: ~: 21OE-09- 124E·l1 NA NA 4481:-09 264E-ll NA NA +··-'-i-'i'4"'E"'-0"-9-:t-::,'';.3t~~~,,-I:ll~t-=-~~~:'::.-=-t-=--=:'''~"''~t-=--:t-:=:,';0~~~~,,-"'0,,8'=l':c"'6".+"7~~~'=·.;.17""l,'-I ~vu.r~na;d"'.~m. 2.14E-02 100E·03 214E-OB 300E-03 NA 1.02E-07 3.40E-05 NA NA B.6SE-OS 223E-05 ~~ ~~ 6.0~:-OS 2 O~:.OS ~: ~N~A _~. O~N:~-.0_8 ,~'''io~"':c'-0~5t------;;'~~i-~::::$N;;A:::-_-_1-f-:::.6o'''6i:2~E--'-''0~8''+t--'o,i2;;;,i'iEP-Og5~::::$N;;A:::-_-_1---""--;';;Nt;A::.::1 ~.: NA 1OOE-03 NA 1B2E-06 NA NA NA NA NA NA NA NA NA NA NA NA ' NA NA NA NA NA NA NAi~_ NA 1 DE·02 NA "30()E-03 720E-01 NA NA NA NA NA NA NA N'A NA NA NA NA NA NA NA NA NA lilA NA NA ~~nes S.OZ~-04 ~.~~~:~: 3.S~~.OS ;~~~:~~ ~: t6~~:07 8.4~~-07 ~: ~: 11~~-07 5.S~~.07 ~: ~: 10~;-07 ~Q~~-97 .~: _~: 10~;.07 SO~~.07 ~: ~: 10~~_07 S4~~.07 ~: ~:
lotill = 1.05E·02 total = 1.72E-OS NA =not applicable
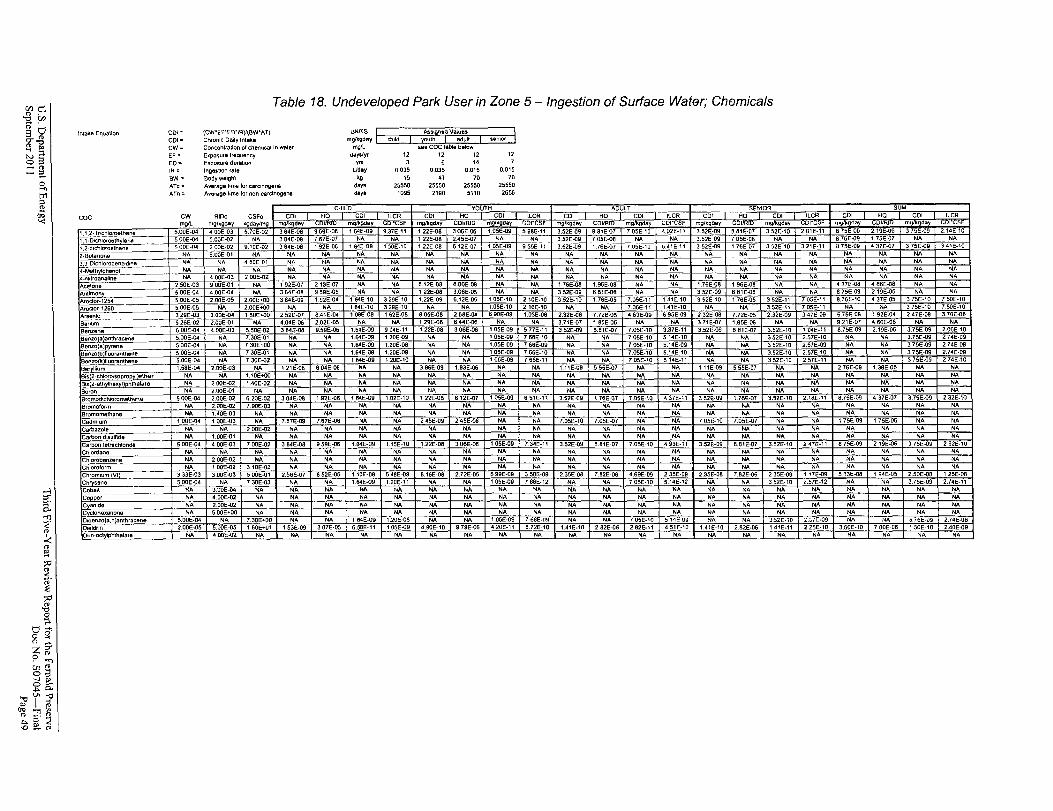
Table 18. Undeveloped Park User in Zone 5 - Ingestion of Surface Water; Chemicals
IntaKe 'Equation. COl:::. (CW'E.F'EO'\R)I\BW'Al) UNITS Ass\~eO Valu8$I COl '" Chronic Daily Inlake mgfkgday child youth I adull senior I CW= Concentration 01 chemical in water moIL see COC labia below
EF = ExposurelreQuency days/yr 12 12 12 12
ED'" Exposure duration 3 6 ,. IR· Ingesllon rale '" 0035 0.035 0.015Llday 0.015
BW = Bodyw.'gh\ 'g 15 47 70 70
ATc" Average Ume lor c'UClnogeni do,.. 25550 25550 25550 25550
ATn = Average Ume for non-carcinogens daye 1095 2HIO 5110 2555
SUMCHILD SENIORYOUTH ADULT COl HQ COl ILCRCOl HQ COl ILCRCOl HQ COl ILCR COl HQ COl IlCR COl HQ COl ILCRCW RlDo CSFoCDC
my Io.gday DllRfD my kgday COI·OSmglkgday COl/RID rTlg7kgday .DI' FmgIKgday I mQI'kQday D,'CSF rTI!;I/kgday Ol/RID mg kgday cor" SF mg/kgday I mg kgday 01moIL mg/kgday II.gdaylmg 2.14E-10B 7sE-09 2.1SE-OB1.05E-09 2.01E-11 J 7SE·0995QE-06 164E-09 9.37E-11 122E-06 306E·OB 5 BeE-11 B B1E-07 70SE-l0 4.02E-l1 3.S2E-09 881E-07 3 S2E-10 400E-03 364E-06 3.S2E-095.00E-04 S.70E-021,1.2-Tnchloroethane
NANA B.7SE-09 17SE-07 NANA NA NA7.B7E-07 NA 1.22E-OB 2.4SE-07 NA NA J.S2E-09 70SE-OB NA500E-04 S.00E-02 NA 3 B4E-08 J.52E-09 705E-OB1.1·D1ch1oroeth lene 341E-l087SE-09 437E-07 375E-091 64E 09 122[-08 10SE-09 9 SSE-II 6.41E-ll 352E-09 176E-07 352E-1O J.:?1E·11500E-04 1 92E 06 150E-l0 612E-07 3.S2E-09 I.7BE-Ol l.OSE-l0:2 00E-02 9.lOE·02 38"E-OB1,2·dlchloroethane
NANA NA NA NANA NA NA NANA NA NA NA NA NA NA NA NANA 6.00E-Ol NA NA2-Butanone ~~ NANA NA NA., 50E 01 NA NA NA NA NANA NA NA NA NA NA NA NANA NA?,J_9Ic!1loroben.!:ldl!"le -- N'-~~t NA NANA NA NA NANA NA NA NA NA NA NA NA NA NANA NA NA NA NANA NA4_Mefh !'!E!Ienol NANA NA NA NANA NA NA NA NA NA NA NA NA200E-02 NA NA NA NA NA NANA 400E-034-Nltroanallne
NA 437E-06 o486E-08 NA NANA B.1LE-08 B.BOE-08 NA NA NA192E-07 213E-07 NA 176E-08 1.96E-08 NA 1.76E-08 19BE-08 NA2.50E-03 900E-01 NAAcetone NANA 122E-08 NA NA 875E-09 219E-05 NA9S9E-05 NA 3.06E-05 NA 8.81E-06 352E-09 881E-06 NA NA4.ODE-04 NA J84E·OB 3S2E·09 NA500E-04Antimony
37SE-10 7S0E-l01.22E-09 6.12E-OS 105E-10 141E-10 70SE-11 8.75E-l0 437E·OS1.92E-04 1 &4E-10 329E-l0 210E-l0 1.76E-05 7.0SE-11 352E-l0 1.76E-05 352E-l1500E-OS 2.00E-OS 2.00E+00 384E-09 3.52E-10Aroclor-1254 1.0SE-10 7.50E-l0164E-l0 7.05E_11 1.41E-l0 705E-11 NA NA 37SE-1ONA 329E·10 NA NA 210E-l0 NA NA 3.S2E-l1500E-05 NA 2.00E+00 NA NA NAAroclof-1260 690E-09 S.7SE-OB 192E-04 3.70E·068.41E-04 10BE-08 162E-08 8.05E-08 268E·()oI 1.03E-08 7.72E-05 69SE-OB 232E-08 347E-09 247E·08329E-03 3.00E-04 1 SOE+OO 2S2E-07 2.32E-08 4.63E-09 7.72E-05 2.32E-09Arsenic
NA NANA 129E-06 644E-06 NA 9.21E-07 460E-OS NA2.02E-05 NA NA 3.71E-07 185E-06 NA 371E-07 1.8SE-OS NA NA526E-02 2.00E-Ol NA 4.04E-06Barium lOSE-OS 2.06E-101.64E-09 122E-08 5.77E-11 3.87E-l1 194E-l1 8.75E-09 2.19E-06 3.7SE-099.S9E-06 904E-l' 306E-06 352E-09 8.B1E-07 7.05E-l0 3.S2E-09 881E-07 3.52E-10500E-04 4.00E-03 S.SOE-02 384E-08Benzene
274E-09120E..()9 10SE-Oe 514E-10 NA NA 3.7SE-097.30E-01 NA 1.64E-09 NA NA 7.66E-10 70SE-10 2.57E-l0S.OOE·04 NA NA NA NA NA NA 3S2E-1OBenzo a nthracentl 274E-OBNA 1.05E-09 5.14E-09 NA NA 37SE-097.30E+00 NA 1.64E-Oe 1.20E·06 NA 7.66E-09 70SE-10 NA 2.57E-09500E-04 NA NA NA NA NA 352E-10Benzo a)pyrene 2.74E-091.64E-Oe 105E-09 S.14E-10 NA NA 375E·09730E-01 NA 1.20E-09 NA NA 766E-10 7.0SE-l0 NA 3.52E-10 2.S7E-10500E-04 NA NA NA NA NABenzo b nuoranlhene
10SE-09 514E-l1 NA 375E-09 274E-l0NA 164E-09 1.20E-l0 NA NA 76SE-11 705E-10 NA 3S2E-l0 257E-l1 NA5.ooE-04 NA 730E-02 NA NA NA NABenzo k nuoranthene NANA NA NA 2.76E-09 1.38E-06 NA604E-06 NA 3.86E-09 1.93E-06 NA 1.11E-09 NA 111E-09 55SE-07 NA1.58E-04 2.ooE-03 NA 121E-OB 55SE-07 NABeryllium NANA NA NA NA NA NANA NA NA NA NA NA NA NANA NA 1.10E+OO NA NA NA NA NABis 2-Chlorolsopropyl}ether
NA NANA NA NA NA NA NA NA NANA NA NA NA NA NA NA NA NA NA2 QOE-02 1.40E-02 NABls 2-eth Ihexyl)phthalate NA NA NA NA NA NANA NA NA NA NANA NA NA NA NA NA NA NA NA2.ooE-01 NA NABoron
105E-09 2.16E-11 6.75E-09 431E-07 3.75E-09 2. 32E·10164E-09 1.Q2E·10 1 22E-08 612E-07 651E-H 3.52E-10192E-Oe 3.52E-09 176E-07 7.05E-l0 4.37E·" "352E·09 1.76E-07500E-04 2.00E-02 S.20E-02 384E-08Bromod\ctuoromelh8ne NANA NA NA NA NA NA NANA NA NA NA NA NA NA NA NANA 2.00E-02 NA NA NA7.90E-03Bromoform
NA NA NA NA NA NA NANA NA NA NA NA NA NA NA NANA 1.40E-03 NA NA NA NANABromomethane NA NA NA 175E-09 175E-06 NA1.00E-04 7.S7E-06 NA 245E-09 245E-06 NA 7.0SE-10 7.0SE-07 NA 70SE-l0 7.05E-07 NA NA100E-03 7.B7e·09 NANACadmium
NANA NA NA NA NANA NA NA NA NA NA NA NA NA NA NANA NA NA NA NA200E-02Carbazole NA NA NA NA NA NA NANA NA NA NA NA NA NA NA NANA 1.00E-Ol NA NA NA NA NACarbon disulfide
7.34E_11 219E-06 2 S2E-101.15E-10 105E-09 4.93E-11 247E-l1 675E-09 37SE-095.00E-04 959E-06 1.64E-09 1.22E-OB 306E-06 3.52E-09 8.81E-07 7.05E-10 3.S2E-09 8.81E-07 3.52E·10400E-03 7ooE-02 384E-08Carbon telrachloride NA NA NA NA NA NANA NA NA NA NA NA NA NA NA NA NA NA NANA NA NA NAChlordane
NA NA NA NA NA NA NA NANA NA NA NA NA NA NA NA NA NANA 200E-02 NA NA NAChlorobenzene NA NA NA NA NA NA NA NANA NA NA NA NA NA NA NA NA NAChloroform NA 100E-02 310E-02 NA NA
194E-05 125E-08110E·OB 548E-09 699E-09 235E-09 1 HE-09 583E-08 2.S0E-06852E-05 8.16E-08 2.72E-05 35OE·09 2.3SE-08 7.82E-06 4.69E-09 2.3SE-08 7.82E-06 23SE-09Chromium VI 333E-03 3.00E-03 500E-01 2.56E-07 105E-09 NA 2.74E-l11.64E-09 1.20E·l1 7 SSE·12 705E-l0 5.14E-12 352E-10 2.S7E-12 NA 3.7SE-09500E·04 NA 730E-03 NA NA NA NA NA NA NAChrysene NA
NA NA NA NA NA NA NA NANA NA NA NA NA NA NA NA NA NANA 3.QOE-a4 NA NACoball NA NA NA NA NA NA NA NA NA NA NANA 4.00E-02 NA NA NA NA NA NA NA NA NANA NACopper
NA NA NA NA NA NA NA NA NANA 2.00E-02 NA NA NA NA NA NA NA NA NA NACyanide NA NA NA NA NANA NA NA NA NA NA NA NA NA500E+00 NA NA NA NA NA NA NA NACydohexanone NA
j"jANA -'~2~~08 1.05E-09 7 6SE-O~ NA NA 51"1E 09 2.:;7[·09 NA 3.75E-095.00E·04 NA 164E-09 NA NA 705E-10 NA NA 3.52[·10 2.74E-utlDloenzo a,h)anthracene 7.30E+00 NA 420E-116.5BE·11 105E-09 4.90E-l0 9.79E-OS 6.72E-10 1.41E-l0 4.S1E-10 141E-11 22SE-10 3.50E-10 700E-06 150E-10 2.40E-092.00E-05 5.00E-OS 1 SOE+01 153E-09 307E·05 282E-06 282E-l1 1.41E-10 2.82E-06Dieldrin
NA NA NA NA NA NA NANA 4.00E-02 NA NA NA NA NA NA NA NA NA NA NA NADI-n-oc Iphthalate NA NA
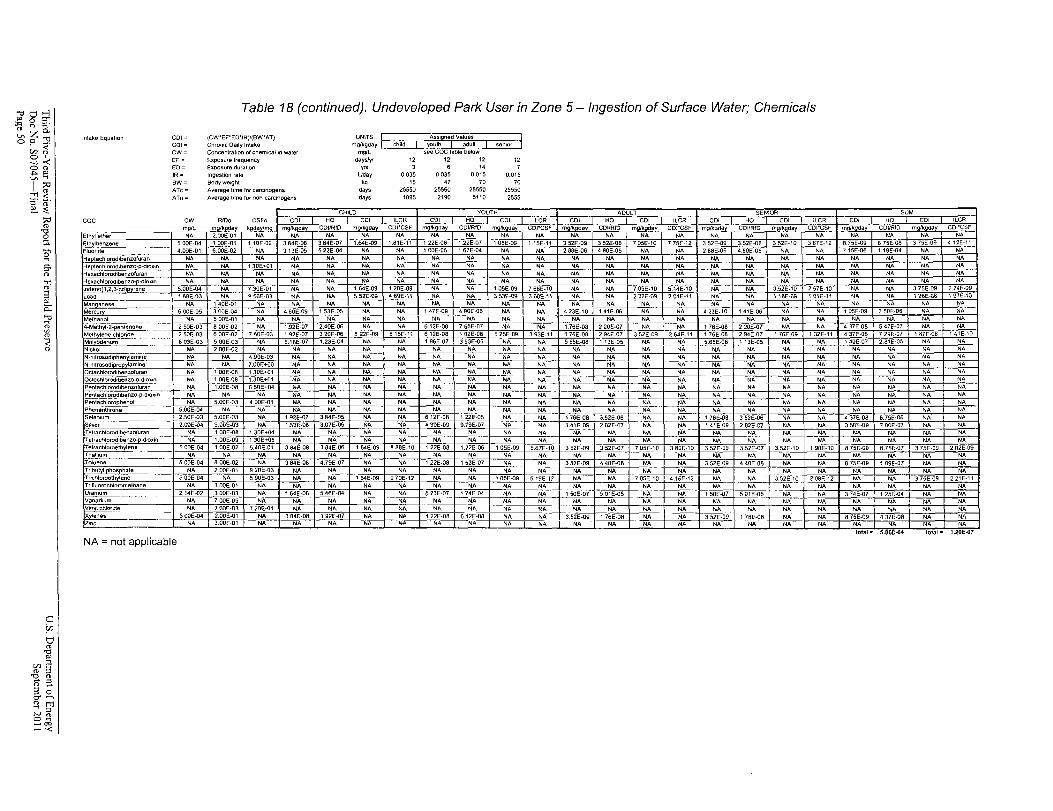
Table 18 (continued). Undeveloped Park User in Zone 5 - Ingestion of Surface Water; Chemicals
Intake Equation COl" (CW'EF'EO'IRjf(BW'AT) UNITS I Assl2!led Values
COl" Chro(llc Dally Intake mg/kgday child youth adult senior
CW= Concentration 01 chemical In water mg/L see COG table below
EF" E)(POSUI9 rrequency days/v' 12 12 12 12 EO= Exposure duration 3 6 14 IR= Ingestion rate '"
I I Uday 0.035 0035 0.015 0.015
BW= BOdYW91ght 15 47 70 70 ATe = Average lime lor carCinogens days" 25550 25550 25550 25550 ATn = Average lime lor non-carcinogens days 1095 2190 5'10 2555
CHILD VOU1H ADULl SENlOR SuM
COC CW RfDo CSFo COl HO COl ILCR COl HO COl ILCR COl HO COl ILCR COl HO COl ILCR COl HO COl ILCR
mglL mglkj:jday k day/mq m Ik da COl/RID m Ikgda CDI'CSF rnglkgday CDI/RID mg/kgday CDJ'CSF m IlI.gday COl/RID m Ikgday CDt'CSF mglkgday COl/RID m Ik da CDI'CSF mCl/kgday COl/RID m /kgd<1 CDI'CSF
IEthyl ether NA 2.00E-Ol NA NA NA NA NA NA NA NA NA NA NA NA NA NA NA NA NA NA NA NA NA
Elhylbenzene 500E·04 100E-Ol 110E-02 384E-OB :3 84E·07 1.64E-09 I.B1E-l1 122E·OB 1.22E·07 105E-09 1.15E-11 352E-09 352E-OB 705E-l0 775E·12 352E-09 3.52E-OB 352E-1O 3 B7E·12 8.75E-09 875E·08 375E·09 412E-ll
Fluonde 4.09E-Ol 6.00E-02 NA 313E-05 522E-04 NA NA t ODE-OS 1.67E-04 NA NA 28BE-06 .4 BOE-05 NA NA 288E-06 4.80E·05 NA NA 715E-06 119E-04 NA NA
H~achlorodlbenzofuran NA NA NA NA NA NA NA NA NA NA NA NA NA NA NA NA NA NA NA NA NA NA NA
He tachlorodlbenzo -dIOXin NA NA 130E+Ol NA NA NA NA NA NA NA NA NA NA NA NA NA NA NA NA NA NA NA NA
Hexachlorodibenzofuran NA NA NA NA NA NA NA NA NA NA NA NA NA NA NA NA NA NA NA NA NA NA NA
Hexachlorodlbenzo-p·dioxln NA NA NA NA NA NA NA NA NA NA NA NA NA NA NA NA NA NA NA NA NA NA NA
Indeno 1,2 ,3-cd)pyrene 5.00E-04 NA 7.30E·Ol NA NA 164E-09 1.20E-09 NA NA 105-E·09 766E-l0 NA NA 705E-l0 5.101E-IO NA NA 3.52E-l0 257E-IO' NA NA 375E-09 2.74E-09
lead IS8E·0? NA B 5UE·03 NA NA 552E-09 4 SSE-II NA NA 3.53E-09 3.ooE-11 NA NA 237E-OS 2 DIE-II NA NA lISE-OS 10IE-11 NA NA 126E·QB 101E-l0
Manganese NA 140E-Ol NA NA NA NA NA NA NA NA- NA NA NA NA NA NA NA NA NA NA NA NA NA
Mercury 600E·OS 300E-04 NA 4.60E-09 153E-05 NA NA lA7E·09 490E·OS I NA NA I 423E-l0l 141E-06 NA NA 423E-IO lAIE-06 NA NA 1.0SE·OS 350E::·06 NA NA
Melhanol NA 500E·Ol NA NA NA NA NA NA NA NA NA- NA NA NA NA NA NA NA NA NA NA NA NA .
4-Melhyl-2-esnIClnone 250E-03 800E-02 NA 1.92E-07 2.40E-06 NA NA 6.12E·08 765E-07 NA NA 1.76E-08 220E·07 NA NA t 76E-08 220E-07 NA NA 437E·08 547E-07 NA NA
Mel~ene cl!!~id~_ -_.
250E-03 6 DO_E.02 7-50E-03 192E-07 320E-OS B 22E-09 616E·II 612E-08 102E-06 525E·09 :>. 93E-l1 176E-08 2.94E-07 352E·09 264E-11 1.7SE-08 2.94[-07 17SE·09 1.32E-l1 4.37E-08 72SE-07 187E·OB I 41E-1O
Mol bdenum 803E-03 500E-03 NA 6.16E-07 1.23E-04 NA NA 196E·07 393E-05 NA NA 565E-08 113E·05 NA NA .5.65E-OB 113E-05 NA NA 140E-07 2.81E-05 NA NA Nickel NA 2.00E-02 NA NA NA NA NA NA NA NA NA NA NA NA -NA NA NA NA NA NA NA NA NA
N-nllrosod.phen lamlne NA NA 4.90E-03 NA NA NA NA NA NA NA NA NA NA NA NA NA NA NA NA NA NA NA NA
N mlrosodi ro lamine NA NA 7.00E+00 NA NA NA NA NA NA NA NA NA NA NA NA NA NA NA NA NA NA NA NA
Oclachlorodlbenzofuran NA 100E·08 130E+Ol NA NA NA NA NA NA NA NA NA NA NA NA NA NA NA NA NA NA NA NA OClochlorod,benzo-p-d,ox.n· NA l00E-08 130E+Ol NA NA NA NA NA NA NA NA NA NA NA NA NA NA NA NA NA NA NA NA
Penlachlorodlbenzofuran NA --'.00E·OB 6.50E+04 NA NA NA NA ~--Z~.=---
NA NA NA NA NA --NA NA -NA NA NA NA NA NA NANA
Penla~~rl~dlbEl~ZO-P-dl0),",n NA NA NA NA NA NA NA NA NA NA NA NA NA NA NA NA NA NA NA NA NA NA
Penlachlorophenol NA 5.ooE-03 4.00E-Ol NA NA NA NA NA NA NA NA NA NA NA .. ._ ~~ NA NA NA NA NA NA NA NA
Phenanthrene 5.00E-04 NA NA NA NA NA NA NA NA NA NA NA NA NA NA NA NA NA NA NA NA NA Selenium 2.50E-03 5.00E-03 NA 192E:-07 384E-05 NA NA 612E·OB 1.22E-05 NA I NA
--I iSE·08 3.52E-06 NA NA 17SE-08 352E-06 NA NA 437E-OB 8.75£,"·06 NA NA
Silver -_.
2.ooE-04 5.00E-O'3 NA 1.53E-08 3.Q7E-06 NA NA A 90E-09 9.79E-07 NA I NA , i~E.09 J 282E-07 ._.
NA I NA , 41E-09 2 B2E-07 NA NA 3.50E-09 700r-07 NA NA Tetrachlorodibenzofuran NA 100E-OB 130E+04 NA NA NA NA NA NA NA NA NA NA NA iliA NA NA NA NA NA NA NA NA Telrachlorodibenzo-:p:-dlolCln -- NA 1.00E-09 130E+05 NA NA NA NA NA NA NA NA NA NA NA NA NA NA NA:-=-J NA NA NA NA NA Telrachloroelh lene 5.00E-04 1.00E-02 5.40E-01 384E-OB 384E-06 164E-09 B.B8E-l0 122E-OB 1.2'2E-06 10SE-09 5.67E-l0 352E-09 352E-07 7.0SE-l0 3 BOE·IO 352E·09 3.52E-07 3.52E-l0 1.90E-l0 8.75E-09 B.75E:·07 37SE-09 202E·09 Thallium NA NA NA NA NA NA NA NA NA NA NA NA NA
- --NA NA NA NA NA NA NA NA NA NA
Toluene 500E-04 800E-02 NA 384E-OB 4.79E-07 NA NA 122E·08 1 ~3E-07 NA NA 352E-09 " 40E-08 NA NA 352E-09 440E-08 NA NA 8.75E-09 109E-07 NA NA Tribul I phosphate NA 200E-Ol 9.20E·03 NA NA NA NA NA NA NA NA NA NA NA NA NA NA NA NA NA NA NA NA Tnchloroelh lene 500E-04 NA 590E-03 NA NA 164E-09 970E-12 NA NA 105E-09 619E-12 NA NA 705E-IO 4.16E-12 NA NA 3.52E-l0 20BE-12 NA NA 375E-09 221E-11 Tnfiuorochloromelhane NA 300E-01 NA NA NA NA NA NA NA NA NA NA NA NA NA NA -".- NA NA NA NA NA NA Uranium 214E-02 300E-03 NA 164E-06 5.46E-04 ~ NA 5.23E-07 174E·04 NA NA 150E-07 5.01E-05 NA NA 1S0E-07 501E·OS NA NA 37<1E·07 1.25E·04 NA NA Vanadium NA 700E-05 NA NA NA NA NA NA NA NA NA NA NA NA NA NA NA NA NA NA NA NA NA Vinyl chklr~e NA 3.QOE-Q3 720E-Ol NA NA NA NA NA NA NA NA NA NA NA NA NA NA NA NA NA " NA NA Xy1enes 500E-04 2.00E-Ol NA 3.B4E·08 192E-07 NA NA 122E-08 612E-OB NA NA 3.52E-09 176E-08 NA NA 352E·09 1.76E-08 NA NA 875E-09 437E-08 NA NA ZInc NA 3.00E·Ol NA NA NA NA NA NA NA NA NA NA NA NA NA NA NA NA NA NA NA NA NA
0total 5.86E-04 total 1.20E-07-NA =not applicable
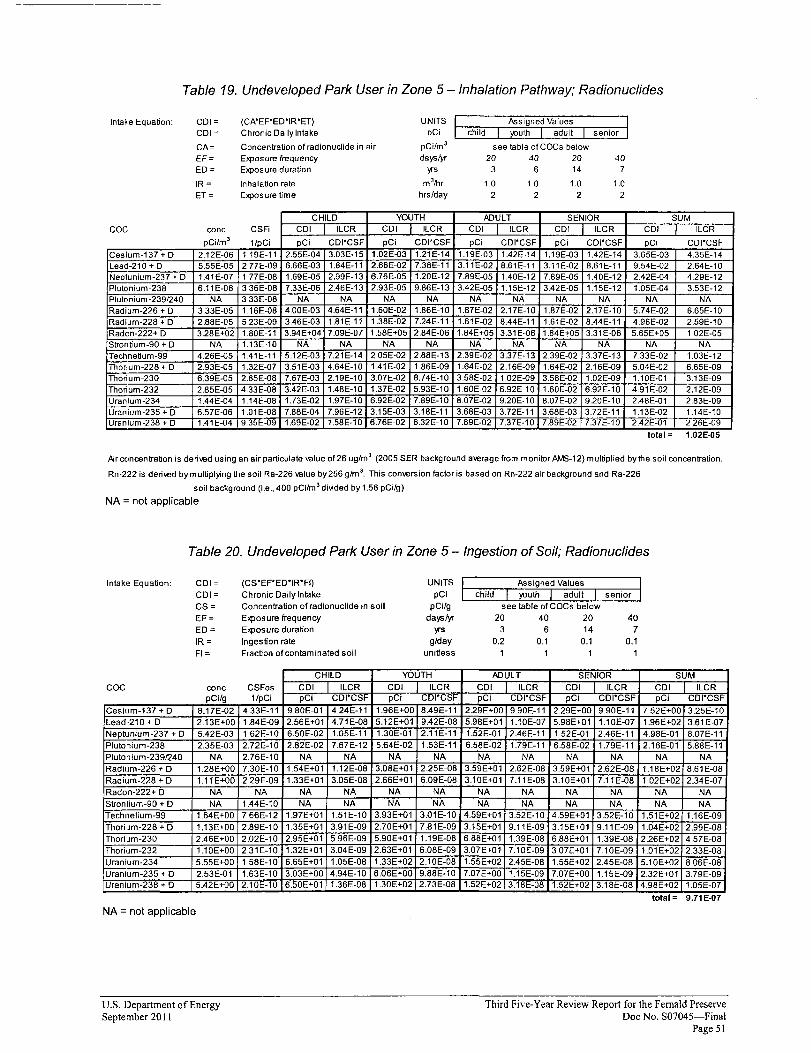
see table of COCs below
Table 19. Undeveloped Park User in Zone 5 -Inhalation Pathway; Radionuclides
Inta,e Equation: CDI= (CNEF·ED·IR·ET) UNITS
CDI= Chronic Daily Intake pCi
CA= Concentration of radionuclide in air pCi/m 3
EF= Expos ure frequency dayslyr 20 40 20 40 ED = Exposure duration yrs 3 6 14 7
IR= Inhalation rate m3111r 1.0 1.0 1.0 1.0 ET= Exposure time hrs/day 2 2 2 2
COC conc
pCi/m 3
CSFi
l/pCi
CHILD YOUTH ADULT SENIOR SUM CDI ILCR CDI I ILCR CDI ILCR CDI ILCR CDI ILCR
pCi CDt·CSF pCi CDI·CSF pCi CDI·CSF pCi CDI·CSF pCi CDI·CSF
Cesium-137 + D 2.12E-06 119E-ll 2.SSE-04 3.03E-1S 1.02E-03 1.21E-14 1.19E-03 1.42E-14 1.19E-03 1.42E-14 3.6SE-03 4.3SE-14 Lead-210 + D S.SSE-OS 277E-09 6.66E-03 1.B4E-ll 2.66E-02 7.3BE-l1 3.11E-02 B.61E-ll 3.11E-02 B.61E-ll 9.S4E-02 2.64E-l0 Neptunium-237 + D 1.41 E-07 1.77E-OB 1.69E-OS 2.99E-13 6.76E-OS 1.20E-12 7.B9E-OS 1.40E-12 7.B9E-OS 1.40E-12 2.42E-04 429E-12 Plutonium-23B 6.11E-OB 3.36E-OB 7.33E-06 2.46E-13 2.93E-OS 9.B6E-13 3.42E-OS 1.1SE-12 3.42E-OS 1.lSE-12 1.0SE-04 3.S3E-12 Plute,nium-2391240 NA 333E-OB NA NA NA NA NA NA NA NA NA NA Radium-226 + D 3.33E-OS 1.16E-OB 400E-03 4.64E-ll 1.60E-02 1.B6E-l0 1.B7E-02 2.17E-l0 1.B7E-02 2.17E-l0 S.74E-02 6.6SE-l0 Radium-22B + D 2.BBE-OS S 23E-09 3.46E-03 1.B1E-l1 1.3BE-02 7.24E-ll 1.61E-02 B.44E-l1 1.61E-02 B.44E-l1 4.96E-02 2.S9E-l0 Radon-222+ D 3.2BE+02 1.BOE-l1 3.94E+04 7.09E-07 1.SBE+OS 2.B4E-06 1.B4E+OS 3.31E-06 1.B4E+OS 3.31E-06 S.6SE+OS 1.02E-OS Strontium-90 + D NA 1.13E-l0 NA NA NA NA NA NA NA NA NA NA Technetium-99 426E-OS 1.41 E-l1 S.12E-03 7.21E-14 2.0SE-02 2.BBE-13 2.39E-02 3.37E-13 2.39E-02 3.37E-13 7.33E-02 1.03E-12 Thonum-22B + D 2.93E-OS 1.32E-07 3.S1E-03 4.64E-l0 1.41 E-02 1.B6E-09 1.64E-02 2.16E-09 1.64E-02 2.16E-09 S.04E-02 6.6SE-09 Thorium-230 6.39E-OS 2.BSE-OB 7.67E-03 2.19E-l0 3.07E-02 B.74E-l0 3.SBE-02 1.02E-09 3.SBE-02 1.02E-09 1.10E-Ol 3.13E-09 Thorium-232 2.BSE-OS 4.33E-OB 3.42E-03 1.4BE-l0 1.37E-02 S.93E-l0 1.60E-02 6.92E-l0 1.60E-02 6.92E-l0 4.91E-02 2.12E-09 Uranium-234 1.44E-04 1.14E-OB 1.73E-02 1.97E-l0 6.92E-02 7.B9E-l0 B.07E-02 9.20E-l0 B.07E-02 9.20E-l0 2.4BE-Ol 2.B3E-09 Uranium-23S + D 6.S7E-06 1.01E-OB 7.BBE-04 7.96E-12 3.1SE-03 3.1BE-ll 3.6BE-03 3.72E-ll 3.6BE-03 3.72E-ll 1.13E-02 1.14E-l0 Uranium-23B + D 1.41E-04 9.3SE-09 1.69E-02 1.SBE-l0 6.76E-02 6.32E-l0 7.B9E-02 7.37E-l0 7.B9E-02 7.37E-l0 2.42E-Ol 226E-09
lolal = 1.02E-OS
Air concentratiDn is derived using an air particulate value of26 ug/m 3 (200S SER background average from I'lDnitor AMS-12) multiplied by the sDil concentration.
Rn-222 is derived by multiplying the soil Ra-226 value by 2S6 g/m 3. This cDnversiDn factor is based on Rn-222 air background and Ra-226
soil background (i.e., 400 pCi/m 3 divided by 1.S6 pCi/g)
NA =not applicable
Table 20. Undeveloped Park User in Zone 5 - Ingestion of Soil; Radionuclides
Intake Equation: CDI= (CS·EF·ED·IWFI) UNITS
CDI= Chronic Daily Inlake pCi
CS= CDncentratiDn of radiDnuciide in soil pCi/g EF= Exposure frequency dayslyr 40 ED= Exposure duration yrs 3 6 14 7 IR= IngestiDn rate g/day 0.2 0.1 0.1 0.1 FI= FractiDn of cDntam inated soil unitless
COG conc pCi/g
Cesium-137 + D B.17E-02 Lead-210 + D 2.l3E+OO Neptunium-237 + D S.42E-03 Plutonium-238 2.3SE-03 Plutonium-2391240 NA Radium-226 + D l.2BE+OO Radium-22B + D 1.11E+OO Radon-222+ D NA Strontium-90 + D NA Technetium-99 1.64E+00 Thori Jm-22B + D 1.13E+OO ThDri Jm-230 2.4SE+OO ThorioJm-232 1.10E+OO Uranium-234 5.55E+OO Uranium-235 + D 2.S3E-Ol Uranium-23S + D 5.42E+OO
CHILD YOUTH
CSFos CDI L ILCR CDI I ILCR l/pCi pCi CDI·CSF pCi CDI·CSF
4.33E-l1 9.BOE-Ol 4.24E-ll 1.96E+00 B.49E-ll
1.B4E-09 2.56E+Ol 4.71E-OB 5.12E+Ol 9.42E-OB
1.62E-l0 6.S0E-02 1.0SE-ll 1.30E-Ol 2.11E-ll
2.72E-l0 2.82E-02 7.67E-12 S.64E-02 1.S3E-l1
2.76E-l0 NA NA NA NA 7.30E-l0 1.S4E+Ol 1.12E-OB 3.0BE+Ol 2.2SE-OB
2.29E-09 1.33E+Ol 3.0SE-OB 2.66E+Ol 6.09E-OB
NA NA NA NA NA
1.44E-l0 NA NA NA NA 7.S6E-12 1.97E+Ol 1.SlE-l0 3.93E+Ol 3.01E-l0
2.S9E-l0 1.35E+Ol 3.91E-09 2.70E+Ol 7.81E-09
2.02E-l0 2.95E+Ol S.96E-09 5.90E+Ol 1.19E-OB
2.31E-l0 1.32E+Ol 3.04E-09 2.63E+Ol 6.0BE-09
1.SSE-l0 6.6SE+Ol 1.0SE-OB 1.33E+02 2.l0E-OB
1.63E-l0 3.03E+OO 4.94E-l0 6.06E+OO 9.SSE-l0 2.10E-l0 6.50E+Ol 1.3SE-OS 1.30E+02 2.73E-OS
ADULT SENIOR SUM CDI ILCR CDI I ILCR CDI I ILCR pCi CDI·CSF pCi CDI·CSF pCi CDI·CSF
2.29E+OO 9.90E-l1 2.29E+00 9.90E-l1 7.S2E+00 3.2SE-l0 5.98E+Ol 1.10E-07 5.9BE+Ol 1.l0E-07 1.96E+02 3.61E-07 1.S2E-Ol 2.46E-ll 1.S2E-Ol 2.46E-ll 4.9BE-Ol B.07E-ll 6.S8E-02 1.79E-l1 6.SBE-02 1.79E-1l 2.l6E-Ol S.B8E-l1
NA NA NA NA NA NA 3.59E+Ol 2.62E-OB 3.S9E+Ol 2.62E-08 1.1BE+02 B.61E-OB 3.10E+Ol 7.llE-OB 3.l0E+Ol 7.11E-OB 1.02E+02 2.34E-07
NA NA NA NA NA NA NA NA NA NA NA NA
4.59E+Ol 3.S2E-l0 4.S9E+Ol 3.52E-l0 1.51E+02 1.16E-09 3.l5E+Ol 9.11E-09 3.1SE+Ol 9.11E-09 1.04E+02 2.99E-OS 6BBE+Ol 1.39E-OB 6.SSE+Ol 1.39E-OB 2.26E+02 4.S7E-OS 3.07E+Ol 7.l0E-09 307E+Ol 7.l0E-09 1.01E+02 2.33E-OB 1.S5E+02 2.4SE-OB 1.S5E+02 2.45E-OB 5.10E+02 B.OSE-OB 7.07E+OO 1.1SE-09 7.07E+OO 1.l5E-09 2.32E+Ol 3.79E-09 1.S2E+02 3.1BE-OS 1.S2E+02 3.1SE-OS 4.9SE+02 1.05E-07
lotal - 9.71 E-07
NA = not applicable
U.S. Department of Energy Third Five-Year Review Report for the Fernald Preserve September 2011 Doc No. S07045-Final
Page 51
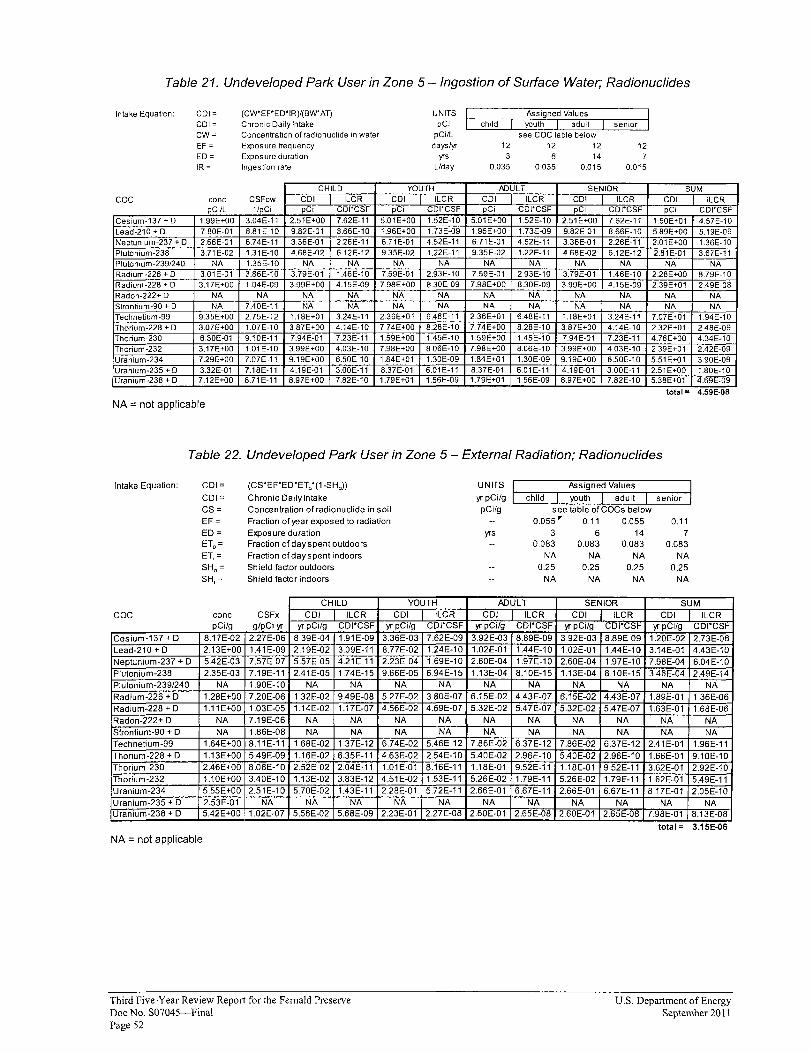
Table 21. Undeveloped Park User in Zone 5 -Ingestion of Surface Water; Radionuclides
Intake Equation: CDI~ (CWEF'ED'IR)I(BWAT) UNITS CDI ~ Chronic Daily Intake pCi CW= Concentration of radionuclide in water pC ilL EF= Exposure frequency daysl,.- 12 12 ED = Exposure duration ,.-S 3 14 7 IR ~ Ingestion rate Liday 0035 0035 0.015 0.015
COC cone pCilL
CSFow 11pCi
CHILD YOUTH ADULT SENIOR SUM CDI I ILCR CDI ILCR CDI ILCR CDI I ILCR CDI I ILCR pCi CDI'CSF pCi CDI'CSF pCi CDI'CSF pCi CDI'CSF pCi CDI'CSF
Cesium-137 + D 1.99E+00 3.04E-11 2.51E+00 7.62E-11 5.01 E+OO 1.52E-10 5.01 E+OO 1.52E-10 2.51 E+OO 7.62E-11 1.50E+01 4.57E-10 Lead-210 + D 7.80E-01 8.81E-10 9.82E-01 8.66E-10 1.96E+00 1.73E-09 1.96E+00 1.73E-09 9.82E-01 8.66E-10 5.89E+00 5.19E-09 Neptunium-237 + D 2.66E-01 6.74E-11 3.36E-01 2.26E-11 6.71E-01 4.52E-11 6.71E-01 4.52E-11 3.36E-01 2.26E-11 2.01E+00 1.36E-10 Plutonium-238 3.71 E-02 1.31E-10 4.68E-02 6.12E-12 9.35E-02 1.22E-11 9.35E-02 1.22E-11 4.68E-02 6.12E-12 2.81E-01 3.67E-11 Plutonlum-2391240 NA 1.35E-10 NA NA NA NA NA NA NA NA NA NA Radium-226 + D 3.01E-01 3.86E-10 3.79E-01 1.46E-10 7.59E-01 2.93E-10 7.59E-01 2.93E-10 3.79E-01 1.46E-10 2.28E+00 8.79E-10 Radium-228 + D 3.17E+00 1.04E-09 3.99E+00 4.15E-09 7.98E+00 8.30E-09 7.98E+00 8.30E-09 3.99E+00 4.15E-09 2.39E+01 2.49E-08 Radon-222+ D NA NA NA NA NA NA NA NA NA NA NA NA Strontium·gO + 0 NA 7.40E-11 NA NA NA NA NA NA NA NA NA NA Teehnetium-99 9.35E+00 2.75E-12 1.18E+01 3.24E-11 2.36E+01 6.48E-11 2.36E+01 6.48E-11 1.18E+01 3.24E-11 7.07E+01 1.94E-10 Thorium -228 + D 3.07E+00 1.07E-10 3.87E+00 4.14E-10 774E+00 8.28E-10 7.74E+00 8.28E-10 3.87E+00 4.14E-10 2.32E+01 2.48E-09 Thorium-230 6.30E-01 9.10E-11 7.94E-01 7.23E-11 1.59E+00 1.45E-10 1.59E+00 1.45E-10 7.94E-01 7.23E-11 4.76E+00 4.34E-10 Thorium-232 3.17E+00 1.01E-10 3.99E+00 4.03E-10 7.98E+00 806E-10 7.98E+00 8.06E-10 3.99E+00 403E-10 2.39E+01 2.42E-09 Uranium-234 7.29E+00 7.07E-11 9.19E+00 6.50E-10 1.84E+01 1.30E-09 1.84E+01 1.30E-09 9.19E+00 6.50E-10 5.51 E+01 3.90E-09 Uranium-235 + 0 3.32E-01 7.18E-11 4.19E-01 3.00E-11 8.37E-01 6.01E-11 8.37E-01 6.01E-11 4.19E-01 3.00E-11 2.51 E+OO 1.80E-10 Uranium-238 + D 7.12E+00 8.71E-11 8.97E+00 7.82E-10 1.79E+01 1.56E-09 1.79E+01 1.56E-09 8.97E+00 7.82E-10 5.38E+01 4.69E-09
total -- 4.S9E-OB
NA = not applicable
Table 22. Undeveloped Park User in Zone 5 - External Radiation; Radionuclides
Intake Equation: CDI= (CS'EF'EO'ETa'(1-SHo)) UNITS
COI= Chronic Daily Intake yr pCilg CS= Concentration of radionuclide in soil pCilg EF = Fraction of year exposed to radiation 0.11 ED = Exposure duration yrs 6 14 7 ETa= Fraction of dayspent outdoors 0.OB3 0.OB3 0.OB3 ET, = Fraction of day s pent indoors NA NA NA NA SHa= Shield factor outdoors 0.25 0.25 0.25 0.25 SH; = Shield factor indoors NA NA NA NA
CHILD YOUTH
COC cone CSFx COl I ILCR pCilg glpCi yr yr pCilg COI'CSF
Cesium-137+0 B.17E-02 2.27E-06 B.39E-04 1.91E-09
Lead-210 + 0 2.13E+00 1.41E-09 2.19E-02 3.09E-11
Neptunium-237 + 0 5.42E-03 7.57E-07 5.57E-05 4.21E-11
Plutonium-23B 2.35E-03 7.19E-11 2.41 E-05 1.74E-15
Plutonium-2391240 NA 1.90E-10 NA NA
Radium-226 + 0 1.2BE+00 7.20E-06 1.32E-02 9A9E-OB
Radium-22B + 0 1.11E+00 1.03E-05 1.14E-02 1.17E-07
Radon-222+ 0 NA 7.19E-06 NA NA Strontium-90 + 0 NA 1.B6E-OB NA NA Technetium-99 1.64E+00 B.11E-11 1.6BE-02 1.37E-12
Thorium-22B + 0 1.13E+00 5.49E-09 1.16E-02 6.35E-11 Thorium-230 2.46E+00 B.OBE-10 2.52E-02 2.04E-11
Thorium-232 1.10E+OO 3.40E-10 1.13E-02 3.B3E-12
Uranium-234 5.55E+00 2.51E-10 5.70E-02 1.43E-11
Uranium-235 + 0 2.53E-01 NA NA NA Uranium-238 + 0 5.42E+OO' 1.02E-07 5.56E-02 5.6BE-09
COl I ILCR yr pCilg COI'CSF
3.36E-03 7.62E-09 B.77E-02 1.24E-10 2.23E-04 1.69E-10 9.66E-05 6.94E-15
NA NA
5.27E-02 3.BOE-07 4.56E-02 4.69E-07
NA NA NA NA
6.74E-02 5.46E-12
4.63E-02 2.54E-10 1.01E-01 B.16E-11 4.51E-02 1.53E-11 2.28E-01 5.72E-11
NA NA 2.23E-01 2.27E-OB
ADULT COl I ILCR
yr pCilg COI'CSF
3.92E-03 B.B9E-09 1.02E-01 1.44E-10 2.60E-04 1.97E-10 1.13E-04 B.10E-15
NA NA 6.15E-02 4.43E-07 5.32E-02 5.47E-07
NA NA NA NA
7.B6E-02 6.37E-12 5.40E-02 2.96E-10 1.1BE-01 9.52E-11 5.26E-02 1.79E-11 2.66E-01 6.67E-11
NA NA 2.60E-01 2.65E-OB
SENIOR SUM COl I
yr pCilg
3.92E-03 1.02E-01 2.60E-04 1.13E-04
NA 6.15E-02 5.32E-02
NA NA
7.86E-02 5.40E-02 1.1BE-01 5.26E-02 2.66E-01
NA 2.60E-01
ILCR COl I ILCR COI'CSF yr pCi/g COI'CSF B.B9E-09 1.20E-02 2.73E-OB 1.44E-10 3.14E-01 4.43E-10 1.97E-10 7.98E-04 6.04E-10 B.10E-15 3.46E-04 2.49E-14
NA NA NA 4.43E-07 1.B9E-01 1.36E-06 5.47E-07 1.63E-01 1.6BE-06
NA NA NA NA NA NA
6.37E-12 2.41 E-01 1.96E-11 2.96E-10 1.66E-01 9.10E-10 9.52E-11 3.62E-01 2.92E-10 1.79E-11 1.62E-01 5.49E-11 6.67E-11 8.17E-01 2.05E-10
NA NA NA 2.65E-OB 7.9BE-01 B.13E-OB
101al- 3.1SE-06
NA = not applicable
Third Five-Year Review Report for the Fernald Preserve U.S. Department of Energy Doc No. S07045-Final September 20 II Page 52
6.2.8 Ecological Risk
A screening-level ecological risk assessment was conducted as part of the OU5 RI. Both radiological and nonradiological risks were evaluated. For radiological risks, dose estimates were calculated for several ecological receptors at the Fernald Preserve. For nonradiological risks, media-specific contaminant concentrations were compared to literature-based benchmark toxicity values (BTVs). BTVs are concentrations that are considered protective of ecological receptors. The RI risk assessment concluded that several constituents warranted further investigation. Since the evaluation ofnonradiological risks was a screening-level assessment only, the OU5 ROD did not commit to any cleanup based on risk to ecological receptors. Instead, potential ecological risks would be revisited following remedial activities. The Site-Wide Excavation Plan (SEP) (DOE 1998b) initiated the implementation of this approach by refining the nonradiological risk screening and by defining remediation areas where ecological risk might be a concern following excavation. These area-specific ecological constituents of concern were investigated as part of the certification process following soil remediation. Surface water and sediment constituents of concern were also monitored, along with an evaluation of cross-media impacts, with no resulting issues.
A review of the assumptions associated with receptor organisms, exposure pathways, calculation parameters, and the target level radiological dose are still valid. For nonradiological risk, a cursory review of screening benchmarks was conducted as well. Since completion of the SEP, a number of updated BTV values have been published, for a variety of ecological receptors and media. A summary of this effort for soil and surface water is shown in Tables 23 and 24. The updated screening values were obtained from the RAIS, available online at http://rais.ornl.gov/. Soil benchmarks for specific parameters were obtained from the EPA Guidance for Developing Ecological Soil Screening Levels (EPA 2003a) and EPA Region 5 RCRA ecological screening levels (EPA 2003b). The lowest above-background concentration from these two sources was used to compare against the BTVs established in the OU5 RI and SEP. A similar approach was also used for surface water, with updated screening values obtained from EPA (2002, 2003b). Other than evaluating against background concentrations, no site-specific conditions were taken into consideration, such as adjustments due to pH, water hardness, receptors, etc.
Both soil and surface water screening values were then compared to zone-specific maximum concentrations from the IRRA. As Table 23 and 24 show, some zone concentrations do exceed the new screening values. However, this does not mean that the remedy is not protective of ecological receptors. BTVs are simply media concentrations that are considered protective of ecological receptors. EPA guidance for ecological risk assessment considers BTV s as only one of multiple factors in the screening process to determine whether or not to proceed with an ecological risk assessment.
Field data from ecological surveys and wetland mitigation monitoring have shown a diverse and growing ecosystem. No signs of toxicological stress have been observed during field activities. Therefore, at this time the prudent course of action is to re-evaluate the literature during subsequent CERCLA 5 year reviews. If it is determined that a full-scale ecological risk assessment is warranted, it will be conducted as part of the final Residual Risk Assessment, to be conducted following completion of the groundwater remedy.
6.2.9 Review of Maximum Contaminant Levels (MCLs)
None of the 50 groundwater constituents of concern had changes in MCLs from the last five-year review.
U.s. Department of Energy Third Five-Year Review Report for the Fernald Preserve September 2011 Doc No. S07045-Final
Page 53
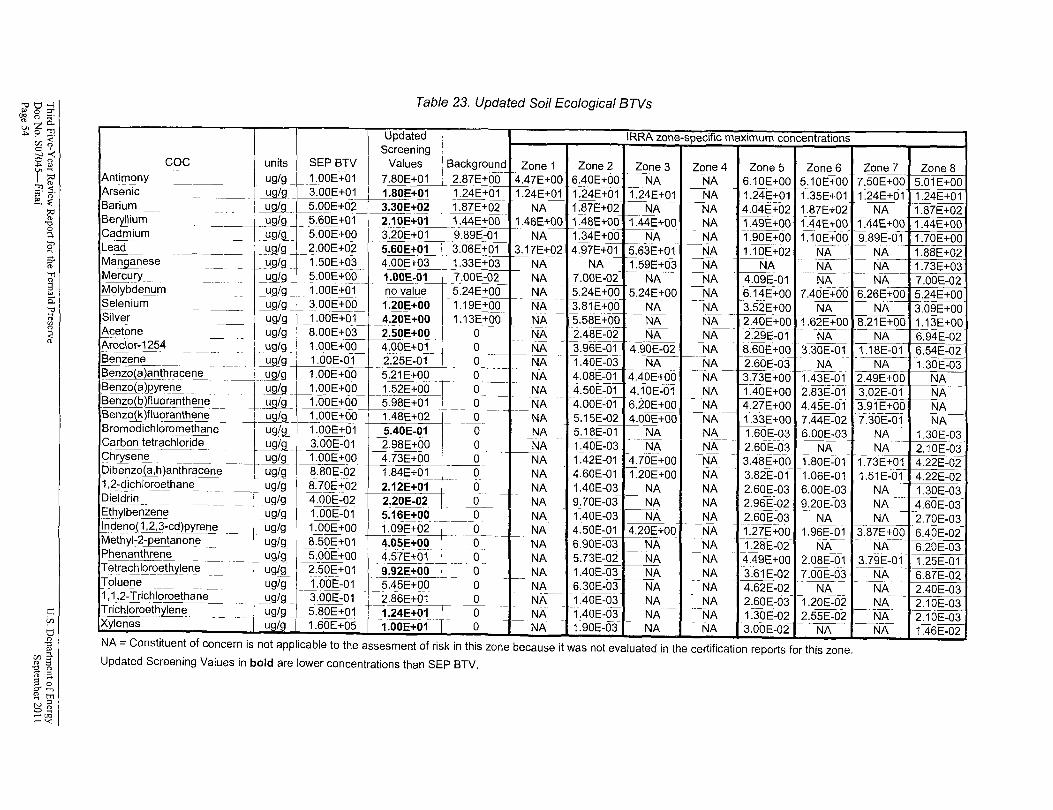
Table 23. Updated Soil Ecological BTVs
IRRA zone-specific maximum concentrations SE I UpdatedScreening
COC units I SEP BTV I Values Backgrou_nd ~one ~ _ Zone 2 ~()n~} Zone 4 _ Zone 5 Zon~~ ...Jone 7 . ~ne 8 ,A.ntirn.<lny ___ ug/g_+ 1.00E+01 _. 7.80E+01 2.87E+OO 4.47E+OO 6.40E+OO NA _~A_. ~c10E:.+OO 5.10E~Q9 7.50E+00 5.01E+00 Arsenic ...I.Jg{g 3.00E+01=ll.80E+01 11.24E+01 1.24E+01 1.24E+01 1.24E+01 NA 1.24E+01 1.35E+01 1.24E+01 1.24E+01 Barium -- ---- ug/g-H-5'jOOE+02 3.30E+02 1.87E+oT ~- 1.87E+02f---"'~ - -NA - 4.04E+02r-1.87E+02 NA 1.87E+02 ~ium -__ -- ug/g-- _5.§o.E+o.1-. -.2.1!l_E~~L~1.44E.=-~.o.o.-- 1.46E+.QQ.~~48E+().2. ~44E-+o.o. 1-_ NA. _ .1,49E:,:Oo.- -~44E:T.Qo._ 1.44E+o.o. 1.44E+o.o. ~admiuJl1__ _ .!:l91l. __5.0Q.E+Oo. 3.20E+QL _9.8~E-o.~ f\J...A. __ ..!1.4E+Oo. r-- NA __ f'J.A. 1.9o.E+·OOr-1.10E+o.o. 9.89E-o.1 1.70E+o.o. Lead ug/g 2.0o.E+o.2 5.60E+01 3.o.6E+01 3.17E+o.2 4.97E+o.1 5.63E+o.1 NA 1.1o.E+o.2 NA NA 1.88E+o.2
;~~e ~=u =~~~~~J ~:~~~:~t ~=[~~~~_ ~~ _;~o.~~5~~+o.-3_~~u~~ _uu ~= r-' ~~ ~'.~~~~g~ Molybdenum ___U911LI. 1'()Q.E+o.1 no val~e _5.24~~ r-' _~ _ ~.24E+o._0 .5}4E+o.o. __ NA6.1_~E+o.o. 7.40E+o.o. 6.26E+o.o. 5.24E+o.o. ~Ienium ____ ug/g 3.o.o.E+Oo. 1.20E+OO 1.19E+o.o. NA 3.81 E+o.o. NA NA 3.52E+OO NA NA 3.09E+Oo. ~_ -- ug/g-~_1.()OE+01__4.?OE+OO 1.13E:;gO NA 1}i8E+o.Q~ ~ NA 2~~OE:T.00 1.6,2E+o.O 8.21E+o.o. 1.13E+00--=-Acetone ug/g 8.o.OE+03 2.S0E+OO I 0 NA 2.48E-o.2 NA NA 2.29E-o.1 NA NA 6.94E-02 Arodor-1254 -.-- ---<i9l9 I 1.00E+00 4.00E+cii j_ 0_ NA. '-",BE-O" ~90E-02, _NA B.60E+OO 3.30E.()1 1.lBE-Ol 6.54E-02Benzene - -- ug/g 1.0o.E-o.1 2.25E-o.1 0. NA 1.4o.E-o.3 NA NA -2.6OE~03- NA - - NA 1.30E-03 E3enzo(a)an_thrac~~--_ ug/g I 1.o.o.E+o.O 1·21 E+o.O ~ 0. -~~ NA 4.o.8E-OT 4AOE+o.O :-. N.A._ ~!3E:~ 1.43E-o.1 2.49E+o.O NA BenzQ.(?l[lyre_n~ .. __ llJ91!.- 1.o.OE+QO__1c52E+Q.Q.... ___0._ _ NA _ 4.50E-o.1 4.1o.E-o.1 __ NA 1.4o.E+o.o. 2.8~E-01 3.o.2E-01 NA Benzo(b)fluoranthene __ _ug/9... ~.Oo.E+OO_~.98_E+o.1 t--- 0._ _ NA 4.o.o.E-o.T r-6.2o.E+o.O _NA 4.27E+o.o. 4.45E~o.1 3.91E+o.O NA Benzo(k)fluoranthene ug/g 1.o.o.E+o.o. 1.48E+o.2 0. NA 5.15E-o.2 4.0o.E+OO NA 1.33E+o.O 7.44E-02 7.3o.E-01 NAI
Bromodichloromelhane _ _ ug~g==:1.0o.E+01 .J).40E-QL -0 -NA ts.18_E-6T:~. NA- NA ~(()3 ~6.00E-~ NA . __ ~OE-o.3 Carb~tetrachloric:l~_ _ ug/g. __ 2POE-01 ...1.98E+QQ... 0. f_J'·JA 1.:.4PE-~~ NA _NA _~O~..Q}__.J'JA___ NA 2. 1o.E-o.3 Chrysene ug/g 1.o.o.E+Oo. 4.73E+o.o. 0. NA 1.42E-o.1 4.7o.E+o.O NA 3.48E+o.o. 1.8o.E-o.1 1.73E+o.1 4.22E-02 Diben~.Cl(a,h)ant~acene--- ug/g-- 8.8o.E-Q2'-~~84E+or::~=---o--- I-- NA 4.6o.E-01 ~2o.E+o.o. NA 3.82E-o.f -1.06E-o.1 1.51 E-o._1.. ~2E-o.2 1,2-_c!i.c:::hlolQethane_ _ _ . .JJ9Ig Jl.1Q.~:,:02 ~12E+1!!.... 0 _ _ NA 1.4o.E-~~ NA NA _2.60~~ _6.o.o.E-Q3___ NA 1.30E-03 Dieldrin __ __ __ _ ug/g 4.()o.E-o.2 2.20E-()~ 0. _N~ J). 7o.E-o.~ _!'lA__ NA 2.96E~~~ _9..20~-o.3 NA __ ~o.E-03 Ethylbenzene fug/g 1.o.o.E-01 I 5.16E+OO ___0. NA 1.4o.E-o.3 NA NA 2.6o.E-o.3 NA NA 2.7o.E-o.3 Jrlde:nQiili~d)pyrene__ ~_~97g. - -1:G0E+o.O I 1.09802....2.__ I- NA 4,-5o.E-gJ.~o.E+Oo. -NA- J,27E+OO -1~6i==-o} r-3.~7E.+0.0 6.40E-02 Methyl-2-peTltanone ug/g I 8.5o.E+01 4.0SE+OO I 0 NA 6.90E-o.3 NA NA 1.28E-02 NA NA 6.20E-03 Phenanthrene --ug/g 5.o.OE+QO- 4.5iE+CJ1 0. NA 5.73E-o.2 - NA-NA 4A9E+OO Z:o.8E~01 3.79E-o.f 125E-o.1 -------. -- ----.. -- .-----t-- _ __ __ ____ _~ ___ Tetr~chl()r()ilthYlen.e __ .tJ.g/~_ 2,59_E+01 J).92E+~t-_ 0. _I-_J'!.A 1.40E-o.3 r--NA ___ NA 3.6~~.7.0o.E-_O~__ J'l.A_~7E-o.2 Toluene____ _ ug/g 1.o.o.E-01 5.45E+o.O 0 NA 6.3o.E-o.3 NA NA 4.62E-o.2 NA NA 2.40E-o.3 1.1,2-Trichloroetha~ ug/g -3.o.OE-01 . -;Ul6E+CJ1 0 NA-- 1.4o.E-o.3 NA - NA 2.6o.E-03- -Uo.E-=-02 NA 2.1o.E-03 Trichloroethylene.___ _ -llg/g 5.8o.E+o.1 1.24E+01 0- - NA-- 1AOE~b3 NA- -NA 1~3o.E:Q2t-i55E-02 NA 2.10E-03 Xylenes - U9fg-- 1.60E+o.5 1.00E+(i1-- - 0. -NA-- -1:9cjE-03- - NA I-- NA 3.o.(iE~o.2 --NA-- NA 1.46E-02
NA =Constituent of concern is not applicable to the assesment of risk in this zone because it was not evaluated in the certification reports for this zone.
Updated Screening Values in bold are lower concentrations than SEP BTV.
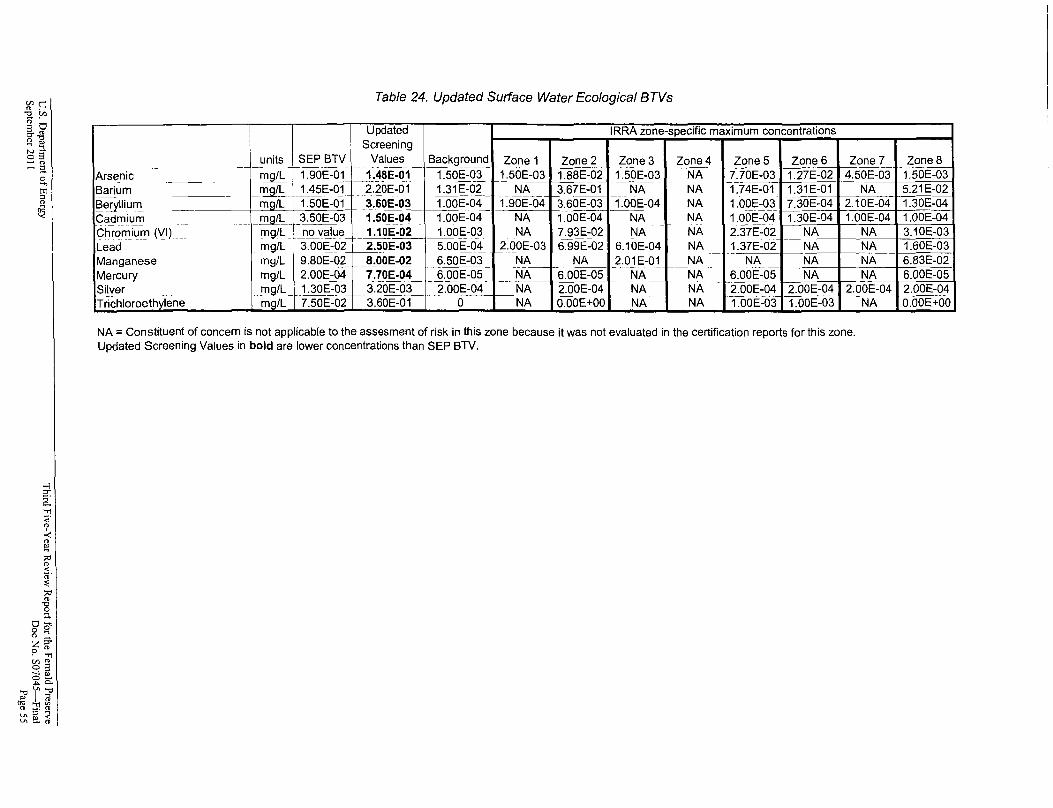
Table 24. Updated Surface Water Ecological BTVs
Updated IRRA zone-specific maximum concentrations Screening
units SEP BTV Values Backgr~und Zone 1 Zone 2 Zone 3 Zone4 Zone 5 Zone 6 Zone 7 - -- - -
'~:!~~~~F - - --- -
Arsenic ~ 1.48E-01 1.50E-03 1.50E-03 1.BBE-02 1.50E-03 NA 7.70E-03 1.27E-02 4.50E-03 ._- ~------- - - ..--
Barium mg/L 2.20E-01 1.31 E-02 NA 3.67E-01 NA NA 1.74E-01 1.31 E-01 NA -- --------- --- f-- --- ~;--
-7~30E-04~e!)'lIium mg/L 1.50E-01 3.60E-03 1.00E-04 1.90E-04 3.60E-O~ 1.00E-04 NA 1.00E-03 2. 1 OE-04
Cadmium _mg/,=-_ 3.50E-03 1.S0E-04 I---:[OOE-04 NA 1.00E-04 NA NA 1.00E=-04 OOE-04 1.00E-04 - - -Np.:- -Ch~on,iuln (\111 _____ 11'lg!1,. ...!1_Q_.vCl!u~_ _ 1.10~~ 1.00E-03 NA 7.93E-02 NA 2.37E-02 NA NA
~-.-- - -- - -
Lead mg/L 3.0_0~Q2_~SOE-03 5.00E-04 2.00E-03 6.99E-02 6.10E-04 NA 1.37E-02 NA NA 6.50E-03
--- - --
Manganese mg/L 9.BOE-02 B.OOE-02 NA NA 2.01 E-01 NA NA NA NA - -- - --:-c-6.00E-05 -NA-- 6:00E-05
- f--NA
- -Mercury mg/L 2.00E-04 7.70E-04 NA 6.00E-05 NA NA
---t------ ------ -- -- -~.--
Silver 1!1_9Lh_ 1.30E-03 3.20E-03 2.00E-04 NA 2.00E-04 NA NA 2.00E-04 2.00E-04 2.00E-04------'
-3.60E-of--~~ -
Trichloroethylene mg/L 7.50E-02 0 NA - O.OOE+OO NA NA 1.00E-03 1.00E-03 NA
NA::: Constituent of concern is not applicable to the assesment of risk in this zone because it was not evaluated in the certification reports for this zone. Updated Screening Values in bold are lower concentrations than SEP BTV.
ZoneB 1.50E-03 5.21E-02 1.30E-04 1.00E-04 3.10E-03 1.60E-03 6.83E-02 6.00E-05 2.00E-04 O.OOE+OO
6.3 Question C: New Information
Question C: Has any other information come to light that could call into question the protectiveness ofthe remedy?
Overall, there has been no information that has indicated either (1) the protectiveness of individual remedies has been compromised or (2) the assumptions underlying the remedies implemented have come into question. While new ecological risk values have been published (discussed above), the ecological restoration that is proceeding has shown no toxicological stresses. There has been no observed natural phenomenon that has compromised the completed remedies or the ongoing operation of the groundwater remedy and care and maintenance of the OSDF. There has been no illegal or malicious behavior that has compromised site operations. As a site that is open to the public, visitor behavior is tracked and evaluated.
6.3.1 Technical Assessment Summary
According to the data collected and reviewed, the inspections conducted, and the stakeholder feedback received, the remedies are functioning as intended by the five RODs. There have been no changes in the physical conditions of the site that would affect the protectiveness of the remedies. There have been no significant changes to the ARARs cited in the individual RODs. There have been no changes in the toxicity factors for the contaminants of concern or risk assessment methodologies that could affect the remedies. There is no new information or activities that call into question the protectiveness of the remedies.
The groundwater remedy is generally progressing as predicted through modeling, and the performance of the OSDF cap and liner systems have been well within the original design requirements. Implementation of the required institutional controls and access/use restrictions of the site have been effective to ensure the land use is consistent with stakeholder expectations, established clean-up levels, and public use as an undeveloped park with an emphasis on wildlife.
Third Five-Year Review Report for the Fernald Preserve U.s. Department of Energy Doc No. S07045-Final September 2011 Page 56
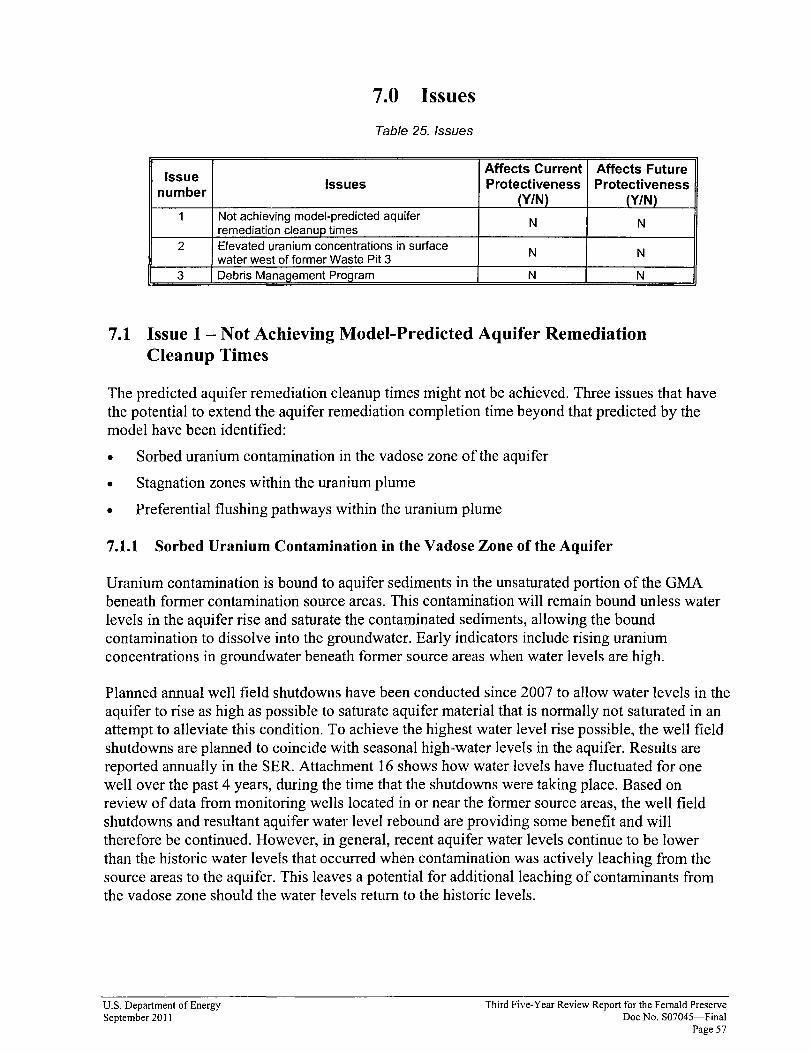
7.0 Issues
Table 25. Issues
Issue number
Issues Affects Current Protectiveness
(YIN)
Affects Future Protectiveness
(YIN) 1 Not achieving model-predicted aquifer
remediation cleanup times N N
2 Elevated uranium concentrations in surface water west of former Waste Pit 3
N N
3 Debris Management Program N N
7.1 Issue 1- Not Achieving Model-Predicted Aquifer Remediation Cleanup Times
The predicted aquifer remediation cleanup times might not be achieved. Three issues that have the potential to extend the aquifer remediation completion time beyond that predicted by the model have been identified:
• Sorbed uranium contamination in the vadose zone of the aquifer
• Stagnation zones within the uranium plume
• Preferential flushing pathways within the uranium plume
7.1.1 Sorbed Uranium Contamination in the Vadose Zone of the Aquifer
Uranium contamination is bound to aquifer sediments in the unsaturated portion of the GMA beneath former contamination source areas. This contamination will remain bound unless water levels in the aquifer rise and saturate the contaminated sediments, allowing the bound contamination to dissolve into the groundwater. Early indicators include rising uranium concentrations in groundwater beneath former source areas when water levels are high.
Planned annual well field shutdowns have been conducted since 2007 to allow water levels in the aquifer to rise as high as possible to saturate aquifer material that is normally not saturated in an attempt to alleviate this condition. To achieve the highest water level rise possible, the well field shutdowns are planned to coincide with seasonal high-water levels in the aquifer. Results are reported annually in the SER. Attachment 16 shows how water levels have fluctuated for one well over the past 4 years, during the time that the shutdowns were taking place. Based on review of data from monitoring wells located in or near the former source areas, the well field shutdowns and resultant aquifer water level rebound are providing some benefit and will therefore be continued. However, in general, recent aquifer water levels continue to be lower than the historic water levels that occurred when contamination was actively leaching from the source areas to the aquifer. This leaves a potential for additional leaching of contaminants from the vadose zone should the water levels return to the historic levels.
u.s. Department of Energy Third Five-Year Review Report for the Fernald Preserve September 2011 Doc No. S07045-Final
Page 57
7.1.2 Stagnation Zones within the Uranium Plume
Stagnation zones exist within the uranium plume. These stagnation zones are created by the competition of extraction wells for water within the aquifer. A stagnation zone, between the South Plume extraction wells and the South Field extraction wells, appears to be impacting the remediation of an off-property lobe of contamination just south of Willey Road. Attachment 17 is a map that shows the maximum uranium plume (as of June 2010) in relation to the time-oftravel remediation footprint predicted by the groundwater model for the Waste Storage Area (Phase II) Remediation Design. Additional direct-push sampling is being planned to provide an update of uranium concentrations within this lobe. Changes to the aquifer remedy may be needed to address this off-property lobe of contamination. Changes that could be considered include: changing the pumping rates of existing extraction wells; converting an out-of-service injection well just north of the lobe into an extraction well; and/or installing a new extraction well south of the lobe. Any change to the aquifer remedy to address this lobe of contamination will likely be complicated by landowner concerns, due to its off-property location.
7.1.3 Preferential Flushing Pathways within the Uranium Plume
The GMA is both heterogeneous and anisotropic. Groundwater flowing through the aquifer matrix seeks the pathway of least resistance to the extraction wells. The result is that coarser grained aquifer material is flushed of contamination more effectively than the finer grained aquifer material because more water is moving through the coarser material. Contamination sorbed to the finer grained aquifer material slowly leaches out into the more active flow paths. Over time, this ineffective flushing of the finer grained material results in reduced cleanup efficiency and prolonged cleanup times. The constant pumping rate being maintained at each extraction well may be contributing to this possible condition. Indirect evidence that preferential flow paths may have been established is the increasingly asymptotic nature of the decreasing uranium concentration trends of the extraction wells and the relatively stable extent of the boundary of the maximum uranium plume. Operational changes to the aquifer remedy may be needed to address this issue. Operational changes could include changing the pumping rates of existing extraction wells, pulse-pumping the existing extraction wells, and/or installing additional extraction wells.
7.2 Issue 2 - Elevated Uranium Concentrations in Surface Water West of Former Waste Pit 3
In late 2006, during the course of routine sampling of several surface water locations, OEPA produced results that were above the surface water FRL for uranium (530 flg/L). DOE generally confmned these sampling results in early 2007.
The location in question is a series of small puddles and drainage ditches due west of the center of former Waste Pit 3, which drain generally south to a depression near the former cement pond. This area does not drain directly to Paddys Run creek. The area of impact at peak water retention is approximately one-half acre, and the actual surface water area is much less than that.
Even though the area in question underwent a rigorous soil certification process, and all certification samples from this area were well below the soil certification FRLs, DOE proposed a study to investigate the leachability of the residual uranium present in the surface soils in the area to gain a better understanding of the reason for the persistently elevated concentrations of
Third Five-Year Review Report for the Fernald Preserve u.s. Department of Energy Doc No. S07045-Final September 20 I I Page 58
uranium in the ponded surface waters. The results of this study confirmed that surface soil uranium concentrations in the area are below the prescribed soil FRL, but the uranium present is generally more leachable than in other areas of the Fernald Preserve. Further, because of these differing leachability characteristics, it was concluded that the possibility of an unknown source of uranium contamination in the area is unlikely.
Although certification had been achieved, compliance with the OUS Record of Decision was established, and the area of elevated uranium concentrations posed no off-site impacts, DOE implemented a maintenance action as a good faith effort to address OEP A concerns. The scope of the maintenance action was to remove approximately 6 inches of soil from the surface of the area. The removed material was: (1) transported to a topographically higher location and distributed sufficiently to prevent extended contact time with ponding rain water (thus to reduce leaching of the residual uranium), (2) treated with high phospholUs content fertilizer to further reduce leachability, and (3) adequately revegetated to stop erosion and spread of this soil. The scraped area and nearby depressions were filled and graded (to reduce or eliminate future ponding) and reseeded. This maintenance action was conducted between September 24 and October 3,2007.
New surface water monitoring locations were established in this area in 2007 to track and trend uranium concentrations. It would appear, based on a review of this data, that the maintenance action undertaken has not achieved its goal of significantly reducing surface water uranium concentrations in this area. Continued high surface water uranium concentration in this area may eventually impact the aquifer cleanup as it is a likely source of ongoing contamination to the aquifer.
7.3 Issue 3 - Debris Management Program
During routine care and maintenance activities as well as routine inspections of the site, debris from remediation activities has been found. This debris typically is in the form of pieces of concrete, brick, tile, and metal. As debris is found, it is flagged and undergoes a radiological scan to determine its disposition. Debris with radiological scans measured above background is removed and placed in a radiological materials area. Controls are in place to mitigate the possibility of members of the public coming into contact with debris. To date, there is no evidence that members of the public have handled contaminated debris. The program to identify and remove debris will continue.
U.s. Department of Energy Third Five-Year Review Report for the Fernald Preserve September 2011 Doc No. S07045-Final
Page 59
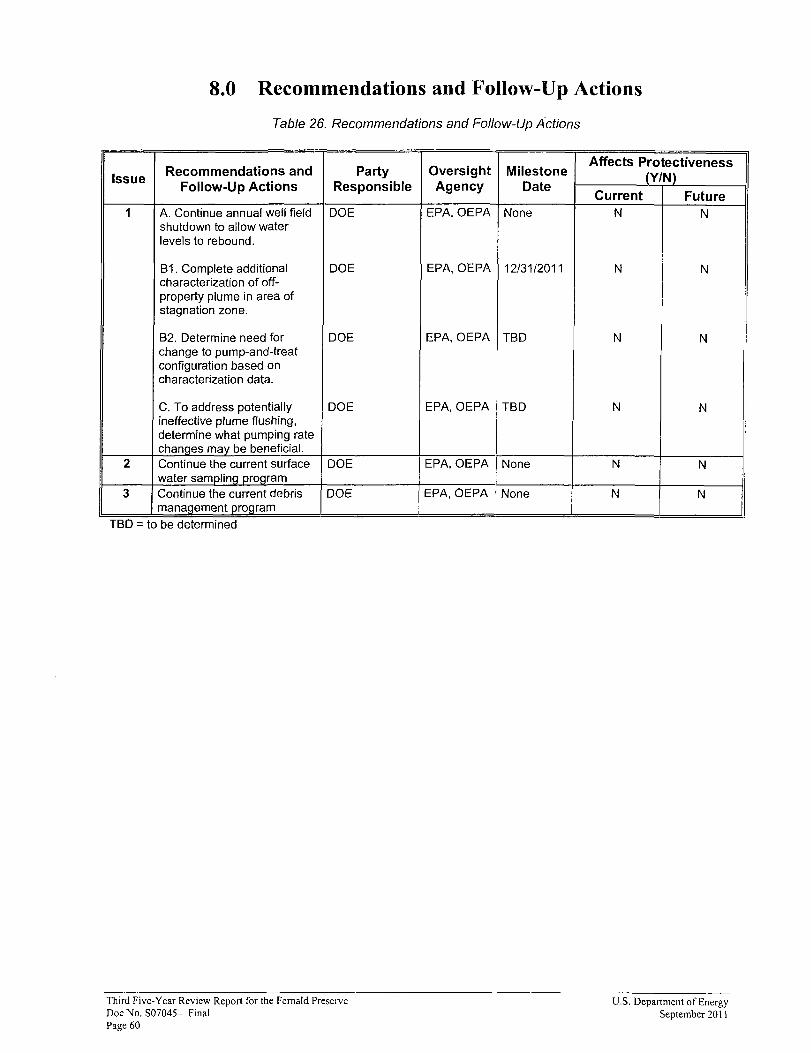
8.0 Recommendations and Follow-Up Actions
Table 26. Recommendations and Follow-Up Actions
Affects Protectiveness OversightRecommendations and MilestoneParty (YIN)Issue AgencyFollow-Up Actions Responsible Date
Current Future EPA,OEPA1 DOE NoneA. Continue annual well field N N
shutdown to allow water levels to rebound.
EPA,OEPADOEB1. Complete additional 12/31/2011 N N characterization of offproperty plume in area of stagnation zone.
I ,EPA,OEPAB2. Determine need for DOE TBD N N :
change to pump-and-treat configuration based on characterization data.
;EPA,OEPAC. To address potentially DOE TBD N N ineffective plume flushing, , ; determine what pumping rate changes may be beneficial.
2 EPA, OEPA I NoneContinue the current surface DOE N N water sampling program
:EPA, OEPA NoneI3 Continue the current debris DOE N N management program i I
TBD - to be determined
Third Five-Year Review Report for the Fernald Preserve u.s. Department of Energy Doc No. S07045-Final September 20 II Page 60
9.0 Protectiveness Statement(s)
The remedy at OUI is protective of human health and the environment. All known waste materials have been removed and disposed ofpennanently. The underlying soils have been certified to meet established FRLs. Institutional controls and access controls are in place and effective in ensuring the footprint of auI is used in accordance with the land use objectives and FRLs supporting those land use objectives.
The remedy at OU2 is protective of human health and the environment. All waste materials have been removed and disposed ofpennanently. The underlying soils have been certified to meet established FRLs. Institutional controls and access controls are in place and effective in ensuring the footprint of OU2 is used in accordance with the land use objectives and FRLs supporting those land use objectives.
The remedy at OU3 is protective of human health and the environment. All waste materials and building debris have been removed and disposed of pennanently. The underlying soils have been certified to meet established FRLs. Institutional controls and access controls are in place and effective in ensuring the footprint of OU3 is used in accordance with the land use objectives and FRLs supporting those land use objectives.
The remedy at OU4 is protective ofhuman health and the environment. All waste materials have been removed and disposed ofpennanently. The underlying soils have been certified to meet established FRLs. Institutional controls and access controls are in place and effective in ensuring the footprint of OU4 is used in accordance with the land use objectives and FRLs supporting those land use objectives.
The remedy at OUS is expected to be protective ofhuman health and the environment and in the interim exposure pathways that could result in unacceptable risks are being controlled. Current groundwater monitoring data indicate the groundwater remedy is functioning as required to achieve groundwater FRLs. The cap and liner systems of the OSDF are functioning as designed and are successfully containing disposed waste materials. The volume of leachate generated from the OSDF is continuing to decline, and the leachate is being effectively collected and treated to minimize impacts to human health and the environment.
u.s. Department of Energy Third Five-Year Review Report for the Fernald Preserve September 201 1 Doc No. S07045-Final
Page 61
10.0 Next Review
The next five-year review for the Femald Preserve is required in 2016, which is 5 years from the due date of this review.
The next five-year review for the Femald Preserve is required to be completed by five years from EPA's concurrence signature date on this review.
Third Five-Year Review Report for the Fernald Preserve u.s. Department of Energy Doc No. S07045-Final September 20 II Page 62
11.0 References
DOE (u.s. Department of Energy), 1994a. Interim Record ofDecision for Remedial Action at Operable Unit 3, Final, Fernald Environmental Management Project, DOE Fernald Area Office, Cincinnati, Ohio.
DOE (U.S. Department of Energy), 1994b. Record ofDecision for Remedial Actions at Operable Unit 4, Final, Fernald Environmental Management Project, DOE Fernald Area Office, Cincinnati, Ohio.
DOE (U.S. Department of Energy), 1995a. Operable Unit 3 Remedial Design/Remedial Action Work Plan for Interim and Final Remedial Actions, Final, Fernald Environmental Management Project, DOE Fernald Area Office, Cincinnati, Ohio.
DOE (U.S. Department of Energy), 1995b. Remedial Investigation Reportfor Operable Unit 5, Final, Fernald Environmental Management Project, DOE Fernald Area Office, Cincinnati, Ohio.
DOE (U.S. Department of Energy), 1995c. Record ofDecision for Remedial Actionsfor Operable Unit 1, Final, Fernald Environmental Management Project, DOE Fernald Area Office, Cincinnati, Ohio.
DOE (U.S. Department of Energy), 1995d. Record ofDecision for Remedial Actions at Operable Unit 2, Final, Fernald Environmental Management Project, DOE Fernald Area Office, Cincinnati, Ohio.
DOE (U.S. Department of Energy), 1995e. Feasibility Study for Operable Unit 5, Final, Fernald Environmental Management Project, DOE Fernald Area Office, Cincinnati, Ohio.
DOE (U.S. Department of Energy), 1996a. Record ofDecision for Remedial Actions at Operable Unit 5, Final, Fernald Environmental Management Project, DOE Fernald Area Office, Cincinnati, Ohio.
DOE (U.S. Department of Energy), 1996b. Operable Unit 3 Record ofDecision for Final Remedial Action, Final, Fernald Environmental Management Project, DOE Fernald Area Office, Cincinnati, Ohio.
DOE (U.S. Department of Energy), 1997. Baseline Remedial Strategy Report, Remedial Design for Aquifer Restoration, Final, Fernald Environmental Management Project, DOE Fernald Area Office, Cincinnati, Ohio, June.
DOE (U.S. Department of Energy), 1998a. Erplanation ofSignificant Differences for Operable Unit 4 Silo 3 Remediation Action, Final, Fernald Environmental Management Project, DOE Fernald Area Office, Cincinnati, Ohio.
DOE (U.S. Department of Energy), 1998b. Sitewide Excavation Plan, Final, Fernald Environmental Management Project, DOE Fernald Area Office, Cincinnati, Ohio.
u.s. Department of Energy September 2011
Third Five-Year Review Report for the Fernald Preserve Doc No. S07045-Final
Page 63 4
DOE (U.S. Department of Energy), 2000. Final Record ofDecision Amendmentfor Operable Unit 4 Silos 1 and 2 Remedial Actions, Revised, Fernald Environmental Management Project, DOE Fernald Area Office, Cincinnati, Ohio.
DOE (U.S. Department of Energy), 2001a. First Five-Year Review Reportfor the FCP, Final, Fernald Environmental Management Project, DOE Fernald Area Office, Cincinnati, Ohio.
DOE (U.S. Department of Energy), 2001b. Explanationfor Non-Significant Differencesfor Operable Unit 5 Record ofDecision, Final, Fernald Environmental Management Project, DOE Fernald Area Office, Cincinnati, Ohio.
DOE (U.S. Department of Energy), 2002. Explanation ofSignificant Differences for Operable Unit 1, Final, Fernald Closure Project, DOE Fernald Area Office, Cincinnati, Ohio.
DOE (U.S. Department of Energy), 2003a. Record ofDecision Amendmentfor Operable Unit 1 Remedial Actions, Final, Fernald Closure Project, DOE Fernald Area Office, Cincinnati, Ohio.
DOE (U.S. Department of Energy), 2003b. Final Record ofDecision Amendment for Operable Unit 4 Silo 3 Remedial Action, Final, Fernald Closure Project, DOE Fernald Area Office, Cincinnati, Ohio.
DOE (U.S. Department of Energy), 2003c. Explanation ofSignificant Differencesfor Operable Unit 4 Silos 1 and 2 Remedial Action, Final, Fernald Closure Project, DOE Fernald Area Office, Cincinnati, Ohio.
DOE (U.S. Department of Energy), 2005a. Explanation ofSignificant Differencesfor Operable Unit 4, Final, Fernald Closure Project, DOE Fernald Area Office, Cincinnati, Ohio.
DOE (U.S. Department of Energy), 2005b. Waste Storage Area (Phase JJ) Design Report, 52424 RP 0004, Revision A, Draft Final, Fernald Closure Project, Cincinnati, Ohio, June.
DOE (U.S. Department of Energy), 2006a. Final Remedial Action Reportfor Operable Unit 1-Waste Pits Remedial Action Project, Final, Fernald Closure Project, Cincinnati, Ohio, August.
DOE (U.S. Department of Energy), 2006b. Final Remedial Action Reportfor Operable Unit 2-Other Waste Units, Final, Fernald Closure Project, Cincinnati, Ohio, September.
DOE (U.S. Department of Energy), 2006c. Final Remedial Action Reportfor Operable Unit 4-Silos 1 through 4, Final, Fernald Closure Project, Cincinnati, Ohio, September.
DOE (U.S. Department of Energy), 2006d. Fernald Groundwater Certification Plan, 51900-PL-0002, Revision 1, Final, Fluor Fernald, Cincinnati, Ohio, April.
DOE (U.S. Department of Energy), 2006e. Comprehensive Legacy Management and Institutional Controls Plan, 200 13-PL-OOO1, Revision 1, Final, Fluor Fernald, DOE, Fernald Area Office, Cincinnati, Ohio, January.
Third Five-Year Review Report for the Fernald Preserve u.s. Department of Energy Doc No. S07045-Final September 20 I J Page 64
DOE (U.S. Department of Energy), 2006f. Second Five-Year Review Reportfor the FCP, 2500-RP-0004, Revision A, Draft, Fluor Fernald, DOE Fernald Area Office, Cincinnati, Ohio, April.
DOE (U.S. Department of Energy), 2007a. Final Remedial Action Report For Operable Unit 3 at the Fernald Closure Project, Final, Fernald Closure Project, Cincinnati, Ohio, February.
DOE (U.S. Department of Energy), 2007b. Fernald 2006 Site Environmental Report, DOE LMll461 2007, S.M. Stoller Corporation for DOE, Fernald Area Office, Cincinnati, Ohio, May.
DOE (U.S. Department of Energy), 2007c. Interim Residual Risk Assessment for the Fernald Closure Project, 50000-RP-0012, Rev 1.
DOE (U.S. Department of Energy), 2008. Fernald Preserve 2007 Site Environmental Report, DOE LMl1607 2008, S.M. Stoller Corporation for DOE, Fernald Area Office, Cincinnati, Ohio, June.
DOE (U.S. Department of Energy), 2009. Fernald Preserve 2008 Site Environmental Report, Fernald Area Office, Cincinnati, Ohio, May.
DOE (U.S. Department of Energy), 201Oa. Comprehensive Legacy Management and Institutional Controls Plan, LMSIFERlS03496-4.0, Revision 4, Fernald Area Office, Cincinnati, Ohio, April.
DOE (U.S. Department of Energy), 20 lOb. Fernald Preserve 2009 Site Environmental Report, Fernald Area Office, Cincinnati, Ohio, May.
EPA (U.S. Environmental Protection Agency), 1991. Consent Agreement as Amended under CERCLA Section 120 and 106 (a) in the matter of U.S. Department of Energy, Fernald Materials Production Center, Fernald, Ohio, U.S. EPA Region V.
EPA (U.S. Environmental Protection Agency), 2002. National Recommended Water Quality Criteria: 2002, EPA 822-R-02-047, EPA Office of Water, Washington, D.C.
EPA (U.S. Environmental Protection Agency), 2003a. Guidancefor Developing Ecological Soil Screening Levels, OSWER Directive 9285.7-55, Office of Solid Waste and Emergency Response, Washington, D.C.
EPA (U.S. Environmental Protection Agency), 2003b. Ecological Screening Levelsfor RCRA Appendix IX Constituents, EPA Region 5, Chicago, Illinois.
u.s. Depanment of Energy Third Five·Year Review Report for the Fernald Preserve September 2011 Doc No. S07045-Final
Page 65
This page intentionally left blank
Third Five-Year Review Report for the Fernald Preserve u.s. Department of Energy Doc No. S07045-Final September 20 II Page 66
Attachments

This page intentionally left blank
Attachment 1 Fernald Preserve and Vicinity
This page intentionally left blank
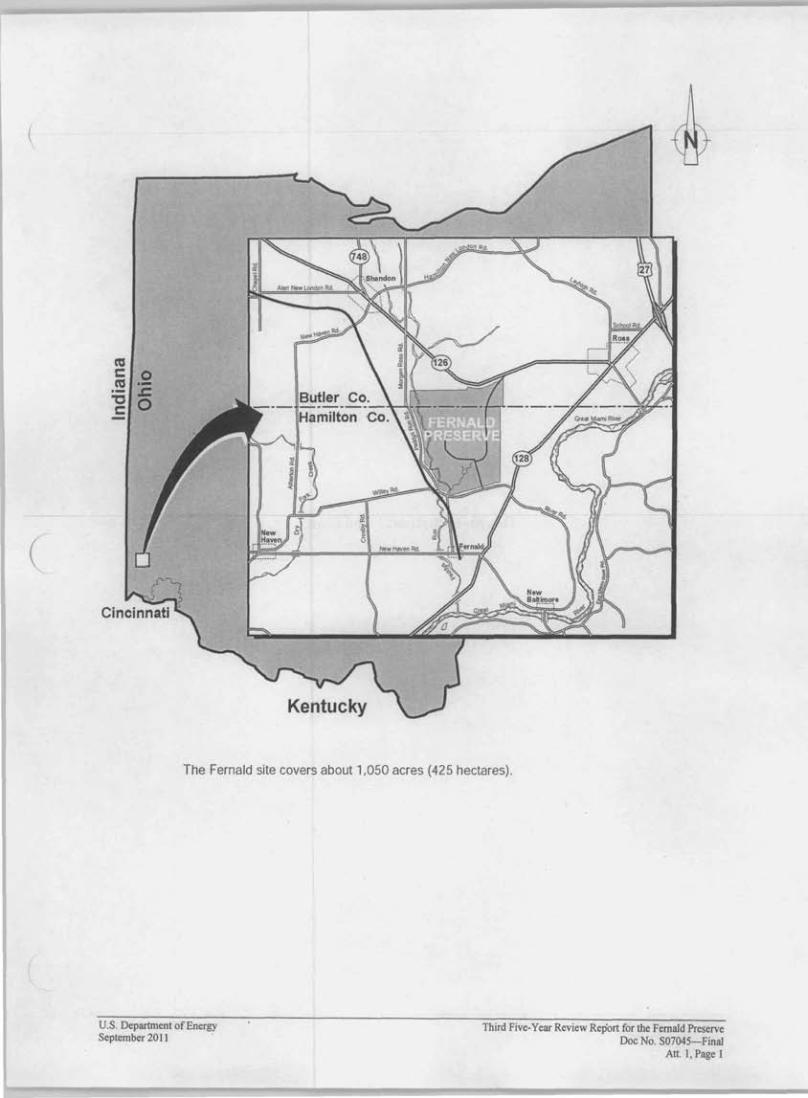
(
ca c 0 C"a .. s=-gO
Kentucky
The Fernald site covers about 1,050 acres (425 hectares) .
U.S. Department of Energy Third Five-Year Review Report for the Fernald Preserve September 2011 Doc No. S07045-Final
At!. 1, Page 1
This page intentionally left blank
Third Five-Year Review Report for the Fernald Preserve U.S. Department of Energy Doc No. S07045-Final September 20 II Alt. I. Page 2
Attachment 2 Fernald Preserve Site Configuration

------------ ----
This page intentionally left blank
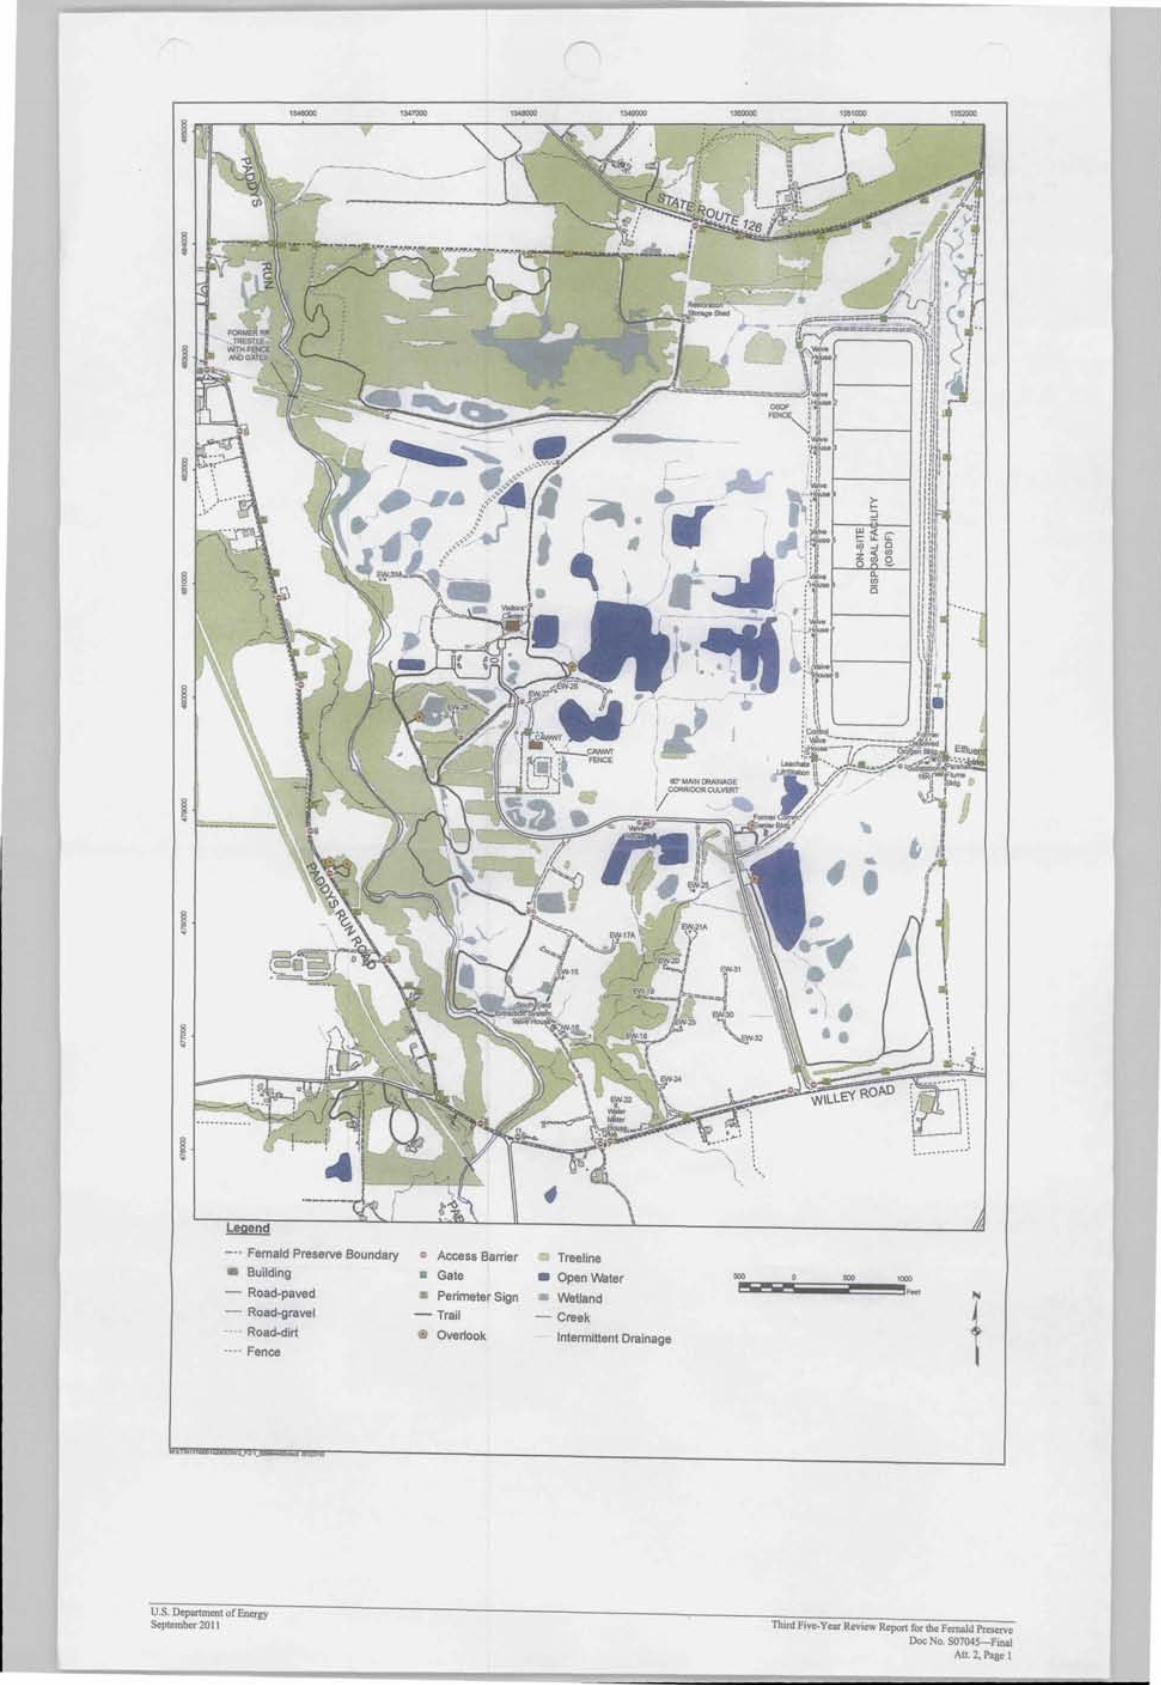
---
1346000
'-" '-"' "'-.
Legend
1347000 1350000 1351000 1352000
'. ...... _.. _.. ~ .... -
Femald Preserve Boundary = Access Barrier - Treeline • Building 500• Gate _ Open Water o 500 1000
- Road-paved FeetPerimeter Sign Wetland - - - -
--- Road-gravel - Trail - Creek ---- Road-dirt Overlook Intermittent Drainage --- - Fence
U.S. Department of Energy September 2011 Third Five-Year Review Report for the Fernald Preserve
Doc No. S07045-Final Att. 2, Page 1

Attachment 3 Initial Public Notice

This page intentionally left blank
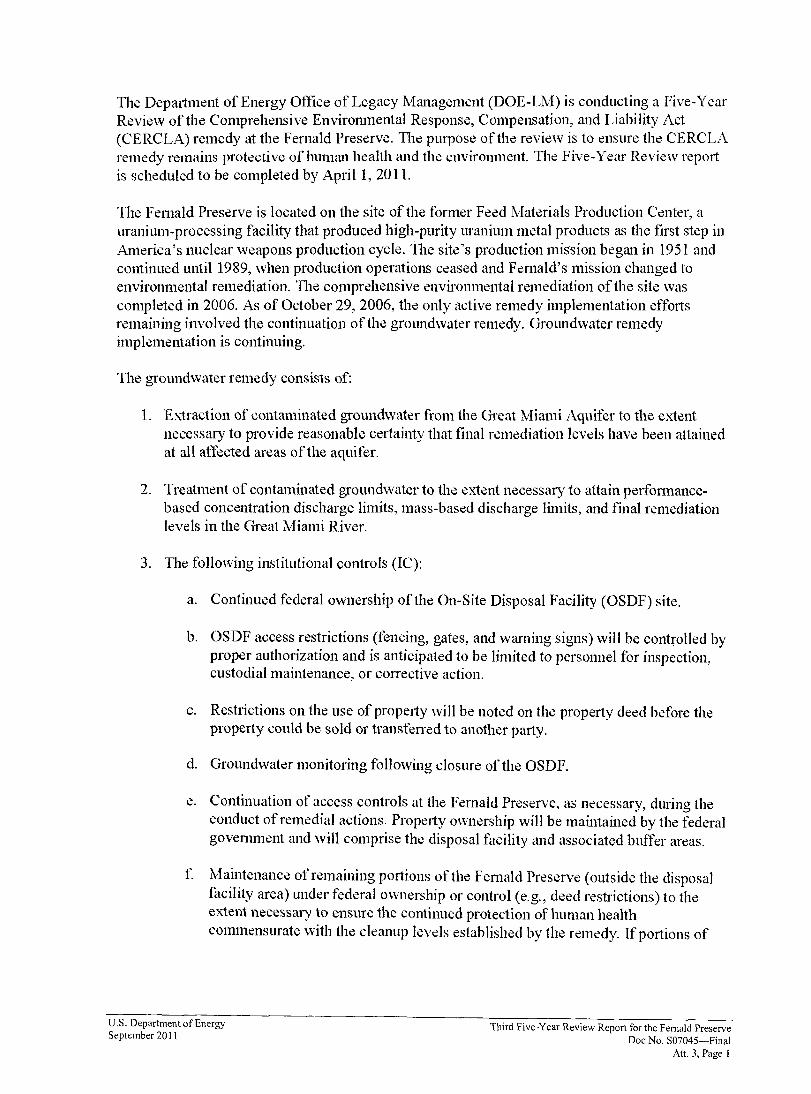
The Depm1ment of Energy OtTice of Legacy lvlanagement (DOE-LM) is conducting a Five-Year Review of the Comprehensive Environmental Response, Compensation, and Liability Act (CERCLA) remedy at the Fernald Preserve. The purpose of the review is to ensure the CERCLA remedy remains protective of human health and the environment. The Five-Year Review report is scheduled to be completed by April 1, 2011.
The Femald Preserve is located on the site of the fonner Feed Materials Production Center, a uranium-processing facility that produced high-purity uranium metal products a<; the first step in America's nuclear weapons production cycle. The site's production mission begml in 1951 and continued unti11989, when production operations ceased and F emald's mission changed to environmental remediation. The comprehensive envirollmental remediation oflhe site was completed in 2006. As of October 29, 2006, the only active remedy implementation efforts remaining involved the continuation of the groundwater remedy. Groundwater remedy implementation is continuing.
The groundwater remedy consists of:
1. E)o;.iraction of contaminated groundwater from the Great Miami Aquifer to the extent necessary to provide reasonable ce11ainly that final remediation levels have been attained at all atTected areas ofthe aquifer.
2. Treatment of contaminated groundw·ater to the extent necessary to attain pelfonnancebased concentration discharge limits, mass-based discharge limits, and final remediation levels in the Great lvliami River.
3. The following institutional controls (IC):
a. Continued federal ownership of the On-Site Disposal Facility (OSDF) site.
b. OSDF access restrictions (fencing, gates, and waming signs) will be controlled by proper authorization and is anticipated to be limited to personnel for inspection, custodial maintenance, or cOlTective action.
c. Restrictions on the llse of propel1y will be noted on the property deed before the property could be sold or transfened to another party.
d. Groundwater monitoring following closure of the OSDF.
e. Continuation of access controls at the Femald Preserve, as necessary, during the conduct of remedial actions. Property ownership will be maintained by the federal govemment and will comprise the disposal facility and associated buffer areas.
f. Maintenance of remaining portions of the Femald Preserve (outside the disposal facility area) under federal ownership or control (e.g., deed restrictions) to the extent necessary to ensure the continued protection of human health commensurate with the cleanup levels established by the remedy. Ifportions of
u.s. Department of Energy Third Five-Year Review Report for the Fernald Preserve September 2011 Doc No. S07045-FinaI
Att. 3, Page I
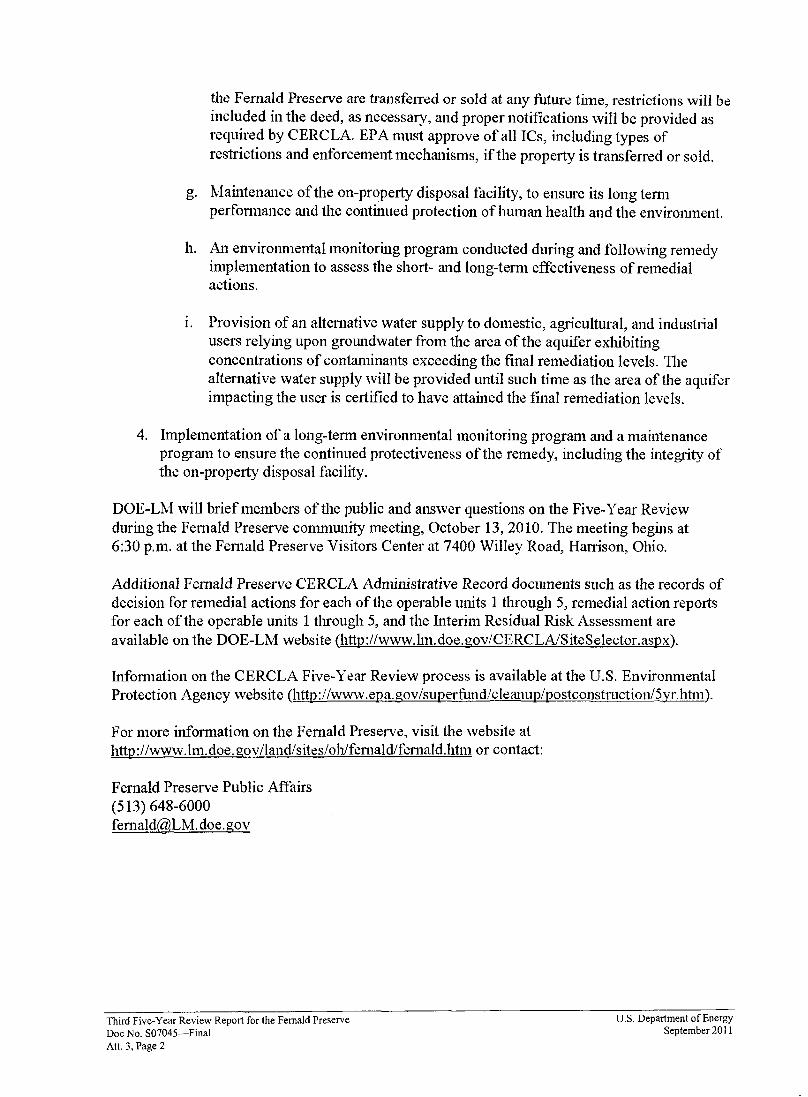
the Fernald Preserve are transferTed or sold at any future time, restrictions will be included in the deed, as necessary, and proper notifications will be provided as required by CERCLA. EPA must approve of all rcs, including types of restrictions and enforcement mechanisms, if the property is transferred or sold.
g. 1.Jaintenance ofthe on-property disposal facility, to ensure its long teml perfonnance and the continued protection of human health and the environment.
h. An environmental monitoring program conducted during and following remedy implementation to assess the short- and long-term effectiveness of remedial actions.
1. Provision of an alternative water supply to domestic, agricultural, and industrial users relying upon groundwater from the area ofthe aquifer exhibiting concentrations of contaminants exceeding the final remediation levels. TIle alternative water supply will be provided until such time as the area ofthe aquifer impacting the user is certified to have attained the final remediation levels.
4. Implementation of a long-tenn environmentalmonitoling program and a maintenance program to ensure the continued protectiveness of the remedy, including the integrity of the on-property disposal facility.
DOE-LM will brief members of the public and answer questions on the Five-Year Review during the Fernald Preserve conullunity meeting, October 13, 2010. The meeting begins at 6:30 p.m. at the Femald Preserve Visitors Center at 7400 Willey Road, Harrison, Ohio.
Additional Femald Preserve CERCLA Administrative Record documents such as the records of decision for remedial actions for each of the operable units 1 through 5, remedial action reports for each of the operable units 1 through 5, and the Interim Residual Risk Assessment are available on the DOE-LM website (http://www.lm.doe.gov/CERCLAISiteSelector.aspx).
Infonllation on the CERCLA Five-Year Review process is available at the U.S. Environmental Protection Agency website (http://www.epa.gov/superfund/cleanup/postconstruction/5yr.htm ).
For more information on the Fernald Preserve, visit the website at http://www.lm.doe. gov /land/s ites/oh/felllaldlfel11ald.htm or contact:
Fernald Preserve Public Affairs (513) 648-6000 fernald@,LM.doe.gov
Third Five-Year Review Report for the Fernald Preserve U.s. Department of Energy
Doc No. S07045-Final September 2011
Alt. 3, Page 2

Attachment 4 Public Questionnaire

This page intentionally left blank
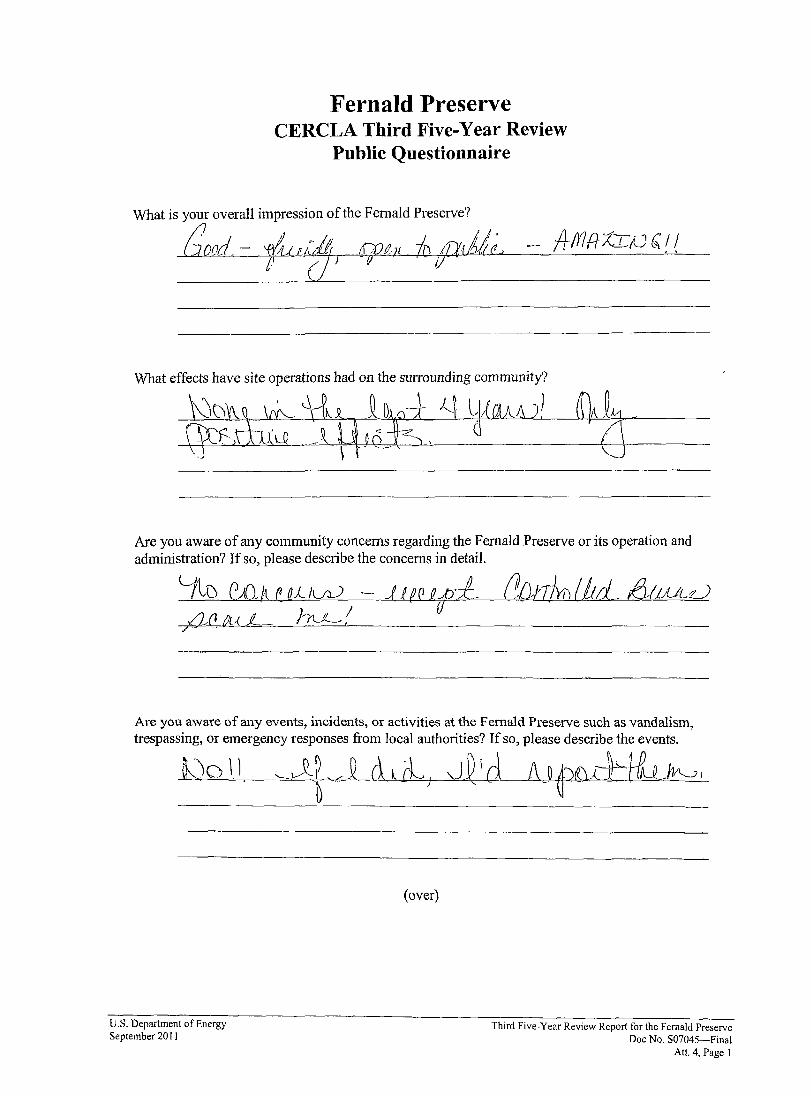
Fernald Preserve CERCLA Third Five-Year Review
Public Questionnaire
What is your overall impression of the Fernald Preserve?
What effects have site operations had on the surrounding community?
Are you aware of any community concerns regarding the Fernald Preserve or its operation and administration? If so, please desclibe the concerns in detail.
Y\D CA11l W_ICAJ --UeQRf-J- (P"Drr}rolitd &LUUJ ;;<2jl (llA L- l~!
Are you aware of any events, incidents, or activities at the Fernald Preserve such as vandalism, trespassing, or emergency responses from local authorities? If so, please describe the events.
000 II J~ 'b2 cLfl; ,J~ld i\J~Cd:iiLfK--,l
(over)
U.S. Department of Energy Third Five-Year Review Report for the Fernald Preserve September 20 I I Doc No. S07045-Final
At!. 4, Page I
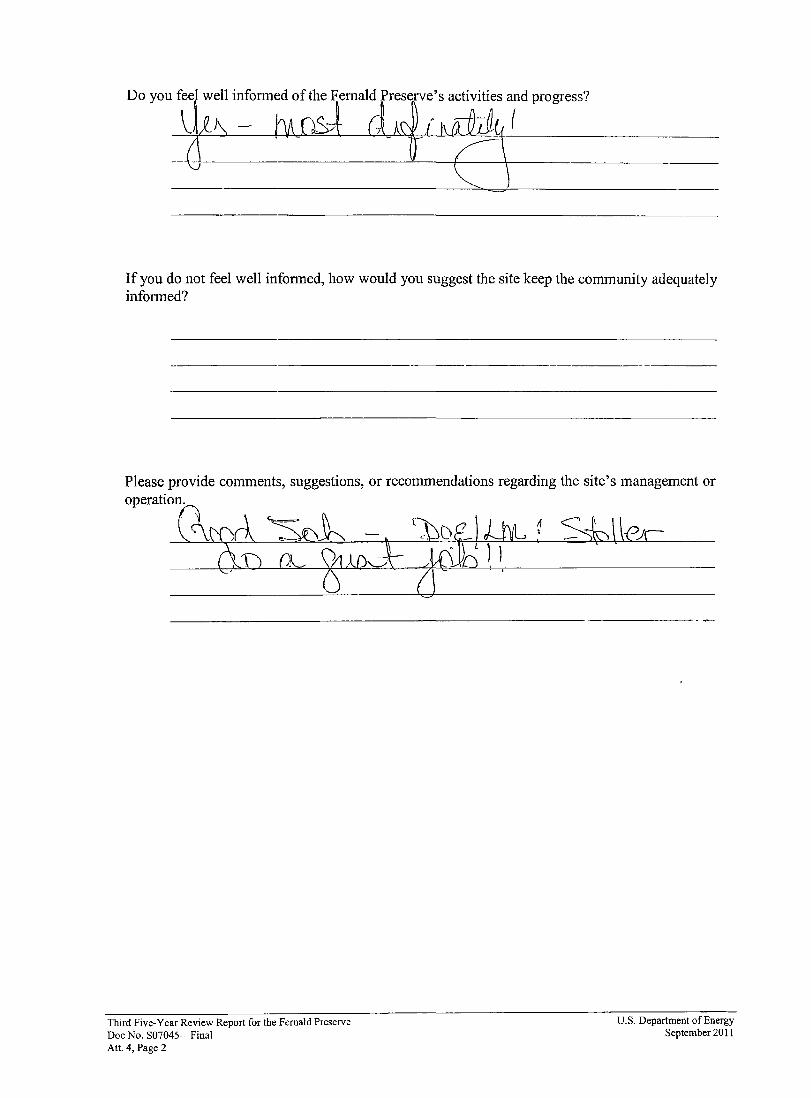
If you do not feel well infonned, how would you suggest the site keep the community adequately infOlmed?
Please provide comments, suggestions, or recOlmnendations regarding the site's management or operation.
~~wJt~~ 1 5sbi\{>JI
Third Five-Year Review Report for the Fernald Preserve U.S. Department of Energy Doc No. S07045-Final . September 20 II Att. 4, Page 2
Attachment 5 Fernald Preserve Inspection Schedule

This page intentionally left blank
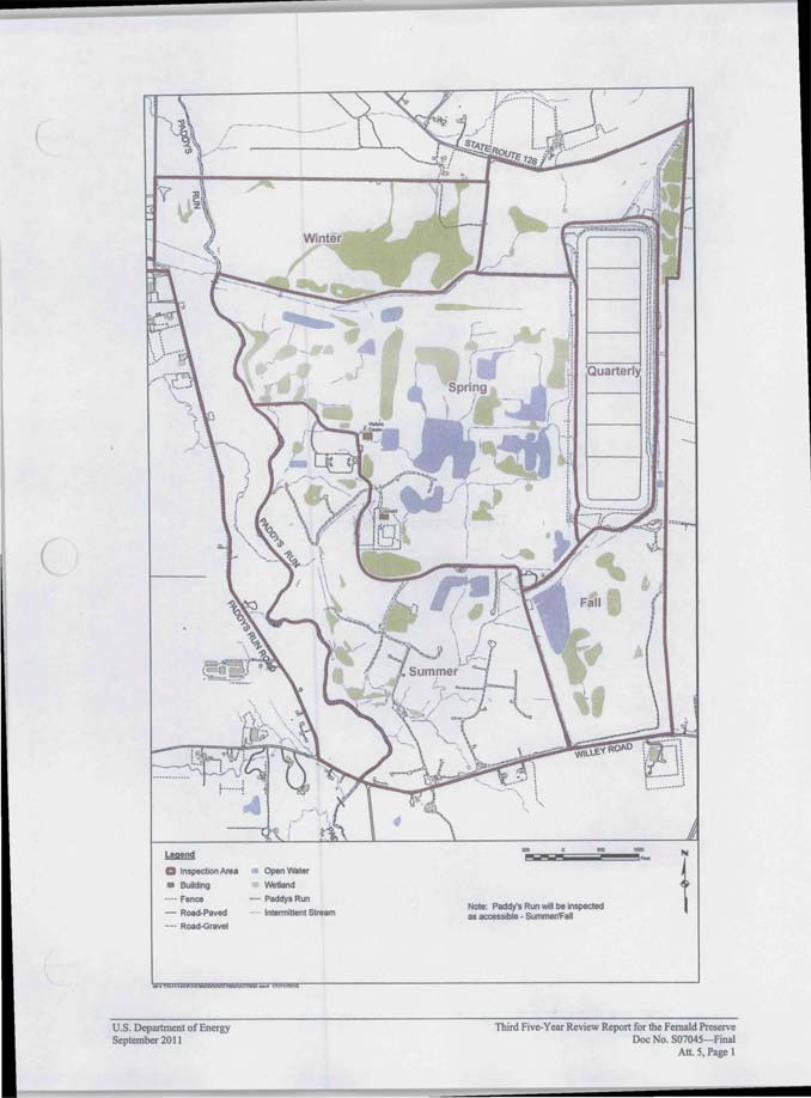
(
/
Quarterly....,-., ,.r\ (_
C~."/'."r "\ ,I..
,.-' ,-.
Legend
a Inspection Area Open Water
• Building We~and
•••• Fence _... Paddys Run Note: Paddy's Run will be inspected
- Road·Paved Intermittent Stream as accessibla - Summer/Fall - _. Road·Gravel
u.s. Department of Energy Third Five-Year Review Report for the Fernald Preserve September 20 II Doc No. S07045- Final
Alt. 5, Page I

This page intentionally left blank
Third Five-Year Review Report for the Fernald Preserve u.s. Department of Energy Doc No. S07045-Final September 20 II AlL 5, Page 2
Attachment 6 Site Inspection Photographs from Select Locations
This page intentionally left blank
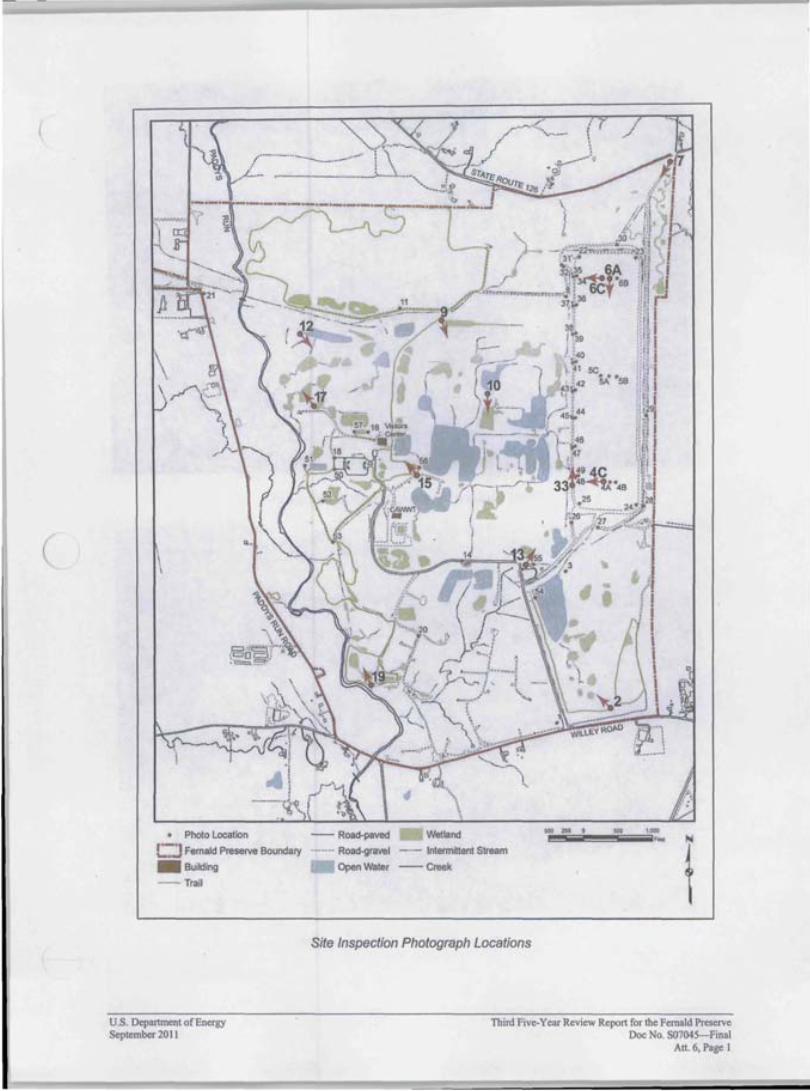
L.
/ "-" '-"' '''-'''- '''-'''-' ...-1:".- ~.---- - -
\ i
\:"".1
• Photo Location
c.-:-J Femald Preserve Boundary
_ Building
-- Trail
( .. ;'--
.-:::.
....-......
- Road-paved Wetland
-..--- Road-gravel _ ...- Intermittent Stream
Open Water -- Creek
Site Inspection Photograph Locations
U.S. Department of Energy Third Five-Year Review Report for the Fernald Preserve September 2011 Doc No. S07045- Final
Art. 6, Page 1
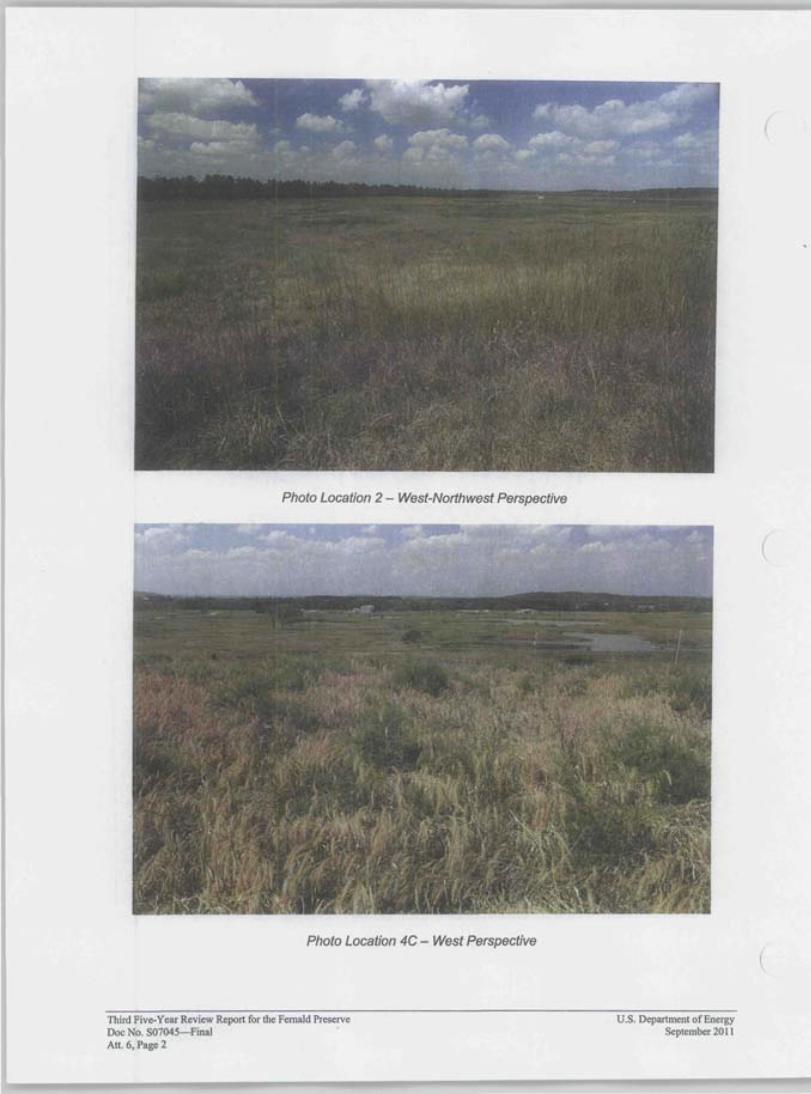
(
Photo Location 2 - West-Northwest Perspective
(
Photo Location 4C - West Perspective
Third Five-Year Review Report for the Fernald Preserve u.s. Department of Energy Doc No. S07045-Final . September 2011 At!. 6, Page 2
(
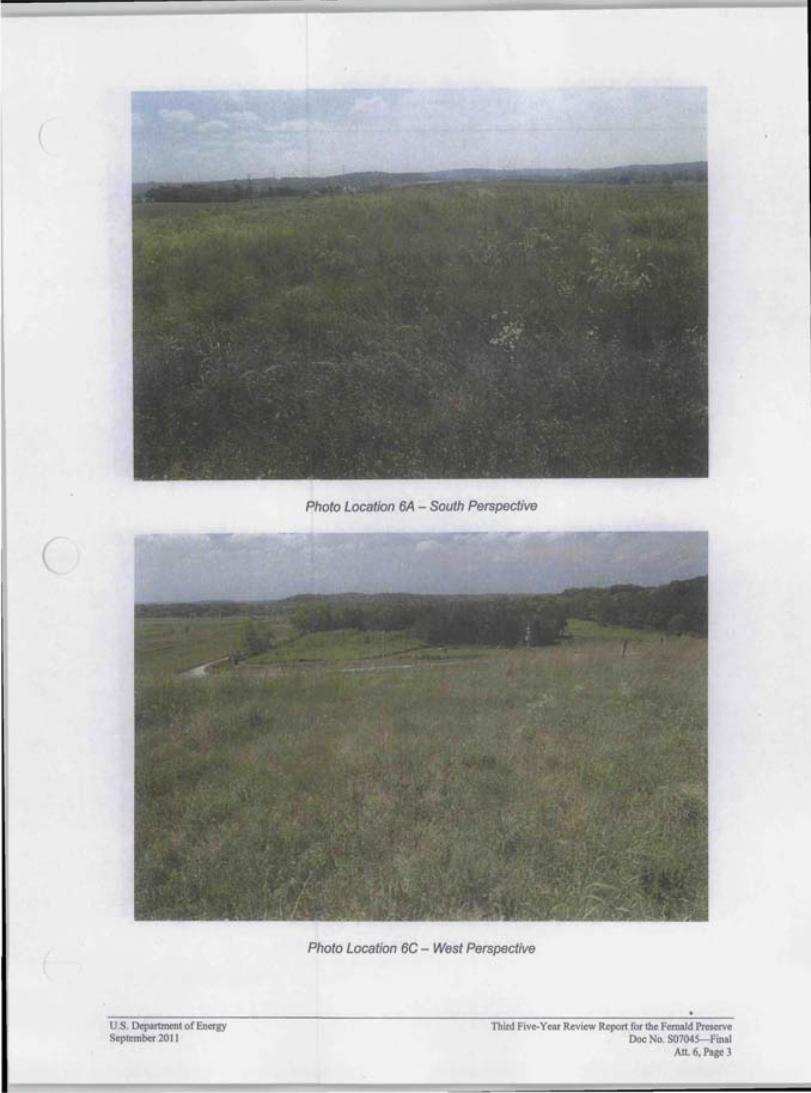
(
Photo Location 6A - South Perspective
Photo Location 6C - West Perspective
u.s.Department of Energy Third Five-Year Review Report for the Fernald Preserve September 2011 Doc No. S07045- Final
Att. 6, Page 3
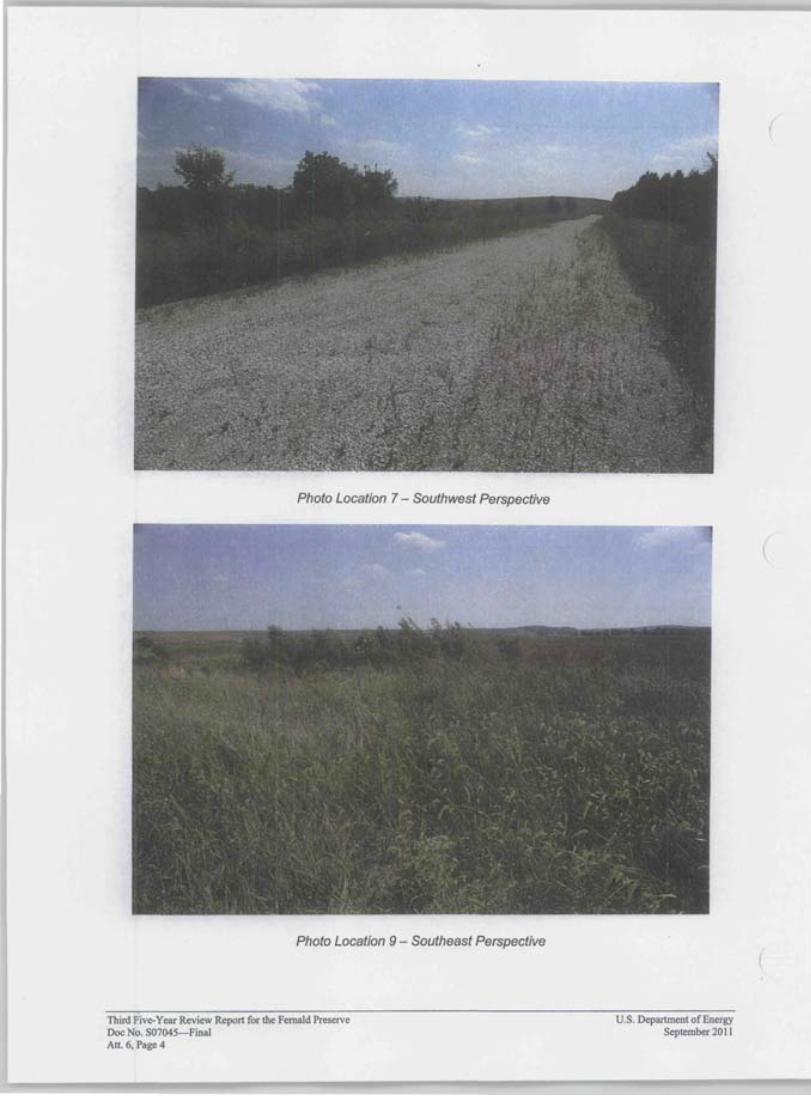
(
Photo Location 7 - Southwest Perspective
(
Photo Location 9 - Southeast Perspective
Third Five-Year Review Report for the Fernald Preserve U.S. Department of Energy Doc No. S07045-Final September 2011 Att. 6, Page 4
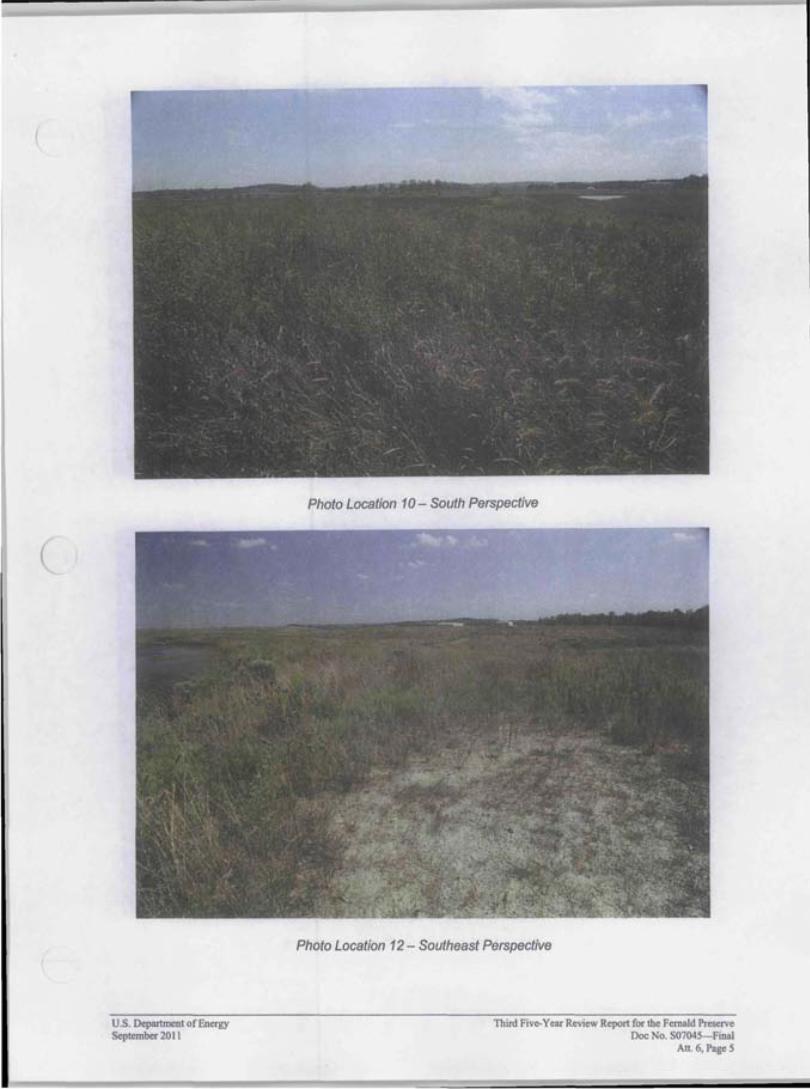
(
Photo Location 10 - South Perspective
Photo Location 12 - Southeast Perspective
u.s. Department of Energy Third Five-Year Review Report for the Fernald Preserve September 201 1 Doc No. S07045- Final
Att. 6, Page 5
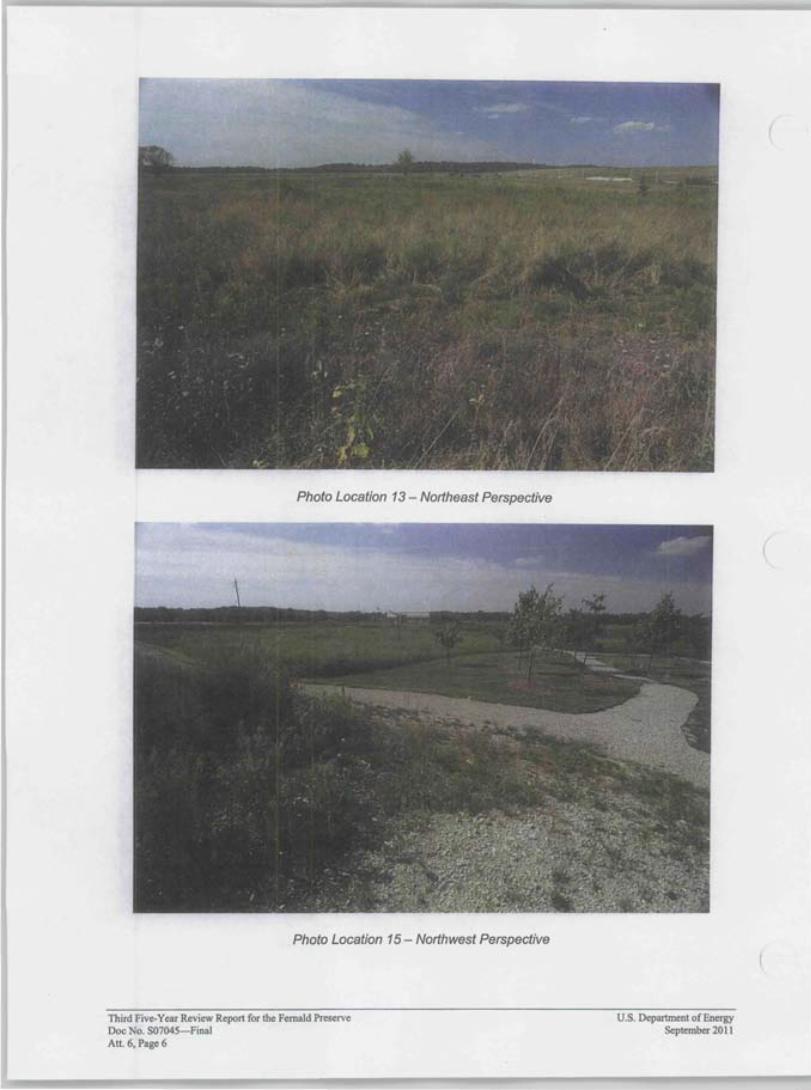
(
Photo Location 13 - Northeast Perspective
(
Photo Location 15 - Northwest Perspective
Third Five-Year Review Report for the Fernald Preserve u.s. Department of Energy Doc No. S07045-Final September 2011 Att. 6, Page 6
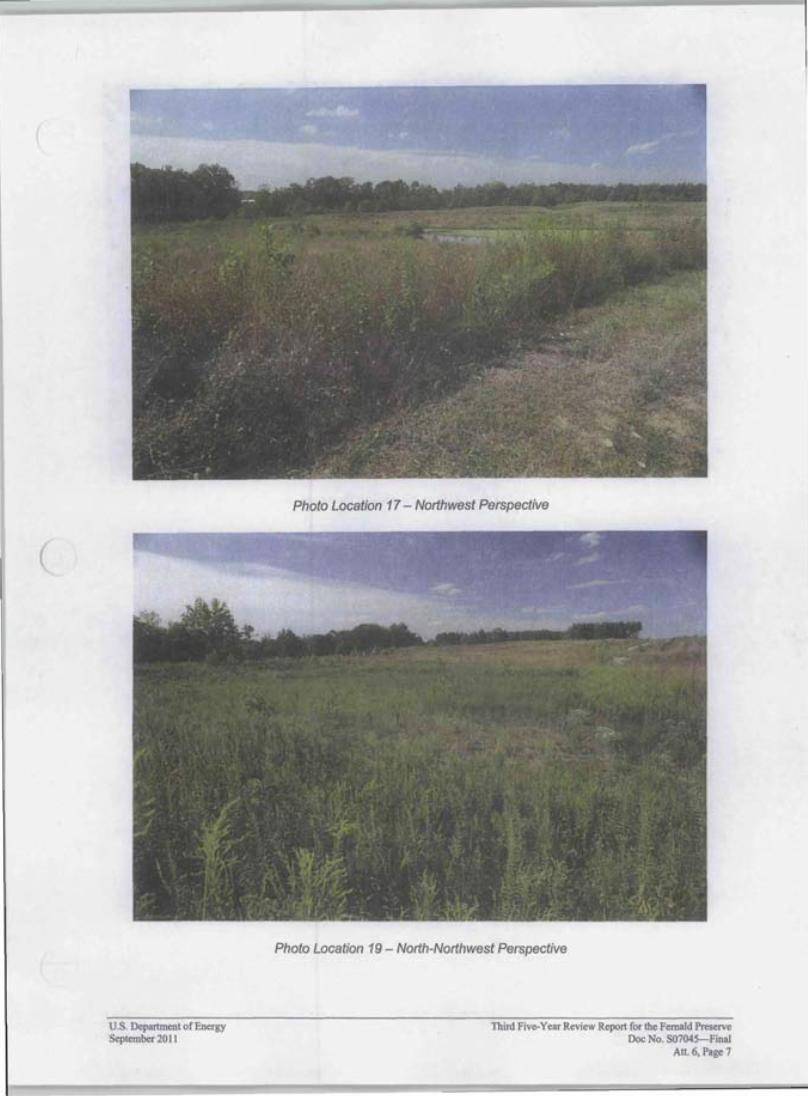
Photo Location 17 - Northwest Perspective
Photo Location 19 - North-Northwest Perspective
U.S. Department of Energy Third Five-Year Review Report for the Fernald Preserve September 2011 Doc No. S07045-Final
Art. 6, Page 7
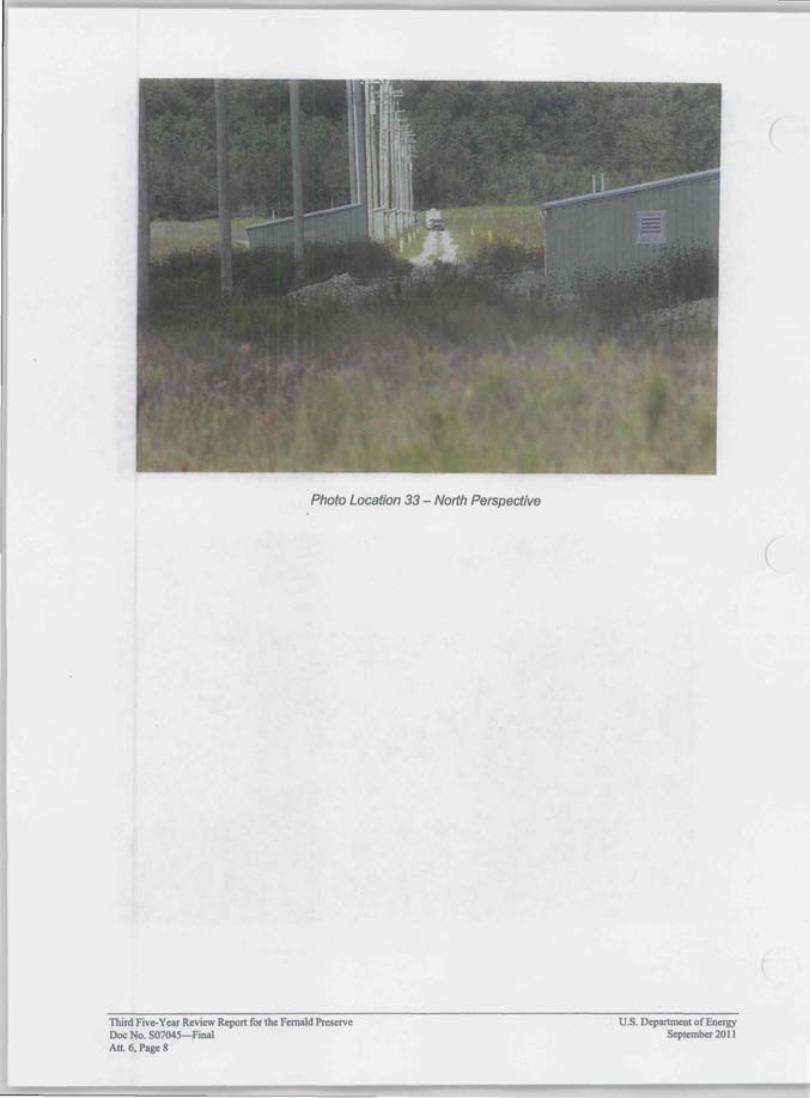
(
Photo Location 33 - North Perspective
(
Third Five-Year Review Report for the Fernald Preserve u.s. Department of Energy Doc No. S07045-Final September 2011 Att. 6, Page 8
Attachment 7 Monitoring Wells with 2009 Exceedances for Total Uranium with
Up, Down, or No Significant Trends
This page intentionally left blank
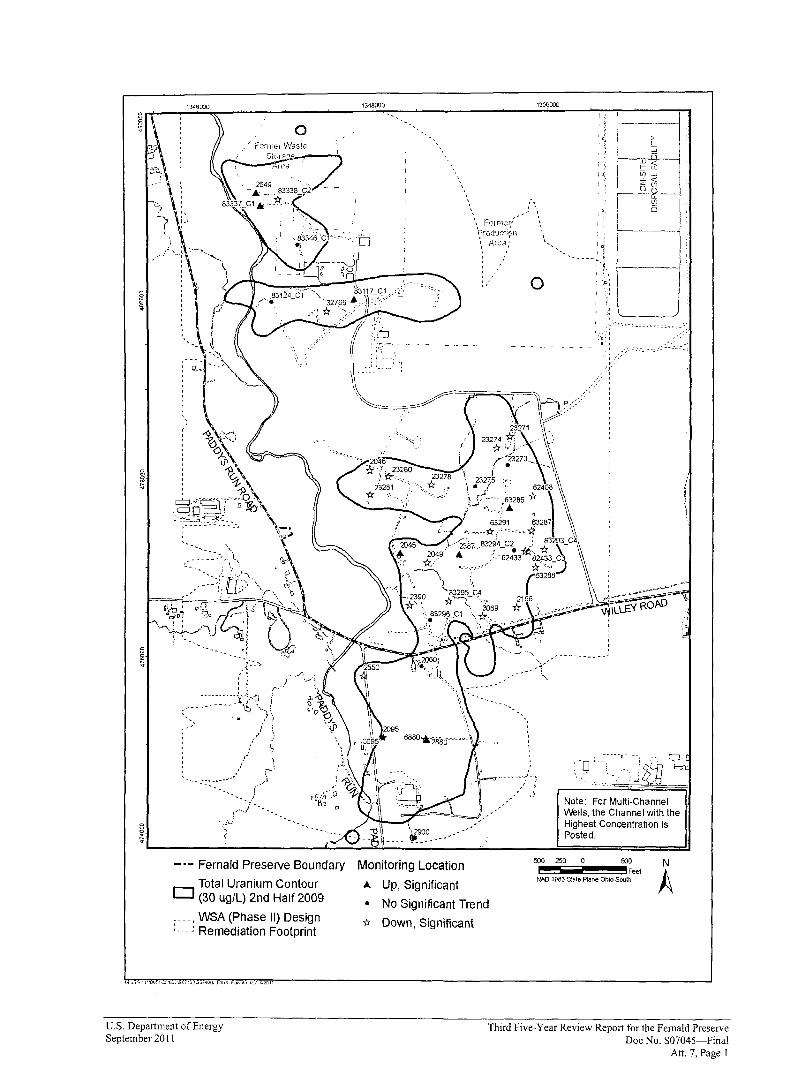
1348000 13~OOO
C~~--~O--~~~--~~~lh~--~-~8i~'
.-,
... FCl lf1icr'# , ' ~rodu:;tif-t\ 't ;},rea:
o
----~-----"-
~ ..J j ........:
t= LL
I ~ ~ J 8 I' ~--.-...
! I,: I~ _____ I i: .. ~~. f----
,-", p. o
Note: For Multi-Channel VVells, the Channel with the Highest Concentration is Posted.o ?
~L-__~_______~~~£L~~____~______~==========~ 500 250 500 N_.- Fernald Preserve Boundary Monitoring Location
iFeet t. NAD 1983 Stale Plane Ohio Scuth ~o Total Uranium Contour ... Up, Significant
(30 ug/L) 2nd Half 2009 • No Significant Trend ____ , WSA (Phase II) Design {( Down, Significant :- -- ~ Remediation Footprint
u.s. Department of Energy Third Five-Year Review Report for the Fernald Preserve September 20 II Doc No. S07045-Finai
Alt. 7, Page I
This page intentionally left blank
Third Five-Year Review Report for the Fernald Preserve U.S. Department of Energy Doc No. S07045-Fillal September 2011 Alt. 7, Page 2

Attachment 8 Hamilton County Health Department Aquifer Restoration
Notification Letter

This page intentionally left blank
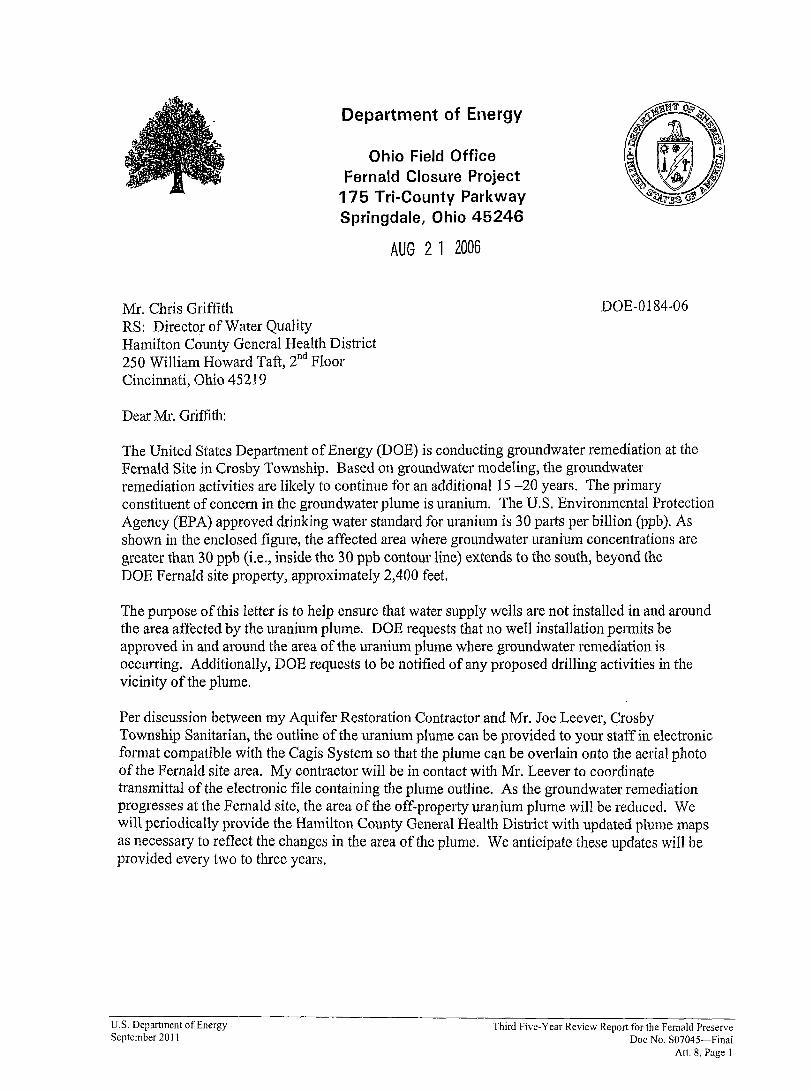
Department of Energy
Ohio Field Office Fernald Closure Project
175 Tri-County Parkway Springdale, Ohio 45246
AUG 2 1 2006
Mr. Chris Griffith DOE-0184-06 RS: Director of Water Quality Hamilton County General Health District 250 William Howard Taft, 2nd Floor Cincinnati, Ohio 45219
Dear Mr. Griffith:
The United States Department of Energy (DOE) is conducting groundwater remediation at the Fernald Site in Crosby Township. Based on groundwater modeling, the groundwater remediation activities are likely to continue for an additional 15 -20 years. The primary constituent of concern in the groundwater plume is uranium. The U.S. Environmental Protection Agency (EPA) approved drinking water standard for uranium is 30 palis per billion (Ppb). As shown in the enclosed figure, the affected area where groundwater uranium concentrations are greater than 30 ppb (i.e., inside the 30 ppb contour line) extends to the south, beyond the DOE Fernald site property, approximately 2,400 feet.
The purpose of this letter is to help ensure that water supply wells are not installed in and around the area affected by the uranium plume. DOE requests that no well installation pelmits be approved in and around the area of the uranium plume where groundwater remediation is occurring. Additionally, DOE requests to be notified of any proposed drilling activities in the vicinity of the plume.
Per discussion between my Aquifer Restoration Contractor and Mr. Joe Leever, Crosby Township Sanitarian, the outline of the uranium plume can be provided to your staff in electronic fOlmat compatible with the Cagis System so that the plume can be overlain onto the aerial photo of the Fernald site area. My contractor will be in contact with Mr. Leever to coordinate transmittal of the electronic file containing the plume outline. As the groundwater remediation progresses at the Femald site, the area of the off-property uranium plume will be reduced. We will periodically provide the Hamilton County General Health District with updated plume maps as necessary to reflect the changes in the area of the plume. We anticipate these updates will be provided every two to three years.
u.s. Department of Energy Third Five-Year Review Report for the Fernald Preserve September 2011 Doc No. S07045-FinaI
Alt. 8, Page 1
Mr. Chris Griffith - 2 - DOE-0184-06
If you have any immediate questions regarding this please contact me at 513-648-3139 or Bill Hertel, Manager of Aquifer Restoration at 513-648-3894 (office) or 513-235-2325 (cell). In the future, please contact Ms. Jane Powell at (513) 648-3148.
Johnny W. Reising Director
Enclosure: As Stated cc wi enclosure: G. Stegner, DOE-OH M. Lutz, S.M. Stoller Corp. S. Marutzky, S.M. Stoller Corp. J. Powell, DOE-LMlFCP, MS2 M. Cullerton, Tetra Tech S. Hehner, ODH G. Jablonowski, US EPA-V, SR-6J M. Miller, S.M. Stoller Corp., MS2 M. Murphy, USEPA-V, A-18J J. Saric, USEP A D. Sarno, FCAB T. Schneider, OEP A M. Shupe, HSI GeoTrans
cc wlo enclosure: J. Chiou, Fluor Fernald, Inc., MS88 B. Hertel, Fluor Fernald, Inc., MS 12 J. Homer, S.M. Stoller Corp., MS12 F. Johnston, Fluor Fernald, Inc., M12 L. McHenry, S.M. Stoller Corp., MS12 C. Murphy, Fluor Fernald, Inc., MS1 D. Sizemore, Fluor Fernald, Inc., MSI M. Sucher, Fluor Fernald, Inc., MS90 C. Tabor, S.M. Stoller Corp., MS12 T. Terry, Fluor Fernald, Inc., MSI S. Walpole, S.M. Stoller Corp., MS76
Third Five-Year Review Report for the Fernald Preserve u.s. Department of Energy Doc No. S07045-Final September 2011 Alt. 8, Page 2
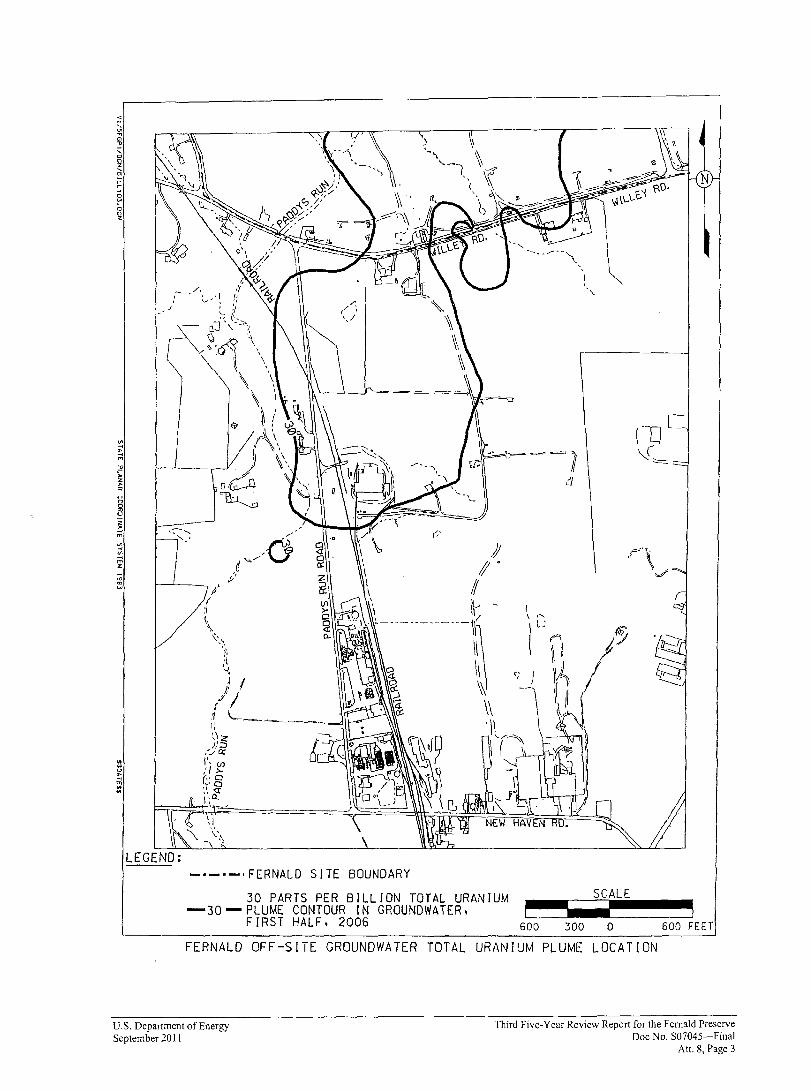
I~
LEGEND: _. _. -, FERNALD SITE BOUNDARY
30 PARTS PER BILLION TOTAL URANIUM ..._ SCALE -30 - PLUME CONTOUR IN GROUNDWATER, 1.-. Il1li,__ '--___I
FIRS T HALF, 2006 600 300 0 600 FEET
FERNALD OFF-SITE GROUNDWATER TOTAL URANIUM PLUME LOCATION
u.s. Department of Energy Third Five-Year Review Report for the F emald Preserve September 2011 Doc No. S07045-Final
At!. 8, Page 3
This page intentionally left blank
Third Five-Year Review Report for the Fernald Preserve u.s. Department of Energy Doc No. S07045-Final September 2011 At!. 8, Page 4
Attachment 9 Total Groundwater Extracted, Injected, and Net Extracted from
GMA (FY 1993 through FY 2010)

This page intentionally left blank
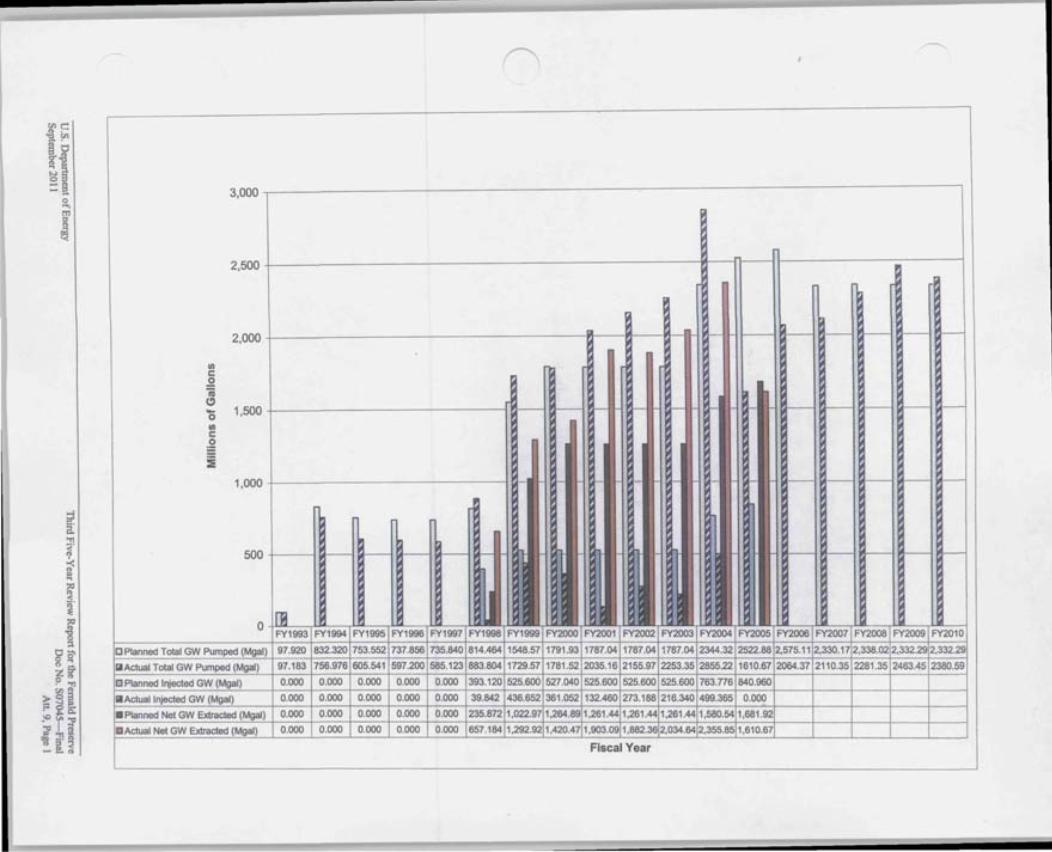
3,000
2,500 -
2,000 I - - I- - ~ 1-
III s:: .2 iii (!) - I.... 1,500 I- - - - l- I-- I- - ~ -0 III s::
~ j
1,000 - i- I- - -- I - ~ I
500 ~ I- - - I - - ,..- ~ -
0 flI J FY1993 FY1994 FY1995 FY1996 FY1997 FY1998 FY1999 FY2000 FY2001 FY2002 FY2003 FY2004 FY2005 FY2006 FY2007 FY2008 FY2009 FY2010
[JPlanned Total GW Pumped (Mgal) 97.920 832.320 7 53.552 7 37.856 7 35.840 8 14.464 1548.57 1791 .93 1787.04 1787.04 1787.04 2344.32 2522.882,575.112,330.172,338.022,332.292,332.29
IiIIActual Total GW Pumped (Mgal) 97.183 756.976 6 05.541 597.200 5 85.123 8 83.804 1729.57 1781 .52 2035.16 2155.97 2253.35 2855.22 1610.67 2064.37 2 110.35 2 281 .35 2 463.45 2 380.59
[J Planned Injected GW (Mgal) 0.000 0.000 0.000 0.000 0.000 393.120 525.600 527.040 525.600 525.600 525.600 763.776 840.960
iii Actual Injected GW (Mgal) 0.000 0.000 0.000 0.000 0.000 39.842 436.652 361 .052 132.460 273.188 216.340 499.365 0.000
• Planned Net GW Extracted (Mgal) 0.000 0.000 0.000 0.000 0.000 235.872 1,022.97 1,264.89 1,261.44 1,261 .44 1,261.44 1,580.54 1,681 .92
iii Actual Net GW Extracted (Mgal) 0.000 0.000 0.000 0.000 0.000 657.184 1,292.92 1,420.47 1,903.09 1,882.362,034 .64 2,355.85 1,610.67
Fiscal Year

This page intentionally left blank
Third Five-Year Review Report for the Fernald Preserve u.s. Department of Energy Doc No. S07045-Final September 2011 Alt. 9, Page 2
Attachment 10 Uranium Extracted, Injected, and Net from GMA (1993-2010)

This page intentionally left blank
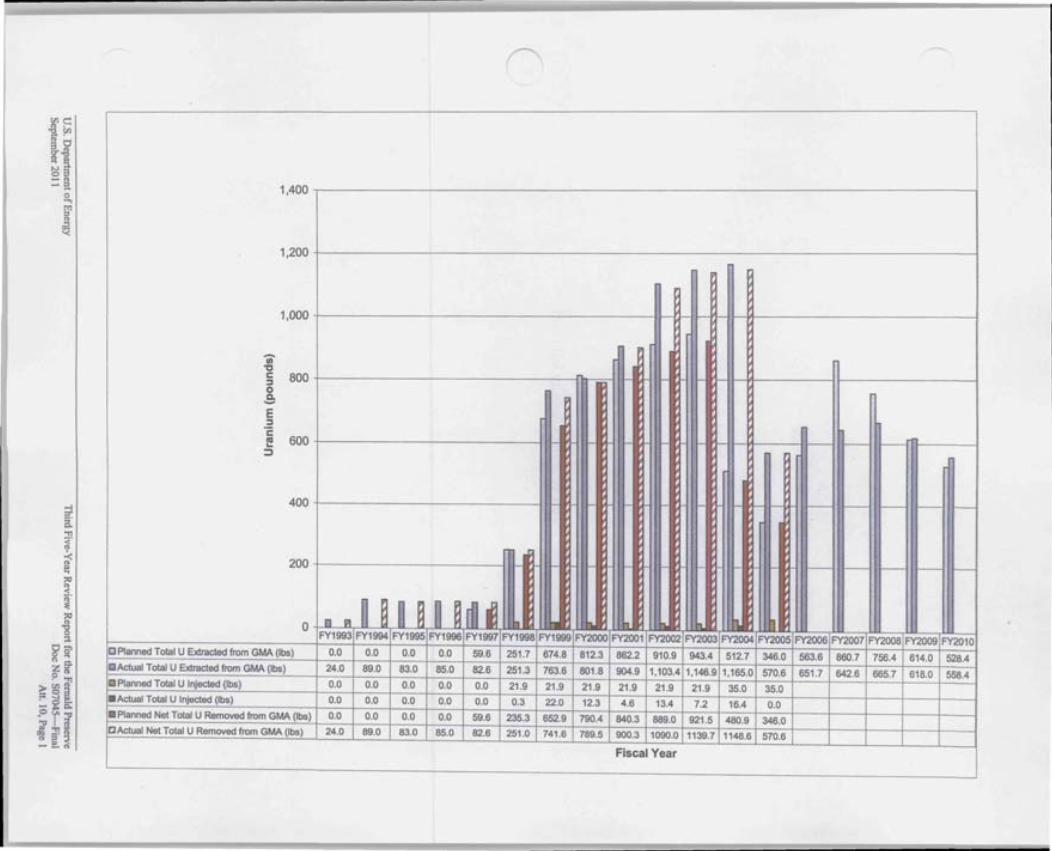
1,400
1,200
1,000 I-- r - r-
Ui' "C c::: 800 r--=- t l t:::::J 0 .S: E :::::J
'c E 600 t t :- t- t-::J
400 l t 1- 1 t---- I- t-- I- t--
200 - - - -- I t- -- I--
0 D~~~ ~ ~~~ill ~ n tI Il. b. tl. b. tl tI FY1993 FY1994 FY1995 FY1996 FY1997 FY1998 FY1999 FY2000 FY2001 FY2002 FY2003 FY2004 FY2005 FY2006 FY2007 FY2008 FY2009 FY2010
o Planned Total U Extracted from GMA (Ibs) 0.0 0.0 0.0 0.0 59.6 251 .7 674.8 812.3 862.2 910.9 943.4 512.7 346.0 563.6 860.7 756.4 614.0 528.4 CActual Total U Extracted from GMA (Ibs) 24.0 89.0 83.0 85.0 82.6 251 .3 763.6 801 .8 904.9 1.103.4 1.146.9 1.165.0 570.6 651 .7 642.6 665.7 618.0 558.4 CPlanned Total U Injected (Ibs) 0.0 0.0 0.0 0.0 0.0 21 .9 21 .9 21 .9 21 .9 21 .9 21 .9 35.0 35.0 • Actual Total U Injected (Ibs) 0.0 0.0 0.0 0.0 0.0 0.3 22.0 12.3 4.6 13.4 7.2 16.4 0.0 • Planned Net Total U Removed from GMA (Ibs) 0.0 0.0 0.0 0.0 59.6 235.3 652.9 790.4 840.3 889.0 921 .5 480.9 346.0 I:JActual Net Total U Removed from GMA (Ibs) 24.0 89.0 83.0 85.0 82.6 251 .0 741.6 789.5 900.3 1090.0 1139.7 1148.6 570.6
Fiscal Year

This page intentionally left blank
Third Five-Year Review Report for the Fernald Preserve u.s. Department of Energy Doc No. S07045-Final September 20 II Atl. 10, Page 2

Attachment 11 Routine Groundwater Elevation Map, Fourth Quarter 2009
(October 12 and October 13)

This page intentionally left blank
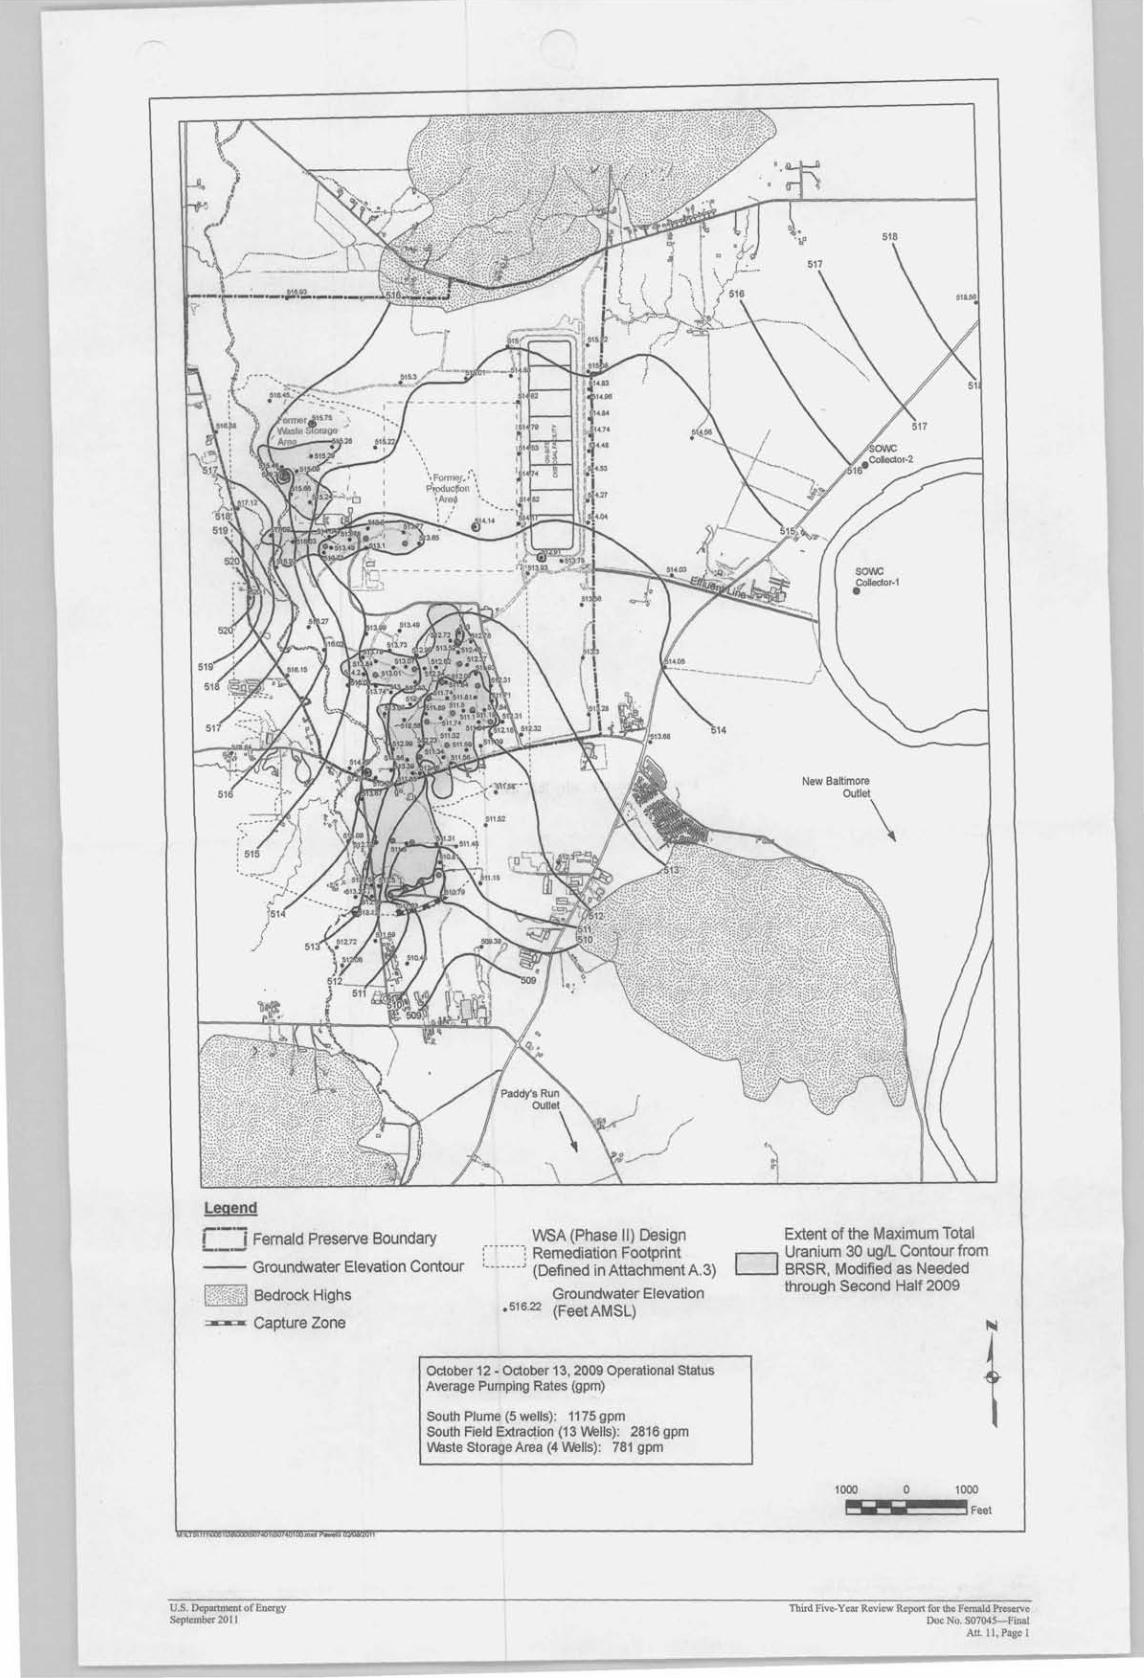
-----
, " 1\"Forme!.. I I
Producfton .. \Are~ '. ,
SOINC Collector-1•
New Baltimore Outlet
\
Legend"...._.- .
!_._...., i Fernald Preserve Boundary
-- Groundwater Elevation Contour
1\.:··:·:·\;;!.:;::.1 Bedrock Highs ',' • • • • , •• J.
• •• Capture Zone
WSA (Phase II) Design :-- ------: Remediation Footprint , _______ (Defined in Attachment A. 3)J
Groundwater Elevation .516.22 (FeetAMSL)
Extent of the Maximum Total 1/Uranium 30 ug/L Contour from L-.J BRSR, Modified as Needed
through Second Half 2009
October 12 - October 13, 2009 Operational Status Average Pumping Rates (gpm)
South Plume (5 wells): 1175 gpm South Field Extraqion (13 Wells): 2816 gpm Waste Storage Area (4 Wells): 781 gpm
1000 o 1000
Feet
U.S. Department of Energy Third Five-Year Review Report for the Fernald Preserve September 2011 Doc No. S07045-Final
Art. 11, Page 1
This page intentionally left blank
Third Five-Year Revit!w Report for the Fernald Preserve u.s. Department of Energy Doc No. S07045-Final September 2011 All. 11, Page 2
Attachment 12 Percent Complete Estimate Based on Uranium Removal
(2006-2009)

This page intentionally left blank
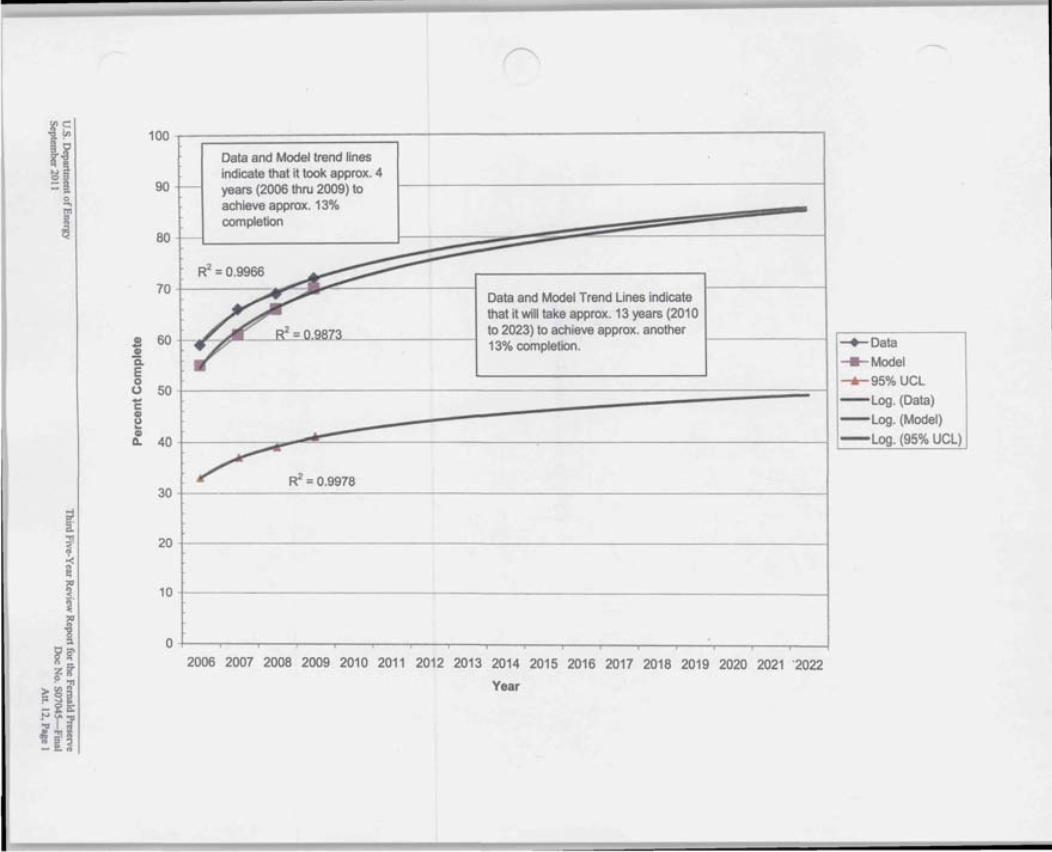
100 r-~==============~--------------------------------~
90
80
Data and Model trend lines indicate that it took approx. 4 years (2006 thru 2009) to achieve approx. 13% completion
70 +----------~~~ Data and Model Trend Lines indicate that it will take approx. 13 years (2010 to 2023) to achieve approx. another 13% completion.
2006 2007 2008 2009 2010 2011 2012 2013 2014 2015 2016 2017 2018 2019 2020 2021 '2022
Year
~Data
_ Model
---.- 95% UCL
-Log. (Data)
-Log. (Model)
-Log. (95% UCL)

This page intentionally left blank
Third Five-Year Review Report for the Fernald Preserve U.S. Department of Energy Doc No. S07045-Final September 2011 Att. 12, Page 2

Attachment 13 Groundwater Treated: Planned and Actual
(FY 1995 - FY 2010)
This page intentionally left blank
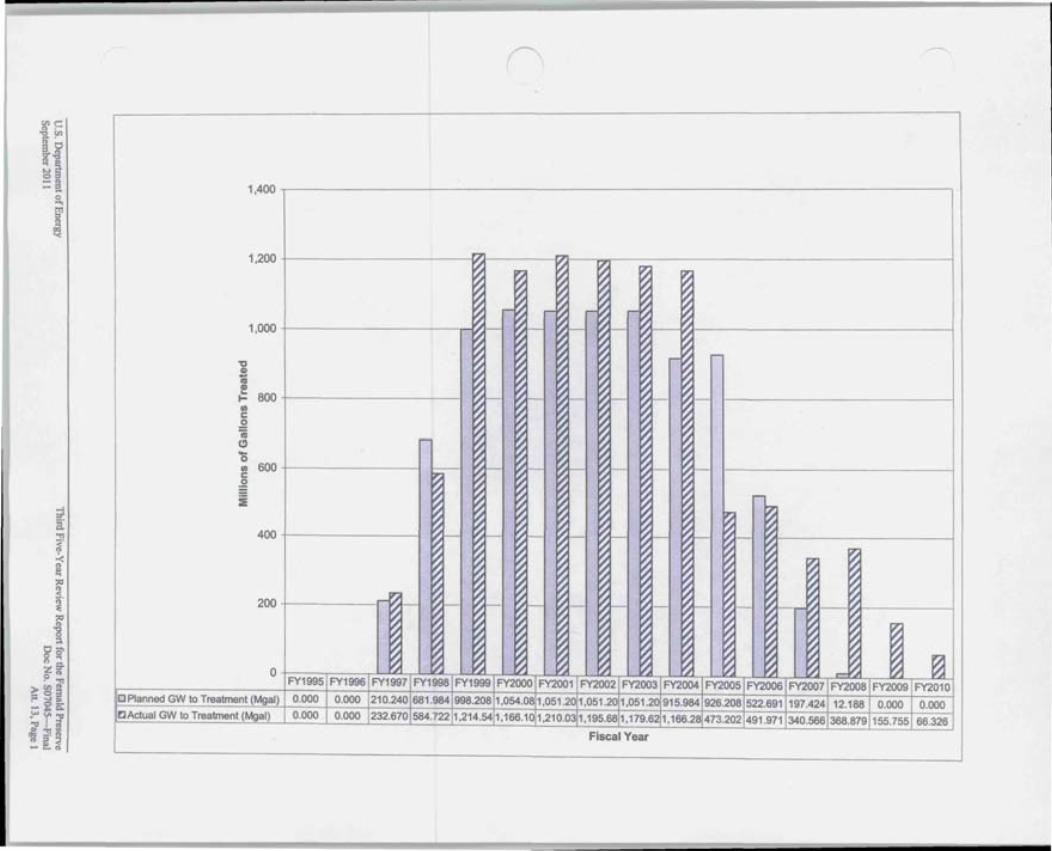
1,400 ,.---------------------------------1
400 +---------1
o Planned GW to Treatment (Mgal) 0.000 0.000 210.240 681 .984 998.208 1,054.081,051 .201,051 .201,051 .20915.984 926.208 522.691 197.424 12.188 0.000 0.000
rJActual GW to Treatment(Mgal) 0.000 0.000 232.670 584.722 1,214.541 ,166.101 ,210.031 ,195.681,179.621 ,166.28 473.202 491 .971 340.566 368.879 155.755 66.326
Fiscal Year

This page intentionally left blank
Third Five-Year Review Report for the Fernald Preserve u.s. Department of Energy Doc No. S07045-Final September 2011 Atl. 13, Page 2

Attachment 14 Groundwater Not Treated (1997-2010)
This page intentionally left blank
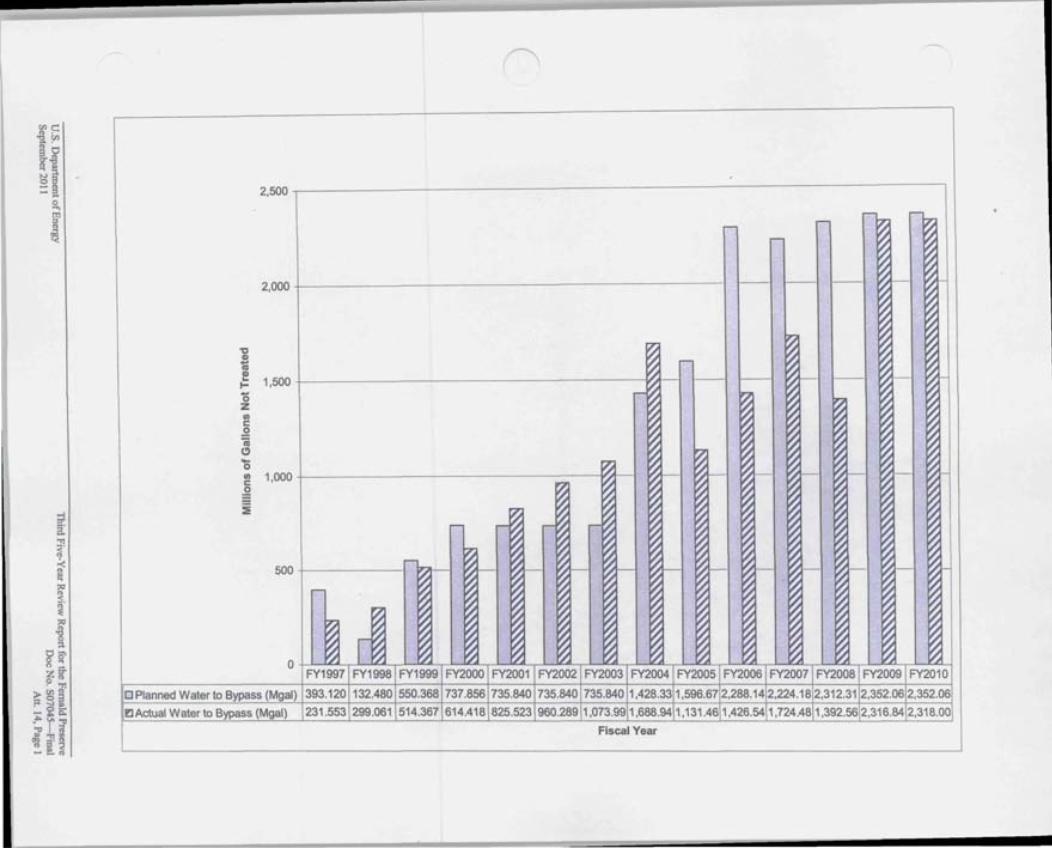
2,500 .,.----------------------------~
-
2,000 +-------------------1 - f----
FY1997 FY1998 FY1999 FY2000 FY2001 FY2002 FY2003 FY2004 FY2005 FY2006 FY2007 FY2008 FY2009 FY2010
o Planned Water to Bypass (Mgal) 393.120 132.480 550.368 737.856 735.840 735.840 735.8401,428.331,596.672,288.142,224.18 2,312.312,352.062,352.06
~Actual Water to Bypass (Mgal) 231.553 299.061 514.367 614.418 825.523 960.289 1,073.991,688.941,131.461,426.541,724.481,392.56 2,316.84 2,318.00
Fiscal Year

This page intentionally left blank
Third Five-Year Review Report for the Fernald Preserve U.s. Department of Energy Doc No. S07045-Final September 2011 Alt. 14, Page 2
Attachment 15 Percent of Groundwater Pumped that was Treated and
Average Monthly Uranium Discharge Concentration vs. Time (January 2004-September 2010)

This page intentionally left blank
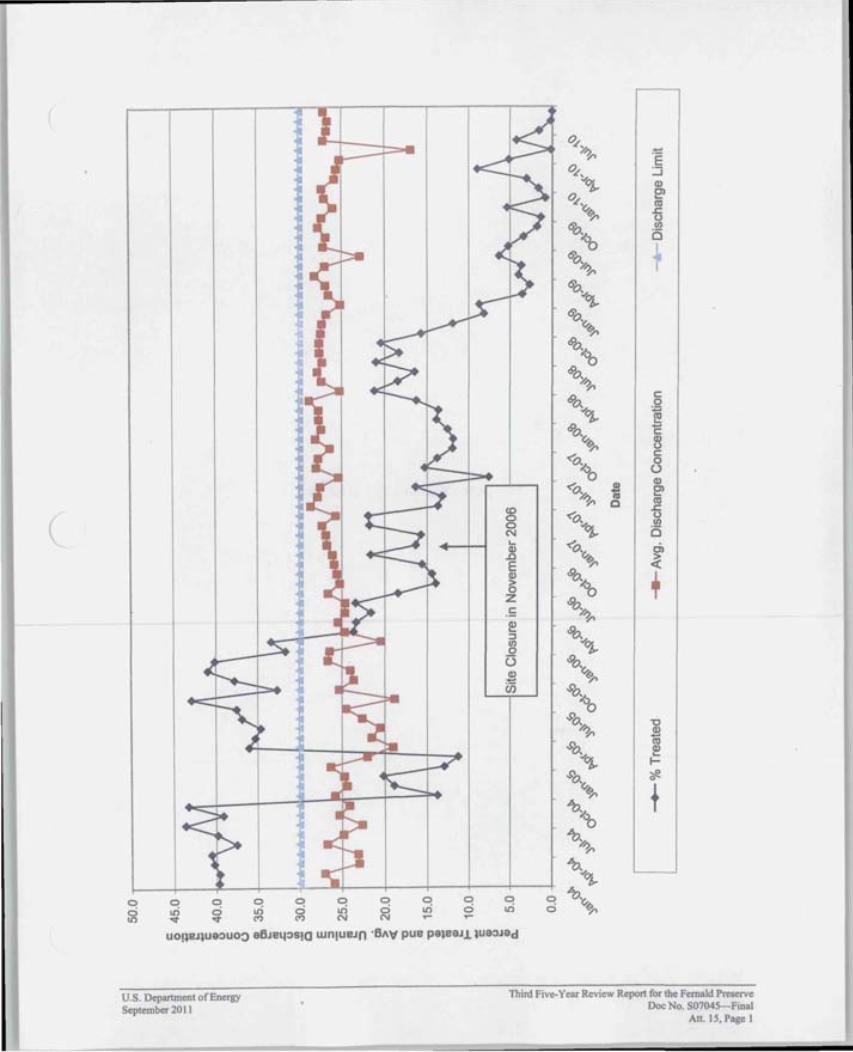
I I ~ L-
a> .0 E a> >0 z ~ a> L-:::J If) 0
(3 a>-U5
0 L'>'-?
;n
o..(~ ~
0L''G,. ~
6'0~ 'b
6! v>'-?
;n
6'0~ ~
6!v'G,. ~
cPo~ va
<9. v>,-?
7'
cPo~ ~
<9.v'G,. ~
<0,;Iva
<o>,-? ~ ;n c
<0, "'~( I I I I t ( 1 ~I
<0'G,. ~
& v~
va BO>,-?
7' & v~ ~
& V'G,. ~
.$'o~ va
.$'o>,-? 7'
.$'o~ ~
.$'0'G,.
~ A v~
va A
V>'-? 7'
A v~ ~
A o 0 000 0 0 000 V'G,.~ ~ o ~ 0 ~ 0 ~ 0 ~ 0 ~ 0 ~ ~ ~ M M N N ~
uOIJeJJU9:>UO:> a5Je4:>SIO wn!UeJn ·5/\,,, pue paJeaJ~ Jua:>Jad
~
E :.::i a> e> co
.s:::. () If)
is
c: o
:;::; ~ c: -a> () c: o ()
a> ~ co
.s:::. () If)
is
! +
"0 a>-co ~ I ~ o
t
Third Five-Year Review Report for the Fernald Preserve u.s.Department of Energy Doc No. S07045- FinalSeptember 20 II
Alt. 15, Page I

This page intentionally left blank
Third Five-Year Review Report for the Fernald Preserve U.S. Department of Energy Doc No. S07045-Final September 2011 Atl. 15. Page 2
Attachment 16 Water Levels in Monitoring Well 62433
(May 25, 2007-January 3,2011)
This page intentionally left blank
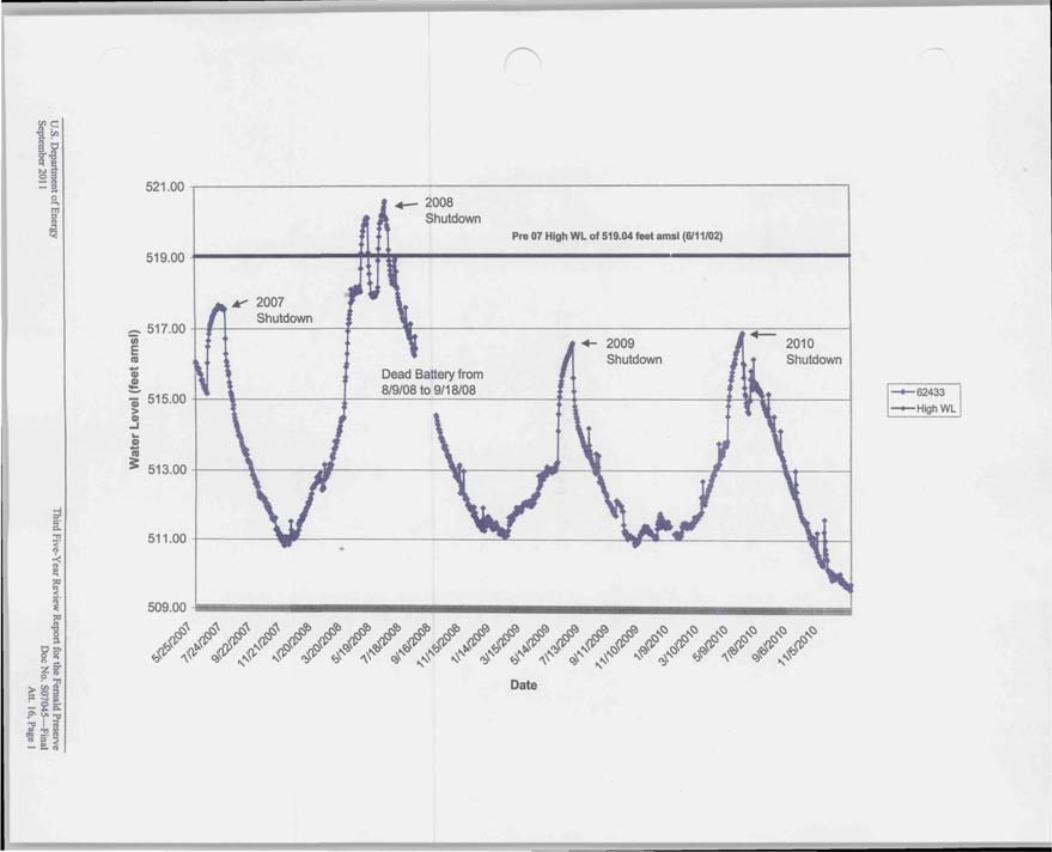
521.00 ~----------------------------------.
2008 Shutdown
Pre 07 High WL of 519.04 feet amsl (6/1 1/02)
519
51 1.00 +-------~..~--------------------~------------~~~~------------__~_1
.00 J--------~~~---------------------__;
¥ 2007 Shutdown
_ 517 . 00 ~~~~~~~--~~--~------------------------------------~~~------~ iii 2009 2010E co Shutdown Shutdown Gi Dead Battery from ~ 8/9/08 to 9/18/08 -62433 m 515 .00 ~~~----------~--~~~~~~--------~~----------------~~H-------~
-HighWL> ~ L
i a>
;> 513.00 -I----''---~''_-----__'1r._---.,..J---~__-----_1__--~~--_;
509.00 ------------------------_____Ii55=m:===I ################~~~~~~#~~~~~~~~#~#~~~~~~~~###~~~~~~~~~~~~~~~~~~~~~
Date
This page intentionally left blank
Third Five-Year Review Report for the Fernald Preserve u.s. Department of Energy Doc No. S07045 -Final September 20 II Alt. 16, Page 2
Attachment 17 Waste Storage Area (Phase II) Design Remediation Footprint

This page intentionally left blank
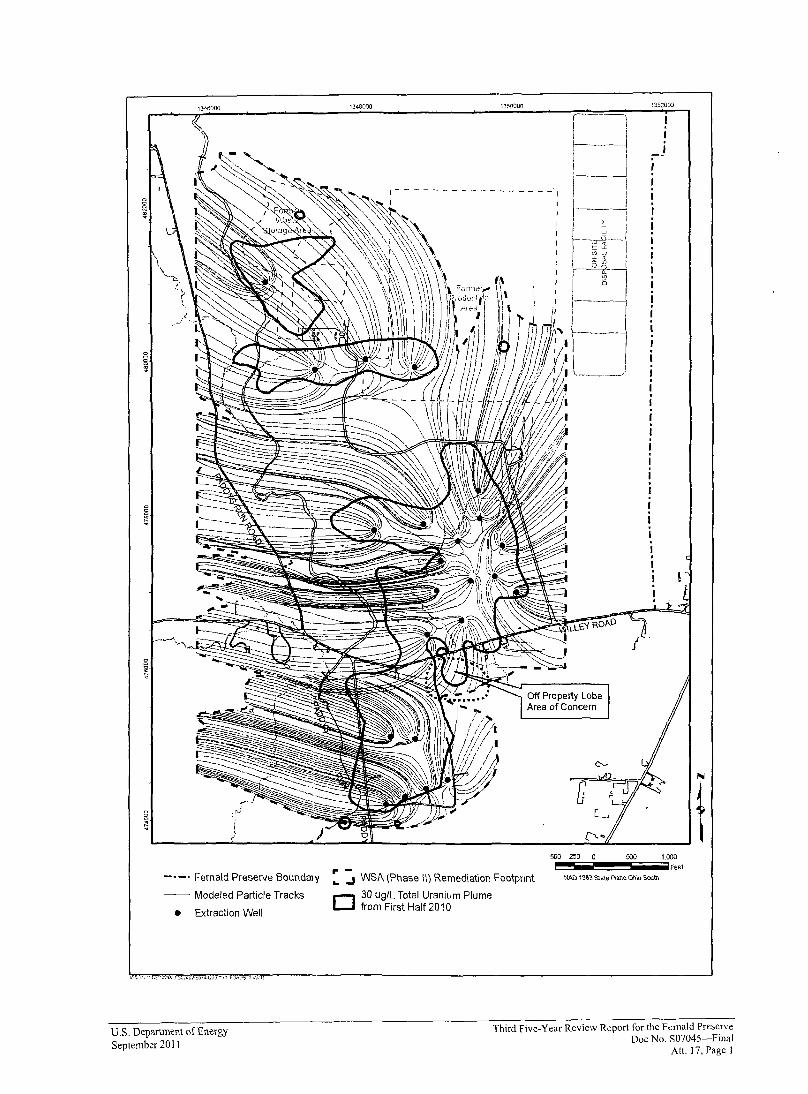
---' Fernald Preserve Boundary
135(1000
Off Property Lobe Area of Concern
r -.. .J WSA (Phase II) Remediation Footprint
-- Modeled Particle Tracks 30 ug/L Total Uranium Plume O from First Half 2010 • Extraction Well
:,:.'.11
Third Five-Year Review Report for the Fernald Preserve U.S. Department of Energy Doc No. S07045-Final
September 2011 Atl. 17, Page I

This page intentionally left blank
Third Five-Year Review Report for the Fernald Preserve u.s. Department of Energy Doc No. S07045-Final September 201 I At!. 17, Page 2