Embed Size (px)
Citation preview

DOE/NE-ID-11201 Revision 3
Five-Year Review of CERCLA Response Actions at the Idaho National Laboratory
February 2007

DOE/NE-ID-11201 Revision 3
Project No. 23037
Five-Year Review of CERCLA Response Actions at the Idaho National Laboratory
February 2007
Prepared for the U.S. Department of Energy
DOE-NE Idaho Operations Office


ABSTRACT
This report summarizes the documentation submitted in support of the five-year review of remedial actions implemented under the Comprehensive Environmental Response, Compensation, and Liability Act Sitewide at the Idaho National Laboratory. The report also summarizes documentation and inspections conducted at the no-further-action sites.
This review covered actions conducted at nine of the 10 waste area groups at the Idaho National Laboratory, i.e., Waste Area Groups 1, 2, 3, 4, 5, 6, 7, 9, and 10. Waste Area Group 8 was not subject to this review, because it does not fall under the jurisdiction of the U.S. Department of Energy Idaho Operations Office. The review included past site inspections and monitoring data collected in support of the remedial actions.
The remedial actions have been completed at Waste Area Groups 2, 4, 5, 6, and 9. Remedial action reports have been completed for Waste Area Groups 2 and 4, and remedial action reports are expected to be completed during 2005 for Waste Area Groups 1, 5, and 9. Remediation is ongoing at Waste Area Groups 3, 7, and 10. Remedial investigations are yet to be completed for Operable Units 3-14, 7-13/14, and 10-08.
The review showed that the remedies have been constructed in accordance with the requirements of the Records of Decision and are functioning as designed. Immediate threats have been addressed, and the remedies continue to be protective. Potential short-term threats are being addressed through institutional controls. Soil cover and cap remedies are being maintained properly and inspected in accordance with the appropriate requirements. Soil removal actions and equipment or system removals have successfully achieved remedial action objectives identified in the Records of Decision. The next Sitewide five-year review is scheduled for completion by 2011.
iii

iv

FOREWORD
Revision 1 of this document was erroneously canceled in September 2006. Company controlled document procedure (MCP-9395) requires a document be given a new revision each time it changes status. This, the document cancellation step in September 2006 resulted in Revision 2. The document was reactivated in February 2007, and this reactivation resulted in Revision 3. Figures 6-6 and Figure 11-1 were revised.
v

vi

CONTENTS
ABSTRACT................................................................................................................................................. iii
ACRONYMS............................................................................................................................................. xxi
1. INTRODUCTION/PURPOSE ........................................................................................................1-1
1.1 Site Location.......................................................................................................................1-6
1.2 Changes to Exposure Pathways, Toxicity, and Other Contaminant Characteristics ..........1-6
1.3 Section 1 References ..........................................................................................................1-7
2. SITEWIDE INSTITUTIONAL CONTROLS, OPERATIONS, AND MAINTENANCE .............2-1
2.1 Land Use.............................................................................................................................2-1
2.2 Institutional Controls ..........................................................................................................2-1
2.3 Operations and Maintenance ..............................................................................................2-2
2.4 Section 2 References ..........................................................................................................2-3
3. SITEWIDE FIVE-YEAR REVIEW PROCESS .............................................................................3-1
3.1 Administrative Components ...............................................................................................3-1
3.2 Community Involvement....................................................................................................3-1
4. WASTE AREA GROUP 1 (TEST AREA NORTH) ......................................................................4-1
4.1 Operable Unit 1-07B (Test Area North Groundwater Contamination) ..............................4-1
4.1.1 Remedial Actions .............................................................................................4-6 4.1.2 Data Evaluation................................................................................................4-8 4.1.3 Progress since Last Review............................................................................4-17 4.1.4 Technical Assessment ....................................................................................4-17 4.1.5 Technical Assessment Summary....................................................................4-20 4.1.6 Issues ..............................................................................................................4-20 4.1.7 Recommendations and Follow-up Activities .................................................4-20 4.1.8 Protectiveness Statement................................................................................4-20
4.2 Operable Unit 1-10 (Test Area North Comprehensive Remediation) ..............................4-20
4.2.1 Remedial Actions ...........................................................................................4-29 4.2.2 Data Evaluation..............................................................................................4-42 4.2.3 Progress since Last Review............................................................................4-43 4.2.4 Technical Assessment ....................................................................................4-43 4.2.5 Technical Assessment Summary....................................................................4-44 4.2.6 Issues ..............................................................................................................4-45
vii

4.2.7 Recommendations and Follow-Up Actions ...................................................4-45 4.2.8 Protectiveness Statement................................................................................4-45
4.3 Section 4 References ........................................................................................................4-45
5. WASTE AREA GROUP 2 (REACTOR TECHNOLOGY COMPLEX) .......................................5-1
5.1 Remedial Actions ...............................................................................................................5-3
5.1.1 Remedy Selection.............................................................................................5-3 5.1.2 Remedial Action Objectives.............................................................................5-7 5.1.3 Remedy Implementation ................................................................................5-10
5.2 Data Evaluation ................................................................................................................5-12
5.2.1 Site Inspections ..............................................................................................5-12 5.2.2 Perched Water Data........................................................................................5-13 5.2.3 Snake River Plain Aquifer Data .....................................................................5-22 5.2.4 Monitoring Results Summary ........................................................................5-29
5.3 Progress since Last Review ..............................................................................................5-29
5.4 Technical Assessment ......................................................................................................5-30
5.4.1 Warm Waste Pond (TRA-03 Site) .................................................................5-30 5.4.2 Chemical Waste Pond (TRA-06 Site) ............................................................5-31 5.4.3 Cold Waste Pond (TRA-08 Site)....................................................................5-31 5.4.4 Sewage Leach Pond and Sewage Leach Pond Soil Contamination
(TRA-13 Site).................................................................................................5-32 5.4.5 TRA-19 and TRA-Y Limited Action Sites ....................................................5-32
5.5 Technical Assessment Summary ......................................................................................5-33
5.5.1 Warm Waste Pond (TRA-03 Site) .................................................................5-33 5.5.2 Chemical Waste Pond (TRA-06 Site) ............................................................5-33 5.5.3 Cold Waste Pond (TRA-08 Site)....................................................................5-33 5.5.4 Sewage Leach Ponds (TRA-13 Site)..............................................................5-33 5.5.5 Soil Surrounding Hot Waste Tanks at the TRA-613 Building
(TRA-15 Site).................................................................................................5-33 5.5.6 Soil Surrounding Tanks 1 and 2 at the TRA-630 Building
(TRA-19 Site).................................................................................................5-33 5.5.7 Brass Cap Area (TRA-Y Site)........................................................................5-34 5.5.8 Sewage Leach Pond Berms and Soil Contamination Area ............................5-34 5.5.9 Institutional Control Sites ..............................................................................5-34
5.6 Issues ................................................................................................................................5-34
5.7 Recommendations and Follow-up Actions.......................................................................5-34
viii

5.8 Protectiveness Statement ..................................................................................................5-35
5.9 Section 5 References ........................................................................................................5-35
6. WASTE AREA GROUP 3 (IDAHO NUCLEAR TECHNOLOGY AND ENGINEERING CENTER) ........................................................................................................................................6-1
6.1 Operable Unit 3-13.............................................................................................................6-1
6.1.1 Remedial Actions .............................................................................................6-1 6.1.2 Data Evaluation..............................................................................................6-22 6.1.3 Progress since Last Review............................................................................6-34 6.1.4 Technical Assessment ....................................................................................6-35 6.1.5 Technical Assessment Summary....................................................................6-38 6.1.6 Issues ..............................................................................................................6-38 6.1.7 Recommendations and Follow-up Actions ....................................................6-39 6.1.8 Protectiveness Statement................................................................................6-39
6.2 ICDF.................................................................................................................................6-40
6.2.1 ICDF Landfill.................................................................................................6-40 6.2.2 ICDF Evaporation Pond.................................................................................6-42 6.2.3 ICDF Staging, Storage, Sizing, and Treatment Facility.................................6-42 6.2.4 Remedial Actions ...........................................................................................6-42 6.2.5 Remedy Implementation ................................................................................6-46 6.2.6 Technical Assessment ....................................................................................6-46 6.2.7 Technical Assessment Summary....................................................................6-47 6.2.8 Issues ..............................................................................................................6-47 6.2.9 Recommendations and Follow-up Activities .................................................6-47 6.2.10 Protectiveness Statement................................................................................6-47
6.3 Section 6 References ........................................................................................................6-47
7. WASTE AREA GROUP 4 (CENTRAL FACILITIES AREA)......................................................7-1
7.1 Remedial Actions ...............................................................................................................7-5
7.1.1 Remedy Selection.............................................................................................7-5 7.1.2 Remedial Action Objectives.............................................................................7-6 7.1.3 Remedy Implementation ..................................................................................7-7
7.2 Data Evaluation ..................................................................................................................7-9
7.2.1 Site Inspections ................................................................................................7-9 7.2.2 Central Facilities Area Groundwater Monitoring ..........................................7-11 7.2.3 Soil-Gas Monitoring.......................................................................................7-17 7.2.4 Moisture Monitoring Data Summary .............................................................7-18 7.2.5 Summary of Central Facilities Area Landfill Monitoring Results .................7-27
7.3 Progress since Last Review ..............................................................................................7-27
ix
7.4 Technical Assessment ......................................................................................................7-28
7.4.1 Central Facilities Area Landfills I, II, and III (CFA-01, CFA-02, and CFA-03 Sites).................................................................................................7-29
7.4.2 Mercury Pond (CFA-04 Site) .........................................................................7-30 7.4.3 Sewage Plant Drainfield (CFA-08 Site).........................................................7-30 7.4.4 Transformer Yard (CFA-10 Site Code) .........................................................7-31
7.5 Technical Assessment Summary ......................................................................................7-31
7.6 Issues ................................................................................................................................7-32
7.7 Recommendations and Follow-up Actions.......................................................................7-32
7.8 Protectiveness Statement ..................................................................................................7-33
7.9 Section 7 References ........................................................................................................7-33
8. WASTE AREA GROUP 5 (AUXILIARY REACTOR AREA AND POWER BURST FACILITY).........................................................................................................8-1
8.1 Remedial Actions .............................................................................................................8-10
8.1.1 Remedy Selection...........................................................................................8-10 8.1.2 Remedial Action Objectives...........................................................................8-17 8.1.3 Remedy Implementation ................................................................................8-19
8.2 Data Evaluation ................................................................................................................8-25
8.2.1 Site Inspections ..............................................................................................8-25 8.2.2 Corrosive Waste Sump (PBF-08 Site) and Evaporation Pond
(PBF-10 Site) .................................................................................................8-25 8.2.3 Contaminated Soil beneath PER-751 Pump House Floor Slab and
Foundation (PBF-37 Site) ..............................................................................8-26 8.2.4 ARA-I Chemical Evaporation Pond (ARA-01 Site) ......................................8-26 8.2.5 ARA-I Sanitary Waste System (ARA-02 Site) ..............................................8-26 8.2.6 ARA-II Stationary Low-Power Reactor No. 1 Burial Ground
(ARA-06 Site) ................................................................................................8-27 8.2.7 Radioactive Waste Leach Pond (ARA-12 Site) .............................................8-27 8.2.8 ARA-I Radionuclide Tank (ARA-16 Site).....................................................8-28 8.2.9 Radiologically Contaminated Surface Soil and Subsurface Structures
associated with ARA-I and ARA-II (ARA-23 Site) ......................................8-28 8.2.10 ARA-I Soil beneath the ARA-626 Hot Cells (ARA-25 Site).........................8-30 8.2.11 Inactive Waste System Sites ..........................................................................8-30 8.2.12 Groundwater Monitoring................................................................................8-31 8.2.13 Institutional Controls......................................................................................8-33
x

8.3 Progress since Last Review ..............................................................................................8-35
8.3.1 Issues Identified during the First Operable Unit 5-05 Five-Year Review......8-36 8.3.2 Response Actions to Issues Identified during the First Five-Year Review....8-36 8.3.3 Ongoing Remediation Activities....................................................................8-36
8.4 Technical Assessment ......................................................................................................8-37
8.5 Issues ................................................................................................................................8-37
8.6 Recommendations and Follow-up Actions.......................................................................8-37
8.7 Protectiveness Statement ..................................................................................................8-38
8.8 Section 8 References ........................................................................................................8-38
9. WASTE AREA GROUP 6 (EXPERIMENTAL BREEDER REACTOR I AND BOILING-WATER REACTOR EXPERIMENT) ..........................................................................9-1
9.1 Remedial Actions ...............................................................................................................9-2
9.1.1 Remedy Selection.............................................................................................9-8 9.1.2 Remedial Action Objectives.............................................................................9-9 9.1.3 Remedy Implementation ................................................................................9-11
9.2 Data Evaluation ................................................................................................................9-12
9.2.1 Site Inspections ..............................................................................................9-12 9.2.2 BORAX-I Burial Ground (BORAX-02 Site).................................................9-12 9.2.3 BORAX Ditch (BORAX-08 Site)..................................................................9-13
9.3 Progress since Last Review ..............................................................................................9-13
9.3.1 Issues Identified during the First Five-Year Review......................................9-13 9.3.2 Response Actions to Issues Identified during the First
Five-Year Review ..........................................................................................9-13
9.4 Technical Assessment ......................................................................................................9-14
9.5 Technical Assessment Summary ......................................................................................9-15
9.6 Issues ................................................................................................................................9-15
9.7 Recommendations and Follow-up Actions.......................................................................9-15
9.8 Protectiveness Statement ..................................................................................................9-15
9.9 Section 9 References ........................................................................................................9-15
xi

10. WASTE AREA GROUP 7 (RADIOACTIVE WASTE MANAGEMENT COMPLEX).............10-1
10.1 Operable Unit 7-08 (Organic Contamination in the Vadose Zone)..................................10-1
10.1.1 Remedial Actions ...........................................................................................10-4 10.1.2 Data Evaluation..............................................................................................10-6 10.1.3 Progress since Last Review..........................................................................10-10 10.1.4 Technical Assessment ..................................................................................10-15 10.1.5 Technical Assessment Summary..................................................................10-16 10.1.6 Issues ............................................................................................................10-16 10.1.7 Recommendations and Follow-up Actions ..................................................10-16 10.1.8 Protectiveness Statement..............................................................................10-16
10.2 Operable Unit 7-10 (Pit 9)..............................................................................................10-16
10.2.1 Remedy Selection.........................................................................................10-18 10.2.2 Data Evaluation............................................................................................10-23 10.2.3 Progress since Last Review..........................................................................10-25 10.2.4 Technical Assessment ..................................................................................10-26 10.2.5 Technical Assessment Summary..................................................................10-26 10.2.6 Issues ............................................................................................................10-26 10.2.7 Recommendations and Follow-up Activities ...............................................10-26 10.2.8 Protectiveness Statement..............................................................................10-27
10.3 Operable Unit 7-12 (Pad A) ...........................................................................................10-27
10.3.1 Remedial Actions .........................................................................................10-29 10.3.2 Data Evaluation............................................................................................10-30 10.3.3 Progress since Last Review..........................................................................10-30 10.3.4 Technical Assessment ..................................................................................10-32 10.3.5 Technical Assessment Summary..................................................................10-33 10.3.6 Issues ............................................................................................................10-33 10.3.7 Recommendations and Follow-up Actions ..................................................10-33 10.3.8 Protectiveness Statement..............................................................................10-33
10.4 Section 10 References ....................................................................................................10-34
11. WASTE AREA GROUP 9 (MATERIALS AND FUELS COMPLEX).......................................11-1
11.1 Remedial Actions .............................................................................................................11-1
11.1.1 Remedy Selection...........................................................................................11-1 11.1.2 Remedial Action Objectives...........................................................................11-4 11.1.3 Remedy Implementation ................................................................................11-5
11.2 Data Evaluation ................................................................................................................11-8
11.3 Progress since Last Review ............................................................................................11-10
11.4 Technical Assessment ....................................................................................................11-10
xii

11.5 Technical Assessment Summary ....................................................................................11-10
11.6 Issues ..............................................................................................................................11-12
11.7 Recommendations and Follow-up Actions.....................................................................11-12
11.8 Protectiveness Statement ................................................................................................11-12
11.9 Section 11 References ....................................................................................................11-12
12. WASTE AREA GROUP 10 (SITEWIDE AREA)........................................................................12-1
12.1 Remedial Actions .............................................................................................................12-7
12.1.1 Remedy Selection...........................................................................................12-8 12.1.2 Remedial Action Objectives.........................................................................12-10 12.1.3 Remedy Implementation ..............................................................................12-12
12.2 Data Evaluation ..............................................................................................................12-14
12.2.1 Site Inspections ............................................................................................12-14 12.2.2 Time-Critical Removal Actions ...................................................................12-14
12.3 Progress since Last Review ............................................................................................12-15
12.3.1 Operable Unit 10-04 Phase I Activities........................................................12-15 12.3.2 Operable Unit 10-04 Phase II Activities ......................................................12-17 12.3.3 Operable Unit 10-04 Phase III Activities .....................................................12-17 12.3.4 Operable Unit 10-04 Phase IV Activities.....................................................12-18 12.3.5 Operable Unit 10-08 New Sites, Track 1s, and Track 2s .............................12-18 12.3.6 Operable Unit 10-08 Snake River Plain Aquifer..........................................12-18
12.4 Technical Assessment ....................................................................................................12-25
12.5 Issues ..............................................................................................................................12-26
12.6 Recommendations and Follow-up Actions.....................................................................12-26
12.7 Protectiveness Statement ................................................................................................12-26
12.8 Section 12 References ....................................................................................................12-26
13. SUMMARY AND CONCLUSIONS............................................................................................13-1
13.1 Section 13 References ......................................................................................................13-1
14. NEXT REVIEW............................................................................................................................14-1
xiii

Appendix A—Evaluation of Slope Factors and Risk-Based Concentration Changes ..............................A-1
Appendix B—Activities Completed since September 30, 2004............................................................... B-1
Appendix C—Issues Identified during the INL Sitewide Five-Year Review of 2005 ............................. C-1
FIGURES
1-1. Idaho National Laboratory Site map showing waste area group locations ...................................1-2
4-1. Facilities and well locations at Test Area North ...........................................................................4-3
4-2. Conceptual illustration of the components of the amended Operable Unit 1-07B remedy (from the 2001 ROD amendment [DOE-ID 2001a]) ....................................................................4-7
4-3. Generalized monitoring program operations throughout the remedial action timeframe. ..........4-11
4-4. Trichloroethene concentrations in the hot spot and downgradient wells ....................................4-13
4-5. Calculated mass flow rate of volatile organic compounds emitted in the off-gas of the New Pump and Treat Facility. ....................................................................................................4-14
4-6. Concentration of contaminants present in groundwater samples collected from the TAN-33 well ...............................................................................................................................4-15
4-7. Trichloroethene peak breakthrough analysis for the TAN-16 well ............................................4-16
4-8. Technical Support Facility remedial action sites ........................................................................4-21
4-9. Water Reactor Research Test Facility remedial action sites.......................................................4-22
4-10. Locations of the TSF-19, TSF-46, TSF-47, and TSF-48 sites ....................................................4-23
5-1. Waste Area Group 2 release sites that required remediation ........................................................5-4
5-2. Map of monitoring wells at the Reactor Technology Complex..................................................5-14
5-3. Historical discharges of water to the Reactor Technology Complex ponds ...............................5-15
5-4. Configuration of the deep perched water at the Reactor Technology Complex (November 2003) ........................................................................................................................5-16
5-5. Chromium levels in wells proximal to the warm waste pond.....................................................5-18
5-6. Tritium levels in wells proximal to the warm waste pond..........................................................5-19
5-7. Tritium levels in wells distal to the warm waste pond................................................................5-20
5-8. Sr-90 concentrations proximal to the warm waste pond and recent data for Sr-90 concentrations proximal to the warm waste pond.......................................................................5-21
xiv

5-9. Historical Co-60 levels in perched water wells ..........................................................................5-23
5-10. Free-phase product thickness over time in PW-13 .....................................................................5-24
5-11. Snake River Plain Aquifer water table configuration for June 2004 ..........................................5-25
5-12. Unfiltered chromium concentrations compared to model predictions (1990 to present) .........................................................................................................................5-26
5-13. Chromium concentrations (μg/L) for October 2003 and March 2004........................................5-27
5-14. Tritium concentration in selected Snake River Plain Aquifer wells in the vicinity of the Reactor Technology Complex for long-term trends and recent values ............................5-28
6-1. Map of CERCLA sites at the Idaho Nuclear Technology and Engineering Center......................6-2
6-2. Paving activities within the tank farm...........................................................................................6-9
6-3. Location of Group 6 sites............................................................................................................6-11
6-4. Gas cylinder removal at the CPP-84 site ....................................................................................6-11
6-5. New vegetation growth in June 2005 at the CPP-84 site ............................................................6-12
6-6. Locations of the tank farm interim action components...............................................................6-17
6-7. Wells at the Idaho Nuclear Technology and Engineering Center...............................................6-28
6-8. Concentration trends for Sr-90 in perched water at selected Idaho Nuclear Technology and Engineering Center wells .....................................................................................................6-29
6-9. Concentration trends for Tc-99 in perched water at selected Idaho Nuclear Technology and Engineering Center wells .....................................................................................................6-30
6-10. Concentration trends for Sr-90 in groundwater at the Idaho Nuclear Technology and Engineering Center .....................................................................................................................6-33
6-11. Concentration trends for Tc-99 in groundwater at the Idaho Nuclear Technology and Engineering Center .....................................................................................................................6-33
6-12. Concentration trends for I-129 in groundwater at the Idaho Nuclear Technology and Engineering Center .....................................................................................................................6-34
6-13. Concentration trends for tritium in groundwater at the Idaho Nuclear Technology and Engineering Center .....................................................................................................................6-34
6-14. Location and plan view of the ICDF Complex ...........................................................................6-41
6-15. Landfill operations at the ICDF ..................................................................................................6-44
6-16. Placing PM2A tank from Waste Area Group 1 into the ICDF ...................................................6-44
xv

7-1. Waste Area Group 4 CERCLA sites.............................................................................................7-3
7-2. Subsidence discovered in the Central Facilities Area Landfill III cover ....................................7-10
7-3. Groundwater monitoring wells and water-level measurement wells ..........................................7-12
7-4. Nitrate concentration in the CFA-MON-A-002 and CFA-MON-A-003 wells (note that the MCL = 10 mg/L)...................................................................................................7-15
7-5. Lead and zinc concentrations in the CFA-MON-A-001 well .....................................................7-15
7-6. Groundwater-level contour map for the Central Facilities Area in January 2004 ......................7-16
7-7. Vapor trends for selected compounds in GSP1-1 (CFA-GAS-V-004) at Landfill I ...................7-19
7-8. Trends for selected compounds at GSP2-2 on Landfill II (CFA-GAS-V-006) ..........................7-21
7-9. Trends for selected compounds at GSP3-1 near Landfill III (CFA-GAS-007) ..........................7-23
7-10. Concentration trends for selected compounds at GSP3-2 near Landfill III (CFA-GAS-V-008) .....................................................................................................................7-24
7-11. Locations of time-domain reflectometer arrays and neutron access tubes..................................7-25
8-1. Auxiliary Reactor Area CERCLA sites ........................................................................................8-5
8-2. Power Burst Facility CERCLA sites.............................................................................................8-6
8-3. Auxiliary Reactor Area institutional control sites.......................................................................8-14
8-4. Power Burst Facility institutional control sites ...........................................................................8-15
8-5. Waste Area Group 5 groundwater contour map developed from April 2004 data .....................8-34
9-1. Waste Area Group 6 CERCLA sites.............................................................................................9-3
9-2. BORAX-02 burial ground.............................................................................................................9-5
9-3. BORAX-08 and EBR-15 ..............................................................................................................9-6
9-4. Waste Area Group 6 institutional control sites ...........................................................................9-10
10-1. Location of Operable Unit 7-08 (organic contamination in the vadose zone units), Operable Unit 7-10 (Pit 9), and Operable Unit 7-12 (Pad A) at the Radioactive Waste Management Complex ................................................................................................................10-2
10-2. Location and depth of vapor sampling ports in and around the Subsurface Disposal Area........10-7
10-3. CCl4 concentrations in aquifer monitoring wells in the vicinity of the Radioactive Waste Management Complex ................................................................................................................10-9
xvi

10-4. Total mass of volatile organic compounds removed during each year of organic contamination in the vadose zone operation .............................................................................10-10
10-5. Spatial distribution of CCl4 in the Subsurface Disposal Area at approximately 70 ft bls in January 1996.........................................................................................................................10-11
10-6. Spatial distribution of CCl4 in the Subsurface Disposal Area at approximately 70 ft bls in January 1998.........................................................................................................................10-11
10-7. Spatial distribution of CCl4 in the Subsurface Disposal Area at approximately 70 ft bls in January 2000.........................................................................................................................10-12
10-8. Spatial distribution of CCl4 in the Subsurface Disposal Area at approximately 70 ft bls in January 2002.........................................................................................................................10-12
10-9. Spatial distribution of CCl4 in the Subsurface Disposal Area at approximately 70 ft bls in October 2003 ........................................................................................................................10-13
10-10. Spatial distribution of CCl4 in the Subsurface Disposal Area at approximately 70 ft bls in January 2004.........................................................................................................................10-13
10-11. Spatial distribution of CCl4 in the Subsurface Disposal Area at approximately 70 ft bls in March 2004...........................................................................................................................10-14
10-12. Spatial distribution of CCl4 in the Subsurface Disposal Area at approximately 70 ft bls in July 2004...............................................................................................................................10-14
10-13. Spatial distribution of CCl4 in the Subsurface Disposal Area at approximately 70 ft bls in September 2004 ....................................................................................................................10-15
10-14. Site plan of the Operable Unit 7-10 Glovebox Excavator Method Project...............................10-19
10-15. The glovebox excavator retrieving waste from Pit 9 ................................................................10-22
10-16. Glovebox excavator operators segregating waste retrieved from Pit 9.....................................10-22
10-17. Comparison of anticipated volatile organic compound levels with photoionization detector readings and SUMMA canister grab sample analytical results...................................10-25
10-18. Lysimeters and monitoring wells at Waste Area Group 7 ........................................................10-31
10-19. Nitrogen concentrations in lysimeters located around Pad A and in the USGS-092 well ........10-32
11-1. Areas that required remediation at the Materials and Fuels Complex ........................................11-3
12-1. Waste Area Group 10 CERCLA sites.........................................................................................12-3
xvii

TABLES
1-1. Decision documents ......................................................................................................................1-3
1-2. Triggering action of five-year reviews at individual waste area groups .......................................1-5
4-1. Contaminants of concern at Operable Unit 1-07B........................................................................4-2
4-2. Chronology of Operable Unit 1-07B events .................................................................................4-4
4-3. Monitoring crosswalk table for the Operable Unit 1-07B remedial action...................................4-9
4-4. Drawdown measured at selected wells .......................................................................................4-14
4-5. Contaminants of concern at Operable Unit 1-10 ........................................................................4-24
4-6. Chronology of Operable Unit 1-10 events..................................................................................4-25
5-1. Contaminants of concern at Waste Area Group 2.........................................................................5-2
5-2. Chronology of Waste Area Group 2 events ..................................................................................5-5
5-3. Institutionally controlled sites at Waste Area Group 2 .................................................................5-8
5-4. Monitoring wells reviewed for this five-year review..................................................................5-15
6-1. Waste Area Group 3 CERCLA sites.............................................................................................6-3
6-2. Idaho Nuclear Technology and Engineering Center CERCLA site groups with contaminants of concern and cleanup goals..................................................................................6-6
6-3. Chronology of significant events ..................................................................................................6-7
6-4. Comparison of contaminant of concern levels at the CPP-67 site to the Operable Unit 3-13 risk-based remediation goals ......................................................................................6-23
6-5. Post-removal confirmation sample results for the CPP-94 site compared to data quality objective action levels.................................................................................................................6-23
6-6. Post-removal confirmation sample results for the CPP-84 site compared to data quality objective action levels.................................................................................................................6-24
7-1. Contaminants of concern for Waste Area Group 4.......................................................................7-2
7-2. Chronology of Waste Area Group 4 events. .................................................................................7-4
7-3. Groundwater monitoring wells and sampling rationale. .............................................................7-12
7-4. Summary of groundwater monitoring results since the last the five-year review (data from 2002 and 2003), background concentrations, and regulatory levels for detected analytes. ........................................................................................................................7-13
xviii
7-5. Summary of moisture monitoring results since the previous five-year review...........................7-26
7-6. Recommendations and responses to issues from the first five-year review for Operable Unit 4-12. ....................................................................................................................7-28
8-1. Contaminants of concern at Waste Area Group 5.........................................................................8-2
8-2. Surface soil concentrations for various contaminants of concern at SL-1....................................8-4
8-3. Subsurface concentrations for various contaminants of concern at SL-1 .....................................8-4
8-4. Chronology of Waste Area Group 5 events ..................................................................................8-8
8-5. Waste Area Group 5 institutionally controlled sites ...................................................................8-16
8-6. Evaluation of the ARA-02 site remediation activities ................................................................8-27
8-7. ARA-23 site Cs-137 data summary by area................................................................................8-29
8-8. ARA-25 site contaminant concentration evaluation ...................................................................8-30
8-9. Lead concentrations in the Waste Area Group 5 groundwater monitoring wells .......................8-32
8-10. PBF-26 site radionuclide concentrations ....................................................................................8-35
9-1. Contaminants of concern at Waste Area Group 6.........................................................................9-1
9-2. Chronology of Waste Area Group 6 events ..................................................................................9-7
9-3. Remedial action objectives for the non-time-critical removal action .........................................9-11
10-1. Contaminants of concern at Operable Unit 7-08 ........................................................................10-3
10-2. Chronology of Operable Unit 7-08 events..................................................................................10-3
10-3. Breakdown by operating cycle of the mass of contaminants removed to date ...........................10-8
10-4. Chronology of Operable Unit 7-10 events................................................................................10-19
10-5. Chronology of significant Operable Unit 7-12 events ..............................................................10-28
11-1. Contaminants of concern at Operable Unit 9-04 ........................................................................11-2
11-2. Chronology of the Waste Area Group 9 events ..........................................................................11-4
11-3. Materials and Fuels Complex groundwater values exceeding drinking water maximum contaminant levels ......................................................................................................................11-9
11-4. Summary of responses to Question A.......................................................................................11-11
xix

12-1. Contaminants of concern for Operable Unit 10-04.....................................................................12-5
12-2. Chronology of Waste Area Group 10 events ..............................................................................12-6
12-3. Operable Unit 10-08 new sites..................................................................................................12-19
xx

ACRONYMS
ACF area shielding factor
ANL Argonne National Laboratory
ANL-W Argonne National Laboratory-West
ARA Auxiliary Reactor Area
ARAR applicable or relevant and appropriate requirement
ARD agreement to resolve disputes
AT&T American Telephone and Telegraph Company
bls below land surface
BORAX Boiling-Water Reactor Experiment
CERCLA Comprehensive Environmental Response, Compensation, and Liability Act
CFA Central Facilities Area
CFR Code of Federal Regulations
COC contaminant of concern
COPC contaminant of potential concern
CPP Chemical Processing Plant
D&D decontamination and decommissioning
DCE dichloroethene
DE deep extraction
DEQ [Idaho] Department of Environmental Quality
DOE U.S. Department of Energy
DOE-ID U.S. Department of Energy Idaho Operations Office
DQO data quality objective
DWMCL drinking water maximum contaminant level
EBR Experimental Breeder Reactor
EDF engineering design file
xxi

EE/CA engineering evaluation/cost analysis
EOCR Experimental Organic-Cooled Reactor
EPA U.S. Environmental Protection Agency
ESD explanation of significant differences
ET evapotranspiration
FD field drain
FFA/CO Federal Facility Agreement and Consent Order
FR Federal Register
FSP field sampling plan
FY fiscal year
GSF gamma-shielding factor
HEAST Health Effects Assessment Summary Table
HEPA high-efficiency particulate air
HI hazard index
HIC high-integrity container
HWMA Hazardous Waste Management Act
ICDF Idaho CERCLA Disposal Facility
ICP Idaho Cleanup Project
IDWR Idaho Department of Water Resources
IE intermediate extraction
IET Initial Engine Test
INEEL Idaho National Engineering and Environmental Laboratory
INEL Idaho National Engineering Laboratory
INL Idaho National Laboratory
INTEC Idaho Nuclear Technology and Engineering Center
IRIS Integrated Risk Information System
xxii
ISB in situ bioremediation
IWTS Integrated Waste Tracking System
LCCDA Liquid Corrosive Chemical Disposal Area
LDR land disposal restriction
LMAES Lockheed Martin Advanced Environmental Systems
MCL maximum contaminant level
MCP management control procedure
MFC Materials and Fuels Complex
MNA monitored natural attenuation
MRDS monitoring report/decision summary
MSIP monitoring system and installation plan
MWTS monitoring well and tracer study
NA not applicable
NAT neutron access tube
NOAA National Oceanic and Atmospheric Administration
NODA Naval Ordnance Disposal Area
NPTF New Pump and Treat Facility
NRF Naval Reactors Facility
NSD notice of soil disturbance
NSI new site identification
NTD no toxicity data
OCVZ organic contamination in the vadose zone
OMRE Organic-Moderated Reactor Experiment
OU operable unit
PBF Power Burst Facility
PCB polychlorinated biphenyl
xxiii
PCE tetrachloroethene (also known as perchloroethylene)
PER Power Excursion Reactor
ppb parts per billion
ppm parts per million
PRG preliminary remediation goal
RAO remedial action objective
RBC risk-based concentration
RBCA risk-based corrective action
RCRA Resource Conservation and Recovery Act
RD/RA remedial design/remedial action
RDX cyclotrimethylene trinitroamine
RfD reference dose
RFTO recuperative flameless thermal oxidation
RI/FS remedial investigation/feasibility study
ROD Record of Decision
RTC Reactor Technology Complex
RWMC Radioactive Waste Management Complex
SDA Subsurface Disposal Area
SE shallow extraction
SL-1 Stationary Low-Power Reactor No. 1
SPERT Special Power Excursion Reactor Test
SRPA Snake River Plain Aquifer
SSSTF staging, storage, sizing, and treatment facility
STF Security Training Facility
TAN Test Area North
TBD to be determined
xxiv

TCA trichloroethane
TCE trichloroethene
TCLP toxicity characteristic leaching procedure
TDR time-domain reflectometer
TFR technical and functional requirement
TNT trinitrotoluene
TRA Test Reactor Area
TRU transuranic
TSCA Toxic Substances Control Act
TSF Technical Support Facility
UCL upper confidence limit
UCL90 upper 90% confidence limit
UHC underlying hazard constituent
USC United States Code
USGS United States Geological Survey
UXO unexploded ordnance
VOC volatile organic compound
WAG waste area group
WCF Waste Calcining Facility
WRRTF Water Reactor Research Test Facility
xxv

xxvi

Five-Year Review of CERCLA Response Actions at the Idaho National Laboratory 1. INTRODUCTION/PURPOSE
The purpose of this five-year review was to ascertain whether completed remedial actions at the Idaho National Laboratory (INL) Site remain protective of human health and the environment. For sites where the remedy is incomplete, the focus of the review was to ascertain whether the remedy is being constructed in accordance with the requirements of applicable decision documents and design specifications and whether the remedy is expected to be protective when it is completed.
This review was conducted in accordance with the requirements of Section 121(c) of the Comprehensive Environmental Response, Compensation, and Liability Act (CERCLA) (42 USC § 9601 et seq.) and is considered statutory (EPA 1991; EPA 1994; EPA 1995a). As identified in Section 2(d) of Executive Order 12580, “Superfund Implementation,” the U.S. Department of Energy (DOE) has the duty and authority by law to conduct five-year reviews at the INL. Furthermore, the “National Oil and Hazardous Substances Pollution Contingency Plan,” as promulgated in the Code of Federal Regulations (CFR), recognizes in 40 CFR 300.5, “Definitions,” that DOE will be the lead agency for the INL with regard to conducting five-year reviews. Section 22.1 of the Federal Facility Agreement and Consent Order for the Idaho National Engineering Laboratory (DOE-ID 1991a) specifies that the U.S. Environmental Protection Agency (EPA) can review response actions and, with consultation from the Idaho Department of Environmental Quality (DEQ), determine whether additional action is required by DOE.
In accordance with the Federal Facility Agreement and Consent Order (FFA/CO) (DOE-ID 1991a), the INL Site was divided into 10 waste area groups (WAGs) to facilitate remedial design/remedial action (RD/RA) (Figure 1-1). WAGs 1 through 9 correspond to the primary facility areas at the INL Site. WAG 10 corresponds to the portion of the Snake River Plain Aquifer (SRPA) beneath the INL Site and to surface and subsurface areas not included with CERCLA sites identified in facility-specific Records of Decision (RODs). The FFA/CO also established operable units (OUs) for specific remedial activities within the WAGs. During the early stages of cleanup, RODs were drafted and implemented for OUs. Comprehensive RODs were subsequently drafted or are being drafted as the cleanup efforts have evolved. Table 1-1 lists the decision documents for each WAG.
As identified in the Idaho National Engineering and Environmental Laboratory Sitewide Five-Year Review Plan for CERCLA Response Actions (DOE-ID 2004a), this review represents the first INL “Sitewide” five-year review conducted by DOE. Several WAGs or OUs have undergone five-year reviews in the past; others have not. Because some of the WAGs have undergone individual five-year reviews in the past, fewer than 5 years might have elapsed since the previous review. However, completion of this review established a consolidated, Sitewide five-year review schedule at the INL Site. Table 1-2 identifies the triggering action and date for the review and presents the number of reviews that have been completed for INL WAGs and OUs. In general, the trigger for this five-year review is initiation of remedial actions or the signature date of the previous five-year review report. Although the trigger dates for the individual WAGs vary, the end date for this review is September 30, 2004, for all WAGs and OUs.
1-1

Figure 1-1. Idaho National Laboratory Site map showing waste area group locations.
1-2

Table 1-1. Decision documents.
Date Decision Document
WAG 1
August 1995 Record of Decision for the Technical Support Facility Injection Well (TSF-05) and Surrounding Groundwater Contamination (TSF-23) and Miscellaneous No Action Sites Final Remedial Action (DOE-ID 1995a)
November 1997 Explanation of Significant Differences from the Record of Decision for the Technical Support Facility Injection Well (TSF-05) and Surrounding Groundwater Contamination (TSF-23) and Miscellaneous No Action Sites, Final Remedial Action, Operable Unit 1-07B, Waste Area Group 1 (INEEL 1997)
October 1999 Final Record of Decision for Test Area North Operable Unit 1-10 (DOE-ID 1999a)
September 2001 Record of Decision Amendment Technical Support Facility Injection Well (TSF-05) and Surrounding Groundwater Contamination (TSF-23) and Miscellaneous No Action Sites Final Remedial Action (DOE-ID 2001)
April 2003 Explanation of Significant Differences for the Record of Decision for the Test Area North Operable Unit 1-10 (DOE-ID 2003a)
February 2004 Record of Decision Amendment for the V-Tanks (TSF-09 and TSF-18) and Explanation of Significant Differences for the PM-2A Tanks (TSF-26) and TSF-06, Area 10, at Test Area North, Operable Unit 1-10 (DOE-ID 2004b)
January 2005 Explanation of Significant Differences for the Record of Decision for the Test Area North Operable Unit 1-10 (DOE-ID 2005a)
WAG 2
December 1991 Declaration for the Warm Waste Pond at the Test Reactor Area at the Idaho National Engineering Laboratory—Declaration of the Record of Decision (DOE-ID 1991b)
December 1992 Record of Decision Test Reactor Area Perched Water System, Operable Unit 2-12 (DOE-ID 1992a)
March 1993 Explanation of Significant Difference for the Warm Waste Pond Sediments Record of Decision at the Test Reactor Area at the Idaho National Engineering Laboratory (Jensen and Montgomery 1993)
December 1997 Final Record of Decision, Test Reactor Area, Operable Unit 2-13 (DOE-ID 1997)
May 2000 Explanation of Significant Differences to the Record of Decision for Test Reactor Area Operable Unit 2-13 (DOE-ID 2000a)
WAG 3
October 1999 Final Record of Decision Idaho Nuclear Technology and Engineering Center, Operable Unit 3-13 (DOE-ID 1999b)
January 2004 Explanation of Significant Differences for the Final Record of Decision for the Idaho Nuclear Technology and Engineering Center, Operable Unit 3-13 (DOE-ID 2004c)
WAG 4
January 1992 Record of Decision Central Facilities Area Motor Pool Pond, Operable Unit 4-11, Waste Area Group 4 (DOE-ID 1992b)
October 1995 Record of Decision Declaration for Central Facilities Area Landfills I, II, and III (Operable Unit 4-12), and No Action Sites (Operable Unit 4-03) (DOE-ID 1995b)
1-3

Table 1-1. (continued).
Date Decision Document
July 2000 Final Comprehensive Record of Decision for Central Facilities Area Operable Unit 4-13 (DOE-ID 2000b)
May 2003 Explanation of Significant Differences for the Record of Decision for the Central Facilities Area Operable Unit 4-13 (DOE-ID 2003b)
WAG 5
September 1992 Power Burst Facility Record of Decision, Power Burst Facility Corrosive Waste Sump and Evaporation Pond, Operable Unit 5-13, Waste Area Group 5 (DOE-ID 1992c)
December 1992 Record of Decision, Auxiliary Reactor Area-I Chemical Evaporation Pond, Operable Unit 5-10 (DOE-ID 1992d)
May 1994 Explanation of Significant Difference: Power Burst Facility Corrosive Waste Sump and Evaporation Pond Record of Decision at the Idaho National Engineering Laboratory (DOE-ID 1994a)
December 1994 Explanation of Significant Difference Power Burst Facility Corrosive Waste Sump and Evaporation Pond Record of Decision at the Idaho National Engineering Laboratory (DOE-ID 1994b)
January 1996 Record of Decision Stationary Low-Power Reactor-1 and Boiling Water Reactor Experimental-I Burial Grounds (Operable Units 5-05 and 6-01) and 10 No Action Sites (Operable Units 5-01, 5-03, 5-04, and 5-11) (INEL 1996)
January 2000 Record of Decision Power Burst Facility and Auxiliary Reactor Area (DOE-ID 2000c)
January 2005 Explanation of Significant Differences for the Record of Decision for the Power Burst Facility and Auxiliary Reactor Area Operable Unit 5-12 (DOE-ID 2005b)
WAG 6
January 1996 Record of Decision Stationary Low-Power Reactor-1 and Boiling Water Reactor Experimental-I Burial Grounds (Operable Units 5-05 and 6-01) and 10 No Action Sites (Operable Units 5-01, 5-03, 5-04, and 5-11) (INEL 1996)
November 2002 Record of Decision Experimental Breeder Reactor-I/Boiling Water Reactor Experiment Area and Miscellaneous Sites, Operable Units 6-05 and 10-04 (DOE-ID 2002a)
WAG 7
October 1993 Record of Decision Declaration for Pit 9 at the Radioactive Waste Management Complex Subsurface Disposal Area at the Idaho National Engineering Laboratory (DOE-ID 1993)
January 1994 Record of Decision Declaration for Pad A at the Radioactive Waste Management Complex Subsurface Disposal Area (DOE-ID 1994c)
November 1994 Record of Decision Declaration for Organic Contamination in the Vadose Zone, Operable Unit 7-08, Idaho National Engineering Laboratory, Radioactive Waste Management Complex, Subsurface Disposal Area (DOE-ID 1994d)
January 1995 Explanation of Significant Differences Pit 9 Interim Action Record of Decision at the Radioactive Waste Management Complex (DOE-ID 1995c)
September 1998 Explanation of Significant Differences for the Pit 9 Interim Action Record of Decision at the Radioactive Waste Management Complex at the Idaho National Engineering and Environmental Laboratory (DOE-ID 1998a)
1-4

Table 1-1. (continued).
Date Decision Document
WAG 8
September 1994 Record of Decision Naval Reactors Facility Industrial Waste Ditch and Landfill Areas Operable Units 8-07, 8-06, and 8-05 (DOE-ID 1994e)
September 1998 Final Record of Decision Naval Reactors Facility Operable Unit 8-08 (DOE-ID 1998b)
July 2002 Explanation of Significant Difference from the Final Record of Decision for the Naval Reactors Facility – Operable Unit 8-08 Idaho National Engineering and Environmental Laboratory (DOE-ID 2002b)
WAG 9
September 1998 Final Record of Decision Argonne National Laboratory-West (ANL-W 1998)
February 2000 Explanation of Significant Difference Argonne National Laboratory-West, Operable Unit 9-04 (ANL-W 2000)
June 2004 Explanation of Significant Difference for Argonne National Laboratory-West, Operable Unit 9-04 (ANL-W 2004)
WAG 10
June 1992 Declaration of the Record of Decision for Ordnance Interim Action, Operable Unit 10-05, Waste Area Group 10 (DOE-ID 1992e)
November 2002 Record of Decision for Experimental Breeder Reactor-I/Boiling Water Reactor Experiment Area and Miscellaneous Sites, Operable Units 6-05 and 10-04 (DOE-ID 2002a)
ANL-W = Argonne National Laboratory-West DOE-ID = U.S. Department of Energy Idaho Operations Office INEEL = Idaho National Engineering and Environmental Laboratory INEL = Idaho National Engineering Laboratory TSF = Technical Support Facility WAG = waste area group
Table 1-2. Triggering action of five-year reviews at individual waste area groups.
Location OU Review Number Triggering Action Trigger Date
WAG 1 1-07B
1-10
First
First
Initiation of remedial action
Initiation of remedial action
September 2001
February 2000
WAG 2 2-13 Second Signature of first five-year review report
September 2003
WAG 3 3-13 First Initiation of remedial action October 2000
WAG 4 4-12 Second Signature of first five-year review report
November 2002
WAG 5 5-05
5-12
Second
First
Signature of first five-year review report
Initiation of remedial action
August 2001
June 2000
WAG 6/10 6-01
6-05
10-04
Second
First
First
Signature of first five-year review report
Initiation of remedial action
Initiation of remedial action
August 2001
April 2004
April 2004
1-5

Table 1-2. (continued).
Location OU Review Number Triggering Action Trigger Date
WAG 7 7-08
7-10
7-12
Second
Firsta
Third
Signature of first five-year review report
Initiation of remedial action
Signature of five-year review report
Signature of two-year review report
August 2003
January 2004
September 2003
December 1997
WAG 8b 8-08 Two reviews completed
Not applicable Not applicable
WAG 9 9-04 First Initiation of remedial action May 1999 a. This is the first review of the remedy for OU 7-10. Periodic modifications to the remedy originally described in the Record of Decision Declaration for Pit 9 at the Radioactive Waste Management Complex Subsurface Disposal Area at the Idaho National Engineering Laboratory (DOE-ID 1993) have occurred more often than 5-year intervals, precluding the need to perform a review before now. b. WAG 8 (the Naval Reactors Facility) is not under the jurisdiction of the DOE-ID; therefore, it is not addressed any further in this review.
DOE-ID = U.S. Department of Energy Idaho Operations Office OU = operable unit ROD = Record of Decision WAG = waste area group
Subsequent individual sections of this report are organized by WAG. Sitewide recommendations are presented after the individual WAG sections. Note that the Naval Reactors Facility (NRF), WAG 8, is not under the jurisdiction of the U.S. Department of Energy Idaho Operations Office (DOE-ID); therefore, it is not subject to this review. Two five-year reviews have been performed at the NRF and are available in the public record at the INL.
1.1 Site Location
The DOE-ID manages the INL Site, which is located 32 mi west of Idaho Falls, Idaho. The INL Site occupies 890 mi2 (Figure 1-1). Facilities at the site are primarily dedicated to environmental research, nuclear research and development, and waste management.
The northeastern portion of the eastern Snake River Plain, where the INL Site is situated, is a volcanic plateau composed of basalt flows intercalated with sand and silt interbeds. Below the INL Site lies part of the SRPA, which is the largest potable aquifer in Idaho. Overall, the SRPA is approximately 200 mi long, is approximately 50 mi wide, and covers an area of approximately 9,600 mi2. The depth of the SRPA at the INL Site varies from approximately 200 ft in the northeastern corner to approximately 900 ft in the southeastern corner.
1.2 Changes to Exposure Pathways, Toxicity, and Other Contaminant Characteristics
One of the questions asked during this review was, “Are the exposure assumptions, toxicity data, cleanup levels, and remedial action objectives used at the time of the remedy selection still valid?” Changes have occurred in some slope factors and toxicity values over the years since the RODs were signed, particularly the earlier RODs. Such changes have been evaluated as part of this five-year review.
Slope factors and risk-based values for nonradionuclides and radionuclides were examined. Toxicity values (slope factors and reference doses) were reviewed for changes. The slope factors and the reference doses were compared to the newest values available from the Integrated Risk Information
1-6
System (IRIS), the Health Effects Assessment Summary Table (HEAST) (EPA 1995b), or other approved sources. Since the changes were minimal, there was no impact to the selected remedies. The scenario assumptions used in the human health risk assessment included both a current occupational worker and a hypothetical future resident (100 years in the future). The exposure assumptions used for these scenarios remain the same.
Details of the changes to slope factors, IRIS, HEAST, and toxicity values and their implications for specific remedial action objectives (RAOs) are included in Appendix A of this document.
1.3 Section 1 References
40 CFR 300, 2006, “National Oil and Hazardous Substances Pollution Contingency Plan,” Code of Federal Regulations, Office of the Federal Register, April 2006.
40 CFR 300.5, 2006, “Definitions,” Code of Federal Regulations, Office of the Federal Register, April 2006.
42 USC § 9601 et seq., 1980, “Comprehensive Environmental Response, Compensation and Liability Act of 1980 (CERCLA/Superfund),” United States Code, December 11, 1980.
ANL-W, 1998, Final Record of Decision Argonne National Laboratory-West Operable Unit 9-04, W7500-000-ES-04, Rev. 0, Idaho National Engineering and Environmental Laboratory, September 1998.
ANL-W, 2000, Explanation of Significant Difference Argonne National Laboratory-West, Document ID 10831, Rev. 0, Idaho National Engineering and Environmental Laboratory, February 2000.
ANL-W, 2004, Explanation of Significant Difference for Argonne National Laboratory-West, Operable Unit 9-04, Document ID 24867, Rev. 0, Idaho National Engineering and Environmental Laboratory, June 2004.
DOE-ID, 1991a, Federal Facility Agreement and Consent Order for the Idaho National Engineering Laboratory, Administrative Docket No. 1088-06-29-120, U.S. Department of Energy Idaho Field Office; U.S. Environmental Protection Agency, Region 10; Idaho Department of Health and Welfare, December 4, 1991.
DOE-ID, 1991b, Declaration for the Warm Waste Pond at the Test Reactor Area at the Idaho National Engineering Laboratory—Declaration of the Record of Decision, Document ID 3320, Rev. 0, U.S. Department of Energy Idaho Field Office; U.S. Environmental Protection Agency, Region 10; Idaho Department of Health and Welfare, December 1991.
DOE-ID, 1992a, Record of Decision Test Reactor Area Perched Water System, Operable Unit 2-12, Document ID 5230, Rev. 0, U.S. Department of Energy Idaho Field Office; U.S. Environmental Protection Agency, Region 10; Idaho Department of Health and Welfare, December 1992.
DOE-ID, 1992b, Record of Decision Central Facilities Area Motor Pool Pond, Operable Unit 4-11, Waste Area Group 4, Document ID 5242, Rev. 0, U.S. Department of Energy Idaho Field Office; U.S. Environmental Protection Agency, Region 10; Idaho Department of Health and Welfare, January 1992.
1-7

DOE-ID, 1992c, Power Burst Facility Record of Decision Power Burst Facility Corrosive Waste Sump and Evaporation Pond, Operable Unit 5-13, Waste Area Group 5, Document ID 5204, Rev. 0, U.S. Department of Energy Idaho Field Office; U.S. Environmental Protection Agency, Region 10; Idaho Department of Health and Welfare, September 1992.
DOE-ID, 1992d, Record of Decision Auxiliary Reactor Area-I Chemical Evaporation Pond, Operable Unit 5-10, Document ID 5232, Rev. 0, U.S. Department of Energy Idaho Field Office; U.S. Environmental Protection Agency, Region 10; Idaho Department of Health and Welfare, December 1992.
DOE-ID, 1992e, Declaration of the Record of Decision for Ordnance Interim Action, Operable Unit 10-05, Waste Area Group 10, Document ID 5137, Rev. 0, U.S. Department of Energy Idaho Field Office; U.S. Environmental Protection Agency, Region 10; Idaho Department of Health and Welfare, June 1992.
DOE-ID, 1993, Record of Decision Declaration for Pit 9 at the Radioactive Waste Management Complex Subsurface Disposal Area at the Idaho National Engineering Laboratory, Document ID 5569, Rev. 0, U.S. Department of Energy Idaho Operations Office; U.S. Environmental Protection Agency, Region 10; and Idaho Department of Health and Welfare, October 1993.
DOE-ID, 1994a, Explanation of Significant Difference Power Burst Facility Corrosive Waste Sump and Evaporation Pond Record of Decision at the Idaho National Engineering Laboratory, Document ID 5702, Rev. 0, U.S. Department of Energy Idaho Operations Office; U.S. Environmental Protection Agency, Region 10; and Idaho Department of Health and Welfare, May 1994.
DOE-ID, 1994b, Explanation of Significant Difference Power Burst Facility Corrosive Waste Sump and Evaporation Pond Record of Decision at the Idaho National Engineering Laboratory, Document ID 5814, Rev. 0, U.S. Department of Energy Idaho Operations Office; U.S. Environmental Protection Agency, Region 10; and Idaho Department of Health and Welfare, December 1994.
DOE-ID, 1994c, Record of Decision Declaration for Pad A at the Radioactive Waste Management Complex Subsurface Disposal Area, Document ID 5632, Rev. 0, U.S. Department of Energy, U.S. Environmental Protection Agency, Idaho Department of Health and Welfare, January 1994.
DOE-ID, 1994d, Record of Decision Declaration for Organic Contamination in the Vadose Zone, Operable Unit 7-08, Idaho National Engineering Laboratory, Radioactive Waste Management Complex, Subsurface Disposal Area, Document ID 5761, Rev. 0, U.S. Department of Energy Idaho Operations Office; U.S. Environmental Protection Agency; Idaho Department of Health and Welfare, November 1994.
DOE-ID, 1994e, Record of Decision Naval Reactors Facility Industrial Waste Ditch and Landfill Areas Operable Units 8-07, 8-06, and 8-06, Document ID 5781, Rev. 0, U.S. Department of Energy Idaho Operations Office; U.S. Environmental Protection Agency; Idaho Department of Health and Welfare, September 1994.
1-8
DOE-ID, 1995a, Record of Decision Declaration for the Technical Support Facility Injection Well (TSF-05) and Surrounding Groundwater Contamination (TSF-23) and Miscellaneous No Action Sites Final Remedial Action, Document ID 10139, Rev. 0, U.S. Department of Energy Idaho Operations Office; U.S. Environmental Protection Agency, Region 10; and Idaho Department of Health and Welfare, August 1995.
DOE-ID, 1995b, Record of Decision Declaration for Central Facilities Area Landfills I, II, and III (Operable Unit 4-12), and No Action Sites (Operable Unit 4-03), Document ID 10146, Rev. 0, U.S. Department of Energy Idaho Operations Office; U.S. Environmental Protection Agency, Region 10; and Idaho Department of Health and Welfare, October 1995.
DOE-ID, 1995c, Explanation of Significant Differences Pit 9 Interim Action Record of Decision at the Radioactive Waste Management Complex, Document ID 5862, Rev. 0, U.S. Department of Energy Idaho Operations Office; U.S. Environmental Protection Agency, Region 10; and Idaho Department of Health and Welfare, January 1995.
DOE-ID, 1997, Final Record of Decision, Test Reactor Area, Operable Unit 2-13, DOE/ID-10586, Rev. 0, U.S. Department of Energy Idaho Operations Office; U.S. Environmental Protection Agency, Region 10; and Idaho Department of Health and Welfare, December 1997.
DOE-ID, 1998a, Explanation of Significant Differences for the Pit 9 Interim Action Record of Decision at the Radioactive Waste Management Complex at the Idaho National Engineering and Environmental Laboratory, Document ID 10537, Rev. 0, U.S. Department of Energy Idaho Operations Office; U.S. Environmental Protection Agency, Region 10; and Idaho Department of Health and Welfare, September 1998.
DOE-ID, 1998b, Final Record of Decision Naval Reactors Facility Operable Unit 8-08, Document ID 10544, Rev. 0, U.S. Department of Energy Idaho Operations Office; U.S. Environmental Protection Agency, Region 10; and Idaho Department of Health and Welfare, September 1998.
DOE-ID, 1999a, Final Record of Decision for Test Area North Operable Unit 1-10, DOE/ID-10682, Rev. 0, U.S. Department of Energy Idaho Operations Office; U.S. Environmental Protection Agency, Region 10; Idaho Department of Health and Welfare, October 1999.
DOE-ID, 1999b, Final Record of Decision Idaho Nuclear Technology and Engineering Center, Operable Unit 3-13, DOE/ID-10660, Rev. 0, U.S. Department of Energy Idaho Operations Office; U.S. Environmental Protection Agency, Region 10; Idaho Department of Health and Welfare, October 1999.
DOE-ID, 2000a, Explanation of Significant Differences to the Record of Decision for Test Reactor Area Operable Unit 2-13, DOE/ID-10744, Rev. 0, U.S. Department of Energy Idaho Operations Office; U.S. Environmental Protection Agency; and Idaho Department of Health and Welfare, Division of Environmental Quality, May 2000.
DOE-ID, 2000b, Final Comprehensive Record of Decision for Central Facilities Area Operable Unit 4-13, DOE/ID-10719, Rev. 2, U.S. Department of Energy Idaho Operations Office; U.S. Environmental Protection Agency; and Idaho Department of Health and Welfare, Division of Environmental Quality, July 2000.
1-9
DOE-ID, 2000c, Record of Decision Power Burst Facility and Auxiliary Reactor Area, DOE/ID-10700, Rev. 0, U.S. Department of Energy Idaho Operations Office; U.S. Environmental Protection Agency; and Idaho Department of Health and Welfare, Division of Environmental Quality, January 2000.
DOE-ID, 2001, Record of Decision Amendment Technical Support Facility Injection Well (TSF-05) and Surrounding Groundwater Contamination (TSF-23) and Miscellaneous No Action Sites Final Remedial Action, DOE/ID-10139 Amendment, Rev. 0, U.S. Department of Energy Idaho Operations Office; U.S. Environmental Protection Agency; and Idaho Department of Health and Welfare, Division of Environmental Quality, September 2001.
DOE-ID, 2002a, Record of Decision Experimental Breeder Reactor-I/Boiling Water Reactor Experiment Area and Miscellaneous Sites, Operable Units 6-05 and 10-04, DOE/ID-10980, Rev. 0, U.S. Department of Energy Idaho Operations Office; U.S. Environmental Protection Agency; and Idaho Department of Health and Welfare, Division of Environmental Quality, November 2002.
DOE-ID, 2002b, Explanation of Significant Difference from the Final Record of Decision for the Naval Reactors Facility – Operable Unit 8-08 Idaho National Engineering and Environmental Laboratory, Document ID 24678, Rev. 0, U.S. Department of Energy Idaho Operations Office; U.S. Environmental Protection Agency; and Idaho Department of Health and Welfare, Division of Environmental Quality, July 2002.
DOE-ID, 2003a, Explanation of Significant Differences for the Record of Decision for the Test Area North Operable Unit 1-10, DOE/ID-11050, Rev. 0, U.S. Department of Energy Idaho Operations Office; U.S. Environmental Protection Agency, Region 10; Idaho Department of Health and Welfare, April 2003.
DOE-ID, 2003b, Explanation of Significant Differences for the Record of Decision for the Central Facilities Area Operable Unit 4-13, DOE/ID-11030, Rev. 0, U.S. Department of Energy Idaho Operations Office; U.S. Environmental Protection Agency, Region 10; Idaho Department of Health and Welfare, May 2003.
DOE-ID, 2004a, Idaho National Engineering and Environmental Laboratory Sitewide Five-Year Review Plan for CERCLA Response Actions, DOE/NE-ID-11125, Rev. 2, U.S. Department of Energy Idaho Operations Office, September 2004.
DOE-ID, 2004b, Record of Decision Amendment for the V-Tanks (TSF-09 and TSF-18) and Explanation of Significant Differences for the PM-2A Tanks (TSF-26) and TSF-06, Area 10, at Test Area North, Operable Unit 1-10, DOE/ID-10682 Amend, Rev. 0, U.S. Department of Energy Idaho Operations Office; U.S. Environmental Protection Agency, Region 10; Idaho Department of Health and Welfare, February 2004.
DOE-ID, 2004c, Explanation of Significant Differences for the Final Record of Decision for the Idaho Nuclear Technology and Engineering Center, Operable Unit 3-13, DOE/ID-11109, Rev. 0, U.S. Department of Energy Idaho Operations Office; U.S. Environmental Protection Agency, Region 10; Idaho Department of Environmental Quality, January 2004.
DOE-ID, 2005a, Explanation of Significant Differences for the Record of Decision for the Test Area North Operable Unit 1-10, DOE/NE-ID-11199, Rev. 0, U.S. Department of Energy Idaho Operations Office, January 2005.
1-10

DOE-ID, 2005b, Explanation of Significant Differences for the Record of Decision for the Power Burst Facility and Auxiliary Reactor Area Operable Unit 5-12, DOE/ID-11017, Rev. 0, U.S. Department of Energy Idaho Operations Office; U.S. Environmental Protection Agency, Region 10; Idaho Department of Environmental Quality, January 2005.
EPA, 1991, Structure and Components of Five-Year Reviews, OSWER Directive 9355.7-02, U.S. Environmental Protection Agency, May 1991.
EPA, 1994, Supplemental Five-Year Review Guidance, OSWER Directive 9355.7-02A, U.S. Environmental Protection Agency, July 1994.
EPA, 1995a, Second Supplemental Five-Year Review Guidance, OSWER Directive 9355.7-03A, U.S. Environmental Protection Agency, December 1995.
EPA, 1995b, Health Effects Assessment Summary Tables, FY-1995 Annual, EPA/540/R-95/036, U.S. Environmental Protection Agency, May 1995.
Executive Order 12580, 1987, “Superfund Implementation,” January 29, 1987.
INEEL, 1997, Explanation of Significant Differences from the Record of Decision for the Technical Support Facility Injection Well (TSF-05) and Surrounding Groundwater Contamination (TSF-23) and Miscellaneous No Action Sites, Final Remedial Action, Operable Unit 1-07B, Waste Area Group 1, INEEL/EXT-97-00931, Rev. 0, Idaho National Engineering and Environmental Laboratory, November 1997.
INEL, 1996, Record of Decision Stationary Low-Power Reactor-1 and Boiling Water Reactor Experiment-I Burial Grounds (Operable Units 5-05 and 6-01), and 10 No Action Sites (Operable Units 5-01, 5-03, 5-04, and 5-11), INEL-95/0282, Rev. 0, Idaho National Engineering Laboratory, January 1996.
Jensen, N. R. and R. A. Montgomery, 1993, Explanation of Significant Difference for the Warm Waste Pond Sediments Record of Decision at the Test Reactor Area at the Idaho National Engineering Laboratory, Document ID 5253, Rev. 0, Idaho National Engineering Laboratory, March 1993.
1-11

1-12

2. SITEWIDE INSTITUTIONAL CONTROLS, OPERATIONS, AND MAINTENANCE
2.1 Land Use
The U.S. Atomic Energy Commission (now the DOE) founded the INL in 1949. At that time, it was known as the National Reactor Testing Station and was established to build, test, and operate nuclear reactors, fuel reprocessing plants, and support facilities with maximum safety and isolation. In 1974, the area was designated as the Idaho National Engineering Laboratory (INEL) to reflect the broad scope of engineering activities conducted there. The name was changed to the Idaho National Engineering and Environmental Laboratory (INEEL) in 1997 to reflect its redirected mission, which included environmental research. In 2005, the name was changed to the INL.
The U.S. Bureau of Land Management manages the surrounding areas for multipurpose use. Communities nearest the INL Site are Atomic City (south), Arco (west), Butte City (west), Howe (northwest), Mud Lake (northeast), and Terreton (northeast). In the counties surrounding the INL Site, approximately 45% of the land is agricultural, 45% is open land, and 10% is urban.
A total of 90 mi of paved highways pass through the INL Site and are used by the public. However, security personnel and fences strictly control public access to facilities at the INL Site.
To facilitate decisions about environmental restoration activities at the INL Site, the DOE-ID conducted analyses, starting in 1992, to project reasonable INL land use scenarios for the next 100 years. The effort was completed in 1995. The methodology for generating the scenarios included reviewing existing DOE plans, policy statements, and mission statements pertaining to the site; reviewing surrounding land use characteristics and county development policies; soliciting input from local, county, state, and federal planners, policy specialists, environmental professionals, and elected officials; and reviewing constraints that could influence future land use at the INL Site.
These analyses resulted in the development of specific issues, assumptions, and constraints that guided the generation of facility and land use scenarios for the next 100 years, as published in the Long-Term Land Use Future Scenarios for the Idaho National Engineering Laboratory (DOE-ID 1995). In general, the scenarios projected (1) no change to the present INL boundaries within the 100-year period and (2) future industrial development during the next 100 years (most likely concentrated in the central portion of the INL Site) and within existing major facility areas. The document also indicated that future land use predictions would become increasingly uncertain beyond 100 years. In general, the RODs discussed in this review have remedies whose risk-management decisions were based on remediation of contaminated areas to a condition suitable for future residential use after a 100-year period elapses.
2.2 Institutional Controls
Institutional controls are measures taken to limit or prohibit activities that might interfere with the integrity of an interim or cleanup action or result in human exposure to hazardous substances at a site. Such measures are required in order to ensure both the continued protection of human health and the environment and the integrity of an interim or cleanup action. Institutional controls are intended to supplement engineering controls and might be a necessary component of the completed remedy. Institutional controls may be used during the remedial investigation/feasibility study (RI/FS), during implementation of the remedial action, and, when necessary, as a component of the completed remedy. Institutional controls are generally required when residual concentrations of hazardous substances remain and preclude releasing an area for unrestricted land use or when the EPA, DOE, and the DEQ (known
2-1

throughout the rest of this document as “the agencies”) determine that such controls are needed to protect human health or the environment.
The institutional controls at the INL Site are based on guidance in the May 3, 1999, EPA “Region 10 Final Policy on the Use of Institutional Controls at Federal Facilities” (EPA 1999); the September 29, 2000, EPA guidance “Institutional Controls: A Site Manager’s Guide to Identifying, Evaluating, and Selecting Institutional Controls at Superfund and RCRA Corrective Action Cleanups” (EPA 2000); and the April 9, 2003, DOE policy “Use of Institutional Controls” (DOE P 454.1).
With the exception of WAGs 8 and 9, institutionally controlled sites are assessed and maintained on an INL Sitewide basis. These activities are conducted in accordance with the requirements specified in decision documents and compiled in the INEEL Sitewide Institutional Controls Plan (DOE-ID 2004a) by utilizing internal procedures, Federal Register (FR) notices, informational announcements, and contracts consistent with applicable laws, regulations, agreements, and consent orders. Institutional control includes implementing administrative and access controls, evaluating those controls, and preparing status reports summarizing the evaluation.
Consolidation of the institutional controls process at the INL Site has resulted in consistent implementation, maintenance, and inspection of institutional controls. The most recent assessment is reported in the INEEL Sitewide Institutional Controls Annual Report – FY 2004 (DOE-ID 2004b). All institutional controls were found to be functioning as intended. Information about CERCLA sites and institutional controls at the INL Site is available publicly on the Web at http://cflup.inel.gov as part of the Idaho National Engineering and Environmental Laboratory Comprehensive Facility and Land Use Plan (DOE-ID 2005).
Remedial activities at the INL Site have advanced significantly during the 5 years covered by this review. Several CERCLA sites have been remediated to the point that hazards no longer remain there; however, the remedial action reports or other closure documentation have not been completed. Those sites are discussed in the individual sections of this document, and eliminating them as institutionally controlled sites upon completion of the proper closure documentation is recommended. The sites will be designated as no-action sites, warning signs and other institutional controls will be removed, and the sites will no longer be listed in the current version of the CERCLA site listings.
The CERCLA sites with hazards that preclude release for unrestricted residential use will retain institutional controls and will be assessed, maintained, and reported on annually. New sites that are identified as having unacceptable risk and determined by the agencies to be action or no-further-action sites have institutional controls and are included in the annual assessment, maintenance, and reporting program.
2.3 Operations and Maintenance
Operations and maintenance activities are measures taken to ensure that selected remedies remain protective of human health and the environment after remedial actions have been completed. In some cases, however, operations and maintenance activities have been specified for sites during the preremediation phase.
Operations and maintenance activities required by the WAG-specific operations and maintenance plans have been incorporated into the INL Sitewide Operations and Maintenance Plan for CERCLA Response Actions (DOE-ID 2006). With the exception of WAGs 8 and 9, operations and maintenance activities will be conducted on a Sitewide basis at the INL Site beginning in 2005. Those activities are
2-2

conducted in accordance with the requirements specified in the decision documents, and results of site inspections will be compiled into a single summary report.
2.4 Section 2 References
DOE P 454.1, 2003, “Use of Institutional Controls,” U.S. Department of Energy, April 9, 2003.
DOE-ID, 1995, Long-Term Land Use Future Scenarios for the Idaho National Engineering Laboratory, DOE/ID-10440, Rev. 0, U.S. Department of Energy Idaho Operations Office, August 1995.
DOE-ID, 2004a, INEEL Sitewide Institutional Controls Plan, DOE/ID-11042, Rev. 1, U.S. Department of Energy Idaho Operations Office, June 2004.
DOE-ID, 2004b, INEEL Sitewide Institutional Controls Annual Report – FY 2004, DOE/NE-ID-11180, Rev. 0, U.S. Department of Energy Idaho Operations Office, September 2004.
DOE-ID, 2005, Idaho National Engineering and Environmental Laboratory Comprehensive Facility and Land Use Plan, http://cflup.inel.gov, visited May 18, 2005.
DOE-ID, 2006, INL Sitewide Operations and Maintenance Plan for CERCLA Response Actions, DOE/NE-ID-11159, Rev. 1, U.S. Department of Energy Idaho Operations Office, May 2006.
EPA, 1999, “Region 10 Final Policy on the Use of Institutional Controls at Federal Facilities,” Office of Environmental Cleanup, Office of Waste and Chemicals Management, and Office of Regional Counsel, U.S. Environmental Protection Agency, Seattle, Washington, May 1999.
EPA, 2000, “Institutional Controls: A Site Manager’s Guide to Identifying, Evaluating and Selecting Institutional Controls at Superfund and RCRA Corrective Action Cleanups,” U.S. Environmental Protection Agency, Seattle, Washington, September 2000.
2-3

2-4

3. SITEWIDE FIVE-YEAR REVIEW PROCESS
3.1 Administrative Components
The DOE-ID is the lead agency for conducting and reporting this Sitewide five-year review of the INL Site. The EPA retains the final authority for evaluating the completeness of the review. Members of the five-year review team consisted of representatives from DOE-ID, the EPA, and the DEQ as well as contractor personnel. A conference call held on October 27, 2004, among the parties mentioned above initiated the discussion regarding the schedule and content of this five-year review. The Shoshone-Bannock Tribes were notified of this five-year review in a meeting held on November 23, 2004.
3.2 Community Involvement
The INL stakeholders and the public were notified of this five-year review, and their input was requested. Responses from the community were received and immediately entered into the INL Site Administrative Record database. In June 2005, notifications were made in the following newspapers that the results of the five-year review were being compiled into this report:
• Arco Advertiser (Arco, Idaho)
• Idaho State Journal (Pocatello, Idaho)
• The Idaho Statesman (Boise, Idaho)
• Idaho Unido (Pocatello, Idaho)
• Moscow-Pullman Daily News (Moscow, Idaho, and Pullman, Washington)
• The Post Register (Idaho Falls, Idaho)
• Sho-Ban News (Fort Hall Reservation)
• The Times News (Twin Falls, Idaho).
3-1

3-2

4. WASTE AREA GROUP 1 (TEST AREA NORTH)
The U.S. Air Force and the U.S. Atomic Energy Commission (now the DOE) established Test Area North (TAN) in the early 1950s to support research into nuclear-powered aircraft. Upon termination of that research in 1961, the TAN facilities were converted to support a variety of other DOE research projects.
From 1962 through the 1970s, TAN supported reactor safety testing and behavior studies at the Loss-of-Fluid Test Facility, the Initial Engine Test (IET) Facility, and the Water Reactor Research Test Facility (WRRTF). Beginning in 1980, TAN was used to conduct work with material from the 1979 Three-Mile Island reactor accident. The Technical Support Facility (TSF) at TAN supports energy research and defense programs. Specialized facilities also are maintained at TSF for technical engineering and remote radioactive materials-handling programs.
Over the years, some of the projects at TAN have resulted in releases of contamination to the environment. To facilitate cleanup of the contamination, TAN was designated as WAG 1 under the FFA/CO (DOE-ID 1991). To better manage the cleanup, WAG 1 was divided into smaller OUs. Final remedial actions are, therefore, being implemented under OUs 1-07B (which consists of TAN groundwater contamination) and OU 1-10 (which consists of the remainder of TAN).
4.1 Operable Unit 1-07B (Test Area North Groundwater Contamination)
From about 1953 to 1972, liquid waste generated at TAN was disposed of in the TSF injection well (the TSF-05 site), resulting in dispersion of contaminants into the SRPA beneath TAN. The waste consisted mainly of industrial and sanitary wastewater but also included organic, inorganic, and low-level radioactive wastewater. As a result of the waste disposed of at the TSF-05 site, contaminated sludge material containing entrapped contaminants, primarily trichloroethene (TCE), is present in the nonaqueous phase liquid and/or sorbed phase. As groundwater flows through the contaminated sludge material, entrapped contaminants dissolve into the aqueous phase, which has resulted in a contaminated groundwater plume emanating from the TSF-05 injection well.
Groundwater containing TCE at concentrations greater than 5 μg/L in the area of the TSF-05 site has been designated as OU 1-07B, and final remedial actions for TSF-05 and the surrounding groundwater contamination (the TSF-23 site) are implemented under OU 1-07B. A complete list of the OU 1-07B contaminants of concern (COCs) is provided in Table 4-1.
This CERCLA (42 USC § 9601 et seq.) remedial action is proceeding in accordance with the Record of Decision for the Technical Support Facility Injection Well (TSF-05) and Surrounding Groundwater Contamination (TSF-23) and Miscellaneous No Action Sites Final Remedial Action (DOE-ID 1995) and the Record of Decision Amendment for the Technical Support Facility Injection Well (TSF-05) and Surrounding Groundwater Contamination (TSF-23) and Miscellaneous No Action Sites Final Remedial Action (DOE-ID 2001a). In addition to the TSF-05 and TSF-23 sites, the OU 1-07B ROD (DOE-ID 1995) addressed 31 potential release sites at TAN that were designated as no-action sites.
4-1

Table 4-1. Contaminants of concern at Operable Unit 1-07B.
Contaminant of Concern Maximum Concentrationsa Cleanup Goalb
Volatile Organic Compounds
TCE 12,000–32,000 ppb 5 ppbc
PCE 110 ppb 5 ppbc
cis-1,2-DCE 3,200–7,500 ppb 70 ppbc
trans-1,2-DCE 1,300–3,900 ppb 100 ppbc
Radionuclides
Tritium 14,900–15,300 pCi/Ld 20,000 pCi/L
Sr-90 530–1,880 pCi/L 8 pCi/L
Cs-137 1,600–2,150 pCi/L 119 pCi/Le
U-234 5.2–7.7 pCi/Ld 27 pCi/Lf
a. The concentration range is taken from measured concentrations at the TSF-05 injection well. Source: Fiscal Year 1999 Groundwater Monitoring Annual Report Test Area North, Operable Unit 1-07B (INEEL 2000). b. Cleanup goals are based on the federal drinking water standards. The cumulative risk of contaminants must be less than 1 × 10⁻⁴, and the hazard index must be less than 1. c. Parts per billion (ppb) is a weight-to-weight ratio that is equivalent to micrograms per liter (μg/L) in water. d. Maximum concentrations of tritium and U-234 are below federal drinking water standards, and baseline risk calculations indicate a cancer risk of 3 × 10⁻⁶. While this risk is smaller than 1 × 10⁻⁴, both tritium and U-234 are included as contaminants of concern as a comprehensive plume management strategy. e. The maximum contaminant level for Cs-137 is derived from a limit of 4 mrem/yr cumulative dose equivalent to the public, assuming a lifetime intake of 2 L/day of water. f. The federal drinking water standard for U-234 is for the U-234, U-235, and U-238 series.
DCE = dichloroethene INEEL = Idaho National Engineering and Environmental Laboratory PCE = tetrachloroethene TCE = trichloroethene TSF = Technical Support Facility
The boundary of the contaminant plume was defined in the OU 1-07B ROD (DOE-ID 1995) based on TCE concentrations, because TCE has the largest distribution of COCs at OU 1-07B. In the 2001 ROD amendment (DOE-ID 2001a), OU 1-07B was divided into three zones identified as the “hot spot,” the “medial zone,” and the “distal zone.” The hot spot was identified as the area immediately around the injection well, where concentrations of TCE exceed 20,000 parts per billion (ppb). The medial zone was the portion of the plume where concentrations of TCE are between 1,000 and 20,000 ppb. The distal zone was the remainder of the plume where TCE concentrations are between 5 and 1,000 ppb. A graphical depiction of the groundwater plume and zones is presented in Figure 4-1. Additional information on the geology, the hydrology, and the nature and extent of contamination is provided in the OU 1-07B ROD (DOE-ID 1995) and can be found in the administrative record for OU 1-07B. Table 4-2 provides a chronology of significant events at OU 1-07B.
4-2

Figure 4-1. Facilities and well locations at Test Area North. Operable Unit 1-07B consists of the TSF-05 injection well and the TSF-23 contaminant plume underlying Test Area North. The trichloroethene concentration zones were defined in the 2001 ROD amendment (DOE-ID 2001a).
4-3

Table 4-2. Chronology of Operable Unit 1-07B events.
Event Date
TAN consists of several experimental and support facilities used to research and develop nuclear reactor performance and safety. Liquid waste that was generated was being discharged to the TSF-05 injection well for disposal.
1953–1972
Low levels of TCE and PCE were detected in the wells used to supply drinking water to workers at TAN. The TSF-05 injection well was identified as the source of the groundwater contamination.
1987
The INEL (now known as the INL) was listed on the National Priorities List (54 FR 29820). November 1989
Sludge was removed from the TSF-05 injection well. 1990
The FFA/CO (DOE-ID 1991) was signed. December 1991
The agencies began an interim action designated as OU 1-07A, as documented in the Record of Decision Technical Support Facility (TSF) Injection Well (TSF-05) and Surrounding Groundwater Contamination (TSF-23) (INEL 1992).
1992
The Groundwater Treatment Facility began operations to extract and treat contaminated groundwater in the vicinity of the TSF-05 injection well.
February 1994
The Remedial Investigation Final Report with Addenda for the Test Area North Groundwater Operable Unit 1-07B of the Idaho National Engineering Laboratory, Volume 1 (EG&G 1994) was completed.
1994
Based on the Remedial Investigation Final Report (EG&G 1994), the Proposed Plan for Groundwater Contamination (Operable Unit 1-07B) and No Action Sites (Operable Units 1-01, -02, -06, -09), Test Area North, Idaho National Engineering Laboratory was published (DOE-ID, EPA, and DEQ 1994).
May 1994
The agencies’ agreement to clean up OU 1-07B was documented in the Record of Decision for the Technical Support Facility Injection Well (TSF-05) and Surrounding Groundwater Contamination (TSF-23) and Miscellaneous No Action Sites Final Remedial Action, (DOE-ID 1995), which was signed in August 1995. The 1995 ROD directed that pump-and-treat technology be used as the default remedy to restore the SRPA and that treatability studies be conducted concurrently to identify more efficient methods that may be used during the final cleanup implementation.
August 1995
The OU 1-07B Phase A, which was defined as a transition from the OU 1-07A interim action to the OU 1-07B final action, was completed. Under OU 1-07B Phase B, planning for the treatability studies was completed, and source containment using pump-and-treat began.
September 1995
The agencies published an ESD (INEEL 1997) that documented changes to the 1995 ROD in several areas, including contaminant area definitions (hot spot, medial zone, and distal zone), the treatability studies’ schedule, and the waste management requirements. Early implementation of OU 1-07B Phase C—the final remedy implementation—began for the medial zone.
November 1997
The treatability studies were completed, and the results were summarized in a field demonstration report (DOE-ID 2000a). Results of the treatability studies showed that two of the technologies investigated, ISB (using sodium lactate) and MNA, would better meet the balancing criteria than pump-and-treat technology for remediation of the hot spot and the distal zone, respectively.
1999
The agencies approved the New Pump and Treat Facility Remedial Design Test Area North Operable Unit 1-07B (DOE-ID 2000b).
March 2000
4-4

Table 4-2. (continued).
Event Date
The Proposed Plan for Operable Unit 1-07B, Final Remedial Action at the TSF Injection Well (TSF-05) and Surrounding Groundwater Contamination (TSF-23) (DOE-ID, EPA, and DEQ 2000) was prepared, recommending final remedy changes for the hot spot and distal zone of the contaminated plume.
2000
Construction of the NPTF in the medial zone was completed. January 2001
The Record of Decision Amendment for the Technical Support Facility Injection Well (TSF-05) and Surrounding Groundwater Contamination (TSF-23) and Miscellaneous No Action Sites Final Remedial Action (DOE-ID 2001a) was signed, identifying ISB and MNA as the final remedies to be used for the hot spot and distal zone.
September 2001
Routine NPTF operations began. October 2001
The remedial design/remedial action scope of work associated with the ROD amendment (DOE-ID 2001a) was completed.
December 2001
The In Situ Bioremediation Remedial Action Work Plan for Test Area North Final Groundwater Remediation, Operable Unit 1-07B (DOE-ID 2002a) was approved.
December 2002
The Monitored Natural Attenuation Remedial Action Work Plan for Test Area North Final Groundwater Remediation, Operable Unit 1-07B (DOE-ID 2003a) was approved.
June 2003
The ISB facility construction and the final inspection with the agencies were completed. The ISB operations began.
October 2003
The MNA prefinal/final inspection was completed, and MNA operations began. October 2003
The alternate electron donor optimization began in order to evaluate the use of whey powder for long-term operations and to ascertain whether whey powder, compared to sodium lactate, will improve system performance and decrease the cost of ISB. Sodium lactate was used for all previous ISB activities.
March 2004
The medial zone rebound test began in order to evaluate the effectiveness of the NPTF. The NPTF was shut down on March 1, 2005, and the rebound test is anticipated to last approximately 2 years.
March 2005
DEQ = [Idaho] Department of Environmental Quality DOE-ID = U.S. Department of Energy Idaho Operations Office EPA = U.S. Environmental Protection Agency ESD = explanation of significant differences FFA/CO = Federal Facility Agreement and Consent Order FR = Federal Register INEL = Idaho National Engineering Laboratory INL = Idaho National Laboratory ISB = in situ bioremediation MNA = monitored natural attenuation NPTF = New Pump and Treat Facility OU = operable unit PCE = tetrachloroethene RD/RA = remedial design/remedial action SRPA = Snake River Plain Aquifer TAN = Test Area North TCE = trichloroethene TSF = Technical Support Facility
4-5

4.1.1 Remedial Actions
4.1.1.1 Remedy Selection. The final remedy for OU 1-07B integrates separate technologies to address the three zones of the plume: (1) in situ bioremediation (ISB) for hot spot restoration, (2) pump-and-treat technology for the medial zone, and (3) monitored natural attenuation (MNA) for distal zone restoration. These technologies comprise a comprehensive approach to restoring the contaminant plume. This remedy includes groundwater monitoring throughout the plume, with analysis of samples to ascertain the progress of the remedy and monitor the plume boundary.
The remedy also prevents current and future exposure of workers, the public, and the environment to contaminated groundwater at TSF-05, because the remedy permanently reduces the toxicity, mobility, and volume of contamination at OU 1-07B. Institutional controls (both engineered and administrative) are in place to protect current and future users from health risks associated with groundwater contamination and will be modified, as required, to maintain a conservative buffer zone around the contaminant plume. Descriptions of the remedial components for restoration of the OU 1-07B hot spot, medial zone, and distal zone of the contaminant plume are stated in Figure 4-2 and discussed in the following paragraphs.
Hot Spot—ISB—used to remediate the hot spot—promotes bacterial growth by supplying essential nutrients to indigenous bacteria that are able to break down contaminants within the SRPA. An amendment, such as sodium lactate or whey, is injected into the secondary source area through the TSF-05 injection well or through other injection wells in the immediate vicinity. Amendment injections increase the number of bacteria, thereby increasing the rate at which the volatile organic compounds (VOCs) break down into harmless compounds. The amendment supply is distributed as needed. The treatment system has operated since 1999.
Medial Zone—Pump-and-treat—used to remediate the medial zone—involves extraction of contaminated groundwater, treatment through air strippers, and injection of the treated groundwater back into the SRPA. Air stripping is a process that brings clean air into contact with contaminated liquid, allowing the contaminants to pass from the liquid into the air, where they quickly evaporate. In accordance with the original remedy selected in the OU 1-07B ROD (DOE-ID 1995), construction of the New Pump and Treat Facility (NPTF) in the medial zone was completed in January 2001. Routine NPTF operations began on October 1, 2001. The agencies approved a medial zone rebound test to evaluate the effectiveness of the NPTF (ICP 2004a). The NPTF was shutdown on March 1, 2005, and the rebound test is expected to continue for approximately 2 years.
Distal Zone—Natural attenuation encompasses the physical, chemical, and biological processes that act without human intervention to reduce the mass, toxicity, mobility, volume, or concentration of contaminants in groundwater. MNA—used to remediate the distal zone—includes groundwater monitoring to compare actual measured natural degradation rates to predicted degradation rates.
Contingencies identified for the medial and distal zones under the remedy include the following:
• For the medial zone, monitoring wells located upgradient of the NPTF (TAN-25, TAN-28, TAN-29, TAN-30A, TAN-37, and TSF-05) are monitored on a routine basis to ensure that concentrations of radionuclides in the groundwater remain low. Well locations are shown on Figure 4-1. If monitoring indicates that the concentration of radionuclides in the NPTF effluent would exceed maximum contaminant levels (MCLs), then the Air Stripper Treatment Unit located between the hot spot and the NPTF will be restarted and operated to prevent radionuclides from traveling downgradient to the NPTF. The NPTF is not currently operating as a result of the medial zone rebound test.
4-6
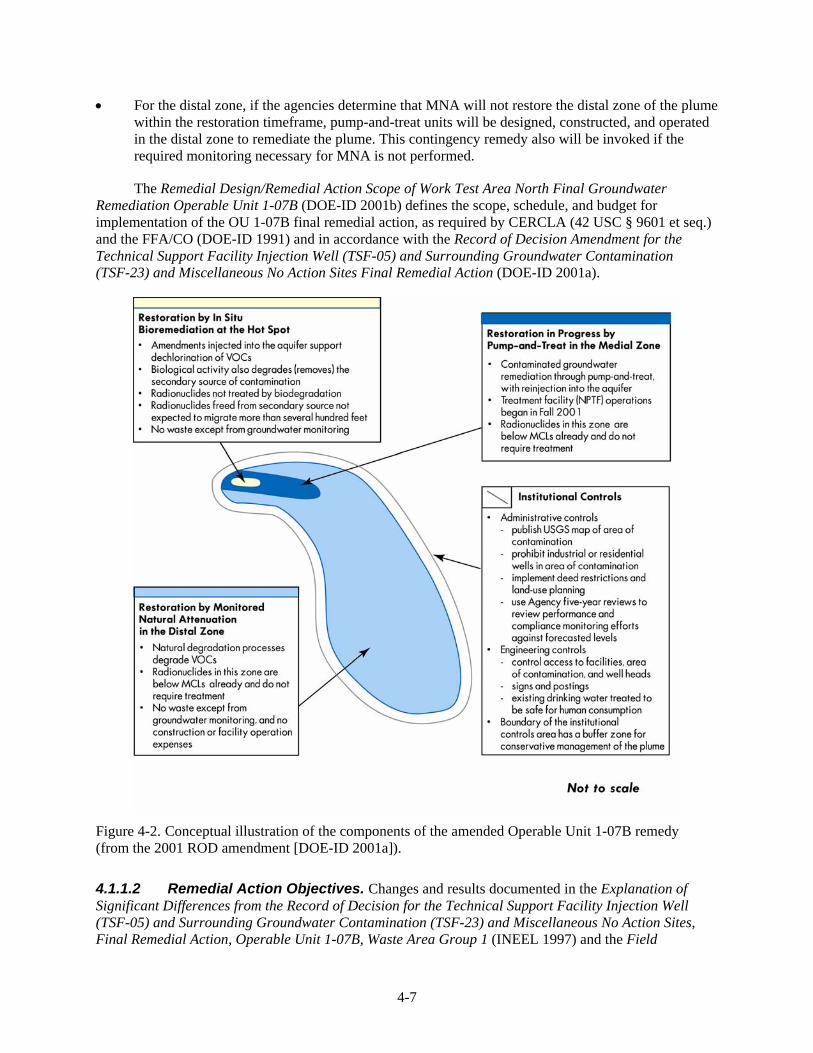
• For the distal zone, if the agencies determine that MNA will not restore the distal zone of the plume within the restoration timeframe, pump-and-treat units will be designed, constructed, and operated in the distal zone to remediate the plume. This contingency remedy also will be invoked if the required monitoring necessary for MNA is not performed.
The Remedial Design/Remedial Action Scope of Work Test Area North Final Groundwater Remediation Operable Unit 1-07B (DOE-ID 2001b) defines the scope, schedule, and budget for implementation of the OU 1-07B final remedial action, as required by CERCLA (42 USC § 9601 et seq.) and the FFA/CO (DOE-ID 1991) and in accordance with the Record of Decision Amendment for the Technical Support Facility Injection Well (TSF-05) and Surrounding Groundwater Contamination (TSF-23) and Miscellaneous No Action Sites Final Remedial Action (DOE-ID 2001a).
Figure 4-2. Conceptual illustration of the components of the amended Operable Unit 1-07B remedy (from the 2001 ROD amendment [DOE-ID 2001a]).
4.1.1.2 Remedial Action Objectives. Changes and results documented in the Explanation of Significant Differences from the Record of Decision for the Technical Support Facility Injection Well (TSF-05) and Surrounding Groundwater Contamination (TSF-23) and Miscellaneous No Action Sites, Final Remedial Action, Operable Unit 1-07B, Waste Area Group 1 (INEEL 1997) and the Field
4-7
Demonstration Report, Test Area North Final Groundwater Remediation, Operable Unit 1-07B (DOE-ID 2000a) prompted a refinement of the RAOs identified in the OU 1-07B ROD (DOE-ID 1995). The agencies agreed to follow final RAOs for the entire contaminant plume in the 2001 ROD amendment (DOE-ID 2001a). The RAOs are as follows:
• Restore the contaminated aquifer groundwater by 2095 (100 years from the signature of the OU 1-07B ROD) by reducing all COCs to below MCLs and a 1 × 10⁻⁴ total cumulative carcinogenic risk-based level for future residential groundwater use and, for noncarcinogens, until the cumulative hazard index is less than 1.
• For aboveground treatment processes in which treated effluent will be reinjected into the aquifer, reduce the concentrations of VOCs to below MCLs and a 1 × 10⁻⁵ total risk-based level.
• Implement institutional controls to protect current and future users from health risks associated with (1) ingestion or inhalation of, or dermal contact with, contaminants in concentrations greater than the MCLs; (2) contaminants with greater than a 1 × 10⁻⁴ cumulative carcinogenic risk-based concentration; or (3) a cumulative hazard index of greater than 1, whichever is more restrictive. The institutional controls shall be maintained until concentrations of all COCs are below the MCLs and until the cumulative carcinogenic risk-based level is less than 1 × 10⁻⁴ and, for noncarcinogens, until the cumulative hazard index is less than 1. Institutional controls shall include access restrictions and warning signs.
4.1.1.3 Remedy Implementation. Implementation of the final remedy started in October 2001, when the NPTF began routine operations in the medial zone. In October 2003, the hot spot remedy (i.e., ISB) and the distal zone remedy (i.e., MNA) became operational; however, actions supporting these remedies have been implemented since 1999 through the treatability studies and post-treatability study activities.
The success of the overall remedial action depends on all remedial components performing as planned in order to achieve remediation goals. The monitoring program for each remedial component provides data to evaluate the performance of each component as well as the overall remedial action. As remedial components are completed, a comprehensive monitoring program (details in Table 4-3) will continue to provide data necessary to evaluate attainment of all RAOs. Figure 4-3 illustrates the expected interaction of various remedy components’ monitoring programs over the life of the remedy.
4.1.2 Data Evaluation
The following subsections summarize data collected to evaluate the performance of the three remedial components.
4.1.2.1 Hot Spot. Currently, ISB is being implemented in the hot spot. Periodic electron donor injections are performed to stimulate increased biological activity, which results in enhanced biodegradation of VOCs through anaerobic reductive dechlorination. Starting with the treatability studies in 1999 through October 2003, sodium lactate was injected into TSF-05 on a weekly to bimonthly frequency. Modifications have been made to the injection strategy in order to optimize ISB performance. Beginning in November 2003, sodium lactate was injected into TSF-05 and TAN-1859 (a downgradient well) on an alternating monthly basis. Following these alternating injections, a field optimization to evaluate ISB effectiveness using whey powder in comparison to sodium lactate began in March 2004 and continued through June 2005. Results of this field optimization will be documented in a future ISB annual report. In general, good conditions for anaerobic reductive dechlorination are being maintained in the hot spot.
4-8

Table 4-3. Monitoring crosswalk table for the Operable Unit 1-07B remedial action. Monitoring Monitoring Decision/Evaluation Sample Basis
Zone Type Sample Parameter Objective Goal Program Document
Hot spot ISB performance
ISB compliance
ISB completion compliance
NPTF performance
MNA performance
Medial zone NPTF performance
NPTF compliance
NPTF completion compliance
ISB performance parameters:
• VOCs
• Tritium
• Ethene, ethane, methane,
redox, electron donor,
bioactivity, and nutrient
VOCs (TAN-28 and TAN-30A)
VOCs (TAN-1860 and TAN-1861)
All VOCs (wells to be determined)
VOCs plus radionuclides (strontium and cesium) (TAN-28, TAN-29, and TAN-30A)
Radionuclides (strontium and cesium) (TAN-25, TAN-28, TAN-29, TAN-30A, TAN-37, and TSF-05)
Drawdown
Facility influent/effluent VOCs and strontium
Air emissions
Operations uptime
Extraction flow rate
All COCs (wells to be determined)
Trending:
• Donor distribution
• Source degradation
• Flux
• New donor
VOCs below MCLs for 1 year
VOCs below MCLs for 1 year
Hot spot completion
Upgradient source
Upgradient radionuclide monitoring (hot spot)
4-9
Facility operations
Facility operations
Facility operations
Facility operations
Facility operations
Medial zone completion
Optimize operation to meet compliance objectives/requirements.
Achieve reduction of downgradient flux to below MCLs.
Achieve reduction of cross-gradient flux to below MCLs.
Determine whether ISB RAOs have been met in the hot spot.
Conduct NPTF contingency evaluation monitoring.
Monitor/evaluate hot spot radionuclide degradation and migration.
Capture the plume.
Stay within influent and effluent
specifications.
Stay within effluent specifications.
Maintain 90% uptime.
Operate within specified flow rate.
Determine that NPTF RAOs have been
or can be met in the medial zone.
ISB
ISB
ISB
NPTF
MNA
ISB work plan
ISB work plan
ISB remedial action report
NPTF work plan
MNA work plan
NPTF NPTF work plan
NPTF NPTF work plan
NPTF NPTF work plan

Table 4-3. (continued). Monitoring Monitoring Decision/Evaluation Sample Basis
Zone Type Sample Parameter Objective Goal Program Document
Distal zone MNA performance MNA performance parameters: Breakthrough curves Trends are toward achievement of MNA MNA work plan RAOs.
• VOCs Plume expansion
• Tritium Degradation rate
MNA compliance MNA performance parameters for 5 years
MNA performance parameters
Annual sampling is a requirement for at least the first 5 years.
MNA MNA work plan
MNA completion compliance
All COCs Remedial action completion Determine that RAOs have been met throughout the plume.
MNA MNA remedial action report
COC = contaminant of concern ISB = in situ bioremediation MCL = maximum contaminant level MNA = monitored natural attenuation NPTF = New Pump and Treat Facility RAO = remedial action objective TAN = Test Area North TSF = Technical Support Facility VOC = volatile organic compound 4-10

Figure 4-3. Generalized monitoring program operations throughout the remedial action timeframe.
4-11

Multiple analytical parameters from 17 monitoring locations (TSF-05A and TSF-05B and TAN-10A, TAN-25, TAN-26, TAN-27, TAN-28, TAN-29, TAN-30A, TAN-31, TAN-37A, TAN-37B, TAN-37C, TAN-D2, TAN-1859, TAN-1860, and TAN-1861) are evaluated to ascertain the effectiveness and consider operational changes to optimize anaerobic reductive dechlorination. See Figure 4-1 for the location of monitoring wells. The long-term goal is to achieve hot spot source degradation with intermediary goals of reducing flux of VOCs from the hot spot in both the downgradient and cross-gradient directions. Groundwater-monitoring results are used to measure the progress of the remedy goals through evaluation of COC concentration trends in combination with the other analytical parameters. As one part of the overall remedial picture, declining TCE trends in five hot spot and downgradient wells are shown in Figure 4-4. The purpose of current ISB operations is to optimize operations in order to work toward meeting the ISB compliance objectives stated in Table 4-3. Those objectives include reduction of flux to downgradient wells (TAN-28 and TAN-30A) and cross-gradient wells (TAN-1860 and TAN-1861). Additional data and evaluation of ISB effectiveness are documented in the following reports:
• Operable Unit 1-07B In Situ Bioremediation Annual Performance Report for October 1999 to July 2001 (INEEL 2002a)
• Annual Performance Report for In Situ Bioremediation Operations August 2001 to October 2002, Test Area North Operable Unit 1-07B (INEEL 2003a)
• Annual Performance Report for In Situ Bioremediation Operations November 2002 to October 2003, Test Area North Operable Unit 1-07B (Armstrong et al. 2004)
• Annual Performance Report for In Situ Bioremediation Operations November 2003 to September 2004, Test Area North, Operable Unit 1-07B (Macbeth et al. 2005).
4.1.2.2 Medial Zone. The NPTF was constructed to remediate the medial zone of the plume through extraction of contaminated groundwater, treatment through air strippers, and reinjection of the treated water. Performance and compliance monitoring is completed to demonstrate that the NPTF is operating as intended. This monitoring includes contaminant concentration trends and the associated calculated carcinogenic risk of water treated through the NPTF and reinjected into the SRPA, operational uptime, drawdown measurements, air emissions, and contaminant concentrations in groundwater in the medial zone.
The risk calculation methodology for water treated through the NPTF is documented in Appendix C of the New Pump and Treat Facility Operations and Maintenance Plan for Test Area North Final Groundwater Remediation, Operable Unit 1-07B (DOE-ID 2003b). Only contaminants with analytical values above the applicable method detection limit (2 μg/L for tetrachloroethene [PCE], TCE, cis-dichloroethene [DCE], and trans-DCE; 1 μg/L for vinyl chloride) are included in the cumulative risk calculation. The concentration of contaminants in treated water since the beginning of operations has been less than the applicable method detection limit. As a result, the concentration of contaminants present in treated water is less than the MCL, and the calculated carcinogenic risk of treated water is zero.
The operational uptime goal for the NPTF is 90%. Uptime is based on the total operational uptime over a specific period and is calculated over a rolling 12-month period. Since the beginning of long-term operations in October 2001, the uptime has always exceeded 90%. The uptime was 98.4% from the beginning of operations to September 30, 2004.
4-12

TCE
Con
cent
ratio
n ( μ
g/L)
1350
TAN-25 TAN-31 TAN-37A TAN-37B
1200 TAN-30A Field Evaluation Lactate Injections
TAN-28 1x, 3% Lactate Injections
1x, 6% Lactate Injections 2x, 3% Lactate Injections 4x, 6% Lactate Injections 4x, 3% Lactate Injections
1050 Whey Powder Injection
900
750
600
450
300
150
0 11/01/98 03/31/99 08/28/99 01/25/00 06/23/00 11/20/00 04/19/01 09/16/01 02/13/02 07/13/02 12/10/02 05/09/03 10/06/03 03/04/04 08/01/04
Date
Figure 4-4. Trichloroethene concentrations in the hot spot and downgradient wells. Dates and types of injections are shown across the top of the figure (1x represents an injection volume of approximately 12,000 gal, 2x approximately 24,000 gal, and 4x approximately 48,000 gal; 3% and 6% represent the concentration of sodium lactate used in the injection solution).
The purpose of drawdown measurements is to evaluate the width of the capture zone generated by operating the NPTF extraction wells. Performance requirements—both for generating the capture zone and for conducting tests to document the width of the capture zone—are described in Sections 4.2 and 4.2.1 of the New Pump and Treat Facility Operations and Maintenance Plan for Test Area North Final Groundwater Remediation, Operable Unit 1-07B (DOE-ID 2003b). Water level data from the TAN-19, TAN-32, TAN-33, and TAN-36 wells are evaluated to ascertain whether sufficient drawdown is achieved when the extraction well pumps are in operation. Wells included in this analysis (TAN-19, TAN-32, TAN-33, and TAN-36) are located near the edge of the minimum required capture zone. Results of drawdown testing are shown in Table 4-4. Water levels responded from 0.025 to 0.15 ft when extraction well pumps were turned off or on. The response of water levels in these four wells to extraction well shutdown indicates that extraction wells cause drawdown at these monitoring wells; thus, the capture zone extends at least as far as these wells. Therefore, it can be concluded that the extraction wells have generated a capture zone that meets the requirement that the zone extend at least 225 ft from the medial zone centerline.
Limits for VOCs discharged from the NPTF to the atmosphere are described in the New Pump and Treat Facility Remedial Design Test Area North Operable Unit 1-07B (DOE-ID 2000b). As shown in Figure 4-5, mass flow rates of VOC COCs in NPTF air effluent remained well below permissible limits. The VOC emissions from NPTF air strippers to the atmosphere were calculated in two ways. The first approach was to calculate the VOC mass flow rate using VOC concentrations measured in air stripper off-gas samples (the air effluent approach). The second approach was to assume that all VOCs dissolved in NPTF influent water were removed and transferred to the air stream and then discharged to the atmosphere (the water influent approach).
4-13

Table 4-4. Drawdown measured at selected wells.
NPTF Shutdown
Date and Time
NPTF Startup
Date and Time
Drawdown Observed during Startup (ft)
TAN-19 TAN-32 TAN-33 TAN-36
Post-Startup Extraction Rate (gpm)
TAN-38 TAN-39 TAN-40 12/10/2001
2210 12/11/2001
0708 0.06 0.15 0.10 0.05 0 114 113
02/27/2002 1000
02/27/2002 1650
0.06 0.05 0.07 0.06 126 117 0
04/18/2002 0705
04/18/2002 1306
0.07 0.06 0.08 0.07 122 120 0
03/19/2003 1000
03/19/2003 1600
0.025 0.05 0.04 0.02 0 85 146
05/09/2003 1000
05/12/2003 1102
0.05 0.05 0.06 0.016 0 92 153
09/24/2003 1300
09/24/2003 1600
0.06 0.05 0.07 0.06 103 81 0
03/01/2004 0935
03/01/2004 1520
0.05 0.06 — 0.06 103 100 0
09/15/2004 1200
09/15/2004 1400
0.023 0.04 0.04 0.03 99 0 90
NPTF = New Pump and Treat Facility TAN = Test Area North
0.0001
0.001
0.01
0.1
1
10
100
1000
VOC
Mas
s Fl
ow R
ate
(lb/h
r)
Oct-03 Nov-03 Jan-04 Mar-04
Date Apr-04 Jun-04 Aug-04 Sep-04
PCE-Air TCE-Liquid PCE Discharge Limit
PCE-Liquid cis-DCE-Air TCE Discharge Limit
TCE-Air cis-DCE-Liquid cis-DCE Discharge Limit
Figure 4-5. Calculated mass flow rate of volatile organic compounds emitted in the off-gas of the New Pump and Treat Facility.
4-14

Baseline facility performance refers to the effect of NPTF operations on groundwater quality in five selected wells near the NPTF. Contaminant concentrations in the TAN-33 well are presented in Figure 4-6 to illustrate the change in contaminant concentrations from the time the well was installed in 1997 until the start of NPTF operations in 2001. Similar contaminant concentration trends have been observed in the TAN-36, TAN-43, and TAN-44 wells, which are located near the NPTF. All data are shown in the following reports:
• New Pump and Treat Facility Annual Operations Report October 2001 through September 2002, Test Area North Final Groundwater Remedy, Operable Unit 1-07B (INEEL 2003b)
• New Pump and Treat Facility Annual Operations Report, October 2002 through September 2003, Test Area North Final Groundwater Remedy, Operable Unit 1-07B (ICP 2004b)
• New Pump and Treat Facility Annual Operations Report, October 2003 through September 2004, Test Area North Final Groundwater Remedy, Operable Unit 1-07B (ICP 2005).
VOC Concentrations in Well TAN-33
1000
900
800
0
10
20
30
40
50
60
70
Con
cent
ratio
n (u
g/L)
700
600
500
400
300
200
100
0 Oct-95 Mar-97 Jul-98 Dec-99 Apr-01 Sep-02 Jan-04 May-05
Date Sampled
Tric
hlor
oeth
ene
Con
cent
ratio
n (u
g/L)
cis-1,2-Dichloroethene Tetrachloroethene trans-1,2-Dichloroethene Trichloroethene
Figure 4-6. Concentration of contaminants present in groundwater samples collected from the TAN-33 well.
4.1.2.3 Distal Zone. Technical information supporting implementation of MNA includes the following:
• Identification of a TCE Degradation Mechanism—An aerobic cometabolic degradation mechanism for TCE has been identified for the OU 1-07B distal zone through direct (presence of enzymes capable of degrading TCE) and indirect (presence of conditions conducive to cometabolism) evidence both within and outside of the plume.
4-15

1/1/
1990
5/16
/199
1
9/27
/199
2
2/9/1
994
6/24
/1995
11/5/
1996
3/20
/199
8
8/2/
199 9
12/14
/200
0
4/28
/200
2
9/10/
2003
1/22
/2005
6/6/2
006
• Determination of the TCE Degradation Rate—A TCE degradation rate of 13.2 years was determined based on a spatial trend comparison of TCE and tritium (a conservative co-contaminant) concentration ratios.
• Monitoring the Size of the TCE Plume—Ongoing monitoring has indicated that the plume has not expanded.
• Determining Peak TCE Concentration Breakthrough—Dates of peak TCE concentrations at monitoring locations (TAN-16, TAN-21, TAN-51, TAN-52, TAN-54, TAN-55, TAN-56, TAN-57, TAN-58, ANP-8, and GIN-4) in the distal zone were determined through numerical modeling. Future groundwater monitoring will confirm breakthrough of peak TCE concentrations. Monitoring well locations are shown in Figure 4-1. Figure 4-7 shows TAN-16 data as an example.
• Evaluating Radionuclide Data—Ongoing monitoring (TAN-25, TAN-28, TAN-29, TAN-30A, TAN-37, and TSF-05) has indicated that attenuation processes of radioactive decay and sorption of radionuclides to aquifer materials continue to be functional within the plume. No migration of Sr-90 and Cs-137 from the source area has been observed, and tritium and U-234 have not been detected above the MCLs. See Figure 4-1 for monitoring well locations.
Additional evaluation of MNA data are presented in the following reports:
• Fiscal Year 2002 Groundwater Monitoring Annual Report, Test Area North, Operable Unit 1-07B (INEEL 2003c)
• Monitored Natural Attenuation 2003 Performance and Compliance Monitoring Annual Report for Test Area North Operable Unit 1-07B (DOE-ID 2004a)
• Monitored Natural Attenuation 2004 Performance and Compliance Monitoring Annual Report for Test Area North, Operable Unit 1-07B (Harris and Lebow 2005).
80
70
60 Estimated time period of TCE
50 peak breakthrough (The range is
TCE
(μg/
L)
40 from 2004 to
2006 as 30 estimated using
the13.2 and 20 year half-lives)20
10
0
Date
Figure 4-7. Trichloroethene peak breakthrough analysis for the TAN-16 well.
4-16

4.1.3 Progress since Last Review
The TSF-05 ROD amendment was signed in 2001 (DOE-ID 2001a); therefore, this is the first five-year review for OU 1-07B.
4.1.4 Technical Assessment
4.1.4.1 Hot Spot—In Situ Bioremediation
Question A: Is the remedy functioning as intended by the decision documents?
Performance Monitoring Results—The ISB data have been analyzed, reviewed, and documented in the following reports:
• In Situ Bioremediation Remedial Action Work Plan for Test Area North Final Groundwater Remediation, Operable Unit 1-07B (INEEL 2002a)
• Annual Performance Report for In Situ Bioremediation Operations August 2001 to October 2002, Test Area North Operable Unit 1-07B (INEEL 2003a)
• Annual Performance Report for In Situ Bioremediation Operations November 2002 to October 2003, Test Area North, Operable Unit 1-07B (Armstrong et al. 2004)
• Annual Performance Report for In Situ Bioremediation Operations November 2003 to September 2004, Test Area North, Operable Unit 1-07B (Macbeth et al. 2005).
A review of the performance monitoring results indicates that ISB is functioning as intended in accordance with the decision documents.
Operations and Maintenance—Operations and maintenance of the ISB system encompass maintaining all equipment in operational status in order to perform amendment injections, sampling activities, and field laboratory activities. Routine inspections of safety equipment are completed as specified in project procedures. Since the 2001 ROD amendment (DOE-ID 2001a), the amendment injection system has transitioned from a manual, aqueous one-well injection system to construction of a facility that houses an aqueous- and solid-phase injection system with the capability to inject into three wells. The facility also contains a field laboratory and office space.
Implementation of Institutional Controls—The institutional controls identified in the 2001 ROD amendment (DOE-ID 2001a) and the In Situ Bioremediation Remedial Action Work Plan for Test Area North Final Groundwater Remediation, Operable Unit 1-07B (INEEL 2002a) have been implemented and were verified during the prefinal/final inspection conducted on October 16 and 17, 2003. Details about the overall OU 1-07B project institutional controls are documented in the Comprehensive Remedial Design/Remedial Action Work Plan for the Test Area North, Waste Area Group 1, Operable Unit 1-10, Group 2 Sites (DOE-ID 2004b).
Question B: Are the exposure assumptions, toxicity data, cleanup levels, and remedial action objectives used at the time of the remedy still valid?
4-17

Exposure pathways and land use have not changed since the 2001 ROD amendment was approved. Additionally, there have been no new contaminants, nor have there been any remedy by-products that would affect the original assumptions. The RAOs identified in the ROD amendment are still valid, and the remedy for the hot spot of the contaminant plume continues to progress as anticipated.
Question C: Has any other information come to light that could call into question the protectiveness of the remedy?
No.
4.1.4.2 Medial Zone-New Pump and Treat Facility
Question A: Is the remedy functioning as intended by the decision documents?
Performance/Compliance Monitoring Results—The NPTF data have been analyzed, reviewed, and documented in the following reports:
• New Pump and Treat Facility Annual Operations Report October 2001 through September 2002, Test Area North Final Groundwater Remedy, Operable Unit 1-07B (INEEL 2003b)
• New Pump and Treat Facility Annual Operations Report, October 2002 through September 2003, Test Area North Final Groundwater Remedy, Operable Unit 1-07B (ICP 2004b)
• New Pump and Treat Facility Annual Operations Report, October 2003 through September 2004, Test Area North Final Groundwater Remedy, Operable Unit 1-07B (ICP 2005).
A review of the performance and compliance monitoring results obtained during the first 3 years of NPTF operations indicates that the remedy is functioning as intended in accordance with the decision documents.
Operations and Maintenance—Operations and maintenance of the NPTF encompass maintaining all equipment in operational status and inspecting the system daily when it contains hazardous waste. During the reporting period, the NPTF operated more than 98% of the time. Daily inspections were completed as required.
Implementation of Institutional Controls—The institutional controls identified in the 2001 ROD amendment (DOE-ID 2001) and the In Situ Bioremediation Remedial Action Work Plan for Test Area North Final Groundwater Remediation, Operable Unit 1-07B (INEEL 2002a) have been implemented. Details for the overall OU 1-07B project institutional controls are documented in the INEEL Sitewide Institutional Controls Plan (DOE-ID 2004b).
Question B: Are the exposure assumptions, toxicity data, cleanup levels, and remedial action objectives used at the time of the remedy still valid?
Exposure pathways and land use have not changed since the OU 1-07B ROD amendment (DOE-ID 2001a) was approved. Additionally, there have been no new contaminants, nor have there been any remedy by-products that would affect the original assumptions. The RAOs identified in the ROD amendment are still valid, and the remedy for the medial zone of the contaminant plume continues to progress as anticipated.
4-18

Question C: Has any other information come to light that could call into question the protectiveness of the remedy?
No.
4.1.4.3 Distal Zone-Monitored Natural Attenuation
Question A: Is the remedy functioning as intended by the decision documents?
Performance Monitoring Results—The MNA data have been analyzed, reviewed, and documented in the following reports:
• Fiscal Year 2002 Groundwater Monitoring Annual Report, Test Area North, Operable Unit 1-07B (INEEL 2003c)
• Monitored Natural Attenuation 2003 Performance and Compliance Monitoring Annual Report for Test Area North Operable Unit 1-07B (DOE-ID 2004a)
• Monitored Natural Attenuation 2004 Performance and Compliance Monitoring Annual Report for Test Area North, Operable Unit 1-07B (Harris and Lebow 2005).
A review of the performance monitoring results indicates that MNA is functioning as intended in accordance with the decision documents.
Operations and Maintenance—Operations and maintenance of MNA implementation encompass maintaining all equipment in operational status to conduct monitoring activities. This includes inspecting and maintaining the well infrastructure and all sampling equipment.
Implementation of Institutional Controls—The institutional controls identified in the ROD amendment (DOE-ID 2001a) and the Monitored Natural Attenuation Remedial Action Work Plan for Test Area North Final Groundwater Remediation, Operable Unit 1-07B (DOE-ID 2003a) have been implemented and were verified during the prefinal/final inspection conducted on October 16, 2003. Details about the overall OU 1-07B project institutional controls are documented in the INEEL Sitewide Institutional Controls Plan (DOE-ID 2004b).
Question B: Are the exposure assumptions, toxicity data, cleanup levels, and remedial action objectives used at the time of the remedy still valid?
Exposure pathways and land use have not changed since the OU 1-07B ROD amendment was approved. Additionally, there have been no new contaminants, nor have there been any remedy by-products that would affect the original assumptions. The RAOs identified in the ROD amendment are still valid, and the remedy in the distal zone of the contaminant plume continues to progress as anticipated.
Question C: Has any other information come to light that could call into question the protectiveness of the remedy?
No.
4-19

4.1.5 Technical Assessment Summary
The remedy for OU 1-07B consists of three components: ISB for the hot spot, pump-and-treat for the medial zone, and MNA for the distal zone. According to the data reviewed, the three components are functioning as intended by the ROD amendment (DOE-ID 2001a) and decision documents. The RAOs identified in the ROD amendment are still valid, and each component of the remedy continues to progress as anticipated. In addition, there have been no changes in conditions, and there is no new information that calls into question the protectiveness of any of the three components of the remedy.
4.1.6 Issues
No issues have been identified during this five-year review.
4.1.7 Recommendations and Follow-up Activities
Implementation of the OU 1-07B remedy continues to progress toward meeting the RAOs stated in the 2001 ROD amendment (DOE-ID 2001a). Optimization and validation activities are currently being conducted for each remedial component and include the following:
• Hot Spot—Optimize the injection strategy to achieve maximum degradation of the residual contamination source and achieve a biologically active area large enough to cut off flux of contaminants to downgradient monitoring locations.
• Medial Zone—Evaluate the effectiveness of NPTF operations during the medial zone rebound test by monitoring changes in TCE concentrations after NPTF shutdown.
• Distal Zone—Verify breakthrough of peak TCE concentrations at distal zone well locations through continued monitoring, and continue to monitor the TCE plume boundary.
4.1.8 Protectiveness Statement
The remedy is expected to be protective of human health and the environment upon attainment of the RAOs defined in the ROD amendment (DOE-ID 2001a). In the interim, the three components of the remedy have been implemented in accordance with the schedules stated in the appropriate remedial action work plans. All prefinal/final inspections have been completed, and all institutional controls for the remedy are in place. Interim remedial action reports for ISB and MNA are currently in preparation.
4.2 Operable Unit 1-10 (Test Area North Comprehensive Remediation)
Section 4.1 of this report described the remedial action for the TSF-05 and TSF-23 sites under the OU 1-07B ROD (DOE-ID 1995). The remaining 62 potential release sites at TAN were examined under the Comprehensive Remedial Investigation/Feasibility Study for the Test Area North Operable Unit 1-10 at the Idaho National Engineering and Environmental Laboratory (DOE-ID 1997). Of the 62 potential sites, 53 were found to require no cleanup actions. The nine remaining sites were found to present an unacceptable risk to human health and the environment and required remedial action. Those nine release sites are TSF-03, TSF-06, TSF-07, TSF-08, TSF-09, TSF-18, TSF-26, WRRTF-01, and WRRTF-13.
4-20

The Final Record of Decision for Test Area North Operable Unit 1-10 (DOE-ID 1999) was finalized and signed in October 1999. The ROD identified nine sites for remedial action, because contamination was present with calculated risks greater than 1E-04 and/or hazard indices greater than 1 for one or more exposure scenarios. In the Test Area North, Waste Area Group 1, Operable Unit 1-10 Remedial Design/Remedial Action Scope of Work (DOE-ID 2000c), the TSF-26 site was spit into TSF-26 (PM-2A tanks [V-13 and V-14]) and TSF-26 soils. In addition, the remedial action sites were divided into two groups. Group 1 comprises the soil-contamination area south of the turntable (TSF-06 site, Area B), the disposal pond (TSF-07 site), the soil excavation at the TSF-26 site (TSF-26 site, soils), and the fuel leak site (WRRTF-13 site). Group 2 comprises the V-Tanks (V-1, V-2, and V-3) and associated piping and equipment (TSF-09 site), V-Tank V-9 and associated piping and equipment (TSF-18 site), the PM-2A tanks (TSF-26 site—PM-2A tanks), and the burn pits (WRRTF-01 and TSF-03 sites) (see Figures 4-8 and 4-9). For the purpose of remediation, the TSF-09 and TSF-18 V-Tank sites were combined into one site designation (TSF-09/18), and the TSF-21 site (the IET valve pit area soil) was included in the V-Tanks’ area of contamination.
Figure 4-8. Technical Support Facility remedial action sites.
4-21

Figure 4-9. Water Reactor Research Test Facility remedial action sites.
During the development of the original Comprehensive Remedial Design/Remedial Action Work Plan for the Test Area North, Waste Area Group 1, Operable Unit 1-10, Group 2 Sites (DOE-ID 2002b) in 2001, the Group 2 sites were further subdivided. The TSF-09/18 site remained as Group 2, while the TSF-26 PM-2A tanks and the TSF-03 and WRRTF-01 burn pits were designated as Group 3.
Since the completion of the original remedial design/remedial action scope of work, the Record of Decision Amendment for the V-Tanks (TSF-09 and TSF-18) and Explanation of Significant Differences for the PM-2A Tanks (TSF-26) and TSF-06, Area 10 at Test Area North, Operable Unit 1-10 (DOE-ID 2004c) and the Explanation of Significant Differences for the Record of Decision for the Test Area North Operable Unit 1-10 were issued in 2003 (DOE-ID 2003c) and the Explanation of Significant Differences for the Record of Decision for the Test Area North Operable Unit 1-10 was issued in 2005 (DOE-ID 2005), documenting modifications or clarifications to remedial actions or requiring remedial actions at new sites. As presented in the Explanation of Significant Differences (ESD) (DOE-ID 2005) issued in January 2005, the TSF-46, TSF-47, and TSF-48 new sites were reevaluated; found to require remedial actions; and included in the Group 2 sites. The TAN-616 caustic tank (V-4, TSF-19 site) also was identified through the ESD as requiring remedial actions. Figure 4-10 shows the location of these new sites.
4-22

Figure 4-10. Locations of the TSF-19, TSF-46, TSF-47, and TSF-48 sites.
4-23

Finally, as a result of post-ROD characterization sampling or other factors, and as described later in this report, remedies for several of the nine original sites were modified. The diesel fuel leak (WRRTF-01 site) was found to be a no-action site (DOE-ID 2003c). The remedy for the TSF burn pit (TSF-03 site) was changed from native soil cover for excavation and disposal (DOE-ID 2003c). The mercury spill area (TSF-08 site) was transferred from OU 1-10 to OU 10-08 for further investigation (DOE-ID 2003c). The remedy for the TSF-09/18 V-Tanks was changed from contents removal and off-Site treatment to contents removal with on-Site treatment (sparging and solidification), V-Tanks (V-1, V-2, V-3, and V-9) removal/disposal, and soil excavation and disposal at the Idaho CERCLA Disposal Facility (ICDF) (DOE-ID 2004c). The remedy for the TSF-26 PM-2A tanks was changed from tank contents removal and treatment if necessary to tank and contents removal with disposal of the V-13 tank and contents and treatment and disposal of the V-14 tank contents (DOE-ID 2005). The remedy for Pit I at the WRRTF-01 burn pits changed from native soil cover to no action, and the COC for Pits II and IV changed from lead to asbestos (DOE-ID 2003c).
A complete list of OU 1-10 remedial action sites, their respective COCs, and final remediation goals is presented in Table 4-5. Table 4-6 provides a chronology of decision documents, implementing documents, and significant events for OU 1-10. The subsequent paragraphs briefly describe the OU 1-10 remedial action sites.
Table 4-5. Contaminants of concern at Operable Unit 1-10. Site
(Site Code) Contaminant of Concern Remediation Goal Group 1 Sites
Soil Contamination Area South of the Cs-137 <23.3 pCi/g Turntable (TSF-06 site, Area B) TSF Disposal Pond (TSF-07) Cs-137 <23.3 pCi/g PM-2A Tanks Cs-137 <23.3 pCi/g (TSF-26-Soils) WRRTF Diesel Fuel Leak Petroleum hydrocarbons None required since below the (WRRTF-13) risk-based corrective action Tier 2
criteria Group 2 Sites
TSF Intermediate-Level (Radioactive) Cs-137 <23.3 pCi/g Waste Disposal System (Tanks V-1, V-2, and V-3) (TSF-09 site), Contaminated Tank (Tank V-9) Southeast of Tank V-3 (TSF-18 site), and Valve Pit 2 Soils (TSF-21 site) V-Tank Area New Sites (TSF-46, Cs-137 <23.3 pCi/g TSF-47, and TSF-48) Caustic Tank V-4 (TSF-19) Cs-137 Disposal of tank and contents
Group 3 Sites PM-2A Tanks (V-13 and V-14) Cs-137 <23.3 pCi/g (TSF-26 Tanks) TSF Burn Pit (TSF-03) Lead <400 mg/kg WRRTF Burn Pits II and IV Asbestos Native soil cover (WRRTF-01)
TSF = Technical Support Facility WRRTF = Water Reactor Research Test Facility
4-24

Table 4-6. Chronology of Operable Unit 1-10 events. Document or Event Date
The FFA/CO (DOE-ID 1991) was signed. December 1991
The Record of Decision for the Technical Support Facility Injection Well (TSF-05) and Surrounding Groundwater Contamination (TSF-23) and Miscellaneous No Action Sites Final Remedial Action (DOE-ID 1995) was completed.
August 1995
The Comprehensive Remedial Investigation/Feasibility Study for the Test Area North Operable Unit 1-10 at the Idaho National Engineering and Environmental Laboratory (Comprehensive RI/FS) (DOE-ID 1997) was completed.
November 1997
The Proposed Plan for Waste Area Group 1-Test Area North Idaho National Engineering and Environmental Laboratory (DOE-ID 1998a) (first proposed plan for OU 1-10 ROD) was completed.
February 1998
The Proposed Plan for Waste Area Group 1 Test Area North at the Idaho National Engineering and Environmental Laboratory an OU 1-10 RI/FS Supplement (DOE-ID 1998b) (second proposed plan for OU 1-10 ROD) was completed.
November 1998
The Comprehensive Remedial Investigation and Feasibility Study Supplement for the Test Area North Operable Unit 1-10 at the Idaho National Engineering and Environmental Laboratory (DOE-ID 1998c) was completed.
November 1998
The Final Record of Decision for Test Area North Operable Unit 1-10 (DOE-ID 1999) was completed.
October 1999
The Test Area North, Waste Area Group 1, Operable Unit 1-10 Remedial Design/Remedial Action Scope of Work (DOE-ID 2000c) was completed.
February 2000
The Field Sampling Plan for Post-Record of Decision Sampling and Field Screening of Selected Sites at Waste Area Group 1, Operable Unit 1-10 (DOE-ID 2000d) was completed.
February 2000
The OU 1-10 remedial action was initiated with the start of post-ROD characterization sampling.
February 2000
The TSF-26 soil pile was removed. May 2000
The TSF-06 overburden soil was removed. July 2000
The Comprehensive Remedial Design/Remedial Action Work Plan for the Test Area North, Operable Unit 1-10, Group 1 Sites (DOE-ID 2003d) was completed.
Rev. 0, August 2000 Rev. 2, November 2003
Approval was received for a “no-longer-contained-in” determination for TSF-06 and TSF-26 contaminated soils.
September 2000
Disposal of TSF-06 and TSF-26 contaminated soils at the RWMC was completed for soil removed in 2000.
December 2000
The Operations and Maintenance Plan for Test Area North, Operable Unit 1-10 (DOE-ID 2001c) was completed.
Rev. 1, November 2001
The Comprehensive Remedial Design/Remedial Action Work Plan for the Test Area North, Waste Area Group 1, Operable Unit 1-10, Group 2 Sites (DOE-ID 2002b) (original work plan for V-Tanks TSF-09/18) was completed.
Rev. 0, November 2001 Rev. 1, March 2002
The Technology Evaluation Scope of Work for the V-Tanks, TSF-09/18, at Waste Area Group 1, Operable Unit 1-10 (DOE-ID 2002c) (addressed the scope of work for evaluation to select a new V-Tanks’ remedy) was completed.
July 2002
4-25

Table 4-6. (continued). Document or Event Date
The Technical Support Facility-06 and Technical Support Facility-26 Calendar Year 2000 Sampling and Remediation Summary Report for Waste Area Group 1, Operable Unit 1-10 (INEEL 2002b) was completed.
October 2002
The TSF-03 and WRRTF-01 2000/2001 Sample Data Compilation and Risk Assessment Report for Operable Unit 1-10, Waste Area Group 1, at Test Area North (DOE-ID 2003e) was completed.
January 2003
The Explanation of Significant Differences for the Record of Decision for the Test Area North Operable Unit 1-10 (DOE-ID 2003c) was completed.
April 2003
The New Proposed Plan for the V-Tanks Contents (TSF-09 and TSF-18) at Test Area North, Operable Unit 1-10 (DOE-ID, EPA, and DEQ 2003) (proposed plan for new V-Tanks’ remedy) was completed.
April 2003
The Comprehensive Remedial Design/Remedial Action Work Plan Addendum for V-Tanks Early Remedial Action for the Test Area North, Waste Area Group 1, Operable Unit 1-10, Group 2 Sites (DOE-ID 2003f) was completed.
May 2003
The Remedial Design/Remedial Action Work Plan for Group 3, PM-2A Tanks and Burn Pits for Test Area North, Waste Area Group 1, Operable Unit 1-10 (DOE-ID 2003g) was completed.
December 2003
The Record of Decision Amendment for the V-Tanks (TSF-09 and TSF-18) and Explanation of Significant Differences for the PM-2A Tanks (TSF-26) and TSF-06, Area 10 at Test Area North, Operable Unit 1-10 (DOE-ID 2004c) (ROD amendment for new V-Tanks’ remedy and ROD change for PM-2A tanks) was completed.
February 2004
The TSF-03 burn pit remediation (soil removal, soil disposal, and site backfill) was completed.
April 2004
The TSF-06 Area B remediation (soil removal, soil disposal, and site backfill) was completed.
May 2004
The Risk-Based Screening and Assessment Approach for Waste Area Group 1 Soils (INEEL 2004) was completed.
May 2004
The Group 3 Remedial Design/Remedial Action Work Plan Addendum 1 for PM-2A Tank Removal and Site Remediation for the Test Area North, Waste Area Group 1, Operable Unit 1-10 (DOE-ID 2004d) was completed.
June 2004
The TSF-26 PM-2A tanks (V-13 and V-14) and contents were removed from the ground and temporarily placed in the TAN-607 high bay pending transport to the ICDF for treatment and disposal.
June 2004
Remediation of the WRRTF-01 burn pits (native soil cover) was completed. August 2004
The Group 2 Remedial Design/Remedial Action Work Plan Addendum for the Assessment and Cleanup of V-Tank Area New Sites, for the Test Area North, Waste Area Group 1, Operable Unit 1-10 (DOE-ID 2004e) (for the TSF-46, TSF-47, TSF-48, and TSF-19 new sites) was completed.
August 2004
The TSF-26 soil remediation (soil removal and disposal and site backfill) was completed.
September 2004
The Group 2 Remedial Design/Remedial Action Work Plan Addendum 2 for the TSF-09/18 V-Tanks and Contents Removal, Phase 1 Contents Treatment, and Site Remediation (DOE-ID 2004f) was completed.
Rev. 0, September 2004 Rev. 1, November 2004
4-26

Table 4-6. (continued). Document or Event Date
The TSF-26 PM-2A tanks (V-13 and V-14) and their contents were shipped to the ICDF for treatment and disposal. PM-2A Tank V-13 was placed directly in the disposal cell at the ICDF, and Tank V-14 was staged at the ICDF pending treatment prior to disposal.
January 2004
The Explanation of Significant Differences for the Record of Decision for the Test Area North Operable Unit 1-10 (DOE-ID 2005) was issued.
January 2005
CERCLA = Comprehensive Environmental Response, Compensation, and Liability Act DEQ = [Idaho] Department of Environmental Quality DOE-ID = U.S. Department of Energy Idaho Operations Office EPA = U.S. Environmental Protection Agency FFA/CO = Federal Facility Agreement and Consent Order ICDF = Idaho CERCLA Disposal Facility INEEL = Idaho National Engineering and Environmental Laboratory OU = operable unit RI/FS = remedial investigation/feasibility study ROD = Record of Decision RWMC = Radioactive Waste Management Complex TSF = Technical Support Facility
Soil Contamination Area South of the Turntable (TSF-06 Site, Area B)—The TSF-06 soil area is south of the turntable and is an open area bounded by the TSF fence on the west and by facility roads and several adjacent structures on the east and south. The area is roughly triangular and measures 675 ft wide on the south and 425 ft on the west. The contaminated area was radiologically surveyed by TAN personnel and covered with 1 to 2 ft of soil in 1992 (INEL 1994). The additional soil is referred to as the TSF-06 overburden, and the underlying contaminated soil is referred to as the TSF-06 native soil. Since 1992, the TSF-06 overburden has become contaminated from windblown soil containing Cs-137 that was stockpiled at the PM-2A tanks site.
TSF Disposal Pond (TSF-07 Site)—The TSF disposal pond is a 35-acre, unlined disposal pond in the southwest portion of the TSF. The pond is surrounded by a 5-ft-tall berm.
A 5-acre area in the northeast corner and on the eastern edge of the pond has been contaminated with Cs-137 and metals. However, it was assumed in the RI/FS that the area of contamination covers the entire main pond and overflow pond surfaces. Previous sampling activities indicate that the Cs-137 has migrated to approximately 11 ft below the bottom of the pond in this area.
Historically, the active portion of the pond received wastewater that included sanitary waste discharges, low-level radioactive waste, industrial wastewater, cold process water, and treated sewage effluent. The pond is currently permitted by the State of Idaho to receive sanitary and industrial waste discharges. The active portion of the pond will be assessed when operations cease.
PM-2A Tanks and Soil (TSF-26 Site)—The PM-2A tanks site consists of two 50,000-gal abandoned underground storage tanks. The tanks were installed in the mid-1950s and stored concentrated low-level radioactive waste from the TAN-616 evaporator from 1955 to 1972 (DOE-ID 1998b). In 1972, a new evaporator system (the PM-2A system) was installed in the area to replace the existing TAN-616 evaporator system, which was failing. The tanks served as feed tanks for the new evaporator system in which liquid waste was evaporated, condensed, passed through an ion-exchange column, and discharged as clean water into the disposal pond (TSF-07 site). The system was shut down in 1975 because of operational difficulties and spills (DOE-ID 1998b).
4-27

The contents of the PM-2A tanks (V-13 and V-14) consisted of a radioactive hazardous sludge with minimal liquids, because, in 1981, the tanks were partially filled with diatomaceous earth to absorb free liquid.
The soil surrounding the PM-2A tanks was contaminated as a result of spills during periodic pumping operations to remove excess liquid from the tanks. The PM-2A tank contents and surrounding soil were contained along with the hazardous constituents, including metals (barium, cadmium, chromium, lead, mercury, and silver), VOCs (TCE, 1,1,1-trichloroethane [TCA], carbon tetrachloride, and acetone), semivolatile organic compounds, polychlorinated biphenyls (PCBs), and radionuclides (Cs-137, Co-60, and Sr-90). Based on sampling, the primary COC in the soil was Cs-137.
Contaminated soil was removed in 1996 as part of a removal action. The contaminated soil was stockpiled until eventual disposal at the Radioactive Waste Management Complex (RWMC) in 2000.
WRRTF Diesel Fuel Leak (WRRTF-13 Site)—The WRRTF fuel leak site is defined as the WRRTF fuel leak site/contamination plume that is under the area where the TAN-738, TAN-739, and TAN-787 tanks were located. The tanks were located between Buildings 641 and 645. Numerous diesel and heating fuel tanks and transfer lines have supplied the buildings within WRRTF during its operational life.
During a startup test of the boilers in October 1991, an estimated 2,100 to 3,600 gal of diesel fuel was unaccounted for. It was suspected that either the transfer line was leaking or the boiler meters were not functioning properly. A pressure leak test indicated that a portion of the transfer piping was leaking. During excavation of the transfer line, the soil below the piping appeared discolored and smelled strongly of petroleum products. The TAN-738 and TAN-787 tanks were removed in December 1991. When removed, TAN-738 contained numerous small holes, and soil below the tank both smelled of and appeared to be contaminated with diesel fuel.
TSF Intermediate-Level (Radioactive) Waste Disposal System (V-Tanks) (TSF-09 Site) and Contaminated Tank Southeast of Tank V-3 (Tank V-9) (TSF-18 Site)—The two V-Tank sites (TSF-09 and TSF-18) have similar attributes and are located in the same area. Because of the similarities between the two sites, they were evaluated together for the ROD.
The TSF-09 site includes the three abandoned 10,000-gal underground V-1, V-2, and V-3 storage tanks; the contents of the tanks; and the surrounding contaminated soil and ancillary piping. The TSF-18 site includes the abandoned 400-gal V-9 underground storage tank, a sand filter, the tank contents, and the surrounding soil. The tank contents are contaminated with radionuclides, heavy metals, organic compounds, and PCBs. The surrounding soil also is contaminated with radionuclides, heavy metals, and organic compounds from spills that occurred when waste was transferred to and from the tanks.
All four V-Tanks were installed in the early 1950s and were used for about 30 years in a system that collected and treated radioactive waste from TAN operations, beginning with the Aircraft Nuclear Propulsion Program in the 1950s and early 1960s. Waste was piped from the adjacent research facilities into the V-9 tank, where some solids were removed. The remaining waste was then routed into one or more of the larger tanks (V-1, V-2, and V-3). The waste was stored in the underground tanks and then treated in the evaporator system located in TAN-616. The tanks’ contents are an aqueous sludge, and nearly all of the contaminants are associated with the solid phase of the sludge.
TSF Burn Pit (TSF-03 Site)—The TSF burn pit area was used for open burning of construction debris. The pit was used from 1953 to 1958 and is located in the northeast corner of the TSF, outside the facility fence.
4-28

The burn pit was believed to be contaminated with lead. While lead does not present a risk that can be calculated using risk guidelines, the EPA has established a residential screening level to address the human health risk caused by lead.
WRRTF Burn Pits I, II, III, and IV (WRRTF-01 Site)—The four WRRTF burn pits were used for open burning of construction debris from 1958 to 1975. They are approximately 2,700 ft north of WRRTF, outside the facility fence.
The WRRTF burn pits were initially thought to be contaminated with lead. However, a 2003 ESD (DOE-ID 2003c) reflects the change in the COCs from lead to asbestos while maintaining the remedy of a native soil cover to Pits II and IV.
Mercury Spill Area (TSF-08 Site)—The mercury spill area is a section of railroad bed near the southwest corner of Building 607. In 1958, the area was contaminated by a mercury spill from the Heat Transfer Reactor Experiment-III engine. A time-critical removal action was performed in 1994, and the area was backfilled with clean gravel. Post-removal action sampling showed low levels of mercury at least 2.5 ft below ground surface.
V-Tank Area New Sites (TSF-46, TSF-47, and TSF-48 Sites)—The August 2004 Group 2 Remedial Design/Remedial Action Work Plan Addendum for the Assessment and Cleanup of V-Tank Area New Sites, for the Test Area North, Waste Area Group 1, Operable Unit 1-10 (DOE-ID 2004e) discusses three new CERCLA sites that have been identified in the vicinity of the V-Tanks (the TSF-09 and TSF-18 sites). These new sites are TSF-46, TSF-47, and TSF-48, as identified in Figure 4-10.
The TSF-46 site includes the soil around the perimeter of Building 616 that was originally identified as a new site in 1998. A Track 1 evaluation completed in September 2000 specifically addresses the contamination in the exterior environment of Building 616 (DOE-ID 2001d). This includes the soil beneath Building 616 and the soil on the north, south, and west sides of the building.
The TSF-47 site (TAN-615 sewer line soil) is associated with a damaged 6-in. sanitary sewer line discovered during decontamination, decommissioning, and excavation of the north end of Building 615. Work crews identified soil overlying the damaged sanitary sewer line that was radiologically contaminated.
The TSF-48 site (soil beneath TAN-615 east and west pits/sumps) is in the south half of the former Building 615. The east pit/sump was located in the fuel assemblies test area. The west pit/sump was located in the decontamination area.
TAN-616 Caustic Tank (TSF-19 Site)—The TSF-19 site is a caustic tank that was the feed tank for providing caustic solution to neutralize the waste in the V-Tanks. The unit ceased operation in the late 1970s. Initial investigation in the 1990s indicated that the tank was empty, and the OU 1-10 ROD (DOE-ID 1999) identified TSF-19 as a no-action site. However, further investigation as part of the removal of Building 616 revealed that the TSF-19 caustic tank was not empty and that some radioactive contamination was present. Thus, the status of the tank was changed in accordance with the 2005 ESD (DOE-ID 2005).
4.2.1 Remedial Actions
The following subsections describe the remedy selection, RAOs, remedy implementation, and ongoing remedy scope for OU 1-10 sites. Remedial actions are discussed in three groups, as previously identified in Table 4-5.
4-29

4.2.1.1 Remedy Selection. The following paragraphs provide brief descriptions of the remedies selected for the OU 1-10 sites.
Soil Contamination Area South of the Turntable (TSF-06 Site, Area B) (Group 1)—The selected remedy for the soil contamination area south of the turntable was soil excavation and disposal. The remedy is consistent with previous removal actions at TAN and consolidates the low-level, radionuclide-contaminated soil/sediments in a centralized repository. Excavation involves removal of soil contaminated with Cs-137 above 23.3 pCi/g to a maximum depth of 10 ft and includes contaminated soil that may be identified under Snake Avenue as part of the TSF-06 site, Area B remedial action. Excavated soil will be disposed of at the ICDF. Confirmation sampling will be conducted to ensure that all contamination present above the final remediation goal is removed. The excavated areas will be backfilled with clean soil after excavation. Institutional controls are required until the site is available for unrestricted land use, and the site will be evaluated during five-year reviews.
TSF Disposal Pond (TSF-07 Site) (Group 1)—The TSF disposal pond will continue to receive wastewater until TSF ceases operation. The selected remedy for the disposal pond is limited action. The remedy is specific to implementing existing management practices, including institutional controls and environmental monitoring, and will continue until the agencies agree that the site no longer poses an unacceptable risk to human health and the environment. The limited action will address the low-level threat posed by the waste at the TSF-07 site. The major components of the limited-action designation included sampling soil, inspecting existing operational controls, implementing institutional controls as needed, and monitoring the environment for at least 100 years.
The selected remedy also includes installation of warning signs to prevent access. Although contamination will remain in place, the radioactivity will decay to less than unrestricted land use concentrations within the period of institutional controls. Implementation of institutional controls and environmental monitoring will be expanded to accommodate site-specific concerns as needed.
PM-2A Tanks Soil (TSF-26 Site) (Group 1)—The soil excavation and disposal tasks at the PM-2A tanks site will be completed as part of the Group 1 sites RD/RA work plan. Excavation will involve removing contaminated soil that is above the 23.3-pCi/g final remediation goal for Cs-137 to a maximum depth of 10 ft and then packaging and transporting the soil for disposal at the ICDF. The disposal also is applicable to the TSF-26 site’s stockpiles that were bagged to support post-ROD sampling activities. Using radiological screening, uncontaminated soil (those with activities less than the final remediation goal) will be stockpiled separately from the contaminated soil. Waste characterization sampling will be conducted on the stockpiled soil. Confirmation sampling will be conducted to ensure that all contamination above the final remediation goal is removed.
Based on the sampling results, uncontaminated soil will be placed over any remaining contaminated soil that is deeper than 10 ft to prevent further spread of contamination. Institutional controls will be evaluated based on the results of the verification sampling. Institutional controls will be maintained until the site is available for unrestricted land use and will be reevaluated during five-year reviews.
WRRTF Diesel Fuel Leak (WRRTF-13 Site) (Group 1)—The selected remedy for the WRRTF diesel fuel leak has been revised from the original remedy designated in the ROD.
A risk-based corrective action (RBCA) analysis was performed in 2000 using the State of Idaho RBCA guidance (DEQ-RBCA Document #2). The analysis showed that no remedial action was required for the WRRTF-13 site. The evaluation of the remedy was performed as specified in the 1999 OU 1-10
4-30

ROD and documented in the WRRTF-13 Calendar Year 2000 Sampling and Risk Based Corrective Action Analysis Summary Report (INEEL 2002c).
Based on the additional soil sample results and the RBCA analysis, no soil volume exceeded the action levels; therefore, this site became a no-action site. The evaluation of the new data and subsequent RBCA analysis based on a residential scenario is consistent with the ROD and has resulted in a determination that neither remedial actions nor institutional controls are required. The change in the remedy for the WRRTF-13 site is documented in the Explanation of Significant Differences for the Record of Decision for the Test Area North Operable Unit 1-10 (DOE-ID 2003c).
TSF Intermediate-Level (Radioactive) Waste Disposal System (V-Tanks) (TSF-09 Site) and Contaminated Tank Southeast of Tank V-3 (Tank V-9) (TSF-18 Site) (Group 2)—The two V-Tank sites (TSF-09 and TSF-18) have similar attributes and are located in the same area. Because of the similarities of the two sites, they were evaluated together for the ROD, and the same remedy was selected for both sites. The original remedy designated in the OU 1-10 ROD required that the V-Tanks’ contents be treated at an off-Site facility. After promulgation of the ROD, the off-Site treatment option became unavailable. An alternate remedy was approved in the 2004 ROD amendment and ESD (DOE-ID 2004c). An additional treatment option was approved in the 2005 ESD (DOE-ID 2005). The final remedy selected includes soil excavation and disposal, tank contents treatment, treated waste solidification, and disposal.
Caustic Tank V-4 (TSF-19 Site) (Group 2)—Further investigation as part of the removal of Building 616 and the TSF-46 new site revealed that the TSF-19 caustic tank was not empty and that some radioactive contamination was present. Video inspection of the inside of the tank revealed a significant heel was still present. As a result of finding waste within TSF-19, the status of the tank and surrounding soil will be changed from no action to remediation required in conjunction and consistent with the TSF-46 site that surrounds the TSF-19 caustic tank. The tank and contents will be removed, treated as necessary, and shipped to the ICDF or another approved disposal facility.
V-Tanks Area New Sites (TSF-46, TSF-47 and TSF-48 Sites) (Group 2)—The TSF-46, TSF-47, TSF-48, and the two V-Tank sites (TSF-09 and TSF-18) have similar COCs in the soil based on historical data (see the Group 3 Remedial Design/Remedial Action Work Plan Addendum 1 for PM-2A Tank Removal and Site Remediation for the Test Area North, Waste Area Group 1, Operable Unit 1-10 [DOE-ID 2004d]) and are located in the same area just north of the TAN-607 facility. As a result, the same remedy and final remediation goal as the V-Tanks soil is being implemented for these new sites: the soil will be excavated and disposed of at the ICDF, and confirmation sampling will be performed to ensure that the final remediation goal designated in the 1999 OU 1-10 ROD (DOE-ID 1999) is met. If the final remediation goal cannot be achieved, institutional controls will be applied.
The treatment process for the V-Tanks waste may be a multistage process and will be conducted ex situ at the V-Tanks site or in adjacent areas. The selected treatment option may include air sparging at ambient or elevated temperatures (up to and including boiling temperatures); chemical oxidation/reduction, as necessary, if the air sparging does not meet the land disposal restrictions (LDRs); and solidification. Laboratory studies will be conducted to optimize the sparging parameters and the choice of specific oxidant(s) or reductant(s). Solidification of the V-Tanks consolidated waste will be necessary to meet ICDF acceptance criteria.
PM-2A Tanks and Contents Removal (TSF-26 Site) (Group 3)—The original selected remedy for the PM-2A tanks was to remove the tank contents using a vacuum and to treat and dispose of the waste. The remedy was modified in the ROD amendment and ESD (DOE-ID 2004c) to removal of the tanks intact without prior removal of the contents. The remedy was further modified in the January 2005
4-31

ESD (DOE-ID 2005) to address disposal of V-13 at the ICDF without treatment and both treatment and disposal of the V-14 tank at the ICDF.
Plans originally called for the contents of the tanks to be treated through thermal desorption or chemical oxidation/reduction to reduce the PCE to meet LDRs and disposal facility waste acceptance criteria. A later review suggested that sparging also might be effective in reducing the levels of contaminants in the waste. Treatment studies will be conducted as necessary to select and refine the most appropriate treatment option. After treatment, the tank contents will be resampled to confirm compliance with LDRs and the applicable disposal facility’s waste acceptance criteria. The tanks and treated contents will be transported to the ICDF or another approved facility for disposal.
WRRTF Burn Pits II and IV (WRRTF-01 Site) (Group 3)—When the OU 1-10 ROD was signed, the only COC identified at the burn pits was lead; thus, the ROD required native soil covers on Pits I, II, and IV. In 2000/2001, however, asbestos was detected in Pits II and IV during additional sampling that was part of a characterization investigation (DOE-ID 2003e). However, asbestos was not evaluated in the human health risk evaluation.
The post-ROD characterization measured asbestos above action levels in Pits II and IV. Asbestos at >1% by volume is a regulatory and health and safety concern. The 2003 ESD (DOE-ID 2003c) reflects the change in the COCs from lead to asbestos while maintaining the remedy of a native soil cover for Pits II and IV.
The 2000/2001 additional investigation did not identify asbestos in Pit I, and lead was not identified above the EPA Region 9 residential PRG during the post-ROD characterization. Based on this information, Pit I does not require a native soil cover, and there are no restrictions on the use of the area. The remedy for Pit I was changed to no action.
Likewise, the 2000/2001 additional characterization investigation did not identify asbestos as being present in Pit III and confirmed that lead concentrations were below the EPA Region 9 residential PRG. Thus, the Pit III site is available for unrestricted use, and no remedial action is required.
The remedy for Pits II and IV required a soil cover followed by institutional controls (including implementation of institutional control signs) based on the presence of asbestos above action levels. Institutional controls are necessary in order to maintain the soil cover and prevent intrusion. Environmental monitoring is not necessary for sites where asbestos is the only cause for remediation. Pits I and III are no-action sites, and neither remedial actions nor institutional controls are required for them. Changing the remedy for Pit I to no action reduces the area and extent of the native soil cover. The April 2003 ESD (DOE-ID 2003c) detailed the changes in the remediation for the WRRTF burn pits.
TSF Burn Pit (TSF-03 Site) (Group 3)—The original remedy selected in the 1999 OU 1-10 ROD for the TSF burn pit was a native soil cover to address the low-level threat posed by waste in the pit. The major component of the selected remedy included sampling to determine the cover design and the monitoring necessary to ensure that the remedy is protective and to compare costs of the soil cover and long-term monitoring with the excavation and disposal option. The remedy also included adding uniform layers of clean soil and surface vegetation to limit direct contact with the lead-contaminated soil if the soil cover option was finalized. Inspections of existing institutional controls also were included to assess their adequacy.
4-32
The 1999 OU 1-10 ROD contingent remedy was excavation and disposal of lead-contaminated soil. Under the contingency, contaminated soil exceeding the remediation goal would be removed and disposed of, and the excavation would be backfilled with clean soil. The contaminated soil would not be treated and would be disposed of at the ICDF.
The April 2003 ESD (DOE-ID 2003c) detailed a change in the remedy for the burn pit. The ESD identified the change in remedy from installation of a native soil cover to the contingent remedy of excavation and disposal. The basis for the remedy change is that the original remedy of a soil cover with long-term monitoring was more costly than the contingent remedy of excavation and disposal. The 2000/2001 additional characterization investigation sampling measured and confirmed that the lead concentrations were above the EPA Region 9 residential PRG of 400 mg/kg (DOE-ID 2003e).
Mercury Spill Area (TSF-08 Site)—No remedy was selected in the 1999 OU 1-10 ROD for the mercury spill area. The ROD stated that a treatability study would be conducted to evaluate plant uptake factors and rates for phyotoremediation specific to the INL Site. A revised risk analysis would be developed using site-specific data. In the April 2003 ESD (DOE-ID 2003c), the TSF-08 mercury spill area was transferred from OU 1-10 to OU 10-08 within WAG 10. The transfer to WAG 10 was based on an agency agreement that the TSF-08 site should be included under the OU 10-08 RI/FS and future ROD. Because the site has been transferred to OU 10-08, no remediation tasks, remedial action scope, or remedial actions remain.
Institutional Control Sites—The ROD (DOE-ID 1999) identified 94 sites as potential release sites. Of the 94 sites, 83 were identified as being no-action sites (where land use is unrestricted) or no-further-action sites (where institutional controls are required to restrict land use in the future). For the eight sites scheduled for remedial action, institutional controls were implemented, and the continuation of institutional controls will be determined after remediation. Two sites, TSF-23 and TSF-05, are associated with the groundwater contamination, and institutional controls have been implemented at those sites. One site, TSF-08, was selected for a treatability study under WAG 10, but institutional controls have been implemented and maintained with the other WAG 1 sites. The ROD amendment and ESD (DOE-ID 2004c) noted that the TSF-06 site, Area 10, which had been designated as a no-action site, was reclassified as a no-further-action site that requires institutional controls. Institutional controls are in place at all sites identified in the 1999 OU 1-10 ROD. A brief description of the objectives of the institutional controls for each of the WAG 1 sites is provided below.
• Burn Pit (TSF-03 Site)—Limit exposure to contaminated soil, and maintain the integrity of native cover and/or engineered cover.
• TAN Injection Well (TSF-05 Site)—Prevent consumption and use of groundwater below the MCL and/or 1E-04 risk.
• Area Northeast of Turntable (TSF-06 Site, Area 1)—Limit exposure to contaminated soil, and ensure that land use is appropriate.
• Radioactive Soil Berm (TSF-06 Site, Area 5)—Limit exposure to contaminated soil, and ensure that land use is appropriate.
• Reactor Vessel Burial Site (TSF-06 Site, Area 10)—Limit exposure to contaminated soil, and ensure that land use is appropriate.
• Contaminated Ditch (TSF-06 Site, Area 11)—Limit exposure to contaminated soil, and ensure that land use is appropriate.
4-33

• Disposal Pond (TSF-07 Site)—Limit direct exposure to radiologically contaminated soil, and ensure that land use is appropriate.
• Mercury Spill (TSF-08 Site)—Limit exposure to contaminated soil, and ensure that land use is appropriate.
• Tanks V-1, V-2, and V-3 (TSF-09 Site)—Limit direct exposure to radiologically contaminated soil, and ensure that land use is appropriate.
• Drainage Pond (TSF-10 Site)—Limit exposure to contaminated soil, and ensure that land use is appropriate.
• Tank V-9 (TSF-18 Site)—Limit direct exposure to radiologically contaminated soil, and ensure that land use is appropriate.
• Groundwater Contamination (TSF-23 Site)—Prevent consumption and use of groundwater below the MCL and/or 1E-04 risk.
• PM-2A Area (TSF-26 Site)—Limit direct exposure to radiologically contaminated soil, and ensure that land use is appropriate.
• Sewage Treatment Plant (TSF-28 Site)—Limit exposure to contaminated soil, and ensure that land use is appropriate.
• Acid Pond (TSF-29 Site)—Limit exposure to contaminated soil, and ensure that land use is appropriate.
• Asbestos Gravel Pit (TSF-39 Site)—Limit exposure to contaminated soil, and ensure that land use is appropriate.
• Contaminated Pipe (TSF-42 Site)—Limit exposure to contaminated soil, and ensure that land use is appropriate.
• Radioactive Parts Security Storage Area Building and Pad (TSF-43 Site)—Limit exposure to contaminated soil, and ensure that land use is appropriate.
• IET Stack Rubble Site (IET-04 Site)—Limit exposure to contaminated soil, and ensure that land use is appropriate.
• Burn Pits (WRRTF-01 Site)—Limit exposure to contaminated soil, and maintain the integrity of the native cover and/or engineered cover.
• WRRFT Fuel Leak (WRRTF-13 Site)—Limit exposure to contaminated soil, and maintain the integrity of the native cover and/or engineered cover.
During implementation of institutional controls at TAN in 2000, the following land use assumptions were made:
• The INL will remain under government management and control through the 100-year scenario.
4-34

• No residential development (i.e., housing) will occur within INL Site boundaries. Grazing will be allowed to continue in the buffer area.
• No new major, private developments (residential or nonresidential) on public lands are expected in areas adjacent to the INL Site.
These assumptions led the DOE-ID to conclude that TAN would remain under restricted industrial until at least 2095.
4.2.1.2 Remedial Action Objectives. This subsection summarizes the RAOs identified in the 1999 OU 1-10 ROD (DOE-ID 1999) and significant changes to the RAOs in subsequent decision documents. Complete details of the RAOs are presented in the 1999 OU 1-10 ROD, and the revised RAOs are presented in the 2004 ROD amendment and ESD (DOE-ID 2004c).
The RAOs for the V-Tanks and V-Tank new sites are based on results of the human health risk assessment and are specific to the COCs and exposure pathways developed for OU 1-10. The 1999 OU 1-10 ROD and the ROD amendment (DOE-ID 2004c) established RAOs for the V-Tanks.
The RAO for the V-Tanks area soil is to reduce risk from all pathways and all COCs to a total excess cancer risk of less than 1 in 10,000 and a total hazard index of less than 1 for the hypothetical resident 100 years in the future and for the current and future worker. The RAO for the V-Tank contents is to prevent release to the environment of the V-Tank contents.
The RAOs for the TSF-06 (Area B), TSF-26, TSF-07, and WRRTF-13 soil are as follows:
• Reduce risk from external radiation exposure from Cs-137 to a total excess cancer risk of less than 1 in 10,000 for the hypothetical resident 100 years in the future and the current and future worker
• Prevent exposure to petroleum hydrocarbon constituents in accordance with the State of Idaho RBCA guidance (only applies to WRRTF-13)
• Prevent direct exposure to lead at concentrations over 400 mg/kg, the EPA residential screening level for lead (only applies to TSF-03).
The RAO for the PM-2A tanks’ (V-13 and V-14) contents is to prevent release to the environment of the PM-2A tanks’ contents.
4.2.1.3 Remedy Implementation. The following paragraphs briefly describe remedy implementation at the OU 1-10 sites.
Soil Contamination Area South of the Turntable (TSF-06 Site, Area B) (Group 1)—In 2000, this site was cleared and prepared for remediation activities. Initial soil sampling and analysis were performed for the contaminated area, excluding the area under Snake Avenue. Additional radiological field screening was used to delineate the boundaries of the contamination. The areas above the 3-pCi/g screening action level were marked. Surface soil samples were collected and analyzed from hot spots. Overburden was removed, additional field screening was performed, and soil with contamination levels greater than the final remediation goal was placed in soil bags for disposal, while soil with contamination levels less than the final remediation goal was stockpiled separately. Soil bags were initially stored during preparation of waste determinations and waste profiles, allowing the soil bags to then be disposed of at the RWMC.
4-35

In 2003, additional pre-excavation soil samples were collected and analyzed from selected areas, and additional field screening was performed to delineate the boundaries of the contaminated areas. Excavation drawings (dig maps) were prepared using the results of the soil sampling and field screening. Soil excavation was only partially completed by November 2003. A prefinal inspection visit was conducted with the agencies on November 20, 2003.
Soil excavation resumed in 2003 and was completed in the spring of 2004. Confirmation sampling also was performed in 2004 to verify that the remedial action met the final remediation goal. Contaminated soil was disposed of at the ICDF. The excavation area was backfilled, restored, contoured, and graded. The post-excavation prefinal inspection was conducted on June 25, 2004. Institutional controls were maintained after completion of the remedial action.
Remedial action scope remaining for the TSF-06 site, Area B includes completing the disposal of secondary waste at the ICDF and providing notice to the Long-Term Stewardship Program to revise the Sitewide operations and maintenance plan to address monitoring for and control of noxious weeds.
All documents for the TSF-06 site, Area B remediation have been completed except for the prefinal inspection report and the OU 1-10 Groups 1 and 3 remedial action report. The remedial action report will include a detailed discussion of all remedial action activities, confirmation sampling results to address the final remediation goal, and any application of institutional controls.
TSF Disposal Pond (TSF-07 Site) (Group 1)—The limited-action remedy for the TSF disposal pond was implemented via the Remedial Design/Remedial Action Work Plan for Group 3, PM-2A Tanks and Burn Pits for Test Area North, Waste Area Group 1, Operable Unit 1-10 for Group 1 sites (DOE-ID 2003g). It was determined that sampling for a no-longer-contained-in determination was not required, and institutional controls were implemented in 2001. Annual radiological surveys around the perimeter of the disposal pond also were implemented in 2001.
When use of the disposal pond ceases (expected in about 2012), the existing institutional controls and monitoring will be evaluated, and, if deemed appropriate, the institutional controls and monitoring will be revised with new, upgraded practices and controls. Details of institutional control requirements at the disposal pond are in the INEEL Sitewide Institutional Controls Plan (DOE-ID 2004b). Details of the radiological monitoring are detailed in the INEEL Sitewide Operations and Maintenance Plan for CERCLA Response Actions (DOE-ID 2004g).
Remaining limited action scope for the disposal pond includes annual site radiological surveys, review of administrative and institutional controls, and future five-year reviews. Specific future tasks also include the following:
• Further assessment after discharge to the pond ceases (expected in about 2012)
• Sampling in 2071 to verify the site is available for unrestricted land use.
Outstanding documents related to the future tasks indicated above include the following:
• Reports associated with the annual surveys, institutional control update reports, future five-year reviews, and the results of the 2071 surveys
• OU 1-10 Groups 1 and 3 remedial action report
4-36
• Field sampling plan (FSP) for further assessment after discharge to the pond ceases and the planned sampling in 2071.
PM-2A Tanks Soil (TSF-26 Site) (Group 1)—In 2000, prior to the excavation of any soil for the remediation of the PM-2A soil, the area was cleared and prepared for remediation activities and included an initial radiation survey. Initial post-ROD soil sampling and analysis of the soil stockpiles were performed in accordance with the FSP. After the initial analytical results were received, the soil stockpiles were removed and placed in soil bags. Radiological field screening delineated the boundaries of the contaminated areas. Surface soil samples were collected from radiological hot spots, and the samples were submitted for analysis. Results of the analysis were submitted to the agencies. The bags of soil were initially stored before disposal at the RWMC.
In 2003, additional pre-excavation soil samples were collected and analyzed from selected areas. Additional field screening was performed to delineate the boundaries of the contaminated areas. Excavation drawings (dig maps) were prepared using the results of the soil sampling and field screening. From the November 2003 prefinal inspection by the agencies, it was determined that the confirmation approach was inadequate and that additional confirmation sampling needed to be performed in 2004. Excavation and transportation of soil to the ICDF were curtailed by the end of November 2003 and did not resume until April 2004.
In 2004, excavation resumed and confirmation sampling was performed to verify that all soil above the final remediation goal of 23.3 pCi/g for Cs-137 had been removed. Contaminated soil was disposed of at the ICDF. The excavation area was photographed and backfilled with clean soil, and the excavation area was surveyed for the record. Six inches of topsoil was placed over the backfilled area. The requirement for revegetation was deleted in accordance with agency agreement on November 2, 2004. The prefinal inspection site visit by the agencies was conducted on September 8, 2004.
Remaining scope for the TSF-26 site tanks soil includes completing the disposal of secondary waste and providing notice to the Long-Term Stewardship Program that previously established institutional controls are to continue. All documents for the tanks’ soil remediation have been completed, except for the following:
• Prefinal inspection report
• OU 1-10 Groups 1 and 3 remedial action report, which will include a detailed discussion of all remedial action activities, confirmation sampling results, and any application of institutional controls.
WRRTF Diesel Fuel Leak (WRRTF-13 Site) (Group 1)—Using the results of post-ROD sampling and a further risk assessment for the WRRTF diesel fuel leak (INEEL 2002c), WRRTF-13 has been revised to a no-action site. No additional scope items remain to be completed (DOE-ID 2003c).
All documents for the WRRTF diesel fuel leak no-action site have been completed, except for the OU 1-10 Groups 1 and 3 remedial action report, which will include a discussion of the remedy change and sampling results to designate WRRTF-13 as a no-action site.
TSF Intermediate-Level (Radioactive) Waste Disposal System (V-Tanks) (TSF-09 Site) and Contaminated Tank Southeast of Tank V-3 (Tank V-9) (TSF-18 Site) (Group 2)—Additional sampling of the contents of the V-9 tank was performed in April 2001. The RD/RA work plan was finalized in November 2001 to implement the original remedy for the V-Tanks (DOE-ID 2001b). However, in early 2002, a review was conducted to reassess the remedy and path forward for the V-Tanks
4-37

due to the loss of the off-Site treatment facility in late 2001. Based on the review, the agencies agreed that the remedy options should be reevaluated. The waste treatment technology evaluation concluded that chemical oxidation was the most viable alternative for treatment of the V-Tank contents. The results of the technology evaluation and the new preferred alternative of contents removal and on-Site treatment were summarized in the April 2003 New Proposed Plan for the V-Tanks Contents (TSF-09 and TSF-18) at Test Area North, Operable Unit 1-10 (DOE-ID, EPA, and DEQ 2003). The selection of the new remedy was reported in the V-Tanks ROD amendment (DOE-ID 2004c).
In 2003, laboratory and bench-scale testing was conducted to determine the chemical oxidation and stabilization parameters for V-Tanks waste treatment. The testing concluded that a chemical oxidation system based on hydrogen peroxide would destroy most of the VOCs (including PCB arochlor-1260) in the V-Tanks waste. In addition, soil sampling and analysis were performed in 2003 to further delineate or bound the extent of soil contamination in the area of contamination under an addendum to the V-Tanks RD/RA work plan.
In 2004, initial tasks completed included system mockup testing. The mockup testing demonstrated sludge removal equipment and equipment efficacy, resulted in modifications of the equipment, and incorporated the changes into a revised design. The excavation to the top of the V-Tanks was completed, and the associated piping was removed. Additional laboratory testing also concluded that VOCs would likely be successfully separated from the overall waste matrix with only air or oxygen sparging at elevated temperatures without supplemental chemical oxidation, thus allowing for a simplified cleanup strategy.
The remaining remedial actions for the TSF-09 and TSF-18 sites include Phase 1 equipment installation in addition to treatment, tank removal, soil excavation and disposal, backfilling, and final reporting. A prefinal inspection will be conducted after the integrated system operability and leak testing is completed.
With the completion of final equipment assembly and testing, the waste from the V-Tanks will be transferred to consolidation tanks. The empty V-Tanks will then be flushed and rinsed. Once the waste is in the consolidation tanks, Phase 1 treatment will begin with air sparging at ambient temperature. The sparged waste will be recirculated between the consolidation tanks. If the air sparging does not treat the VOCs sufficiently to achieve the LDR requirements, then additional treatment using chemical oxidation/reduction methods will be utilized until the LDR requirements are met. If chemical oxidation is needed, then Addendum 3 to the Group 2 V-Tanks RD/RA work plan will be prepared.
After Phase 1 treatment by air sparging is completed, the sparged waste will be sampled and analyzed. If the treated waste is not characteristic and meets the LDR treatment standards, then the treated waste will be solidified and transported to the ICDF for disposal.
After the waste has been completely transferred from the V-Tanks and the tanks have been flushed and rinsed, they will be removed from the excavation. All contaminated soil at the site will be excavated, and confirmation sampling will be performed to ensure that the final remediation goal has been met. After any additional excavation necessary to remove the contaminants, the excavation will be backfilled with clean soil to the original land surface. The excavated contaminated soil and the empty V-Tanks will be transported to the ICDF for disposal.
The TSF-09 and TSF-18 remedial action documents that need to be completed include the following:
• Prefinal inspection report
4-38

• Group 2 V-Tanks RD/RA work plan Addendum 3 (if necessary)
• OU 1-10 Group 2 remedial action report, which will include a detailed discussion of all remedial action activities, confirmation sampling results to address the final remediation goal, and any continued application of institutional controls.
Caustic Tank V-4 (TSF-19 Site) (Group 2)—The V-4 caustic tank was removed and placed into CERCLA storage as part of an activity conducted in conjunction with Building 616 decontamination and dismantlement. Liquid in the tank was removed after the tank was placed in storage, and both the liquid and the caustic heel in the tank were sampled.
The remaining scope for the V-4 caustic tank includes making a final waste determination, preparing a waste profile, and disposing of the liquid and the tank.
Remedial action documents that need to be completed for the V-4 caustic tank include the following:
• Prefinal inspection report
• OU 1-10 Group 2 remedial action report, which will include a detailed discussion of the actions taken to characterize and dispose of the tank and contents.
V-Tanks New Sites (TSF-46, TSF-47, and TSF-48 Sites) (Group 2)—Soil excavation began with the demolition of Building 616. Soil was excavated at various stages to provide access to the foundation of the building below grade surface. The contaminated soil around Building 616 was stockpiled and ultimately disposed of at the ICDF in 2004.
Characterization samples were obtained from the soil beneath the building foundation in the pump room and evaporator pit areas. The soil in those areas is radiologically contaminated and was bagged and staged pending shipment to the ICDF.
The remaining scope to complete the remedial actions for the TSF-46, TSF-47, and TSF-48 sites includes soil excavation and disposal, backfilling, and final reporting. All contaminated soil at the sites will be excavated, and confirmation sampling will be performed to ensure that the final remediation goal has been met.
Remedial action documents that need to be completed for the new sites include the following:
• Prefinal inspection report
• OU 1-10 Group 2 remedial action report, which will include a detailed discussion of all remedial action activities, confirmation sampling results to address the final remediation goal, and continuing application of institutional controls.
All remedy activities will be included in the Group 2, V-Tanks prefinal inspection report and remedial action report.
4-39
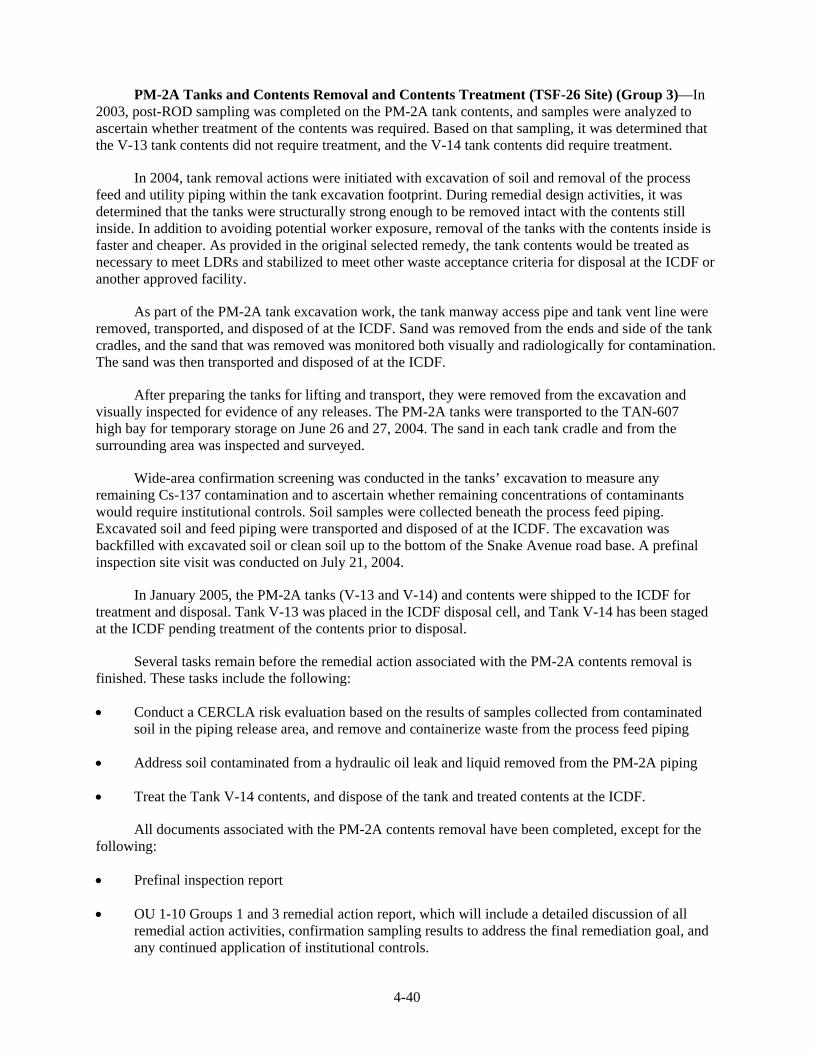
PM-2A Tanks and Contents Removal and Contents Treatment (TSF-26 Site) (Group 3)—In 2003, post-ROD sampling was completed on the PM-2A tank contents, and samples were analyzed to ascertain whether treatment of the contents was required. Based on that sampling, it was determined that the V-13 tank contents did not require treatment, and the V-14 tank contents did require treatment.
In 2004, tank removal actions were initiated with excavation of soil and removal of the process feed and utility piping within the tank excavation footprint. During remedial design activities, it was determined that the tanks were structurally strong enough to be removed intact with the contents still inside. In addition to avoiding potential worker exposure, removal of the tanks with the contents inside is faster and cheaper. As provided in the original selected remedy, the tank contents would be treated as necessary to meet LDRs and stabilized to meet other waste acceptance criteria for disposal at the ICDF or another approved facility.
As part of the PM-2A tank excavation work, the tank manway access pipe and tank vent line were removed, transported, and disposed of at the ICDF. Sand was removed from the ends and side of the tank cradles, and the sand that was removed was monitored both visually and radiologically for contamination. The sand was then transported and disposed of at the ICDF.
After preparing the tanks for lifting and transport, they were removed from the excavation and visually inspected for evidence of any releases. The PM-2A tanks were transported to the TAN-607 high bay for temporary storage on June 26 and 27, 2004. The sand in each tank cradle and from the surrounding area was inspected and surveyed.
Wide-area confirmation screening was conducted in the tanks’ excavation to measure any remaining Cs-137 contamination and to ascertain whether remaining concentrations of contaminants would require institutional controls. Soil samples were collected beneath the process feed piping. Excavated soil and feed piping were transported and disposed of at the ICDF. The excavation was backfilled with excavated soil or clean soil up to the bottom of the Snake Avenue road base. A prefinal inspection site visit was conducted on July 21, 2004.
In January 2005, the PM-2A tanks (V-13 and V-14) and contents were shipped to the ICDF for treatment and disposal. Tank V-13 was placed in the ICDF disposal cell, and Tank V-14 has been staged at the ICDF pending treatment of the contents prior to disposal.
Several tasks remain before the remedial action associated with the PM-2A contents removal is finished. These tasks include the following:
• Conduct a CERCLA risk evaluation based on the results of samples collected from contaminated soil in the piping release area, and remove and containerize waste from the process feed piping
• Address soil contaminated from a hydraulic oil leak and liquid removed from the PM-2A piping
• Treat the Tank V-14 contents, and dispose of the tank and treated contents at the ICDF.
All documents associated with the PM-2A contents removal have been completed, except for the following:
• Prefinal inspection report
• OU 1-10 Groups 1 and 3 remedial action report, which will include a detailed discussion of all remedial action activities, confirmation sampling results to address the final remediation goal, and any continued application of institutional controls.
4-40

WRRTF Burn Pits II and IV (WRRTF-01 Site) (Group 3)—In 2000/2001, additional sampling and analysis of soil samples occurred to assess the burn pits for additional COCs. Based on the sampling, a risk assessment was performed and a recommendation was made to change the COC from lead to asbestos. The original remedy was to continue with the revised COCs.
In 2004, site preparation began, and soil cover construction revisions were made to Pits II and IV. The low areas of the soil cover were filled and compacted with clean native soil to provide a minimum of 2 ft of cover over the waste material. The cover surfaces were contoured to provide natural drainage away from the pits, and granite monuments were placed to mark the pit boundaries. A prefinal inspection site visit was conducted with the agencies on July 21, 2004. Revegetation of the WRTTF burn pit was completed in the late fall of 2004.
To complete the remedial actions associated with the burn pits, the following tasks will be performed:
• The Long-Term Stewardship Program will be notified when remediation is complete and will be informed that the institutional controls need to be modified based on the remedy change
• The Sitewide institutional controls plan and the Sitewide operations and maintenance plan should be revised, and a requirement for monitoring and maintenance of the revegetated area for regrowth should be added.
All documents for the WRRTF-01 burn pits’ remediation have been completed, except for the following:
• Prefinal inspection report
• OU 1-10 Group 1 and 3 remedial action report, which will include a detailed discussion of all remedial action activities and the removal or continued application of institutional controls.
TSF Burn Pit (TSF-03 Site) (Group 3)—In 2001, additional sampling and analysis were performed to ascertain whether additional COCs that might not have been evaluated during the remedial investigation needed to be considered. Based on the sample results, a human health risk evaluation was conducted and showed dioxins and furans in addition to lead in the burn pit soil. As documented in the April 2003 ESD (DOE-ID 2003c), the remedial action was changed from placement of a native soil cover to excavation of the soil and disposal at the ICDF.
In 2004, the soil and debris were excavated from the burn pit. The extent of the excavation was initially based on visual evidence of the burn pit layer and the underburden. Clean soil was stockpiled for later use. X-ray fluorescence field analysis was used to confirm that the excavation had removed the lead-contaminated soil. Confirmation soil sampling was conducted, and the samples were analyzed to confirm that soil above the final remediation goal and ROD-identified contaminants (lead, dioxins, furans, PCBs, and chromium) had been removed. Field screening for gamma radiation also was performed. The results of the soil samples and a risk comparison concluded that the primary contaminants had been removed and the site could be released for unrestricted use. A prefinal inspection was conducted with the agencies on June 25, 2004. Contaminated soil and debris excavated from the burn pit were disposed of at the ICDF. The excavation was backfilled and compacted with clean stockpiled soil and soil from the TAN gravel pit. The backfilled excavation was contoured, and 6 in. of topsoil was placed over the surface. Revegetation of the TSF-03 burn pit was completed in the late fall of 2004.
4-41

Completion of the remedial actions associated with the burn pit requires the following:
• Complete a data summary engineering design file (EDF) report that includes the land survey and confirmation sampling results, as-built information, extent of soil excavation, and quantities of contaminated soil removed
• Provide notice to the Long-Term Stewardship Program that since contaminated soil has been removed, institutional controls are no longer required and the Sitewide institutional controls plan and the Sitewide operations and maintenance plan should be revised to reflect this change
• Requirements for inspection of the native soil cover can be deleted, but monitoring and maintenance of the revegetated area for regrowth need to be added to the Sitewide operations and maintenance plan.
All documents for the TSF-03 burn pit remedial actions have been completed, except for the following:
• Prefinal inspection report
• OU 1-10 Group 1 and 3 remedial action report, which will include a detailed discussion of all remedial action activities, confirmation sampling results to address the final remediation goal, and the removal of institutional controls.
4.2.2 Data Evaluation
4.2.2.1 Site Inspections. Operations, maintenance, and institutional control inspections are conducted annually at WAG 1 sites. The following is a summary of annual inspections conducted at WAG 1 sites within the timeframe of this five-year review.
In accordance with EPA guidance, institutional control inspections were required within 6 months of signature of the ROD and were completed in May 2000 (DOE-ID 2000e). Yearly inspections of institutional controls have been completed since then and reported in the following documents:
• The 2001 Institutional Controls Inspection, Environmental Monitoring, and Site Maintenance Report for Waste Area Group 1 (DOE-ID 2001e)
• The 2002 Institutional Controls Inspection, Environmental Monitoring, and Site Maintenance Report for Waste Area Group 1 (DOE-ID 2002d)
• FY 2003 Institutional Controls Assessment Report for Waste Area Group 1 (DOE-ID 2003h).
In 2004, institutional controls at the INL Site were compiled into the INEEL Sitewide Operations and Maintenance Plan for CERCLA Response Actions (DOE-ID 2004g). The initial Sitewide inspection was reported in the INEEL Sitewide Institutional Controls Annual Report - FY 2004 (DOE-ID 2004h).
No deficiencies have been noted during the interval covered by this five-year review. Remedial activities have progressed and are nearing completion at many sites. When the hazards at a site are removed and the site qualifies for unrestricted use, institutional controls will be removed. At the time of this review, the TSF-03 site, a former burn pit, has been remediated such that the hazards have been removed. That site will qualify for removal of institutional controls pending completion of closure documentation.
4-42

Operations and maintenance activities at WAG 1 consist of annual inspections for subsidence, erosion, and evidence of animal intrusion at the TSF-03, TSF-06 (Area B), TSF-07, TSF-09, TSF-18, TSF-26, and WRRTF-01 sites. In addition, a radiological survey around the perimeters of the TSF-06 (Area B), TSF-07, TSF-09, TSF-18, and TSF-26 sites is completed annually. In 2002, subsidence was observed in boreholes from earlier sampling efforts at the TSF-03 and WRRTF-01 burn pits. Repairs were subsequently performed, and no other maintenance activities were necessary within the timeframe of this five-year review.
4.2.2.2 Cleanup Results. The confirmation sampling and analysis were completed for the TSF-03, TSF-06, and TSF-26 sites’ soil areas to verify that the final remediation goals were met. The analytical data accumulated from these sampling events will be summarized and reported in the Group 1 and 3 remedial action report. The results of sampling for PM-2A Tank V-13 contents and of post-treatment confirmation sampling for PM-2A Tank V-14 contents also will be summarized and reported in the Group 1 and 3 remedial action report. All data obtained from ongoing remedial actions (TSF-09/18, TSF-46, TSF-47, TSF-48, and TSF-19) will be reported in the Group 2 remedial action report.
4.2.3 Progress since Last Review
This is the first five-year review of OU 1-10.
4.2.4 Technical Assessment
Question A: Is the remedy functioning as intended by the decision documents?
For the sites where remedial actions have been completed (TSF-03, TSF-06 Area B, TSF-26 PM-2A tanks site soil excavation and removal, and WRRTF-01) the remedies have been implemented as specified in the decision documents. At the TSF-03, TSF-06, and TSF-26 sites, excavation and confirmation sampling are completed, and the areas have been backfilled as required. Native soil covers have been completed for Burn Pits II and IV within the WRRTF-01 site, and Pits I and III have been identified as no-action sites that require no remedial actions. Institutional controls are in place and functioning as intended for the TSF-06, TSF-26, and WRRTF-01 sites. A more detailed discussion of the functionality of the remedial actions and the results of soil sampling will be included in the final remedial action report.
Institutional controls are in place and functioning as intended at the TSF-08 site pending further assessment under OU 10-08.
At sites where remedial actions are still in progress (TSF-09/18, TSF-19, TSF-46, TSF-47, TSF-48, and TSF-26 [PM-2A tank and contents removal and, as necessary, treatment as necessary]), remedial actions are being implemented in accordance with the OU 1-10 decision documents. At the TSF-26 site, the PM-2A tanks have been removed from the ground and shipped to the ICDF. Tank V-14 has been disposed of, and treatment of Tank V-14 is pending. Ongoing remediation at the TSF-09/18, TSF-19, TSF-46, TSF-47, and TSF-48 sites is being performed in accordance with the respective RD/RA work plans and addendums. A more detailed discussion of the functionality of the remedial actions and the results of soil sampling will be reported in the final remedial action report.
Remedial actions are in progress for six OU 1-10 sites, and the remedial actions are complete for four sites, with the remedial action report pending. The requirements have been implemented and are functioning at two sites where monitoring and/or institutional controls are the only requirements. For the two OU 1-10 sites with no-action requirements (no remedial action, monitoring, or institutional controls are required), a response to Question A is not applicable, because no action was necessary. At sites where
4-43

remediation is continuing, access controls are in place to prevent unnecessary exposure to contaminants. A final assessment of the functionality of all “pending” and “to be determined” OU 1-10 remedies will be discussed in the next Sitewide five-year review report.
Question B: Are the exposure assumptions, toxicity data, cleanup levels, and remedial action objectives used at the time of the remedy still valid?
Several changes have been made to the exposure assumptions, toxicity data, cleanup levels, and RAOs associated with OU 1-10 remedial action activities. The changes are summarized in the following paragraphs.
TSF Burn Pit (TSF-03 Site)—The original remedy specified in the 1999 OU 1-10 ROD required a native soil cover and long-term monitoring for this pit. The 2003 ESD to the ROD changed the remedy from a native soil cover and monitoring to excavation of the contaminated soil from the pit and disposal (DOE-ID 2003c).
Reactor Vessel Burial Site (TSF-06 Site, Area 10)—The original remedy determined this to be a no-action site. Based on a reevaluation of the data, the 2004 ESD to the ROD revised the remedy to no further action (DOE-ID 2003c) with appropriate ongoing institutional controls, monitoring, and maintenance, because the risk at the site precluded unrestricted land use. The remedy has been revised, and the appropriate institutional controls, monitoring, and maintenance have been implemented.
WRRTF Burn Pits I, II, III, and IV (WRRTF-01 Site)—Additional soil sampling and analysis took place in 2000/2001 in Pits II and IV to assess the soil for additional COCs. Based on the sampling, a risk assessment was performed and a recommendation was made to change the COC from lead to asbestos. This change to the exposure pathway and RAO, as documented in the 2003 ESD to the ROD (DOE-ID 2003c), changed the remedy from native soil covers for all four burn pits to soil covers for Pits II and IV only. Asbestos and lead above the EPA residential PRG were not detected in Pits I and III; therefore, Pits I and III became no-action sites.
WRRTF Diesel Fuel Leak (WRRTF-13 Site)—The exposure assumption and cleanup levels associated with the WRRTF-13 site changed based on the RBCA evaluation of the diesel contaminants. As discussed in the 2003 ESD to the ROD (DOE-ID 2003c), the remedy of soil excavation and land farming of the contaminated soil was changed to no remedial action required for the site, because no soil volume exceeded the action levels.
As discussed in Section 4.2.1, “Remedial Actions,” the exposure assumptions, toxicity data, cleanup levels, and RAOs have not changed for the TSF-06 (Area B), TSF-07, TSF-09, TSF-18, TSF-26, TSF-46, TSF-47, and TSF-48 sites.
Question C: Has any other information come to light that could call into question the protectiveness of the remedy?
No.
4.2.5 Technical Assessment Summary
Remedial actions have been completed at the TSF-03 (burn pits), TSF-06 (Area B), TSF-26 (PM-2A tanks soil excavation and removal), and WRRTF-01 sites. No changes in the physical conditions of these sites have occurred that would affect the protectiveness of the remedies, and there have been no changes in the toxicity factors or risk factors for the COCs. Remedial actions are still in progress at the
4-44

TSF-09/18, TSF-19, TSF-26, (PM-2A tank [V-14] contents treatment), TSF-46, TSF-47, and TSF-48 sites. Through determinations made in decision documentation, the selected remedies for the TSF-08 and WRRTF-13 sites were modified to no-action site or transfer to OU 10-08, respectively.
Based on the available data, the remedial actions at the sites have been successfully completed or are currently being completed in accordance with the requirements in the OU 1-10 decision documents. Although the exposure assumptions at the WRRTF-13 site have changed and the COCs at the WRRTF-01 site have been modified, these changes have not negatively impacted the performance of remedial actions for the sites. Furthermore, no new information has come to light that could call into question the protectiveness of the remedies.
4.2.6 Issues
No issues have been identified during the ongoing OU 1-10 remedial action activities that have not been resolved through the ROD amendment and ESDs. For a list of issues identified within all WAGs during the INL Sitewide five-year review in 2005, see Table C-1 in Appendix C.
4.2.7 Recommendations and Follow-Up Actions
It is recommended that operations and maintenance requirements at WAG 1 be revised. Activities that were required during the preremediation phase may no longer apply. Such activities should be discontinued.
4.2.8 Protectiveness Statement
The OU 1-10 sites whose remedial actions are completed (i.e., Groups 1 and 3) are protective of human health and the environment. The final remedial action reports documenting that final remedial goals have been met are pending for sites whose remedies are completed; however, institutional controls are in place as necessary. Remediation of OU 1-10 Group 2 sites is in progress and expected to be protective of human health and the environment. Remediation and construction are being done in accordance with the requirements of the decision documents and design specifications included in the respective RD/RA work plans. In the interim, exposure pathways that could result in unacceptable risks are being controlled.
4.3 Section 4 References
42 USC § 9601 et seq., 1980, “Comprehensive Environmental Response, Compensation and Liability Act of 1980 (CERCLA/Superfund),” United States Code, December 11, 1980.
54 FR 29820, 1989, “National Priorities List for Uncontrolled Hazardous Waste Sites: Update #9, Federal Facilities Sites,” FRL-3615-2, Federal Register, U.S. Environmental Protection Agency, July 14, 1989.
Armstrong, A. T., R. A. Wymore, D. A. Dettmers, P. S. Lebow, K. L. Harris, and T. Wood, 2004, Annual Performance Report for In Situ Bioremediation Operations November 2002 to October 2003, Test Area North, Operable Unit 1-07B, ICP/EXT-04-00122, Rev. 0, Idaho National Engineering and Environmental Laboratory, Idaho Completion Project, April 2004.
4-45

DOE-ID, 1991, Federal Facility Agreement and Consent Order for the Idaho National Engineering Laboratory, Administrative Docket No. 1088-06-29-120, U.S. Department of Energy Idaho Operations Office; U.S. Environmental Protection Agency, Region 10; Idaho Department of Health and Welfare, December 4, 1991.
DOE-ID, 1995, Record of Decision Declaration for the Technical Support Facility Injection Well (TSF-05) and Surrounding Groundwater Contamination (TSF-23) and Miscellaneous No Action Sites Final Remedial Action, Document ID 10139, Rev. 0, U.S. Department of Energy Idaho Operations Office; U.S. Environmental Protection Agency, Region 10; and Idaho Department of Health and Welfare, August 1995.
DOE-ID, 1997, Comprehensive Remedial Investigation/Feasibility Study for the Test Area North Operable Unit 1-10 at the Idaho National Engineering and Environmental Laboratory, DOE/ID-10557, Rev. 0, U.S. Department of Energy Idaho Operations Office, November 1997.
DOE-ID, 1998a, Proposed Plan for Waste Area Group 1 - Test Area North Idaho National Engineering and Environmental Laboratory, Document ID 10553, Rev. 0, U.S. Department of Energy Idaho Operations Office, February 1998.
DOE-ID, 1998b, Comprehensive Remedial Investigation and Feasibility Study Supplement for the Test Area North Operable Unit 1-10 at the Idaho National Engineering and Environmental Laboratory, DOE/ID-10557, Supplement, Rev. 0, U.S. Department of Energy Idaho Operations Office, November 1998.
DOE-ID, 1999, Final Record of Decision for Test Area North Operable Unit 1-10, DOE/ID-10682, Rev. 0, U.S. Department of Energy Idaho Operations Office; U.S. Environmental Protection Agency, Region 10; Idaho Department of Health and Welfare, October 1999.
DOE-ID, 2000a, Field Demonstration Report, Test Area North Final Groundwater Remediation, Operable Unit 1-07B, DOE/ID-10718, Rev. 0, U.S. Department of Energy Idaho Operations Office, March 2000.
DOE-ID, 2000b, New Pump and Treat Facility Remedial Design Test Area North Operable Unit 1-07B, DOE/ID-10661, Rev. 1, U.S. Department of Energy Idaho Operations Office, March 2000.
DOE-ID, 2000c, Test Area North, Waste Area Group 1, Operable Unit 1-10 Remedial Design/Remedial Action Scope of Work, DOE/ID-10723, Rev. 0, U.S. Department of Energy Idaho Operations Office, February 2000.
DOE-ID, 2000d, Field Sampling Plan for Post-Record of Decision Sampling and Field Screening of Selected Sites at Waste Area Group 1, Operable Unit 1-10, DOE/ID-10710, Rev. 0, U.S. Department of Energy Idaho Operations Office, February 2000.
DOE-ID, 2000e, Institutional Control Status Report at Test Area North, Waste Area Group 1, DOE/ID-10750, Rev. 0, U.S. Department of Energy Idaho Operations Office, May 2000.
DOE-ID, 2001a, Record of Decision Amendment Technical Support Facility Injection Well (TSF-05) and Surrounding Groundwater Contamination (TSF-23) and Miscellaneous No Action Sites Final Remedial Action, DOE/ID-10139 Amendment, Rev. 0, U.S. Department of Energy Idaho Operations Office; U.S. Environmental Protection Agency; and Idaho Department of Health and Welfare, Division of Environmental Quality, September 2001.
4-46

DOE-ID, 2001b, Remedial Design/Remedial Action Scope of Work Test Area North Final Groundwater Remediation Operable Unit 1-07B, DOE/ID-10905, Rev. 1, U.S. Department of Energy Idaho Operations Office, November 2001.
DOE-ID, 2001c, Operations and Maintenance Plan for Test Area North, Operable Unit 1-10, DOE/ID-10711, Rev. 1, U.S. Department of Energy Idaho Operations Office, November 2001.
DOE-ID, 2001d, Test Area North (TAN)-616 Track 1 Decision Documentation Package, DOE/ID-10846, Rev. 0, U.S. Department of Energy Idaho Operations Office, January 2001.
DOE-ID, 2001e, The 2001 Institutional Controls Inspection, Environmental Monitoring, and Site Maintenance Report for Waste Area Group 1, DOE/ID-10899, Rev. 0, U.S. Department of Energy Idaho Operations Office, August 2001.
DOE-ID, 2002a, In Situ Bioremediation Remedial Action Work Plan for Test Area North Final Groundwater Remediation, Operable Unit 1-07B, DOE/ID-11015, Rev. 0, U.S. Department of Energy Idaho Operations Office, December 2002.
DOE-ID, 2002b, Comprehensive Remedial Design/Remedial Action Work Plan for the Test Area North, Waste Area Group 1, Operable Unit 1-10, Group 2 Sites, DOE/ID-10875, Rev. 1, U.S. Department of Energy Idaho Operations Office, March 2002.
DOE-ID, 2002c, Technology Evaluation Scope of Work for the V-Tanks, TSF-09/18, at Waste Area Group 1, Operable Unit 1-10, DOE/ID-10999, Rev. 0, U.S. Department of Energy Idaho Operations Office, July 2002.
DOE-ID, 2002d, The 2002 Institutional Controls Inspection, Environmental Monitoring, and Site Maintenance Report for Waste Area Group 1, DOE/ID-11011, Rev. 0, U.S. Department of Energy Idaho Operations Office, July 2002.
DOE-ID, 2003a, Monitored Natural Attenuation Remedial Action Work Plan for Test Area North Final Groundwater Remediation, Operable Unit 1-07B, DOE/ID-11055, Rev. 0, U.S. Department of Energy Idaho Operations Office, June 2003.
DOE-ID, 2003b, New Pump and Treat Facility Operations and Maintenance Plan for Test Area North Final Groundwater Remediation, Operable Unit 1-07B, DOE/ID-10684, Rev. 3, U.S. Department of Energy Idaho Operations Office, September 2003.
DOE-ID, 2003c, Explanation of Significant Differences for the Record of Decision for the Test Area North Operable Unit 1-10, DOE/ID-11050, Rev. 0, U.S. Department of Energy Idaho Operations Office; U.S. Environmental Protection Agency, Region 10; Idaho Department of Health and Welfare, April 2003.
DOE-ID, 2003d, Comprehensive Remedial Design/Remedial Action Work Plan for the Test Area North, Operable Unit 1-10, Group 1 Sites, DOE/ID-10712, Rev. 2, U.S. Department of Energy Idaho Operations Office, November 2003.
DOE-ID, 2003e, TSF-03 and WRRTF-01 2000/2001 Sample Data Compilation and Risk Assessment Report for Operable Unit 1-10, Waste Area Group 1, at Test Area North, DOE/ID-11045, Rev. 1, U.S. Department of Energy Idaho Operations Office, January 2003.
4-47

DOE-ID, 2003f, Comprehensive Remedial Design/Remedial Action Work Plan Addendum for V-Tanks Early Remedial Action for the Test Area North, Waste Area Group 1, Operable Unit 1-10, Group 2 Sites, DOE/ID-11075, Rev. 0, U.S. Department of Energy Idaho Operations Office, May 2003.
DOE-ID, 2003g, Remedial Design/Remedial Action Work Plan for Group 3, PM-2A Tanks and Burn Pits for Test Area North, Waste Area Group 1, Operable Unit 1-10, DOE/ID-11073, Rev. 0, U.S. Department of Energy Idaho Operations Office, December 2003.
DOE-ID, 2003h, FY 2003 Institutional Controls Assessment Report for Waste Area Group 1, DOE/ID-11105, Rev. 0, U.S. Department of Energy Idaho Operations office, August 2003.
DOE-ID, 2004a, Monitored Natural Attenuation 2003 Performance and Compliance Monitoring Annual Report for Test Area North Operable Unit 1-07B, DOE/NE-ID-11148, Rev. 0, U.S. Department of Energy Idaho Operations Office, June 2004.
DOE-ID, 2004b, INEEL Sitewide Institutional Controls Plan, DOE/ID-11042, Rev. 1, U.S. Department of Energy Idaho Operations Office, June 2004.
DOE-ID, 2004c, Record of Decision Amendment for the V-Tanks (TSF-09 and TSF-18) and Explanation of Significant Differences for the PM-2A Tanks (TSF-26) and TSF-06, Area 10, at Test Area North, Operable Unit 1-10, DOE/ID-10682 Amend, Rev. 0, U.S. Department of Energy Idaho Operations Office; U.S. Environmental Protection Agency, Region 10; Idaho Department of Health and Welfare, February 2004.
DOE-ID, 2004d, Group 3 Remedial Design/Remedial Action Work Plan Addendum 1 for PM-2A Tank Removal and Site Remediation for the Test Area North, Waste Area Group 1, Operable Unit 1-10, DOE/ID-11161, Rev. 0, U.S. Department of Energy Idaho Operations Office, June 2004.
DOE-ID, 2004e, Group 2 Remedial Design/Remedial Action Work Plan Addendum for the Assessment and Cleanup of V-Tank Area New Sites, for the Test Area North, Waste Area Group 1, Operable Unit 1-10, DOE/NE-ID-11152, Rev. 0, U.S. Department of Energy Idaho Operations Office, August 2004.
DOE-ID, 2004f, Group 2 Remedial Design/Remedial Action Work Plan Addendum 2 for the TSF-09/18 V-Tanks and Contents Removal, Phase 1 Contents Treatment, and Site Remediation at Test Area North, Waste Area Group 1, Operable Unit 1-10, DOE/NE-ID-11150, Rev. 3, U.S. Department of Energy Idaho Operations Office, November 2005.
DOE-ID, 2004g, INEEL Sitewide Operations and Maintenance Plan for CERCLA Response Actions, DOE/NE-ID-11159, Rev. 0, U.S. Department of Energy Idaho Operations Office, September 2004.
DOE-ID, 2004h, INEEL Sitewide Institutional Controls Annual Report - FY 2004, DOE/NE-ID-11180, Rev. 0, U.S. Department of Energy Idaho Operations Office, September 2004.
DOE-ID, 2005, Explanation of Significant Differences for the Record of Decision for the Test Area North Operable Unit 1-10, DOE/NE-ID-11199, Rev. 0, U.S. Department of Energy Idaho Operations Office, January 2005.
4-48

DOE-ID, EPA, and DEQ, 1994, Proposed Plan for Groundwater Contamination (Operable Unit 1-07B) and No Action Sites (Operable Units 1-01, -02, -06, -09), Test Area North, Idaho National Engineering Laboratory, U.S. Department of Energy Idaho Operations Office, U.S. Environmental Protection Agency, and Idaho Division of Environmental Quality, May 1994.
DOE-ID, EPA, and DEQ, 2000, Proposed Plan for Operable Unit 1-07B, Final Remedial Action at the TSF Injection Well (TSF-05) and Surrounding Groundwater Contamination (TSF-23), DOE/ID-21251, U.S. Department of Energy Idaho Operations Office, U.S. Environmental Protection Agency, and Idaho Department of Environmental Quality, November 2000.
DOE-ID, EPA, and DEQ, 2003, New Proposed Plan for the V-Tanks Contents (TSF-09 and TSF-18) at Test Area North, Operable Unit 1-10, Environmental Restoration Administrative Record No. 24783, 2003 Proposed Plan, U.S. Department of Energy Idaho Operations Office; U.S. Environmental Protection Agency, Region 10; Idaho Department of Health and Welfare, April 2003.
EG&G, 1994, Remedial Investigation Final Report with Addenda for the Test Area North Groundwater Operable Unit 1-07B at the Idaho National Engineering Laboratory, Volume 1, EGG-ER-10643, Rev. 0, Idaho National Engineering Laboratory, January 1994.
Harris, K. L. and P. S. Lebow, 2005, Monitored Natural Attenuation 2004 Performance and Compliance Monitoring Annual Report for Test Area North, Operable Unit 1-07B, ICP/EXT-05-00818, Rev. 0, Idaho National Laboratory, Idaho Completion Project, April 2005.
ICP, 2004a, New Pump and Treat Facility Medial Zone Rebound Test Plan, Operable Unit 1-07B, Test Area North, ICP/EXT-04-00557, Rev. 1, Idaho National Engineering and Environmental Laboratory, Idaho Completion Project, November 2004.
ICP, 2004b, New Pump and Treat Facility Annual Operations Report, October 2002 through September 2003, Test Area North Final Groundwater Remedy, Operable Unit 1-07B, ICP/EXT-04-00148, Rev. 0, Idaho National Engineering and Environmental Laboratory, Idaho Completion Project, February 2004.
ICP, 2005, New Pump and Treat Facility Annual Operations Report, October 2003 through September 2004, Test Area North Final Groundwater Remedy, Operable Unit 1-07B, ICP/EXT-04-00708, Rev. 0, Idaho National Engineering and Environmental Laboratory, Idaho Completion Project, January 2005.
INEEL, 1997, Explanation of Significant Differences from the Record of Decision for the Technical Support Facility Injection Well (TSF-05) and Surrounding Groundwater Contamination (TSF-23) and Miscellaneous No Action Sites, Final Remedial Action, Operable Unit 1-07B, Waste Area Group 1, INEEL/EXT-97-00931, Rev. 0, Idaho National Engineering and Environmental Laboratory, November 1997.
INEEL, 2000, Fiscal Year 1999 Groundwater Monitoring Annual Report Test Area North, Operable Unit 1-07B, INEEL/EXT-99-01255, Rev. 0, Idaho National Engineering and Environmental Laboratory, January 2000.
INEEL, 2002a, Operable Unit 1-07B In Situ Bioremediation Annual Performance Report for October 1999 to July 2001, INEEL/EXT-2002-00543, Rev. 0, Idaho National Engineering and Environmental Laboratory, March 2002.
4-49

INEEL, 2002b, Technical Support Facility-06 and Technical Support Facility-26 Calendar Year 2000 Sampling and Remediation Summary Report for Waste Area Group 1, Operable Unit 1-10, INEEL/EXT-02-01135, Rev. 0, Idaho National Engineering and Environmental Laboratory, October 2002.
INEEL, 2002c, WRRTF-13 Calendar Year 2000 Sampling and Risk Based Corrective Action Analysis Summary Report, INEEL/EXT-02-01137, Rev. 0, Idaho National Engineering and Environmental Laboratory, October 2002.
INEEL, 2003a, Annual Performance Report for In Situ Bioremediation Operations August 2001 to October 2002, Test Area North Operable Unit 1-07B, INEEL/EXT-03-00371, Rev. 0, Idaho National Engineering and Environmental Laboratory, September 2003.
INEEL, 2003b, New Pump and Treat Facility Annual Operations Report October 2001 through September 2002, Test Area North Final Groundwater Remedy, Operable Unit 1-07B, INEEL/EXT-03-00198, Rev. 0, Idaho National Engineering and Environmental Laboratory, August 2003.
INEEL, 2003c, Fiscal Year 2002 Groundwater Monitoring Annual Report, Test Area North, Operable Unit 1-07B, INEEL/EXT-03-00195, Rev. 0, Idaho National Engineering and Environmental Laboratory, August 2003.
INEEL, 2004, Risk-Based Screening and Assessment Approach for Waste Area Group 1 Soils, INEEL/EXT-03-00540, Rev. 0, Idaho National Engineering and Environmental Laboratory, May 2004.
INEL, 1992, Record of Decision Technical Support Facility (TSF) Injection Well (TSF-05) and Surrounding Groundwater Contamination (TSF-23), Document ID 5202, Rev. 0, Idaho National Engineering Laboratory, September 1992.
INEL, 1994, Preliminary Scoping Track 2 Summary Report for Test Area North Operable Unit 1-05: Radioactive Contamination Sites, INEL-94/0135, Rev. 0, Idaho National Engineering Laboratory, October 1994.
Macbeth, T. W., D. L. Dettmers, K. L. Harris, J. Witt, M. C. Koelsch, and P. S. Lebow, 2005, Annual Performance Report for In Situ Bioremediation Operations November 2003 to September 2004, Test Area North, Operable Unit 1-07B, ICP/EXT-05-00787, Rev. 0, Idaho National Laboratory, Idaho Cleanup Project, May 2005.
4-50

5. WASTE AREA GROUP 2 (REACTOR TECHNOLOGY COMPLEX)
The Reactor Technology Complex (RTC), formerly known as the Test Reactor Area (TRA), was established in the early 1950s to study the effects of radiation on materials, fuels, and equipment. To aid in this research, a number of facilities were constructed, including three major test reactors: the Materials Test Reactor (1952 to 1970), the Engineering Test Reactor (1957 to 1982), and the Advanced Test Reactor (1967 to present).
Some of the operations at these and other RTC facilities have resulted in releases of radioactive and inorganic contaminants. Consequently, the RTC was designated as WAG 2 under the FFA/CO (DOE-ID 1991a). The FFA/CO further divided WAG 2 into 13 OUs that contain a total of 55 release sites. In 1997, however, all of these sites were rolled into OU 2-13 (DOE-ID 1997a). Three RODs have been prepared for WAG 2.
The first WAG 2 ROD—signed on December 3, 1991—addressed OU 2-10, which is the warm waste pond sediments (DOE-ID 1991b) at the RTC. That ROD resulted in an interim action of physical separation and chemical extraction to recover contaminants from the warm waste pond sediments followed by backfilling the warm waste pond.
In December 1992, the Record of Decision, Test Reactor Area Perched Waster System, Operable Unit 2-12 (DOE-ID 1992) was issued for the OU 2-12 TRA perched water system. It was determined that no remedial action was necessary for the deep perched water system to ensure protection of human health and the environment. That decision was based on the results of human-health and ecological-risk assessments that showed the conditions at the site do not pose unacceptable risks to human health or the environment with regard to current and future use of the SRPA beneath the RTC. Originally, the Remedial Investigation Report for the Test Reactor Area Perched Water System (Operable Unit 2-12) (Dames and Moore 1992) identified 13 COCs: Am-241, Cs-137, Co-60, H-3, Sr-90, arsenic, beryllium, cadmium, chromium, cobalt, fluoride, lead, and manganese. A key assumption for the no-action decision was that groundwater monitoring would be performed to verify that contaminant concentration trends follow those predicted by computer modeling. That key assumption was carried forward in the Comprehensive Remedial Investigation/Feasibility Study for the Test Reactor Area Operable Unit 2-13 at the Idaho National Engineering and Environmental Laboratory (DOE-ID 1997a) and the Final Record of Decision, Test Reactor Area, Operable Unit 2-13 issued in December 1997 (DOE-ID 1997b). The objectives of the groundwater monitoring program were to verify contaminant concentration trends in the SRPA, as predicted by the computer models, and to evaluate the effect that discontinuing discharge to the warm waste pond has had on contaminant concentrations in the deep perched water system and the SRPA. Subsequent monitoring and trending of the data, as discussed in Section 5.2, have reduced the groundwater COC list to Co-60, H-3, Sr-90, and chromium (DOE-ID 2003).
In 1997, a comprehensive RI/FS was completed in order to ascertain the extent of, and risks from, contamination at the 55 OU 2-13 release sites and the SRPA (DOE-ID 1997a). Data obtained during the RI/FS showed that contaminant concentrations at eight of the sites presented unacceptable risks to human health and safety or the environment. The final ROD for OU 2-13 recommended remedial actions for four of those eight sites and limited action for the remaining four sites (DOE-ID 1997b). Remedial actions were initiated at the sites in 1999 and completed in 2000. Table 5-1 lists the eight release sites described in the ROD as posing unacceptable risks. The table also shows the COCs and cleanup goals for each site.
5-1
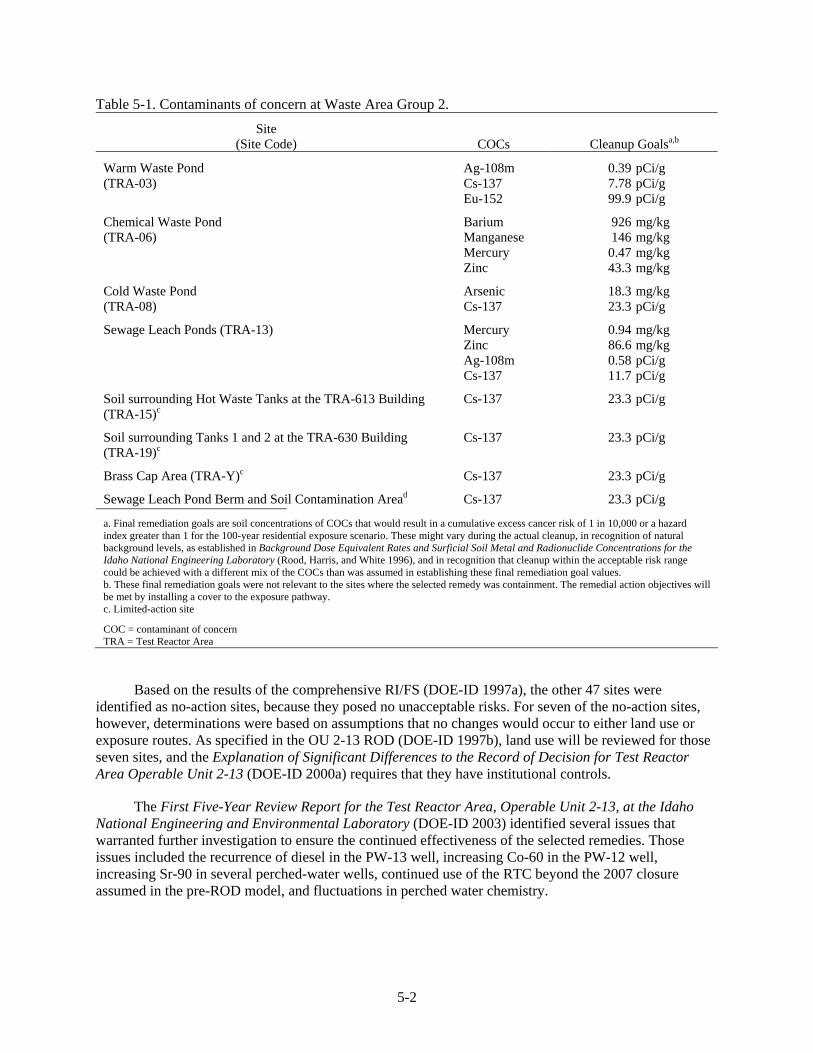
Table 5-1. Contaminants of concern at Waste Area Group 2.
Site (Site Code) COCs Cleanup Goalsa,b
Warm Waste Pond (TRA-03)
Ag-108m Cs-137 Eu-152
0.39 7.78 99.9
pCi/g pCi/g pCi/g
Chemical Waste Pond (TRA-06)
Barium Manganese Mercury Zinc
926 146
0.47 43.3
mg/kg mg/kg mg/kg mg/kg
Cold Waste Pond (TRA-08)
Arsenic Cs-137
18.3 23.3
mg/kg pCi/g
Sewage Leach Ponds (TRA-13) Mercury Zinc Ag-108m Cs-137
0.94 86.6 0.58 11.7
mg/kg mg/kg pCi/g pCi/g
Soil surrounding Hot Waste Tanks at the TRA-613 Building (TRA-15)c
Cs-137 23.3 pCi/g
Soil surrounding Tanks 1 and 2 at the TRA-630 Building (TRA-19)c
Cs-137 23.3 pCi/g
Brass Cap Area (TRA-Y)c Cs-137 23.3 pCi/g
Sewage Leach Pond Berm and Soil Contamination Aread Cs-137 23.3 pCi/g
a. Final remediation goals are soil concentrations of COCs that would result in a cumulative excess cancer risk of 1 in 10,000 or a hazard index greater than 1 for the 100-year residential exposure scenario. These might vary during the actual cleanup, in recognition of natural background levels, as established in Background Dose Equivalent Rates and Surficial Soil Metal and Radionuclide Concentrations for the Idaho National Engineering Laboratory (Rood, Harris, and White 1996), and in recognition that cleanup within the acceptable risk range could be achieved with a different mix of the COCs than was assumed in establishing these final remediation goal values. b. These final remediation goals were not relevant to the sites where the selected remedy was containment. The remedial action objectives will be met by installing a cover to the exposure pathway. c. Limited-action site
COC = contaminant of concern TRA = Test Reactor Area
Based on the results of the comprehensive RI/FS (DOE-ID 1997a), the other 47 sites were identified as no-action sites, because they posed no unacceptable risks. For seven of the no-action sites, however, determinations were based on assumptions that no changes would occur to either land use or exposure routes. As specified in the OU 2-13 ROD (DOE-ID 1997b), land use will be reviewed for those seven sites, and the Explanation of Significant Differences to the Record of Decision for Test Reactor Area Operable Unit 2-13 (DOE-ID 2000a) requires that they have institutional controls.
The First Five-Year Review Report for the Test Reactor Area, Operable Unit 2-13, at the Idaho National Engineering and Environmental Laboratory (DOE-ID 2003) identified several issues that warranted further investigation to ensure the continued effectiveness of the selected remedies. Those issues included the recurrence of diesel in the PW-13 well, increasing Co-60 in the PW-12 well, increasing Sr-90 in several perched-water wells, continued use of the RTC beyond the 2007 closure assumed in the pre-ROD model, and fluctuations in perched water chemistry.
5-2
Investigative activities to address the issues included fieldwork, modeling, and conceptual model research. The activities—documented in the Response to the First Five-Year Review Report for the Test Reactor Area, Operable Unit 2-13, at the Idaho National Engineering and Environmental Laboratory (DOE-ID 2005)—showed that the identified issues do not affect the selected remedies. Recommendations to ensure continued protectiveness of the selected remedies also were included in the document.
Figure 5-1 shows the locations of the eight release sites at WAG 2 that required remediation. Table 5-2 provides a chronology of significant events at WAG 2.
5.1 Remedial Actions
5.1.1 Remedy Selection
Remedies were selected for the eight WAG 2 sites that were identified as posing unacceptable risks at the RTC. The remedy selection process in CERCLA (42 USC § 9601 et seq.) was used to identify and select the remedies for each site. The following subsections describe the selected remedies.
5.1.1.1 Warm Waste Pond (TRA-03 Site). The selected remedy for Cells 1952 and 1957 of the warm waste pond was containment of the pond contents using an engineered cover that consists of several layers of geologic materials to reduce potential exposure to contaminated pond sediments by human and environmental receptors. Cell 1964 includes a riprap layer placed over the existing native soil cover to inhibit future intrusion or excavation and to increase the degree of permanence of the remedy. The remedy for the warm waste pond also includes institutional controls that will remain in place as long as hazards that make the site unsuitable for unrestricted release are present. Specifically, the institutional controls include long-term environmental monitoring, cover integrity monitoring and maintenance, surface water diversions, and administrative and physical access restrictions.
5.1.1.2 Chemical Waste Pond (TRA-06 Site). The selected remedy for the chemical waste pond was containment with a native soil cover and institutional controls with possible excavation, treatment, and disposal. Preremediation sampling conducted in 1998 verified that the sediments in the chemical waste pond were not Resource Conservation and Recovery Act (RCRA) -characteristic hazardous waste. As such, excavation, treatment, and disposal were not required (DOE-ID 1998a). This remedy provided soil that is thick enough to effectively reduce the potential for human and/or biological intrusion or excavation into the contamination. The remedy for the chemical waste pond also includes institutional controls, as described above for the warm waste pond.
5.1.1.3 Cold Waste Pond (TRA-08 Site). The selected alternative for the cold waste pond was excavation and disposal. Institutional controls also were prescribed for the cold waste pond and included controlling access and restricting land use to all but industrial activities for 100 years after the remedial action. The selected remedy addressed the principal risks posed from the pond by effectively removing the source of contamination, thereby eliminating the pathway by which a future receptor might be exposed.
5.1.1.4 Sewage Leach Ponds (TRA-13 Site). The selected remedy for the sewage leach ponds was containment using a native soil cover. The remedy provided soil that is thick enough to effectively reduce the potential for intrusion or excavation into the contaminated area and provided shielding against exposure to radionuclide contamination. Before the soil cover was put in place, contaminated soil from the sewage leach pond berms was placed in the bottom of the ponds to consolidate the contaminated soil (see Section 5.1.1.8). The remedy for the sewage leach ponds also includes institutional controls, as described above for the warm waste pond.
5-3

5-4
Figure 5-1. Waste Area Group 2 release sites that required remediation.

Table 5-2. Chronology of Waste Area Group 2 events. Event Date
The Declaration for the Warm Waste Pond at the Test Reactor Area at the Idaho National Engineering Laboratory—Declaration of the Record of Decision (DOE-ID 1991b) was signed.
December 1991
The OU 2-10 removal of windblown contamination at the warm waste pond was completed.
1992
The Record of Decision, Test Reactor Area Perched Water System, Operable Unit 2-12 (DOE-ID 1992) was signed.
December 1992
The Explanation of Significant Differences for the Warm Waste Pond Sediments Record of Decision at the Test Reactor Area at the Idaho National Engineering Laboratory (Jensen and Montgomery 1993) was issued.
March 1993
The Post Record of Decision Monitoring Plan for the Test Reactor Area Perched Water System Operable Unit 2-12 (INEL 1993) was completed.
June 1993
The OU 2-10 warm waste pond interim action was completed. December 1993 The OU 2-04 non-time-critical removal action at TRA-34 was completed. 1996 A three-year statutory review of the deep perched water system was completed. August 1996 The Comprehensive Remedial Investigation/Feasibility Study for the Test Reactor Area Operable Unit 2-13 at the Idaho National Engineering and Environmental Laboratory (DOE-ID 1997a) was completed.
February 1997
The Final Record of Decision, Test Reactor Area, Operable Unit 2-13 (DOE-ID 1997b) was signed.
December 1997
The Groundwater Monitoring Plan for the Test Reactor Area Operable Unit 2-13 (DOE-ID 1998b) was completed.
July 1998, revised 2004
The Comprehensive Remedial Design/Remedial Action Work Plan for the Test Reactor Area, Operable Unit 2-13 (DOE-ID 1998a) was completed.
September 1998
The five-year statutory review of the warm waste pond interim action was completed. September 1998 The actual remedial action began. March 8, 1999 The comprehensive OU 2-13 remedial action was completed. December 1999 The Operations and Maintenance Plan for the Final Selected Remedies and Institutional Controls at Test Reactor Area, Operable Unit 2-13 (DOE-ID 2000b) was completed.
March 2000
The Explanation of Significant Differences to the Record of Decision for Test Reactor Area Operable Unit 2-13 (DOE-ID 2000a) covering site-specific institutional controls was completed.
May 2000
The First Five-Year Review Report for the Test Reactor Area, Operable Unit 2-13, at the Idaho National Engineering and Environmental Laboratory (DOE-ID 2003) documented the first comprehensive remedy review for WAG 2.
September 2003
The Project Close-out Report for Waste Area Group 2, Test Reactor Area (INEEL 2003a) was completed.
September 2003
The Response to the First Five-Year Review Report for the Test Reactor Area, Operable Unit 2-13, at the Idaho National Engineering and Environmental Laboratory (DOE-ID 2005) was completed.
May 2005
DOE-ID = U.S. Department of Energy Idaho Operations Office INEEL = Idaho National Engineering and Environmental Laboratory INEL = Idaho National Engineering Laboratory OU = operable unit TRA = Test Reactor Area WAG = waste area group
5-5

5.1.1.5 Soil surrounding Hot Waste Tanks at the TRA-613 Building (TRA-15 Site). The selected remedy for the soil surrounding the hot waste tanks was limited action through the maintenance of institutional controls, including continued use of existing administrative controls and implementation of long-term environmental monitoring for at least 100 years. On the basis of radioactive decay, no further action is anticipated after 100 years.
5.1.1.6 Soil surrounding Tanks 1 and 2 at the TRA-630 Building (TRA-19 Site). The selected alternative for this site was limited action through maintenance of institutional controls. If the institutional controls are not maintained, a contingency for excavation and disposal exists for this site. However, because of the physical location of the contaminated soil (i.e., subsurface soil in and around active radioactive waste piping and tank systems), access is limited; thus, removal of all of the contaminated soil in order to eliminate the need for institutional controls cannot be verified. Therefore, excavation alternatives cannot be fully implemented.
5.1.1.7 Brass Cap Area (TRA-Y Site). Like the TRA-19 site, the selected alternative for the brass cap area was limited action through maintenance of institutional controls. If the institutional controls are not maintained, a contingency for excavation and disposal exists for this area. However, because of the physical location of the contaminated soil (i.e., subsurface soil in and around active radioactive waste piping and tank systems), access is limited; thus, removal all of the contaminated soil to eliminate the need for institutional controls cannot be verified. Therefore, excavation alternatives cannot be fully implemented.
5.1.1.8 Sewage Leach Pond Berms and Soil Contamination Area. The selected alternative for the sewage leach pond berms and soil contamination area included placing the contaminated berm material in the bottom of the sewage leach pond before the native soil cover was placed over the pond (see Section 5.1.1 4). The remaining low-level, radionuclide-contaminated soil was left in place, and exposure to the contaminants is being minimized through the use of fences, signs, and monitoring.
5.1.1.9 Institutional Control Sites. After completion of the OU 2-13 comprehensive RI/FS (DOE-ID 1997a) and signing of the OU 2-13 ROD (DOE-ID 1997b), the 47 no-action sites were reevaluated, and 15 of those sites were found to require institutional controls to ensure adequate protection of human health and safety and the environment. The ESD to the OU 2-13 ROD discusses implementation, maintenance, and monitoring of institutional controls at each site in detail. A summary of the institutional controls identified for each of the WAG 2 sites is presented as follows:
• Warm Waste Pond (TRA-03 Site)—Restrict the site to occupational access for more than 30 years, and restrict to industrial use until residential risk is <1E-04 based on the results of a five-year review.
• Warm Waste Retention Basin (TRA-04 Site)—Restrict the site to industrial land use only for depths less than 10 ft until approximately 2028. Restrict land use for deeper soil (approximately 40 ft), unless otherwise indicated based on the results of a five-year review.
• TRA Chemical Waste Pond (TRA-06 Site)—Restrict residential land use to depths less than 14 ft.
• TRA Cold Waste Disposal Ponds (TRA-08 Site)—Restrict the site to industrial land use for less than 100 years until residential risk is <1E-04 based on the results of a five-year review.
5-6

• TRA Sewage Leach Ponds (TRA-13 Site)—Restrict the site to occupational access for more than 30 years and restrict to industrial land use only until residential risk is <1E-04 based on the results of a five-year review.
• TRA Sewage Leach Pond Soil Contamination Area (TRA-13A Site)—Restrict occupational and residential access until risk is 1E-04 based on the results of a five-year review.
• TRA Hot Waste Tanks 2, 3, and 4 at TRA-613 (TRA-15 Site)—Restrict occupational residential access for less than 100 years until risk is 1E-04 based on the results of a five-year review. After the above restriction is removed, restrict land use at depths greater than 10 ft until otherwise evaluated.
• TRA Rad Tanks 1 and 4 at TRA-630 (TRA-19 Site)—Restrict occupational access and prohibit residential development until soil is removed or status is changed based on the results of a five-year review.
• North Storage Area (TRA-34 Site)—Restrict the site to industrial land use only until residential risk is <10-4 (until approximately 2028) based on the results of a five-year review.
• PCB Spill at TRA-619 (TRA-B Site)—Permanently restrict the site to industrial land use only, unless otherwise indicated based on the results of a five-year review.
• PCB Spill at TRA-626 (TRA-C Site)—Permanently restrict the site to industrial land use only, unless otherwise indicated based on the results of a five-year review.
• PCB Spill at TRA-653 (TRA-E Site)—Permanently restrict the site to industrial land use only, unless otherwise indicated based on the results of a five-year review.
• Hot Tree Site (TRA-X Site)—Restrict the site to industrial land use only until approximately 2028 or until residential risk is <10-4 based on the results of a five-year review.
• Brass Cap Area (TRA-Y Site)—Restrict occupational access and prohibit residential development until contamination is removed or status is changed based on a five-year review.
• Perched Water and SRPA (No Action with Monitoring)—Restrict drilling of wells for the purpose of drinking water use until contaminant concentrations are below the MCL based on the results of a five-year review.
Table 5-3 provides a current list of the institutionally controlled sites at WAG 5, identifies the COCs, and the concentration for each, the release criteria, and the expected release date.
5.1.2 Remedial Action Objectives
The RAOs for the eight sites of concern were developed in accordance with 40 CFR 300, “National Oil and Hazardous Substances Pollution Contingency Plan,” and CERCLA RI/FS guidance through meetings with the DEQ, EPA, and DOE. The RAOs result from risk assessments and are specific to the COCs and exposure pathways developed for each site.
5-7
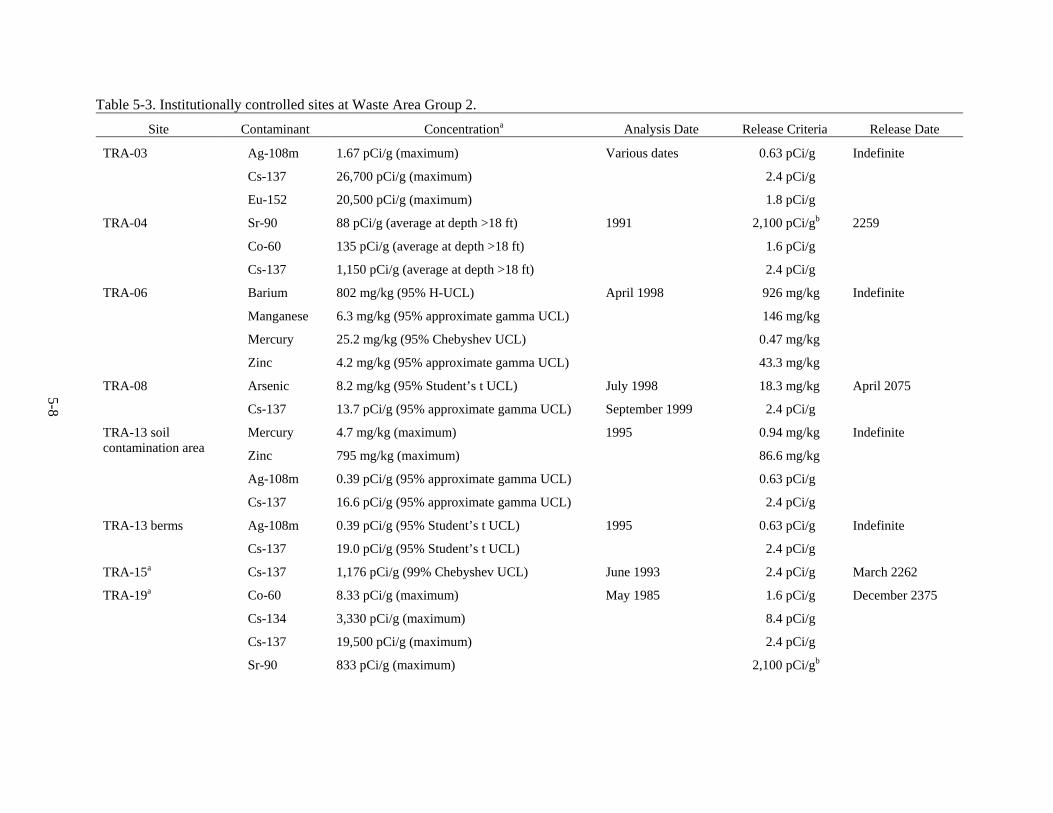
Table 5-3. Institutionally controlled sites at Waste Area Group 2.
Site Contaminant Concentrationa Analysis Date Release Criteria Release Date
5-8
TRA-03
TRA-04
TRA-06
TRA-08
TRA-13 soil contamination area
TRA-13 berms
TRA-15a
TRA-19a
Ag-108m 1.67 pCi/g (maximum) Various dates 0.63 pCi/g
Cs-137 26,700 pCi/g (maximum) 2.4 pCi/g
Eu-152 20,500 pCi/g (maximum) 1.8 pCi/g
Sr-90 88 pCi/g (average at depth >18 ft) 1991 2,100 pCi/gb
Co-60 135 pCi/g (average at depth >18 ft) 1.6 pCi/g
Cs-137 1,150 pCi/g (average at depth >18 ft) 2.4 pCi/g
Barium 802 mg/kg (95% H-UCL) April 1998 926 mg/kg
Manganese 6.3 mg/kg (95% approximate gamma UCL) 146 mg/kg
Mercury 25.2 mg/kg (95% Chebyshev UCL) 0.47 mg/kg
Zinc 4.2 mg/kg (95% approximate gamma UCL) 43.3 mg/kg
Arsenic 8.2 mg/kg (95% Student’s t UCL) July 1998 18.3 mg/kg
Cs-137 13.7 pCi/g (95% approximate gamma UCL) September 1999 2.4 pCi/g
Mercury 4.7 mg/kg (maximum) 1995 0.94 mg/kg
Zinc 795 mg/kg (maximum) 86.6 mg/kg
Ag-108m 0.39 pCi/g (95% approximate gamma UCL) 0.63 pCi/g
Cs-137 16.6 pCi/g (95% approximate gamma UCL) 2.4 pCi/g
Ag-108m 0.39 pCi/g (95% Student’s t UCL) 1995 0.63 pCi/g
Cs-137 19.0 pCi/g (95% Student’s t UCL) 2.4 pCi/g
Cs-137 1,176 pCi/g (99% Chebyshev UCL) June 1993 2.4 pCi/g
Co-60 8.33 pCi/g (maximum) May 1985 1.6 pCi/g
Cs-134 3,330 pCi/g (maximum) 8.4 pCi/g
Cs-137 19,500 pCi/g (maximum) 2.4 pCi/g
Sr-90 833 pCi/g (maximum) 2,100 pCi/gb
Indefinite
2259
Indefinite
April 2075
Indefinite
Indefinite
March 2262
December 2375

5-9
Table 5-3. (continued).
Site Contaminant Concentrationa Analysis Date Release Criteria Release Date
TRA-34 Ag-108m 0.34 pCi/g (maximum) September 26, 1995 0.63 pCi/g No longer required
Cs-137 0.53 pCi/g (95% approximate gamma UCL) 2.4 pCi/g
Eu-152 0.95 pCi/g (95% Student’s t UCL) 1.8 pCi/g
TRA-B PCBs 19.3 mg/kg (95% Student’s t UCL) November 1990 Not applicable Indefinite
TRA-C PCBs 5.5 mg/kg (95% approximate gamma UCL) September 1990 Not applicable Indefinite
TRA-E PCBs 1.5 mg/kg (95% approximate gamma UCL) September 1990 Not applicable Indefinite
TRA-X Cs-137 4.81 pCi/g (maximum) May 17, 1995 2.4 pCi/g July 2025
TRA-Ya Co-60 8.33 pCi/g (maximum) May 1985 1.6 pCi/g December 2375
Cs-134 3,330 pCi/g (maximum) 8.4 pCi/g
Cs-137 19,500 pCi/g (maximum) 2.4 pCi/g
Sr-90 833 pCi/g (maximum) 2,100 pCi/gb
TRA Groundwater Cr 193 mg/kg (unfiltered—maximum)c March 2005 0.1 mg/kg To be determined
132 mg/kg (filtered—maximum) 100 pCi/L
Co-60 36.8 pCi/L (maximum)d 8 pCi/L
Sr-90 88.9 pCi/L (maximum)d 20,000 pCi/L
H-3 24,000 pCi/L (maximum)e
a. In accordance with the OU 2-13 ROD, this site will be evaluated following the decontamination and dismantlement of the surrounding RTC facilities. b. Based on the new slope factors provided by the EPA guidance, the criteria to release the site for Sr-90 and its daughters is 23.1 pCi/g. c. Maximum concentration was obtained for a sample collected from the TRA-07 aquifer well during the March 2005 semiannual sampling event. Historic results may be higher. d. Maximum concentration was obtained for a sample collected from the PW-12 perched well during the March 2005 semiannual sampling event. Historic results may be higher. e. Maximum concentration was obtained for a sample collected from the PW-11 perched well during the March 2005 semiannual sampling event. Historic results may be higher.
EPA = U.S. Environmental Protection Agency OU = operable unit PCB = polychlorinated biphenyl ROD = Record of Decision RTC = Reactor Technology Complex TRA = Test Reactor Area UCL = upper confidence limit

The RAOs for protection of human health and safety are as follows:
• Inhibit direct exposure to radionuclide COCs in soil that would result in a total excess cancer risk of greater than 1 in 10,000 to 1,000,000 (1E-04 to 1E-06) to current and future workers and future residents.
• Inhibit ingestion of chemical and radionuclide COCs in soil by all affected exposure routes (including ingestion of soil, groundwater, and homegrown produce) that would result in a total excess cancer risk of greater than 1 in 10,000 to 1,000,000 (1E-04 to 1E-06) or a hazard index greater than 1 to current and future workers and future residents.
• Inhibit the degradation of any low-level waste repository covers (e.g., warm waste pond cell covers) that would result in exposure to either the buried waste or the migration of contaminants to the surface and pose a total excess cancer risk (for all contaminants) of greater than 1 in 10,000 to 1,000,000 (1E-04 to 1E-06) or a hazard index greater than 1 to current and future workers and future residents.
The RAOs for protection of the environment are as follows:
• Inhibit adverse effects to resident populations of flora and fauna, as determined by the ecological risk evaluation from soil, surface water, or air containing COCs
• Inhibit adverse effects at sites where COCs remain in place, which could result in exposure to COCs or migration of COCs to the surface.
To meet these RAOs, final remediation goals (Table 5-1) were established as quantitative cleanup levels and are based on the results of the baseline risk assessment and an evaluation of expected exposures and risks for selected alternatives. Remedial actions were completed to ensure that risks would be mitigated and exposure would not exceed the final remediation objectives.
5.1.3 Remedy Implementation
The following paragraphs describe the remedial actions implemented at the OU 2-13 sites of concern. More details about the remedial actions are found in the Remedial Action Report for the Test Reactor Area Operable Unit 2-13 (DOE-ID 2000c). In addition to the eight sites identified for remedial action and limited action, the seven sites identified for no action with institutional controls also were included in the OU 2-13 remedy implementation and are discussed in Section 5.1.1.9.
5.1.3.1 Warm Waste Pond (TRA-03 Site). Remedial activities were conducted at the warm waste pond in 1999. Engineered soil covers were placed over the covers that were constructed during interim actions. Cell 1964 was covered with native soil, and Cell 1952 was covered with pea gravel, cobble, and a second layer of pea gravel. After radiologically contaminated soil from the north cold waste pond was placed in Cell 1957, it was covered with soil, pea gravel, cobble, and another layer of pea gravel. All three cells were then covered by a 2-ft-thick riprap layer to inhibit human intrusion. Preremediation occupational and residential risks are contained at this site beneath the engineered cover. Institutional controls also were established, thereby restricting the site to all but occupational access for more than 30 years and restricting the site to all but industrial land use until residential risk is <10-04 based on the results of a five-year review.
5-10
5.1.3.2 Chemical Waste Pond (TRA-06 Site). Remedial activities were conducted at the chemical waste pond in 1999. A three-layer, native-soil cover was constructed over the former waste pond and consisted of (1) a gravel and coarse-sand layer; (2) a compacted, low-permeability layer; and (3) a topsoil layer. The topsoil layer was reseeded with native vegetation to control erosion. Institutional controls were established, restricting residential land use to depths <14 ft, where a mercury hazard remains. Industrial land use is unrestricted. Recently available EPA information could be used to reevaluate and increase the original OU 2-13 ROD’s conservative final remediation goal for mercury. (See the End of Well Report for MIDDLE-1823 Waste Area Group 10 Deep Corehole Vertical Profile [INEEL 2003b] for an example of where a reevaluation was done.)
5.1.3.3 Cold Waste Pond (TRA-08 Site). The cold waste pond remains in use today. The presence of Cs-137 is believed to be from windblown soil contamination originating from the warm waste pond, and the presence of arsenic is the result of historical disposal practices at the cold waste pond. Post-ROD sampling data (DOE-ID 1998c) confirmed that the pond sediments are below the 18.3-mg/kg final remediation goal for arsenic and the RCRA toxicity characteristic leaching procedure’s regulatory limit. Therefore, arsenic was eliminated as a COC, and the final remediation goal for Cs-137 was increased from 11.7 to 23.3 pCi/g (DOE-ID 2000c). Remedial actions were conducted at the cold waste pond in 1999. Approximately 80 yd3 of Cs-137-contaminated soil was removed from the northern ponds and transported to Cell 1957 of the warm waste pond for disposal. Institutional controls were established, thereby restricting the site to all but industrial land use until residential risk is <10-04 based on the results of a five-year review.
5.1.3.4 Sewage Leach Ponds (TRA-13 Site). Remedial actions were conducted at the sewage leach ponds in 1999. Approximately 1,431 yd3 of soil contaminated with Cs-137 concentrations greater than 23.3 pCi/g was excavated from the sewage leach pond berms and placed in the bottom of the sewage leach pond. A three-layer native soil cover with a minimum thickness of 10 ft was then constructed over the ponds. The cover consisted of (1) a gravel and coarse-sand layer; (2) a compacted, low-permeability layer; and (3) a topsoil layer. Six inches of clean soil was placed over the soil contamination area that surrounds the sewage leach pond. The topsoil layer and the soil contamination area were reseeded with native vegetation to control erosion. Institutional controls were established, restricting the site to all but occupational access for more than 30 years and to all but industrial land use until residential risk is <10-04.
5.1.3.5 Soil Surrounding Hot Waste Tanks at the TRA-613 Building (TRA-15 Site). Occupational access is restricted at this site for 25 more years, and residential access is restricted for approximately 95 more years until the risk is <10-04 based on the results of a five-year review. After the aforementioned restriction is removed, land use will be restricted at depths >10 ft until otherwise evaluated.
5.1.3.6 Soil Surrounding Tanks 1 and 2 at the TRA-630 Building (TRA-19 Site). Occupational access is restricted and residential development is prohibited for at least 95 more years until soil is removed or the status is changed based on the results of a five-year review.
5.1.3.7 Brass Cap Area (Site Code TRA-Y). Occupational access is restricted and residential development is prohibited for at least 95 more years until soil is removed or the status is changed based on the results of a five-year review.
5.1.3.8 Sewage Leach Pond Berms and Soil Contamination Area. Remedial actions for the sewage leach pond berms and soil contamination area were conducted in conjunction with the sewage leach pond. For additional details see Section 5.1.3.4.
5-11

5.2 Data Evaluation
Site inspections were conducted annually for each site discussed in this section, as required by the OU 2-13 ROD (DOE-ID 1997b). The inspections were implemented through the Operations and Maintenance Plan for the Final Selected Remedies and Institutional Controls at Test Reactor Area, Operable Unit 2-13 (DOE-ID 2000b), and the inspections were documented in annual inspection reports. A summary of the annual site inspections for the years 2003 and 2004 is included in this data evaluation.
Additionally, groundwater monitoring under CERCLA has been ongoing at the RTC in accordance with the requirements of the OU 2-12 and OU 2-13 RODs (DOE-ID 1992; DOE-ID 1997b). On October 7, 1991, the EPA designated the SRPA as a sole-source aquifer under the Safe Drinking Water Act (42 USC § 300 et seq.). Although the SRPA and perched water beneath the RTC are listed as no-action sites, they are monitored extensively, because changes in these sites may be indicative of the effectiveness of the remedies in place at the OU 2-13 sites or may indicate the occurrence of a new release.
Under the Groundwater Monitoring Plan for the Test Reactor Area Operable Unit 2-13 (DOE-ID 2004), perched-water and aquifer wells are routinely sampled for the COCs chromium, tritium, Co-60, and Sr-90. Previously, perched-water and aquifer wells were sampled for the radiological contaminants Am-241, Cs-137, Co-60, Sr-90, H-3, and the inorganic contaminants arsenic, beryllium, cadmium, chromium, fluoride, lead, manganese, and mercury. Water quality results show little impact (most levels are near detection limits) for Am-241, Cs-137, arsenic, beryllium, cadmium, fluoride, lead, manganese, and mercury. In addition to sampling for contaminants, water levels also are collected from monitoring wells located near the RTC as part of routine monitoring activities. The United States Geological Survey (USGS) also monitors selected wells at the RTC, and data from the monitoring are used to supplement information collected under CERCLA-driven monitoring.
5.2.1 Site Inspections
Annual site inspections included visual inspections of the engineered soil covers, vegetation, and rip-rap covers. Radiological surveys also were performed on the warm waste pond and sewage leach pond covers and on the sewage leach pond soil contamination area to ascertain the extent, if any, of contaminant migration.
Visual site inspections showed that the engineered covers are functioning as designed, and the covers show no sign of erosion or animal intrusion; however, the vegetation on the chemical leach pond, the sewage leach ponds, and the sewage leach pond soil contamination area was sparse. The results from the annual radiological surveys indicate that the remedies at the warm waste pond and sewage leach pond are functioning as intended with no unexplained radiological anomalies.
A review of the institutional controls indicated that they, too, are functioning as intended. Based on previous risk evaluations, institutional controls will need to be maintained until at least 2025, at which time they should be reevaluated.
5-12

5.2.2 Perched Water Data
The post-ROD monitoring plan (Dames & Moore 1993) specified that groundwater sampling and analysis for all COCs would be performed quarterly for six deep perched water wells (i.e., PW-11, PW-12, USGS-053, USGS-054, USGS-055, and USGS-056). The USGS has been collecting groundwater samples from wells near the RTC since the 1960s, but the USGS sampling has varied over the years in terms of wells, analytes, and frequency. Data from RTC area wells sampled by the USGS—but not required under the OU 2-13 groundwater monitoring plan (DOE-ID 2004)—were included in this five-year review. Figure 5-2 shows the locations of these and other perched-water and aquifer wells near the RTC. Table 5-4 lists the wells whose data were reviewed for this five-year review.
5.2.2.1 Perched Water Hydrogeologic Data Evaluation. Two perched water zones resulting from discharges of water to RTC ponds have been recognized. Historically, the cold waste pond has been the largest source of water for the perched water zones. From 1998 to 2004, the cold waste pond received an average of about 380 gal of water per minute. In the past, other surface sources of water, including the former warm waste pond and the chemical waste pond, represented only a small percentage of the total input to the subsurface. The history of liquid effluent discharge to ponds from 1982 through 2004 is summarized in Figure 5-3.
A strong correlation exists between water level patterns in the perched water system and the discharge rates to the cold waste pond. The thickness and size of the two perched water zones have changed over time, depending on the amount of water discharged to the RTC ponds. The relationship between pond discharge and the footprint of the perched water bodies has been tracked and described in numerous reports (Hull 1989; Doornbos et al. 1991; Dames & Moore 1992).
The shallow perched water zone is formed on a layer of fine-grained sediments at the alluvial-basalt contact at a depth of about 50 ft below land surface (bls). The primary source of water for the perched water system, the cold waste pond, receives only relatively uncontaminated effluent. The shallow perched water eventually percolates through the underlying basalt to a deeper perched water zone. Consequently, the data evaluation focuses on the deep perched water.
The deep perched water zone can be seen to range in elevation from less than 4,750 ft to more than 4,860 ft. It is elongated in a northwest-to-southeast direction and generally has a broad, flat top with steeply sloping flanks (Figure 5-4). On the most recent contour map, the deep perched zone is narrower, and the elevations range from less than 4,730 ft to more than 4,850 ft. The deep perched zone still has a flat top with steeply dipping sides, but the highest elevation is centered beneath the cold waste pond. The hydrographs of most wells tapping the deep perched zone have shown a marked decrease in water elevation over the same period of March 1991 to April 2003. This is likely attributed to the decreased discharge to the ponds between 1991 and 2003. Although it is not apparent from Figure 5-3, the average discharge rate to the cold waste pond between early 1982 and late 1991 was 460 gal per minute. Since late 1991, discharges to the cold waste pond have averaged 380 gal per minute. It is important to note that the apex of the deep perched zone is now centered beneath the cold waste pond, where formerly it had been larger, extending to the northwest beneath the old warm waste pond and the RTC facility.
5.2.2.2 Deep Perched Water Analytical Data Evaluation. Most of the wells in the deep perched water system show fluctuating or decreasing trends in COC concentrations over the sampling record. The following paragraphs discuss the major COCs in the perched water zone. Perched water data are compared to MCLs in the following paragraphs; however, this comparison is not intended to convey that the perched water represents an aquifer capable of sustained long-term use.
5-13

Figure 5-2. Map of monitoring wells at the Reactor Technology Complex.
5-14

Table 5-4. Monitoring wells reviewed for this five-year review. Shallow Perched Wells
CWP-01 CWP-02 CWP-03 CWP-04 CWP-05 CWP-06 CWP-07 CWP-08 CWP-09 TRA-A13 TRA-A77
Deep Perched Wells PW-07 PW-08 PW-09 PW-10 PW-11a PW-12a PW-13 PW-14a
USGS-053a USGS-054a USGS-055a USGS-056a
USGS-060 USGS-061 USGS-062 USGS-063 USGS-64 USGS-066 USGS-068 USGS-069 USGS-070 USGS-071 USGS-072 USGS-073 USGS-074 USGS-075a USGS-078 TRA-1933a
TRA-1934a
Aquifer Wells MTR-TEST SITE-19 TRA-DISP TRA-01 TRA-02 TRA-03 TRA-04 TRA-06Aa
TRA-07a TRA-08a USGS-058a USGS-065a
USGS-076 USGS-079 USGS-084 Highway-3a
MIDDLE-1823a
a. Well are identified in the OU 2-13 Groundwater Monitoring Plan (DOE-ID 2004).
DOE-ID = U.S. Department of Energy Idaho Operations Office OU = operable unit TRA = Test Reactor Area USGS = United States Geological Survey
Figure 5-3. Historical discharges of water to the Reactor Technology Complex ponds.
5-15

N
Reactor Technology Complex
PW-10
PW-11
PW-12
PW-13
PW-14
PW-7
PZ-1
USGS-053 USGS-054
USGS-055
USGS-060
USGS-061
USGS-062
USGS-063
USGS-064
USGS-066
USGS-068
USGS-069
USGS-070
USGS-071
USGS-072
USGS-073
USGS-074
USGS-075 PW-8
PW-9
USGS-056
4819.7
4807.2
4837.0
4852.0
dry
dry
4856.7
4852.4
4844.8
4859.6 4861.2
4849.3 dry
4835.5
4787.1
4854.9
dry
4738.0
4841.9
4851.3
4846.3
4768.0
4777.3
dry
dry 4857.2
4844.3
Chemical waste pond
Sewage pond
Warm waste pond
Cold waste pond
Boundary of deep perched zone
4749.0
USGS-078 0 1000 2000 3000 4000
Feet
Figure 5-4. Configuration of the deep perched water at the Reactor Technology Complex (November 2003).
The federal drinking water standard for chromium (total chromium) is 100 μg/L. Drinking water standards are based on unfiltered concentrations; however, differences in well construction and pumping rates make it difficult to evaluate concentrations of metals when the metals are present as particulate matter and in a dissolved state. In the hexavalent form, chromium is present in an anionic state (CrO4
2-) and is relatively mobile in groundwater. Unfiltered samples might contain metals present as particulate matter, while filtered samples are representative of the more mobile dissolved metals. Filtered samples also might contain some colloidal particles fine enough to pass through the filter. Filtered and unfiltered samples were collected for chromium and other metals from many of the wells. In general, filtered samples provide the best indication of groundwater contamination levels for chromium. Unfiltered
5-16

samples are influenced by variability in the degree of well development and are subject to greater variability introduced by the sampling process.
Generally, chromium data show decreasing or flat concentration trends in most of the deep perched water wells. The highest concentrations have occurred in wells proximal to the warm waste pond, as shown in Figure 5-5. Those wells had reported values as high as 800 μg/L during the 1993 to 1995 period. Filtered sample results have not exceeded the MCL (100 μg/L) since 2001 (Figure 5-5). The concentration data in the USGS-053 well show a break in the data record from approximately 1996 to 2003, because that well has been dry sporadically in recent years. The lining of the evaporation pond and the resultant decrease in infiltration might have caused the drying, because the well is to the southwest of the warm waste pond. The spike in chromium concentrations in USGS-053 in 1995 does not have a clear explanation, but recent concentrations are well below the MCLs.
The MCL for tritium is 20,000 pCi/L, and it has a half-life of 12.3 years. Tritium, as an isotope of hydrogen, travels with groundwater and is considered an ideal conservative tracer. Reductions in the activity of measured tritium can result from both dilution and radioactive decay.
Activities of tritium measured in deep perched wells proximal and distal to the warm waste pond versus time are shown in Figures 5-6 and 5-7, respectively. All wells show a drastic decline in reported values for tritium since completion of the remedial actions (construction of the new evaporation pond). With source-term elimination, radioactive decay plays a significant role in decreasing activity. Without the addition of new tritium to the subsurface, it is unlikely that tritium activity will ever increase. Included in Figures 5-6 and 5-7 are detailed plots of recent tritium activities for proximal and distal wells to the warm waste pond, respectively. The plots show that tritium is currently above the MCL for a few wells, but activities have declined steadily for the past 5 years in most wells. The USGS-055 well (Figure 5-6) showed an increase in tritium in the last sample collected, but the tritium was still well below its MCL.
The MCL is 8 pCi/L for Sr-90, which has a half-life of 29 years. As indicated by its high soil-to-water distribution coefficients (Kd 24 mL/g), Sr-90 is less mobile in soil water than tritium (Dames & Moore 1993). Strontium is present primarily as a divalent cation; thus, it behaves much like dissolved calcium.
Figure 5-8 shows Sr-90 levels for wells proximal to the warm waste pond for the period of record. Activities for these wells peaked in the early 1970s. Figure 5-8 also shows a detail of Sr-90 activities for deep perched wells proximal to the warm waste pond over the past 5 years. While most of the wells shown on the graph have concentrations that are above the MCLs, all wells show a general decreasing trend since the 2001 to 2002 timeframe.
For wells distal to the warm waste pond, only USGS-070 has consistently shown concentrations above the MCLs. The most recent sampling conducted in the spring of 2004 reported values for Sr-90 of approximately 34 pCi/L. The general trend in Sr-90 concentrations is a steady decline in the USGS-070 well over the interval from 1996 to 2004.
The MCL is 100 pCi/L for Co-60, which has a half-life of 5.2 years. Co-60 is relatively immobile in groundwater, as indicated by its high soil-to-water distribution coefficient (Kd 56 mL/g) (Dames & Moore 1993).
5-17

WELLS PROXIMAL TO THE WARM WASTE POND- CHROMIUM C
ON
CEN
TRA
TIO
N (u
g/L)
CO
NC
ENTR
ATI
ON
(uG
/L)
900
800
700
600
500
400
300
200
100
0
PW-11
PW-12
PW-13
USGS-053
USGS-054
USGS-055
USGS-056
MCL
Jan-90 Jan-95 Jan-00
SAMPLE DATE
RECENT DATA FOR WELLS PROXIMAL TO THE WARM WASTE POND- CHROMIUM
200
180
160
140
120
100
80
60
40
20
0
PW-11
PW-12
USGS-053
USGS-054
USGS-055
MCL
Jan-00 Jan-01 Jan-02 Jan-03 Jan-04
SAMPLE DATE
Figure 5-5. Chromium levels in wells proximal to the warm waste pond.
5-18

WELLS PROXIMAL TO THE WARM WASTE POND- TRITIUM C
ON
CEN
TRA
TIO
N (p
Ci/L
)
2500000
2000000
1500000
1000000
500000
0 Jan-60 Jan-65 Jan-70 Jan-75 Jan-80 Jan-85 Jan-90 Jan-95 Jan-00
SAMPLE DATE
WELLS PROXIMAL TO THE WARM WASTE POND- TRITIUM
PW-11
PW-12
PW-13
USGS-053
USGS-054
USGS-055
USGS-056
MCL
CO
NC
ENTR
ATI
ON
(pC
i/L)
80000
PW-11
PW-12 70000 PW-13
USGS-053
USGS-054 60000 USGS-055
MCL
50000
40000
30000
20000
10000
0 Jan-00 Jan-01 Jan-02 Jan-03 Jan-04 Jan-05
SAMPLE DATE
Figure 5-6. Tritium levels in wells proximal to the warm waste pond.
5-19

WELLS DISTAL TO THE WARM WAST POND- TRITIUM
1000000
900000
800000
700000 PW-7
PW-9
600000 USGS-066
USGS-070
USGS-071 500000
USGS-072
USGS-073 400000 USGS-074
USGS-078
MCL 300000
200000
100000
0
Jan-61 Jan-66 Jan-71 Jan-76 Jan-81 Jan-86 Jan-91 Jan-96 Jan-01
SAMPLE DATE
RECENT DATA FOR WELLS DISTAL TO THE WARM WASTE POND- TRITIUM
180000
160000
140000
120000
PW-9
USGS-066 100000 USGS-070
USGS-071
USGS-073 80000 USGS-078
MCL 60000
40000
20000
0 Jan-95 Jan-96 Jan-97 Jan-98 Jan-99 Jan-00 Jan-01 Jan-02 Jan-03 Jan-04
SAMPLE DATE
Figure 5-7. Tritium levels in wells distal to the warm waste pond.
CO
NC
ENTR
ATI
ON
(pC
i/L)
CO
NC
ENTR
ATI
ON
(pC
i/L)
5-20

WELLS PROXIMAL TO THE WARM WASTE POND- STRONTIUM-90
CO
NC
ENTR
ATI
ON
(pC
i/L)
CO
NC
ENTR
ATI
ON
(pC
i/L)
900
800
700
600
500
400
300
200
100
0
PW-11
PW-12
PW-13
USGS-053
USGS-054
USGS-055
USGS-056
MCL
Jan-65 Jan-70 Jan-75 Jan-80 Jan-85 Jan-90 Jan-95 Jan-00
SAMPLE DATE
RECENT DATA FOR WELLS PROXIMAL TO THE WARM WASTE POND- STRONTIUM-90
100
90
80
70
60
50
40
30
20
10
0
PW-11
PW-12
PW-13
USGS-053
USGS-054
USGS-055
MCL
Jan-00 Jan-01 Jan-02 Jan-03 Jan-04
SAMPLE DATE
Figure 5-8. Sr-90 concentrations proximal to the warm waste pond and recent data for Sr-90 concentrations proximal to the warm waste pond.
5-21

In general, Co-60 levels in the perched water have historically shown decreasing trends, with the highest results in wells used to monitor the deep perched water proximal to the warm waste pond (Figure 5-9). In recent years, most of the Co-60 levels have been below the MCL. One notable exception to the general trends of decreasing or fluctuating concentrations in the past 5 years occurred at the PW-12 well, which spiked to a value over 300 pCi/L in the spring of 2003. The concentration has steadily declined since the 2003 spike and was approximately 50 pCi/L in the sample collected during the spring 2004 sampling round.
A detailed study of the Co-60 spike in PW-12 was conducted and documented in the Response to the First Five-Year Review Report for the Test Reactor Area, Operable Unit 2-13, at the Idaho National Engineering and Environmental Laboratory (DOE-ID 2005), which reported that the spike likely resulted from remobilization of existing Co-60 because of changes in hydrogeologic conditions. Continued monitoring in accordance with the OU 2-13 Groundwater Monitoring Plan (DOE-ID 2004) was recommended in this well.
A layer of free-phase diesel product was discovered during the drilling of the PW-13 well in 1990. Shortly after the installation of the well, a series of measurements was taken to determine the presence and thickness of the floating product. Since then, the well has been monitored intermittently, revealing a high degree of variability in product thickness. Between February 2003 when the last five-year review was completed at WAG 2 and September 30, 2004, product thickness measurements were taken in PW-13 on four occasions (ICP 2004). Product was encountered three of the four times and continues to show variability in the thickness. Figure 5-10 shows the product thickness over time in the PW-13 well. Additional discussion of free-phase product sampling at WAG 2 is presented in Appendix B.
5.2.3 Snake River Plain Aquifer Data
Aquifer wells are currently sampled for the COCs chromium, tritium, Co-60, and Sr-90. Water level data also are collected from aquifer wells to evaluate groundwater flow directions.
5.2.3.1 Snake River Plain Aquifer Water Level Data Evaluation. The SRPA occurs approximately 450 ft below the RTC and consists of a series of saturated basalt flows and sedimentary materials. The SRPA is relatively permeable because of the presence of fractures, fissures, and rubble zones at contacts between individual basalt flows.
A groundwater elevation contour map was constructed for the SRPA under the RTC using data collected in June 2004 (Figure 5-11). Groundwater elevations were ascertained by subtracting depth-to-water measurements from surveyed elevation data plus the measured stick-up and then correcting for stretch and/or variations associated with the e-line tape and for borehole deviation in wells.
Generally, groundwater flows to the southwest under the ambient, hydraulic gradient. Figure 5-11 depicts the SRPA water table in June 2004. The inherent heterogeneity of the fractured basalt SRPA makes it difficult to contour the water table. Figure 5-11 also shows the inferred direction of groundwater flow beneath the RTC. The direction of flow is inferred, because the SRPA’s highly heterogeneous matrix creates anisotropy that can result in flow paths not perpendicular to the water level contours. Fluctuating water levels caused by recharge and pumping further complicate a determination of SRPA flow directions in the general vicinity of the RTC. Therefore, uncertainty exists about the direction of groundwater flow in the vicinity of the RTC because of the heterogeneity and the spatial and temporal changes that occur within the SRPA. At this time, it appears that a portion of the RTC within the fence line is not covered by the existing monitoring well network in the SRPA. Additional monitoring wells do not appear to be needed immediately but may need to be considered in the future, depending on further evaluation of sources within the RTC fence line.
5-22

WELL PROXIMAL TO THE WARM WASTE POND- COBALT 60 C
ON
CEN
TRA
TIO
N (p
Ci/L
)
2000
4000
6000
8000
10000
12000
14000
16000
18000
0 Jan-61 Jan-65 Jan-69 Jan-73 Jan-77 Jan-81 Jan-85 Jan-89 Jan-93 Jan-97 Jan-01 Jan-05
SAMPLE DATE
PW-11
PW-12
PW-13
USGS-053
USGS-054
USGS-055
USGS-056
MCL
RECENT DATA FOR WELLS PROXIMAL TO THE WARM WASTE POND- COBALT-60
CO
NC
ENTR
ATI
ON
(pC
i/L)
50
100
150
200
250
300
350
0 Jan-00 Jan-01 Jan-02 Jan-03 Jan-04
SAMPLE DATE
PW-11
PW-12
PW-13
USGS-053
USGS-054
USGS-055
MCL
Figure 5-9. Historical Co-60 levels in perched water wells.
5-23

0
1
2
3
4
5
6
7
8
9
5/7/90 1/31/93 10/28/95 7/24/98 4/19/01 1/14/04
Date
Free
Pro
duct
thic
knes
s (ft
)
Installed petro traps on 11/11/04
Figure 5-10. Free-phase product thickness over time in PW-13.
5-24

Figure 5-11. Snake River Plain Aquifer water table configuration for June 2004.
5-25

5.2.3.2 Snake River Plain Aquifer Analytical Data Evaluation. Currently, groundwater samples are collected on a semiannual basis from the TRA-06A, TRA-07, TRA-08, USGS-065, USGS-058, MIDDLE-1823, and Highway-3 aquifer wells. The samples are analyzed for chromium (filtered and unfiltered), Sr-90, gamma isotopes, and tritium. In addition to the usual analytes, aquifer wells were analyzed for I-129 and Tc-99 in the October 2003 sampling event, as agreed to in the previous five-year review report (DOE-ID 2003). The I-129 and Tc-99 concentrations were below detection limits in all samples.
Chromium is the only analyte that is currently above an MCL in aquifer wells. As of March 2004, chromium is above its MCL (100 µg/L) in two wells: USGS-065 and TRA-07. Unfiltered chromium samples show a general declining trend for the three aquifer wells that are immediately downgradient of the RTC (Figure 5-12) and are much lower than model predictions. The TARGET computer code was used to simulate groundwater flow and transport in a two-dimensional model to characterize the flow and migration of contaminants between the warm and cold waste ponds and the SRPA (DOE-ID 2005). Chromium concentrations show a consistent decline in USGS-065 and TRA-07 since August 1999. The linear trend line for TRA-07 suggests that chromium concentrations in both USGS-065 and TRA-07 will drop below the MCL sometime near 2008 (Figure 5-13). The date predicted by the linear trend line to drop below the MCL is considerably sooner than the 2034 date predicted by the TARGET computer model.
Unfiltered Aquifer Cr Concentrations
CO
NC
ENTR
ATI
ON
(ug/
L)
100
200
300
400
500
600
Linear Trend of TRA-07
0 Jan-90 Jan-92 Jan-94 Jan-96 Jan-98 Jan-00 Jan-02 Jan-04 Jan-06 Jan-08
SAMPLE DATE
TRA-06A TRA-07 TRA-08 USGS-058 USGS-065 USGS-076 MCL Modeled Cr Conc Linear (TRA-07)
Figure 5-12. Unfiltered chromium concentrations compared to model predictions (1990 to present).
5-26

PW-14
PW-11
PW-12
PW-13 USGS-053 USGS-054
USGS-055 USGS-056
USGS-058
USGS-068
USGS-065
TRA-06A
TRA-07
TRA-08
MIDDLE-1823
0 500 1000 1500 2000
LEGEND Perched Water Well with October 03, March 04 Chromium concentration (ug/L)
Sc ale
Feet
Big Lost River
TRA
34.6, 31.1
1.38, 1.38; 5.85, 5.61
Dry, Dry
5.03, 3.66
31, 43.5
18.7, 27.7
22, NS
6.61, 6.44
NS, NS
USGS-058
PW-12
Aquifer Well with October 03, March 04 Chromium concentration (ug/L)
Dry, Dry
ND Means not detected NS Means not sampled
26.9, 31
6.29, 8.32
150, 136 103, 109
13.4, 16.7
5.03, 3.66
13.4, 16.7
Figure 5-13. Chromium concentrations (μg/L) for October 2003 and March 2004.
All aquifer wells near the RTC were below the MCL (20,000 pCi/L) for tritium as of March 2004. Historically, TRA-07 and USGS-065 have been above the MCL. However, since 1999, concentrations have dipped below the MCL for tritium (Figure 5-14). Most wells show declining or relatively flat trends for tritium with some associated variability between sampling rounds (Figure 5-14). Sr-90 was not detected in any of the aquifer wells in the RTC vicinity since the last five-year review.
5-27

300000
250000
200000
150000
100000
50000
0 Jan-70 Jan-74 Jan-78 Jan-82
TRITIUM SRPA WELLS
TRA-07 TRA-08 USGS-65 MCL
Jan-86 Jan-90 Jan-94 Jan-98 Jan-02
SAMPLE DATE
TRITIUM SRPA WELLS
CO
NC
ENTR
ATI
ON
(pC
i/L)
0
5000
10000
15000
20000
25000
CO
NC
ENTR
ATI
ON
(pC
i/L)
TRA-07 TRA-08 USGS-065 MCL
Jan-00 Jan-01 Jan-02 Jan-03 Jan-04
SAMPLE DATE
Figure 5-14. Tritium concentration in selected Snake River Plain Aquifer wells in the vicinity of the Reactor Technology Complex for long-term trends and recent values.
5-28

5.2.4 Monitoring Results Summary
The primary COCs identified in SRPA wells are chromium and H-3, but only chromium exceeded an MCL. Measured concentrations of chromium in SRPA monitoring wells are decreasing and expected to reach the MCL sometime around 2008—considerably ahead of the model-predicted date of 2034. Tritium levels in all aquifer wells are below the MCL and are expected to continue to decrease due to radioactive decay and dilution.
Most of the contaminants monitored in the deep perched water zone show decreasing concentration trends since the last five-year review. Most contaminants also are below the MCLs in the deep perched water, with some notable exceptions discussed in the following paragraphs. Filtered chromium concentrations are below the MCLs in all deep perched water wells.
Tritium values are below the MCLs in all perched water wells except PW-11, which has been consistently above the MCLs since the early 1990s. There is a significant and established decreasing trend in the concentrations, however, and if the current trend continues, the concentrations will drop below the MCLs by 2007.
A number of perched wells have Sr-90 concentrations that are above the MCLs. These wells include most of the deep perched wells proximal to the warm waste pond (PW-12, PW-13, USGS-053, USGS-054, and USGS-055) and one distal perched water well (USGS-070). The concentration trends in most of these wells have been relatively flat, with some variation between sampling events. The USGS-070 well has shown a decreasing trend since about late 1996.
The Co-60 concentrations are currently below the MCLs in all deep perched water wells. As previously discussed, a spike of Co-60 was detected in PW-12 in recent years, but the concentration has returned to a value below the MCLs in the last two sampling rounds conducted in the fall of 2003 and the spring of 2004. The spike was attributed to changing hydrologic conditions in the vicinity of the well.
5.3 Progress since Last Review
The following actions were completed in response to issues identified in the previous five-year review, with complete results detailed in the Response to the First Five-Year Review Report for the Test Reactor Area, Operable Unit 2-13, at the Idaho National Engineering and Environmental Laboratory (DOE-ID 2005):
1. A systematic analysis was done to identify the source of increasing Co-60 and Sr-90 in the perched water. Potential sources of Co-60 near the PW-12 well were investigated, historical contaminant trends in perched water wells were evaluated, natural mechanisms that might create non-idealized behavior were assessed, and new research suggesting that non-ideal behavior might be a characteristic common to fractured rock vadose zones was examined. The analysis showed that the spike in Co-60 was probably due to changes in the rate of water infiltrating through residual contamination near PW-12.
2. The potential impacts of continued RTC operations on the perched water system and the assumptions used in the OU 2-13 ROD (DOE-ID 1997b) were evaluated. A water budget for the RTC was developed, the pre-ROD model with a new operational scenario was evaluated, and a new vadose flow and transport model using a commercially available, modern numerical simulator was developed (DOE-ID 2005). The updated flow modeling predicted that all of the concentrations of modeled contaminants in the SRPA would decrease below the MCLs by approximately 2034.
5-29

3. The Groundwater Monitoring Plan (DOE-ID 2004) was revised, and the number of analytes was reduced. One round of sampling also included I-129 and Tc-99.
4. A geochemical investigation was conducted to fingerprint various water sources at the RTC so that sources of water for perched water wells could be correlated. Additional samples of perched and aquifer water were collected, the distribution of contaminants in the perched water was examined to ascertain sources of contaminants, water sources were characterized based on major ion chemistry and oxygen and hydrogen isotope data to determine water sources, flow paths were examined using oxygen and hydrogen isotope data and major ion chemistry data, and information on contaminant sources and water sources was combined to characterize perched water bodies. The results of this investigation show that the perched water bodies below the RTC are from several distinct sources, most notably from the cold waste pond and leakage from underground water piping.
5. A field characterization effort was carried out to identify the extent and source of diesel in the PW-13 perched water well. Potential diesel sources were investigated, two new perched water wells were installed near PW-13, new wells and selected existing wells were sampled for dissolved constituents of diesel fuel, natural attenuation of diesel was evaluated, and natural mechanisms for “cycling” diesel in the subsurface were analyzed. The analysis showed that the recurrence of diesel is likely due to periodic trapping of the free-phase product in response to changes in the hydrologic conditions in the vicinity of the PW-13 well and that the selected remedy (i.e., no further action) remains protective. The study recommended continued monitoring of the free product thickness on a monthly basis. Petroleum traps have been installed in the three wells used for this investigation.
6. Vegetation at the chemical waste pond, the sewage leach pond, and the sewage leach pond soil contamination area continues to be monitored on an annual basis. The inspection conducted during Fiscal Year (FY) 2004 showed that the vegetation areas will require continued monitoring until native/planted flora is able to establish itself, as assessed during a five-year review.
5.4 Technical Assessment
The information provided in this technical assessment is based on previously compiled data regarding the operations, maintenance, and monitoring activities associated with the TRA-03, TRA-06, TRA-08, TRA-13, TRA-15, TRA-19, and TRA-Y sites.
5.4.1 Warm Waste Pond (TRA-03 Site)
Question A: Is the remedy functioning as intended by the decision documents?
The RAO at the warm waste pond was to inhibit the exposure of human or ecological receptors to radiological contamination remaining in place and resulting in unacceptable excess risk. Based on the review of the inspections and monitoring that have been conducted in the 2 years following the first five-year review, the remedy at the warm waste pond is functioning as intended by the decision documents. The operations and maintenance activities and the institutional controls are effective in maintaining the functionality and integrity of the remedy.
5-30

Question B: Are the exposure assumptions, toxicity data, cleanup levels, and remedial action objectives used at the time of the remedy selection still valid?
There have been no changes to the original exposure assumptions, toxicity data, cleanup levels, or RAOs since completion of the remedial action. As such, the original assumptions are still considered valid.
Question C: Has any other information come to light that could call into question the protectiveness of the remedy?
No.
5.4.2 Chemical Waste Pond (TRA-06 Site)
Question A: Is the remedy functioning as intended by the decision documents?
The RAO at the chemical waste pond was to inhibit the exposure of human or ecological receptors to toxic metal contamination remaining in place and resulting in unacceptable excess risk. Based on the review of the inspections and monitoring that have been conducted in the 2 years following the first five-year review, the remedy at the chemical waste pond is functioning as intended by the decision documents. The operations and maintenance activities and the institutional controls are effective in maintaining the functionality and integrity of the remedy.
Question B: Are the exposure assumptions, toxicity data, cleanup levels, and remedial action objectives used at the time of the remedy selection still valid?
There have been no changes to the original exposure assumptions, toxicity data, cleanup levels, or RAOs since completion of the remedial action. As such, the original assumptions are still considered valid.
Question C: Has any other information come to light that could call into question the protectiveness of the remedy?
No.
5.4.3 Cold Waste Pond (TRA-08 Site)
As stated previously, the cold waste pond is still being used. Contaminated soils were removed from the cold waste pond and consolidated under the engineered cover at the warm waste pond in 1999. Institutional controls are in place at the cold waste pond, and it is restricted to industrial use only.
Question A: Is the remedy functioning as intended by the decision documents?
The removal of soils during the 1999 OU 2-13 remedial action reduced the excess unacceptable risk to levels commensurate with industrial-use scenarios. Contaminated soil was removed during the OU 2-13 remedial action. Institutional controls and operations and maintenance activities were established. Based on the inspections conducted annually at the site, the institutional controls and the operations and maintenance activities are effective in maintaining the remedy as intended by the decision documents.
5-31

Question B: Are the exposure assumptions, toxicity data, cleanup levels, and remedial action objectives used at the time of the remedy selection still valid?
There have been no changes to the original exposure assumptions, toxicity data, cleanup levels, or RAOs since completion of the remedial action. As such, the original assumptions are still considered valid.
Question C: Has any other information come to light that could call into question the protectiveness of the remedy?
No.
5.4.4 Sewage Leach Pond and Sewage Leach Pond Soil Contamination (TRA-13 Site)
Question A: Is the remedy functioning as intended by the decision documents?
Routine, annual radiological surveys conducted at the sewage leach pond remedial action site in 2003 and 2004 demonstrated that the radiation levels remain unchanged at the site and are consistent with the site background. Additionally, visual inspections of the site indicate that the institutional controls (i.e., signage and land use restrictions) have been effective in maintaining the protectiveness of the remedy. Based on these findings, the remedy is functioning as intended by the decision documents.
Question B: Are the exposure assumptions, toxicity data, cleanup levels, and remedial action objectives used at the time of the remedy selection still valid?
There have been no changes to the original exposure assumptions, toxicity data, cleanup levels, or RAOs since completion of the remedial action. As such, the original assumptions are still considered valid.
Question C: Has any other information come to light that could call into question the protectiveness of the remedy?
No.
5.4.5 TRA-19 and TRA-Y Limited Action Sites
Institutional controls have been implemented at the TRA-19 and TRA-Y sites with the contingency for excavation and disposal of contaminated media that present an unacceptable risk.
Question A: Is the remedy functioning as intended by the decision documents?
Annual inspections of the TRA-19 and TRA-Y sites indicate that the institutional controls in place (i.e., signage and land use restrictions) are effective in maintaining the integrity of the sites and limiting exposure of human or ecological receptors to the contaminants remaining at these sites. As such, the contingency for excavation and disposal has not required implementation.
5-32

Question B: Are the exposure assumptions, toxicity data, cleanup levels, and remedial action objectives used at the time of the remedy selection still valid?
There have been no changes to the original exposure assumptions, toxicity data, cleanup levels, or RAOs since completion of the remedial action. As such, the original assumptions are still considered valid.
Question C: Has any other information come to light that could call into question the protectiveness of the remedy?
No.
5.5 Technical Assessment Summary
5.5.1 Warm Waste Pond (TRA-03 Site)
The warm waste pond was capped with an engineered cover, and institutional controls were put in place to ensure the protectiveness of the remedy. The technical assessment finds that the remedy and institutional controls are functioning as intended.
5.5.2 Chemical Waste Pond (TRA-06 Site)
The chemical waste pond was capped with a soil cover and vegetated, and institutional controls were put in place to ensure the protectiveness of the remedy. With the exception of sparse vegetation growth, the technical assessment finds that the remedy and institutional controls are functioning as intended.
5.5.3 Cold Waste Pond (TRA-08 Site)
The cold waste pond is an active site. The removal of contaminated soils and implementation of institutional controls provide protection for human health and safety and for the environment. The technical assessment finds the remedy and institutional controls are functioning as intended.
5.5.4 Sewage Leach Ponds (TRA-13 Site)
The sewage leach ponds were capped with a soil cover and vegetated, and institutional controls were put in place to ensure the protectiveness of the remedy. With the exception of sparse vegetation growth, the technical assessment finds that the remedy and institutional controls are functioning as intended.
5.5.5 Soil Surrounding Hot Waste Tanks at the TRA-613 Building (TRA-15 Site)
Institutional controls have been implemented at the TRA-15 site. The technical assessment finds that the no-action decision and underlying assumptions remain valid in the interest of protection of human health and safety and the environment.
5.5.6 Soil Surrounding Tanks 1 and 2 at the TRA-630 Building (TRA-19 Site)
Institutional controls have been implemented at the TRA-19 site, with the contingency for excavation if the institutional controls are not maintained. The technical assessment finds that the
5-33

underlying assumptions remain valid in the interest of protection of human health and safety and the environment.
5.5.7 Brass Cap Area (TRA-Y Site)
Institutional controls have been implemented at the brass cap area, with the contingency for excavation if the institutional controls are not maintained. The technical assessment finds that the underlying assumptions remain valid in the interest of protection of human health and safety and the environment.
5.5.8 Sewage Leach Pond Berms and Soil Contamination Area
The sewage leach pond berms and soil contamination area were included with the remedial action at the sewage leach ponds. As stated previously for the sewage leach ponds, the technical assessment finds that the remedy and institutional controls are functioning as intended.
5.5.9 Institutional Control Sites
Institutional controls have been implemented at the warm waste retention basin (TRA-04 site), the north storage area (TRA-34 site), the PCB spill at TRA-619 (TRA-B site), the PCB spill at TRA-626 (TRA-C site), the PCB spill at TRA-653 (TRA-E site), the hot tree site (TRA-X), and the SRPA. The technical assessment finds that the no-action decisions and underlying assumptions remain valid in the interest of protection of human health and safety and the environment.
5.6 Issues
Establishment and maintenance of desirable vegetation on the native soil covers for the chemical waste pond, the sewage leach pond, and the sewage leach pond soil contamination area were identified as issues during this five-year review.
5.7 Recommendations and Follow-up Actions
Recommendations for the WAG 2 sites stem from the response actions to issues identified during the first five-year review. The following actions are recommended to ensure long-term protectiveness of human health and the environment for the selected remedies for OU 2-13 (DOE-ID 2005):
• Monitor selected perched water wells for dissolved diesel components at least annually until it is confirmed that the free product observed in the PW-13 well is either a new problem or the residual of an old diesel spill.
• Continue monthly thickness monitoring and passive removal of diesel using petroleum traps in the PW-13, TRA-1933, and TRA-1934 wells.
• Monitor Voluntary Consent Order investigations of the piping systems at the RTC in relation to observed concentrations of Co-60 in PW-12. This will aid in developing a long-term understanding of the perched water system beneath the RTC.
• Correlate the stratigraphic and lithologic structure of the RTC subsurface with recent geochemical fingerprinting that indicates multiple and distinct sources for the perched water. Developing an enhanced understanding of the perched water bodies might provide additional insight into their influence on contaminant transport at the RTC.
5-34

• Continue monitoring perched water and groundwater wells according to the existing Groundwater Monitoring Plan (DOE-ID 2004).
• Monitoring and corrective actions should be implemented until invasive weed species have been eradicated and native vegetation has been restored to 70% of natural conditions. Monitoring and corrective actions should be performed in accordance with the requirements in the OU 2-13 Operations and Maintenance Plan (DOE-ID 2000b) and the Balance of INL Cleanup Integrated Weed Management Plan (ICP 2005).
• Revise operations and maintenance activities. For example, the frequency of radiological surveys at the sewage leach pond may be reduced from once a year to once every 5 years, based on the findings over the past years. Modifications to operations and maintenance activities will require agency approval.
5.8 Protectiveness Statement
Based on the data reviewed and the site inspections, the remedies are functioning as intended by the OU 2-13 ROD (DOE-ID 1997b) and as modified by the ESD (DOE-ID 2000a). No changes in the physical conditions of the sites have occurred that would affect the protectiveness of the remedies. No changes have occurred in the toxicity factors or risk factors for the COCs. Several issues have been identified that warrant further evaluation; however, there is no information that negates the protectiveness of the remedies at this time.
5.9 Section 5 References
40 CFR 300, 2003, “National Oil and Hazardous Substances Pollution Contingency Plan,” Code of Federal Regulations, Office of the Federal Register, August 2003.
42 USC § 300f to 300j-26, 1974, “Safe Drinking Water Act,” United States Code.
42 USC § 6901 et seq., 1976, “Resource Conservation and Recovery Act of 1976,” United States Code, October 21, 1976. (The 1980 Amendment is cited as the “Solid Waste Disposal Act Amendments of 1980.”)
42 USC § 9601 et seq., 1980, “Comprehensive Environmental Response, Compensation and Liability Act of 1980 (CERCLA/Superfund),” United States Code, December 11, 1980.
Dames & Moore, 1992, Remedial Investigation Report for the Test Reactor Area Perched Water System (Operable Unit 2-12), EGG-WM-10002, Rev. 0, Idaho National Engineering Laboratory, June 1992.
Dames & Moore, 1993, Post Record of Decision Monitoring Plan for the Test Reactor Area Perched Water System Operable Unit 2-12, EGG-ER-10547, Rev. 0, Idaho National Engineering Laboratory, June 1993.
DOE-ID, 1991, Federal Facility Agreement and Consent Order for the Idaho National Engineering Laboratory, Administrative Docket No. 1088-06-29-120, U.S. Department of Energy Idaho Operations Office; U.S. Environmental Protection Agency, Region 10; Idaho Department of Health and Welfare, December 4, 1991.
5-35

DOE-ID, 1991b, Declaration for the Warm Waste Pond at the Test Reactor Area at the Idaho National Engineering Laboratory—Declaration of the Record of Decision, Document ID 3320, Rev. 0, U.S. Department of Energy Idaho Operations Office, December 1991.
DOE-ID, 1992, Record of Decision, Test Reactor Area Perched Water System, Operable Unit 2-12, Document ID 5230, Rev. 0, U.S. Department of Energy Idaho Operations Office, December 1992.
DOE-ID, 1997a, Comprehensive Remedial Investigation/Feasibility Study for the Test Reactor Area Operable Unit 2-13 at the Idaho National Engineering and Environmental Laboratory, DOE/ID-10531, Rev. 0, U.S. Department of Energy Idaho Operations Office, February 1997.
DOE-ID, 1997b, Final Record of Decision, Test Reactor Area, Operable Unit 2-13, DOE/ID-10586, Rev. 0, U.S. Department of Energy Idaho Operations Office, December 1997.
DOE-ID, 1998a, Comprehensive Remedial Design/Remedial Action Work Plan for the Test Reactor Area, Operable Unit 2-13, DOE/ID-10643, Rev. 0, U.S. Department of Energy Idaho Operations Office, September 1998.
DOE-ID, 1998b, Groundwater Monitoring Plan for the Test Reactor Area Operable Unit 2-13, DOE/ID-10626, Rev. 0, U.S. Department of Energy Idaho Operations Office, July 1998.
DOE-ID, 1998c, Field Sampling Plan for Confirmation Sampling and Field Screening of Selected Sites at Waste Area Group 2, Operable Unit 2-13, DOE/ID-10657, Rev. 0, U.S. Department of Energy Idaho Operations Office, September 1998.
DOE-ID, 2000a, Explanation of Significant Differences to the Record of Decision for Test Reactor Area Operable Unit 2-13, DOE/ID-10744, Rev. 0, U.S. Department of Energy Idaho Operations Office; U.S. Environmental Protection Agency; and Idaho Department of Health and Welfare, Division of Environmental Quality, May 2000.
DOE-ID, 2000b, Operations and Maintenance Plan for the Final Selected Remedies and Institutional Controls at Test Reactor Area, Operable Unit 2-13, DOE/ID-10658, Rev. 3, U.S. Department of Energy Idaho Operations Office, March 2000.
DOE-ID, 2000c, Remedial Action Report for the Test Reactor Area Operable Unit 2-13, DOE/ID-10720, Rev. 0, U.S. Department of Energy Idaho Operations Office, July 2000.
DOE-ID, 2003, First Five-Year Review Report for the Test Reactor Area, Operable Unit 2-13, at the Idaho National Engineering and Environmental Laboratory, DOE/ID-11099, Rev. 0, U.S. Department of Energy Idaho Operations Office, September 2003.
DOE-ID, 2004, Groundwater Monitoring Plan for the Test Reactor Area, Operable Unit 2-13, DOE/ID-10626, Rev. 5, U.S. Department of Energy Idaho Operations Office, September 2004.
DOE-ID, 2005, Response to the First Five-Year Review Report for the Test Reactor Area, Operable Unit 2-13, at the Idaho National Engineering and Environmental Laboratory, DOE/NE-ID-11189, Rev. 0, U.S. Department of Energy Idaho Operations Office, May 2005.
Doornbos, Martin H., Julie L. Mattick, Deborah L. McElroy, Leah V. Street, Carolyn S. Blackmore, and Craig A. Dicke, 1991, Environmental Characterization Report for the Test Reactor Area, EGG-WM-9690, Rev. 0, Idaho National Engineering Laboratory, September 1991.
5-36

Hull, L. C., 1989, Conceptual Model and Description of the Affected Environment for the TRA Warm Waste Pond (Waste Management Unit TRA-03), EGG-ER-8644, Rev. 0, Idaho National Engineering and Environmental Laboratory, October 1989.
ICP, 2004, Annual Groundwater Monitoring Status Report for Waste Area Group 2 for Fiscal Year 2004, ICP/EXT-04-00484, Rev. 0, Idaho National Engineering and Environmental Laboratory, Idaho Completion Project, August 2004.
ICP, 2005, Balance of INL Cleanup Integrated Weed Management Plan, ICP/EXT-04-00654, Rev. 0, Idaho National Laboratory, Idaho Completion Project, March 2005.
INEEL, 2003a, Project Close-out Report for Waste Area Group 2, Test Reactor Area, INEEL/EXT-03-00028, Rev. 0, Idaho National Engineering and Environmental Laboratory, September 2003.
INEEL, 2003b, End of Well Report for MIDDLE-1823 Waste Area Group 10 Deep Corehole Vertical Profile, INEEL/EXT-03-00392, Rev. 1, Idaho National Engineering and Environmental Laboratory, July 2003.
INEL, 1993, Post Record of Decision Monitoring Plan for the Test Reactor Area Perched Water System Operable Unit 2-12, EGG-ER-10547, Rev. 0, Idaho National Engineering Laboratory, June 1993.
Jensen, N. R. and R. A. Montgomery, 1993, Explanation of Significant Differences for the Warm Waste Pond Sediments Record of Decision at the Test Reactor Area at the Idaho National Engineering Laboratory, Document ID 5253, Rev. 0, Idaho National Engineering Laboratory, March 1993.
Rood, S. M., G. A. Harris, and G. J. White, 1996, Background Dose Equivalent Rates and Surficial Soil Metal and Radionuclide Concentrations for the Idaho National Engineering Laboratory, INEL-94/0250, Rev. 1, Idaho National Engineering Laboratory, August 1996.
5-37

5-38

6. WASTE AREA GROUP 3 (IDAHO NUCLEAR TECHNOLOGY AND ENGINEERING CENTER)
The Idaho Nuclear Technology and Engineering Center (INTEC), formerly known as the Chemical Processing Plant (CCP), was established in 1952. Its primary mission was to reprocess uranium from spent nuclear fuel for defense purposes. Additional activities included research on and storage of spent nuclear fuel.
During the operational life of the INTEC facility, releases of radiological and hazardous materials have occurred. Consequently, INTEC was designated as WAG 3 under the FFA/CO (DOE-ID 1991). The FFA/CO divided WAG 3 into 13 OUs, with OU 3-13 intended to provide a comprehensive investigation of WAG 3. Figure 6-1 is a map of INTEC with the location of CERCLA sites outlined in blue.
This section summarizes the five-year review of remedial actions conducted under OU 3-13, including construction, operation, and maintenance of the ICDF. Because the ICDF plays a significant role in the disposal of contaminated materials from all CERCLA facilities at the INL Site, ICDF information is presented as Section 6.2.
6.1 Operable Unit 3-13
The Comprehensive RI/FS for the Idaho Chemical Processing Plant OU 3-13 at the INEEL—Part A, RI/BRA Report (Final) (DOE-ID 1997) was completed in 1997 and addressed 94 release sites. Eight sites were subsequently added or had their site description clarified. The Final Record of Decision Idaho Nuclear Technology and Engineering Center, Operable Unit 3-13 was signed in 1999 (DOE-ID 1999). The Explanation of Significant Differences for the Final Record of Decision for the Idaho Nuclear Technology and Engineering Center, Operable Unit 3-13 (DOE-ID 2004a) altered the remedy for the CPP-23, CPP-61, CPP-81, and CPP-82 sites. The CPP-81 and CPP-82 sites were identified as no-action sites, the CPP-61 site was reclassified as a no-further-action site, and the CPP-23 site was included as part of the OU 3-13 Group 5 remedy. Table 6-1 lists the sites planned for remediation, the no-further-action sites, and a site description and status.
The Comprehensive RI/FS for Idaho Chemical Processing Plant OU 3-13 at the INEEL—Part B, FS Supplement Report (DOE-ID 1998) grouped the WAG 3 release sites according to shared characteristics or common contaminant sources. The seven groups are listed in Table 6-2 along with associated COCs and cleanup goals. A chronology of significant events at INTEC is provided in Table 6-3.
6.1.1 Remedial Actions
6.1.1.1 Remedy Selection. The WAG 3 sites were grouped according to shared characteristics and common contaminant sources. A single remedy was selected for all sites within each group. Selected remedies for each group are described below.
Group 1 (Tank Farm Soil)—Group 1 represents principal threat waste from direct radiation exposures to workers or the public at sites within or near the INTEC tank farm and from potential leaching and transport of contaminants to the perched water or the SRPA, a sole source aquifer. The CPP-96 site is a consolidation of the individual tank farm soil sites and the intervening interstitial soils within the CPP-96 site boundary.
6-1

Figure 6-1. Map of CERCLA sites at the Idaho Nuclear Technology and Engineering Center.
6-2

Table 6-1. Waste Area Group 3 CERCLA sites. Site Code Site Description Remedy
Group 1 Sites—Tank Farm Soil CPP-96 Tank farm interstitial soils (consolidation of all previously OU 3-14 RD/RA
identified tank farm soil sites [identified below] and the intervening interstitial soils)
CPP-15 Solvent burner east of CPP-605 OU 3-14 RD/RA CPP-16 Contaminated soil from leak in line from CPP WM-181 to OU 3-14 RD/RA
the process equipment waste evaporator CPP-20 CPP-604 radioactive waste unloading area OU 3-14 RD/RA CPP-24 CPP tank farm area bucket spill OU 3-14 RD/RA CPP-25 Contaminated soil in the tank farm area north of CPP-604 OU 3-14 RD/RA CPP-26 Contaminated soil in the tank farm area from steam OU 3-14 RD/RA
flushing CPP-27 Contaminated soil in the tank farm area east of CPP-604 OU 3-14 RD/RA CPP-28 Contaminated soil in the tank farm area south of WM-181 OU 3-14 RD/RA
by the A-6 valve box CPP-30 Contaminated soil in the tank farm area near the B-9 valve OU 3-14 RD/RA
box CPP-31 Contaminated soil in the tank farm area south of OU 3-14 RD/RA
the WM-183 tank CPP-32 Contaminated soil in the tank farm area southwest and OU 3-14 RD/RA
northwest of the B-4 valve box CPP-33 Contaminated soil in the tank farm area near WL-102, OU 3-14 RD/RA
northeast of CPP-604 CPP-58 CPP process equipment waste evaporator overhead pipeline OU 3-14 RD/RA
spills CPP-79 Tank farm release near the A-2 valve box OU 3-14 RD/RA
Group 2 Sites—Soil under Buildings and Structures CPP-02 French drain west of CPP-603 To be remediated after
building removal CPP-41a Fire training pits between CPP-666 and CPP-663, under Planned to be remediated
asphalt during Group 3 activities (DOE-ID 2002a).
CPP-60 Paint shop at present location of CPP-645 To be remediated after building removal
CPP-68 CPP VES-UTI-652 abandoned gasoline tank (north of Planned to be remediated CPP-606) during Group 3 activities
(DOE-ID 2002a) CPP-80 CPP-601 vent tunnel drain leak To be remediated after
building removal CPP-85 WCF blower corridor Capped as part of WCF
closure CPP-86 CPP-602 waste trench sump To be remediated after
building removal CPP-87 CPP-604 vessel off-gas blower cell sump and floor drain To be remediated after
building removal
6-3
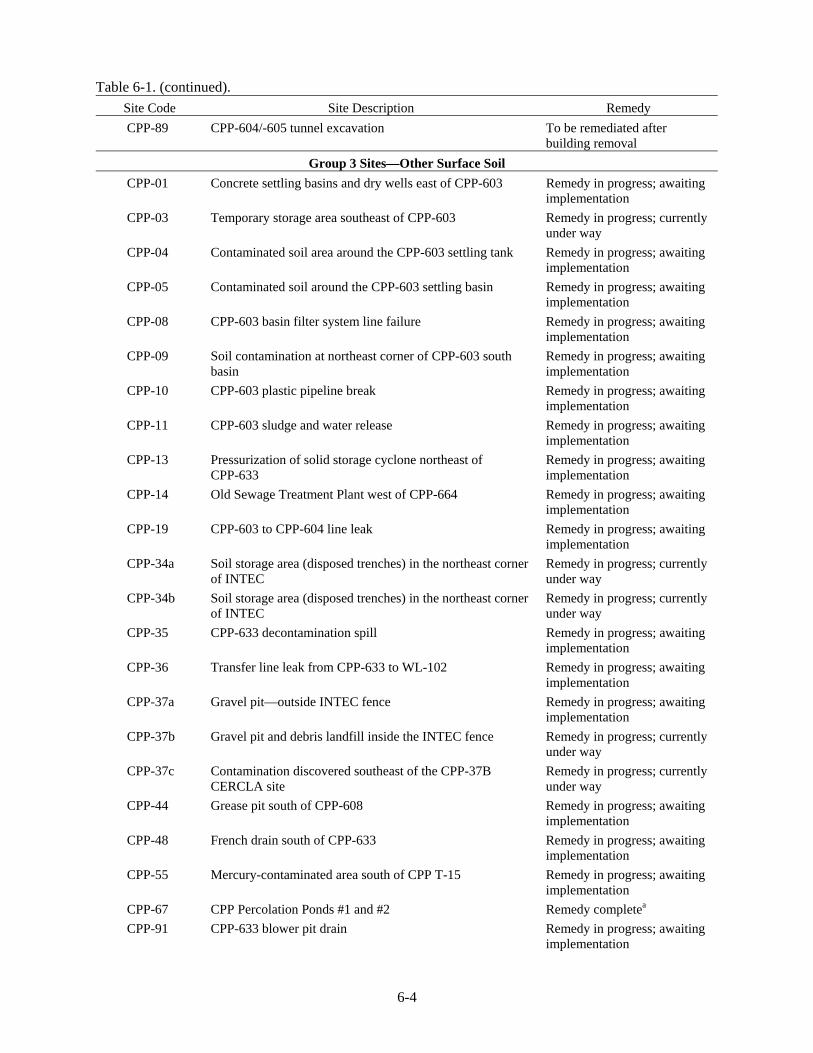
Table 6-1. (continued). Site Code Site Description Remedy CPP-89 CPP-604/-605 tunnel excavation To be remediated after
building removal Group 3 Sites—Other Surface Soil
CPP-01 Concrete settling basins and dry wells east of CPP-603 Remedy in progress; awaiting implementation
CPP-03 Temporary storage area southeast of CPP-603 Remedy in progress; currently under way
CPP-04 Contaminated soil area around the CPP-603 settling tank Remedy in progress; awaiting implementation
CPP-05 Contaminated soil around the CPP-603 settling basin Remedy in progress; awaiting implementation
CPP-08 CPP-603 basin filter system line failure Remedy in progress; awaiting implementation
CPP-09 Soil contamination at northeast corner of CPP-603 south Remedy in progress; awaiting basin implementation
CPP-10 CPP-603 plastic pipeline break Remedy in progress; awaiting implementation
CPP-11 CPP-603 sludge and water release Remedy in progress; awaiting implementation
CPP-13 Pressurization of solid storage cyclone northeast of Remedy in progress; awaiting CPP-633 implementation
CPP-14 Old Sewage Treatment Plant west of CPP-664 Remedy in progress; awaiting implementation
CPP-19 CPP-603 to CPP-604 line leak Remedy in progress; awaiting implementation
CPP-34a Soil storage area (disposed trenches) in the northeast corner Remedy in progress; currently of INTEC under way
CPP-34b Soil storage area (disposed trenches) in the northeast corner Remedy in progress; currently of INTEC under way
CPP-35 CPP-633 decontamination spill Remedy in progress; awaiting implementation
CPP-36 Transfer line leak from CPP-633 to WL-102 Remedy in progress; awaiting implementation
CPP-37a Gravel pit—outside INTEC fence Remedy in progress; awaiting implementation
CPP-37b Gravel pit and debris landfill inside the INTEC fence Remedy in progress; currently under way
CPP-37c Contamination discovered southeast of the CPP-37B Remedy in progress; currently CERCLA site under way
CPP-44 Grease pit south of CPP-608 Remedy in progress; awaiting implementation
CPP-48 French drain south of CPP-633 Remedy in progress; awaiting implementation
CPP-55 Mercury-contaminated area south of CPP T-15 Remedy in progress; awaiting implementation
CPP-67 CPP Percolation Ponds #1 and #2 Remedy completea
CPP-91 CPP-633 blower pit drain Remedy in progress; awaiting implementation
6-4

Table 6-1. (continued). Site Code Site Description Remedy CPP-92 Soil boxes west of CPP-1617 Remedy in progress; currently
under way CPP-93 Simulated calcine disposal trench Remedy in progress; awaiting
implementation CPP-97 Tank farm soil stockpile Remedy in progress; awaiting
implementation CPP-98 Tank farm shoring boxes Remedy in progress; currently
under way CPP-99 Boxed soil Remedy in progress; currently
under way Group 4 Site—Perched Water
CPP-83 The entire perched water system at INTEC Remedy in progress; currently under way
Group 5 Site—Snake River Plain Aquifer CPP-23 CPP injection well (MAH-FE-PL-304) Remedy in progress;
monitoring ongoing Group 6 Sites—Buried Gas Cylinders
CPP-84 Gas canisters (buried gas cylinders) Remedy completeb
CPP-94 Gas canisters (buried gas cylinders) Remedy completeb
Group 7 Site—SFE-20 Hot Waste Tank System CPP-69 CPP VES-SFE-20 abandoned liquid radioactive waste Remedy in progress; currently
storage tank under way No Further Action Sites
CPP-06 Trench east of CPP-603 fuel storage basin No further action; conduct five-year review.
CPP-17 Soil storage area south of CPP peach bottom fuel storage No further action; conduct area five-year review.
CPP-22 Particulate air release south of CPP-603 No further action; conduct five-year review.
CPP-61 PCB spill in CPP-718 transformer yard No further action; conduct five-year review.
CPP-88 Radiologically contaminated soil No further action; conduct five-year review.
CPP-90 CPP-709 ruthenium detection No further action; conduct five-year review.
CPP-95 Airborne plume (also shown in OU 10-06) No further action; conduct five-year review.
a. Remediation has been performed and is documented in the Site Completion Report for Area CPP-67, WAG 3, OU 3-13, Group 3, Other Surface Soils (DOE-ID 2005a). b. The remedy is complete for Group 6 (DOE-ID 2005b).
CERCLA = Comprehensive Environmental Response, Compensation, and Liability Act CPP = Chemical Processing Plant DOE-ID = U.S. Department of Energy Idaho Operations Office INTEC = Idaho Nuclear Technology and Engineering Center OU = operable unit PCB = polychlorinated biphenyl RD/RA = remedial design/remedial action WAG = waste area group WCF = Waste Calcining Facility
6-5

Table 6-2. Idaho Nuclear Technology and Engineering Center CERCLA site groups with contaminants of concern and cleanup goals.
Group Classification COCs Cleanup Goals Group 1 Tank Farm The final remedy has not been selected for Cleanup goals will be established in
Soil Group 1 soils; however, interim actions the OU 3-14 ROD. were selected to provide protection until the final remedy is developed under OU 3-14. Consequently, COCs have not been established.
Group 2 Soil under Buildings and Structures
Group 3 Other Surface Soil
Radionuclides: Am-241 Cs-137 Eu-152 Eu-154 Pu-238 Pu-239/240 Pu-240 Sr-90
Nonradionuclides: Mercury (human health)
Radionuclides: Am-241 Cs-137 Eu-152 Eu-154 Pu-238 Pu-239/240 Pu-241 Sr-90
Nonradionuclides: Mercury (human health)
Group 4 Perched Water The primary threat posed by perched water is migration of contaminants to the SRPA.
290 pCi/g 23 pCi/g 270 pCi/g 5,200 pCi/g 670 pCi/g 250 pCi/g 56,000 pCi/g 223 pCi/g
23 mg/kg
290 pCi/g 23 pCi/g 270 pCi/g 5,200 pCi/g 670 pCi/g 250 pCi/g 56,000 pCi/g 223 pCi/g
23 mg/kg Perched water remediation goals are as follows: • Reduce recharge to perched
water. • Minimize migration of
contaminants to the SRPA so that SRPA groundwater outside of the current INTEC security fence meets the applicable State of Idaho groundwater standards by 2095.
6-6

Table 6-2. (continued). Group Classification COCs Cleanup Goals
Group 5 SRPA Radionuclides:a
Sr-90 and daughters 8 pCi/L Tritium 20,000 pCi/L I-129 1 pCi/L Uranium and daughters 15 pCi/L Np-237 15 pCi/L Plutonium and daughters 15 pCi/L Am-241 and daughters 15 pCi/L
Nonradionuclides: Chromium 100 μg/L Mercury (human health) 2 μg/L
Group 6 Buried Gas Safety hazard Remedy the safety hazard posed by Cylinders cylinders by excavating, removing,
treating, and disposing of the cylinders.
Group 7 SFE-20 Hot Radionuclides and chemicals associated Limit potential external exposures to Waste Tank with the tank system workers and non-workers. Remove
radioactive and hazardous substances remaining in the tank system to prevent potential release to soil or groundwater.
a. The remedy for groundwater outside the INTEC security fence specified in the OU 3-13 ROD is considered final, but the final remedy for groundwater inside the fence was deferred to OU 3-14. The OU 3-14 ROD will establish the final remedy for the aquifer. COC = contaminant of concern INTEC = Idaho Nuclear Technology and Engineering Center OU = operable unit ROD = Record of Decision SRPA = Snake River Plain Aquifer
Table 6-3. Chronology of significant events. Event Date
Construction and operation of CPP began. 1952 The FFA/CO was signed (DOE-ID 1991). December 1991 Fuel processing operations at CPP were shut down. 1992 The Final Record of Decision Idaho Nuclear Technology and Engineering Center, Operable Unit 3-13 (DOE-ID 1999) was signed.
October 1999
The WCF was closed under RCRA (42 USC § 6901 et seq.), and capping was completed. November 1999 The Remedial Design/Remedial Action Work Plan for Group 1 Tank Farm Interim Action (DOE-ID 2000a) was issued.
September 2000
The Monitoring System and Installation Plan for Operable Unit 3-13, Group 4, Perched Water Well Installation (DOE-ID 2000b) was issued, and the remedial action process for perched water began.
September 2000
The Monitoring System and Installation Plan for Operable Unit 3-13, Group 5, Snake River Plain Aquifer (DOE-ID 2000c) was issued.
November 2000
Group 6: cylinders were removed from CPP-94. December 2000
6-7

Table 6-3. (continued). Event Date
The “Interim Remedial Action Report for the WAG 3 OU 3-13, Group 1, Tank Farm Interim Action (Draft)”a was issued.
July 2002
The Monitoring System and Installation Plan for Operable Unit 3-13, Group 5, Snake River Plain Aquifer (DOE-ID 2002b) was issued.
July 2002
The EPA and DEQ issued a notice of violation for not completing the tank farm interim action (Kreizenbeck 2002).
November 2002
The agency-approved agreement to resolve dispute for the tank farm interim action became effective (Bowhan 2003).
February 2003
Elevated Tc-99 concentrations were found in the SRPA. May 2003 The Remedial Design/Remedial Action Work Plan for the VES-SFE-20 Hot Waste Tank System (DOE-ID 2003a) was submitted to the regulatory agencies.
June 2003
The DOE and contractor resumed work on the tank farm interim action and issued the revised Remedial Design/Remedial Action Work Plan for Group 1, Tank Farm Interim Action (DOE-ID 2003b).
September 2003
The ICDF opened for receipt of first waste shipment (Drake and Edgett 2003). September 2003 The “Monitoring Report/Decision Summary for Operable Unit 3-13, Group 5, Snake River Plain Aquifer (Draft)”b (equivalent to a remedial action report) was issued.
September 2003
The Explanation of Significant Differences for the Final Record of Decision for the Idaho Nuclear Technology and Engineering Center, Operable Unit 3-13 (DOE-ID 2004a) was issued.
January 2004
The Operable Unit 3-13, Group 3, Other Surface Soils Remediation Sets 1–3 (Phase I) Remedial Design/Remedial Action Work Plan (DOE-ID 2004b) was completed.
February 2004
The Remedial Design/Remedial Action Work Plan for Operable Unit 3-13, Group 6, Buried Gas Cylinders (DOE-ID 2004c) was issued.
July 2004
Group 6: cylinders were removed from CPP-84. August 2004 The Monitoring Report/Decision Summary for Operable Unit 3-13, Group 5, Snake River Plain Aquifer (DOE-ID 2004d) concluded that the Group 5 remedy was operational and functional.
December 2004
The Remedial Action Report for the Tank Farm Interim Action, WAG 3, OU 3-13, Group 1, Tank Farm Soils (DOE-ID 2005b) was issued.
June 2005
The Remedial Action Report for Operable Unit 3-13, Group 6, Buried Gas Cylinders (DOE-ID 2005c) was issued.
June 2005
a. “Interim Remedial Action Report for the WAG 3 OU 3-13, Group 1, Tank Farm Interim Action (Draft),” DOE/ID-11007, Rev. 0, U.S. Department of Energy Idaho Operations Office, July 2002 b. “Monitoring Report/Decision Summary for Operable Unit 3-13, Group 5, Snake River Plain Aquifer (Draft),” DOE/ID-11098, Rev. 0, U.S. Department of Energy Idaho Operations Office, September 2003
CERCLA = Comprehensive Environmental Response, Compensation, and Liability Act CPP = Chemical Processing Plant DEQ = [Idaho] Department of Environmental Quality DOE = U.S. Department of Energy DOE-ID = U.S. Department of Energy Idaho Operations Office EPA = U.S. Environmental Protection Agency FFA/CO = Federal Facility Agreement and Consent Order ICDF = Idaho CERCLA Disposal Facility OU = operable unit RCRA = Resource Conservation and Recovery Act SRPA = Snake River Plain Aquifer USC = United States Code WAG = waste area group WCF = Waste Calcining Facility
6-8

The final remedial action decision for the Group 1 sites has been deferred. Additional site characterization, risk analysis, and remedial alternative evaluation are in progress under the OU 3-14 RI/FS. An interim action for Group 1 consisting of institutional controls with surface water control was selected in the OU 3-13 ROD (DOE-ID 1999).
The interim remedy for controlling surface water infiltration included grading and surface sealing of the tank farm soil, improving drainage to direct precipitation water away from the contaminated areas, and constructing a lined evaporation pond that would collect the precipitation run-off (Figure 6-2).
Figure 6-2. Paving activities within the tank farm.
Group 2 (Soil under Buildings and Structures)—Group 2 comprises release sites where contaminated soil is present under an existing building or structure. It was assumed that the buildings and structures limit infiltration of water through the contaminated soils and prevent direct exposure to the contaminated soils. The selected remedy for Group 2 was institutional controls and soil excavation or capping. Because the buildings and structures tend to limit infiltration, soil excavation and capping activities have been deferred until the buildings and structures are closed, decontaminated, and dismantled. Institutional controls have been established and maintained in the interim.
Group 3 (Other Surface Soil)—Group 3 comprises release sites within the WAG 3 area of contamination. The principal threat from these sites is external exposure. The remedy selected in the OU 3-13 ROD (DOE-ID 1999) was soil removal and disposal at the ICDF in addition to institutional controls and the notice of soil disturbance (NSD) process. Major components of the selected remedy included removal of contaminated soil and debris and backfilling with clean soil or, if appropriate, capping the soil in place pursuant to applicable landfill closure requirements to reduce the risk from external exposure to <1 × 10⁻⁴ and construction of the ICDF for disposal of the waste. Refer to Section 6.2 for information on the ICDF.
6-9

Group 4 (Perched Water)—Group 4 comprises the perched water that occurs at depths ranging between 100 and 420 ft in the basalt and the sedimentary interbeds beneath INTEC. Perched water consists of variably saturated zones above the regional SRPA. Potential sources for the perched water include infiltration of precipitation, the Big Lost River (when it flows), the INTEC sewage system’s infiltration trenches (taken out of service in 2004), lawn irrigation, process leaks, and other miscellaneous INTEC water sources. The former percolation ponds and previous service wastewater discharges to the deep vadose zone from the former injection well also were major contributors to perched water. The perched water zones are important, because they increase the opportunity for contaminants to move both laterally and vertically in the vadose zone and to potentially transfer contaminants to the deeper groundwater.
The selected remedy for Group 4 is institutional controls with aquifer recharge control. This remedy consists of (1) institutional controls in the form of administrative actions to restrict future use of perched water and (2) remedies to control the water infiltration and minimize downward movement of contaminated perched water to the SRPA. Perched water monitoring has been the mechanism by which aquifer recharge control is evaluated. Perched water monitoring includes sampling and analysis of perched water wells to ascertain changes in the areal extent and quality of perched water.
Group 5 (Snake River Plain Aquifer)—The major human health threat posed by contaminated SRPA groundwater is exposure to radionuclides via ingestion by future groundwater users. An interim action was selected for the SRPA. While the remediation of contaminated SRPA groundwater outside of the current INTEC security fence is final, the final remedy for the contaminated portion of the SRPA inside of the INTEC fence line has been deferred to the OU 3-14 ROD. As a result of dividing the SRPA groundwater contaminant plume into two zones, the OU 3-13 remedial action for Group 5 is classified as an interim action.
The selected interim action remedy for the SRPA is institutional controls with monitoring and contingent remediation. Specific provisions include the following:
• Implement institutional controls to prevent groundwater use within the portion of the SRPA that exceeds the MCLs for tritium, Sr-90, and I-129 until drinking water standards are met
• Construct new SRPA monitoring wells outside of the INTEC security fence to assess whether the MCLs will be exceeded after 2095
• If COCs exceed action levels at a sustainable pumping rate, implement a contingent pump-and-treat remedial action
• Conduct treatability studies, including a technical evaluation of treating the I-129 and other COCs, if a pump-and-treat remedy is determined to be necessary.
If necessary, contingent remediation would be implemented if the treatability studies show that pumping and treating are feasible and practicable.
Group 6 (Buried Gas Cylinders)—Group 6 comprises the CPP-84 and CPP-94 sites, which contained buried gas cylinders from INTEC construction and operations processes. The remediation goal for Group 6 was to remedy the safety hazard posed by the buried cylinders. Refer to Figure 6-3 for the location of the Group 6 sites. Refer to Figure 6-4 for a photograph of remedial activities at CPP-84. Figure 6-5 shows the reclaimed area at CPP-94.
6-10

Figure 6-3. Location of Group 6 sites.
Figure 6-4. Gas cylinder removal at the CPP-84 site.
6-11

Figure 6-5. New vegetation growth in June 2005 at the CPP-84 site.
Group 7 (SFE-20 Hot Waste Tank System)—Group 7 comprises the SFE-20 hot waste tank system, which is an abandoned radioactive liquid waste storage tank, its contents, and associated structures located about 10 ft below grade. The selected remedy for Group 7 was removal, treatment, and disposal of the tank and the liquid within the tank and implementation of institutional controls.
6.1.1.2 Remedial Action Objectives. The RAOs for OU 3-13 are specific risk criteria that take into consideration the assumed future land uses at INTEC. The human health RAOs for soils and groundwater at OU 3-13 include the following:
1. Groundwater
a. For INTEC-impacted groundwater (located in the groundwater-contaminant plume outside of the current INTEC security fence), restore the aquifer for use by 2095 and beyond so that the risk will not exceed a cumulative carcinogenic risk of 1 × 10⁻⁴ for groundwater ingestion.
b. For INTEC-impacted groundwater (located in the groundwater-contaminant plume outside of the current INTEC security fence), restore the aquifer to drinking water quality (below MCLs) for use by 2095 and beyond.
c. For INTEC-impacted groundwater (located in the groundwater-contaminant plume outside of the current INTEC security fence), restore the aquifer so that the noncarcinogenic risk will not exceed a total hazard index of 1 for groundwater ingestion.
d. For INTEC-impacted groundwater (located in the groundwater-contaminant plume outside of the current INTEC security fence), prevent groundwater consumption by the public until Objectives a, b, and c (listed above) are met.
e. Maintain caps placed over the contaminated soil or debris areas that are contained in place and the closed ICDF Complex to prevent the release of leachate to underlying groundwater, which would result in exceeding a cumulative carcinogenic risk of 1 × 10⁻⁴, a total hazard index of 1, or applicable State of Idaho groundwater quality standards (i.e., MCLs) in the SRPA.
6-12

2. Surface Soil
a. Prevent exposure to contaminated surface soils at each release site such that for all surface exposure pathways, a cumulative carcinogenic risk of 1 × 10⁻⁴ and a total hazard index of 1 are not exceeded at each release site. These RAOs also address no-further-action sites where the current radiological contaminant levels will meet the residential risk-based concentration on or before the year 2095. The RAOs will be achieved as follows:
(1) DOE operational phase (expected until 2045):
(a) Implement institutional controls to limit access and exposure duration at each source area to achieve a cumulative carcinogenic risk of 1 × 10⁻⁴ and a total hazard index of 1.
(b) Remove contaminated soil at each source area sufficient to achieve a cumulative carcinogenic risk of 1 × 10⁻⁴ and a total hazard index of 1 to a future residential user or cap in place contaminated soil or debris areas presenting a cumulative carcinogenic risk of 1 × 10⁻⁴ and a total hazard index of 1.
(2) Government control phase (expected between 2045 and 2095):
(a) Implement institutional controls to limit the duration and frequency of exposure to non-capped contaminated soil areas by the public to achieve a cumulative carcinogenic risk of 1 × 10⁻⁴ and a total hazard index of 1.
(b) Maintain caps for contaminated soil areas that are contained in place to prevent exposure of the public to a cumulative carcinogenic risk of 1 × 10⁻⁴ and a total hazard index of 1.
(c) Maintain the closed and capped ICDF Complex to prevent exposure of the public to a cumulative carcinogenic risk of 1 × 10⁻⁴ and a total hazard index of 1.
(3) Post-government control (beyond 2095): Continue institutional controls at all capped areas to prevent disturbance of capped areas to achieve a cumulative carcinogenic risk of 1 × 10⁻⁴ and a total hazard index of 1.
3. Perched Water
a. Prevent migration of radionuclides from perched water in concentrations that would cause SRPA groundwater outside of the current INTEC security fence to exceed a cumulative carcinogenic risk of 1 × 10⁻⁴, a total hazard index of 1, or applicable State of Idaho groundwater quality standards (i.e., MCLs) in 2095 and beyond.
b. Prevent excavation into and drilling through the contaminated earth materials remaining after desaturation of the perched water to prevent exposure of the public to a cumulative carcinogenic risk of 1 × 10⁻⁴ and a total hazard index of 1 and to protect the SRPA to meet Objective 3a listed above.
6-13

4. SRPA (INTEC-derived, groundwater-contaminant plume outside of the current INTEC security fence)
a. Prior to 2095, prevent current on-Site workers and the general public from ingesting SRPA groundwater that exceeds a cumulative carcinogenic risk of 1 × 10⁻⁴, a total hazard index of 1, or applicable State of Idaho groundwater quality standards (i.e., MCLs).
b. In 2095 and beyond, ensure that SRPA groundwater does not exceed a cumulative carcinogenic risk of 1 × 10⁻⁴, a total hazard index of 1, or applicable State of Idaho groundwater quality standards (i.e., MCLs).
5. Other Areas
a. For other source areas that either pose a safety hazard, a threat of release to groundwater, or an ecological hazard, the RAOs include the following:
(1) Eliminate the safety hazard posed by buried compressed gas cylinders at the CPP-84 and CPP-94 sites.
(2) Eliminate the threat of release to the SRPA posed by the SFE-20 hot waste tank system.
(3) Prevent ecological receptor exposure to surface soil COCs with a concentration greater than 10 times background concentrations that could cause adverse effects to resident populations of flora or fauna, as determined by the screening-level ecological risk assessment.
Based on the RAOs described above, remediation goals were established for each WAG 3 grouping. The following summarizes those remediation goals.
Group 1 (Tank Farm Soil)—The principal threats at the tank farm soil release sites are external exposure to radiation and potential leaching and transport of contaminants to the perched water or the SRPA. Consequently, the remediation goals for the tank farm interim action were as follows:
• Prevent intrusion into soil contaminants by the general public
• Reduce precipitation infiltration by approximately 80% of the average annual precipitation at the site
• Maximize run-off and minimize surface water ponding on the tank farm
• Prevent surface water run-on from a one-in-25-year, 24-hour storm
• Minimize infiltration and subsequent contaminant leaching due to external building drainage and run-on.
Group 2 (Soil under Buildings and Structures)—The principal threat posed by the Group 2 soil is external exposure to radionuclides and possibly leaching and transport of soil contaminants to the perched water or SRPA. The remediation goals for the period before decontamination and decommissioning (D&D) are to prevent exposure to current workers and non-workers and to minimize possible leaching and transport of contaminants to the underlying SRPA. The remediation goals for the
6-14

post-D&D period are to prevent exposure to future workers and residents and to minimize possible leaching and transport of contaminants to the underlying SRPA.
Group 3 (Other Surface Soil)—The principal threat posed by Group 3 soil is external exposure to contaminated soils. Therefore, the remediation goal is to prevent external exposure to current workers and non-workers and future workers and residents.
Group 4 (Perched Water)—The principal threat posed by perched water is migration of contaminants to the SRPA. The remediation goal is to reduce recharge to the perched zones and to minimize migration of contaminants to the SRPA so that SRPA groundwater outside of the current INTEC security fence meets the applicable standards by 2095.
Group 5 (Snake River Plain Aquifer)—The principal threat posed by the SRPA is ingestion of contaminated groundwater. The remediation goal is to prevent current on-Site workers and non-workers during the institutional control period from ingesting contaminated drinking water above the applicable groundwater standards or risk-based groundwater concentrations. The goal also is to achieve applicable State of Idaho groundwater standards or risk-based groundwater concentrations in the SRPA plume south of the INTEC security fence by the year 2095.
Group 6 (Buried Gas Cylinders)—The principal threat posed by the buried gas cylinders is a safety hazard that includes chemical exposure, fire, explosion, and projectile hazards. The remediation goal is to alleviate the safety hazard posed by the cylinders.
Group 7 (SFE-20 Hot Waste Tank System)—The principal threat posed by the SFE-20 tank system is external exposure and the potential for contaminant release to the environment. The remediation goal is to limit potential external exposures to workers and non-workers and to remove radioactive and hazardous substances remaining in the tank system to prevent potential contaminant releases to the underlying soils and groundwater. In January 2005, the first phase of the remediation of the SFE-20 system was initiated. That phase implemented the excavation of the tank vault, removal of the tank, characterization of the tank contents, removal and characterization of the loose surface contamination in the vault and pump pit, and installation of a new reinforced-concrete roof over the vault. The work plan states that the soils are to be reused to cover the excavation, since Phase II is planned to be initiated at a future date.
6.1.1.3 Remedy Implementation. The CERCLA institutional controls have been implemented at all WAG 3 release sites, in accordance with the OU 3-13 ROD (DOE-ID 1999) and EPA guidance on institutional controls. Institutional controls include warning signs posted at each site, boundary markers and access restrictions as needed, and activity and deed restrictions posted in the Idaho National Engineering and Environmental Laboratory Comprehensive Facility and Land Use Plan (DOE-ID 2005d). Institutional controls are inspected, maintained, and reported annually as part of the INL Sitewide effort. Institutional controls for each group are as follows:
• Group 1: Twelve of the 14 sites have warning signs placed on the tank farm perimeter fence rather than on each individual site. The CPP-15 and CPP-58 sites are not geographically located within the tank farm fence and have separate warning signs.
• Group 2: Warning signs are in place on the buildings or structures that cover the site.
• Group 3: Warning signs are in place to identify sufficiently the location and extent of the contamination site. In many cases, brass markers are in place to define the extent of the site.
6-15

• Groups 4 and 5: Restrictions (secured wellheads) are in place to control access to wells, and DOE controls are in place to prevent the installation of water supply wells.
• Group 6: Warning signs were in place while hazards were present at the sites.
• Group 7: Warning signs were in place while hazards were accessible. The site is currently under remediation, and the area is controlled as a CERCLA activity.
• No-further-action sites: Restrictions are in place to control soil excavation, assess soils for contamination, and restrict use of soil that exceeds remediation goals.
Institutional controls at WAG 3 include a requirement for NSD within the WAG 3 area of concern. The following requirement is found in the OU-13 ROD (DOE-ID 1999):
Before conducting any site disturbance activities, the regulatory agencies will be notified to the extent of any disturbance and provided with a plan for their approval, including necessary corrective actions that will be performed to ensure that the remedies identified in the ROD remain operational and functional. A formal system for notification and approval of disturbances to the OU 3-13 sites will be developed during the remedial design.
Eighty NSDs have been requested between September 1999 and September 2004. Most soil disturbances have involved the CPP-88 and CPP-95 no-further-action sites and the general soils within the INTEC security fence and outside of the security fence, respectively. Seven NSDs were requested at Group 1 sites; one involved Group 2 soil, and four involved Group 3 soil. The NSD process has been effective in tracking and controlling soil disturbances at INTEC.
Group 1 (Tank Farm Soil)—The OU 3-13 ROD (DOE-ID 1999) required an interim remedial action for the INTEC tank farm to protect human health and the environment. That action was implemented through the Remedial Design/Remedial Action Work Plan for Group 1, Tank Farm Interim Action (DOE-ID 2003b). Refer to Figure 6-6 for the location of the tank farm interim action. The objectives of the tank farm interim action plan were to install and maintain institutional controls to prevent exposure to the tank farm soil and engineering controls to reduce water infiltration into the tank farm. To achieve the objective: (1) an asphalt cover was placed over three soil contamination sites within the tank farm to divert precipitation and reduce infiltration, (2) the storm water collection system around the tank farm was installed and improved, (3) a lift station was installed, and (4) an evaporation pond with a leak-detection system was installed to serve as the collection point for the diverted run-off.
Installation of the project’s components began in FY 2001; however, because of funding limitations, the project did not meet the enforceable completion date for the draft remedial action report (May 2002). As a result, the DOE was given a notice of violation for not demonstrating compliance with the requirements of the RD/RA work plan in accordance with the FFA/CO (DOE-ID 1991). The EPA, the DEQ, and the DOE-ID settled the notice of violation in an agreement effective in February 2003, which required the DOE-ID to complete the interim action activities as amended by the agreement to resolve dispute (Bowhan 2003).
6-16

Figure 6-6. Locations of the tank farm interim action components.
6-17

The RD/RA Work Plan (DOE-ID 2003b) was revised in May 2003 to incorporate changes to the interim action design in accordance with the agreement to resolve dispute, and construction work resumed. Phase I of the interim action was completed and certified in September 2003. Phase I included all work performed outside of the tank farm fence (upgrading culverts, lining ditches, asphalting areas surrounding the tank farm, installing a lift station, and installing the evaporation pond). Construction on Phase II of the interim action began in the spring of 2004 and was certified complete in September of that year. That work included placing impermeable asphalt caps over three soil contamination sites and installing drainage piping from the caps to the existing storm water collection system.
The Remedial Action Report for the Tank Farm Interim Action, WAG 3, OU 3-13, Group 1, Tank Farm Soils (DOE-ID 2005b) documents the project’s completion and final certification status. Operations and maintenance at the tank farm interim action will continue until the final remedy is selected and implemented as part of OU 3-14.
Group 2 (Soil under Buildings and Structures)—Remedy implementation for Group 2 is deferred until the buildings and structures are removed. Pending the building removal, the drainage from buildings on or near Group 2 sites was evaluated in accordance with the Drainage Evaluation Plan for Group 2—Soils under Buildings and Structures for Waste Area Group 3, Operable Unit 3-13 (DOE-ID 2000d). The Drainage Observation Report for Group 2—Soils under Buildings for Waste Area Group 3, Operable Unit 3-13 (DOE-ID 2000e) and the Storm Water Drainage Inspection Report/Long-Term Drainage Maintenance Plan for Group 2—Soils under Buildings and Structures for Waste Area Group 3, Operable Unit 3-13 (DOE-ID 2001a) identified corrective measures for the CPP-80, CPP-87, and CPP-89 sites. At CPP-80, a deteriorated seal in a foundation expansion joint was repaired in June 2001. Paving for CPP-87 and CPP-89 was deferred, as agreed upon by the regulatory agencies in accordance with the “Final Original Copy of Agreement to Resolve Dispute Waste Area Group 3, Operable Unit 3-13” (Bowhan 2003) and ensuing RD/RA Work Plan (DOE-ID 2003b). Group 2 sites that are planned to be remediated during Group 3 activities include the CPP-41a and CPP-68 sites (DOE-ID 2002a).
The CPP-85 CERCLA site is the WCF blower corridor that runs along the outside of the former WCF. The regulatory agencies agreed that the blower corridor would be closed in place by grouting along with the WCF closure project. The post-closure monitoring and maintenance requirements were addressed in the OU 3-13 ROD (DOE-ID 1999), which required that the WCF be included in the five-year review. The DEQ has since required that post-closure care of the WCF be conducted under the Hazardous Waste Management Act/Resource Conservation and Recovery Act (HWMA/RCRA) program (HWMA 1983; 42 USC § 6901 et seq.) rather CERCLA (42 USC § 9601 et seq.). Subsequently, the DOE-ID submitted an HWMA/RCRA post-closure permit application that was approved by the State of Idaho (DEQ 2003a). The post-closure permit requires periodic inspection and monitoring of the WCF cap and routine monitoring of the groundwater. As an OU 3-13 Group 2 site, this action is consistent with the remediation goals for the post-D&D period to prevent exposure to future workers and residents and to minimize possible leaching and transport of contaminants to the underlying SRPA.
Group 3 (Other Surface Soils)—The Group 3 sites were segregated into Phases I and II for implementation of the remedial actions. Sites planned for remediation as part of Phase I include the following:
• CPP-03—Temporary storage area southeast of the CPP-603 site
• CPP-34A/B—Soil storage areas (disposal trenches) in northeast corner of INTEC
• CPP-37A—Gravel pit outside of the INTEC fence
6-18

• CPP-37B—Gravel pit and debris landfill inside of the INTEC fence
• CPP-37C—New site contamination area southeast of the CPP-37B site
• CPP-92—Boxed soil from the tank farm upgrade and other INTEC excavations
• CPP-97—Tank farm soil stockpiles from the tank farm upgrade
• CPP-98—Tank farm shoring boxes from the tank farm upgrade
• CPP-99—Boxed soil from the tank farm upgrade and CPP-604 tunnel egress excavation.
Physical work on the remediation of Phase I sites was initiated in the summer of 2004 at the CPP-67 site (the percolation ponds) with the collection of verification samples. After verification sampling, approximately 2 ft of contaminated soil was removed from each pond, and demolition of associated buildings, service discharge piping, and concrete structures was completed. Confirmation sampling and gamma surveys were performed at each pond after excavation and demolition to confirm removal of the contaminated soil. All demolition and excavated materials were transported to the ICDF for disposal. A total of 21,026 yd3 was transported from the ponds and disposed of at the ICDF. A more detailed summary of the remedial actions performed at the CPP-67 site is presented in the Site Completion Report for Area CPP-67, WAG 3, OU 3-13, Group 3, Other Surface Soils (DOE 2005e). Additional remedial actions for WAG 3 sites performed since September 30, 2004, are discussed in Appendix B.
Remediation of the remainder of the Group 3 sites (Phase II) will be addressed in a separate RD/RA work plan that is currently scheduled for submittal to the regulatory agencies in October 2007.
Group 4 (Perched Water)—As of the end of 2004, activities completed to implement the remedy and reduce recharge included the following (DOE-ID 2005f):
• The percolation ponds were permanently taken out of service on August 26, 2002, reducing water infiltration at INTEC by ~1 million gal per day
• Sewage effluent was re-directed to new percolation ponds on December 2, 2004, reducing infiltration by ~40,000 gal per day
• The Tank Farm Interim Action Project (DOE-ID 2005b) installed concrete-lined ditches around the tank farm to reduce water infiltration (2003–2004)
• Subsurface injection of steam condensate was reduced from ~2,013 gal per day (1997) to ~80 gal per day (2003)
• Lawn irrigation was reduced through elimination of grassed lawn areas.
Additional efforts that are now under way to further reduce recharge to the perched water and the aquifer include the following:
• Testing of underground pipelines to locate and eliminate water leaks
• Elimination of clean water discharges to the ground inside the INTEC fence
• Cement lining of additional ditches at INTEC to reduce storm water infiltration.
6-19

Group 5 (Snake River Plain Aquifer)—The first Group 5 RAO is being met by maintaining institutional control over the area of the identified SRPA contaminant plume south of the current INTEC security fence. Groundwater monitoring and modeling have been and are being performed to address the second RAO (post-2095 risk).
Groundwater monitoring results demonstrate that since 2003, tritium and I-129 concentrations in groundwater have been below their respective drinking water MCLs in all SRPA monitoring wells downgradient of INTEC (DOE-ID 2004d). Coupled with the modeling results (DOE-ID 2004d), groundwater monitoring performed over the past 20 years indicates that the RAOs for I-129 and tritium have already been met.
Currently, Sr-90 concentrations in groundwater exceed the MCL downgradient of INTEC, but Sr-90 concentrations are slowly declining in most wells (see Section 6.1.2.3). Groundwater quality trends indicate that Sr-90 concentrations in groundwater outside of the INTEC security fence will decline below the MCL by 2095 (DOE-ID 2004d). However, perched water and vadose zone materials near the tank farm constitute a residual secondary source of Sr-90 and Tc-99 that is being investigated and addressed under the OU 3-14 remedial investigation (DOE-ID 2005f).
Explanation of Significant Differences and the CPP-23 Injection Well—Evaluation of new and existing information associated with the CPP-23 injection well, including monitoring of contaminants in the SRPA and perched water since the issuance of the OU 3-13 ROD (DOE-ID 1999), provided sufficient information to expand the Group 5 remedy in the OU 3-13 ROD to encompass the CPP-23 site through the ESD (DOE-ID 2004a). An evaluation of the CPP-23 site was previously pending via the OU 3-14 process. The supporting information for this action was documented in the ESD and included the “INTEC Injection Well: Summary of Historical Information and Groundwater Quality Trends” (EDF-3943), the Annual INTEC Water Monitoring Report for Group 4—Perched Water (2003) (DOE-ID 2003c), and the Monitoring Report/Decision Summary for Operable Unit 3-13, Group 5, Snake River Plain Aquifer (DOE-ID 2004d).
The ESD (DOE-ID 2004a) also revised the monitoring requirements to include vertical profiling of groundwater in three monitoring wells to monitor groundwater concentrations of I-129 derived from the former injection well. The Long-Term Monitoring Plan for Operable Unit 3-13, Group 5, Snake River Plain Aquifer (DOE-ID 2004e) provided the schedule for packer sampling. If I-129 concentrations remain below 5 pCi/L, groundwater monitoring will continue under the Group 5 Long-Term Monitoring Plan. If I-129 vertical profiles indicate concentrations at or above an action limit of 5 pCi/L, then additional monitoring wells might be required. The additional data would be used in the contaminant fate and transport model, which in turn would be used to make future decisions regarding the need for a contingent groundwater remedy.
Groundwater Modeling Changes—The Monitoring Report/Decision Summary (MRDS) (DOE-ID 2004d) revised the groundwater model and provided new data for the hazard index (HI) interbed thickness and physical properties. The new information demonstrated that elevated radionuclide concentrations do not exist within the HI interbed downgradient of INTEC. In addition, the INTEC model is being revised under the OU 3-14 tank farm soil and groundwater RI/FS to reconcile data gathered since the OU 3-13 modeling was conducted. Changes in the OU 3-14 RI/FS include the following:
• New data on COC concentrations and source terms
• Vertical profiling of wells
• Properties of interbeds
6-20

• Drain-out of perched water after relocation of the percolation ponds
• Properties of the HI interbed
• Revised source terms for tank farm soil contamination and the former INTEC injection well
• A geostatistical stratigraphic model based on lithology to replace the effective interbeds’ approach used in the OU 3-13 model and based on estimates of precipitation infiltration revised from past moisture monitoring
• New infiltration data from the INTEC water balance study.
Group 6 (Buried Gas Cylinders Remedy Implementation)—The selected remedy for Group 6 was removal, treatment, and disposal of the buried gas cylinders. Refer to Figure 6-3 for the location of the Group 6 sites. Remediation of the CPP-94 site was performed in 2000 and included a geophysical survey to locate all cylinders; clearing of vegetation; mobilization of equipment; hand excavation and exhumation of six hydrofluoric cylinders; decommissioning and disposal of five empty hydrofluoric cylinders; shipment of a hydrofluoric gas cylinder containing product to an off-Site facility for treatment; and post-removal soil sampling. Reclamation activities at the CPP-94 site were performed in 2004 in conjunction with the CPP-84 site. The activities included site grading and reseeding with native plant species. Institutional control signs have been removed.
Remediation of the CPP-84 site was performed in 2004 and included a geophysical survey to find the cylinder burial location; clearing of vegetation; mobilization of equipment; excavation, exhumation, and segregation of 148 gas cylinders; on-Site treatment of cylinders containing product other than chlorine and Freon gases; decommissioning and recycling of 125 empty cylinders as scrap metal; disposal of 18 treated and decommissioned acetylene cylinders; shipment of one full chlorine gas cylinder and four partially filled Freon gas cylinders to off-Site facilities for recycling of the contents; and post-removal soil sampling. Reclamation activities at the CPP-84 site were performed in 2004 and included backfilling, site grading, and reseeding with native plant species. Institutional control signs have been removed.
The remedy for Group 6 has been completed and is documented in the Remedial Action Report for Operable Unit 3-13, Group 6, Buried Gas Cylinders (DOE-ID 2005c).
Group 7 (SFE-20 Hot Waste Tank System)—The DEQ issued the HWMA/RCRA Closure Plan for VES-SFE-20 Hot Waste Tank System at INTEC (DEQ 2003b) that included all of the ROD-specified requirements. The CERCLA remediation of the VES-SFE-20 tank system is being performed in a manner to meet the CERCLA objectives and to satisfy the additional requirements imposed by the HWMA/RCRA Closure Plan. Upon completion of the remediation, DOE will provide a RCRA closure certification.
Removal of the VES-SFE-20 tank and contents is in progress and scheduled for completion by October 2006. Phase II, removal of the vault and soil remediation, is scheduled for completion in 2010.
6-21

6.1.2 Data Evaluation
The WAG 3 sites where remediation has been performed or additional data were collected include the following:
• CPP-67 (Group 3), CPP Percolation Ponds 1 and 2
• CPP-84 and CPP-94 (Group 6), buried gas cylinders sites
• Perched water (Group 4)
• SRPA (Group 5).
The following subsections describe the data obtained after remediation or during investigation.
6.1.2.1 CPP-67 Site (Group 3 Site). The Site Completion Report for Area CPP-67, WAG 3, OU 3-13, Group 3, Other Surface Soils (DOE-ID 2005g) was submitted to the regulatory agencies to document the achievement of the WAG 3 soil risk-based remediation goals. The Site Completion Report documents the results of confirmatory soil sampling performed at each pond after completion of excavation. Sampling was performed using the agency-approved sampling plan entitled “Chemical Processing Plant (CPP)-67 Confirmatory Sampling (INTEC Ponds 1 and 2)” (ESP-116-04 in [Kirchner 2005]). Table 6-4 provides a summary comparison of the CPP-67 sampling results relative to the OU 3-13 soil risk-based remediation goals. The table, using the highest analytical result for comparison, shows that the CPP-67 site has been adequately remediated.
6.1.2.2 CPP-84 and CPP-94 Sites (Group 6). Upon removal of the cylinders from CPP-84 and CPP-94, soil samples were collected in accordance with the Preliminary Characterization Plan for the OU 3-13 Group 6 RD/RA Buried Gas Cylinders; CPP-84 and CPP-94 (DOE-ID 2001b), the Remedial Design/Remedial Action Work Plan for Operable Unit 3-13, Group 6, Buried Gas Cylinders (DOE-ID 2004c), and the Quality Assurance Project Plan for Waste Area Groups 1, 2, 3, 4, 6, 7, 10, and Deactivation, Decontamination, and Decommissioning (DOE-ID 2004f).
Tables 6-5 and 6-6 list MCLs of contaminants of potential concern (COPCs) from each site as compared to action levels defined in the data quality objectives (DQOs). The only result reported above action levels is iron for the CPP-94 site. The OU 3-13 ROD (DOE-ID 1999) did not evaluate risk for essential nutrients below 10 times background levels. Iron is considered an essential nutrient. The maximum value for iron reported from the CPP-94 site is within background levels for the area as reported in the executive summary of the Background Dose Equivalent Rates and Surficial Soil Metal and Radionuclide Concentrations for the Idaho National Engineering Laboratory (INEL 1996). The iron result was evaluated, and action was deemed unnecessary. Consequently, results of the remediation effort meet cleanup DQOs defined in the RD/RA Work Plan (DOE-ID 2004c) and as required by the OU 3-13 ROD (DOE-ID 1999).
6-22

Table 6-4. Comparison of contaminant of concern levels at the CPP-67 site to the Operable Unit 3-13 risk-based remediation goals.
Soil Risk-Based Remediation CPP-67 Remediated COC Levels Goal for Single COCs Achieveda
COC (pCi/g or mg/kg) (pCi/g or mg/kg) Radionuclides
Am-241 290 NA for CPP-67 Cs-137 23 5.21E+00 + 2.55E-01 pCi/g Eu-152 270 Nondetect Eu-154 5,200 Nondetect Pu-238 670 NA for CPP-67 Pu-239/240 250 NA for CPP-67 Pu-241 56,000 NA for CPP-67 Sr-90 223 NA for CPP-67
Nonradionuclides Mercury (human health) 23 1.4 mg/kg
a. The CPP-67 results are the highest analytical results received from both ponds. COC = contaminant of concern CPP = Chemical Processing Plant NA = not applicable
Table 6-5. Post-removal confirmation sample results for the CPP-94 site compared to data quality objective action levels.
Maximum Sample Result Action Level COPC (mg/kg) (mg/kg)
Arsenic 1.1 E+01 3.1 E+01 Barium 8.0 E+02 5.5 E+03 Beryllium 6.7 E-01 1.6 E+02 Cadmium 1.4 E+00 3.7 E+01 Chromium 4.7 E+01a 2.3 E+02 Cobalt 9.7 E+00 4.7 E+03 Copper 2.7 E+01a 3.1 E+03 Fluoride 2.3 E+03b 3.7 E+03 Iron 2.6 E+04a,c 2.3 E+04 Lead 1.9 E+01 4.0 E+02 Mercury 5.0 E-02 2.3 E+01 Nickel 3.4 E+01d 1.6 E+03
a. Received a “J” validation flag. The material was analyzed for and detected at or above the applicable detection limit, but the reported value is an estimate and might be inaccurate or imprecise. The estimated values are well below action levels. b. An initial biased sample result from a discolored soil clump reported fluoride above the action level. Action was taken to remove and manage contaminated soil clumps, after which confirmation sampling was conducted. The reported result is the maximum concentration from the confirmation sampling effort. c. The ROD did not evaluate risk for essential nutrients below 10 times background levels. Iron is considered an essential nutrient. The maximum result reported is within background levels for the area (INEL 1996). The result was evaluated, and action was deemed unnecessary. d. Received an “E” flag, indicating the reported value was estimated due to interference during analysis. COPC = contaminant of potential concern INEL = Idaho National Engineering Laboratory ROD = Record of Decision
6-23

Table 6-6. Post-removal confirmation sample results for the CPP-84 site compared to data quality objective action levels.
Maximum Sample Result Action Level COPC (mg/kg) (mg/kg) Arsenic 1.3 E+01a 3.1 E+01 Acetone Not detected 1.6 E+03 Barium 2.2 E+02 5.5 E+03 Beryllium 9.6 E-01 1.6 E+02 Cadmium 5.2 E-01 3.7 E+01 Chromium 3.3 E+01 2.3 E+02 Cobalt 6.9 E+00b 4.7 E+03 Copper 1.8 E+01 3.1 E+03 Fluoridec 1.1 E+02b 3.7 E+03 Iron 2.0 E+04 2.3 E+04 Lead 1.4 E+01b 4.0 E+02 Mercury 2.0 E-02 2.3 E+01 Nickel 2.7 E+01 1.6 E+03 Asbestos Not analyzedd >1%
a. All arsenic results were reported with “R” validation flags, indicating that the data are not recommended for use. These flags were applied by the validator, because the laboratory failed to demonstrate adequate measurement precision for arsenic from the analysis of a representative sample and its duplicate. However, based on the results of other laboratory quality control parameters (i.e., spiked matrix samples and spiked control samples), the laboratory demonstrated good laboratory accuracy. Because it is not uncommon for laboratory precision to be poor for some analytes in solid samples due to matrix inhomogeneity and because the laboratory accuracy is believed to be sound for these analyses, the reported laboratory results are believed to be reliable enough to confirm that arsenic is below action levels. b. Received a “J” validation flag. The material was analyzed for and detected at or above the applicable detection limit, but the reported value is an estimate and might be inaccurate or imprecise. These estimated values are well below action levels. c. Fluoride was added as a COPC for the CPP-84 site upon the unexpected discovery of cylinders containing hydrofluoric gas. d. Asbestos sampling was omitted as prescribed in the Group 6 RD/RA Work Plan DQOs, because there was no visual evidence of asbestos, and none of the asbestos-containing cylinders (acetylene) were breached. COPC = contaminant of potential concern CPP = Chemical Processing Plant DQO = data quality objective RD/RA = remedial design/remedial action
6.1.2.3 Group 4 Water Data Evaluation. The Monitoring System and Installation Plan for Operable Unit 3-13, Group 4, Perched Water Well Installation (DOE-ID 2000b) was written in September 2000 and identified and described the work elements required to implement the remedies selected in the ROD. The Monitoring System and Installation Plan (MSIP) established a phased approach to data collection for the hydrologic system at INTEC while the percolation ponds were still operating. The MSIP also included a monitoring well and tracer study (MWTS) and an FSP. The MWTS was intended to investigate subsurface water movement from recharge sources at the sewage treatment plant and the former percolation ponds to the INTEC perched water and the SRPA. The tracer study was intended to help define the relationship between the northern and southern perched water zones.
One objective of the MWTS was to collect sufficient data to support the contingent remedial action decision to be made 5 years after use of the old percolation pond was terminated, which occurred in 2002. The decision will involve a determination of what additional measures, if any, are needed to prevent the perched water from transporting contaminants to the SRPA. That decision is scheduled for 2008.
The results of the Phase I MWTS were reported in May 2002 (DOE-ID 2002c) and revised in June 2003 (DOE-ID 2003d). Although the tracer test results were inconclusive because of the high
6-24

sorption rates of tracer dye on alluvium and interbed material, the tests provided important data regarding subsurface water velocities and the nature and extent of perched water below INTEC. The information in the report represented a significant update and revision to the hydrogeologic conceptual model, as compared with the information presented previously in the RI/FS (DOE-ID 1997) and OU 3-13 ROD (DOE-ID 1999).
The southern perched water system was created primarily by the disposal of service wastewater into the percolation ponds from 1984 to 2002. Data presented in the MWTS suggested that the northern and southern perched water systems at INTEC are isolated. This further implies that relocation of the percolation ponds will have little effect on the northern perched water. However, additional studies are being conducted under OU 3-13 Group 4 to ascertain the interaction of the two perched water systems.
Annual Water Monitoring Reports—The results of the 2003 perched water sampling efforts are reported in the Annual INTEC Water Monitoring Report for Group 4—Perched Water (2003) (DOE-ID 2003c). The data were collected between August 2002 and July 2003. Samples were collected from 17 perched wells and lysimeters. Perched water samples were analyzed for tritium, Sr-90, I-129, uranium isotopes, plutonium isotopes, Tc-99, Am-241, metals (filtered and unfiltered), anions, and gamma spectrometry. The results of routine perched water monitoring in 2004 are reported in the Annual INTEC Water Monitoring Report for Group 4—Perched Water (2004) (DOE-ID 2004g). An MRDS is scheduled for submission in April 2008.
The primary radioactive contaminants detected in the perched water during 2003 and 2004 were Sr-90, Tc-99, tritium, I-129, and nitrate. I-129, tritium, and Sr-90 were the analytes detected above their respective MCLsa in 2003/2004. The highest Sr-90 concentration was 458,000 pCi/L at Well 33-1. Tritium was detected above the MCL in one well (MW-17-2) in the southern part of INTEC. The concentrations of radioactive analytes at most well locations showed decreasing concentration trends. Pu-238 was detected in one well, and Pu-241 was detected at two other locations; however, these detections are suspect, because the detections are near the detection limits, and each detection is an isolated occurrence that is not confirmed by the presence of other plutonium isotopes. U-233/234 and U-238 were detected but at concentrations within background limits.
Water-level measurements were taken in perched wells at INTEC to evaluate the extent of perched water bodies and potential recharge sources. The tensiometer and water-level measurements indicate that only the wells in the immediate vicinity of the former percolation ponds are drying up in response to diversion of flow to the new percolation ponds. Wells in the northern part of INTEC near the tank farm show some fluctuations but do not appear to be affected by the service wastewater diversion, indicating that other water sources are contributing to the perched water in the northern part of INTEC.
The Annual INTEC Water Monitoring Report for Group 4—Perched Water (2004) (DOE-ID 2004g) confirmed that Sr-90 and H-3 were the principal radionuclides detected in perched water at concentrations exceeding their respective MCL. The Sr-90 concentrations exceeded the MCL of 8 PCi/L in 11 of the 22 perched wells sampled. The Sr-90 concentrations in the northern shallow perched wells were similar to those observed in 2003 in most of the wells, except for Well 33-1. Perched Well 33-1 near the main stack is notable, because it displayed the highest Sr-90 activity (458,000 pCi/L) and because it has been dry during most of the period between 1991 and 2004.
a. Perched water results are compared to drinking water MCLs; however, such comparison is for reference only and does not imply that the perched water zones constitute aquifers capable of sustained long-term yield.
6-25

Tritium concentrations slightly exceeded the MCL of 20,000 pCi/L in three of the wells. I-129 and Tc-99 were detected in several perched wells, but their concentrations did not exceed the MCLs. The Tc-99 concentrations in perched water in 2004 were similar to those observed in previous years.
The Annual INTEC Water Monitoring Report for Group 4—Perched Water (2004) (DOE-ID 2004g) shows that perched water wells near the former percolation ponds are now mostly dry following diversion of the service wastewater flow to the new percolation ponds in August 2002. In contrast, perched water levels beneath the northern part of INTEC near the tank farm do not appear to be declining, suggesting that other recharge sources are present in this area. Ascertaining the source of this water is one objective of the water system engineering study that is planned for completion in 2005. Additional studies are being conducted under OU 3-13 to ascertain the interaction of the two perched water systems.
Water System Engineering Study (2003)—As required by the DQOs in the Monitoring System and Installation Plan for Operable Unit 3-13, Group 4, Perched Water Well Installation (DOE-ID 2003e), a water system engineering study was conducted in 2003 to identify potential perched water recharge sources associated with INTEC operations (DOE-ID 2003f). Objectives were to compile process water flow data for the various water systems at INTEC and to perform water balance calculations to ascertain whether significant quantities of water could be leaking from underground pipelines. Because of inadequate metering, process water flow data were deemed inadequate to complete a defensible water balance. Therefore, the water system engineering study report recommended installation of new metering devices, redesign and/or modification of existing metering systems, and installation of new data-acquisition technology. Additional recommendations were included for eliminating or minimizing process water leaks or intentional discharges. Plant metering systems were upgraded during 2004, and completion of the water balance calculations using the recent flow data is planned for 2005. Results will be reported in a water balance report in 2005. In December 2004, the infiltration trenches that receive water from the sewage lagoons were taken out of service, and the water was rerouted to the new percolation ponds.
Technetium-99 (Tc-99)—In 2001, the ICPP-MON-A-230 well was installed to monitor the SRPA. The well is located approximately 300 ft north of the tank farm fence line and is screened from 443 to 483 ft with a pump intake depth at 474 ft bls. In May 2003, routine groundwater monitoring at the well indicated the presence of Tc-99 at 2,200 pCi/L, which is approximately twice the derived MCL for Tc-99 (900 pCi/L). This was the first time that Tc-99 concentrations in the SRPA had been found to exceed the MCL. The high Tc-99 concentration was confirmed in August 2003 by subsequent samples ranging from 2,000 to 2,840 pCi/L. The Tc-99 activity in the SRPA significantly exceeds the 200-pCi/L Tc-99 activities predicted in the original Comprehensive RI/FS for the Idaho Chemical Processing Plant OU 3-13 at the INEEL—Part A, RI/BRA Report (Final) (DOE-ID 1997) and the 20-pCi/L Tc-99 activity predicted by the more recent updated WAG 3 Group 5 modeling (DOE-ID 2004d).
The observed high Tc-99 activity is a concern, because Tc-99 has a long half-life (2.13 × 10⁵ years) and relatively high subsurface mobility (similar to tritium or I-129). The presence of Tc-99 in the groundwater at the observed concentrations raises questions regarding the true source term of Tc-99 and the ability of the model to properly predict its fate and transport. As a supplement to the Group 4 MSIP (DOE-ID 2003e), an investigation was performed during 2003 to ascertain the source of the Tc-99. The goal of the investigation was to determine whether the observed Tc-99 was the result of cross contamination and to evaluate the potential sources of Tc-99 contamination.
6-26

The results were reported in the Evaluation of Tc-99 in Groundwater at INTEC: Summary of Phase I Results (ICP 2004) and indicate the following:
• The source of the elevated Tc-99 activity in groundwater at the ICPP-MON-A-230 well is likely attributable to historical liquid waste releases at the tank farm (in particular, from the CPP-31 site).
• The most likely mechanism for transport of Tc-99 from contaminated soil at the tank farm to the SRPA is downward movement of contaminated water through the vadose zone to the water table.
• The former INTEC injection well likely constituted an earlier source of Tc-99 to the SRPA, but the resulting groundwater concentrations did not exceed the MCL. Most likely, the existing Tc-99 plume that extends south and downgradient of INTEC is primarily the result of service waste discharges to the former injection well, not contaminated soil at the tank farm. It is estimated that Tc-99 has been present in the SRPA beneath the northern portion of INTEC since at least 1995.
Geochemical Study for Perched Water (2004)—As required by the DQOs in the Group 4 MSIP (DOE-ID 2003e), a geochemical study was performed in 2003 and 2004 to ascertain sources of perched water in the northern part of INTEC. Data from the geochemical study will be published in 2005. The results will be used to assess the effectiveness of the Group 4 perched water remedy and to ascertain whether more measures are needed to reduce infiltration of water to the northern perched water zones.
Perched water levels are monitored monthly in approximately 65 perched monitoring wells at and near INTEC, and perched water samples are collected annually from the monitoring wells that have water. The following briefly summarizes recent perched water monitoring results and trends at INTEC.
Radionuclides (including Sr-90, Tc-99, I-129, and tritium) are the principal COCs in perched water at INTEC. Contaminant concentrations in perched water are compared with drinking water MCLs, but such comparison is only intended to provide a point of reference and does not imply that the perched water zones constitute aquifers nor that perched water must comply with drinking water standards. In general, radionuclide concentrations in perched water at INTEC have either remained nearly steady (Tc-99 and I-129) or have slowly declined over time (Sr-90 and tritium). Figure 6-7 shows the location of wells at INTEC. Perched water concentration trend plots are shown in Figures 6-8 and 6-9.
Historically, Sr-90 concentrations in perched water at INTEC have been much higher than in the underlying aquifer. During 2004, Sr-90 concentrations in perched water exceeded the 8-pCi/L MCL in 11 of the 22 perched water monitoring wells sampled. The 33-1 shallow perched well (south of the INTEC tank farm) contained the highest Sr-90 activity (458,000 pCi/L). Tritium concentrations exceeded the 20,000-pCi/L MCL in three of the wells. The highest tritium concentration observed in 2004 was 32,800 pCi/L in MW-17-2 (in the southern part of INTEC), which exceeds the 20,000-pCi/L MCL.
During 2004, I-129 and Tc-99 were detected in several perched wells, but their concentrations did not exceed the MCLs. Other radionuclides detected in one or more perched water samples at concentrations below the MCLs include Cs-137, Pu-241, U-233/-234, U-235, and U-238. Concentrations of uranium isotopes were similar to background levels at all locations, and none of the total uranium concentrations exceeded the MCL of 30 µg/L.
Nitrate is the predominant nonradionuclide contaminant in the perched water at INTEC. Nitrate concentrations exceeding the MCL (10 mg/L NO3-N) were observed in several shallow and deep perched wells in the northern part of INTEC, with the highest concentration observed at the 33-1 well (69 mg/L NO3-N). For wells that had been sampled previously, nitrate concentrations were consistent with historical levels.
6-27

Linc
oln
Blvd
.
Big Lost River
Legend &< &<&< CPP-04
CPP-05 ICPP-MON-A-021 ") Former Injection Well
&< Aquifer Wells # Perched Water Wells*
Project: MRDS Report Map Requestor: Jeffrey Forbes Sewage GIS Analyst: Ariel Hitchcock Treatment LagoonsDate Drawn: 7/18/2005 Disclaimer: Contact the INEEL SAL at
526-3529 for information about & &<< CPP-02 CPP-01the data shown on this map.
Path: X:\gis_projects\cpp\wells BLR-DP STL-SPFile Name: mwts_report_2005-ap_v4.mxd BLR-CH **##* ##* STL-DP *##*#*BLR-SP TF-SP STL-AL #* #*BLR-AL TF-CH STL-CH MW-24TF-AL
TF-DP ICPP-MON-A-230#*#*#*#*&< ## 33-4-1**
33-4-2 37-433-3 #*
#* MW-6
#* Tank Farm MW-20-1ICPP-2018 #* MW-20-2 MW-4-2
33-2 ICPP-2020 33-1 MW-4-1MW-10-2#*#* # ICPP-MON-A-022*#* MW-10-1 &<USGS-050 #* # ICPP-2019
Former Injection Well MW-3-1 # *
< #* MW-2* #MW-5-1 * ICPP-2021# *# < * MW-3-2 MW-5-2 #* &< 55-06Cleveland Blvd. MW-18-1 MW-12-1
MW-18-2 MW-12-2 MW-8 USGS-052&< ") MW-18-4 #* &< #
USGS-043 * MW-1-1
MW-1-4 USGS-040 &< MW-11-2
MW-11-1#*##*# CS-AL
* CS-DP* CS-SP #* CS-CH &< USGS-041USGS-044
&< &< USGS-047
USGS-046&<
USGS-049USGS-042 MW-14 &<&<&< #* USGS-045 USGS-048
&< MW-7-1MW-9-2 MW-7-2MW-9-1 MW-16 #*#*##*#* * #MW-13 * #* MW-17-1
MW-15 MW-17-2 MW-17-4
USGS-059 PW-6
&PP-SP &<
ICPP-1802 #* PP-DP <#* USGS-122ICPP-1803 PP-AL PP-CH*< * *# ##& # *#* USGS-123 #* PW-3USGS-051
PW-1ICDF &< #* Pond 1#* #* #* ICPP-1804 PW-5 PW-4
Pond 2 Former Percolation Ponds
ICPP-1783 USGS-057 #* USGS-067
&< ICPP-1800 PW-2 &<#* &< &< #* &< #* ICPP-1801 & &<< ICPP-1782 ICPP-1829
ICPP-1781 ICPP-1807 ±ICPP-1831 Feet
0 500 1,000 2,000
Figure 6-7. Wells at the Idaho Nuclear Technology and Engineering Center.
6-28
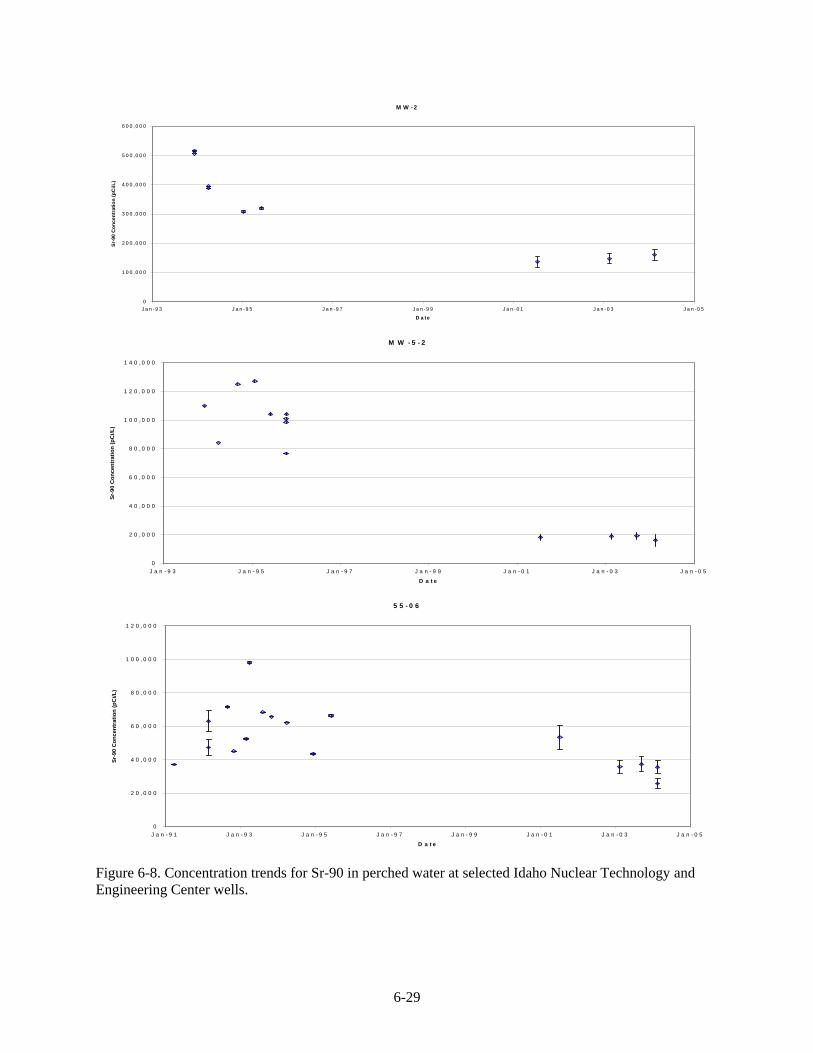
M W - 2 Sr
-90
Con
cent
ratio
n (p
Ci/L
) Sr
-90
Con
cent
ratio
n (p
Ci/L
) Sr
-90
Con
cent
ratio
n (p
Ci/L
)
6 0 0 ,0 0 0
5 0 0 ,0 0 0
4 0 0 ,0 0 0
3 0 0 ,0 0 0
2 0 0 ,0 0 0
1 0 0 ,0 0 0
0 J a n - 9 3 J a n -9 5 J a n -9 7 J a n - 9 9 J a n - 0 1 J a n -0 3 J a n -0 5
D a te
M W - 5 - 2
1 4 0 , 0 0 0
1 2 0 , 0 0 0
1 0 0 , 0 0 0
8 0 , 0 0 0
6 0 , 0 0 0
4 0 , 0 0 0
2 0 , 0 0 0
0 J a n - 9 3 J a n - 9 5 J a n - 9 7 J a n - 9 9 J a n - 0 1 J a n - 0 3 J a n - 0 5
D a t e
J a n - 9 1 J a n - 9 3 J a n - 9 5 J a n - 9 7 J a n - 9 9 J a n - 0 1 J a n - 0 3 J a n - 0 5
D a t e
Figure 6-8. Concentration trends for Sr-90 in perched water at selected Idaho Nuclear Technology and Engineering Center wells.
5 5 - 0 6
1 2 0 , 0 0 0
1 0 0 , 0 0 0
8 0 , 0 0 0
6 0 , 0 0 0
4 0 , 0 0 0
2 0 , 0 0 0
0
6-29

5 5 - 0 6
0
2 0
4 0
6 0
8 0
1 0 0
1 2 0 Tc
-99
Con
cent
ratio
n (p
Ci/L
)
J a n - 9 3 J a n - 9 5 J a n - 9 7 J a n - 9 9 J a n - 0 1 J a n - 0 3 J a n - 0 5
D a t e
M W - 1 0 - 2
7 0 0
6 0 0
5 0 0
4 0 0
3 0 0
2 0 0
Tc-9
9 (p
Ci/L
) Tc
-99
Con
cent
ratio
n (p
Ci/L
)
A rc h iv e d W a te r S a m p le s
Wel
l Rep
airs
Per
form
ed 1
994
1 8 0
1 6 0
1 4 0
1 2 0
1 0 0
8 0
6 0
4 0
2 0
0 J a n -7 0 J a n -7 5 J a n -8 0 J a n -8 5 J a n -9 0 J a n -9 5 J a n -0 0 J a n -0 5
D a te
1 0 0
0 J a n - 9 3 J a n - 9 5 J a n - 9 7 J a n - 9 9 J a n - 0 1 J a n - 0 3 J a n - 0 5
D a t e
U S G S -5 0
2 0 0
Figure 6-9. Concentration trends for Tc-99 in perched water at selected Idaho Nuclear Technology and Engineering Center wells.
6-30

Water levels are measured monthly in perched monitoring wells to evaluate the extent of perched water bodies and potential recharge sources at INTEC. Perched water wells near the former percolation ponds are now mostly dry following diversion of the service wastewater flow to the new percolation ponds in August 2002. Similarly, the MW-24 perched well near the sewage treatment plant has gone dry following the diversion of the wastewater effluent to the new percolation ponds in December 2004. In contrast, perched water levels beneath most of the northern part of INTEC have remained relatively constant from 2002 through 2004, and in a few cases, perched water levels have risen. The Big Lost River has been dry since May 2000; thus, it is concluded that additional recharge sources must exist in the northern part of INTEC to explain the observed perched water trends (other than the Big Lost River and the former percolation ponds). Additional evaluation of potential recharge sources for perched water is being performed to determine the appropriate actions to take. Activities being evaluated include (1) testing of underground pipelines to locate and eliminate water leaks, (2) elimination of clean water discharges to the ground inside the INTEC fence, and (3) cement lining of ditches at INTEC to reduce storm water infiltration.
6.1.2.4 Group 5 Water Data Evaluation. To implement the Group 5 remedy, the Monitoring System and Installation Plan for Operable Unit 3-13, Group 5, Snake River Plain Aquifer was issued in 2000 (DOE-ID 2000c). The MSIP is equivalent to the RD/RA Work Plan for the aquifer. As identified in the Monitoring System and Installation Plan for Operable Unit 3-13, Group 5, Snake River Plain Aquifer (DOE-ID 2002b), baseline groundwater sampling was performed at INTEC during 2001. The baseline round of sampling included nearly all aquifer monitoring wells in the vicinity of INTEC and downgradient of the Central Facilities Area (CFA) landfills. The Annual INTEC Groundwater Monitoring Report for Group 5–Snake River Plain Aquifer (2001) (DOE-ID 2001c) documented the results of the 2001 groundwater sampling. The report included plume maps and time-series trend plots for the principal radionuclide COCs (Sr-90, Tc-99, I-129, and H-3).
A plume investigation was conducted between July and November 2002. The field investigation included drilling of four new borings through the HI interbed; collecting groundwater samples from above, within, and below the HI interbed using an inflatable straddle packer; performing laboratory analysis of groundwater samples; and collecting interbed sediment samples for analysis of geotechnical properties. The results of this investigation were reported in the MRDS (DOE-ID 2004d).
Although the injection well was plugged with cement in 1989, the regulatory agencies expressed concern that the former INTEC injection well could constitute a continuing threat to groundwater quality. Therefore, an engineering design file (EDF) (EDF-3943) was prepared to summarize the history of the former injection well and to evaluate the possibility that significant levels of residual contaminant could be present in or near the well. The Explanation of Significant Differences for the Final Record of Decision for the Idaho Nuclear Technology and Engineering Center, Operable Unit 3-13 (DOE-ID 2004a) was signed in January 2004. One portion of the ESD pertains to groundwater quality and the former INTEC injection well. Because of lingering concerns regarding the possibility that significant levels of residual contaminants might be present in or near the former injection well, the ESD implemented additional monitoring requirements for the aquifer. Specifically, the ESD requires that depth-discrete groundwater samples be collected periodically from three existing aquifer monitor wells using an inflatable straddle packer. The three wells (USGS-44, USGS-46, and USGS-47) are located immediately downgradient of the former injection well. The schedule for packer sampling is detailed in a revision to the Group 5 long-term monitoring plan (DOE-ID 2004e) and requires that packer sampling be performed in 2005, 2007, and 2010. The ESD also established an “action level” for I-129 of 5 pCi/L, which will apply to the depth-discrete groundwater samples to be collected with the inflatable straddle packer. If the packer sampling results show that concentrations of I-129 in groundwater exceed 5 pCi/L at one or more depths in any of the three wells, additional steps will be taken to address residual I-129 source from the former
6-31
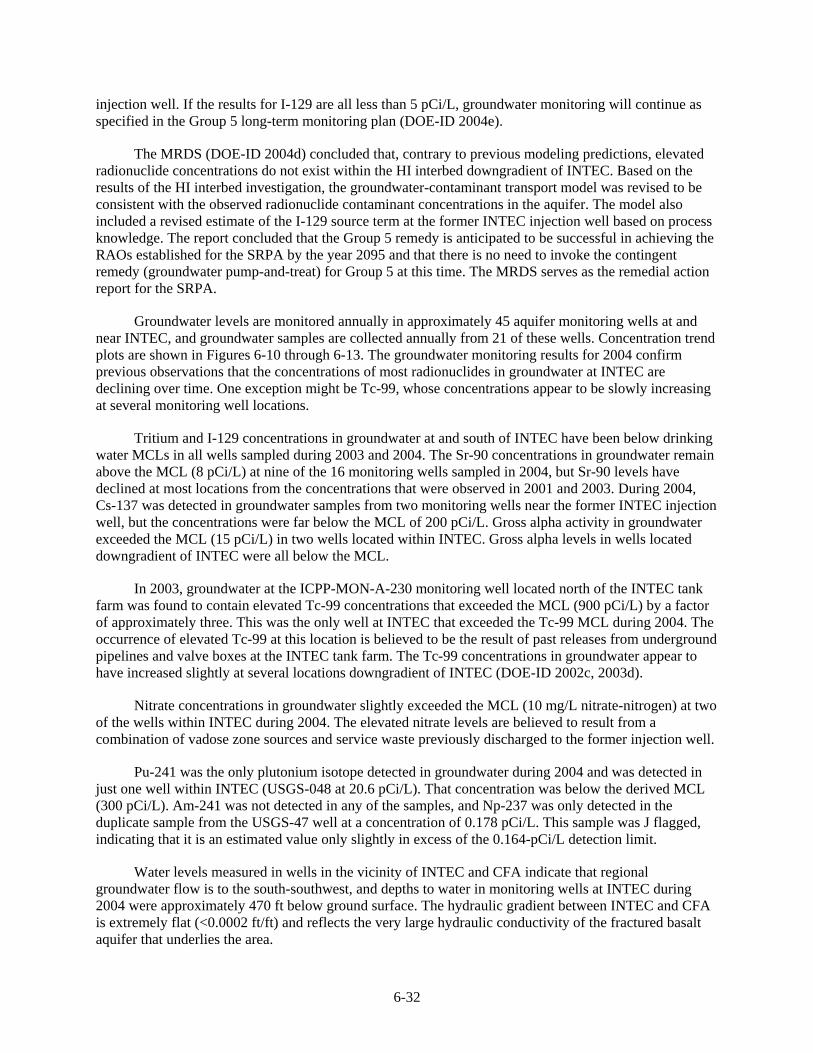
injection well. If the results for I-129 are all less than 5 pCi/L, groundwater monitoring will continue as specified in the Group 5 long-term monitoring plan (DOE-ID 2004e).
The MRDS (DOE-ID 2004d) concluded that, contrary to previous modeling predictions, elevated radionuclide concentrations do not exist within the HI interbed downgradient of INTEC. Based on the results of the HI interbed investigation, the groundwater-contaminant transport model was revised to be consistent with the observed radionuclide contaminant concentrations in the aquifer. The model also included a revised estimate of the I-129 source term at the former INTEC injection well based on process knowledge. The report concluded that the Group 5 remedy is anticipated to be successful in achieving the RAOs established for the SRPA by the year 2095 and that there is no need to invoke the contingent remedy (groundwater pump-and-treat) for Group 5 at this time. The MRDS serves as the remedial action report for the SRPA.
Groundwater levels are monitored annually in approximately 45 aquifer monitoring wells at and near INTEC, and groundwater samples are collected annually from 21 of these wells. Concentration trend plots are shown in Figures 6-10 through 6-13. The groundwater monitoring results for 2004 confirm previous observations that the concentrations of most radionuclides in groundwater at INTEC are declining over time. One exception might be Tc-99, whose concentrations appear to be slowly increasing at several monitoring well locations.
Tritium and I-129 concentrations in groundwater at and south of INTEC have been below drinking water MCLs in all wells sampled during 2003 and 2004. The Sr-90 concentrations in groundwater remain above the MCL (8 pCi/L) at nine of the 16 monitoring wells sampled in 2004, but Sr-90 levels have declined at most locations from the concentrations that were observed in 2001 and 2003. During 2004, Cs-137 was detected in groundwater samples from two monitoring wells near the former INTEC injection well, but the concentrations were far below the MCL of 200 pCi/L. Gross alpha activity in groundwater exceeded the MCL (15 pCi/L) in two wells located within INTEC. Gross alpha levels in wells located downgradient of INTEC were all below the MCL.
In 2003, groundwater at the ICPP-MON-A-230 monitoring well located north of the INTEC tank farm was found to contain elevated Tc-99 concentrations that exceeded the MCL (900 pCi/L) by a factor of approximately three. This was the only well at INTEC that exceeded the Tc-99 MCL during 2004. The occurrence of elevated Tc-99 at this location is believed to be the result of past releases from underground pipelines and valve boxes at the INTEC tank farm. The Tc-99 concentrations in groundwater appear to have increased slightly at several locations downgradient of INTEC (DOE-ID 2002c, 2003d).
Nitrate concentrations in groundwater slightly exceeded the MCL (10 mg/L nitrate-nitrogen) at two of the wells within INTEC during 2004. The elevated nitrate levels are believed to result from a combination of vadose zone sources and service waste previously discharged to the former injection well.
Pu-241 was the only plutonium isotope detected in groundwater during 2004 and was detected in just one well within INTEC (USGS-048 at 20.6 pCi/L). That concentration was below the derived MCL (300 pCi/L). Am-241 was not detected in any of the samples, and Np-237 was only detected in the duplicate sample from the USGS-47 well at a concentration of 0.178 pCi/L. This sample was J flagged, indicating that it is an estimated value only slightly in excess of the 0.164-pCi/L detection limit.
Water levels measured in wells in the vicinity of INTEC and CFA indicate that regional groundwater flow is to the south-southwest, and depths to water in monitoring wells at INTEC during 2004 were approximately 470 ft below ground surface. The hydraulic gradient between INTEC and CFA is extremely flat (<0.0002 ft/ft) and reflects the very large hydraulic conductivity of the fractured basalt aquifer that underlies the area.
6-32

Sr-90 in Groundwater vs. Time
Sr-9
0 A
ctiv
ity (p
Ci/L
) 500
MCL = 8 pCi/L 450
400 USGS-40 USGS-41 USGS-42 350 USGS-43 USGS-44
300 USGS-45 USGS-46 USGS-47
250 USGS-48 USGS-49
200 USGS-51 USGS-52 USGS-59
150 USGS-67 USGS-122
100 USGS-123
50
0
Jan-
66
Jan-
70
Jan-
74
Jan-
78
Jan-
82
Jan-
86
Jan-
90
Jan-
94
Jan-
98
Jan-
02
Jan-
06
Figure 6-10. Concentration trends for Sr-90 in groundwater at the Idaho Nuclear Technology and Engineering Center.
3,500
3,000
Tc-9
9 A
ctiv
ity in
Gro
undw
ater
(pC
i/L)
2,500
MW-18-4 2,000 USGS-47
USGS-48 USGS-52
1,500 USGS-112 MON-A-230
1,000 Note: MCL = 900
500
0
Jan-94 Jan-95 Jan-96 Jan-97 Jan-98 Jan-99 Jan-00 Jan-01 Jan-02 Jan-03 Jan-04 Jan-05
Figure 6-11. Concentration trends for Tc-99 in groundwater at the Idaho Nuclear Technology and Engineering Center.
6-33

I-129 in Groundwater vs. Time
50
MCL = 1 pCi/L45
40 USGS-50 (Perched) USGS-40 USGS-41 35 USGS-42
Figure 6-12. Concentration trends for I-129 in groundwater at the Idaho Nuclear Technology and Engineering Center.
Tritium in Groundwater vs. Time
5,000,000
MCL = 20,000 pCi/L
4,500,000
USGS-50 (Perched) USGS-40 USGS-41
3,500,000
4,000,000
USGS-42 USGS-43
Figure 6-13. Concentration trends for tritium in groundwater at the Idaho Nuclear Technology and Engineering Center.
6.1.3 Progress since Last Review
This is the first five-year review for WAG 3.
3,000,000
2,500,000
2,000,000
1,500,000
1,000,000
500,000
0
30
25
20
15
10
5
0
Jan-
54
H-3
Act
ivity
(pC
i/L)
I-129
Act
ivity
(pC
i/L)
Jan-
74
Jan-
76
Jan-
58Ja
n-78
Jan-
62Ja
n-80
Jan-
66
Jan-
70
Jan-
82
Jan-
84
Jan-
86Ja
n-74
Jan-
78Ja
n-88
Jan-
90
Jan-
82
Jan-
92
Jan-
86
Jan-
94
Jan-
90
Jan-
96
Jan-
94Ja
n-98
Jan-
98Ja
n-00
Jan-
02Ja
n-02
Jan-
06
Jan-
04
USGS-44 USGS-45 USGS-46 USGS-47 USGS-48 USGS-49 USGS-51 USGS-52 USGS-59 USGS-67 USGS-122 USGS-123
USGS-43 USGS-44 USGS-45 USGS-46 USGS-47 USGS-48 USGS-49 USGS-50 USGS-51 USGS-52 USGS-59 USGS-67
6-34

6.1.4 Technical Assessment
6.1.4.1 Group 1 (Tank Farm Soil)
Question A: Is the remedy functioning as intended by the decision documents?
Yes, the interim action is functioning as intended. The asphalt cover and drainage improvements have been installed to reduce infiltration of precipitation. Operations and maintenance procedures are in place to routinely inspect the cover and provide repairs as necessary.
The institutional controls and the NSD process are effectively preventing unauthorized intrusion into the tank farm soil.
Question B: Are the exposure assumptions, toxicity data, cleanup levels, and remedial action objectives used at the time of the remedy still valid?
Yes, the OU 3-13 Group 1 ROD determination is an interim action. The OU 3-14 RI/FS will evaluate alternatives for a final action for tank farm soils. The RAOs used for selecting the interim action remedy have not changed.
Question C: Has any other information come to light that could call into question the protectiveness of the remedy?
No.
6.1.4.2 Group 2 (Soil under Buildings and Structures)
Question A: Is the remedy functioning as intended by the decision documents?
Yes, the remedy consists of institutional controls with containment. The institutional controls have restricted access to the contaminated soils. The annual institutional control inspections have revealed no significant deficiencies that would impact human health or the environment.
Question B: Are the exposure assumptions, toxicity data, cleanup levels, and remedial action objectives used at the time of the remedy still valid?
Yes, the exposure assumptions, toxicity data, cleanup levels, and RAOs are still valid.
Question C: Has any other information come to light that could call into question the protectiveness of the remedy?
No.
6.1.4.3 Group 3 (Other Surface Soil)
Question A: Is the remedy functioning as intended by the decision documents?
Yes, the remedy—removal of contaminated soils and on-Site disposal—has been initiated and is functioning as intended. The remedial action for the CPP-67 percolation ponds was completed in November 2004, with the disposal of an estimated 30,500 yd3 of soil at the ICDF. Remedial actions for the other Group 3 sites are still in progress. Institutional controls are in place at all Group 3 CERCLA sites. The NSD process is functioning.
6-35

Question B: Are the exposure assumptions, toxicity data, cleanup levels, and remedial action objectives used at the time of the remedy still valid?
No, the exposure assumptions, toxicity data, cleanup levels, and RAOs have changed, because the ROD did not take into account the shielding factor associated with a residential scenario that should have been used to calculate the risk associated with external radiation exposure, specifically Cs-137.
Question C: Has any other information come to light that could call into question the protectiveness of the remedy?
No.
6.1.4.4 Group 4 (Perched Water)
Question A: Is the remedy functioning as intended by the decision documents?
Yes, institutional controls are in place, and recharge controls are currently being implemented in a phased approach. The current institutional controls have prevented perched water use, as intended. The percolation ponds have been relocated, as specified in the ROD, and use of the former percolation ponds was discontinued in August 2002. Additional controls to limit recharge are being investigated so that the Group 4 remedy will be achieved.
Question B: Are the exposure assumptions, toxicity data, cleanup levels, and remedial action objectives used at the time of the remedy still valid?
Yes, the exposure assumptions, toxicity data, cleanup levels, and RAOs used at the time of the remedy are still valid. Additional controls are now being evaluated to determine actions to be taken to reduce the moisture content of the perched water zone, because the perched water is not behaving as initially modeled. It is noted that the Group 4 RAOs are to (1) reduce recharge to the perched water zone and (2) prevent migration of radionuclides from perched water in concentrations that would cause the SRPA to exceed the cumulative carcinogenic risk of 1 × 10⁻⁴ or a total hazard index of 1. In order to meet these RAOs, the additional actions and model updates will be performed, as necessary.
Question C: Has any other information come to light that could call into question the protectiveness of the remedy?
No, the identified remedy of institutional controls with aquifer recharge control continues to be protective. However, new information is being evaluated as part of remedy implementation to address the aquifer recharge control. Specifically, the detection of elevated Tc-99 activity in the aquifer beneath the tank farm is being assessed for Group 4 as well as Group 5. In addition, as of October 2004, northern perched water volumes have not diminished in response to post-ROD recharge controls. Consequently, the need to assess and eliminate recharge sources is being evaluated during implementation of the Group 4 remedy. Ongoing perched water data collection and evaluation efforts are under way as part of the Group 4 remedy, and the effectiveness of the Group 4 remedy will be assessed in the MRDS (remedial action report) due April 21, 2008.
6-36

6.1.4.5 Group 5 (Snake River Plain Aquifer)
Question A: Is the remedy functioning as intended by the decision documents?
Yes, the selected SRPA interim action remedy of “institutional controls with monitoring and contingent remediation” is functioning as intended. Institutional controls are in place, and groundwater monitoring and assessment of the results are being performed to ensure that the RAOs for the SRPA are being met. The OU 3-14 feasibility study is providing new information and modeling for the SRPA within INTEC. This information and modeling are expected to impact the modeling and information on the SRPA outside of INTEC (OU 3-13, Group 5). When this information is available, the Group 5 model and remedy will need to be reassessed to ascertain whether the interim remedy is continuing to function as intended by the OU 3-13 ROD (DOE-ID 1999).
Question B: Are the exposure assumptions, toxicity data, cleanup levels, and remedial action objectives used at the time of the remedy still valid?
Yes, but the 2003 discovery of Tc-99 concentrations in the SRPA inside INTEC and new information and modeling being developed for OU 3-14 will require input into the OU 3-13 Group 5 model. The Group 5 RAOs are still valid. This includes the RAO to restore INTEC-impacted groundwater (located in the groundwater-contaminant plume outside of the current INTEC security fence) for use by 2095 and beyond so that the risk will not exceed a cumulative carcinogenic risk of 1 × 10⁻⁴ for groundwater ingestion.
Question C: Has any other information come to light that could call into question the protectiveness of the remedy?
No. The remedy of institutional controls with monitoring and contingent remediation continues to be protective. Information and modeling that are developed for the SRPA within INTEC as part of the OU 3-14 activities will have to be assessed for impacts on the protectiveness of the Group 5 remedy.
6.1.4.6 Group 6 (Buried Gas Cylinders)
Question A: Is the remedy functioning as intended by the decision documents?
Yes. Remedial actions are complete, and no hazards remain in place.
Question B: Are the exposure assumptions, toxicity data, cleanup levels, and remedial action objectives used at the time of the remedy still valid?
Yes. The exposure assumptions, toxicity data, cleanup levels, and RAOs are still valid.
Question C: Has any other information come to light that could call into question the protectiveness of the remedy?
No new information has been identified that would call into question the protectiveness of the remedy. It is anticipated that Group 6 sites will be classified as no-action sites and institutional controls will be removed in the closure documentation.
6-37

6.1.4.7 Group 7 (SFE-20 Hot Waste Tank System)
Question A: Is the remedy functioning as intended by the decision documents?
Yes, the remedy is functioning as intended. Phase I remediation activities are currently being implemented and are on schedule. Phase I will be followed by the Phase II remediation activities.
Question B: Are the exposure assumptions, toxicity data, cleanup levels, and remedial action objectives used at the time of the remedy still valid?
Yes. The exposure assumptions, toxicity data, cleanup levels, and remedial action objectives used at the time of the remedy are still valid.
Question C: Has any other information come to light that could call into question the protectiveness of the remedy?
No.
6.1.5 Technical Assessment Summary
The interim action remedy for Group 1 resulted in improvements to control surface water infiltration. In addition, institutional controls and operations and maintenance are being performed until the OU 3-14 ROD is implemented. Final remedial actions for the Group 2 sites are deferred until the buildings and structures are closed and D&D has been completed. Institutional controls and the soil disturbance process are in place and prevent inadvertent intrusion into the WAG 3 sites. Remedial actions have been completed at the Group 6 sites and at the CPP-67 site within the Group 3 soil sites. No changes to site conditions or toxicity factors or risk factors that would affect the protectiveness of the remedies have occurred at any of these sites.
Remedial actions are in progress for the remainder of the Group 3 sites and at the Group 4, 5, and 7 sites. Remedial actions are being implemented in accordance with the requirements in the decision documents, and the remedies are expected to be protective upon completion.
The detection of elevated Tc-99 activity in the SRPA beneath the northern portion of INTEC is being assessed for Groups 4 and 5. Tc-99 was not identified as a COC in the OU 3-13 ROD (DOE-ID 1999), but Tc-99 has been monitored closely since its discovery in 2003. Although groundwater quality trends and modeling indicate that Sr-90 activities in the SRPA outside of the INTEC security fence will decline below the MCL by 2095, Group 5 does not address the Sr-90 source term in the tank farm soil, which represents an additional secondary source that could cause MCLs to be exceeded. Consequently, Group 4 and 5 remedies might require additional actions to ensure that the remedies achieve the RAOs. The effectiveness of the Group 4 remedy will be assessed in the MRDS (remedial action report) due April 21, 2008, and the tank farm soils are being investigated under OU 3-14. If, based on new information collected and modeling performed during the OU 3-14 investigation, it is determined that changes to the remedies are necessary for Group 4 or 5, they will be initiated at that time.
6.1.6 Issues
The ongoing remedial actions and continuing remedial investigations have revealed the two following issues, both of which are being addressed in the OU 3-14 RI/FS:
6-38

• Tc-99 is present in the SRPA within the INTEC fence line at concentrations that are approximately twice the derived MCL. The observed Tc-99 concentrations are higher than predicted in the original OU 3-13 remedial investigation/baseline risk assessment (DOE-ID 1997).
• Perched water in the northern perched water zone has not yet drained. Additional controls might be necessary and are being evaluated.
6.1.7 Recommendations and Follow-up Actions
The following actions are recommended to ensure long-term protectiveness of human health and the environment for the selected remedies for OU 3-13:
• Assess the information from the OU 3-14 groundwater modeling with respect to Groups 4 and 5. As needed, reevaluate the protectiveness of the Group 4 and 5 remedies in the subsequent five-year review.
• Revise the status of Group 6 sites to no action, update the entries in the Idaho National Engineering and Environmental Laboratory Comprehensive Facility and Land Use Plan (DOE-ID 2005d), and discontinue five-year reviews of these sites.
• Section 12.2 of the OU 3-13 ROD (DOE-ID 1999) requires that any planned disturbance at a site for which action is required under the ROD (including the no-further-action sites with institutional controls) will be preceded by appropriate planning documents to be submitted to and concurred on by the regulatory agencies prior to implementation. WAG 3 has an approved INTEC soils management strategy, most recently documented in the INEEL Sitewide Institutional Controls Plan (DOE-ID 2004h). It is proposed to revise the NSD process to allow 7 calendar days for the agencies to respond. If no response is received within 7 days, work will proceed. The effectiveness of the NSD process will be reevaluated in the subsequent five-year review.
• Update the OU 3-13 remediation goals associated with Cs-137 to reflect the risk levels due to shielding associated with the residential scenario. This will require negotiation between the agencies and the WAG 3 project and may require an ESD to the OU 3-13 ROD.
Page 8-5 of the OU 3-13 ROD (DOE-ID 1999) requires, “An evaluation of whether additional soil excavation is necessary to protect ecological receptors will be conducted after the WAG 10 plant uptake treatability study is completed.” The COCs identified in the ROD for this evaluation are mercury, lead, and chromium. The regulatory agencies established remediation goals for the COCs in the ROD prior to completion of the plant uptake study because of the relatively small volume of soils that might be affected by the results of the study. WAG 10 ecological monitoring has been conducted at WAG 3, and the data are in the process of being assessed and finalized. Once the data assessment is complete, the data will be used to verify that the remediation goals for WAG 3 are adequately protective of ecological receptors. This information will be discussed in the next five-year review.
6.1.8 Protectiveness Statement
The OU 3-13 remedial actions have been completed for (1) Group 1, (2) the CPP-67 site within Group 3, and (3) Group 6. No changes in the physical conditions of these sites have occurred that would affect the protectiveness of the remedies, and there have been no significant changes in the toxicity factors or risk factors for the COCs associated with these sites. Based on the available data, the remedial actions at the sites have been successfully completed, and the remedies are functioning as intended in the decision document.
6-39

Group 2 sites compose a deferred action that consists of implementing institutional controls and soil excavation and capping. The remedy associated with these sites is functioning as intended in the decision document.
Remedial actions are in progress for the remainder of the Group 3 sites and at the Group 4, 5, and 7 sites. Upon completion of remedial actions for Groups 3, 4, 5, and 7, the remedies are expected to be protective. However, new information and modeling for the OU 3-14 feasibility study will provide additional information on the SRPA within INTEC. The information is expected to impact the modeling and information on the SRPA outside of INTEC (Group 5). The information and modeling will have to be assessed when they are available in order to determine whether the remedies for Groups 4 and 5 continue to be protective.
Uncertainties exist regarding the draining of the northern perched water zone and the elevated concentration of Tc-99 in the perched water. Since the Group 4 remedy is in process, it is unknown whether additional actions will be needed for the Group 4 remedy to be fully protective. Consequently, the remedy will require evaluation through the future remedial action report.
The institutional controls and the soil management strategy remain in effect for the no-further-action sites and are protective of human health and the environment.
6.2 ICDF
The OU 3-13 ROD (DOE-ID 1999) requires the removal and on-Site disposal of some of the CERCLA remediation waste generated within the boundaries of the INL Site. The ICDF was constructed in 2003 to meet the need for an on-Site disposal facility at the INL. The ICDF was constructed for the disposal of hazardous low-level waste, mixed low-level waste, and PCB-contaminated soil and debris waste types that (1) are generated by CERCLA remedial and removal actions at the INL Site and (2) meet the landfill waste acceptance criteria.
The ICDF is located south of INTEC and adjacent to the former percolation ponds. Disposal cells, including a buffer zone, cover approximately 40 acres and have a disposal capacity of about 510,000 yd3. The ICDF landfill meets the substantive requirements of RCRA Subtitle C (42 USC § 6921 et seq.), HWMA (1983), DOE O 435.1, and the Toxic Substances Control Act (TSCA) (15 USC § 2601 et seq.). The ICDF landfill utilizes a modular design consisting of two cells. Construction of Cell 1 was completed in 2003, and construction of Cell 2 began in 2004. The ICDF Complex includes the necessary subsystems and support facilities to provide a complete waste management system. Major components of the ICDF Complex include the following (Figure 6-14):
• Disposal cells (landfill)
• Evaporation pond consisting of two cells
• Staging, storage, sizing, and treatment facility (SSSTF).
6.2.1 ICDF Landfill
The ICDF landfill is the consolidation point for CERCLA-generated waste within the INL Site boundaries and is designed to receive CERCLA waste that meets the LDRs. Waste generated within the WAG 3 area of contamination that has not triggered placement or has not been treated is not required to meet LDR criteria.
6-40

6-41
DECON Building(CPP-1688)
Admin Trailer (CPP-1689)
Evaporation PondCrest Pad Building
(CPP-1798)
Landfill Crest Pad Building
(CPP-1799)
Aspen Ave.
Linc
oln
Blv
d.
Main Entrance Gate
Scal
e
RADCON Trailer PCB Storage
West Cell East Cell
Truck Load/Unload
Bulk Soil Staging Pad
Contaminated Equipment Pad
Truck In-Transport
Area
West P
erimeter R
d.
Previous Percolation Pond
Area
Legend Buildings Roads Fences Ditches Evaporation Ponds
Project: ICDF Base Map Map Requestor: Peggy Jessmore GIS Analyst: Dan Mahnami Date Drawn: 9/26/2005 Disclaimer: Contact the SAL at 526-3529 for information
about the data shown on this map. Path: X:\gis_projects\cpp\base_maps File Name: ICDF_Base_Map_2005-ap_v1.mxd Control Number: SALAM001394
0 100 200 300 400 50 Feet
0 20 40 60 80 100 120 10 Meters
Figure 6-14. Location and plan view of the ICDF Complex.

6.2.2 ICDF Evaporation Pond
The ICDF evaporation pond, designated as a RCRA corrective action management unit in the OU 3-13 ROD (DOE-ID 1999), is the disposal site for ICDF leachate and other aqueous waste that results from operating the ICDF Complex. Other aqueous waste generated at the INL Site also may be disposed of in the evaporation pond in accordance with the waste acceptance criteria for the ICDF evaporation pond.
6.2.3 ICDF Staging, Storage, Sizing, and Treatment Facility
The SSSTF is designed to provide the centralized receiving, inspection, treatment, and segregation areas necessary to stage and store incoming waste from CERCLA activities. This waste, as well as waste generated during the operation of the ICDF Complex, is disposed of in the ICDF landfill or evaporation pond, or this waste may be shipped off the INL Site. All SSSTF activities take place within the WAG 3 area of concern to allow flexibility in managing the consolidation and remediation of waste without triggering LDRs and other RCRA requirements in accordance with the OU 3-13 ROD (DOE-ID 1999). The LDRs apply to waste generated outside of the WAG 3 area of contamination or to WAG 3 area of concern waste that has triggered placement.
6.2.4 Remedial Actions
6.2.4.1 Remedy Selection. The requirement for an on-Site CERCLA disposal facility at the INL Site was derived from the selected remedy for the WAG 3 Group 3 (other surface soil) identified in the OU 3-13 ROD (DOE-ID 1999). The remedy required removal and on-Site disposal of the Group 3 soils. The ICDF was constructed to satisfy the requirement for an on-Site disposal facility and is intended to reduce the overall areal extent of INL Site soil contamination. The best location for the ICDF was evaluated using the analytical hierarchy process’ decision analysis technique. Based on this evaluation, it was determined that locating the facility within the area of concern was the most cost-effective and applicable or relevant and appropriate requirement (ARAR) -compliant location for the facility.
6.2.4.2 Remedial Action Objectives. Throughout the remedy selection and design phases of the ICDF Complex, it was recognized that one of the most critical tools for the protection of the environment is the development of limitations regarding the waste that can be accepted into the ICDF Complex. To this end, DOE-ID and the regulatory agencies worked to develop waste acceptance criteria that ensure the protection of human health and the environment. A discussion of the protectiveness of the waste acceptance criteria for the ICDF Complex is provided below. The waste acceptance criteria are divided into sections covering general complex criteria, landfill criteria, evaporation pond criteria, and SSSTF criteria.
ICDF Complex—The ICDF Complex waste acceptance criteria (DOE-ID 2005h) were developed to identify the types and quantities of waste allowable for receipt. These waste acceptance criteria are protective of human health and the environment. The objectives of the ICDF waste acceptance criteria are to ensure the following:
• Only waste that is within the agreed-upon limitations enter the ICDF Complex.
• Waste that enters the ICDF Complex has been screened and ascertained to be within the limits that have been deemed protective. Waste within the ICDF Complex will not exceed the allowable limits for the protection of the SRPA in accordance with the OU 3-13 ROD requirements (DOE-ID 1999).
6-42

• The commitments in the OU 3-13 ROD are met and maintained.
• The waste received at the ICDF Complex contains only the radionuclides and hazardous constituents that the facility can manage safely.
• The concentrations and/or total activities of the waste received at the ICDF Complex are compatible with the design and operational limits.
• Waste received at the treatment unit can be treated and disposed of at the ICDF Complex while maintaining protectiveness.
• The waste received at the ICDF Complex is in a form of container that will maintain its integrity and retain an acceptable configuration under the conditions expected to be encountered during ICDF operations and closure.
• Waste received at the ICDF Complex does not contain materials that will compromise the safety or integrity of the facility under the expected operating conditions.
The ICDF waste acceptance criteria ensure compliance with applicable regulatory and ROD requirements established for protection of human health and the environment, including the SRPA.
ICDF Landfill Section—The ICDF landfill waste acceptance criteria are used to identify the types and quantities of waste allowable for placement in the landfill. These waste acceptance criteria are protective of human health and the environment. Refer to Figures 6-15 and 6-16 for photographs of the ICDF landfill operation. The objectives of the ICDF landfill waste acceptance criteria are to ensure the following:
• Waste placed within the ICDF landfill will not exceed the allowable limits for the protection of the SRPA
• Human and ecological receptors will be prevented from exceeding a cumulative carcinogenic risk of 1 × 10⁻⁴ and a total hazard index of 1
• Exceedances of MCLs in the SRPA will be prevented
• Waste received at the ICDF landfill will contain only the radionuclides and hazardous constituents that the facility can manage safely
• The concentrations and/or total activities of the waste received are compatible with the ICDF landfill design and operations parameters
• Waste received does not contain materials that will compromise the safety or integrity of the facility, including the landfill liner system, under the expected operating conditions.
ICDF Evaporation Pond Section—The ICDF evaporation pond waste acceptance criteria were developed to identify the types and quantities of liquid waste allowable for storage/evaporation. These waste acceptance criteria are protective of human health and the environment. The objectives of the evaporation pond waste acceptance criteria are to ensure the following:
• The waste received at the ICDF evaporation pond contains only the radionuclides and hazardous constituents the facility can safely manage
6-43

Figure 6-15. Landfill operations at the ICDF.
Figure 6-16. Placing PM2A tank from Waste Area Group 1 into the ICDF.
6-44
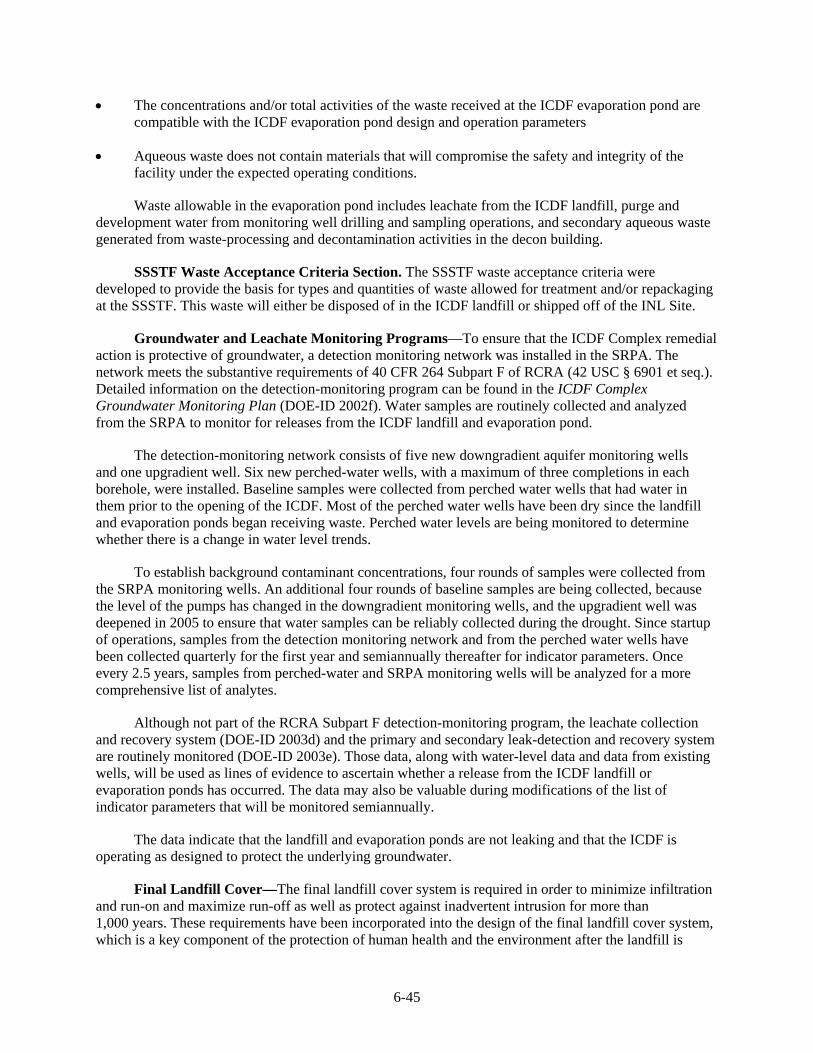
• The concentrations and/or total activities of the waste received at the ICDF evaporation pond are compatible with the ICDF evaporation pond design and operation parameters
• Aqueous waste does not contain materials that will compromise the safety and integrity of the facility under the expected operating conditions.
Waste allowable in the evaporation pond includes leachate from the ICDF landfill, purge and development water from monitoring well drilling and sampling operations, and secondary aqueous waste generated from waste-processing and decontamination activities in the decon building.
SSSTF Waste Acceptance Criteria Section. The SSSTF waste acceptance criteria were developed to provide the basis for types and quantities of waste allowed for treatment and/or repackaging at the SSSTF. This waste will either be disposed of in the ICDF landfill or shipped off of the INL Site.
Groundwater and Leachate Monitoring Programs—To ensure that the ICDF Complex remedial action is protective of groundwater, a detection monitoring network was installed in the SRPA. The network meets the substantive requirements of 40 CFR 264 Subpart F of RCRA (42 USC § 6901 et seq.). Detailed information on the detection-monitoring program can be found in the ICDF Complex Groundwater Monitoring Plan (DOE-ID 2002f). Water samples are routinely collected and analyzed from the SRPA to monitor for releases from the ICDF landfill and evaporation pond.
The detection-monitoring network consists of five new downgradient aquifer monitoring wells and one upgradient well. Six new perched-water wells, with a maximum of three completions in each borehole, were installed. Baseline samples were collected from perched water wells that had water in them prior to the opening of the ICDF. Most of the perched water wells have been dry since the landfill and evaporation ponds began receiving waste. Perched water levels are being monitored to determine whether there is a change in water level trends.
To establish background contaminant concentrations, four rounds of samples were collected from the SRPA monitoring wells. An additional four rounds of baseline samples are being collected, because the level of the pumps has changed in the downgradient monitoring wells, and the upgradient well was deepened in 2005 to ensure that water samples can be reliably collected during the drought. Since startup of operations, samples from the detection monitoring network and from the perched water wells have been collected quarterly for the first year and semiannually thereafter for indicator parameters. Once every 2.5 years, samples from perched-water and SRPA monitoring wells will be analyzed for a more comprehensive list of analytes.
Although not part of the RCRA Subpart F detection-monitoring program, the leachate collection and recovery system (DOE-ID 2003d) and the primary and secondary leak-detection and recovery system are routinely monitored (DOE-ID 2003e). Those data, along with water-level data and data from existing wells, will be used as lines of evidence to ascertain whether a release from the ICDF landfill or evaporation ponds has occurred. The data may also be valuable during modifications of the list of indicator parameters that will be monitored semiannually.
The data indicate that the landfill and evaporation ponds are not leaking and that the ICDF is operating as designed to protect the underlying groundwater.
Final Landfill Cover—The final landfill cover system is required in order to minimize infiltration and run-on and maximize run-off as well as protect against inadvertent intrusion for more than 1,000 years. These requirements have been incorporated into the design of the final landfill cover system, which is a key component of the protection of human health and the environment after the landfill is
6-45

closed. The landfill cover has been designed to minimize infiltration, thus protecting the SRPA’s groundwater resources. The cover system also has been designed to contain the waste and prevent exposures to the waste through the use of natural earthen materials that will last well beyond the 1,000-year minimum life.
The landfill cover complies with identified ARARs and in most cases exceeds the minimum regulatory requirements. The cover system exceeds the requirements of 40 CFR 264.310, “Closure and Post-Closure Care,” regarding minimum requirements for landfill covers. The cap has been designed to reduce infiltration through a combination of the following two processes:
• Evapotranspiration layer to promote run-off and evapotranspiration
• Barrier and drainage layer to direct infiltration off the cover system and minimize infiltration into the waste.
The 9-ft-thick evapotranspiration layer consists of fine-grained loam material. The layer is designed to store precipitation during wet periods and then to allow evaporation or transpiration of stored water in dry periods. The system can function well in arid environments to minimize infiltration into the landfill. Previous studies at the INL and Hanford sites have shown that, for typical years of rainfall, zero infiltration will occur with this evapotranspiration cap system.
The regulations require the barrier and drainage layers. These layers are a secondary system that reduces infiltration into the landfill from what might break through the evapotranspiration layer. The barrier system consists of a 2-ft-thick clay liner overlain by drainage media to promote run-off away from the landfill waste. In combination, these two systems provide a minimum of infiltration and minimize potential impacts to the SRPA.
The minimum cover thickness will be 17.5 ft when constructed. The cover materials have been designed to provide protection against intrusion for more than 1,000 years. The biointrusion layer, which consists of cobble-sized rock, will prevent burrowing animals from penetrating into the barrier layer of the cap. All layers of the cap have been designed to provide natural filtering so that materials cannot be washed through the cobbles and compromise the cover system. This thick cap system will prevent any exposure to waste or the potential for inadvertent exposure to contamination.
6.2.5 Remedy Implementation
Operation of the ICDF landfill and evaporation pond began on September 15, 2003, and the SSSTF began operating in 2005. Construction of Cell 2 was initiated in 2005. The ICDF Complex is an integral part of the FFA/CO CERCLA process for the INL Site, and contaminated waste from the Power Burst Facility (PBF), TAN, the RTC, CFA, and INTEC have been disposed of at the ICDF Complex.
The schedule for the ICDF landfill is to operate from April through November. This schedule provides a significant opportunity to coordinate operation of the ICDF landfill with other landfills at the INL Site. These opportunities include equipment and personnel sharing to reduce the cost of operating the ICDF landfill and the other landfills.
6.2.6 Technical Assessment
Question A: Is the remedy functioning as intended by the decision documents?
Yes.
6-46

Question B: Are the exposure assumptions, toxicity data, cleanup levels, and RAOs used at the time of the remedy still valid?
Yes.
Question C: Has any other information come to light that could call into question the protectiveness of the remedy?
No.
6.2.7 Technical Assessment Summary
The ICDF was constructed in accordance with the requirements established in the OU 3-13 ROD (DOE-ID 1999) and is operating as intended. No changes in initial design criteria or assumptions have come to light that would call into question the effectiveness of the facility.
6.2.8 Issues
There are no issues that would significantly impact the operation of the ICDF or that require immediate attention. For a list of issues identified within all WAGs during the INL Sitewide five-year review in 2005, see Table C-1 in Appendix C.
6.2.9 Recommendations and Follow-up Activities
No pertinent recommendations or follow-up actions have been identified at the ICDF Complex that have not been resolved.
6.2.10 Protectiveness Statement
The ICDF has been operational since September 2003, providing a cost-effective treatment and disposal unit for CERCLA cleanup at the INL Site in accordance with the requirements in the OU 3-13 ROD (DOE-ID 1999). The INEEL CERCLA Disposal Facility Complex Remedial Action Work Plan (DOE-ID 2003g) presents an operations schedule that projects that the last waste will be disposed of in the ICDF landfill by 2013. After the last waste has been disposed of, the EPA and DEQ will be notified. Upon this notification, the ICDF Complex closure activities will be initiated. This schedule allows sufficient time to complete shutdown-related activities and to complete the transfer of the ICDF to the Long-Term Stewardship Program by the end of FY 2015. After shutdown activities are completed, the ICDF site is expected to be protective of human health and the environment.
6.3 Section 6 References
40 CFR 264.310, 2006, “Closure and Post-Closure Care,” Code of Federal Regulations, Office of the Federal Register, May 2006.
40 CFR 264, Subpart F, 2006, “Releases from Solid Waste Management Units,” Code of Federal Regulations, Office of the Federal Register, May 2006.
15 USC § 2601 et seq., 1976, “Toxic Substances Control Act of 1976,” United States Code, October 11, 1976.
6-47

42 USC § 6901 et seq., 1976, “Resource Conservation and Recovery Act of 1976,” United States Code, October 21, 1976. (The 1980 Amendment is cited as the “Solid Waste Disposal Act Amendments of 1980.”)
42 USC § 9601 et seq., 1980, “Comprehensive Environmental Response, Compensation and Liability Act of 1980 (CERCLA/Superfund),” United States Code, December 11, 1980.
Bowhan, B. R., DOE Idaho, to D. G. Earley, Office of the Attorney General State of Idaho, and Cyndy Mackey, EPA Region 10, March 4, 2003, “Final Original Copy of Agreement to Resolve Dispute Waste Area Group 3, Operable Unit 3-13,” OCC-03-025 http://ar.inel.gov/images/pdf/200303/2003030600415GSJ.pdf.
DEQ, 2003a, HWMA/RCRA Post-Closure Permit for the Idaho Nuclear Technology and Engineering Center Waste Calcine Facility at the Idaho National Engineering and Environmental Laboratory, PER-112, Idaho Department of Environmental Quality, October 2003.
DEQ, 2003b, HWMA/RCRA Closure Plan for VES-SFE-20 Hot Waste Tank System at INTEC, Document ID 24071, Idaho Department of Environmental Quality, May 2003.
DOE O 435.1, 1999, “Radioactive Waste Management,” U.S. Department of Energy, July 1999.
DOE-ID, 1991, Federal Facility Agreement and Consent Order for the Idaho National Engineering Laboratory, U.S. Department of Energy, U.S. Environmental Protection Agency Region 10, Idaho Department of Health and Welfare, Administrative Docket No. 1088-06-29-120, December 9, 1991.
DOE-ID, 1997, Comprehensive RI/FS for the Idaho Chemical Processing Plant OU 3-13 at the INEEL—Part A, RI/BRA Report (Final), DOE/ID-10534, Rev. 0, U.S. Department of Energy Idaho Operations Office, November 1997.
DOE-ID, 1998, Comprehensive RI/FS for Idaho Chemical Processing Plant OU 3-13 at the INEEL—Part B, FS Supplement Report, DOE/ID-10619, Rev. 2, U.S. Department of Energy Idaho Operations Office, October 1998.
DOE-ID, 1999, Final Record of Decision Idaho Nuclear Technology and Engineering Center, Operable Unit 3-13, DOE/ID-10660, Rev. 0, U.S. Department of Energy Idaho Operations Office, October 1999.
DOE-ID, 2000a, Remedial Design/Remedial Action Work Plan for Group 1 Tank Farm Interim Action, DOE/ID-10772, Rev. 0, U.S. Department of Energy Idaho Operations Office, September 2000.
DOE-ID, 2000b, Monitoring System and Installation Plan for Operable Unit 3-13, Group 4, Perched Water Well Installation, DOE/ID-10774, Rev. 0, U.S. Department of Energy Idaho Operations Office, September 2000.
DOE-ID, 2000c, Monitoring System and Installation Plan for Operable Unit 3-13, Group 5, Snake River Plain Aquifer, DOE/ID-10782, Rev. 1, U.S. Department of Energy Idaho Operations Office, November 2000.
6-48

DOE-ID, 2000d, Drainage Evaluation Plan for Group 2—Soils under Buildings and Structures for Waste Area Group 3, Operable Unit 3-13, DOE/ID-10759, Rev. 0, U.S. Department of Energy Idaho Operations Office, July 2000.
DOE-ID, 2000e, Drainage Observation Report for Group 2—Soils under Buildings for Waste Area Group 3, Operable Unit 3-13, DOE/ID-10833, Rev. 0, U.S. Department of Energy Idaho Operations Office, December 2000.
DOE-ID, 2001a, Storm Water Drainage Inspection Report/Long-Term Drainage Maintenance Plan for Group 2—Soils under Buildings and Structures for Waste Area Group 3, Operable Unit 3-13, DOE/ID-10884, Rev. 0, U.S. Department of Energy Idaho Operations Office, September 2001.
DOE-ID, 2001b, Preliminary Characterization Plan for the OU 3-13 Group 6 RD/RA Buried Gas Cylinder Sites: CPP-84 and CPP-94, DOE/ID-10842 (formerly INEEL/EXT-2000-00398), Rev. 2, U.S. Department of Energy Idaho Operations Office, March 2001.
DOE-ID, 2001c, Annual INTEC Groundwater Monitoring Report for Group 5 – Snake River Plain Aquifer (2001), DOE/ID-10930, Rev. 0, U.S. Department of Energy Idaho Operations Office, February 2002.
DOE-ID, 2002a, Operable Unit 3-13, Group 3, Other Surface Soils, Prioritization and Site Grouping Report, DOE/ID-10996, Rev. 0, U.S. Department of Energy Idaho Operations Office, September 2002.
DOE-ID, 2002b, Monitoring System and Installation Plan for Operable Unit 3-13, Group 5, Snake River Plain Aquifer, DOE/ID-10782, Rev. 2, U.S. Department of Energy Idaho Operations Office, July 2002.
DOE-ID, 2002c, Phase I Monitoring Well and Tracer Study Report for Operable Unit 3-13, Group 4, Perched Water, DOE/ID-10967, Rev. 0, U.S. Department of Energy Idaho Operations Office, April 2002.
DOE-ID, 2002f, ICDF Complex Groundwater Monitoring Plan, DOE/ID-10955, Rev. 0, U.S. Department of Energy Idaho Operations Office, May 2002.
DOE-ID, 2003a, Remedial Design/Remedial Action Work Plan for the VES-SFE-20 Hot Waste Tank System, DOE/ID-11048, Rev. 0, U.S. Department of Energy Idaho Operations Office, June 2003.
DOE-ID, 2003b, Remedial Design/Remedial Action Work Plan for Group 1, Tank Farm Interim Action, DOE/ID-10772, Rev. 1, U.S. Department of Energy Idaho Operations Office, September 2003.
DOE-ID, 2003c, Annual INTEC Water Monitoring Report for Group 4—Perched Water (2003), DOE/ID-11117, Rev. 0, U.S. Department of Energy Idaho Operations Office, December 2003.
DOE-ID, 2003d, Phase I Monitoring Well and Tracer Study Report for Operable Unit 3-13, Group 4, Perched Water, DOE/ID-10967, Rev. 2, U.S. Department of Energy Idaho Operations Office, June 2003.
6-49

DOE-ID, 2003e, Monitoring System and Installation Plan for Operable Unit 3-13, Group 4, Perched Water Well Installation, DOE/ID-10774, Rev. 2, U.S. Department of Energy Idaho Operations Office, November 2003. (Note that subsequent to the September 30, 2004, cut-off date for this five-year review report, DOE/ID-10774 was revised to Rev. 3, January 2005.)
DOE-ID, 2003f, INTEC Water System Engineering Study, DOE/ID-11115, Rev. 0, U.S. Department of Energy Idaho Operations Office, December 2003.
DOE-ID, 2003g, INEEL CERCLA Disposal Facility Complex Remedial Action Work Plan, DOE/ID-10984, Rev. 0, U.S. Department of Energy Idaho Operations Office, February 2003.
DOE-ID, 2004a, Explanation of Significant Differences for the Final Record of Decision for the Idaho Nuclear Technology and Engineering Center, Operable Unit 3-13, DOE/ID-11109, Rev. 0, U.S. Department of Energy Idaho Operations Office, January 2004.
DOE-ID, 2004b, Operable Unit 3-13, Group 3, Other Surface Soils Remediation Sets 1–3 (Phase I) Remedial Design/Remedial Action Work Plan, DOE/ID-11089, Rev. 0, U.S. Department of Energy Idaho Operations Office, February 2004.
DOE-ID, 2004c, Remedial Design/Remedial Action Work Plan for Operable Unit 3-13, Group 6, Buried Gas Cylinders, DOE/ID-10838, Rev. 2, U.S. Department of Energy Idaho Operations Office, July 2004.
DOE-ID, 2004d, Monitoring Report/Decision Summary for Operable Unit 3-13, Group 5, Snake River Plain Aquifer, DOE/ID-11098, Rev. 1, U.S. Department of Energy Idaho Operations Office, December 2004.
DOE-ID, 2004e, Long-Term Monitoring Plan for Operable Unit 3-13, Group 5, Snake River Plain Aquifer, DOE/ID-10783, Rev. 3, U.S. Department of Energy Idaho Operations Office, August 2004.
DOE-ID, 2004f, Quality Assurance Project Plan for Waste Area Groups 1, 2, 3, 4, 5, 6, 7, and 10 and Deactivation, Decontamination, and Decommissioning, DOE/ID-10587, Rev. 8, U.S. Department of Energy Idaho Operations Office, March 2004.
DOE-ID, 2004g, Annual INTEC Water Monitoring Report for Group 4—Perched Water (2004), DOE/NE-ID-11192, Rev. 0, U.S. Department of Energy Idaho Operations Office, December 2004.
DOE-ID, 2004h, INEEL Sitewide Institutional Controls Plan, DOE/ID-11042, Rev. 1, U.S. Department of Energy Idaho Operations Office, June 2004.
DOE-ID, 2005a, Site Completion Report for Area CPP-67, WAG 3, OU 3-13, Group 3 Other Surface Soils, DOE/NE-ID-11234, Rev. 0, U.S. Department of Energy Idaho Operations Office, July 2005.
DOE-ID, 2005b, Remedial Action Report for the Tank Farm Interim Action, WAG 3, OU 3-13, Group 1, Tank Farm Soils, DOE/NE-ID-11209, Rev. 0, U.S. Department of Energy Idaho Operations Office, June 2005.
DOE-ID, 2005c, Remedial Action Report for Operable Unit 3-13, Group 6, Buried Gas Cylinders, DOE/NE-ID-11230, Rev. 0, U.S. Department of Energy Idaho Operations Office, June 2005.
6-50

DOE-ID, 2005d, Idaho National Engineering and Environmental Laboratory Comprehensive Facility and Land Use Plan, http://cflup.inel.gov, visited May 18, 2005.
DOE-ID, 2005e, Site Completion Report for Area CPP-67, WAG 3, OU 3-13, Group 3, Other Surface Soils, DOE/NE-ID-11234, Rev. 0, U.S. Department of Energy Idaho Operations Office, July 2005.
DOE-ID, 2005f, “Operable Unit 3-14 Tank Farm Soil and Groundwater Remedial Investigation/Baseline Risk Assessment (Draft),” DOE/NE-ID-11227, Rev. 0, U.S. Department of Energy Idaho Operations Office, May 2005.
DOE-ID, 2005g, Site Completion Report for Area CPP-67, WAG 3, OU 3-13, Group 3, Other Surface Soils, DOE/NE-ID-11234, Rev. 0, U.S. Department of Energy Idaho Operations Office, July 2005.
DOE-ID, 2005h, ICDF Complex Waste Acceptance Criteria, DOE/ID-10881, Rev. 2, U.S. Department of Energy Idaho Operations Office, July 2005.
Drake, M. W. and S. M. Edgett, Idaho National Engineering and Environmental Laboratory, to D. Gail, S. M. Stoller Corporation, September 12, 2003, “INEEL CERCLA Disposal Facility (ICDF) Complex Implementation Project - Restricted Notice to Proceed with Remediation and ICDF Operations - Contract #21115,” CCN Number 44923.
EDF-3943, 2003, “INTEC Injection Well: Summary of Historical Information and Groundwater Quality Trends,” Rev. 0, Idaho National Engineering and Environmental Laboratory, December 2003.
HWMA, 1983, “Hazardous Waste Management Act of 1983,” Idaho Code Sections 39-4401 et seq., 1983.
ICP, 2004, Evaluation of Tc-99 in Groundwater at INTEC: Summary of Phase I Results, ICP/EXT-04-00244, Rev. 0, Idaho National Engineering and Environmental Laboratory, Idaho Completion Project, September 2004.
INEL, 1996, Background Dose Equivalent Rates and Surficial Soil Metal and Radionuclide Concentrations for the Idaho National Engineering Laboratory, INEL-94/0250, Rev. 1, Idaho National Engineering Laboratory, August 1996.
Kirchner, D. R., Bechtel BWXT Idaho, to R. S. Rice, Bechtel BWXT Idaho, February 15, 2005, “Closure Report for ESP-116-04 CPP-67 Confirmatory Sampling (INTEC Ponds 1 and 2) Project,” ESP-116-04.
Kreizenbeck, R., EPA Region 10, to W. Bergholz, DOE Idaho, December 4, 2002, “Notice of Violation and Penalty Assessment,” OIS Document Number 24768.
6-51

6-52

7. WASTE AREA GROUP 4 (CENTRAL FACILITIES AREA)
The CFA was originally built and operated by the U.S. Navy as a proving ground for battleship guns and to conduct other munitions experiments. Construction of the proving ground facility was completed in 1943. The U.S. Navy continued to use the facilities until 1949, when munitions experiments were discontinued.
Since then, the DOE has used the CFA to house numerous support services for INL Site operations, including administrative offices, research laboratories, a cafeteria, emergency and medical services, construction and support services, workshops, warehouses, vehicle and equipment pools, bus operations, laundry facilities, landfills, and a sewage treatment plant. Some of the support activities have resulted in releases of organic and inorganic contaminants at CFA sites such as storage tanks, dry wells, disposal ponds, and a sewage plant. Consequently, CFA was designated as WAG 4 under the FFA/CO (DOE-ID 1991). Remedial action determinations for WAG 4 sites are documented in three RODs and one ESD to the OU 4-13 ROD.
The first WAG 4 ROD—signed on December 31, 1992—addressed OU 4-11, which is the CFA motor pool pond (DOE-ID 1992). The ROD resulted in no action, with potential risk via the groundwater pathway to be evaluated in the comprehensive RI/FS (DOE-ID 2000a).
The second ROD––issued on October 10, 1995––addressed the OU 4-03 underground storage tank sites and CFA Landfills I, II, and III (designated as the CFA-01, CFA-02, and CFA-03 sites, respectively) (DOE-ID 1995). That ROD upheld the no-further-action determinations for 19 underground storage tank sites. It also documented that these sites pose no risk to human health and the environment and that the sites require no institutional controls. The no-further-action designation used to classify these sites was the appropriate terminology for 1995; however, since the ROD was signed, “no further action” has been modified to designate a site that does not require further remedial actions but does require institutional controls. Therefore, the no-further-action designation of these 19 storage tanks is equivalent to the current “no-action” designation. The ROD also required the installation of compacted native soil covers over the three landfills as a presumptive remedy. As part of the remedy, soil vapor, moisture infiltration, and groundwater monitoring was required in order to evaluate the effectiveness of the soil covers. Groundwater monitoring at WAG 4 is conducted under the Post-Record of Decision Monitoring Work Plan Central Facilities Area Landfills I, II, and III Operable Unit 4-12 (INEEL 2003a). The monitoring began in 1996 and will continue until a five-year review shows that some or all of the monitoring activities can cease.
Following completion of the first two RODs, seven time-critical removal actions were performed at the lead shop (CFA-06 site), tank farm (CFA-42 site), and lead storage yard (CFA-43 site), where soil contaminated with antimony, arsenic, lead, and petroleum products were excavated (INEL 1997). Other time-critical removal actions were conducted at the mercury pond (CFA-04 site), the lead shop (CFA-06 site), the lead storage area (CFA-43 site), the French drains (CFA-07 site), and the tank farm spills (CFA-42 site). Non-time-critical removal actions were performed at the dry wells (CFA-13 and CFA-15 sites) and tank farm (CFA-42 site), where the dry wells were abandoned (no contaminated soils were found) and additional petroleum-contaminated soils were excavated and disposed of from the CFA-42 site (INEEL 1998).
7-1

The Comprehensive Remedial Investigation/Feasibility Study for the Central Facilities Area Operable Unit 4-13 at the Idaho National Engineering and Environmental Laboratory (DOE-ID 2000a) evaluated 52 potential release sites and determined that 45 of those sites posed no unacceptable risk to human health or the environment, so they were designated as no-action sites.
The third ROD for WAG 4 is the Final Comprehensive Record of Decision for Central Facilities Area Operable Unit 4-13 (DOE-ID 2000b), which was signed in July 2000. That ROD determined that remedial actions were necessary at the mercury pond (CFA-04 site), the sewage treatment plant drainfield (CFA-08 site), and the transformer yard (CFA-10 site). The ROD also contained a review of the results of the time-critical removal actions and stated that no additional remedial actions were necessary; however, institutional controls were required at the CFA-07 site (French drains).
The Explanation of Significant Differences for the Record of Decision for the Central Facilities Area Operable Unit 4-13 (DOE-ID 2003a), issued in May 2003, documents differences to the selected remedy for the CFA-04 mercury pond remedial actions. This ESD increased the final remediation goal for the CFA-04 mercury pond remedial action from 0.5 mg/kg to 8.4 mg/kg and eliminated the requirement to backfill the pond with clean soil to the surrounding grade. The 8.4-mg/kg value is an ecological value based on 10 times the average background concentration for composited samples.
Table 7-1 lists the CFA release sites that required remediation, the COCs for each site, and the cleanup goals for each site. The CERCLA (42 USC 9601 et seq.) remedial actions at CFA are proceeding in accordance with the requirements identified in the three RODs.
Table 7-1. Contaminants of concern for Waste Area Group 4. Site
(Site Code) COC Remediation Goalsa,b
Landfills I, II, and III Not applicableb Not applicableb
(CFA-01, CFA-02, and CFA-03) (containment) Mercury Pond Mercury 8.4 mg/kg (CFA-04) Sewage Plant Drainfield Cs-137 Not applicable (CFA-08) (containment) Transformer Yard Lead 400 mg/kg (CFA-10) a. The maximum Cs-137 concentration at the CFA-08 drainfield (180 pCi/g) will naturally decay to 23 pCi/g in the 100-year institutional control period for the INL Site. However, the ultimate goal for unrestricted access is 2.3 pCi/g, the 1E-04 future residential risk-based concentration. That concentration will be achieved in an additional 89 years through continued natural decay. Note that 23 pCi/g is not a true “remediation goal” in that soil is being removed to this level; the goal will be achieved through radioactive decay. Confirmatory soil sampling to demonstrate that this level is achieved during the 100-year period will not be performed under this remedy, because the known radioactive half-life for Cs-137 is 30 years. b. The OU 4-12 ROD does not detail specific COCs or remedial action goals. The remedies for CFA Landfills I, II, and III were implemented in accordance with EPA presumptive remedy guidance (DOE-ID 1995). CFA = Central Facilities Area COC = contaminant of concern DOE-ID = U.S. Department of Energy Idaho Operations Office EPA = U.S. Environmental Protection Agency INL = Idaho National Laboratory OU = operable unit ROD = Record of Decision
Figure 7-1 shows the locations of the CERCLA sites at WAG 4. Table 7-2 provides a chronology of significant events at WAG 4.
7-2

Figure 7-1. Waste Area Group 4 CERCLA sites.
7-3

Table 7-2. Chronology of Waste Area Group 4 events.
Event Date
The initial assessment of the mercury pond (CFA-04 site) was completed. October 1986
The Record of Decision Central Facilities Area Motor Pool Pond, Operable Unit 4-11, Waste Area Group 4 (DOE-ID 1992) was signed.
December 1992
The time-critical removal action for the mercury pond (CFA-04 site) was completed. 1994
Time-critical removal action at the French drains (CFA-07 site) was completed. 1995
The Record of Decision Declaration for Central Facilities Area Landfills I, II, and III (Operable Unit 4-12), and No Action Sites (Operable Unit 4-03) (DOE-ID 1995) was signed.
October 1995
The Remedial Design/Remedial Action Work Plan for Central Facilities Area Landfills I, II, and III Native Soil Cover Project, Operable Unit 4-12 (DOE-ID 1996) was completed.
April 1996
The remedial action at CFA Landfills I, II, and III began. June 1996
The remedial action at CFA Landfills I, II, and III ended. April 1997
The Post-Record of Decision Monitoring Work Plan Central Facilities Area Landfills I, II, and III Operable Unit 4-12 (INEEL 2003a) was completed.
June 1997
The Remedial Action Report CFA Landfills I, II, and III Native Soil Cover Project Operable Unit 4-12 (DOE-ID 1997) was completed.
September 1997
The Comprehensive Remedial Investigation/Feasibility Study for the Central Facilities Area Operable Unit 4-13 at the Idaho National Engineering and Environmental Laboratory (DOE-ID 2000a) was completed.
July 2000
The Final Comprehensive Record of Decision for Central Facilities Area Operable Unit 4-13 (DOE-ID 2000b) was signed.
July 2000
The Remedial Design/Remedial Action Work Plan Idaho National Engineering and Environmental Laboratory Central Facilities Area, Operable Unit 4-13 Transformer Yard (CFA-10) (DOE-ID 2001) was completed.
April 2001
The remedial action at the transformer yard (CFA-10 site) began. June 2001
The remedial action at the transformer yard (CFA-10 site) ended. August 2001
The Remedial Design/Remedial Action Work Plan for Waste Area Group 4, CFA-08 Sewage Plant Drainfield, OU 4-13 (DOE-ID 2002a) was completed.
March 2002
The remedial action at the sewage plant drainfield (CFA-08 site) began. March 2002
The Operations and Maintenance Plan for the Final Selected Remedies and Institutional Controls at Central Facilities Area, Operable Unit 4-13 (DOE-ID 2002b) was completed.
March 2002
The Construction Complete Report for the Idaho National Engineering and Environmental Laboratory, Central Facilities Area, Operable Unit 4-13, Transformer Yard (CFA-10) (DOE-ID 2002c) was completed.
April 2002
The remedial action at the sewage plant drainfield (CFA-08 site) ended. November 2002
The statutory five-year review of CFA Landfills I, II, and III took place (DOE-ID 2002d). November 2002
The Waste Area Group 4 Remedial Design/Remedial Action Work Plan, CFA-04 Pond Mercury-Contaminated Soils, Operable Unit 4-13 (DOE-ID 2003b) was completed.
February 2003
7-4

Table 7-2. (continued).
Event Date
The Construction Complete Report for the Idaho National Engineering and Environmental Laboratory, Central Facilities Area, Operable Unit 4-13, CFA-08 Sewage Plant Drainfield (DOE-ID 2003c) was completed.
June 2003
The Explanation of Significant Differences for the Record of Decision for the Central Facilities Area Operable Unit 4-13 (DOE-ID 2003a) was completed.
February 2003
The remedial action at the mercury pond (CFA-04 site) began. June 2003
The remedial action at the mercury pond (CFA-04 site) ended. November 2003
The Remedial Action Report for the Idaho National Engineering and Environmental Laboratory, Central Facilities Area, Operable Unit 4-13 (DOE-ID 2004a) was completed.
September 2004
CFA = Central Facilities Area DOE-ID = U.S. Department of Energy Idaho Operations Office
7.1 Remedial Actions
7.1.1 Remedy Selection
Remedies were selected for the WAG 4 sites identified as posing unacceptable risks. The CERCLA remedy selection process—as described in the Record of Decision Declaration for Central Facilities Area Landfills I, II, and III (Operable Unit 4-12), and No Action Sites (Operable Unit 4-03) (DOE-ID 1995) and the Final Comprehensive Record of Decision for Central Facilities Area Operable Unit 4-13 (DOE-ID 2000b)—was used to identify and select the remedies for each of the sites. The following subsections provide brief descriptions of the WAG 4 selected remedies.
7.1.1.1 Landfills I, II, and III (CFA-01, CFA-02, and CFA-03 Sites). The selected remedial action for the CFA landfills was installation of compacted native soil covers. In addition, routine groundwater monitoring, soil vapor monitoring, and moisture infiltration are required to ensure that the covers are functioning as intended. Institutional controls (including routine monitoring of the soil covers, signage, fencing, and access controls) were identified.
7.1.1.2 Mercury Pond (CFA-04 Site). The selected remedy for the mercury pond included excavation, treatment by stabilization, and disposal (on the INL Site) of the pond’s mercury-contaminated soil. Institutional controls were to be implemented if necessary, based on the effectiveness of the remedial action.
7.1.1.3 Sewage Plant Drainfield (CFA-08 Site). The selected remedy for the sewage plant drainfield was containment with an engineered cover. Performance standards were implemented as design criteria for the site to ensure that the engineered cover protects human health and the environment. Institutional controls are required to be maintained and include fencing, signage, access restriction, and routine monitoring of the engineered cover.
7.1.1.4 Transformer Yard (CFA-10 Site). The selected remedy for the transformer yard included characterization and excavation of lead-contaminated soil that exceeded the remedial action goal. Soil that required treatment was stabilized and disposed of at an off-Site facility. Soil that did not require treatment was excavated and disposed of on-Site.
7-5
7.1.1.5 Institutional Control Sites. As specified in the OU 4-13 ROD (DOE-ID 2000b), institutional controls have been established at five WAG 4 sites. Institutional controls are required at (1) the Landfills I, II, and III (CFA-01, CFA-02, and CFA-03 sites) to ensure that future activities do not compromise the integrity of the covers, (2) the French drains (CFA-07 site) because the residual lead concentration exceeds the EPA residential screening level at depth below 10 ft, and (3) the sewage plant drainfield (CFA-08 site) because the Cs-137 concentrations exceed risk-based levels for the 100-year future residential scenario. A brief description of the objectives of the institutional controls for each site is provided below:
• Landfills I, II, and III (CFA-01, CFA-02, and CFA-03 Sites)—Maintain the integrity of the cover by restricting drilling and excavation activities and by establishing visible access restrictions.
• French Drains (CFA-07 Site)—Limit residential land use for depths greater than 10 ft by implementing visible access restrictions.
• CFA-08 (Sewage Treatment Plant Drainfield)—Prevent exposure to contaminated soil by restricting drilling and excavation activities and by implementing visible access restrictions.
7.1.2 Remedial Action Objectives
The RAOs for the CFA sites were developed in accordance with 40 CFR 300, “National Oil and Hazardous Substances Pollution Contingency Plan,” and CERCLA RI/FS guidance through meetings with the DEQ, the EPA, and the DOE. The RAOs result from risk assessments and are specific to the COCs and exposure pathways developed for OUs 4-12 and 4-13.
To meet the RAOs, preliminary remediation goals were established as quantitative cleanup levels based primarily on ARARs and risk-based doses. Final remediation goals, as presented in Table 7-1, are based on the results of the baseline risk assessment and an evaluation of expected exposures and risks for selected alternatives. Remedial actions were completed to ensure that risks would be mitigated and exposure would not exceed the final remediation objectives.
The RAOs for protection of human and environmental health and safety are described in the following subsections for each of the sites.
7.1.2.1 Landfills I, II, and III (CFA-01, CFA-02, and CFA-03 Sites). The RAOs for Landfills I, II, and III are as follows:
• Prevent direct contact with the landfill contents
• Minimize the potential for erosion and infiltration at the surface
• Ensure that drinking water standards are not exceeded in the SRPA as a result of the migration of contaminants from the landfills.
7-6

7.1.2.2 Mercury Pond (CFA-04 Site). The RAOs for the mercury pond are as follows:
• Prevent ingestion and inhalation of radionuclide and nonradionuclide COCs that would result in a total excess cancer risk greater that 1 in 10,000 or a total hazard index greater than 1.0
• Prevent exposure of ecological receptors to contaminated soil with concentrations greater than or equal to a screening level of 10 times background values that result in a hazard quotient greater than or equal to 10.
7.1.2.3 Sewage Plant Drainfield (CFA-08 Site). The RAOs for the sewage plant drainfield are as follows:
• Prevent direct human exposure to radionuclides that would result in a total excess cancer risk greater than 1 in 10,000
• Prevent ingestion and inhalation of Cs-137 that would result in a total excess cancer risk greater than 1 in 10,000 or a total hazard index greater than 1.0
• Prevent exposure of ecological receptors to contaminated soil with concentrations greater than or equal to a screening level of 10 times background values that result in a hazard quotient greater than or equal to 10
• Monitor the groundwater at WAG 4 until the nitrate levels fall below the 10-mg/L MCL.
7.1.2.4 Transformer Yard (CFA-10 Site). The RAO for the transformer yard is to prevent exposure to lead at concentrations over 400 mg/kg, the EPA residential screening level for lead.
7.1.3 Remedy Implementation
The following subsections describe the remedial and removal actions implemented at the WAG 4 sites. Full descriptions of the remedial actions are in the Remedial Action Report CFA Landfills I, II, and III Native Soil Cover Project Operable Unit 4-12 (DOE-ID 1997) and the Remedial Action Report for the Idaho National Engineering and Environmental Laboratory, Central Facilities Area, Operable Unit 4-13 (DOE-ID 2004a); additional information regarding the time-critical removal action at the French drain site (CFA-07) can be found in the Preliminary Scoping Track 2 Summary Report for Central Facilities Area Operable Unit 4-09 (Incorporating Selected Sites from Operable Units 4-03 and 4-07) and CFA French Drain Removals (INEL 1996).
7.1.3.1 Landfills I, II, and III (CFA-01, CFA-02, and CFA-03 Sites). The remedial action at the CFA landfills consisted of installing native soil covers and environmental monitoring equipment. The covers consist of three layers: (1) general backfill to bring the existing grade up to the design slope; (2) a compacted low-permeability soil layer to inhibit the transport of moisture to the landfill contents; and (3) a topsoil layer for the final grade, allowing for vegetation growth. In addition, a layer of riprap was placed in the northeast corner of Landfill II to provide slope stability. A detailed description of the remedial action is contained in the Remedial Action Report CFA Landfills I, II, and III Native Soil Cover Project Operable Unit 4-12 (DOE-ID 1997).
As part of the CFA landfills preemptive remedy, environmental monitoring equipment was installed in and around each of the three landfills covers. Soil moisture monitoring is conducted using neutron access tubes (NATs) and time-domain reflectometry. Vadose zone gas sampling is conducted to monitor for potential transport of gases from the landfill, and routine groundwater monitoring is
7-7

conducted across a network of wells upgradient and downgradient from the landfills. The sampling locations and frequencies for the environmental monitoring points are detailed in the Post-Record of Decision Monitoring Work Plan Central Facilities Area Landfills I, II, and III Operable Unit 4-12 (INEEL 2003a).
Institutional controls were established at the landfills to restrict access to the sites. The institutional controls, site-specific operations and maintenance, and environmental monitoring will continue until deemed unnecessary based on the results of a five-year review (DOE-ID 2002b).
7.1.3.2 Mercury Pond (CFA-04 Site). The remedial action at the mercury pond consisted of removing mercury-contaminated soils for direct disposal at the CFA bulky waste landfill and direct disposal and treatment at the ICDF. Asbestos-contaminated material and commingled mercury-contaminated soils were excavated and directly disposed of at the CFA bulky waste landfill. Low-level, mercury-contaminated soil was excavated and directly disposed of at the ICDF. The low-level, toxicity-characteristic-leaching-procedure (TCLP), mercury-contaminated soil was excavated and shipped to the ICDF for treatment before disposal. Portions of the mercury pond area were excavated to basalt. In these locations and others where the excavation was extensive (i.e., asbestos area), fill material was brought in to bring the area up to preconstruction grade. The excavation area was covered with topsoil, contoured, and revegetated.
As detailed in the Remedial Action Report (DOE-ID 2004a), the average mercury concentration in soil remaining in the pond area is below the remedial action goal of 8.4 mg/kg; therefore, no institutional controls were identified for the site, and the site will not be included in subsequent five-year reviews. Additional details about the remedial action at the pond are contained in the Remedial Action Report (DOE-ID 2004a).
7.1.3.3 Sewage Plant Drainfield (CFA-08 Site). The remedial action at the sewage plant drainfield consisted of an engineered cover designed to prevent intrusion into the drainfield by humans or animals. Before the cover materials were put in place, the vegetation in the area was mowed and proof-rolled. In addition, the drainfield distribution boxes were collapsed and backfilled to existing grade. Material was then put in place to construct the engineered cover. The layers composing the cover include cobble, pea gravel, and native soil. The cobble and pea gravel layers are intended to prevent animal intrusion into the waste, and the native soil layer is intended to foster vegetation growth. After placement of materials, the construction and support areas were revegetated, and a chain-link fence was erected around the perimeter of the engineered cover to prevent inadvertent human intrusion. Concrete survey monuments were placed in accordance with the Operations and Maintenance Plan for the Final Selected Remedies and Institutional Controls at Central Facilities Area, Operable Unit 4-13 (DOE-ID 2002b). A detailed description of the CFA-08 remedial action is provided in the Remedial Action Report (DOE-ID 2004a).
Contamination was left in place at the sewage plant drainfield. As required by EPA Region 10 policy (EPA 1999) and as prescribed by the remedy (DOE-ID 2000b), institutional controls are required at the CFA-08 site. A detailed discussion of the institutional controls’ evaluation and implementation is provided in the OU 4-13 Operations and Maintenance Plan (DOE-ID 2002b).
7.1.3.4 Transformer Yard (CFA-10 Site). The remedial action goal was met at the transformer yard by excavating and removing lead-contaminated soil. All soil with lead concentrations exceeding 400 mg/kg was excavated from the site. Excavated soil identified as characteristic for RCRA hazardous waste (by TCLP) was properly packaged and transported to an off-Site facility that was permitted for treatment, storage, and disposal. All other lead-contaminated soil (i.e., with TCLP lead concentrations <5 mg/L) were designated as nonhazardous waste and then transported to and disposed of at the CFA
7-8

bulky waste landfill. Institutional controls were not identified for the CFA-10 site, because all contaminated media posing unacceptable risks were removed. As a result, this site will not be considered under any subsequent five-year reviews. Additional details about the remedial action at the transformer yard are in the Remedial Action Report for OU 4-13 (DOE-ID 2004a).
7.2 Data Evaluation
Post-remedial action sampling and data evaluation are not required for the CFA-04, CFA-07, CFA-08, or CFA-10 sites. Consequently, the data evaluation will focus on the routine groundwater samples, gas samples from boreholes, moisture monitoring data from NATs, and data from time-domain reflectometer (TDR) arrays. The following subsections provide (1) a review and assessment of the annual site inspections for the CFA landfills and the sewage plant drainfield and (2) an evaluation of routine monitoring data collected for the CFA landfills since the last five-year review. Operational and sampling procedures for the groundwater sampling, gas sampling, and moisture monitoring are outlined in the Post-Record of Decision Monitoring Work Plan, Central Facilities Area Landfills I, II, and III Operable Unit 4-12 (INEEL 2003a).
The Operations and Maintenance Plan for the Final Selected Remedies and Institutional Controls at Central Facilities Area, Operable Unit 4-13 (DOE-ID 2002b) describes the activities and procedures required for maintenance of sites that remain under institutional controls. Basic elements of the Operations and Maintenance Plan include a description of inspection, maintenance, and repair procedures for the vegetative cover, soil cover, rock armor, and monitoring equipment associated with the CFA landfills. The Operations and Maintenance Plan also includes descriptions of inspection and maintenance activities for the CFA-07 and CFA-08 sites as well as detailed instructions regarding the periodic radiological survey to be conducted at the CFA-08 sewage plant drainfield cover.
7.2.1 Site Inspections
Operations, maintenance, and institutional control inspections are conducted annually at the five OU 4-13 sites requiring institutional controls. The following are summaries of the annual inspections conducted for the CFA landfills, French drains, and sewage plant drainfield.
7.2.1.1 Annual Inspection of the CFA-01, CFA-02, and CFA-03 Sites. The annual operations, maintenance, and institutional control inspection for FY 2002 was conducted on October 16, 2002 (DOE-ID 2002e). Visible access restrictions, activity control, and unauthorized access and land-use restrictions were evaluated at the CFA-01, CFA-02, and CFA-03 sites. No deficiencies were identified. The soil covers at the CFA-01, CFA-02, and CFA-03 sites were inspected for vegetation cover, erosion, subsidence, and intrusion. The vegetation on the covers is generally well established. Minimal encroachment of rabbit brush at Landfill I and small areas of sparse vegetation on Landfills II and III were identified. Small mammal burrows and minor erosion rills also were identified. The rabbit brush was removed, burrows and rills were filled, and all affected areas were revegetated during FY 2003 maintenance activities.
Topographic surveys were conducted in 2002 and 2005 at the CFA-01, CFA-02, and CFA-03 sites and at the rock armor on the north end of the CFA-02 site in accordance with the Operations and Maintenance Plan (DOE-ID 2002b). Data from the surveys were evaluated to ascertain whether any large-scale subsidence or structural failure of the covers had occurred. The results of the topographic surveys indicated no subsidence or failure.
7-9
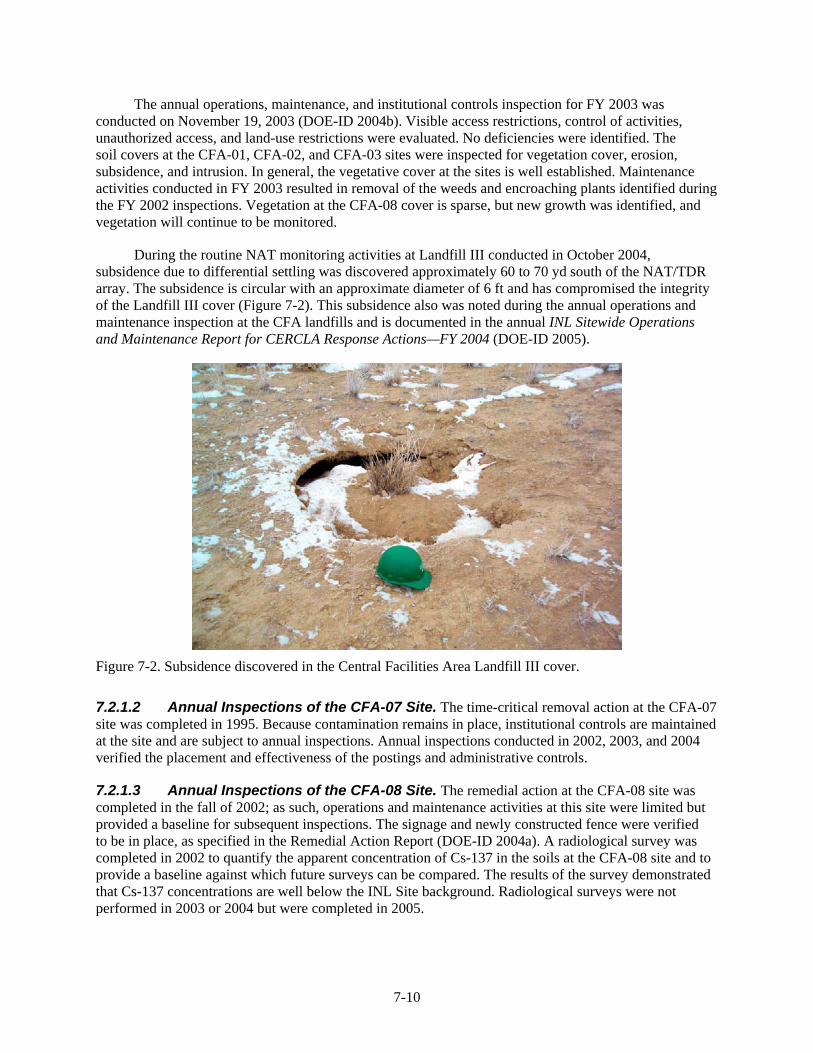
The annual operations, maintenance, and institutional controls inspection for FY 2003 was conducted on November 19, 2003 (DOE-ID 2004b). Visible access restrictions, control of activities, unauthorized access, and land-use restrictions were evaluated. No deficiencies were identified. The soil covers at the CFA-01, CFA-02, and CFA-03 sites were inspected for vegetation cover, erosion, subsidence, and intrusion. In general, the vegetative cover at the sites is well established. Maintenance activities conducted in FY 2003 resulted in removal of the weeds and encroaching plants identified during the FY 2002 inspections. Vegetation at the CFA-08 cover is sparse, but new growth was identified, and vegetation will continue to be monitored.
During the routine NAT monitoring activities at Landfill III conducted in October 2004, subsidence due to differential settling was discovered approximately 60 to 70 yd south of the NAT/TDR array. The subsidence is circular with an approximate diameter of 6 ft and has compromised the integrity of the Landfill III cover (Figure 7-2). This subsidence also was noted during the annual operations and maintenance inspection at the CFA landfills and is documented in the annual INL Sitewide Operations and Maintenance Report for CERCLA Response Actions—FY 2004 (DOE-ID 2005).
Figure 7-2. Subsidence discovered in the Central Facilities Area Landfill III cover.
7.2.1.2 Annual Inspections of the CFA-07 Site. The time-critical removal action at the CFA-07 site was completed in 1995. Because contamination remains in place, institutional controls are maintained at the site and are subject to annual inspections. Annual inspections conducted in 2002, 2003, and 2004 verified the placement and effectiveness of the postings and administrative controls.
7.2.1.3 Annual Inspections of the CFA-08 Site. The remedial action at the CFA-08 site was completed in the fall of 2002; as such, operations and maintenance activities at this site were limited but provided a baseline for subsequent inspections. The signage and newly constructed fence were verified to be in place, as specified in the Remedial Action Report (DOE-ID 2004a). A radiological survey was completed in 2002 to quantify the apparent concentration of Cs-137 in the soils at the CFA-08 site and to provide a baseline against which future surveys can be compared. The results of the survey demonstrated that Cs-137 concentrations are well below the INL Site background. Radiological surveys were not performed in 2003 or 2004 but were completed in 2005.
7-10

7.2.2 Central Facilities Area Groundwater Monitoring
In accordance with the ROD (DOE-ID 1995), groundwater monitoring has been conducted to (1) establish a baseline of potential contaminant concentrations in the SRPA against which future data can be compared and (2) ensure that drinking water standards are not exceeded in the SRPA because of migration of contaminants from the landfills. Groundwater samples were collected from 11 wells in the vicinity of the CFA landfills. The sampling rationale is described in Table 7-3, and sampling locations are shown on Figure 7-3. Groundwater samples were collected and analyzed for VOCs, anions, metals, and alkalinity. Groundwater levels were measured at the 11 wells that are routinely sampled and at 19 other wells located in the vicinity of the CFA landfills (Figure 7-3). The following discussion covers groundwater monitoring results since the last five-year review (DOE-ID 2002d) and, specifically, the results contained in the annual reports for 2002 and 2003 (INEEL 2003b; ICP 2004a).
7.2.2.1 Groundwater Sampling Data. A comparison of the maximum concentrations for detected analytes versus background and the defined regulatory level are provided in Table 7-4. Elevated nitrate concentrations (i.e., levels greater than the 10-mg/L MCL for sensitive populations) have been present in the CFA-MON-A-002 and CFA-MON-A-003 wells. As defined, sensitive populations include infants. Nitrate concentrations in all other wells were equal to or less than 4 mg/L. The nitrate concentrations in CFA-MON-A-002 and CFA-MON-A-003 have remained relatively steady over time (Figure 7-4).
In a few wells, aluminum and iron occasionally exceeded their respective secondary MCLs of 200 μg/L and 300 μg/L (Table 7-4). The elevated aluminum concentrations in two wells, LF2-11 and CFA-MON-A-003, probably are due to suspended solids, because aluminum solubility is very low at the near-neutral pH found in these wells. The principal control of dissolved aluminum concentrations is pH. The solubility of iron is controlled by pH and dissolved oxygen concentration. Iron is soluble in low-pH conditions or in the absence of dissolved oxygen. The occasional occurrences of elevated iron concentrations are inconsistent with the high dissolved oxygen concentrations and neutral to slightly alkaline pH present in these wells. The chemical inconsistency suggests that the iron is from suspended solids or well materials rather than being in solution.
Lead and zinc concentrations in groundwater samples collected from several wells as part of the CFA groundwater monitoring and sampling program were anomalously high in the past. The higher concentrations of iron, lead, and zinc in several of the CFA monitoring wells were the result of corrosion of galvanized riser pipe used in the well construction; after the galvanized riser pipes were replaced, the lead and zinc concentrations decreased sharply (Figure 7-5). This was also observed at the WAG 5 wells after the galvanized riser pipes were replaced (ICP 2004b).
In 2003, nitrogen and oxygen isotope ratios in nitrate were ascertained for seven wells in order to verify the source of the nitrate in the CFA-MON-A-002 and CFA-MON-A-003 monitoring wells (ICP 2004a). The sewage plant drainfield (CFA-08 site) had been previously implicated as the source of the nitrate contamination, based on a nitrogen isotope study conducted in 2000 and the assumption that groundwater flow was to the southwest (INEEL 2002). The nitrogen isotope analysis was redone with the addition of the oxygen isotope ratios in nitrate, because the groundwater flow map in the Central Facilities Area Landfills I, II, and II Annual Monitoring Report (2002) (INEEL 2003b) did not support the CFA-08 site, because the source of the nitrate and the oxygen isotope ratio in nitrate was not determined in the study conducted in 2000. The nitrogen isotope ratios for the CFA-MON wells were similar in both studies. Consequently, the oxygen isotope ratios in nitrate were used to differentiate the source of the nitrate. The CFA-MON wells do not have oxygen isotope ratios in nitrate that would indicate nitrification and/or denitrification of sewage. The nitrogen and oxygen isotope ratios in nitrate suggested a manufactured source of nitrate-like nitric acid. Both the water-level map (Figure 7-6) and the isotope data suggest that the dry pond (CFA-04 site) is the source of the nitrate.
7-11

Table 7-3. Groundwater monitoring wells and sampling rationale. Well Completion
Well (ft below land surface) Sampling Rationale LF 2-08 Screened (485–495) Downgradient of Landfill II LF 2-09 Screened (469.6–497) Downgradient of Landfill II LF 2-11 Screened (484–499) Upgradient of Landfill II LF 3-08 Screened (500–510) Downgradient of Landfills I and III LF 3-09 Screened (490–500) Downgradient of Landfills I and III LF 3-10 Screened (481–501) Adjacent to Landfill III USGS-083 Screened (516–752) Downgradient of Landfills I, II, and III USGS-128 Screened (457–615) Upgradient of Landfills I and III CFA-MON-A-001 Screened (488–518) Downgradient of CFA CFA-MON-A-002 Screened (488–518) Downgradient of CFA CFA-MON-A-003 Screened (488–518) Downgradient of CFA
CFA = Central Facilities Area USGS = United States Geological Survey
M12S
LF3-8 LF2-9 LF2-8
LF3-10
LF3-09
LF2-11
ICPP-MON-A-166
USGS-127
USGS-116
USGS-115 USGS-114
USGS-113
USGS-083
USGS-038 USGS-037
USGS-036
USGS-035 USGS-034
USGS-020 USGS-128
USGS-085
ICPP-MON-A-164C
ICPP-MON-A-164B
CFA-MON-003 CFA-MON-001 STF-MON-A-004
USGS-112
CFA-MON-002
USGS-077
INTEC
CFA
CFA-04
CFA-08 Sewage Plant, Septic Tank,& Drain Field
Landfill II Landfill I
Landfill III Landfill III Extention (Non-CERCLA)
SewageLagoons Center
Pivot
CFA-1
CFA-2
Big Lost River
ICPP-MON-A-167
Legend Monitoring Well Locations Production Wells U.S. Highway 20/26 Secondary Roads
0 2,000 4,000 6,000 8,000 1,000 Feet
Project: LTS Map Requestor: Mike Roddy GIS Analyst: Dan Mahnami Date Drawn: 4/19/2005 Disclaimer: Contact the SAL at 526-3529 for information
about the data shown on this map. Path: X:\gis_projects2\ineel\landfill_maps File Name: CFA_Landfills_and_GW_Wells-al_v1.mxd Control Number: SALAM001161
Figure 7-3. Groundwater monitoring wells and water-level measurement wells.
7-12

Table 7-4. Summary of groundwater monitoring results since the last the five-year review (data from 2002 and 2003), background concentrations, and regulatory levels for detected analytes.
7-13
Number of Wells with Maximum Location of MCL or LF2-11 Detections above Detections above MCL
Compound Units Detected
Value Maximum
Detected Value Secondary
MCLa Upgradient
Wellb Backgroundc Background and Upgradient Well
or Secondary MCL (2002, 2003)d
Anions
Alkalinity-bicarbonate mg/L 317 USGS-128 None 136 169–174 No NA
Chloride mg/L 117 LF3-09 250 107 16–27 Yes 0, 0
Fluoride mg/L 0.235 USGS-083 2 0.15 0.3–0.5 No 0, 0
Nitrate/nitrite mg-N/L 21.3 CFA-MON-A-002 10 3.3 1 to 2 Yes 2, 2
Sulfate mg/L 36.2 USGS-128 250 29.6 24–31 Yes 0, 0
Common Cations
Calcium μg/L 75,900 LF2-09 None 60,400 43,000–46,000 Yes NA
Magnesium μg/L 25,400 CFA-MON-A-002 None 17,000 15,000 Yes NA
Potassium μg/L 5,040 LF2-09 None 4,360 3,100–3,500 Yes NA
Sodium μg/L 44,900 LF2-11 None 44,900 14,000–17,000 No NA
Organic Analytes
Toluene μg/L 32 LF2-08 1,000 ND NA NA 0, 0
Inorganic Analytes
Aluminum μg/L 416 CFA-MON-A-002 50–200 240 10–13 Yes 1, 1
Arsenic μg/L 3.7 LF2-09 50/10e ND 2 to 3 Yes 0, 0
Barium μg/L 184 LF2-09 2,000 160 50 to 70 Yes 0, 0
Beryllium μg/L ND — 4 ND N N 0, 0
Cadmium μg/L ND — 5 ND <1 No 0, 0
Chromium μg/L 57.8 LF3-09 100 23.3 2 to 3 Yes 0, 0

7-14
Table 7-4. (continued).
Number of Wells with Maximum Location of MCL or LF2-11 Detections above Detections above MCL Detected Maximum Secondary Upgradient Background and or Secondary MCL (2002,
Compound Units Value Detected Value MCLa Wellb Backgroundc Upgradient Well 2003)d
Copper μg/L ND — 1,300/1,000 ND <1 No 0, 0
Iron μg/L 1,680 USGS-128 300 872 16–25 Yes 5, 2
Lead μg/L 14.5 USGS-128 15f ND 1 to 5 Yes 0, 0
Manganese μg/L 25.4 USGS-128 50 8.1 7 Yes 0, 0
Mercury μg/L ND — 2 ND N N 0, 0
Nickel μg/L 112 LF3-09 None 11.7 N Yes NA
Selenium μg/L ND — 50 ND <1 No 0, 0
Vanadium μg/L 8.8 USGS-083 None ND N N NA
Zinc μg/L 958 USGS-128 5,000 ND 10.5–54 Yes 0, 0
a. Numbers in italics are for the secondary MCL. b. Data for LF2-11 are from 2002, because the well could not be sampled in 2003. c. Background is from two sources. Plain numbers are from Knobel, Orr, and Cecil (1992). Italicized numbers are from USGS (1999)—median and mean values. d. The first number is for 2002, and the second number is for 2003. e. The proposed new MCL for arsenic is 10 μg/L, which will take effect in January 2006. f. The action level for lead is 15 μg/L.
CFA = Central Facilities Area MCL = maximum contaminant level N = not determined NA = not applicable ND = not detected USGS = United States Geological Survey

Nitrate
0
5
10
15
20
25
Jan-96 Jan-97 Jan-98 Jan-99 Jan-00 Jan-01 Jan-02 Jan-03 Jan-04 Jan-05
Date
Con
cent
ratio
n (m
g/L-
N)
CFA-MON-A-002
CFA-MON-A-003
Figure 7-4. Nitrate concentration in the CFA-MON-A-002 and CFA-MON-A-003 wells (note that the MCL = 10 mg/L).
0
300
600
900
1200
1500
Jan-96 Jan-97 Jan-98 Jan-99 Jan-00 Jan-01 Jan-02 Jan-03 Jan-04 Jan-05
Date
Zinc
con
cent
ratio
n (u
g/L)
0
10
20
30
40
50
Lead
con
cent
ratio
n (u
g/L)
zinc lead
Galvanized riser replaced with stainless steel
Figure 7-5. Lead and zinc concentrations in the CFA-MON-A-001 well.
7-15

Figure 7-6. Groundwater-level contour map for the Central Facilities Area in January 2004 (ICP 2004a).
The wells in the vicinity of the CFA landfills have elevated levels of sodium and chloride relative to background concentrations (Table 7-4). The elevated sodium and chloride concentrations in the CFA landfill wells are due to upgradient impacts from INTEC (DOE-ID 2002c; DOE-ID 2003d). Sodium and chloride concentrations have remained relatively steady in the landfill wells since they were first sampled.
In addition to WAG 4 monitoring, WAG 3 Group 5 conducts annual groundwater sampling at two CFA landfill wells for selected radionuclides to track INTEC plumes. The WAG 3 Group 5 groundwater sampling also indicated that increasing concentrations of Sr-90 originating from INTEC might be progressing toward CFA. Currently, tritium, Tc-99, gross beta, and Sr-90 concentrations do not exceed the MCLs in groundwater underlying the CFA. Details about the locations and concentrations of INTEC plumes are contained in the Annual INTEC Groundwater Monitoring Report for Group 5–Snake River
7-16

Plain Aquifer (2001) (DOE-ID 2002f) and the Annual INTEC Groundwater Monitoring Report for Group 5—Snake River Plain Aquifer (2003) (2003d).
7.2.2.2 Groundwater-Level Monitoring. Since the last five-year review, water levels were measured at 31 wells in October 2002 and at 30 wells at and near CFA in January 2004. The depth to groundwater was ascertained using surveyed measuring point elevations and well deviation correction factors. A groundwater-level contour map for the January 2004 data is shown on Figure 7-6. The apparent groundwater flow direction from CFA Landfills I and III varies from southeast to south to southwest and is consistent for both water-level measurement events. The apparent direction of groundwater flow from Landfill II is predominantly southeast. The groundwater-level contour map shows that parts of Landfills I and II are not covered by the current groundwater monitoring system. Two additional wells were installed in 2005 at CFA Landfills I and II to address this problem. The latest groundwater contour map from January 2004 is consistent with the groundwater contour maps in the previous annual report (INEEL 2003b) and the Central Facilities Area Landfills I, II, and III Five-Year Review Supporting Documentation (DOE-ID 2002d).
Although flow directions and gradients do not appear to change, water levels have dropped by over 5 ft since 2001. This drop is the reason that the LF2-09 and LF2-11 wells could not be sampled in 2003. The groundwater gradient in the area covered by the water-level measurements varies considerably (Figure 7-6). The gradient is slight over the area between INTEC and the CFA landfills (more than 1 mi), with less than 2 ft of head difference. Steeper gradients are present south of CFA and to the east of CFA between the Security Training Facility (STF) and PBF. From LF2-09 to CFA-MON-A-003, the average gradient is approximately 5.3 ft per mi; from LF3-09 to M12S, the average gradient is about 5.5 ft per mi.
7.2.3 Soil-Gas Monitoring
As part of the remedial action, five soil-gas sampling boreholes were installed in the vicinity of the CFA landfills to monitor for soil-gas contaminants. One borehole was installed adjacent to Landfill I, two were installed adjacent to Landfill II, and two were installed adjacent to Landfill III (one of which is proximal to Landfill I). Each borehole was completed with four soil-gas-sampling ports, including two above the shallow interbed and two below it. The soil-gas samples are currently collected in the fall in response to an issue raised in the previous five-year review.
The soil-gas sampling ports are designed to sample soil gases from discrete depths. One shallow sampling port was placed within the surficial sediments at a depth of approximately 13 ft. A second sampling port was placed in basalt at a depth of approximately 38 ft above the shallow interbed, which is located approximately 40 to 60 ft bls. Two deep sampling ports were placed below the shallow interbed, with perforated sections vertically separated by approximately 30 ft. The depths of these two ports are approximately 78 and 108 ft. The perforated sections of the deep sampling ports were located adjacent to fracture zones in the basalt, i.e., the most probable avenue of soil-gas migration. Soil gas samples were collected and analyzed for VOCs, including methane.
Historically, VOCs that have been detected consistently in the soil-gas samples include 1,1,1-TCA, 1,1-dichloroethane, 1,1-DCE, dichlorodifluoromethane, trichlorofluoromethane, TCE, 1,1,2-trichloro-1,2,2-trifluoroethane (F-113), 1,2-dichloro-1,2,2-tetrafluoroethane (F-114), cis-1,2-DCE, carbon tetrachloride, and PCE. These compounds are refrigerants, common solvents, products of solvent degradation, and constituents found in solvents that are used to clean mechanical equipment. Generally, the upper soil gas locations at a depth of 10 to 13 ft bls were low in VOC concentrations, with the highest VOC concentrations at the intermediate sample port depths of approximately 35 to 38 ft bls and 70 to 78 ft bls. The VOC concentrations then generally decreased in samples collected from the
7-17

lowermost locations at 100 to 108 ft bls. The soil-gas sampling results since the last five-year review are described below.
At GSP1-1, the analytes occurring at the highest concentrations were 1,1,1-TCA, 1,1-DCE, TCE, and trichlorofluoromethane. The concentration trends for these four compounds are shown in Figure 7-7. The trend plots indicate that the concentrations of the above four analytes are increasing at the 37.5-ft sampling depth but not at the 77.5-ft sampling depth.
The VOC concentrations in GSP2-1 are generally lower than in the other gas-monitoring wells, and trends were not plotted for that reason. All detected compounds were below 1,000 ppb volume in concentration.
At GSP2-2, analytes occurring at the highest concentrations were 1,1,1-TCA, 1,1-dichloroethane, dichlorodifluoromethane, trichlorofluoromethane, and cis-1,2-DCE. The concentration trends for 1,1,1-TCA and 1,1-dichloroethane do not show any consistent trends (Figure 7-8). Dichlorodifluoromethane and trichlorofluoromethane show a trend of increasing concentrations in the 37.5-ft depth sample (Figure 7-8).
At GSP3-1, the compounds occurring at the highest concentrations were 1,1,1-TCA, dichlorodifluoromethane, trichlorofluoromethane, and 1,1-DCE. The concentration plots for 1,1,1-TCA and 1,1-DCE indicate a general trend of increasing concentrations at a depth of 77.5 ft (Figure 7-9).
At GSP3-2, the compounds occurring at the highest concentrations were 1,1,1-TCA, trichlorofluoromethane, and dichlorodifluoromethane. The concentration plots for 1,1,1-TCA and trichlorofluoromethane show a modest trend toward increasing concentrations at a depth of 77.5 ft (Figure 7-10).
7.2.4 Moisture Monitoring Data Summary
The overall objective of infiltration monitoring at the CFA landfills is to document the effectiveness of the landfill covers for minimizing infiltration into the landfill waste (INEEL 2003a). The moisture content of the soil was monitored using TDR and neutron-probe instruments. The locations of the TDR arrays and NATs are shown on Figure 7-11.
For the purpose of the data discussion below, water that moves into the soil is defined as “infiltration.” Water that continues to move downward below the evapotranspiration (ET) depth of the soil profile is termed “recharge.” Infiltration and recharge are represented by an increase in water storage within a system. In addition to recharge, ET is a large contributor to decreasing water content in near-surface soils, moving water upward and out of the soil. The term “drainage” refers to water movement out of a unit thickness of soil or a decrease in soil moisture content but does not indicate the direction of movement. Drainage is used only to evaluate the ET depth. The locations of the soil moisture monitoring locations are shown in Figure 7-3.
7.2.4.1 Neutron Probe Monitoring Summary. The infiltration estimates for the spring of 2002 ranged from 1.34 to 5.23 in., but infiltration ranged from 0.3 to 0.89 in. for the spring of 2003. The infiltration estimates are generally consistent with the measured precipitation of 2.63 in. in 2002 and 1.5 in. in 2003 at the National Oceanic and Atmospheric Administration (NOAA) weather station located at CFA.
7-18

1,1,1-Trichloroethane
0
2000
4000
6000
8000
10000
12000
Aug-96 Aug-97 Aug-98 Aug-99 Aug-00 Aug-01 Aug-02 Aug-03
Sample Date
Con
cent
ratio
n (p
pbv)
12.5 ft 37.5 ft 77.5 ft 107.5 ft
1,1-Dichloroethene
0
500
1000
1500
2000
2500
3000
3500
4000
4500
5000
Aug-96 Aug-97 Aug-98 Aug-99 Aug-00 Aug-01 Aug-02 Aug-03
Sample Date
Con
cent
ratio
n (p
pbv) 12.5 ft
37.5 ft 77.5 ft 107.5 ft
Figure 7-7. Vapor trends for selected compounds in GSP1-1 (CFA-GAS-V-004) at Landfill I.
7-19

Trichloroethene
0
200
400
600
800
1000
1200
1400
1600
1800
Aug-96 Aug-97 Aug-98 Aug-99 Aug-00 Aug-01 Aug-02 Aug-03
Sample Date
Con
cent
ratio
n (p
pbv)
12.5 ft 37.5 ft 77.5 ft 107.5 ft
Trichlorofluoromethane
0
200
400
600
800
1000
1200
1400
Aug-96 Aug-97 Aug-98 Aug-99 Aug-00 Aug-01 Aug-02 Aug-03
Sample Date
Con
cent
ratio
n (p
pbv)
12.5 ft
37.5 ft
77.5 ft
107.5 ft
Figure 7-7. (continued).
7-20

1,1,1-trichloroethane
0
500
1000
1500
2000
2500
Aug-96 Aug-97 Aug-98 Aug-99 Aug-00 Aug-01 Aug-02 Aug-03
Sample Date
Conc
entra
tion
(ppb
v)
12.5 ft
37.5 ft
77.5 ft
107.5 ft
1,1-dichloroethane
Conc
entra
tion
(ppb
v)
10000
9000
8000
7000
6000
5000
4000
3000
2000
1000
0
12.5 ft
37.5 ft
77.5 ft
107.5 ft
36,000
Aug-96 Aug-97 Aug-98 Aug-99 Aug-00 Aug-01 Aug-02 Aug-03
Sample Date
Figure 7-8. Trends for selected compounds at GSP2-2 on Landfill II (CFA-GAS-V-006).
7-21
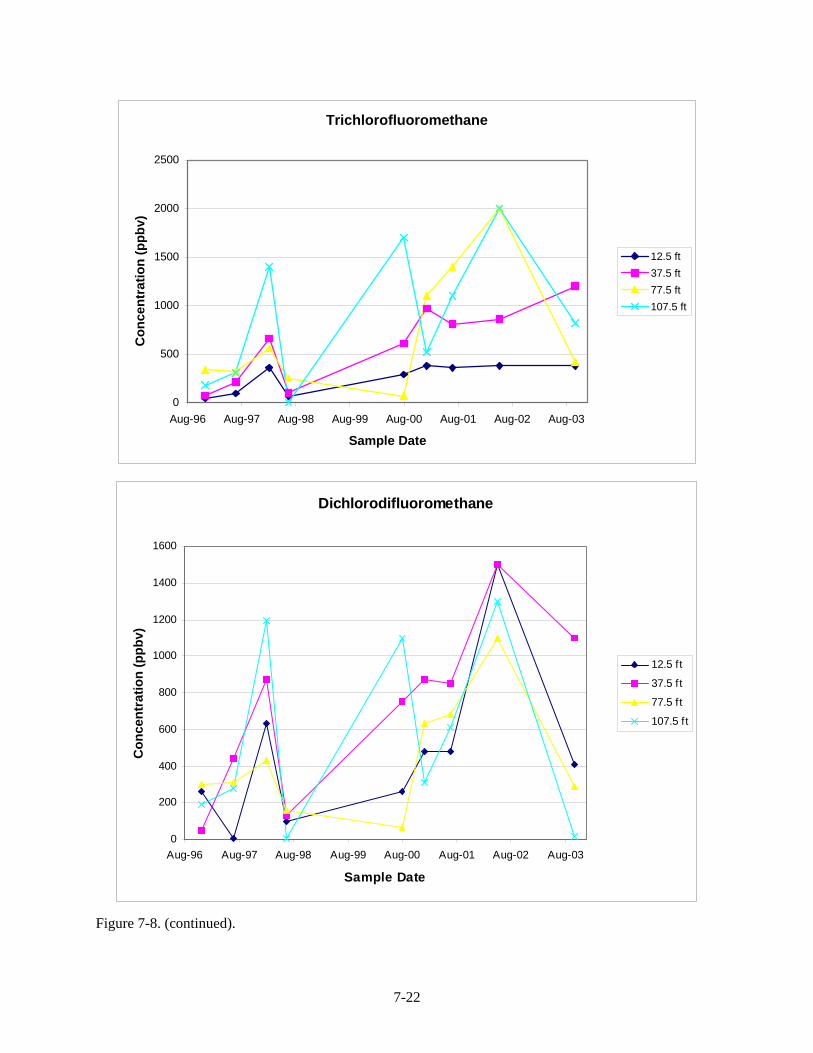
Trichlorofluoromethane
0
500
1000
1500
2000
2500
Aug-96 Aug-97 Aug-98 Aug-99 Aug-00 Aug-01 Aug-02 Aug-03
Sample Date
Con
cent
ratio
n (p
pbv)
12.5 ft 37.5 ft 77.5 ft 107.5 ft
Dichlorodifluoromethane
0
200
400
600
800
1000
1200
1400
1600
Aug-96 Aug-97 Aug-98 Aug-99 Aug-00 Aug-01 Aug-02 Aug-03
Sample Date
Con
cent
ratio
n (p
pbv)
12.5 ft
37.5 ft
77.5 ft
107.5 ft
Figure 7-8. (continued).
7-22

1,1,1-trichloroethane
0
2000
4000
6000
8000
10000
12000
14000
16000
Aug-96 Aug-97 Aug-98 Aug-99 Aug-00 Aug-01 Aug-02 Aug-03
Sample Date
Con
cent
ratio
n (p
pbv)
12.5 ft 37.5 ft 77.5 ft 107.5 ft
1,1-dichloroethene
0
1000
2000
3000
4000
5000
6000
7000
8000
Aug-96 Aug-97 Aug-98 Aug-99 Aug-00 Aug-01 Aug-02 Aug-03
Sample Date
Con
cent
ratio
n (p
pbv)
12.5 ft 37.5 ft 77.5 ft 107.5 ft
Figure 7-9. Trends for selected compounds at GSP3-1 near Landfill III (CFA-GAS-007).
7-23

1,1,1-trichloroethane
0
500
1000
1500
2000
2500
3000
3500
Aug-96 Aug-97 Aug-98 Aug-99 Aug-00 Aug-01 Aug-02 Aug-03
Sample Date
Con
cent
ratio
n (p
pbv)
12.5 ft
37.5 ft
77.5 ft
107.5 ft
Trichlorofluoromethane
0
500
1000
1500
2000
2500
3000
3500
Aug-96 Aug-97 Aug-98 Aug-99 Aug-00 Aug-01 Aug-02 Aug-03
Sample Date
Con
cent
ratio
n (p
pbv)
12.5 ft
37.5 ft
77.5 ft
107.5 ft
Figure 7-10. Concentration trends for selected compounds at GSP3-2 near Landfill III (CFA-GAS-V-008).
7-24

7-25
Figure 7-11. Locations of time-domain reflectometer arrays and neutron access tubes.

The neutron probe data from 2002 and 2003 indicate considerable variability in recharge from year to year (Table 7-5). In 2003, recharge was very low or nonexistent, with recharge estimates for the spring of 2003 less than 0.25 in. for all locations, including the background location. Recharge for the spring of 2002 was greater than 1 in. at four of the five NAT locations.
Table 7-5. Summary of moisture monitoring results since the previous five-year review. NATs TDRs
LF2-03 LF2-04 LF2-07 LF3-03 LF3-05 LF3-east LF3-west LF2-north LF2-south
Infiltration and Recharge Estimates Spring 2002 infiltration (in.)
Infiltration 2.11 2.46 5.23 3.77 1.34 5.35 4.72 4.32 0.81 Rechargea 0.29 1.07 2.97 1.24 <0.25 <0.25 <0.25 <0.25 <0.25
Spring 2003 infiltration (in.) Infiltration 0.30 0.45 0.42 0.89 0.47 1.91 1.84 1.5 1.05 Rechargea <0.25 <0.25 <0.25 <0.25 <0.25 <0.25 <0.25 0.28(3) <0.25
Water Storage Analysis Change in storage from 10/01 to 10/02 (in.) Total 0.17 0.49 1.10 0.51 -0.42 0.87 -0.13 -0.03 -0.23
Within cap — — -0.18 0.07 -0.14 -0.17 -0.04 -0.08 -0.22 Within ET zone 0.02 -0.05 0.05 0.10 -0.18 1.1 -0.09 0.00 -0.27 Below ET zone 0.15 0.54 1.05 0.41 -0.24 -0.23 -0.04 -0.03 0.04
Change in storage from 10/02 to 10/03 (in. of water) Total -0.30 -0.65 -1.41 -0.46 -0.17 -0.12 -0.67 0.25 0.27
Within cap — — -0.06 -0.08 -0.17 -0.36 -0.25 -0.14 0.01 Within ET zone -0.09 -0.01 -0.30 -0.08 -0.01 0.11 -0.45 -0.18 0.08 Below ET zone -0.21 -0.64 -1.11 -0.38 -0.16 -0.23 -0.22 0.42 0.19
a. The ET depth is assumed to be 3 to 4 ft for the NATs and 4 ft for the TDRs. The amount of recharge is estimated to be the increase in moisture content below the ET depth.
ET = evapotranspiration NAT = neutron access tube TDR = time-domain reflectometer
Changes in storage refer to changes in soil moisture content over a period that represents a full moisture cycle (typically 1 year). Changes in storage for FY 2002 and FY 2003 are discussed. Changes in storage at the NAT locations for FY 2002 (i.e., October 2001 to October 2002) indicate the moisture content over the soil profile monitored by the NATs at all locations except LF3-05 increased in moisture content (Table 7-5). However, the change in water storage indicates that moisture contents are generally holding steady within the landfill caps and within the ET zones. Location LF2-07 showed the largest increase in water storage, with 1.10 in. over the entire soil column and 1.05 in. below the ET zone. In contrast, LF2-03 located near the edge of Landfill II, showed almost no change in storage over the entire soil column, within and below the ET zone (see Table 7-5). The NATs, LF2-04 and LF3-03, showed small positive changes in storage over the entire soil column and below the ET zone. Changes in storage at the NAT locations during FY 2003 (i.e., October 2002 to October 2003) indicate that the moisture content over the soil profile monitored by the NATs decreased at all locations (Table 7-5). The change in water storage indicates that moisture contents decreased slightly within the landfill caps and the ET zones (net drainage).
7-26
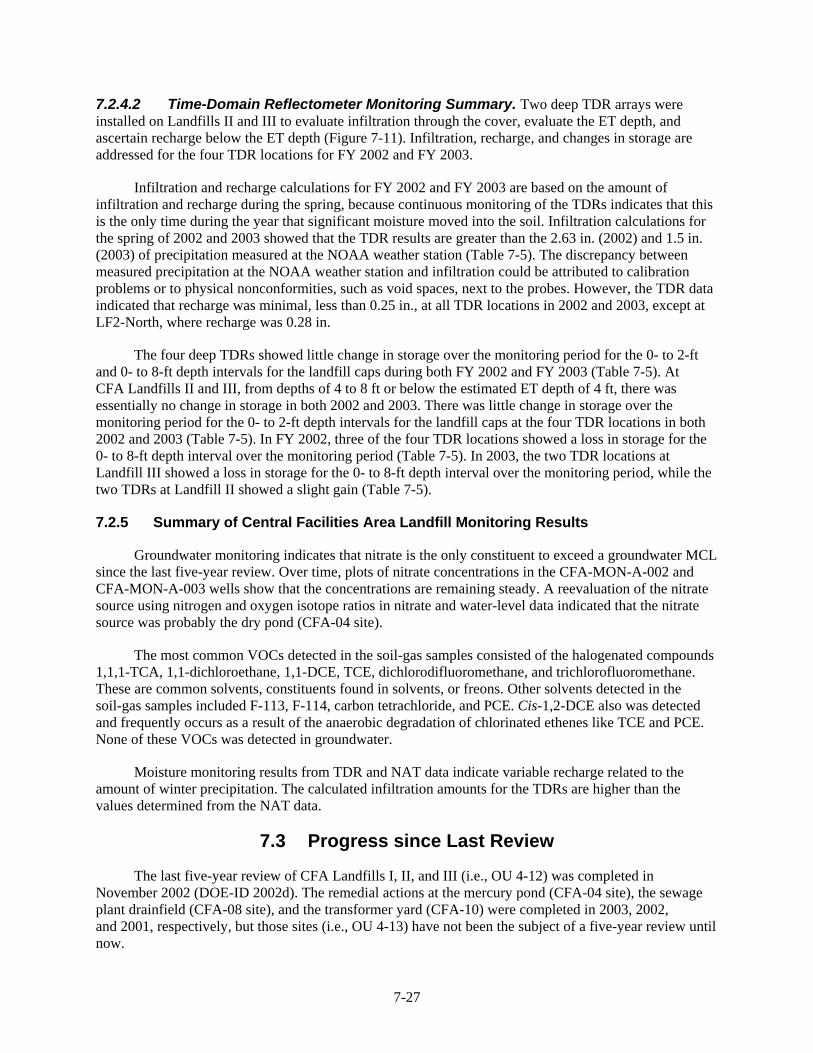
7.2.4.2 Time-Domain Reflectometer Monitoring Summary. Two deep TDR arrays were installed on Landfills II and III to evaluate infiltration through the cover, evaluate the ET depth, and ascertain recharge below the ET depth (Figure 7-11). Infiltration, recharge, and changes in storage are addressed for the four TDR locations for FY 2002 and FY 2003.
Infiltration and recharge calculations for FY 2002 and FY 2003 are based on the amount of infiltration and recharge during the spring, because continuous monitoring of the TDRs indicates that this is the only time during the year that significant moisture moved into the soil. Infiltration calculations for the spring of 2002 and 2003 showed that the TDR results are greater than the 2.63 in. (2002) and 1.5 in. (2003) of precipitation measured at the NOAA weather station (Table 7-5). The discrepancy between measured precipitation at the NOAA weather station and infiltration could be attributed to calibration problems or to physical nonconformities, such as void spaces, next to the probes. However, the TDR data indicated that recharge was minimal, less than 0.25 in., at all TDR locations in 2002 and 2003, except at LF2-North, where recharge was 0.28 in.
The four deep TDRs showed little change in storage over the monitoring period for the 0- to 2-ft and 0- to 8-ft depth intervals for the landfill caps during both FY 2002 and FY 2003 (Table 7-5). At CFA Landfills II and III, from depths of 4 to 8 ft or below the estimated ET depth of 4 ft, there was essentially no change in storage in both 2002 and 2003. There was little change in storage over the monitoring period for the 0- to 2-ft depth intervals for the landfill caps at the four TDR locations in both 2002 and 2003 (Table 7-5). In FY 2002, three of the four TDR locations showed a loss in storage for the 0- to 8-ft depth interval over the monitoring period (Table 7-5). In 2003, the two TDR locations at Landfill III showed a loss in storage for the 0- to 8-ft depth interval over the monitoring period, while the two TDRs at Landfill II showed a slight gain (Table 7-5).
7.2.5 Summary of Central Facilities Area Landfill Monitoring Results
Groundwater monitoring indicates that nitrate is the only constituent to exceed a groundwater MCL since the last five-year review. Over time, plots of nitrate concentrations in the CFA-MON-A-002 and CFA-MON-A-003 wells show that the concentrations are remaining steady. A reevaluation of the nitrate source using nitrogen and oxygen isotope ratios in nitrate and water-level data indicated that the nitrate source was probably the dry pond (CFA-04 site).
The most common VOCs detected in the soil-gas samples consisted of the halogenated compounds 1,1,1-TCA, 1,1-dichloroethane, 1,1-DCE, TCE, dichlorodifluoromethane, and trichlorofluoromethane. These are common solvents, constituents found in solvents, or freons. Other solvents detected in the soil-gas samples included F-113, F-114, carbon tetrachloride, and PCE. Cis-1,2-DCE also was detected and frequently occurs as a result of the anaerobic degradation of chlorinated ethenes like TCE and PCE. None of these VOCs was detected in groundwater.
Moisture monitoring results from TDR and NAT data indicate variable recharge related to the amount of winter precipitation. The calculated infiltration amounts for the TDRs are higher than the values determined from the NAT data.
7.3 Progress since Last Review
The last five-year review of CFA Landfills I, II, and III (i.e., OU 4-12) was completed in November 2002 (DOE-ID 2002d). The remedial actions at the mercury pond (CFA-04 site), the sewage plant drainfield (CFA-08 site), and the transformer yard (CFA-10) were completed in 2003, 2002, and 2001, respectively, but those sites (i.e., OU 4-13) have not been the subject of a five-year review until now.
7-27

As part of the first five-year review for OU 4-12, the determination as to whether the remedial action implemented for CFA Landfills I, II, and III is protective of human health and the environment was deferred until additional assessments of groundwater-level data and landfill cover performance could be completed. Based on the assessment, recommendations were made that would aid in the assessment of the effectiveness of the remedial action at the CFA landfills. The recommendations and actions taken since the previous five-year review for OU 4-12 are summarized in Table 7-6.
Table 7-6. Recommendations and responses to issues from the first five-year review for Operable Unit 4-12.
Recommendation in first five-year review Action taken
Continue the yearly inspection of the institutional Completed controls.
Continue annual groundwater sampling. Completed
Continue annual soil-gas monitoring, and change it Completed from October to September.
Continue to monitor USGS-083 and LF3-09 Completed
Continue monthly moisture monitoring through Completed September 2003.
Perform digital gyroscopic deviation surveys. Completed on selected wells
Defer the decision as to whether an additional well Two additional wells have been installed during is required to monitor groundwater under the CFA FY 2005. Well placement was based on revised landfills until new groundwater contour maps are groundwater contour maps. derived.
Monitor detectable vapor analytes (i.e., VOCs) in Contract Laboratory Program VOCs continue to the groundwater. be the target analytes for groundwater sampling.
Reevaluate the source of nitrates. Sampling for nitrogen and oxygen isotope ratios in nitrate was completed, and new groundwater contour maps were generated.
Submit non-quality-assured data (i.e., groundwater Completed elevations, NAT data, and TDR data) as part of the annual monitoring reports.
CFA = Central Facilities Area FY = fiscal year NAT = neutron access tube TDR = time-domain reflectometer USGS = United States Geological Survey VOC = volatile organic compound
7.4 Technical Assessment
The information provided in this technical assessment is a summary of previously compiled data on the operations, maintenance, and monitoring activities associated with the CFA-01, CFA-02, CFA-03, CFA-04, CFA-08, and CFA-10 sites.
7-28

7.4.1 Central Facilities Area Landfills I, II, and III (CFA-01, CFA-02, and CFA-03 Sites)
This assessment evaluates the monitoring data collected in support of the remedial action for the CFA landfills, as summarized in Section 7.2. In addition, the assessment considers information obtained from the annual institutional control inspections and operation and maintenance of the covers at the CFA landfills.
Question A: Is the remedy functioning as intended by the decision documents?
The landfill covers were intended to prevent direct contact with landfill contents and prevent water from percolating through the landfills and carrying contaminants from the waste into the SRPA. The soil-gas monitoring points, moisture infiltration equipment, and groundwater monitoring wells were installed in strategic locations to evaluate impacts to the environment (SRPA) from the waste in the landfills. Based on the review of the available data, the landfill covers continue to function as designed by limiting the amount of infiltration at the surface of the landfills.
Question B: Are the exposure assumptions, toxicity data, cleanup levels, and remedial action objectives used at the time of the remedy selection still valid?
There have been no changes in the original exposure assumptions, toxicity data, cleanup levels, or RAOs since completion of the covers at CFA Landfills I, II, and III. The groundwater monitoring results have shown that concentrations of nitrates exceeding the MCLs for drinking water are not attributed to the leaching of contaminants from the landfills. The original assumptions, cleanup levels, and RAOs used at the time of the remedy are still valid, based on the review of the technical assessment data provided.
Question C: Has any other information come to light that could call into question the protectiveness of the remedy?
The soil-gas, groundwater, and soil-moisture (TDR and NAT) data and observations from annual operations and maintenance inspections have been reviewed. Two items of interest were identified for further evaluation as part of this five-year review: (1) the potential impact of soil-gas VOCs on groundwater at the CFA landfills and (2) the appearance of subsidence in the cover of Landfill III (Figure 7-2). In addition, it is noted that during past installation of the TDR arrays, roots were observed encroaching into the low-permeability layer of the landfill covers.
A preliminary evaluation of the potential impacts of VOCs in soil gas at the CFA landfills was made by comparing deep soil-gas concentrations at the CFA landfills to the preliminary remediation goals calculated for the Subsurface Disposal Area (SDA) at the RWMC. Using the 2003 soil-gas data, the maximum PCE, TCE, and 1,1,1-TCA concentrations measured at the CFA landfills are much lower than the preliminary remediation goals calculated for the SDA (ICP 2004a). Given these comparisons, it is highly unlikely that contamination from the CFA landfills would adversely impact the SRPA.
Although the subsidence at Landfill III has potentially compromised the integrity of the cover, the cover integrity will be restored upon repair, thus reestablishing the protectiveness of the remedy. In addition, it is uncertain what effect encroachment of roots into the low-permeability layer of the landfill covers may have on the protectiveness of the remedy. Therefore, infiltration monitoring should continue, and alternative vegetation analysis and infiltration modeling will be performed in FY 2006 to evaluate the impacts of root encroachment into the low-permeability layer of the landfill covers. Soil-gas and groundwater data will continue to be monitored to assess the protectiveness of the remedy. The covers at CFA Landfills I, II, and III remain protective of human health and the environment, and there is no additional information that indicates that the protectiveness of the covers has been compromised.
7-29

7.4.2 Mercury Pond (CFA-04 Site)
This assessment evaluates the protectiveness of the remedial action implemented at the mercury pond. As stated previously, this remedial action was completed in November 2003 through the removal and disposal of mercury-contaminated soil that exceeded the prescribed remedial action goal (DOE-ID 2004a).
Question A: Is the remedy functioning as intended by the decision documents?
The selected remedy at the mercury pond included the excavation, removal, and disposal of mercury-contaminated soil. In addition, material that contained asbestos was removed and disposed of. The remedial activities removed, to the extent practical, all mercury-contaminated media that exceeded the remedial action goal concentration of 8.4 mg/kg (DOE-ID 2000b; DOE-ID 2003a). The average concentration in the pond area is 7.3 mg/kg, which is below the 8.4-mg/kg remedial action goal (DOE-ID 2004a).
Question B: Are the exposure assumptions, toxicity data, cleanup levels, and remedial action objectives used at the time of the remedy selection still valid?
There have been no changes to the original exposure assumptions, toxicity data, cleanup levels, or RAOs since the remedial action was completed. Upon completion of the remedial action, the average mercury concentration in the soil in the pond area was 7.3 mg/kg. As such, the excess risk to human or ecological receptors from the residual mercury contamination is determined to be within acceptable limits.
The ESD to the ROD (DOE-ID 2003a) provided justification to raise the remedial action goal from 0.5 mg/kg to 8.4 mg/kg, based on updated mercury toxicity data. Originally, the mercury pond was not identified as presenting a risk to the SRPA, based on information provided in the RI/FS (DOE-ID 2000a); however, the mercury pond has recently been identified as a potential source for the elevated nitrate concentrations in two monitoring wells south of CFA (ICP 2004a).
More information is needed on the types and quantities of nitrate disposed of in the pond. As a result, the source of nitrates will continue to be investigated until it can be positively identified or the nitrate levels drop below the MCL.
Question C: Has any other information come to light that could call into question the protectiveness of the remedy?
Because the remedial action was completed in November 2003 and the contaminated soil was removed from the site, the remedy is considered to be protective of human health and the environment; however, the recent suggestion that the mercury pond might be the source of elevated nitrates in the groundwater reaffirms the need for continued groundwater monitoring in and around CFA to assess the concentrations of contaminants in the SRPA.
7.4.3 Sewage Plant Drainfield (CFA-08 Site)
Question A: Is the remedy functioning as intended by the decision documents?
The intent of the engineered cover placed over the sewage plant drainfield was to prevent human or ecological receptor contact with the radioactively contaminated (Cs-137) materials in the drainfield. The remedial action, including installation of institutional controls, was completed at the site in November 2002 and has been the subject of annual operations, maintenance, and institutional control
7-30

inspections. Based on the results of these inspections, the remedy is functioning as intended by the decision documents.
Question B: Are the exposure assumptions, toxicity data, cleanup levels, and remedial action objectives used at the time of the remedy selection still valid?
There have been no changes to the original exposure assumptions, toxicity data, cleanup levels, or RAOs since the remedial action was completed. As such, the original assumptions are still considered valid.
Question C: Has any other information come to light that could call into question the protectiveness of the remedy?
Nitrate concentrations in excess of the EPA drinking water standard of 10 mg-N/L have been detected in two of the CFA groundwater monitoring wells (ICP 2004a). A nitrogen isotope study completed in 2000 implicated the sewage plant drainfield as the source of the elevated nitrates (INEEL 2002); however, the revised groundwater flow map in the 2002 Annual Monitoring Report (INEEL 2003b) and a new nitrogen and oxygen isotope study (ICP 2004a) did not support the drainfield as the source of the nitrates. Both the revised water level map and the nitrogen and oxygen isotope study indicated that the mercury pond (CFA-04 site) was the probable source of the nitrates. The engineered cover and institutional controls remain protective of human health and the environment.
7.4.4 Transformer Yard (CFA-10 Site Code)
Question A: Is the remedy functioning as intended by the decision documents?
The remedy at the transformer yard included the removal and disposal of lead-contaminated soil. The verification sampling performed after completion of the soil removal indicates that the lead concentration in the soil ranges from 9.7 to 298 mg/kg, well below the remedial action goal of 400 mg/kg.
Question B: Are the exposure assumptions, toxicity data, cleanup levels, and remedial action objectives used at the time of the remedy selection still valid?
There have been no changes to the original exposure assumptions, toxicity data, cleanup levels, or RAOs since completion of the remedial action. As such, the original assumptions are still considered valid.
Question C: Has any other information come to light that could call into question the protectiveness of the remedy?
There has been no new information that would indicate that the remedy is not protective. All contaminated media with lead concentrations exceeding the remedial action goal of 400 mg/kg were removed from the site, thereby removing the potential for exposure of human and ecological receptors to contamination that would present unacceptable risk or hazards.
7.5 Technical Assessment Summary
CFA Landfills I, II, and III (CFA-01, CFA-02, and CFA-03 sites) were capped with engineered covers. The covers are performing as expected by limiting infiltration from the surface, and indications are that the remedy is effective.
7-31

The sewage plant drainfield (CFA-08 site) had been suspected of being a nitrate source, as indicated by nitrate levels found in CFA monitoring wells. However, nitrogen and oxygen isotope ratios in nitrate showed that this was not the most likely source of the nitrates. The drainfield was capped with an engineered cover to prevent human and receptor contact with radioactive contaminants.
The mercury pond (CFA-04 site) has now been identified as a possible source of the increased nitrate levels in the CFA-MON-A-002 and CFA-MON-A-003 wells. The pond was remediated by removing contaminated soil. Though the pond has been remediated, contaminants have migrated into the vadose zone, and groundwater monitoring will need to continue to track the nitrate contamination.
7.6 Issues
No issues were identified with the mercury pond (CFA-04 site), the French drains (CFA-07 site), the sewage plant drainfield (CFA-08 site), or the transformer yard (CFA-10).
The subsidence feature identified on CFA Landfill III (CFA-03 site) compromised the integrity of the cover and, if the cover is not repaired, has the potential to allow surface water to contact the waste and potentially carry contaminants to the SRPA. For a list of issues identified within all WAGs during the INL Sitewide five-year review in 2005, see Table C-1 in Appendix C.
7.7 Recommendations and Follow-up Actions
Recommendations are made in this subsection relating to the sites that are subject to a five-year review—specifically, CFA Landfills I, II, and III (CFA-01, CFA-02, and CFA-03 sites), the French drains (CFA-07 site), and the sewage plant drainfield CFA-08—as specified in the OU 4-13 Operations and Maintenance Plan (DOE-ID 2002b).
The subsidence feature in the cover of Landfill III (CFA-03 site) will be repaired and revegetated in accordance with the original cover design and construction. To this end, it is recommended that the annual visual inspections of the landfills continue, paying close attention to the repaired portion of Landfill III. These inspections will continue until the next five-year review, when continuation of the inspections will be reevaluated. In accordance with the OU 4-13 Operations and Maintenance Plan (DOE-ID 2002b), a topographical survey of Landfills I, II, and III also will be performed in FY 2005. In addition, the repaired area of Landfill III will be the subject of topographical surveys in FY 2006 and FY 2007 to evaluate and document the effectiveness of repairing the subsidence. Topographical surveys will be conducted for subsequent five-year reviews, and the frequency of the surveys will be evaluated.
Because VOCs have been detected in the past in the groundwater and in the gas vapors, it is recommended that the soil-gas sampling continue at CFA Landfills I, II, and III on an annual basis. “Trigger” soil-gas concentrations should be calculated to determine the need for vadose zone vapor modeling. Upon determination of the “trigger” concentrations, continuation of the vapor sampling at the CFA landfills will be reevaluated through the comparison of the “trigger” soil-gas concentrations to the historical vapor concentrations observed from the sampling events at the CFA landfills. The VOCs will continue to be monitored in the groundwater and would indicate any future vertical migration.
7-32

7.8 Protectiveness Statement
Based on the data reviewed and the site inspections, the remedies are functioning as intended by the OU 4-12 ROD (DOE-ID 1995) and the OU 4-13 ROD (DOE-ID 2000b), as modified by the ESD (DOE-ID 2003a). No changes in the physical conditions of the site have occurred that would affect the protectiveness of the remedies. There have been no changes in the toxicity factors or risk factors for the COCs. Several issues have been identified that warrant further evaluation; however, there is no information that negates the protectiveness of the remedies at the WAG 4 sites at this time.
7.9 Section 7 References
40 CFR 300, 2003, “National Oil and Hazardous Substances Pollution Contingency Plan,” Code of Federal Regulations, Office of the Federal Register, August 2003.
42 USC § 9601 et seq., 1980, “Comprehensive Environmental Response, Compensation and Liability Act of 1980 (CERCLA/Superfund),” United States Code, December 11, 1980.
DOE-ID, 1991, Federal Facility Agreement and Consent Order for the Idaho National Engineering Laboratory, Administrative Docket No. 1088-06-29-120, U.S. Department of Energy Idaho Operations Office; U.S. Environmental Protection Agency, Region 10; Idaho Department of Health and Welfare, December 4, 1991.
DOE-ID, 1992, Record of Decision Central Facilities Area Motor Pool Pond, Operable Unit 4-11, Waste Area Group 4, Document ID 5242, Rev. 0, U.S. Department of Energy Idaho Operations Office, January 1992.
DOE-ID, 1995, Record of Decision Declaration for Central Facilities Area Landfills I, II, and III (Operable Unit 4-12), and No Action Sites (Operable Unit 4-03), Document ID 10146, Rev. 0, U.S. Department of Energy Idaho Operations Office, Idaho Department of Health and Welfare, and U.S. Environmental Protection Agency, October 1995.
DOE-ID, 1996, Remedial Design/Remedial Action Work Plan for Central Facilities Area Landfills I, II, and III Native Soil Cover Project, Operable Unit 4-12, DOE/ID-10528, Rev. 0, U.S. Department of Energy Idaho Operations Office, April 1996.
DOE-ID, 1997, Remedial Action Report CFA Landfills I, II, and III Native Soil Cover Project Operable Unit 4-12, DOE/ID-10589, Rev. 0, U.S. Department of Energy Idaho Operations Office, September 1997.
DOE-ID, 2000a, Comprehensive Remedial Investigation/Feasibility Study for the Central Facilities Area Operable Unit 4-13 at the Idaho National Engineering and Environmental Laboratory, DOE/ID-10680, Rev. 1, U.S. Department of Energy Idaho Operations Office, July 2000.
DOE-ID, 2000b, Final Comprehensive Record of Decision for Central Facilities Area Operable Unit 4-13, DOE/ID-10719, Rev. 2, U.S. Department of Energy Idaho Operations Office, July 2000.
DOE-ID, 2001, Remedial Design/Remedial Action Work Plan Idaho National Engineering and Environmental Laboratory Central Facilities Area, Operable Unit 4-13 Transformer Yard (CFA-10), DOE/ID-10826, Rev. 0, U.S. Department of Energy Idaho Operations Office, April 2001.
7-33

DOE-ID, 2002a, Remedial Design/Remedial Action Work Plan for Waste Area Group 4, CFA-08 Sewage Plant Drainfield, OU 4-13, DOE/ID-10929, Rev. 0, U.S. Department of Energy Idaho Operations Office, March 2002.
DOE-ID, 2002b, Operations and Maintenance Plan for the Final Selected Remedies and Institutional Controls at Central Facilities Area, Operable Unit 4-13, DOE/ID-10931, Rev. 0, U.S. Department of Energy Idaho Operations Office, March 2002.
DOE-ID, 2002c, Construction Complete Report for the Idaho National Engineering and Environmental Laboratory, Central Facilities Area, Operable Unit 4-13, Transformer Yard (CFA-10), DOE/ID-10965, Rev. 0, U.S. Department of Energy Idaho Operations Office, April 2002.
DOE-ID, 2002d, Central Facilities Area Landfills I, II, and III Five-Year Review Supporting Documentation, DOE/ID-10981, Rev. 0, U.S. Department of Energy Idaho Operations Office, November 2002.
DOE-ID, 2002e, Fiscal Year 2002 Operations and Maintenance Report for the Central Facilities Area, Operable Unit 4-13, DOE/ID-11052, Rev. 0, U.S. Department of Energy Idaho Operations Office, December 2002.
DOE-ID, 2002f, Annual INTEC Groundwater Monitoring Report for Group 5–Snake River Plain Aquifer (2001), DOE/ID-10930, Rev. 0, U.S. Department of Energy Idaho Operations Office, February 2002.
DOE-ID, 2003a, Explanation of Significant Differences for the Record of Decision for the Central Facilities Area Operable Unit 4-13, DOE/ID-11030, Rev. 0, U.S. Department of Energy Idaho Operations Office, May 2003.
DOE-ID, 2003b, Waste Area Group 4 Remedial Design/Remedial Action Work Plan, CFA-04 Pond Mercury-Contaminated Soils, Operable Unit 4-13, DOE/ID-11028, Rev. 0, U.S. Department of Energy Idaho Operations Office, February 2003.
DOE-ID, 2003c, Construction Complete Report for the Idaho National Engineering and Environmental Laboratory, Central Facilities Area, Operable Unit 4-13, CFA-08 Sewage Plant Drainfield, DOE/ID-11059, Rev. 0, U.S. Department of Energy Idaho Operations Office, June 2003.
DOE-ID, 2003d, Annual INTEC Groundwater Monitoring Report for Group 5—Snake River Plain Aquifer (2003), DOE/ID-11118, Rev. 0, U.S. Department of Energy Idaho Operations Office, December 2003.
DOE-ID, 2004a, Remedial Action Report for the Idaho National Engineering and Environmental Laboratory, Central Facilities Area, Operable Unit 4-13, DOE/NE-ID-11137, Rev. 1, U.S. Department of Energy Idaho Operations Office, September 2004.
DOE-ID, 2004b, Fiscal Year 2003 Operations and Maintenance Report for the Central Facilities Area, DOE/NE-ID-11145, Rev. 0, U.S. Department of Energy Idaho Operations Office, March 2004.
DOE-ID, 2005, INL Sitewide Operations and Maintenance Report for CERCLA Response Actions— FY 2004, DOE/NE-ID-11200, Rev. 0, U.S. Department of Energy Idaho Operations Office, August 2005.
7-34

EPA, 1999, “Region 10 Final Policy on the Use of Institutional Controls at Federal Facilities,” Office of Environmental Cleanup, Office of Waste and Chemicals Management, and Office of Regional Counsel, U.S. Environmental Protection Agency, Seattle, Washington, May 1999.
ICP, 2004a, Central Facilities Area Landfills I, II, and III Annual Monitoring Report (2003), ICP/EXT-04-00149, Rev. 0, Idaho National Engineering and Environmental Laboratory, Idaho Completion Project, October 2004.
ICP, 2004b, Annual Groundwater Monitoring Status Report for the Waste Area Group 5 for Fiscal Year 2004, ICP/EXT-04-00369, Rev. 1, Idaho National Engineering and Environmental Laboratory, Idaho Completion Project, November 2004.
INEEL, 1998, Central Facilities Area Contaminated Soil Removal Action Summary Report Operable Units 4-02, 4-05, and 4-09, INEEL/EXT-97-01462, Rev. 0, Idaho National Engineering and Environmental Laboratory, June 1998.
INEEL, 2002, Summary of Nitrate Evaluation, Waste Area Group 4, INEEL/EXT-2000-01115, Rev. 0, Idaho National Engineering and Environmental Laboratory, March 2002.
INEEL, 2003a, Post-Record of Decision Monitoring Work Plan Central Facilities Area Landfills I, II, and III Operable Unit 4-12, INEL-95/0579, Rev. 5, Idaho National Engineering and Environmental Laboratory, October 2003.
INEEL, 2003b, Central Facilities Landfills I, II, and III Annual Monitoring Report (2002), INEEL/EXT-03-00024, Rev. 0, Idaho National Engineering and Environmental Laboratory, September 2003.
INEL, 1996, Preliminary Scoping Track 2 Summary Report for Central Facilities Area Operable Unit 4-09 (Incorporating Selected Sites from Operable Units 4-03 and 4-07) and CFA French Drain Removals, INEL-95/0586, Rev. 0, Idaho National Engineering Laboratory, April 1996.
INEL, 1997, Central Facilities Area Contaminated Soil Removal Action Summary Report Operable Units 4-06 and 4-09, INEL/EXT-97-00112, Rev. 0, Idaho National Engineering Laboratory, April 1997.
Knobel, L. L., B. R. Orr, and L. D. Cecil, 1992, “Summary of Concentrations of Selected Radiochemical and Chemical Constituents in Groundwater from the Snake River Plain Aquifer, Idaho: Estimated from an Analysis of Previously Published Data,” Journal of Idaho Academy of Science, Vol. 28, No. 1, pp. 48–61, June 1992.
USGS, 1999, Chemical Constituents in Ground Water from 39 Selected Sites with an Evaluation of Associated Quality Assurance Data, Idaho National Engineering and Environmental Laboratory and Vicinity, Idaho, USGS Open File Report 99-246, United States Geological Survey.
7-35

7-36

8. WASTE AREA GROUP 5 (AUXILIARY REACTOR AREA AND POWER BURST FACILITY)
WAG 5 comprises the Auxiliary Reactor Area (ARA) and the PBF.
The ARA consisted of four separate operational areas (designated as ARA-I, ARA-II, ARA-III, and ARA-IV). The ARA-II facility housed the Stationary Low Power Reactor No. 1 (SL-1) facility and numerous minor structures. The ARA-I facility was built to support SL-1. Both of these facilities were built in 1957. In 1961, an accident destroyed the SL-1 reactor, and ARA-I became the staging area for the SL-1 emergency response and subsequent SL-1 decontamination and cleanup.
ARA-III and ARA-IV were built in the late 1950s. The ARA-III facility initially housed the Army Gas-Cooled Reactor Experiment research reactor, and the ARA-IV facility was built to accommodate the Mobile Low Power Reactor-1. Experiments with the Army Gas-Cooled Reactor were discontinued at ARA-III in 1961. Work on the Mobile Low Power Reactor-1 at ARA-IV continued through 1964. In 1963, the ARA-III facility was modified to support tests at ARA-IV and remained active until 1965. ARA-IV was used to operate the Nuclear Effects Reactor Program from 1967 to 1970. ARA-IV is still in use as part of the Critical Infrastructure Test Range Complex.
PBF was built in the late 1950s. Initially, it was known as the Special Power Excursion Reactor Test (SPERT) facility and consisted of five separate operational areas: the Control Area and SPERT-I, SPERT-II, SPERT-III, and SPERT-IV. Later, operational areas at PBF consisted of the PBF Control Area, the PBF Reactor Area (SPERT-I), the Waste Engineering Development Facility (SPERT-II), the Waste Experimental Reduction Facility (SPERT-III), and the Mixed Waste Storage Facility (SPERT-IV). Collectively, the Waste Engineering Development Facility, the Waste Experimental Reduction Facility, and the Mixed Waste Storage Facility were known as the Waste Reduction Operations Complex.
Operations at ARA and PBF resulted in releases of contaminants to the environment. Consequently, these areas have been designated as WAG 5 under the FFA/CO (DOE-ID 1991). This CERCLA (42 USC § 9601 et seq.) remedial action is proceeding in accordance with requirements identified in four RODs. Tables 8-1 through 8-3 list the release sites that required remediation, the COCs at each site, and the cleanup goals for each site. Figures 8-1 and 8-2 show the CERCLA sites at ARA and PBF, respectively.
The first ROD, issued in September 1992, focused on remediation of the PBF corrosive waste sump (PBF-08 site) and evaporation pond (PBF-10 site) within OU 5-13 as part of an interim remedial action (DOE-ID 1992a). The second ROD, issued in December 1992, focused on the no-action declaration for the ARA-I chemical evaporation pond (ARA-01 site) (DOE-ID 1992b). The third ROD was issued in January 1996 under OU 5-07 and focused on remediation of the SL-1 burial ground (ARA-06 site) and the identification of 10 no-action sites within OUs 5-01, 5-03, 5-04, and 5-11 (and an additional burial ground within WAG 6, OU 6-01, that is not summarized here) (INEL 1996). Although no additional effort was expended to remediate or assess these no-action sites individually, each was considered for cumulative effects in the comprehensive RI/FS for WAG 5. The fourth ROD, also known as the comprehensive ROD for WAG 5 (OU 5-12), was issued in January 2000 and describes the proposed remedial action for WAG 5 sites not covered by the previous RODs (DOE-ID 2000a).
8-1

Table 8-1. Contaminants of concern at Waste Area Group 5.
Site (Site Code) COC Remediation Goal
8-2
PBF Corrosive Waste Sump Cs-137 (PBF-08) Chromium
PBF Evaporation Pond Cs-137 (PBF-10) Chromium
SPERT-II Leach Pond Mercury(PBF-16)
Contaminated Soil beneath PER-751 Pump House Floor Slab and Cs-137 Foundation (PBF-37)
ARA-I Chemical Evaporation Pond Arsenic (ARA-01) Selenium
Thallium
ARA-I Sanitary Waste System Cs-137 (ARA-02) Ra-226
U-235 U-238
Aroclor-1242 Lead
ARA-II Stationary Low-Power Reactor No. 1 Burial Ground Refer to (ARA-06) Tables 8-2 and 8-3
ARA-III Radioactive Waste Leach Pond Ag-108m (ARA-12) Copper
Mercury Selenium
ARA-I Radionuclide Tank Cs-137 (ARA-16)
30 pCi/g 800 mg/kg
30 pCi/g 800 mg/kg
0.5
mg/kg
23 pCi/g
10 mg/kg 2.2 mg/kg 4.3 mg/kg
8.5 pCi/ga
2.1 or 1.2 pCi/gb
6.2 pCi/ga
10.6 pCi/ga
1 mg/kgc
400 mg/kg
Inhibit exposure to radioactive constituents.
0.75 pCi/g 220 mg/kg 0.5 mg/kg 2.2 mg/kg
23 pCi/g

8-3
Table 8-1. (continued).
Site (Site Code) COC Remediation Goal
Radiologically Contaminated Surface Soils and Subsurface Structures Associated with ARA-I and ARA-II (ARA-23)
Cs-137 23 pCi/g
ARA-I Soil beneath the ARA-626 Hot Cells Cs-137 23 pCi/g (ARA-25) Ra-226 2.1 or 1.2 pCi/gb
Arsenic 5.8 mg/kg Lead 400 mg/kg
Copper 220 mg/kg
a. The remediation goals for Cs-137, U-235, and U-238 are weighted averages based on relative risk contributions and 100 times the 1E-06 risk-based soil concentrations reported by Fromm (1996). The cumulative risk for Cs-137, U-235, and U-238 is 1E-04 at the remediation goal soil concentrations.
b. The remediation goal is the average INL Site background value for Ra-226 reported by Giles (1998), because the 1E-04 risk-based concentration derived from Fromm (1996), 0.55 pCi/g, is below the INL-average background concentration. A goal of 2.1 pCi/g will be used for comparison of sample results that may include interference from U-235. Otherwise, a goal of 1.2 pCi/g will be used.
c. The reference addresses PCB remediation waste for high-occupancy areas. Though the seepage pit sludge is not remediation waste, 1 mg/kg was identified as a protective remediation goal for the aroclor-1242 contained in the seepage pit sludge. A noncarcinogenic risk-based remediation goal could not be developed, because a reference dose for calculating a hazard quotient specific to aroclor-1242 is unavailable. The toxicity of aroclor-1242 was qualitatively assessed using the reference doses for aroclor-1254.
ARA = Auxiliary Reactor Area COC = contaminant of concern INL = Idaho National Laboratory PBF = Power Burst Facility PCB = polychlorinated biphenyl SPERT = Special Power Excursion Reactor Test

Table 8-2. Surface soil concentrations for various contaminants of concern at SL-1.
Concentration (pCi/g)
Radionuclide 95% Upper Confidence Limit INL Backgrounda
Co-60 0.36 No data are available.
Cs-137 904 1.28
Eu-154 2.68 No data are available.
Sr-90 1370 0.76
Th-230 and/or U-234 2.7 1.88/1.95 a. The 95%/95% upper tolerance limit, grab sample background concentrations are from Background Dose Equivalent Rates and Surficial Soil Metal and Radionuclide Concentrations for the Idaho National Engineering Laboratory (Rood, Harris, and White 1995).
INL = Idaho National Laboratory
Table 8-3. Subsurface concentrations for various contaminants of concern at SL-1.
Concentration (pCi/g)
July 2094 Radionuclide July 1994 (Anticipated)
Cs-137 2.29E+04 2.27E+03
Sr-90 2.15E+04 1.99E+03
Kr-85 6.91E+02 1.08E+00
Sm-151 5.20E+02 2.41E+02
Pm-147 2.62E+01 8.78E-11
Pu-241 1.96E+01 1.59E-01
Eu-154 1.84E+01 5.80E-03
Eu-155 1.24E+01 1.05E-05
Pu-239 1.04E+01 1.04E+01
Tc-99 6.85E+00 6.85E+00
Pu-238 6.72E+00 3.05E+00
Am-241 2.57E+00 2.76E+00
Pu-240 1.56E+00 I.55E+00
Zr-93 1.04E+00 1.04E+00
8-4

Figure 8-1. Auxiliary Reactor Area CERCLA sites.
8-5

Figure 8-2. Power Burst Facility CERCLA sites.
8-6

The Record of Decision Power Burst Facility and Auxiliary Reactor Area, Operable Unit 5-12 (DOE-ID 2000a) evaluated 55 individual sites that were identified in the Waste Area Group 5 Operable Unit 5-12 Comprehensive Remedial Investigation/Feasibility Study (Holdren et al. 1999). Of the 55 sites, the OU 5-12 ROD (DOE-ID 2000a) provided information to support remedial actions for six sites at ARA (ARA-01, ARA-02, ARA-12, ARA-16, ARA-23, and ARA-25) and one at PBF (PBF-16) where contamination presented an unacceptable risk to human health and the environment. The OU 5-12 ROD also reviewed the no-action determination for the ARA-I chemical evaporation pond (ARA-01) and stated that remedial action was required. The OU 5-12 ROD also established that groundwater monitoring was to be conducted at WAG 5 until results of a five-year review warranted discontinuation of the monitoring. This monitoring resulted from a concern about elevated lead concentrations that had been detected in selected wells at the site.
As part of the OU 5-12 remedial action, a new site designated as PBF-37 was identified as requiring remediation. The PBF-37 site consists of contaminated soil beneath the floor slab and foundation of the Power Excursion Reactor (PER) -751 radioactive waste storage tank pump house. A New Site Identification Form was completed for this site in September 2004. It was anticipated that this contaminated soil site could be remediated in a manner similar to all other Phase II OU 5-12 contaminated soil (i.e., soil removal to either basalt or designated remedial action guidelines). As such, the agencies agreed to include the PBF-37 site under the OU 5-12 remedial action for contaminated soils. The site was remediated in the fall of 2004, with all residual sampling results returned by the winter of 2004/2005.
Institutional controls also were required for six of the seven remedial action sites—the exception being the PBF-16 site. No additional remediation activities were conducted for the remaining 48 sites in WAG 5, but the ROD did require institutional controls for nine of the 48 sites. A no-action decision was made for the remaining 39 sites, because they presented no unacceptable risks. Also included in the ROD are the institutional control requirements associated with both the residual PBF evaporation pond (PBF-10 site), which was remediated as part of the OU 5-13 interim ROD, and the residual SL-1 burial ground (ARA-06 site), which was remediated in accordance with the Record of Decision: Stationary Low-Power Reactor-1 and Boiling Water Reactor Experiment-I Burial Grounds (Operable Units 5-05 and 6-01), and 10 No Action Sites (Operable Units 5-01, 5-03, 5-04, and 5-11) (INEL 1996).
In addition, four previously identified inactive waste systems were closed during the OU 5-12 remediation activities as part of “best management” practices. These four sites were the ARA-07 site (the seepage pit east of ARA-II [ARA-720A]), the ARA-08 site (the seepage pit west of ARA-II [ARA-720B]), the ARA-13 site (the area around the ARA-III sanitary sewer distribution box and septic tank [ARA-740]), and the ARA-21 site (the ARA-IV test area septic tank and Leach Pit No. 2). Details of remedial actions for each of the remediation sites are discussed in the following subsections.
Table 8-4 provides a chronology of the major remedial action events associated with WAG 5.
8-7

Table 8-4. Chronology of Waste Area Group 5 events.
Event Date
The SPERT-I reactor operations began. 1955
The ARA-I, ARA-II, and ARA-IV facilities were constructed. 1957
The SPERT-II reactor operations began. 1958
The ARA-III facility was constructed to house the Army Gas-Cooled Reactor Experiment.
1959
The SPERT-II reactor operations began. 1960
The SL-1 reactor accident occurred. January 1961
The Army Gas-Cooled Reactor Experiment at ARA-III was deactivated. 1961
The SPERT-IV reactor operations began. 1961
The ARA-III facility was modified to support the Mobile Low-Power Reactor tests at ARA-IV.
1963
The SPERT-I reactor operations ceased. 1964
The SPERT-II reactor operations ceased, and the facility was converted for research purposes.
1964
The Army Reactor Program was phased out. 1965
Nuclear Effects Reactor operations began at ARA-III. 1967
The SPERT-III reactor operations ceased. 1968
ARA-III was modified to support other INL programs. 1969
Nuclear Effects Reactor operations ceased at ARA-III. 1970
The SPERT-IV reactor operations ceased. 1970
The PBF reactor construction was completed and operations began. 1972
The ARA-IV facility was shut down (some welding qualification work continued at the facility).
1975
The SPERT-IV reactor building D&D was completed. 1979
The SPERT-III reactor building D&D was completed. 1980
Waste Experimental Reduction Facility operations began at the former SPERT-III reactor location.
1982
The ARA-IV facility D&D was completed (explosives testing continued at the facility).
1985
The SPERT-I reactor was demolished. 1985
The PBF reactor was placed in standby mode. 1985
The SPERT-IV facility was modified, becoming the Mixed Waste Storage Facility. 1985
The ARA-II facility was shut down. 1986
The ARA-I facility was shut down. 1988
8-8

Table 8-4. (continued).
Event Date
The ARA-III facility was shut down. 1989
The PBF ROD was issued for the corrosive waste sump and evaporation pond (OU 5-13)—an interim action decision.
September 1992
The ROD was issued for the ARA-I chemical evaporation pond (OU 5-10)—a no-action decision.
December 1992
The RD/RA Work Plan (INEL 1993) was completed for the PBF-08 corrosive waste sump and PBF-10 evaporation pond (OU 5-13).
November 1993
Mobilization for the OU 5-13 remedial action occurred. November 1993
The first ESD (DOE-ID 1994a) was issued for the OU 5-13 interim action. May 1994
The second ESD (DOE-ID 1994b) was issued for the OU 5-13 interim action. December 1994
Final demobilization from the OU 5-13 remedial action occurred. January 1995
The Remedial Action Report was issued for the PBF-08 corrosive waste sump and PBF-10 evaporation pond interim action (OU 5-13) (Parsons 1995).
March 1995
The RI/FS Report was issued for SL-1 (OU 5-05) and the BORAX-I (OU 6-01) burial grounds (INEL 1995).
March 1995
The ROD for SL-1 burial ground (OU 5-05), the BORAX-I burial ground (OU 6-01), and 10 no-action sites within WAG 5 (OUs 5-01, 5-03, 5-04, and 5-11) was issued (INEL 1996).
January 1996
Mobilization for the OU 5-05 remedial action occurred. July 1996
Final demobilization from the OU 5-05 remedial action occurred. April 1997
The Remedial Action Report for the SL-1 burial ground (OU 5-05) and BORAX-I (OU 6-01) burial ground remedial actions was completed (DOE-ID 1997).
October 1997
The ARA-II facility D&D was completed. 1997
The WAG 5, OU 5-12 Comprehensive RI/FS was issued (DOE-ID 1999). January 1999
The ARA-III facility D&D was completed. 1999
The comprehensive ROD for PBF and ARA (OU 5-12) was completed (DOE-ID 2000a).
January 2000
Mobilization for the OU 5-12 remedial action, Phase I, occurred. June 2000
Incinerator operations at the Waste Experimental Reduction Facility were shut down.
September 2000
The ARA-I facility D&D was completed. 2000
Revision 1 of the RD/RA Work Plan for Phase I of the WAG 5 comprehensive remedial action (OU 5-12) was completed (DOE-ID 2001).
June 2001
The EPA completed the initial five-year remedial action review of the SL-1 and BORAX-I burial grounds (OU 5-05 and OU 6-01).
August 2001
Final demobilization from the OU 5-12 remedial action, Phase I, occurred. November 2001
8-9

Table 8-4. (continued).
Event Date
The Remedial Action Report for Phase I of the WAG 5 comprehensive remedial action (OU 5-12) was issued (DOE-ID 2002).
January 2002
The RD/RA Work Plan for Phase II of the WAG 5 comprehensive remedial action (OU 5-12) was issued (DOE-ID 2003).
April 2003
Mobilization for the OU 5-12 remedial action, Phase II, occurred. October 2003
The Waste Experimental Reduction Facility was closed. 2003
The mission of the Waste Experimental Reduction Facility was converted to the Large-Scale Development Facility.
2004
The Mixed Waste Storage Facility was closed, and its mission was converted to the Contraband Detection Facility.
2004
The mission of the Waste Engineering Development Facility was converted to the Special Programs Facility.
2004
Remedial action activities and post-remediation sampling activities were completed for Phase II of the WAG 5 comprehensive remedial action (OU 5-12).
September 2004
ARA = Auxiliary Reactor Area BORAX = Boiling Water Reactor Experiment D&D = decontamination and decommissioning DOE-ID = U.S. Department of Energy Idaho Operations Office EPA = U.S. Environmental Protection Agency ESD = Explanation of Significant Differences INEL = Idaho National Engineering Laboratory INL = Idaho National Laboratory OU = operable unit PBF = Power Burst Facility RD/RA = remedial design/remedial action RI/FS = remedial investigation/feasibility study ROD = Record of Decision SL-1 = Stationary Low Power Reactor No. 1 SPERT = Special Power Excursion Reactor Test WAG = waste area group
8.1 Remedial Actions
As previously stated, four RODs have been prepared for contaminated sites within WAG 5. Based on these RODs, remedial actions have been identified for 10 individual sites, and no further actions have been identified for nine additional sites. Details of the WAG 5 remedial actions are described in the following subsections.
8.1.1 Remedy Selection
Remedies were selected for the WAG 5 sites identified as posing unacceptable risk through the CERCLA remedy selection process described in the Power Burst Facility Record of Decision: Power Burst Facility Corrosive Waste Sump and Evaporation Pond, Operable Unit 5-13, Waste Area Group 5 (DOE-ID 1992a), the Record of Decision: Stationary Low-Power Reactor-1 and Boiling Water Reactor Experiment-I Burial Grounds (Operable Units 5-05 and 6-01), and 10 No Action Sites (Operable Units 5-01, 5-03, 5-04, and 5-11) (INEL 1996), and the Record of Decision Power Burst Facility and
8-10

Auxiliary Reactor Area, Operable Unit 5-12 (DOE-ID 2000a). The following subsections briefly describe the selected WAG 5 remedial actions.
8.1.1.1 Corrosive Waste Sump (PBF-08 Site) and Evaporation Pond (PBF-10 Site). The selected remedial actions at the PBF corrosive waste sump and evaporation pond consisted of removing high contaminant concentrations in the evaporation pond, stabilizing contaminated material from the pond by grouting, disposing of waste, removing sludge and sediment in the corrosive waste sump, treating materials and sediment removed from the sump by grouting if feasible, and disposing of materials.
8.1.1.2 Sanitary Waste System (ARA-02 Site). The selected remedy for the sanitary waste system was removal, ex situ thermal treatment, and disposal. The activities required to implement the selected remediation alternative for this site included the following:
• Excavation and removal of the sludge and all components of the septic system
• Shipping of structural components of the system to an acceptable facility for disposal
• Thermal treatment of the sludge at an approved facility with appropriate disposal of the treated residual
• Additional sampling of the soil to be excavated, the sludge in the seepage pit, and the septic tanks, piping, and pumice blocks
• Dust control and environmental monitoring during active remediation.
8.1.1.3 ARA-II SL-1 Burial Ground (ARA-06 Site). The selected remedial action for the SL-1 burial ground included containment by capping with an engineered barrier of native materials, contouring and grading of the surrounding terrain, periodic aboveground radiological surveys, periodic inspection and maintenance, and implementation and maintenance of institutional controls. The major components of the selected remedy included the following:
• Containment by capping with an engineered barrier constructed primarily of native materials
• Contouring and grading of surrounding terrain to direct surface water run-off away from the cap
• Periodic aboveground radiological surveys after completion of the cap to assess the effectiveness of the remedial action
• Periodic inspection and maintenance after completion of the cap to ensure cap integrity and surface drainage away from the barrier
• Access restrictions consisting of fencing, posted signs, and permanent markers
• Restrictions limiting land use to industrial applications for at least 100 years following completion of the cap
• Review of the remedy no less than every 5 years until determined by the agencies to be unnecessary.
8-11
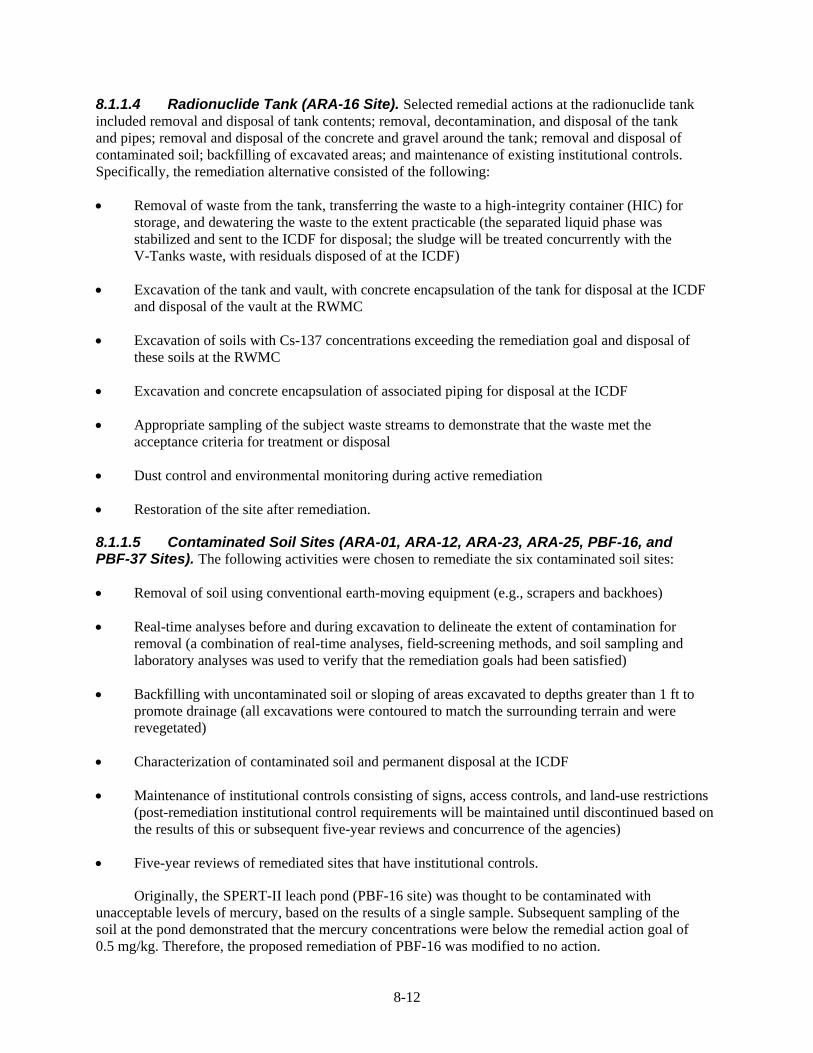
8.1.1.4 Radionuclide Tank (ARA-16 Site). Selected remedial actions at the radionuclide tank included removal and disposal of tank contents; removal, decontamination, and disposal of the tank and pipes; removal and disposal of the concrete and gravel around the tank; removal and disposal of contaminated soil; backfilling of excavated areas; and maintenance of existing institutional controls. Specifically, the remediation alternative consisted of the following:
• Removal of waste from the tank, transferring the waste to a high-integrity container (HIC) for storage, and dewatering the waste to the extent practicable (the separated liquid phase was stabilized and sent to the ICDF for disposal; the sludge will be treated concurrently with the V-Tanks waste, with residuals disposed of at the ICDF)
• Excavation of the tank and vault, with concrete encapsulation of the tank for disposal at the ICDF and disposal of the vault at the RWMC
• Excavation of soils with Cs-137 concentrations exceeding the remediation goal and disposal of these soils at the RWMC
• Excavation and concrete encapsulation of associated piping for disposal at the ICDF
• Appropriate sampling of the subject waste streams to demonstrate that the waste met the acceptance criteria for treatment or disposal
• Dust control and environmental monitoring during active remediation
• Restoration of the site after remediation.
8.1.1.5 Contaminated Soil Sites (ARA-01, ARA-12, ARA-23, ARA-25, PBF-16, and PBF-37 Sites). The following activities were chosen to remediate the six contaminated soil sites:
• Removal of soil using conventional earth-moving equipment (e.g., scrapers and backhoes)
• Real-time analyses before and during excavation to delineate the extent of contamination for removal (a combination of real-time analyses, field-screening methods, and soil sampling and laboratory analyses was used to verify that the remediation goals had been satisfied)
• Backfilling with uncontaminated soil or sloping of areas excavated to depths greater than 1 ft to promote drainage (all excavations were contoured to match the surrounding terrain and were revegetated)
• Characterization of contaminated soil and permanent disposal at the ICDF
• Maintenance of institutional controls consisting of signs, access controls, and land-use restrictions (post-remediation institutional control requirements will be maintained until discontinued based on the results of this or subsequent five-year reviews and concurrence of the agencies)
• Five-year reviews of remediated sites that have institutional controls.
Originally, the SPERT-II leach pond (PBF-16 site) was thought to be contaminated with unacceptable levels of mercury, based on the results of a single sample. Subsequent sampling of the soil at the pond demonstrated that the mercury concentrations were below the remedial action goal of 0.5 mg/kg. Therefore, the proposed remediation of PBF-16 was modified to no action.
8-12

8.1.1.6 Institutional Control Sites. As a result of the PBF and ARA ROD (DOE-ID 2000a) and the OU 5-12 remedial actions, a total of 13 sites have been identified as requiring institutional controls within WAG 5. Figure 8-3 shows the locations of the ARA institutional control sites, and Figure 8-4 shows the locations of institutional control sites at PBF. Brief descriptions of the institutional controls for each of these 13 sites are provided below.
PBF Reactor Area Evaporation Pond (PBF-733) (PBF-10 Site)—Restrict the site to all but industrial land use until the restriction is discontinued based on the results of a five-year review.
PBF SPERT-I Leach Pond (PBF-12 Site)—Restrict the site to all but industrial land use until the restriction is discontinued based on the results of a five-year review.
PBF Reactor 4 Area Rubble Pit (PBF-13 Site)—Control land use to prohibit potential exposure to friable asbestos. Augment the existing institutional controls with signs and maintenance of the existing cover. Periodic inspections also will be defined in the WAG 5 institutional controls plan (DOE-ID 2000b). Institutional controls will be maintained until discontinued based on the results of a five-year review. Recommendations for appropriate land-use restrictions will accompany any land transfer.
PBF SPERT-III Large Leach Pond (PBF-21 Site)—Restrict the site to all but industrial land use until the restriction is discontinued based on the results of a five-year review.
PBF SPERT-IV Leach Pond (PBF-758) (PBF-22 Site)—Restrict the site to all but industrial land use until the restriction is discontinued based on the results of a five-year review.
PBF SPERT-IV Lake (PBF-26 Site)—Restrict the site to all but industrial land use until the restriction is discontinued based on the results of a five-year review.
ARA-I Lead Sheeting Pad near ARA-627 (ARA-03 Site)—Restrict the site to all but industrial land use until the restriction is discontinued based on the results of a five-year review.
ARA-II Stationary Low-Power Reactor No. 1 Burial Ground (ARA-06 Site)—Maintain land-use controls to inhibit intrusion into the buried waste. Surface contamination will be addressed by the remediation of the ARA-23 site. Institutional controls will be maintained until discontinued based on the results of a five-year review. Recommendations for appropriate land-use restrictions will accompany any land transfer.
ARA-II Seepage Pit to the East (ARA-720A) (ARA-07 Site)—Restrict the site to industrial land use until the restriction is discontinued based on the results of a five-year review.
ARA-II Seepage Pit to the West (ARA-720B) (ARA-08 Site)—Restrict the site to all but industrial land use until the restriction is discontinued based on the results of a five-year review.
ARA-II Radiologically Contaminated Surface Soils around ARA-I and ARA-II (ARA-23 Site)—Restrict the site to all but industrial land use until remediation is implemented as prescribed in the ROD. Land-use controls will not be required after remediation if all contaminated soil is removed to basalt or contaminant concentrations are comparable to local background values. Otherwise, institutional controls will be maintained until discontinued based on the results of a five-year review.
8-13

Auxiliary Reactor Area Institutional Control Sites
ARA-24
ARA-12
Project: WAG5 IC Site Map Requestor: Rich Wells GIS Analyst: Julie Brizzee Date Drawn: 7/16/03 Path: /projects/ara/cercla_sites Filename: ara_cercla_sites-bp.mxd
ARA-08
0
ARA-23
ARA-07 ARA-16
ARA-03
ARA-02
ARA-01
ARA-25
ARA-06
´ 0.25
Legend Roads and Buildings
Fences
Rad Fence
Institutional Control Sites
0.5 Miles
Figure 8-3. Auxiliary Reactor Area institutional control sites.
8-14

Power Burst Facility Institutional Control Sites
´
Legend Roads and Buildings
Fences
Rad Fence
Institutional Control Sites
0 0.5 0.25 Miles
PBF-13
PBF-12
Project: WAG5 IC Site Map Requestor: Rich Wells GIS Analyst: Julie Brizzee Date Drawn: 7/16/03 Path: /projects/pbf/cercla_sites Filename: ara_cercla_sites-bp.mxd
PBF-10
PBF-21
PBF-22
PBF-26
Figure 8-4. Power Burst Facility institutional control sites.
8-15

ARA-III Windblown Soil (ARA-24 Site)—Land use will be restricted to prohibit potential exposure to radiologically contaminated material. Institutional controls will be maintained until discontinued based on the results of a five-year review. Recommendations for appropriate land-use restrictions will accompany any land transfer.
ARA-I Soils beneath the ARA-626 Hot Cells (ARA-25 Site)—Restrict the site to all but industrial land use until remediation is implemented as prescribed in the ROD. Land-use controls will not be required after remediation if all contaminated soil is removed to basalt or contaminant concentrations are comparable to local background values. Otherwise, institutional controls will be maintained until discontinued based on the results of a five-year review.
Before remedial action activities, a total of 15 institutional control sites had been identified. The initially identified sites included ARA-01, ARA-02, ARA-12, and ARA-16, but did not include ARA-07 and ARA-08. The reason for eliminating ARA-01, ARA-02, ARA-12, and ARA-16 from institutional controls was that remediation of the sites reduced contamination below levels required for free release.
The institutional control sites that were added (ARA-07 and ARA-08) came about as part of additional remedial actions aimed at closing certain sites as part of best management practices. A total of four of theses sites were identified during Phase I remediation activities. These sites included ARA-07 and ARA-08 as well as ARA-13 and ARA-21. After remediation of each of these sites, their residual surfaces were evaluated to ascertain which of the sites needed institutional controls. Based on the review, ARA-07 and ARA-08 were identified as requiring institutional controls.
Table 8-5 provides a current list of the institutionally controlled sites at WAG 5, identifies the COCs and the concentration for each, the release criteria, and the expected release date.
Table 8-5. Waste Area Group 5 institutionally controlled sites.
Site COC Concentration Analysis Date Release Criteria Release Date
ARA-03 Cs-137 5.00 pCi/g September 27, 1994 2.4 pCi/g January 2036 (95% Student’s t UCL)
ARA-06 Cs-137 22,900 pCi/g (maximum) July 1994 2.4 pCi/g July 2394 Sr-90 21,500 pCi/g (maximum) 2,100 pCi/g
ARA-07 Cs-137 17.6 pCi/g (maximum) June 1991 2.4 pCi/g June 2078
ARA-08 Cs-137 11.6 pCi/g (maximum) June 1991 2.4 pCi/g December 2059
ARA-23 Cs-137 83.8 pCi/ga (95% UCL) September 2004 2.4 pCi/g November 2158
ARA-24 Cs-137 <5 pCi/g (maximum) September 1997 2.4 pCi/g August 2029
ARA-25 Cs-137 398 pCi/g (maximum) September 2001 2.4 pCi/g Indefinite Ra-226 26.3 pCi/g (maximum) 0.52 pCi/g Arsenic 36.0 mg/kg (maximum) 5.8 mg/kg Lead 1,266 mg/kg (maximum) 400 mg/kg Copper 201 mg/kg (maximum) 220 mg/kg
PBF-10 Cs-137 15.8 pCi/g August 18, 1994 2.4 pCi/g August 2076 (95% Student’s t UCL)
PBF-12 Cs-137 16.37 pCi/g December 1984 2.4 pCi/g August 2068 (95% approximate gamma UCL)
PBF-13 Asbestos NA NA NA Indefinite
8-16

Table 8-5. (continued).
Site COC Concentration Analysis Date Release Criteria Release Date
PBF-21 Cs-137 18.4 pCi/g December 1982 2.4 pCi/g September (99% Chebyshev UCL) 2071
PBF-22 Cs-137 4.42 pCi/g December 1988 2.4 pCi/g August 2015 (99% Chebyshev UCL)
PBF-26 Cs-137 4.67 pCi/g December 1985 2.4 pCi/g August 2012 (95% Student’s t UCL)
a. This concentration represents the maximum 95% UCL for one of five zones defined for ARA-23. The 95% UCL concentrations for the other four zones range from 9.5 to 22.3 pCi/g.
ARA = Auxiliary Reactor Area COC = contaminant of concern NA = not applicable PBF = Power Burst Facility UCL = upper confidence limit
8.1.2 Remedial Action Objectives
The RAOs for the WAG 5 sites were developed in accordance with 40 CFR 300, “National Oil and Hazardous Substances Pollution Contingency Plan,” and EPA guidance. The RAOs result from risk assessments and are specific to the COCs and exposure pathways developed in the RODs for OUs 5-05, 5-13, and 5-12.
The RAOs for the corrosive waste sump and the evaporation pond at PBF are established in the OU 5-13 ROD (DOE-ID 1992a), and RAOs for the SL-1 burial ground site were established in the OU 5-05 ROD (INEL 1996). The RAOs for the sanitary waste system, the radionuclide tank, and the contaminated soil sites are presented in the ROD for OU 5-12 (DOE-ID 2000a). Detailed RAOs for each of the sites are presented in the following subsections.
8.1.2.1 Corrosive Waste Sump (PBF-08 Site) and Evaporation Pond (PBF-10 Site). Cleanup goals for the PBF waste sump and evaporation pond sediments were developed based on a site-specific, residential-use scenario for a population that begins residing at the site in 100 years. This scenario results in the calculation of a conservative cleanup level protective of current occupational and future residential populations at PBF. The cleanup goal for chromium was 800 mg/kg. This level was established using equations from the Risk Assessment Guidance for Superfund, Volume I, Human Health Evaluation Manual (Part A) (EPA 1989) and site-specific exposure parameters for the residential use scenario. As established in the OU 5-13 ROD (DOE-ID 1992a), the cleanup goal for Cs-137 in 1992 was 30 pCi/g and corresponded to a future excess cancer risk (100 years in the future) of 5 × 10⁻⁵. Both cleanup levels were calculated using EPA-approved methods.
8.1.2.2 Sanitary Waste System (ARA-02 Site). The RAOs for the sanitary waste system applied only to the ARA-02 seepage pit sludge, because all of the COCs at the site were contained within the sludge. As a result, the RAOs developed to protect human health included the following:
• Inhibit direct exposure to radionuclide COCs that would result in a total excess cancer risk greater than or equal to 1 in 10,000 for current and future workers and future residents
• Inhibit dermal absorption of COCs that would result in a total excess cancer risk greater than or equal to 1 in 10,000 or a hazard index of 2 or greater for current and future workers and future residents.
8-17

8.1.2.3 ARA-II SL-1 Burial Ground (ARA-06 Site). Results of the remedial investigation and baseline risk assessment indicated that exposure to penetrating radiation from contaminated soils and material within the burial ground presented the most significant future risk to human health. Therefore, the primary RAOs and the focus of the remedial action alternative development were to inhibit exposure to radioactive materials. The RAOs established to protect human health included the following:
• Inhibit exposure to radioactive materials that would result in a total excess cancer risk (for all contaminants) of greater than 1 in 10,000 to 1 in 1,000,000 (1E-04 to 1E-06)
• Inhibit ingestion of radioactive materials that would result in a total excess cancer risk (for all contaminants) of greater than 1 in 10,000 to 1 in 1,000,000 (1E-04 to 1E-06)
• Inhibit inhalation of suspended radioactive materials that would result in a total excess cancer risk (for all contaminants) of greater than 1 in 10,000 to 1 in 1,000,000 (1E-04 to 1E-06)
• Inhibit degradation of the burial grounds that could result in exposure of buried waste or migration of contaminants to the surface that would pose a total excess cancer risk (for all contaminants) of greater than 1 in 10,000 to 1 in 1,000,000 (1E-04 to 1E-06).
The RAO for protection of the environment focuses on preservation of the local ecology by inhibiting the potential for contaminant migration. The RAO established for protection of the environment is to inhibit adverse effects to resident species from exposure to contaminants at the burial ground.
As a result of these risks, a containment strategy was selected as the most appropriate remedy for the SL-1 burial ground.
8.1.2.4 Radionuclide Tank (ARA-16). Remediation objectives, based on the risks discussed in the OU 5-12 ROD (DOE-ID 2000a), were developed for the soil at the ARA-16 radionuclide tank. A risk of 1E-04 was posed to human health primarily by external exposure to ionizing radiation from Cs-137. In addition, remediation was applied to address the principal threat waste contained in the tank.
Because a release to the environment had not occurred, the contents of the radionuclide tank were not quantitatively evaluated in the remedial investigation/baseline risk assessment. Therefore, the risk assessment was limited to evaluating the soil outside of the tank. Cs-137 was the only COC identified for the ARA-16 site based on human health risks. The total estimated risk for the 100-year future residential scenario for the soil around the tank was 1E-04 (1 in 10,000) from Cs-137. The noncarcinogenic hazard quotient for residential exposure was less than 1. The total estimated risk for all pathways for the current occupational scenario was 3E-04 with a hazard index for the current occupational exposure of less than 1. The total estimated risk for all pathways for the 100-year occupational scenario was 1E-04 (1 in 10,000) with the primary contributor being Cs-137. The noncarcinogenic hazard index for the future occupational exposure was less than 1.
The human health threat posed by the radioactively contaminated soil and gravel in and around the ARA-16 tank vault is external exposure to ionizing radiation. No unacceptable ecological risk was associated with this site. The RAO developed for the soil and gravel was to inhibit direct exposure to radionuclide COCs that would result in a total excess cancer risk greater than or equal to 1 in 10,000 for current and future workers and for future residents. To meet this goal, a remediation goal of 23 pCi/g for Cs-137 was established. In addition, remediation was applied to address the principal threat waste contained in the tank.
8-18

Though no releases occurred from the ARA-16 tank and the tank was not leaking, the tank contents were identified as principal threat waste and could have posed an unacceptable risk if released to the environment. Therefore, an additional RAO was developed to prevent release of the tank contents and preclude human and ecological exposures to the ARA-16 tank contents.
8.1.2.5 Contaminated Soil Sites (ARA-01, ARA-12, ARA-23, ARA-25, and PBF-37 Sites). A human health risk of 1E-04 at the contaminated soil sites was posed primarily by external exposure to ionizing radiation. The radioactive COCs were Ag-108m, Cs-137, and Ra-226. Dermal adsorption of arsenic and ingestion of Ra-226, arsenic, and lead posed secondary human health risks. Ecological hazard quotients greater than 10 were from exposure to selenium, thallium, copper, mercury, and lead in the soil.
The following RAOs were developed for the contaminated soil sites to protect human health and the environment:
• Inhibit direct exposure to radionuclide COCs that would result in a total excess cancer risk greater than or equal to 1 in 10,000 for current and future workers and future residents
• Inhibit dermal adsorption of COCs that would result in a total excess cancer risk greater than or equal to 1 in 10,000 or a hazard index of 2 or greater for current and future workers and future residents
• Inhibit ecological receptor exposures to contaminated soil with concentrations of contaminants greater than or equal to 10 times background values and that result in a hazard quotient greater than or equal to 10.
Remediation goals were established to meet these RAOs. Remediation goals can be satisfied by either cleaning up to the identified contaminant concentration or by removing all soil down to the basalt interface. Removing soil down to basalt will be protective, because surface exposure pathways will be eliminated. The Waste Area Group 5 Operable Unit 5-12 Comprehensive Remedial Investigation/Feasibility Study (DOE-ID 1999) showed that groundwater exposure pathways pose a cumulative risk of less than 1E-04 and a hazard index of less than 1 for the baseline no-action alternative. Removal of contaminated soil further reduces the potential groundwater risk. Therefore, remediation to retrieve residual contamination that might have migrated into the fractured basalt would not be justified.
8.1.3 Remedy Implementation
8.1.3.1 Corrosive Waste Sump (PBF-08 Site) and Evaporation Pond (PBF-10 Site). The OU 5-13 interim action was performed in two phases. The first phase consisted of excavation of the evaporation pond sediments, removal and replacement of the corrosive waste sump discharge pipe, and initial remediation activities for the sump. The second phase consisted of the final sump remediation activities. Details of the remediation are documented in the Final Remedial Action Report: Power Burst Facility (PBF)-08 Corrosive Waste Sump and PBF-10 Evaporation Pond Interim Action, Operable Unit 5-13 (Parsons 1995).
Major components of the interim remedial action were as follows:
• Installation of engineering barriers to control dust migration
• Installation of a modular tank to receive discharges that could have occurred during the interim action due to an emergency situation and to be used for future discharges in lieu of the evaporation pond
8-19

• Excavation and placement (in low-level waste containers) of residual sludge and sediments from the corrosive waste sump to eliminate future contamination to the tank during discharge events, which was followed by decontamination of the sump interior
• Removal and placement (in low-level waste containers) of the discharge pipe from the corrosive waste sump to the evaporation pond
• Installation of new discharge piping from the corrosive waste sump to the modular tank
• Excavation and placement (in low-level waste containers) of 170 yd3 of sediments from the evaporation pond using shovels and a skid-steer, front-end loader to remove from the evaporation pond contaminated sediments with chromium concentrations greater than 800 mg/kg and/or Cs-137 concentrations greater than 30 pCi/g
• Verification sampling beneath the existing liner to ensure that remaining concentrations of chromium and Cs-137 were below the cleanup levels
• Transport of filled low-level waste containers to the RWMC for disposal.
The OU 5-13 interim remedial action was initiated in 1993 and completed in 1994. During interim actions, changes made to the proposed remedial action were sufficient to require two ESDs. The first ESD (DOE-ID 1994a), issued in May 1994, increased the estimated amount of evaporation pond sediments requiring excavation from 100 yd3 to 170 yd3 while containing the sludge and sediments instead of stabilizing them, because the ungrouted sediments were found to meet the waste acceptance criteria for disposal at the RWMC. The second ESD (DOE-ID 1994b), issued in December 1994, found that the waste in the corrosive waste sump was characteristically toxic for chromium and would have to be stabilized in a more leach-resistant manner than previously estimated, increasing costs by more than 50%.
Initial remediation activities involved flushing the interior walls of the sump. First, a high-pressure sprayer was used to flush the walls of the sump and increase liquid volume, and then sump pumps were used to pump the residual liquid and sprayer rinsate to the evaporation pond. The initial flush pumped all of the sump water to the evaporation pond without suspending the sludge and sediment at the bottom of the sump. After flushing, the sump discharge line was removed, cut into 1-ft sections, and disposed of at the CFA bulky waste landfill (since no radioactive contamination was detected). New underground piping was then installed from the large modular tank to the sump. The modular tank used was 63 ft in diameter, and 5.5 ft high, with a capacity of 124,000 gal. The cylindrical tank was fabricated with metal sidewalls, two interior Hypalon liners, and a drainage monitoring system between the liners.
The subsequent step in the OU 5-13 remediation was to excavate the evaporation pond sediments. The evaporation pond was divided into 49 grids, each having approximate dimensions of 20 × 20 ft. Each grid was surveyed to ascertain those that needed to be excavated. Based on that survey, 21 of the 49 grids were marked for excavation. Laborers then used square-pointed shovels (initially) and a skid loader to excavate the contaminated soils from each of the 21 grids. Water sprays were used to prevent fugitive dust generation during excavation.
After evaporation pond excavation, remediation activities returned to the corrosive sump pump. The residual sludge and sediment from the bottom of the sump were removed using slurry pumps and a mobile filter press. The diatomaceous earth served as the pre-coat material for the filter plates. Squeegees were used to force the sludge particles to the slurry pump because of an inability to suspend the sludge using air sparging equipment. The conveyed sludge was then pumped to the filter press, where the sludge was retained on the filter plates while the effluent was circulated back into the sump. After filling the
8-20

filter plates with sludge, the sludge was dewatered, and the dry filter cake was scraped off and placed in interim storage at PBF. A high-pressure wash was used to remove surface contamination from the interior of the sump. The rinse water was processed through the filter press and then discharged in the modular evaporation tank.
After sludge removal, a TCLP analysis of the dewatered sludge found that it was characteristically toxic for trivalent chromium. The sludge was removed from storage at PBF, repackaged, and transported to the Mixed Waste Storage Facility, where the sludge was managed in accordance with the requirements of that facility’s RCRA Part A permit.
8.1.3.2 Contaminated Soil beneath PER-751 Pump House Floor Slab and Foundation (PBF-37 Site). Site preparation for PBF-37 included establishing work control areas and controlled access points. Before sampling the soil, workers removed the soil cover that had been put in place after demolition and removal of the PER-751 tank and pump house. A front-end loader was used to scrape the soil cover into a pile. This facilitated sampling of the contaminated area. Before actual soil removal, the underlying tarps were removed. A backhoe was staged at the task site for removal of the contaminated soil. Soft-sided sacks were obtained to use as containers for the soil that was removed.
The extent of the site remediation was based on the original radiological survey of the posted soil contamination area. The controlled area measured roughly 20 ft wide and 40 ft long. A more defined area for purposes of soil removal was based on an in situ gamma survey that was conducted after soil samples were collected and by using hand-held survey instruments. In accordance with this survey, an 8- × 8-ft area found to have the highest level of contamination (based on the in situ gamma survey) was delineated in the southwestern quadrant of the site. To ensure optimum contamination removal, this area was excavated to a depth of 2 ft using a backhoe. Soil in the remaining contaminated soil area was excavated to a depth of 1 ft. A large concrete pier that supported the south tank saddle was encountered during excavation.
Excavated soil was placed in 12 soft-sided bags. These bags were loaded onto trailers and transferred to a registered CERCLA storage area located at the PBF Control Area. The storage area will be inspected weekly by a Waste Generator Services facility representative.
8.1.3.3 ARA-I Chemical Evaporation Pond (ARA-01 Site). The chemical evaporation pond is a shallow, unlined surface impoundment roughly 100 × 300 ft that was used to dispose of laboratory wastewater from the ARA-I Shop and Maintenance Building (ARA-627). Located southeast of ARA-I, the pond was constructed in 1970 by excavating soil to create a shallow topographic depression. Basalt outcrops are present within and immediately adjacent to the pond. The subsurface immediately beneath the pond consists of fracture and rubble zones. No interbed was found within the first 118 ft of the surface.
Contaminated soil was excavated from the pond in accordance with the requirements delineated in the Record of Decision Power Burst Facility and Auxiliary Reactor Area, Operable Unit 5-12 (DOE-ID 2000a). This was followed by in situ field-screening measurements and confirmation sample analysis of the residual soil surface.
8.1.3.4 ARA-I Sanitary Waste System (ARA-02 Site). The septic system serviced the ARA-I facility from 1960 until 1988. The ARA-02 site was defined as the entire septic system, including the three tanks (one septic tank, one settling tank, and one chlorine contact tank), a seepage pit, three manholes, and all associated piping leading from source buildings (both 4- and 8-in. diameter) as well as any contiguous soil contaminated from system materials. The septic system serviced ARA-I
8-21

Buildings 626, 627, and 628 and Office Trailers 1 and 2 outside of the ARA-I facility fence. The vertical extent of the site was defined by the depth to the soil/basalt interface.
At the ARA-02 site, the entire septic system was removed in accordance with the requirements of the Record of Decision Power Burst Facility and Auxiliary Reactor Area, Operable Unit 5-12 (DOE-ID 2000a). The seepage pit sludge was removed and disposed of, thus mitigating the human health risk associated with this site.
8.1.3.5 ARA-II SL-1 Burial Ground (ARA-06 Site). Remediation of the SL-1 burial ground was performed in 1996 and 1997. Details of the SL-1 burial ground remedial action are contained in the Remedial Action Report OU 5-05 Stationary Low-Power Reactor No. 1 and OU 6-01 Boiling Water Reactor Experimental-I Burial Grounds Engineered Barriers (DOE-ID 1997).
The SL-1 contaminated-soil area was initially excavated to a depth of 6 in. using two front-end loaders. This was followed by the excavation of 1,527 yd3 of contaminated soil in certain designated “hot spots.” The 2,407 yd3 of excavated contaminated soil was then transported, spread, and compacted over a 530- × 40-ft soil consolidation area between Trench 1 and Pit 2 of the SL-1 burial ground. This was followed by the addition and compaction of 9.9 yd3 of investigation-derived waste into the soil consolidation area. A 22-in.-thick biotic barrier consisting of pea gravel and cobble was then placed over the soil consolidation area, followed by a human intrusion barrier of large angular basalt boulders. This was followed by the placement of fences, gates, and four granite monuments at the SL-1 site. After construction of the cap, the area around the cap was recontoured and reseeded. Institutional controls over the SL-1 burial ground were established in the OU 5-12 ROD (DOE-ID 2000a).
8.1.3.6 Radioactive Waste Leach Pond (ARA-12 Site). The radioactive waste leach pond was an unlined surface impoundment with approximate dimensions of 150 × 370 ft. The pond was constructed in a natural depression west of ARA-III to dispose of low-level liquid waste from reactor research operations. Liquid radioactive waste was stored temporarily in tanks and then transferred to the leach pond via an underground pipe. A second separate discharge line originated at an uncontaminated water storage tank. The pond also received facility run-off through a culvert. The ARA-III facility was active from about 1959 to 1965. From 1966 to 1987, activities at ARA-III were limited to component and instrumentation testing, instrumentation development and fabrication, and chemical research. Waste associated with these activities was not disposed of in the leach pond, and the only discharges to the pond during this period were from the water storage tank and facility run-off. The facility was shut down in 1987, leaving the pond dry except during spring run-off and heavy precipitation. In 1991, the culvert was plugged in preparation for D&D operations at ARA-III. In 1993, the tanks and waste lines to the leach pond were removed. Contaminated soil from the ARA-12 site was excavated in accordance with the requirements outlined in the OU 5-12 ROD (DOE-ID 2000).
8.1.3.7 ARA-I Radionuclide Tank (ARA-16 Site). The radionuclide tank was a 1,000-gal, stainless-steel underground tank that rested on a 6-in. gravel bed inside an open-topped concrete vault. The tank was 12 ft long and approximately 4 ft in diameter. The tank was connected to the ARA-626 and ARA-627 buildings within the ARA-I facility via stainless-steel piping. The tank had been partially excavated in the past for sampling; therefore, the depth of the fill material varied from the original design.
The tank had several piping connections, along with an internal pump and a manway cover. During initial remedial action activities, the pump and all external piping were removed from the tank. Connective piping to the tank was then cut and capped to isolate the tank. After the tank was isolated, approximately 317 gal of waste was removed from the tank and placed into a 400-gal HIC. The tank was rinsed, and the rinsate was also pumped to the HIC. The HIC allowed for the separation of the sludge from the liquid phase by pumping the liquid through a filtered media. The liquid phase was passed
8-22

through a carbon filter (to remove trace organic contamination) and solidified in 55-gal lined steel drums using a sodium polyacrylate monopolymer (i.e., Stergo). The slurry left in the HIC consisted of approximately 4.5 gal of sludge and 75.5 gal of supernatant. The slurry was a Type B radioactive waste that was transuranic and listed for both 1,1,1-TCA (F001) and toluene (F005).
The HIC that contained the concentrated waste was shielded and initially placed in storage at ARA-I awaiting eventual treatment as part of the OU 1-10 V-Tank waste treatment, which was scheduled for early 2005. The HIC has subsequently been shipped to TAN, where the waste awaits treatment. Pumping the waste out of the tank was followed by removal and disposal of both the tank (along with all associated piping) and the concrete vault surrounding the tank. Both removal actions were performed in accordance with the requirements of the OU 5-12 ROD (DOE-ID 2000a). Excavation proceeded to the basalt layer in some locations.
8.1.3.8 Radiologically Contaminated Surface Soil and Subsurface Structures associated with ARA-I and ARA-II (ARA-23 Site). The ARA-23 site is a 240-acre, windblown-contamination area that includes both residual subsurface structures from ARA-I and ARA-II and the areas surrounding ARA-I and ARA-II. Of the 240 acres, 42 acres exceeded risk-based concentrations and required remediation. The site also contained subsurface structures remaining after D&D activities within ARA-I and ARA-II. The radioactive contamination in the windblown soil was primarily due to contamination released from the 1961 SL-1 accident and its subsequent cleanup. However, minor amounts of contamination might have been added by other ARA operations. Over time, winds dispersed the contamination over an area of roughly 240 acres, but most of this windblown contamination is significantly less than risk-based remediation goals. The long axis of the roughly oval-shaped site is consistent with the generally southwest-to-northeast winds common at the INL Site.
The contaminated soil was removed from the ARA-23 site in accordance with the requirements delineated in the OU 5-12 ROD (DOE-ID 2000a). Soil contaminated with Cs-137 was removed and disposed of in a manner that mitigated the human health risk associated with this site. Excavation activities in 2003 were concentrated in the soil-contamination area next to Fillmore Boulevard at ARA-I and the area between the fence outside of the ARA-II facility and the windblown area. In 2004, excavation consisted of the windblown contamination area, the contaminated soil area near the haul road, the area near the SL-1 burial ground, the turnaround area, areas on top of the SL-1 burial ground, the area north of ARA-II, the washdown area across Fillmore Boulevard, and the bermed area next to ARA-I. In general, excavation was done using 1- to 6-in. excavation cuts over the entire contaminated soil area, followed by spot excavations in the more contaminated soil areas. In addition, the fence surrounding the ARA-II facility was removed and disposed of at the ICDF in 2004.
8.1.3.9 ARA-I Soil beneath the ARA-626 Hot Cells (ARA-25 Site). The ARA-25 site comprised contaminated soil that was discovered beneath the ARA-626 hot cells during D&D activities at the ARA-I facility in 1998. The contamination was found near the hot cell floor drains. The contaminated area immediately around the drains measured approximately 8 × 12 ft. However, other isolated hot spots beneath the building also were discovered. Therefore, a cumulative size of 16 × 24 ft was estimated for the site. The ARA-I hot cells were constructed in 1959 and used until the facility was shut down in 1988. Stainless-steel piping connected the floor drains to the ARA-729 radionuclide tank (ARA-16 site). The pipes were included in the remediation of the ARA-16 site and were not a component of the ARA-25 site.
The contaminated soils at the ARA-25 site were removed in accordance with the requirements of the OU 5-12 ROD (DOE-ID 2000a). The hot cell foundation was initially removed to allow for excavation of the underlying and immediately surrounding soil. The contaminated soil area was then removed to the basalt sublayer.
8-23

8.1.3.10 Inactive Waste System Sites. As previously stated, four inactive waste system sites (ARA-07, ARA-08, ARA-13, and ARA-21) were removed or abandoned in accordance with established regulatory standards. The following subsections discuss the actions taken at each of those four sites.
ARA-II Seepage Pit to the East (ARA-720A) (ARA-07 Site)—The ARA-07 site was one of the no-action sites closed as part of Phase I cleanup activities during remediation of OU 5-12. The pit was constructed of 8- × 8- × 16-in. pumice blocks laid on their sides in the shape of a circle. The seepage pit had a diameter of 13 ft and a depth of 10 ft. The top two courses of pumice blocks were set in mortar. As-Built Drawing No. 102832 shows the first course of blocks set on bedrock and leveled with concrete. The pit had a gravel base and contained approximately 6 to 12 in. of sludge. The top of the pit extended above the ground and was covered by a wooden roof with lifting rings and a 2- × 2-ft square access port. A 4-ft-high, chain-link fence surrounded the entire structure.
The seepage pit was just outside of the ARA-II facility fence and was the terminus of two septic tanks serving the Administration Building (Building 613) and the Technical Support Building (Building 602). The seepage pit was also thought to be the terminating point for an underground waste detention tank (ARA-719), which was removed during D&D activities (INEEL 1999). The system was used from approximately 1959 to 1986. To close the pit, the roof structure and top two courses of cement blocks were removed and disposed of. The seepage pit was then filled with earthen material and abandoned.
ARA-II Seepage Pit to the West (ARA-720B) (ARA-08 Site)—The ARA-08 site was another no-action site that was closed as part of Phase I cleanup activities during remediation of OU 5-12. The seepage pit was inactive and had a diameter of 13 ft and a depth of 10 ft. The pit was constructed using the same pumice blocks and layout as was used at the ARA-07 site. The pit contained approximately 18 to 24 in. of sludge. Three separate concrete slabs measuring approximately 3 × 10 ft capped the pit. The concrete slabs were covered by approximately 3 ft of soil.
The seepage pit was just outside the ARA-II facility fence and received waste from the Administrative and Technical Support Building (Building 606). The system was used from approximately 1959 to 1986. To close the site, the concrete slab covering the pit was removed and disposed of. The pit was then filled with earthen material and abandoned.
ARA-III Sanitary Sewer Leach Field (ARA-740) (ARA-13 Site)—The ARA-13 site was the third no-action site that was closed as part of Phase I cleanup activities during remediation of OU 5-12. The ARA-13 site consisted of a manhole, a septic tank system, a distribution box, and a leach field. Sanitary waste was disposed of in the system from 1969 to 1980. In addition to sanitary waste, small quantities of laboratory waste were diverted to this system between 1980 and 1983.
As part of best management practices, an estimated 2,300 gal of liquid was pumped out of the septic tank system and disposed of in the CFA sanitary sewer system. The septic tank and distribution box were then excavated to allow access to the sludge in the bottoms of the components. Upon excavation, the septic tank system was found to be three separate tanks in series. The top half of each tank was removed, and dry cement and Aquaset were mixed into the residual sludge in each tank to remove free liquids. The sludge from the septic tanks was then removed, placed into soft-sided containers, and disposed of at the RWMC. Sludge from the distribution box was removed, mixed with dry cement (to solidify free liquids), and disposed of at Envirocare. The tops of each septic tank were surveyed, found to be free of radioactive contamination, and shipped to the CFA landfill for disposal. The ARA-13 system components remaining in the ground were then decontaminated, visually inspected, and surveyed for radiological contamination. No radiological contamination was detected. Holes were then made in the bottom of each component, and each component and the excavation were filled with earthen material before being disposed of.
8-24

ARA-IV Septic Tank and Seepage Pit #2 (ARA-21 Site)—The ARA-21 site was the fourth no-action site that was closed as part of Phase I cleanup activities during remediation of OU 5-12. The ARA-21 site consisted of a 1,000-gal underground septic tank, an estimated 250- to 500-gal chlorine contact tank, and a seepage pit that received sanitary waste from the ARA-IV Test Area Building (ARA-616). The system was used from approximately 1957 to 1970. During D&D operations in 1987, the piping was cut 10 ft from the building, and the tanks and leach pit were covered with 6 ft of soil. For purposes of best-management practices, the liquid waste was removed from the septic tanks and disposed of at the CFA sanitary sewer system.
8.2 Data Evaluation
This data evaluation section includes a summary of annual site inspections, compilation and evaluation of data collected during soil excavation activities, and compilation and examination of groundwater data collected during the 5 years covered by this review.
8.2.1 Site Inspections
Annual site inspections included visual inspection of the engineered rip-rap and a radiological survey around the perimeter of the ARA-II SL-1 burial ground (ARA-06 site) to determine the extent, if any, of contaminant migration.
Visual site inspections showed that the riprap cover is functioning as designed and showed no signs of subsidence of animal intrusion. In addition, the results from the annual radiological surveys indicate that the remedy is functioning as intended, and no unexplained radiological anomalies have appeared.
Site inspections at institutionally controlled sites were conducted annually at ARA-03, ARA-06, ARA-07, ARA-08, ARA-23, ARA-24, ARA-25, PBF-10, PBF-12, PBF-13, PBF-21, PBF-22, and PBF-26. Visible access restrictions, control of activities, unauthorized access, and land-use restrictions were evaluated. No deficiencies were identified.
8.2.2 Corrosive Waste Sump (PBF-08 Site) and Evaporation Pond (PBF-10 Site)
Samples were taken of the residual sediments and surrounding soil above and below the evaporation pond liner, and radiological surveys were performed on the floor and walls of the corrosive waste sump. The radiological survey of the sump floor and walls found only fixed levels of contamination on the sump walls, ranging from 220 to 1,000 disintegrations per minute. Residual sediment samples collected above the evaporation pond liner showed Cs-137 concentrations of 11.2 to 17.5 pCi/g and chromium concentrations of 213 to 309 mg/kg, both below the established cleanup goals of 30 pCi/g for Cs-137 and 800 mg/kg for chromium. Soil samples collected below the evaporation pond liner also indicated chromium concentrations of 14.4 to 23 mg/kg (within background) with minor Cs-137 contamination. Based on these results, it was concluded that the pond liner was not breached during its operational lifetime and that all contaminants had been contained within the evaporation pond. The results also verified that the interim action could be considered complete.
Site restoration activities included backfilling and recontouring the area, followed by reseeding of the area. Interim action activities were completed in 1994. Because of its interim nature, a final ROD on the residual OU 5-13 site was not made until after the WAG 5 comprehensive ROD (OU 5-12) had been issued. Because of the lack of smearable contamination in the corrosive waste sump, however, it was anticipated that no further remedial actions or institutional controls would be required. In contrast, the Cs-137 concentration in the residual evaporation pond sediments was below cleanup goals, but the concentration was not below the free-release levels that have been set for Cs-137. Therefore, it was
8-25

anticipated that institutional controls would still be required on the evaporation pond until the Cs-137 has decayed to its free-release level. Both of these expectations were confirmed when the final OU 5-12 ROD was issued (DOE-ID 2000a).
8.2.3 Contaminated Soil beneath PER-751 Pump House Floor Slab and Foundation (PBF-37 Site)
Characterization sampling for metals and radionuclides before remediation at the PBF-37 site demonstrated that the only COC was Cs-137. After excavation of the contaminated soils at the site, in situ surveys of the excavation were performed, and confirmation samples were collected for laboratory analysis. The three in situ survey results ranged from 1.3 pCi/g to a maximum of 2.8 pCi/g. The analytical laboratory results for the two confirmation samples were 1.42 and 2.29 pCi/g. Based on the analytical results, it is being recommended in the forthcoming remedial action report that institutional controls will not be required for the site.
8.2.4 ARA-I Chemical Evaporation Pond (ARA-01 Site)
Screening sample results for arsenic at the ARA-01 site provided in situ measurements with a range of 4.8 to 9.5 mg/kg, while the in situ measurements for selenium were 0.4 to 2.0 mg/kg, and the in situ measurements for thallium were 1.3 to 2.4 mg/kg. The 95% upper confidence limit (UCL) for arsenic from the confirmation sample analytical results (calculated assuming a normal distribution in accordance with EPA guidelines) was 7.3 mg/kg, below the remedial action goal of 10 mg/kg. For selenium, all but one of the confirmation sample results was below the method detection limit with the single detectable concentration being 0.2 mg/kg as compared to the remedial action goal of 2.2 mg/kg. Assuming a non-parametric Chebyshev distribution (in accordance with EPA guidelines), the 95% UCL for selenium was calculated to be 0.11 mg/kg, below the remedial action level of 2.2 mg/kg. Based on a gamma distribution (again, in accordance with EPA guidelines), the 95% UCL for thallium from confirmation samples was 1.5 mg/kg, also below the remedial action goal of 4.3 mg/kg. By comparing the 95% UCL post-remediation concentrations to remediation goals, the remediation of the ARA-01 site was determined to be successful.
In accordance with the OU 5-12 ROD (DOE-ID 2000a), institutional controls were not required at ARA-01 after remediation, given that the COCs were inorganic (not radionuclides) and their post-remediation concentrations were below remedial action goals and therefore also below free-release levels.
8.2.5 ARA-I Sanitary Waste System (ARA-02 Site)
In situ measurements of the soil immediately underlying the seepage pit location demonstrated that the Cs-137 concentration remaining in the soil was 0.36 ± 0.13 pCi/g. This concentration is below the remediation goal of 8.5 pCi/g for Cs-137, which was established assuming that institutional controls would be in place for 100 years before the site could be turned over for residential use and the Cs-137 had decayed. It appears that the calculated 95% UCL for the residual Cs-137 contamination at the ARA-02 site was also below the established free-release concentration of 0.86 pCi/g. The concentrations of the remaining contaminants were derived, as provided in Table 8-6, using Cs-137 as a marker and assuming the concentrations of the other COCs present at the same ratio as the maximum concentrations provided in Table 21 of the OU 5-12 ROD (DOE-ID 2000a).
8-26
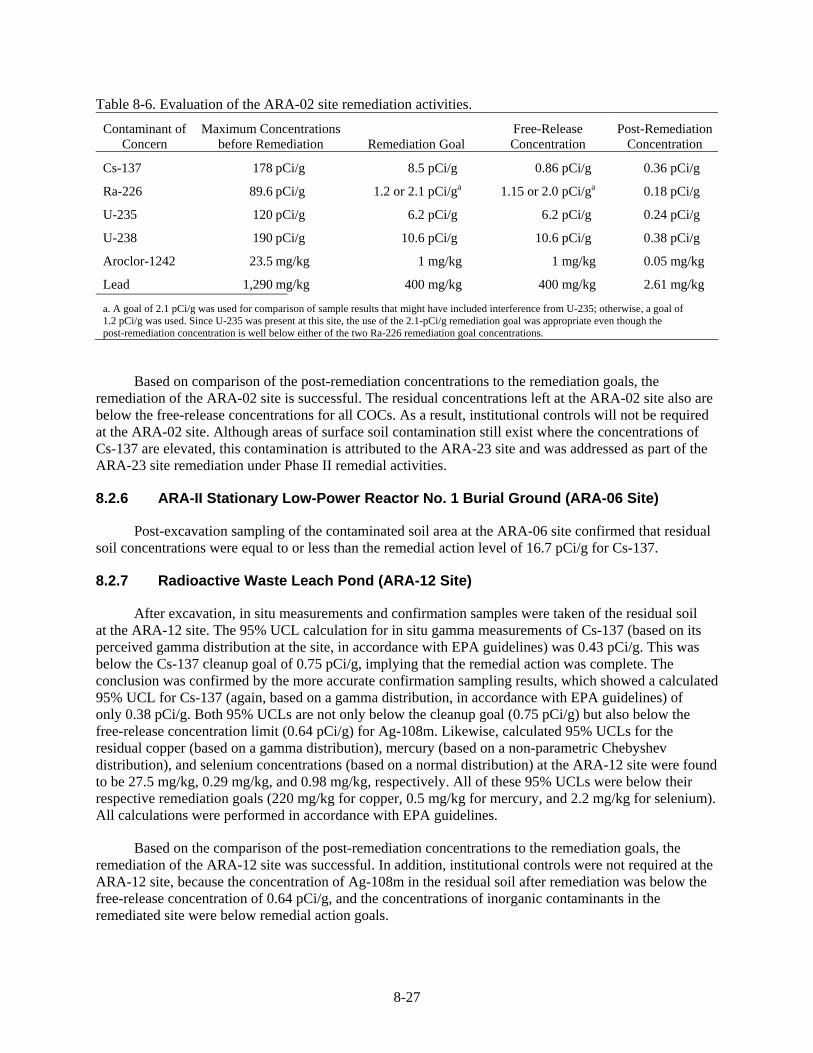
Table 8-6. Evaluation of the ARA-02 site remediation activities.
Contaminant of Maximum Concentrations Free-Release Post-Remediation Concern before Remediation Remediation Goal Concentration Concentration
Cs-137 178 pCi/g 8.5 pCi/g 0.86 pCi/g 0.36 pCi/g
Ra-226 89.6 pCi/g 1.2 or 2.1 pCi/ga 1.15 or 2.0 pCi/ga 0.18 pCi/g
U-235 120 pCi/g 6.2 pCi/g 6.2 pCi/g 0.24 pCi/g
U-238 190 pCi/g 10.6 pCi/g 10.6 pCi/g 0.38 pCi/g
Aroclor-1242 23.5 mg/kg 1 mg/kg 1 mg/kg 0.05 mg/kg
Lead 1,290 mg/kg 400 mg/kg 400 mg/kg 2.61 mg/kg
a. A goal of 2.1 pCi/g was used for comparison of sample results that might have included interference from U-235; otherwise, a goal of 1.2 pCi/g was used. Since U-235 was present at this site, the use of the 2.1-pCi/g remediation goal was appropriate even though the post-remediation concentration is well below either of the two Ra-226 remediation goal concentrations.
Based on comparison of the post-remediation concentrations to the remediation goals, the remediation of the ARA-02 site is successful. The residual concentrations left at the ARA-02 site also are below the free-release concentrations for all COCs. As a result, institutional controls will not be required at the ARA-02 site. Although areas of surface soil contamination still exist where the concentrations of Cs-137 are elevated, this contamination is attributed to the ARA-23 site and was addressed as part of the ARA-23 site remediation under Phase II remedial activities.
8.2.6 ARA-II Stationary Low-Power Reactor No. 1 Burial Ground (ARA-06 Site)
Post-excavation sampling of the contaminated soil area at the ARA-06 site confirmed that residual soil concentrations were equal to or less than the remedial action level of 16.7 pCi/g for Cs-137.
8.2.7 Radioactive Waste Leach Pond (ARA-12 Site)
After excavation, in situ measurements and confirmation samples were taken of the residual soil at the ARA-12 site. The 95% UCL calculation for in situ gamma measurements of Cs-137 (based on its perceived gamma distribution at the site, in accordance with EPA guidelines) was 0.43 pCi/g. This was below the Cs-137 cleanup goal of 0.75 pCi/g, implying that the remedial action was complete. The conclusion was confirmed by the more accurate confirmation sampling results, which showed a calculated 95% UCL for Cs-137 (again, based on a gamma distribution, in accordance with EPA guidelines) of only 0.38 pCi/g. Both 95% UCLs are not only below the cleanup goal (0.75 pCi/g) but also below the free-release concentration limit (0.64 pCi/g) for Ag-108m. Likewise, calculated 95% UCLs for the residual copper (based on a gamma distribution), mercury (based on a non-parametric Chebyshev distribution), and selenium concentrations (based on a normal distribution) at the ARA-12 site were found to be 27.5 mg/kg, 0.29 mg/kg, and 0.98 mg/kg, respectively. All of these 95% UCLs were below their respective remediation goals (220 mg/kg for copper, 0.5 mg/kg for mercury, and 2.2 mg/kg for selenium). All calculations were performed in accordance with EPA guidelines.
Based on the comparison of the post-remediation concentrations to the remediation goals, the remediation of the ARA-12 site was successful. In addition, institutional controls were not required at the ARA-12 site, because the concentration of Ag-108m in the residual soil after remediation was below the free-release concentration of 0.64 pCi/g, and the concentrations of inorganic contaminants in the remediated site were below remedial action goals.
8-27
8.2.8 ARA-I Radionuclide Tank (ARA-16 Site)
In situ measurement of the basalt/soil underlying the tank and vault at the ARA-16 site demonstrated that the maximum Cs-137 concentration in the remediated site was 1.5 pCi/g, well below the remediation goal of 23 pCi/g for Cs-137. As a result, remediation of the ARA-16 site was successful. The maximum concentration of Cs-137 in the remediated site also was below the free-release concentration of 2.4 pCi/g. Given that fact, institutional controls at the ARA-16 site are no longer required. Although Cs-137 was still present in surficial soils (similar to the ARA-02 site), that contamination was attributed to windblown contamination from the SL-1 accident and was addressed as part of the Phase II remedial action for the ARA-23 site.
8.2.9 Radiologically Contaminated Surface Soil and Subsurface Structures associated with ARA-I and ARA-II (ARA-23 Site)
Because of the size of the ARA-23 site excavation, the post-remediation evaluation activities (via sampling) were separated into five zones. The various zones of the excavation were as follows:
• Area near the ARA-I facility
• Area near the ARA-II facility
• Equipment washdown area
• Haul road and turnaround area
• Windblown area.
A review of the contamination profiles for both in situ measurements and confirmation samples found that the contamination profiles generally followed a log-normal distribution rather than a normal distribution. The only exceptions to this were the confirmation samples in the washdown area and the in situ measurements in the haul road and turnaround area.
Residual sampling results, for the ARA-I area of the ARA-23 site after remediation showed 95% UCL Cs-137 concentrations of 8.5 pCi/g for the in situ measurements (based on a gamma distribution, in accordance with EPA guidelines) and 22.3 pCi/g for the confirmation samples (based on a non-parametric Chebyshev distribution). Both calculated values were below the remedial action goal of 23 pCi/g for Cs-137. Therefore, remediation of the ARA-I excavation site within the ARA-23 site was considered complete.
For purposes of evaluating the ARA-II portion of the ARA-23 site, the data had to be split into samples collected from (1) the basalt surface where excavation was to that surface and (2) samples collected from excavated soil areas. This was because the RAOs were to either excavate to basalt or excavate enough of the soil to meet the remedial action goal of 23 pCi/g for Cs-137. In situ measurements, post-remediation for the ARA-II areas in the ARA-23 site that were not excavated to basalt showed a 95% UCL Cs-137 concentration of 8.6 pCi/g (based on a normal distribution, in accordance with EPA guidelines), which was below the remedial action goal of 23 pCi/g for Cs-137. The confirmation sample data for the ARA-II site projected a 95% UCL (based on a normal distribution, in accordance with EPA guidelines) of 11.1 pCi/g, also below the remedial action goal of 23 pCi/g for Cs-137. As a result, remedial actions for the ARA-II portion of the ARA-23 site were judged to be complete in that the residual soil surface at ARA-II met the remediation goals for Cs-137.
8-28

Residual sampling results for the equipment washdown area of the ARA-23 site after remediation showed 95% UCL concentrations of 8.4 pCi/g for Cs-137 for the in situ measurements (based on a gamma distribution, in accordance with EPA guidelines) and 12.9 pCi/g for the confirmation samples (based on a normal distribution). Both calculated values were below the remedial action level of 23 pCi/g, indicating that the remediation was complete.
In situ measurements and confirmation sample results for the haul road and turnaround area of the ARA-23 site followed a gamma distribution, in accordance with EPA guidelines. The calculated 95% UCL Cs-137 concentrations of the residual soil surfaces were 7.4 pCi/g for the in situ measurements and 24.9 pCi/g for the confirmation samples. While the in situ measurements were below the remedial goal for Cs-137 (23 pCi/g), the confirmation sample results were just above the remediation goal. The reason for this was that one of these 10 samples had a Cs-137 concentration above the remediation goal of 23 pCi/g (ARA-23H-20 was 56.3 pCi/g). The same sample location provided an in situ Cs-137 concentration of 11.7 pCi/g. The high Cs-137 concentration in this single confirmation sample was attributed to a “hot particle” that incorrectly skewed the 95% UCL calculation to a level above the remediation goal and could be screened from the confirmation sample evaluation. The new 95% UCL that was calculated for Cs-137 from the other nine confirmation samples (under a normal distribution, in accordance with EPA guidance) was only 9.5 pCi/g, below the remedial action goal of 23 pCi/g. Therefore, remediation of the haul road and turnaround area of the ARA-23 site was considered complete.
In situ measurements for the windblown area of the ARA-23 site, post-remediation, had a 95% UCL Cs-137 concentration of 9.3 pCi/g based on a normal distribution. Confirmation samples of the windblown area based on a gamma distribution provided a 95% UCL of 9.6 pCi/g for Cs-137. Both 95% UCLs were below the remediation goal for Cs-137 (23 pCi/g). As a result, remediation of the windblown area of the ARA-23 site was considered complete.
A summary of the residual concentrations in the excavated soil (and basalt) areas of each portion of the ARA-23 site is shown in Table 8-7. Based on the comparison of the post-remediation concentrations to the remediation goal, the remediation of the ARA-23 site was determined to be successful. However, the presence of Cs-137 contamination in excess of the free-release concentration of 2.4 pCi/g requires that institutional controls remain in place.
Table 8-7. ARA-23 site Cs-137 data summary by area.
ARA-I
Area In Situ Measurements Cs-137
(pCi/g)
8.5a
Confirmation Sampling Cs-137 (pCi/g)
22.3b
ARA-II 8.6c (soil)/52.1a (basalt) 11.1c (soil)/83.8a (basalt)
Equipment washdown
Haul road and turnaround
8.4a
7.4a
12.9c
9.5c,d
Windblown 9.3c 9.6a
a. 95% UCL, determined under a gamma distribution, in accordance with EPA guidelines b. 95% UCL, determined under a non-parametric Chebyshev distribution, in accordance with EPA guidelines c. 95% UCL, determined under a normal distribution, in accordance with EPA guidelines d. With single outlier sample removed
EPA = U.S. Environmental Protection Agency UCL = upper confidence limit
8-29

8.2.10 ARA-I Soil beneath the ARA-626 Hot Cells (ARA-25 Site)
In situ measurements of the exposed basalt layer at the ARA-25 site showed a maximum Cs-137 concentration of 398 pCi/g in the basalt—in excess of the 23-pCi/g remediation goal. The measured Cs-137 concentrations were used to calculate concentrations of the remaining COCs. The concentration of Cs-137 and those derived for the other COCs are provided in Table 8-8. Although all the remaining contaminant concentrations (except copper) exceeded their remediation goals, the OU 5-12 ROD (DOE-ID 2000a) stated that remedial goals can be satisfied by either cleaning up to the identified contaminant concentration or by removing all soil down to the basalt interface. Because the contaminated soil was removed down to the basalt interface, the remediation of the ARA-25 site was successful. However, the presence of high levels of Cs-137 within the basalt required the use of institutional controls at the ARA-25 site. Because the residual contamination was higher than remediation goals, institutional controls will be needed at the ARA-25 site longer than the assumed 100 years. As a result, monuments were placed on top of the site, as were sign postings and personnel access restrictions that commonly accompany institutional controls.
Table 8-8. ARA-25 site contaminant concentration evaluation.
Maximum Contaminant of Maximum Concentration Post-Remediation
Concern before Remediation Concentration Remediation Goal
Cs-137 449 pCi/g 398 pCi/g 23 pCi/g
Ra-226 29.7 pCi/g 26.3 pCi/g 1.2 or 2.1 pCi/ga
Arsenic 40.6 mg/kg 36.0 mg/kg 5.8 mg/kg
Lead 1,430 mg/kg 1,266 mg/kg 400 mg/kg
Copper 227 mg/kg 201 mg/kg 220 mg/kg
a. A goal of 2.1 pCi/g was used for comparison of sample results that might have included interference from U-235; otherwise, a goal of 1.2 pCi/g was used. Regardless of which remediation goal concentration was used for comparison, the post-remediation concentration clearly exceeds either one.
8.2.11 Inactive Waste System Sites
ARA-II Seepage Pit to the East (ARA-720A) (ARA-07 Site)—Based on June 1991 data, the maximum concentration of Cs-137 at the ARA-07 site was found to be 17.6 pCi/g. Accounting for radioactive decay, the corrected Cs-137 concentration (to September 2004) is 13.0 pCi/g. Though cleanup was not required, the residual Cs-137 concentration was still above the free-release concentration of 2.4 pCi/g established at the time. As a result, sufficient Cs-137 contamination existed to warrant institutional controls being established at the site. The institutional controls consist of visible access restrictions (i.e., CERCLA signs) and prevention of unauthorized access (i.e., the INL Site security gate). The institutional control requirement is to be reviewed every 5 years.
ARA-II Seepage Pit to the West (ARA-720B) (ARA-08 Site)—Based on June 1991 data, the maximum concentration of Cs-137 at the ARA-08 site was 11.6 pCi/g. This corresponds to a September 2004 Cs-137 concentration of 8.6 pCi/g. Though cleanup was not required, the residual Cs-137 concentration was still above the free-release concentration of 2.4 pCi/g established at the time. As a result, sufficient contamination existed to warrant institutional controls being established at the site. The institutional controls consist of visible access restrictions (i.e., CERCLA signs) and prevention of
8-30

unauthorized access (i.e., the INL Site security gate). The institutional control requirement is to be reviewed every 5 years.
ARA-III Sanitary Sewer Leach Field (ARA-740) (ARA-13 Site)—Results from sampling at the ARA-13 site showed that waste from the manhole was nonhazardous and nonradioactive. The sludge from the septic tank system also was not hazardous but contained levels of Cs-137 below the free-release concentration of 2.4 pCi/g. As a result, a decision was made to manage all sludge from the ARA-13 site as low-level waste. Sludge from the distribution box was found to be regulated under the TSCA (15 USC § 2601 et seq.) because of PCB concentrations in excess of 50 parts per million (ppm).
After removal of the sludge from the septic tank and distribution box, no evidence of additional hazardous or radioactive contamination was found in the soil surrounding these systems. In addition, analytical data from the leach field showed that contamination levels were not a problem and that leaving the leach field in place was the best management practice. As a result, the sites can be considered closed, with no further institutional controls required.
ARA-IV Septic Tank and Seepage Pit #2 (ARA-21 Site)—The ARA-21 site sampling was done before remediation to determine waste disposition paths for the septic tank, the chlorine contact tank, and the liquid waste contained in them. Based on analytical data, it was determined that the components would be abandoned in place; therefore, sampling of the individual components was not required. Analytical data for the ARA-21 site showed K-40 concentrations of 85.8 ± 22.1 pCi/L in the septic tank and 97.0 ± 26.0 pCi/L in the chlorine contact tank. Gross beta levels were 42.4 ± 3.14 pCi/L in the septic tank and 62.8 ± 4.4 pCi/L in the chlorine contact tank, while gross alpha concentrations were within normal levels. Inorganic and organic analyses indicated that all of the waste met RCRA regulatory limits (42 USC § 6901 et seq.). The lack of hazardous or radioactive contamination at the ARA-21 site after remediation allowed for the site to be closed without any institutional controls.
8.2.12 Groundwater Monitoring
The OU 5-12 ROD (DOE-ID 2000a) required that nine aquifer wells within WAG 5 be sampled annually to monitor organic, inorganic, and radionuclide contaminant concentrations in the groundwater. The purpose of the monitoring was to compare the measured contaminant concentrations (if any) against the pre-defined MCLs, secondary MCLs, or EPA action levels and to ascertain whether the contaminant concentrations are stable, increasing, or decreasing. In addition, up to 21 monitoring wells in the vicinity of WAG 5 have been used to determine the elevation of the groundwater, groundwater gradients, and direction of groundwater flow beneath WAG 5. Annual monitoring of WAG 5 wells has been conducted since FY 2001 (INEEL 2001; INEEL 2002a; INEEL 2003a; ICP 2004).
8.2.12.1 Volatile Organic Compound Results. Sporadic detections of VOCs have been reported for the WAG 5 groundwater samples, but consistent VOC detections have not occurred. There were scattered detections of the VOCs like toluene and trichloroethene, but detections were not consistent and were well below their respective MCLs except for PCE in FY 2003. In the FY 2003 sampling event, PCE concentrations above its MCL of 5 μg/L were reported for groundwater samples from the ARA-MON-A-004 and PBF-MON-A-004 wells. However, PCE was below the reporting limit of 1 μg/L in both wells in the FY 2004 sampling event.
8.2.12.2 Inorganic Results. Inorganic analyses included metals and anions. Specific metals requested included arsenic, barium, cadmium, chromium, lead, mercury, selenium, and silver. Anion analysis included fluoride, chloride, bromide, nitrate, nitrite, orthophosphate, and sulfate. In FY 2003 and FY 2004, all analytical results for metals and anions were below the MCLs, secondary MCLs, or action
8-31
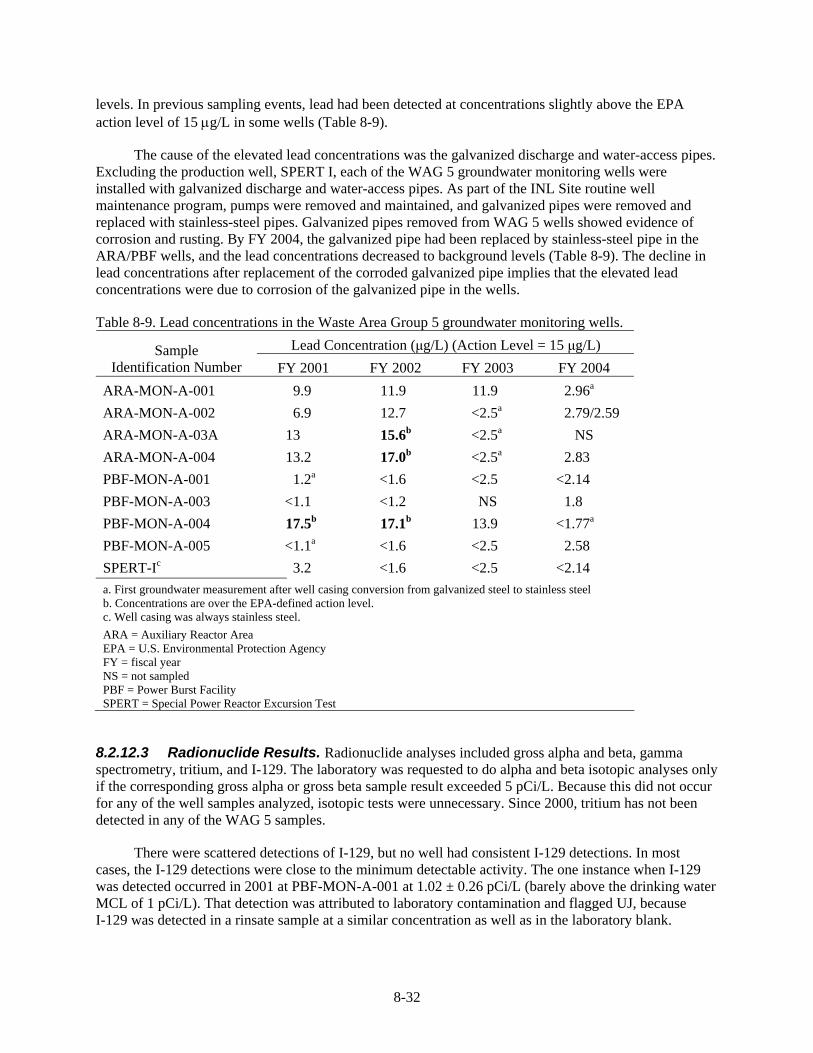
levels. In previous sampling events, lead had been detected at concentrations slightly above the EPA action level of 15 μg/L in some wells (Table 8-9).
The cause of the elevated lead concentrations was the galvanized discharge and water-access pipes. Excluding the production well, SPERT I, each of the WAG 5 groundwater monitoring wells were installed with galvanized discharge and water-access pipes. As part of the INL Site routine well maintenance program, pumps were removed and maintained, and galvanized pipes were removed and replaced with stainless-steel pipes. Galvanized pipes removed from WAG 5 wells showed evidence of corrosion and rusting. By FY 2004, the galvanized pipe had been replaced by stainless-steel pipe in the ARA/PBF wells, and the lead concentrations decreased to background levels (Table 8-9). The decline in lead concentrations after replacement of the corroded galvanized pipe implies that the elevated lead concentrations were due to corrosion of the galvanized pipe in the wells.
Table 8-9. Lead concentrations in the Waste Area Group 5 groundwater monitoring wells. Lead Concentration (μg/L) (Action Level = 15 μg/L)Sample
Identification Number FY 2001 FY 2002 FY 2003 FY 2004 ARA-MON-A-001 9.9 11.9 11.9 2.96a
ARA-MON-A-002 6.9 12.7 <2.5a 2.79/2.59 ARA-MON-A-03A 13 15.6b <2.5a NS ARA-MON-A-004 13.2 17.0b <2.5a 2.83 PBF-MON-A-001 1.2a <1.6 <2.5 <2.14 PBF-MON-A-003 <1.1 <1.2 NS 1.8 PBF-MON-A-004 17.5b 17.1b 13.9 <1.77a
PBF-MON-A-005 <1.1a <1.6 <2.5 2.58 SPERT-Ic 3.2 <1.6 <2.5 <2.14 a. First groundwater measurement after well casing conversion from galvanized steel to stainless steel b. Concentrations are over the EPA-defined action level. c. Well casing was always stainless steel. ARA = Auxiliary Reactor Area EPA = U.S. Environmental Protection Agency FY = fiscal year NS = not sampled PBF = Power Burst Facility SPERT = Special Power Reactor Excursion Test
8.2.12.3 Radionuclide Results. Radionuclide analyses included gross alpha and beta, gamma spectrometry, tritium, and I-129. The laboratory was requested to do alpha and beta isotopic analyses only if the corresponding gross alpha or gross beta sample result exceeded 5 pCi/L. Because this did not occur for any of the well samples analyzed, isotopic tests were unnecessary. Since 2000, tritium has not been detected in any of the WAG 5 samples.
There were scattered detections of I-129, but no well had consistent I-129 detections. In most cases, the I-129 detections were close to the minimum detectable activity. The one instance when I-129 was detected occurred in 2001 at PBF-MON-A-001 at 1.02 ± 0.26 pCi/L (barely above the drinking water MCL of 1 pCi/L). That detection was attributed to laboratory contamination and flagged UJ, because I-129 was detected in a rinsate sample at a similar concentration as well as in the laboratory blank.
8-32

There were scattered detections of Cs-134 in FY 2003 and FY 2004. These detections were close to or below the minimum detectable activity for this analysis and were flagged with a “J” by the validator, indicating that the result might be inaccurate or imprecise. Although Cs-134 was found to be present statistically, the result is questionable. Cs-137 is generally expected to be present when Cs-134 is detected, especially given the fact that Cs-134 has a 2.06-year half-life as compared to a 30.17-year half-life for Cs-137. However, Cs-137 was not detected in any of the samples. In addition, reactor operations that could have contributed to the presence of either isotope ceased at PBF in February 1985.
8.2.12.4 Water-Level Measurement Results. Water-level measurements were obtained from seven monitoring wells in 2001, eight wells in 2002, 21 wells in 2003, and 19 monitoring wells in 2004 at WAG 5. The number of wells measured for water levels was expanded in 2003 and 2004 to give a better representation of the water table at WAG 5. Like past groundwater contour maps of WAG 5, the contour map of the April 2004 data shows steep contours in the PBF area with the direction of hydraulic gradient somewhat counter to the regional south-southwest gradient (Figure 8-5).
8.2.13 Institutional Controls
Institutional controls have been warranted for many of the WAG 5 sites because of the presence of radionuclides above concentrations that would allow for free release. Given the revised preliminary remediation goals that have been calculated based on the most recent of the sites’ EPA guidance (see Appendix A), several sites no longer require institutional controls as described in the following subsections.
8.2.13.1 ARA-I Lead Sheeting Pad near ARA-627 (ARA-03 Site). The estimated baseline risk for the ARA-03 site was 2E-05 for the 100-year future residential scenario from exposure to Cs-137 (DOE-ID 1999) with analytical results ranging from 0.49 to 7.4 pCi/g for samples obtained on September 27, 1994. Based on this risk, the ROD (DOE-ID 2000a) recommends that the site be restricted to industrial land use until institutional controls are discontinued based on the results of a five-year review. The 1994 data set was evaluated for normality using the Shapiro-Wilk test statistic, which indicated that the data were normally distributed at the 5% significance level. The 95% UCL for the data set using the Student’s t was 5.00 pCi/g, which equates to 3.94 pCi/g when decay corrected to January 24, 2005. Based on the concentrations provided in Appendix A, the allowable concentration for the current residential scenario below which institutional controls are no longer required is 5.97 pCi/g. Based on this concentration, institutional controls are no longer required for the ARA-03 site.
8.2.13.2 Power Burst Facility SPERT-IV Leach Pond (PBF-758) (PBF-22 Site). The PBF-22 site was the location of an unlined surface impoundment that received effluent from the SPERT-IV reactor from 1961 to 1970. Occasional discharges from the SPERT-IV waste holdup tank were routed to the pond from 1979 to 1981. Contaminated primary coolant effluents from the PBF reactor were transported to the site by truck and emptied into the pond in the early 1980s. Given the results of two separate characterization events in 1988, institutional controls were implemented at the site based on exposure risks being 9E-06 for Cs-137 for the current occupational scenario and 3E-06 for the 100-year future residential scenario, as outlined in the ROD (DOE-ID 2000a). The Cs-137 results ranged from 0.073 to 8.0 pCi/g with an average of 1.10 pCi/g. The 99% Chebyshev UCL (used because the data follow a non-parametric distribution) is 4.42 pCi/g for the 1988 data set. Based on this concentration being below the 5.97-pCi/g requirement for free release, institutional controls are no longer required at this site.
8-33

US-26
Big Lost River USGS-005 4462.44
NPR-TEST 4462.64
INTEC USGS-082
4449.295
USGS-116 4449.2
PBF-MON-A-001
4446.94 USGS-020 4456.86
4441.02 PBF-MON-A-004
NTP-Area 2 4451.19
CFA 4437.24 PBF-MON-A-003
4441.25 ARA-MON-A-003A
STF-MON-A-02A 4436.59
4433.19 STF-MON-A-003
4441.29 ARA-MON-A-004
4434.08 STF-MON-A-004
4439.68 ARA-MON-A-001
ARA-MON-A-002 4439.2
US-20
USGS-107 4431.89
LEGEND Monitoring well
Highways
INL roads
Water-level contour contour interval =2 feet
Scale
USGS-110 0 2500 5000 7500 10000 4429.24 USGS-001
Feet INL Boundary
Figure 8-5. Waste Area Group 5 groundwater contour map developed from April 2004 data.
8-34
4428.84

8.2.13.3 Power Burst Facility SPERT-IV Lake (PBF-26 Site). The PBF-26 site is a surface impoundment area constructed in 1960 around an irregularly shaped natural depression. The area typically received small quantities of uncontaminated cooling water from the secondary loop of the SPERT-IV reactor from 1961 to 1970, uncontaminated effluent from Three-Mile Island studies, and discharges generated by periodic testing of emergency eye wash and shower stations from 1985 to 1992. The site is restricted to industrial land use because of estimated baseline risks of 7E-05 for the current occupational scenario and 6E-05 for the 100-year future residential scenario from exposure to radionuclides (Cs-137, U-235, and U-238). Table 8-10 lists the radionuclides detected during the 1985 sampling event, including the range, the average, the 95% UCL (including the data distribution), and the 1E-04 current residential scenario concentrations for the three radionuclides of concern from Appendix A, as calculated based on new slope factors.
Table 8-10. PBF-26 site radionuclide concentrations.
Current Residential Range Average 95% UCL Scenario
Radionuclide (pCi/g) (pCi/g) (pCi/g) (pCi/g)
Cs-137 0.70–7.69 2.79 4.67 (Student’s t) 5.97 (external exposure)
U-235 0.80 NA NA 19.5 (external exposure)
U-238 0.80–3.4 2.1 NA 74.2 (external exposure)
NA = not applicable UCL = upper confidence limit
For U-235 and U-238, too few sample results were available from which to calculate the 95% UCL. Therefore, the maximum concentration detected will be used for comparison to the current residential scenario concentration. Both the U-235 and U-238 maximum concentrations (0.80 and 3.4 pCi/g, respectively) are below the corresponding current residential scenario concentrations of 19.5 and 74.2 pCi/g. Based on these comparisons, the presence of neither of these radionuclides is cause for institutional control restrictions on the site. Cs-137, with a 95% UCL concentration of 4.67 pCi/g for the 1985 data set, is below the current residential scenario concentration of 5.97 pCi/g. Based on this concentration being below the 5.97-pCi/g requirement for free release, institutional controls are no longer required at this site.
8.3 Progress since Last Review
The OU 5-05 ROD (INEL 1996) is the only WAG 5 ROD that has undergone a previous five-year review. That ROD addressed the remediation of the SL-1 burial ground. In 2001, the EPA conducted the first five-year review of the OU 5-05 ROD (EPA 2001). The report documented completion of the OU 5-05 remedial action in 1997 and concluded that the engineered barriers placed over the SL-1 burial ground appeared intact with no visible evidence of subsidence or erosion and no evidence of weeds, shrub encroachment, or other biointrusion into the barriers. The revegetated areas surrounding the site appeared to be fixed and well established with no indication of any surface erosion; all institutional markers (fences, signs, posted notices, and permanent markers) were in place and intact. As a result, the remedial actions performed on the SL-1 burial ground were judged to be effective in meeting the site’s RAOs.
A review of the 2002 and 2003 inspection reports (INEEL 2002b; INEEL 2003b) for the SL-1 burial ground showed that conditions were similar to those at the time of the initial five-year review. The engineered barriers still appeared intact, with no visible signs of erosion. Although rabbit nesting was
8-35

observed in the vicinity of the SL-1 engineered barrier, it appeared very unlikely that the rabbits posed a threat to the integrity of the SL-1 cover. In addition, the revegetated areas surrounding the SL-1 engineered barrier remained free of erosion, and all of the institutional controls are intact and up-to-date. Although vegetation was encroaching on the SL-1 engineered barrier in 2002, vegetation appeared to be absent in 2003. Dose rates around the perimeters of the SL-1 burial ground remained consistent with past survey results. As a result, the remedial actions at the SL-1 burial ground still appear to be effective in meeting the site’s RAOs.
8.3.1 Issues Identified during the First Operable Unit 5-05 Five-Year Review
The only issue identified during the OU 5-05 five-year review was the presence of windblown contamination in the area surrounding the SL-1 burial ground. The contamination was initially identified as part of the OU 5-05/6-01 SL-1/BORAX Annual Inspection Report (INEEL 1998). The five-year review indicated that the windblown contamination was to be removed during Phase II of the WAG 5 comprehensive (OU 5-12) remedial action. For purposes of completion, the Phase II soil removal action needs to be summarized as part of this review.
The five-year review also mentions that no groundwater monitoring requirements were included in the SL-1 remedy. Rather, groundwater monitoring requirements were addressed by the WAG 5 ROD (DOE-ID 2000a), which found no unacceptable risk due to impacts on groundwater. Nevertheless, groundwater monitoring was required as part of the first OU 5-12 comprehensive review in order to reduce uncertainties and provide trend data. This monitoring is summarized in Section 8.2.12.
8.3.2 Response Actions to Issues Identified during the First Five-Year Review
Since the time of the first review, remediation of the windblown contamination in the vicinity of the SL-1 burial ground was removed as part of the ARA-23 site soil removal action performed in 2004. Details of the removal action are documented in Section 8.1.3.8. The results showed that all contaminated soils were removed to a level below the remedial action goal of 23 pCi/g for Cs-137. However, the residual soil areas within the ARA-23 site maintained a Cs-137 concentration in excess of the free-release concentration of 2.4 pCi/g. In addition, areas within the basalt subsurface that were not excavated indicated Cs-137 contamination in excess of both the free-release concentration and the remedial action goal (2.4 pCi/g and 23 pCi/g, respectively). As a result, institutional controls will need to be maintained over the windblown contamination area as well as the SL-1 burial ground until the Cs-137 contamination in the basalt, waste, and residual soil drops below free-release concentrations.
8.3.3 Ongoing Remediation Activities
As of September 2004, all remedial actions identified in the OU 5-13 ROD, the OU 5-05 ROD, and the OU 5-12 ROD have been completed. Details associated with the remedial actions are contained in the respective remedial action reports for each ROD (DOE-ID [1992a] for OU 5-13, DOE-ID [1997] for OU 5-05, and DOE-ID [2002] and a report to be published for OU 5-12).
The only ongoing remediation activity is the groundwater monitoring activities that are under way as part of OU 5-12.
8-36
8.4 Technical Assessment
Question A: Is the remedy functioning as intended by the decision documents?
According to sampling data and site inspections, all COCs are at or below regulatory action levels. However, at some of the sites, contaminants are present at concentrations that prohibit unrestricted use of or unrestricted access to the site. At sites where contaminant concentrations prohibit free release of the site, institutional controls have been implemented. Therefore, the remedial actions implemented at WAG 5 are functioning as intended.
Question B: Are the exposure assumptions, toxicity data, cleanup levels, and remedial action objectives used at the time of the remedy selection still valid?
No changes that would negatively impact the original assumptions for exposure assumptions or toxicological parameters have occurred since development of final remedial goals. Therefore, the original assumptions, cleanup levels, and RAOs used at the time of the remedy selection are still valid.
Question C: Has any other information come to light that could call into question the protectiveness of the remedy?
No.
8.5 Issues
Based on recent EPA-approved guidelines, the revised free-release concentration for Cs-137 is 5.97 pCi/g. This is due to a soil shielding factor that was included in the latest risk models. Before the next five-year review, the DOE-ID, with agency concurrence, will determine how best to address the impact that the new guidelines have on the duration of institutional controls. For WAG 5, the new guidelines would allow for institutional controls to be discontinued at the ARA-03, PBF-22, and PBF-26 sites. For a list of issues identified within all WAGs during the INL Sitewide five-year review in 2005, see Table C-1 in Appendix C.
8.6 Recommendations and Follow-up Actions
The institutional controls that are currently in place for the 13 waste sites within WAG 5 appear to be functional and should be left in place for most of the sites until the radioactive residual contamination in these sites drops below free-release concentrations. The free-release concentration for Cs-137 (the primary radionuclide COC) was established at 2.4 pCi/g, which is equivalent to a 1 E-4 risk for residential use.
As stated above, a four-year review of groundwater monitoring activities within WAG 5 showed that the existing groundwater flow and elevation underneath WAG 5 are not varying significantly and that the concentrations of organic, inorganic, and radionuclide contamination in the groundwater are substantially below EPA-defined regulatory levels. As a result of these findings, it is recommended that the majority of inorganic, radionuclide, and groundwater-level monitoring should be terminated at WAG 5. To provide adequate data for wells that have undergone replacement of the galvanized piping with stainless-steel piping within the past 2 years, an additional round of samples will be collected specifically for lead and zinc analyses. Provided that this additional round supports the assertion that contaminant concentrations have decreased to acceptable levels, sampling for these analytes will be discontinued. Organic groundwater monitoring will be continued on only the three monitoring wells
8-37

(PBF-MON-A-001, PBF-MON-A-003, and SPERT-I) within the vicinity of the PER-722 diesel fuel release behind the PBF Reactor Building (PER-620). Furthermore, it is recommended that organic groundwater monitoring of these three wells be terminated in 2006 if monitoring results continue to indicate that organic contaminant concentrations in the groundwater are below regulatory concern.
8.7 Protectiveness Statement
Review of the results of the groundwater monitoring activities and annual inspection reports conducted at WAG 5 since 2001 shows that the remedy is functioning as intended by the OU 5-12 ROD (DOE-ID 2000a) and as modified by its ESD (DOE-ID 2005). No changes in the physical conditions of the site have occurred that would affect the remedy’s protectiveness. As of September 2004, no changes have occurred in the COC toxicity factors or risk factors that would negatively impact the protectiveness of the remedy. A total of 13 hazardous sites within WAG 5 remain under institutional controls. In addition, recommendations are to continue groundwater monitoring for organic contamination on three of the monitoring wells within WAG 5 (PBF-MON-A-001, PBF-MON-A-003, and SPERT-I). However, all of these actions are in accordance with the intent of the OU 5-12 ROD (DOE-ID 2000a). None of the available information negates the protectiveness of the OU 5-12 remedies.
8.8 Section 8 References
40 CFR 300, 2003, “National Oil and Hazardous Substances Pollution Contingency Plan,” Code of Federal Regulations, Office of the Federal Register, August 2003.
15 USC § 2601 et seq., 1976, “Toxic Substances Control Act of 1976,” United States Code, October 11, 1976.
42 USC § 6901 et seq., 1976, “Resource Conservation and Recovery Act of 1976,” United States Code, October 21, 1976. (The 1980 Amendment is cited as the “Solid Waste Disposal Act Amendments of 1980.”)
42 USC § 9601 et seq., 1980, “Comprehensive Environmental Response, Compensation and Liability Act of 1980 (CERCLA/Superfund),” United States Code, December 11, 1980.
DOE-ID, 1991, Federal Facility Agreement and Consent Order for the Idaho National Engineering Laboratory, Administrative Docket No. 1088-06-29-120, U.S. Department of Energy Idaho Operations Office; U.S. Environmental Protection Agency, Region 10; Idaho Department of Health and Welfare, December 4, 1991.
DOE-ID, 1992a, Power Burst Facility Record of Decision: Power Burst Facility Corrosive Waste Sump and Evaporation Pond, Operable Unit 5-13, Waste Area Group 5, Document ID 5204, Rev. 0, U.S. Department of Energy Idaho Operations Office, September 1992.
DOE-ID, 1992b, Record of Decision: Auxiliary Reactor Area-I Chemical Evaporation Pond, Operable Unit 5-10, Document ID 5232, Rev. 0, U.S. Department of Energy Idaho Operations Office, December 1992.
DOE-ID, 1994a, Explanation of Significant Difference: Power Burst Facility Corrosive Waste Sump and Evaporation Pond Record of Decision at the Idaho National Engineering Laboratory, Document ID 5814, Rev. 0, U.S. Department of Energy Idaho Operations Office, May 1994.
8-38

DOE-ID, 1994b, Explanation of Significant Difference: Power Burst Facility Corrosive Waste Sump and Evaporation Pond Record of Decision at the Idaho National Engineering Laboratory, Document ID 5814, Rev. 0, U.S. Department of Energy Idaho Operations Office, December 1994.
DOE-ID, 1997, Remedial Action Report OU 5-05 Stationary Low-Power Reactor No. 1 and OU 6-01 Boiling Water Reactor Experimental-I Burial Grounds Engineered Barriers, DOE/ID-10591, Rev. 0, U.S. Department of Energy Idaho Operations Office, October 1997.
DOE-ID, 1999, Waste Area Group 5 Operable Unit 5-12 Comprehensive Remedial Investigation/Feasibility Study, DOE/ID-10607, Rev. 0, U.S. Department of Energy Idaho Operations Office, January 1999.
DOE-ID, 2000a, Record of Decision Power Burst Facility and Auxiliary Reactor Area, Operable Unit 5-12, DOE/ID-10700, Rev. 0, U.S. Department of Energy Idaho Operations Office, January 2000.
DOE-ID, 2000b, “Institutional Control Plan for the Power Burst Facility and Auxiliary Reactor Area, Operable Unit 5-12,” provided in Appendix A to the Operations and Maintenance Plan for Power Burst Facility and Auxiliary Reactor Area, Operable Unit 5-12, DOE/ID-10805, Rev. 0, U.S. Department of Energy Idaho Operations Office, December 2000.
DOE-ID, 2001, Waste Area Group 5 Remedial Design/Remedial Action Work Plan, Phase I, DOE/ID-10761, Rev. 1, U.S. Department of Energy Idaho Operations Office, June 2001.
DOE-ID, 2002, Remedial Action Report for WAG 5, OU 5-12 Phase I Remedial Action; Sites ARA-02, ARA-16, ARA-25, and Inactive Waste System Sites ARA-07, ARA-08, ARA-13, and ARA-21, DOE/ID-10954, Rev. 0, U.S. Department of Energy Idaho Operations Office, January 2002.
DOE-ID, 2003, Remedial Design/Remedial Action Work Plan, Phase II, for Waste Area Group 5, DOE/ID-10798, Rev. 1, U.S. Department of Energy Idaho Operations Office, April 2003.
DOE-ID, 2005, Explanation of Significant Differences for the Record of Decision for the Power Burst Facility and Auxiliary Reactor Area Operable Unit 5-12, DOE/ID-11017, Rev. 0, U.S. Department of Energy Idaho Operations Office, January 2005.
EPA, 1989, Risk Assessment Guidance for Superfund, Volume I, Human Health Evaluation Manual (Part A), EPA/540/1/1-89/002, U.S. Environmental Protection Agency, December 1989.
EPA, 2001, Remedial Action Review: Idaho National Engineering and Environmental Laboratory—Stationary Low Power Reactor-1 and Boiling Water Reactor-I Burial Grounds, 1145.1.22, U.S. Environmental Protection Agency, Region 10, Office of Environmental Cleanup, Seattle, Washington 98101, August 2001.
Fromm, J., Idaho Department of Health and Welfare, Department of Environmental Quality, to Waste Area Group Managers and Technical Support Staff, January 3, 1996, “Radionuclide Risk-Based Concentration Tables,” Document ID 27760.
Giles, J. R., 1998, “Radium-226 at ARA-01, 02, 16, and 23,” INEEL/INT-98-00850, Rev. 0, Idaho National Engineering and Environmental Laboratory, September 1998.
8-39

Holdren, K. J., C. M. Hiaring, D. E. Burns, N. L. Hampton, B. J. Broomfield, E. R. Neher, R. L. VanHorn, I. E. Stepan, R. P. Wells, R. L. Chambers, L. Schmeising, and R. Henry, 1999, Waste Area Group 5 Operable Unit 5-12 Comprehensive Remedial Investigation/Feasibility Study, DOE/ID-10607, Rev. 0, U.S. Department of Energy Idaho Operations Office, January 1999.
ICP, 2004, Annual Groundwater Monitoring Status Report for Waste Area Group 5 for Fiscal Year 2004, ICP/EXT-04-00369, Rev. 0, Idaho National Engineering and Environmental Laboratory, Idaho Completion Project, September 2004.
INEEL, 1998, OU 5-05/6-01 SL-1/BORAX Annual Inspection Report, OP-ER-138-98, Rev. 0, Idaho National Engineering and Environmental Laboratory, August 1998.
INEEL, 1999, Final Report of the Decontamination and Dismantlement of the Auxiliary Reactor Area II Facility, INEEL/EXT-99-00905, Rev. 0, Idaho National Engineering and Environmental Laboratory, September 1999.
INEEL, 2001, FY 2001 Annual Groundwater Monitoring Trending Report for the Waste Area Group 5, INEEL/EXT-01-00268, Rev. 0, Idaho National Engineering and Environmental Laboratory, April 2001.
INEEL, 2002a, Annual Groundwater Monitoring Status Report for the Waste Area Group 5 for Fiscal Year 2002, INEEL/EXT-02-01032, Rev. 0, Idaho National Engineering and Environmental Laboratory, October 2002.
INEEL, 2002b, 2002 Annual Inspection Summary for Stationary Low-Power Reactor-1 and Boiling Water Reactor Experiment-I Burial Grounds, Operable Units 5-05 and 6-01, Document ID 23829, Rev. 0, Idaho National Engineering and Environmental Laboratory, August 2002.
INEEL, 2003a, Annual Groundwater Monitoring Status Report for the Waste Area Group 5 for Fiscal Year 2003, INEEL/EXT-03-00729, Rev. 0, Idaho National Engineering and Environmental Laboratory, September 2003.
INEEL, 2003b, 2003 Annual Inspection Summary for the Stationary Low-Power Reactor-1 Burial Ground, Operable Unit 5-05, INEEL/EXT-03-01126, Rev. 0, Idaho National Engineering and Environmental Laboratory, August 2003.
INEL, 1993, Final Remedial Design/Implementing Remedial Action Work Plan – Power Burst Facility (PBF)-08 Corrosive Waste Sump and PBF-10 Evaporation Pond Remediation – Operable Unit (OU) 5-13, Rev. 0, Document ID 045.013.1.3.101.01, Idaho National Engineering Laboratory, November 1993.
INEL, 1995, Remedial Investigation/Feasibility Study Report for Operable Units 5-05 and 6-01 (SL-1 and BORAX-I Burial Grounds), INEL-95/0027, Rev. 0, Idaho National Engineering Laboratory, March 1995.
INEL, 1996, Record of Decision: Stationary Low-Power Reactor-1 and Boiling Water Reactor Experimental-I Burial Grounds (Operable Units 5-05 and 6-01), and 10 No Action Sites (Operable Units 5-01, 5-03, 5-04, and 5-11), INEL-95/0282, Rev. 0, Idaho National Engineering Laboratory, January 1996.
8-40

Parsons, 1995, Final Remedial Action Report: Power Burst Facility (PBF)-08 Corrosive Waste Sump and PBF-10 Evaporation Pond Interim Action, Operable Unit 5-13, Document ID 05.013.2.1.209.01, Parsons Engineering Science, Inc., March 1995.
Rood, S. M., G. A. Harris, and G. J. White, 1995, Background Dose Equivalent Rates and Surficial Soil Metal and Radionuclide Concentrations for the Idaho National Engineering Laboratory, INEL-94/0250, Rev. 0, Idaho National Engineering Laboratory, February 1995.
8-41

8-42

9. WASTE AREA GROUP 6 (EXPERIMENTAL BREEDER REACTOR I AND BOILING-WATER REACTOR EXPERIMENT)
The Experimental Breeder Reactor (EBR) -I was established in the early 1950s to test the theory that a reactor could produce more fuel than it uses and became the first reactor to generate electricity. In 1953, tests conducted at the EBR-I proved that a reactor could create more fuel than it used, even while it created electricity. In 1963, reactor operations at EBR-I ceased.
Less than a mile from EBR-I at the Boiling-Water Reactor Experiment (BORAX) area, five reactor experiments were conducted between 1953 and 1964. These experiments began with BORAX-I, which was used to demonstrate the feasibility of boiling water reactors. The BORAX-I reactor was intentionally destroyed in 1954 to determine its inherent safety under extreme conditions. It was then buried in place.
In late 1954, another BORAX facility was constructed a few hundred feet northeast of BORAX-I. Over the next 10 years, three reactors (BORAX-II, BORAX-III, and BORAX-IV) shared the same reactor vessel, but the experiments used different fuel designs and core configurations. The BORAX-V reactor also shared the same facility but used a new reactor vessel and core system.
Past operations and support activities at the EBR-I and BORAX areas resulted in the release of radioactive contamination. To facilitate cleanup of the contamination, EBR-I and BORAX were designated as WAG 6 in accordance with the FFA/CO (DOE-ID 1991). Because they are located within 1 mi of each other and have similar operational backgrounds and sources of contamination, the WAG 6 boundary encompasses both facilities and the immediately adjacent surface and subsurface areas. Table 9-1 summarizes the COCs and remediation goals for WAG 6 sites where a remedial action was performed.
Table 9-1. Contaminants of concern at Waste Area Group 6.
Site Remediation (Site Code) COC Concentration Goal
BORAX-I Burial Ground (BORAX-02) Cs-137 95% UCL—1,817 pCi/g 16.7 pCi/g
Sr-90 95% UCL—2.0 pCi/g 10.8 pCi/g
U-235 95% UCL—68.6 pCi/g 13.2 pCi/g
BORAX Ditch (BORAX-08) Cs-137 Maximum—2,130 pCi/g 16.7 pCi/g
Radioactive Soil Contamination at Cs-137 Maximum—14,600 pCi/g 16.7 pCi/g EBR-I (EBR-15)
BORAX = Boiling-Water Reactor Experiment COC = contaminant of concern EBR = Experimental Breeder Reactor UCL = upper confidence limit
The Comprehensive Remedial Investigation/Feasibility Study for Waste Area Groups 6 and 10 Operable Unit 10-04 (DOE-ID 2001) was incorporated into OU 10-04 in accordance with the FFA/CO (DOE-ID 1991). The OU 10-04 RI/FS (DOE-ID 2001) evaluated 50 potential release sites, including 22 sites at WAG 6 (14 at EBR-I and eight at the BORAX area). Other than limited actions consisting of institutional controls, all remedial actions have been completed at the WAG 6 sites.
9-1

The CERCLA sites at WAG 6 are illustrated in Figure 9-1. Except for the active septic system that supports the EBR-I National Historic Landmark, most of the tanks and inactive septic systems have been removed from the EBR-I area. The radionuclide-contaminated soil outside of the EBR-I building was removed in 1995.
The CERCLA sites related to BORAX include underground storage tanks, septic systems, a leach pond, a ditch, a trash dump, and two former reactor sites. Other than fences, none of the aboveground structures related to BORAX remain, and all of the tanks and septic systems have been removed. The BORAX leach pond was filled with clean dirt in 1985, and the radionuclide-contaminated soil in the BORAX ditch was removed in 1995. All of the waste material was removed from the BORAX trash dump in 1985. The BORAX-I, BORAX-II, BORAX-III, and BORAX-IV reactor fuels and vessel components were dispositioned by Argonne National Laboratory-West (ANL-W) personnel at the completion of each respective experiment. At the completion of the BORAX-V experiments, all of the reactor fuel and portions of the internal reactor were removed by ANL-W personnel for dispositioning. Later, several phases of D&D removed the BORAX-V aboveground facility structures, stabilized the remaining underground structures, filled the basement with soil, and replaced concrete foundation blocks over the basement. The radionuclide-contaminated soil related to the BORAX-I reactor was remediated in 1997 (DOE-ID 1997) under the Record of Decision Stationary Low-Power Reactor-1 and Boiling Water Reactor Experiment-I Burial Grounds (Operable Units 5-05 and 6-01), and 10 No Action Sites (Operable Units 5-01, 5-03, 5-04, and 5-11) (INEL 1996a), and an engineered barrier cap was placed over the former reactor site.
Two RODs have been prepared for remediation activities within WAG 6. The first ROD, issued in January 1996, focused on remediation of BORAX-02. The Record of Decision Stationary Low-Power Reactor-1 and Boiling Water Reactor Experiment-I Burial Grounds (Operable Units 5-05 and 6-01), and 10 No Action Sites (Operable Units 5-01, 5-03, 5-04, and 5-11) (INEL 1996a) required the consolidation of contaminated materials at the site of the original BORAX-I reactor burial ground and construction of a human intrusion barrier over the site (Figure 9-2). The Record of Decision Experimental Breeder Reactor-I/Boiling Water Reactor Experiment Area and Miscellaneous Sites, Operable Units 6-05 and 10-04 (DOE-ID 2002) provided for implementation of institutional controls at selected no-further-action sites at WAG 6. In addition, a 1995 CERCLA non-time-critical removal action addressed radionuclide-contaminated soil under OU 10-06 at the EBR-15 site and the BORAX-08 ditch (Figure 9-3), as outlined in the Engineering Evaluation/Cost Analysis for Operable Unit 10-06 Radionuclide-Contaminated Soils Removal Action at the Idaho National Engineering Laboratory (INEL 1995a).
Table 9-2 provides a chronology of the WAG 6 remedial action events.
9.1 Remedial Actions
As stated previously, two RODs have been prepared for contaminated sites within WAG 6, and one non-time-critical removal action has been performed. Based on these activities, remedial actions were conducted at three individual sites with institutional controls being required at two of the three sites. In addition to these two sites, institutional controls have been identified for three additional WAG 6 sites. Details of the remedial actions are described in the following subsections.
9-2

Figure 9-1. Waste Area Group 6 CERCLA sites.
9-3

9-4

BORAX-02
Legend CERCLA Site Roads Fences
0 100 200 300 50 Feet
Project: BORAX CERCLA Sites Map Requestor: Rich Wells GIS Analyst: Dan Mahnami Date Drawn: 4/22/2005 Disclaimer: Contact the SAL at 526-3529 for
information about the data shown on this map.
Path: X:\gis_projects\borax\cercla_sites File Name: BORAX_02-ap_v1.mxd Control Number: SALAM001170
Figure 9-2. BORAX-02 burial ground.
9-5

BORAX-08
Adams Blvd.
EBR-15
BORAX
EBR-I
Legend CERCLA Site Roads Fences
0 200 400 600 100 Feet
Project: BORAX/EBR-I CERCLA Sites Map Requestor: Rich Wells GIS Analyst: Dan Mahnami Date Drawn: 4/22/2005 Disclaimer: Contact the SAL at 526-3529 for
information about the data shown on this map.
Path: X:\gis_projects\borax\cercla_sites File Name: BORAX_08_EBR_15-ap_v1.mxd Control Number: SALAM001171
Figure 9-3. BORAX-08 and EBR-15.
9-6

Table 9-2. Chronology of Waste Area Group 6 events.
Event Date
Construction of EBR-I was completed. 1951
Operation of the EBR-I reactor began. August 24, 1951
The first electricity from nuclear power was generated at EBR-I. December 20, 1951
The EBR-I scientists proved the breeder reactor concept. 1953
Construction of BORAX-I was completed. 1953
BORAX-I was intentionally destroyed. July 1954
Construction of BORAX-II was completed. 1954
Operation of the BORAX-II reactor began. October 19, 1954
BORAX-II operation was shut down. March 1955
Operation of the BORAX-III reactor began. June 9, 1955
BORAX-III became the first reactor to provide electricity to a city (i.e., Arco, Idaho). July 17, 1955
BORAX-III was shut down. 1956
Operation of the BORAX-IV reactor began. December 3, 1956
BORAX-IV was shut down. June 1958
Operation of the BORAX-V reactor began. February 9, 1962
ERB-I operations ceased. December 30, 1963
BORAX-V was shut down. September 1964
EBR-I was dedicated as a Registered National Historic Landmark. August 26, 1966
EBR-I was dedicated as a National Historic Mechanical Engineering Landmark. 1979
EBR-I was dedicated as a Historic Landmark for Advances in Materials Technology. 1979
The BORAX leach pond was backfilled with clean dirt. 1985
EBR-I was dedicated as a Nuclear Historic Landmark. 1987
The Remedial Investigation/Feasibility Study Report for Operable Units 5-05 and 6-01 (SL-1 and BORAX-I Burial Grounds) (INEL 1995b) was completed.
March 1995
The Engineering Evaluation/Cost Analysis for Operable Unit 10-06 Radionuclide-Contaminated Soils Removal Action at the Idaho National Engineering Laboratory (INEL 1995a) was completed.
June 1995
The non-time-critical removal action fieldwork at BORAX-08 was completed. September 18, 1995
The Record of Decision Stationary Low-Power Reactor-1 and Boiling Water Reactor Experiment-I Burial Grounds (Operable Units 5-05 and 6-01), and 10 No Action Sites (Operable Units 5-01, 5-03, 5-04, and 5-11) (INEL 1996a) was completed.
January 1996
The Stationary Low Power Reactor-1 and Boiling Water Reactor Experiment-I Burial Grounds Engineered Barriers Remedial Design/Remedial Action Scope of Work, Operable Units 5-05 and 6-01 (INEL 1996b) was completed.
March 1996
The Stationary Low-Power Reactor-1 and Boiling Water Reactor Experiment-I Burial Grounds Engineered Barriers Remedial Design/Remedial Action Work Plan, Operable Unit 5-05/6-01 (DOE-ID 1996) was completed.
April 1996
9-7
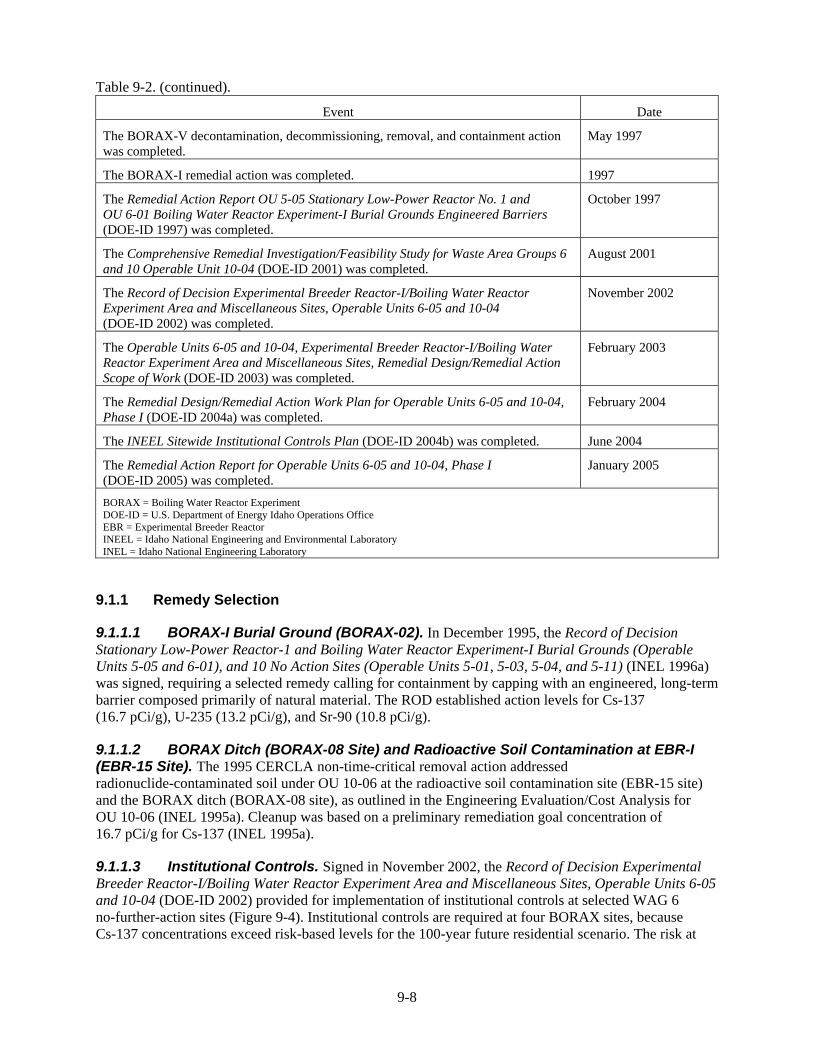
Table 9-2. (continued).
Event Date
The BORAX-V decontamination, decommissioning, removal, and containment action was completed.
May 1997
The BORAX-I remedial action was completed. 1997
The Remedial Action Report OU 5-05 Stationary Low-Power Reactor No. 1 and OU 6-01 Boiling Water Reactor Experiment-I Burial Grounds Engineered Barriers (DOE-ID 1997) was completed.
October 1997
The Comprehensive Remedial Investigation/Feasibility Study for Waste Area Groups 6 and 10 Operable Unit 10-04 (DOE-ID 2001) was completed.
August 2001
The Record of Decision Experimental Breeder Reactor-I/Boiling Water Reactor Experiment Area and Miscellaneous Sites, Operable Units 6-05 and 10-04 (DOE-ID 2002) was completed.
November 2002
The Operable Units 6-05 and 10-04, Experimental Breeder Reactor-I/Boiling Water Reactor Experiment Area and Miscellaneous Sites, Remedial Design/Remedial Action Scope of Work (DOE-ID 2003) was completed.
February 2003
The Remedial Design/Remedial Action Work Plan for Operable Units 6-05 and 10-04, Phase I (DOE-ID 2004a) was completed.
February 2004
The INEEL Sitewide Institutional Controls Plan (DOE-ID 2004b) was completed. June 2004
The Remedial Action Report for Operable Units 6-05 and 10-04, Phase I (DOE-ID 2005) was completed.
January 2005
BORAX = Boiling Water Reactor Experiment DOE-ID = U.S. Department of Energy Idaho Operations Office EBR = Experimental Breeder Reactor INEEL = Idaho National Engineering and Environmental Laboratory INEL = Idaho National Engineering Laboratory
9.1.1 Remedy Selection
9.1.1.1 BORAX-I Burial Ground (BORAX-02). In December 1995, the Record of Decision Stationary Low-Power Reactor-1 and Boiling Water Reactor Experiment-I Burial Grounds (Operable Units 5-05 and 6-01), and 10 No Action Sites (Operable Units 5-01, 5-03, 5-04, and 5-11) (INEL 1996a) was signed, requiring a selected remedy calling for containment by capping with an engineered, long-term barrier composed primarily of natural material. The ROD established action levels for Cs-137 (16.7 pCi/g), U-235 (13.2 pCi/g), and Sr-90 (10.8 pCi/g).
9.1.1.2 BORAX Ditch (BORAX-08 Site) and Radioactive Soil Contamination at EBR-I (EBR-15 Site). The 1995 CERCLA non-time-critical removal action addressed radionuclide-contaminated soil under OU 10-06 at the radioactive soil contamination site (EBR-15 site) and the BORAX ditch (BORAX-08 site), as outlined in the Engineering Evaluation/Cost Analysis for OU 10-06 (INEL 1995a). Cleanup was based on a preliminary remediation goal concentration of 16.7 pCi/g for Cs-137 (INEL 1995a).
9.1.1.3 Institutional Controls. Signed in November 2002, the Record of Decision Experimental Breeder Reactor-I/Boiling Water Reactor Experiment Area and Miscellaneous Sites, Operable Units 6-05 and 10-04 (DOE-ID 2002) provided for implementation of institutional controls at selected WAG 6 no-further-action sites (Figure 9-4). Institutional controls are required at four BORAX sites, because Cs-137 concentrations exceed risk-based levels for the 100-year future residential scenario. The risk at
9-8

the EBR-08 site is attributed to the presence of diesel. A brief description of the objectives of the institutional controls for each of the WAG 6 sites is provided below:
• BORAX-II through BORAX-V Leach Pond (BORAX-01 Site)—Prevent exposure to contaminated soil, and control land use as industrial until discontinued based on the results of a five-year review.
• BORAX-I Burial Ground (BORAX-02 Site)—Maintain the integrity of the containment barrier. Establish visible access restrictions, and control drilling and excavation.
• BORAX Ditch (BORAX-08 Site)—Prevent exposure to contaminated soil, and control land use as industrial until discontinued based on the results of a five-year review.
• BORAX-II through BORAX-V (BORAX-09 Site)—Maintain the integrity of the containment barrier. Establish visible access restrictions, and control drilling and excavation.
• EBR-01 Fuel Oil Tank (EBR-08 Site)—Prevent exposure to contaminated soil. Establish visible access restrictions, and control drilling and excavation.
The ROD (DOE-ID 2002) also mandated development of a comprehensive approach for establishing, implementing, enforcing, and monitoring institutional controls at CERCLA sites in accordance with EPA Region 10 policy (EPA 1999).
In accordance with the requirements delineated in the Remedial Design/Remedial Action Work Plan for Operable Units 6-05 and 10-04, Phase I (DOE-ID 2004a), institutional controls were implemented at the five sites listed in 2004. The results from the OU 10-04 Phase I activities are documented in the Remedial Action Report for Operable Units 6-05 and 10-04, Phase I (DOE-ID 2005).
9.1.2 Remedial Action Objectives
9.1.2.1 BORAX-I Burial Ground (BORAX-02 Site). Results of the remedial investigation and baseline risk assessment indicated that exposure to penetrating radiation from contaminated soils and materials within the burial ground presented the most significant future risk to human health. Therefore, the primary RAOs and the focus of the remedial action alternative development were to inhibit exposure to radioactive materials. The RAOs established for protection of human health were as follows:
• Inhibit exposure to radioactive materials that would result in a total excess cancer risk (for all contaminants) of greater than 1 in 10,000 to 1 in 1,000,000 (1E-04 to 1E-06)
• Inhibit ingestion of radioactive materials that would result in a total excess cancer risk (for all contaminants) of greater than 1 in 10,000 to 1 in 1,000,000 (1E-04 to 1E-06)
• Inhibit inhalation of suspended radioactive materials that would result in a total excess cancer risk (for all contaminants) of greater than 1 in 10,000 to 1 in 1,000,000 (1E-04 to 1E-06)
• Inhibit degradation of the burial ground that could result in exposure of buried waste or migration of contaminants to the surface that would pose a total excess cancer risk (for all contaminants) of greater than 1 in 10,000 to 1 in 1,000,000 (1E-04 to 1E-06).
9-9

Figure 9-4. Waste Area Group 6 institutional control sites.
9-10

The RAO for protection of the environment focuses on preservation of the local ecology by inhibiting the potential for contaminant migration. The RAO established for protection of the environment was to inhibit adverse effects to resident species from exposure to contaminants at the burial ground.
9.1.2.2 BORAX Ditch (BORAX-08 Site) and Radioactive Soil Contamination at EBR-I (EBR-15 Site). The RAOs for these sites were based on the results of the human health and ecological baseline risk assessments and were specific to the COCs and exposure pathways identified for the sites. The RAOs for protecting the environment were not required for the radioactive soil contamination at EBR-I, because the area was found to be protective of the environment. The recommended RAOs are presented in Table 9-3.
Table 9-3. Remedial action objectives for the non-time-critical removal action.
Site Environmental Media RAO
BORAX-08 Soil Prevent direct exposure to radiation posing excess cancer risk levels of 1E-04.
Prevent adverse effects to resident populations (as determined by the ecological risk assessment) from soil or air containing COCs from the BORAX ditch.
Limit release of metals from the site by migration caused by infiltrating precipitation.
Prevent erosion that might result in the release of contaminated soils.
Limit biotic intrusion into contaminated ditch soils that could facilitate erosion or the release of contaminated soil.
Groundwater Prevent ingestion of groundwater in excess of maximum contaminant levels and a total cancer risk of 1E-04 for metals only.
EBR-15 Soil Prevent direct exposure to radiation posing excess cancer risk levels of 1E-04.
Groundwater Prevent ingestion of groundwater posing excess cancer risk levels of 1E-04 to 1E-06.
Food crops Prevent ingestion of contaminated food crops posing excess cancer risks of 1E-04 (Areas B, 7, 8, 9, 11a, and 11b).
BORAX = Boiling Water Reactor Experiment COC = contaminant of concern EBR = Experimental Breeder Reactor RAO = remedial action objective
9.1.3 Remedy Implementation
9.1.3.1 BORAX-I Burial Ground (BORAX-02 Site). The remedial action for the burial ground was done in accordance with the requirements delineated in the Stationary Low-Power Reactor-1 and Boiling Water Reactor Experiment-I Burial Grounds Engineered Barriers Project Remedial Design/Remedial Action Work Plan, Operable Unit 5-05/6-01 (DOE-ID 1996). The remedial action began in July 1996 with the removal of all shrubs, roots, signs, fencing, and other debris from the contaminated
9-11

area for consolidation on top of the original 100- × 100-ft burial ground. Soil areas with radionuclide contamination exceeding the action levels were excavated to a depth of 1 ft and placed over the original burial ground in 6-in. lifts. A human intrusion barrier consisting of basalt riprap was constructed over the consolidated soils. A chain-link fence was installed around the burial ground with “Keep Out” and CERCLA identification signs, and two granite monuments were installed to warn potential future intruders. Results of the remedial action are documented in the Remedial Action Report OU 5-05 Stationary Low-Power Reactor No. 1 and OU 6-01 Boiling Water Reactor Experiment-I Burial Grounds Engineered Barriers (DOE-ID 1997).
9.1.3.2 BORAX Ditch (BORAX-08 Site) and Radioactive Soil Contamination at EBR-I (EBR-15 Site). The total volume of soil excavated from the EBR-15 site was 1,280 yd3 with an average excavation depth of 12.5 in. The radionuclide-contaminated soil was transported in covered dump trucks to the RTC (formerly the TRA) warm waste pond for disposal. The total volume excavated from the BORAX-08 site was 1,180 yd3, focusing on Cs-137 as the COC with a preliminary remediation goal of 16.7 pCi/g. Again, the radionuclide-contaminated soil was disposed of in the RTC warm waste pond.
9.2 Data Evaluation
9.2.1 Site Inspections
Operations, maintenance, and institutional control inspections are conducted annually at WAG 6 sites. The following paragraphs summarize the results of annual inspections conducted at WAG 6 within the timeframe of this five-year review.
Inspections of institutional controls were required within 6 months of the ROD being signed and were completed in March 2003 (INEEL 2003). No deficiencies were identified during the 2003 inspection; however, all five sites were posted with “Environmentally Controlled Area” signs, which needed to be replaced with the standardized institutional controls sign. Signs were replaced during the spring of 2004. Institutional control inspections were conducted again in June 2004 (DOE-ID 2004c). Visible access restrictions, activity control, and land-use restrictions were evaluated, and no deficiencies were identified.
Operations and maintenance activities at WAG 6 consist of annual inspections of the BORAX-02 site for evidence of intrusion, settling, erosion, and, at the perimeter of the covers, radioactive contaminant migration. Annual inspections showed that the engineered covers are functioning as designed with no sign of erosion, subsidence, or animal intrusion.
9.2.2 BORAX-I Burial Ground (BORAX-02 Site)
The Cs-137 analytical results for the excavated areas had a mean of 1.43 pCi/g with a 95% UCL of 7.2 pCi/g based on a gamma distribution of the data. Only one of the zones requiring excavation exceeded the remediation goal for U-235 with a concentration of 15 pCi/g. After excavation, the maximum concentration was 8.2 pCi/g. The Sr-90 concentrations for the excavated areas ranged from 0.9 to 85 pCi/g with an average of 12.4 pCi/g and a median of 1.3 pCi/g. The 95% Chebyshev UCL for the Sr-90 data set is 52.2 pCi/g, which exceeds the remediation goal. The data set is largely skewed because of the single high data point of 85 pCi/g. If this point is omitted from consideration, the minimum remains 0.9 pCi/g with a maximum of 8.1 pCi/g, an average of 3.35 pCi/g, and a median of 1.25 pCi/g. The 95% Chebyshev UCL for this modified data set is 8.23 pCi/g, which is within the specified remediation goal.
9-12

9.2.3 BORAX Ditch (BORAX-08 Site)
Based on the verification sampling data provided in the Comprehensive Remedial Investigation/Feasibility Study for Waste Area Groups 6 and 10 Operable Unit 10-04 (DOE-ID 2001), the residual Cs-137 concentrations at the BORAX-08 site ranged from 0.1 to 8.1 pCi/g with an average concentration of 1.2 pCi/g and a 95% UCL concentration of 2.75 pCi/g based on a gamma distribution for the data set. Based on the revised preliminary remediation goals as provided by the EPA and presented in Appendix A, the Cs-137 concentration required for free release is 5.97 pCi/g. Therefore, institutional controls should no longer be required at BORAX-08.
9.3 Progress since Last Review
The BORAX-I burial ground (BORAX-02 site) is the only WAG 6 site to previously undergo a five-year review, which was conducted by the EPA (EPA 2001). The 1998 annual inspection report identified localized areas of potential contamination that were observed during the radiological survey of the area. Potential contamination of the burial ground was addressed in the WAG 10 RI/FS (DOE-ID 2001), which did not confirm the potential contamination identified in the 1998 annual inspection report. The review showed that based on the most recent annual inspection, the engineered barrier appeared to be intact with no visible evidence of subsidence or erosion. There was no indication that weeds or shrubs were encroaching onto the engineered barrier and no indication of other biointrusion. The revegetated area showed no indication of soil movement or erosion, and the grass appeared to be well established. Results of radiological surveys were consistent with those obtained historically after the remedial action. The EPA staff visually inspected the site on July 16, 2001, and observations were consistent with the annual report.
9.3.1 Issues Identified during the First Five-Year Review
The first five-year review report noted that according to the June 2001 annual inspection, the CERCLA sign at the BORAX-02 site needed to be updated to correctly state the existing dimensions of the perimeter fence. It was recommended that the next review for the site be coordinated with the next statutory Sitewide five-year review. It was also noted that the observation of contamination at the burial ground so soon after completion of the remedial action was cause for concern, but there was no indication of failure of the engineered barrier. The early appearance of contamination, the proximity of exposed surface contamination areas, and the fact that the radiological surveys were similar from year to year suggested windblown cross contamination as a likely source of the observed contamination.
9.3.2 Response Actions to Issues Identified during the First Five-Year Review
The only issue identified in the first five-year review requiring attention was to replace the CERCLA sign with an updated version. As part of the OU 6-05 and 10-04 Phase I remedial action, the CERCLA sign was replaced to comply with the current specifications in the INEEL Sitewide Institutional Controls Plan (DOE-ID 2004b). That action was documented in the Remedial Action Report for Operable Units 6-05 and 10-04, Phase I (DOE-ID 2005).
It was also determined that the residual risk associated with the site needed to be addressed, although it was not required as a result of the first five-year review of the burial ground (BORAX-02 site) remedial action. As discussed in the 2002 annual inspection report, BORAX-02 was assessed for the nature and extent of the radiological contamination that remain outside the engineered barrier at the site. Upon review of the available data, the data from the 1998 Global Positioning Radiometric Scanner survey were selected for use in the risk assessment. The Cs-137 data were corrected for the shielding provided by the 6-in. gravel layer and for radioactive decay to May 2002. Historical data were used to establish ratios
9-13

of Sr-90 and U-235 to Cs-137 in order to estimate the concentrations of the two isotopes. Based on this approach, the average Cs-137, U-235, and Sr-90 concentrations for the site using exposure point concentrations for nine discrete areas were 51.56 pCi/g, 2.98 pCi/g, and 12.57 pCi/g, respectively.
The assessment was performed using two methods, the RESidual RADioactivity (RESRAD) modeling and the standard baseline risk assessment methodology presented in the OU 10-04 RI/FS (DOE-ID 2001). The results of the assessment showed that the dose to current and future receptors is acceptable at the BORAX-02 site, although two areas of contamination might exceed risk-based concentrations (1E-04). This risk, however, is considered acceptable based on the uncertainties associated with the analysis and combined with the understanding that the residual Cs-137 activity at the site will decay to acceptable risk levels in approximately 130 years.
9.4 Technical Assessment
Question A: Is the remedy functioning as intended by the decision documents?
The Cs-137 and U-235 confirmation sample results for the BORAX-02 site remediated under OU 6-01 were within the specified remediation goals, but the Sr-90 results are questionable because of the single high result. The site does not pose an unacceptable risk to human health or the environment, given the results of the risk assessment performed in 2002 to address residual contamination at the site (EDF-2208). Disregarding the single high result for SR-90, the 95% UCL for Sr-90 was 8.23 pCi/g, which is within the remediation goal of 10.8 pCi/g. The engineered cover is intended to provide shielding from ionizing radiation, prevent human intrusion, and contain the contaminated surface soils. The annual inspections validated the structural integrity of the cover. Based on this five-year review, the remedy and protective measures implemented at the BORAX-I burial ground (BORAX-02 site) are functioning as intended.
The OU 6-05 ROD (DOE-ID 2002) required implementation of institutional controls at five sites. Based on this five-year review, the institutional controls are in place and functioning as required.
The non-time-critical removal actions completed at the EBR-15 and BORAX-08 sites were successful in removing contaminated soil that exceeded the prescribed remediation goals. For the two sites, the 95% UCL for the residual Cs-137 contamination was 3.17 pCi/g and 2.75 pCi/g, respectively, as compared to the remediation goal of 16.7 pCi/g. Based on these concentrations, the remediation of the two sites was successful.
Question B: Are the exposure assumptions, toxicity data, cleanup levels, and remedial action objectives used at the time of the remedy selection still valid?
None of the COCs has undergone any major revision in the toxicological criteria since the development of the final remediation goals that would decrease these goals. In fact, based on the EPA guidance of 2001 as presented in Appendix A, the Cs-137 remediation goals have increased. Therefore, once met, the final remediation goals (site-specific, risk-based cleanup levels) will remain protective of human health and the environment under current exposure scenarios.
The original assumptions, cleanup levels, and RAOs used at the time of the remedy selection are still valid.
9-14

Question C: Has any other information come to light that could call into question the protectiveness of the remedy?
No new information that would call into question the protectiveness of the implemented remedies has surfaced while compiling and reviewing the inspections, radiological survey, and confirmation sampling analytical data.
9.5 Technical Assessment Summary
Remedial actions have been completed at the BORAX-I burial ground, the BORAX ditch, and the radioactive soil contamination area at EBR-I. Based on the available data, the remedial actions at the sites were successful, and the remedies are functioning as intended. The exposure assumptions, toxicity data, cleanup levels, and RAOs used at the time of the remedy selections are still valid, and no new information has come to light that could call into question the protectiveness of the remedies. In addition to the remediation of these three sites, institutional controls have been implemented and are functioning as required at five sites within WAG 6.
9.6 Issues
No issues were identified during the five-year review of the remedial actions conducted at WAG 6. For a list of issues identified within all WAGs during the INL Sitewide five-year review in 2005, see Table C-1 in Appendix C.
9.7 Recommendations and Follow-up Actions
The annual inspections and reports of institutional controls should be continued in accordance with the 1999 EPA “Region 10 Final Policy on the Use of Institutional Controls at Federal Facilities” (EPA 1999), as outlined in the INEEL Sitewide Institutional Controls Plan (DOE-ID 2004b). Radiological surveys at the BORAX-I burial ground should be continued to ensure that contamination levels are at or below those observed historically. If any changes are identified that would call into question the integrity of the engineered barrier at the burial ground, a new baseline survey should be completed to identify the impact of the changes. Based on the preliminary remediation goals provided by the EPA (see Appendix A), institutional controls are no longer required at BORAX-08.
9.8 Protectiveness Statement
The remedies completed at WAG 6 are functioning as intended. The physical conditions of the site have not changed in ways that would affect the protectiveness of the completed remedies, nor have the toxicity or risk factors changed in ways that would adversely impact the levels of COCs. There is no information that would call into question the protectiveness of the remedies performed.
9.9 Section 9 References
DOE-ID, 1991, Federal Facility Agreement and Consent Order for the Idaho National Engineering Laboratory, Administrative Docket No. 1088-06-29-120, U.S. Department of Energy Idaho Operations Office; U.S. Environmental Protection Agency, Region 10; Idaho Department of Health and Welfare, December 4, 1991.
9-15

DOE-ID, 1996, Stationary Low-Power Reactor-1 and Boiling Water Reactor Experiment-I Burial Grounds Engineered Barriers Project Remedial Design/Remedial Action Work Plan, Operable Unit 5-05/6-01, DOE/ID-10532, Rev. 0, U.S. Department of Energy Idaho Operations Office, April 1996.
DOE-ID, 1997, Remedial Action Report OU 5-05 Stationary Low-Power Reactor No. 1 and OU 6-01 Boiling Water Reactor Experiment-I Burial Grounds Engineered Barriers, DOE/ID-10591, Rev. 0, U.S. Department of Energy Idaho Operations Office, October 1997.
DOE-ID, 2001, Comprehensive Remedial Investigation/Feasibility Study for Waste Area Groups 6 and 10 Operable Unit 10-04, DOE/ID-10807, Rev. 0, U.S. Department of Energy Idaho Operations Office, August 2001.
DOE-ID, 2002, Record of Decision Experimental Breeder Reactor-I/Boiling Water Reactor Experiment Area and Miscellaneous Sites, Operable Units 6-05 and 10-04, DOE/ID-10980, Rev. 0, U.S. Department of Energy Idaho Operations Office, November 2002.
DOE-ID, 2003, Operable Units 6-05 and 10-04, Experimental Breeder Reactor-I/Boiling Water Reactor Experiment Area and Miscellaneous Sites, Remedial Design/Remedial Action Scope of Work, DOE/ID-11035, Rev. 0, U.S. Department of Energy Idaho Operations Office, February 2003.
DOE-ID, 2004a, Remedial Design/Remedial Action Work Plan for Operable Units 6-05 and 10-04, Phase I, DOE/ID-11101, Rev. 0, U.S. Department of Energy Idaho Operations Office, February 2004.
DOE-ID, 2004b, INEEL Sitewide Institutional Controls Plan, DOE/ID-11042, Rev. 1, U.S. Department of Energy Idaho Operations Office, June 2004.
DOE-ID, 2004c, INEEL Sitewide Institutional Controls Annual Report – FY 2004, DOE/NE-ID-11180, Rev. 0, U.S. Department of Energy Idaho Operations Office, September 2004.
DOE-ID, 2005, Remedial Action Report for Operable Units 6-05 and 10-04, Phase I, DOE/NE-ID-11186, Rev. 0, U.S. Department of Energy Idaho Operations Office, January 2005.
EDF-2208, 2002, “Risk Assessment for the Residual Radiological Contamination at the BORAX I Reactor Burial Site, CERCLA Site BORAX-02, OU 6-01,” Rev. 1, Idaho National Engineering and Environmental Laboratory, December 2002.
EPA, 1999, “Region 10 Final Policy on the Use of Institutional Controls at Federal Facilities,” Office of Environmental Cleanup, Office of Waste and Chemicals Management, and Office of Regional Counsel, U.S. Environmental Protection Agency, Seattle, Washington, September 2000.
EPA, 2001, “Idaho National Engineering Laboratory SL-1/BORAX-I Burial Grounds Remedial Action Review,” Document No. 24742, U.S. Environmental Protection Agency Region 10, August 17, 2001.
INEEL, 2003, Institutional Controls Status Report for Waste Area Groups 6 and 10, INEEL/EXT-03-00199, Rev. 0, Idaho National Engineering and Environmental Laboratory, April 2003.
9-16

INEL, 1995a, Engineering Evaluation/Cost Analysis for Operable Unit 10-06 Radionuclide-Contaminated Soils Removal Action at the Idaho National Engineering Laboratory, INEL-95/0259, Rev. 0, Idaho National Engineering Laboratory, June 1995.
INEL, 1995b, Remedial Investigation/Feasibility Study Report for Operable Units 5-05 and 6-01 (SL-I and BORAX-I Burial Grounds), INEL-95/0027, Rev. 0, Idaho National Engineering Laboratory, March 1995.
INEL, 1996a, Record of Decision Stationary Low-Power Reactor-1 and Boiling Water Reactor Experiment-I Burial Grounds (Operable Units 5-05 and 6-01), and 10 No Action Sites (Operable Units 5-01, 5-03, 5-04, and 5-11), INEL-95/0282, Rev. 0, Idaho National Engineering Laboratory, January 1996.
INEL, 1996b, Stationary Low Power Reactor-1 and Boiling Water Reactor Experiment-I Burial Grounds Engineered Barriers Remedial Design/Remedial Action Scope of Work, Operable Units 5-05 and 6-01, INEL-95/0456, Rev. 0, Idaho National Engineering Laboratory, March 1996.
9-17

9-18

10. WASTE AREA GROUP 7 (RADIOACTIVE WASTE MANAGEMENT COMPLEX)
Since it began operations in the 1950s, the RWMC has been used to dispose of hazardous and radioactive waste. The RWMC occupies about 177 acres and is divided into three areas: the SDA, the Transuranic Storage Area, and the administration and operations area. This five-year review of the RWMC addresses only cleanup sites within the SDA, which consists of a series of pits and trenches designed for disposal of mixed hazardous substances, including organic waste (e.g., carbon tetrachloride [CCl4]) and radioactive waste (e.g., transuranic [TRU] waste). The SDA was used to dispose of TRU waste from 1952 to 1970. Disposal of mixed waste was discontinued in 1983.
To facilitate the cleanup of the RWMC, it was designated as WAG 7 under the FFA/CO (DOE-ID 1991). Final remedial actions are being implemented at two OUs within the SDA: OU 7-08 (which consists of organic contamination in the vadose zone [OCVZ]) and OU 7-12 (which consists of Pad A). In addition, an interim action that is subject to a five-year review is being implemented at OU 7-10 (which consists of Pit 9). Figure 10-1 shows the locations of these OUs.
10.1 Operable Unit 7-08 (Organic Contamination in the Vadose Zone)
From 1954 to 1970, drums of radioactive and organic waste from the Rocky Flats Plant in Colorado were buried in the SDA. Many of these containers have since breached, releasing VOCs to the vadose zone, which is the 580-ft-thick unsaturated zone that lies beneath the earth’s surface but above the SRPA. These VOCs are primarily in the form of organic vapors that have migrated from the buried waste.
Cleanup of the OCVZ at the SDA is being addressed under OU 7-08. This remedial action is proceeding in accordance with the Record of Decision Declaration for Organic Contamination in the Vadose Zone, Operable Unit 7-08, Idaho National Engineering Laboratory, Radioactive Waste Management Area, Subsurface Disposal Area (DOE-ID 1994a). Table 10-1 shows the COCs and cleanup goals for the OCVZ.
The OU 7-08 ROD (DOE-ID 1994a) lists CCl4, PCE, TCE, and 1,1,1-TCA as COCs but only lists a cleanup goal for CCl4, because successful treatment of CCl4 will also reduce the other COCs. The original estimated volume of CCl4 buried in the SDA was 325,000 lb, but that estimate was revised to 1,800,000 lb in the spring of 2001 based on additional information obtained from the Rocky Flats Plant.
CCl4 has been detected in the SDA surficial sediments, vadose zone soil gas, vadose zone soil water (perched water and lysimeters), and the SRPA beneath and surrounding the SDA. Through the use of surface isolation flux chambers, CCl4 vapor has been detected emanating from the soil surface. In 1987, CCl4 was also detected in the SRPA above MCLs.
Since 1996, treatment units have been used to destroy contaminants in vapor extracted from various wells in the vadose zone. Early units used recuperative flameless thermal oxidation (RFTO) to destroy VOCs. Newer OCVZ units utilize catalytic oxidation. Monitoring indicates that concentrations of VOCs are decreasing throughout the vadose zone.
Table 10-2 provides a chronology of significant events at OU 7-08.
10-1

10-2
Figure 10-1. Location of Operable Unit 7-08 (organic contamination in the vadose zone units), Operable Unit 7-10 (Pit 9), and Operable Unit 7-12 (Pad A) at the Radioactive Waste Management Complex.

Table 10-1. Contaminants of concern at Operable Unit 7-08.
Site COCs Cleanup Goalsa
OCVZ Carbon tetrachloride (CCl4) 30 to 200 ppm by vapor
PCE NAa
TCE NAa
1,1,1-TCA NAa
a. The OU 7-08 ROD (DOE-ID 1994a) does not specify cleanup goals for PCE, TCE, or 1,1,1-TCA, because these contaminants will be reduced by virtue of CCl4 treatment. Cleanup goals are being revised and will be published in Revision 2 of the Data Quality Objectives Summary Report for Operable Unit 7-08 Post-Record of Decision Sampling (INEEL 2002).
COC = contaminant of concern DOE-ID = U.S. Department of Energy Idaho Operations Office INEEL = Idaho National Engineering and Environmental Laboratory NA = not applicable OCVZ = organic contamination in the vadose zone OU = operable unit PCE = tetrachloroethene ppm = parts per million ROD = Record of Decision TCA = trichloroethane TCE = trichloroethene
Table 10-2. Chronology of Operable Unit 7-08 events.
Event Date
The RWMC was established. 1950
The TRU waste was buried at the SDA. Associated with the TRU waste were large quantities of VOCs.
1952–1970
A shallow gas survey identified VOCs in the subsurface. 1987
CCl4 was detected above the MCL in the SRPA south of the SDA. 1987
The INL Site received its final listing on the National Priorities List (54 FR 29820). November 21, 1991
The FFA/CO for the INL Site was signed (DOE-ID 1991). December 9, 1991
Subsurface vapor samples from monitoring wells at the RWMC revealed the extent and concentration of contaminants in the subsurface.
July 1992–March 1993
The remedial action and feasibility study was completed for OCVZ. 1993
The OU 7-08 ROD (DOE-ID 1994a) was signed. December 2, 1994
The prefinal inspection of the RFTO units was completed. December 1995
The baseline subsurface vapor sampling was completed. January 4, 1996
RFTO Units A, B, and C were started. January 1996
The first failure of RFTO Unit C occurred. The unit was rebuilt. September 1998
The final failure of RFTO Unit C occurred. May 14, 2000
The inventory of VOCs was revised upward. 2001
Catalytic oxidation Unit D replaced RFTO Unit C. July 2001
10-3

Table 10-2. (continued).
Event Date
Unit D began continuous operation. January 2002
The first five-year review of the OCVZ remedy was completed. August 18, 2003
Unit B was replaced with catalytic oxidation Unit F. March 2004
Unit A was replaced with catalytic oxidation Unit E. April 2004
Unit E was relocated. March 2005 DOE-ID = U.S. Department of Energy Idaho Operations Office FFA/CO = Federal Facility Agreement and Consent Order FR = Federal Register INL = Idaho National Laboratory MCL = maximum contaminant level OCVZ = organic contamination in the vadose zone OU = operable unit RFTO = recuperative flameless thermal oxidation ROD = Record of Decision RWMC = Radioactive Waste Management Complex SDA = Subsurface Disposal Area SRPA = Snake River Plain Aquifer TRU = transuranic VOC = volatile organic compound
10.1.1 Remedial Actions
10.1.1.1 Remedy Selection. The OU 7-08 ROD (DOE-ID 1994a) summarized the site assessment and identified the selected remedy—i.e., extraction from and destruction of organic contaminants in the vadose zone beneath and in the immediate vicinity of the RWMC where organic contaminants exist in a vapor state. The selected remedy does not include the waste remaining in the disposal pits. The selected remedy that is specified in the OU 7-08 ROD also includes monitoring of the vadose zone vapor and the SRPA.
The general objective of the selected remedy was to reduce the risks posed to human health and the environment from organic contaminants in the vadose zone and to prevent federal and state drinking water standards from being exceeded after the 100-year institutional control period, as defined in DOE Manual 435.1-1, “Radioactive Waste Management Manual.”
The OU 7-08 ROD (DOE-ID 1994a) stated that the major components of the selected remedy would include the following:
• Installing and operating five vapor extraction wells (in addition to an existing vapor extraction well) at the RWMC as part of a first-phase effort to extract organic contaminant vapors from the vadose zone. The selected remedy includes options to expand the number of vapor extraction wells for potential second and third phases. Additional system modifications will be evaluated with each transition phase.
• Installing and operating off-gas treatment systems to destroy the organic contaminants in the vapor that is removed from the extraction wells. Off-gas treatment will be in the form of catalytic oxidation or an equally effective organic contaminant destruction technology.
• The addition of soil vapor monitoring wells to monitor the performance of the vapor extraction wells and verify the attainment of RAOs. Soil vapor monitoring will also provide information to evaluate potential modifications to the selected remedy to continue beyond the first phase. The
10-4

expected duration of the first phase is approximately 2 years; potential second and third phases would operate for approximately 2 years each. The actual duration of each phase is dependent on elements such as equipment procurement and installation that may be involved with each potential phase transition.
• The maintenance of institutional controls, which includes using signs, restricting access, maintaining fences/barriers, and monitoring the existing production well supplying water to workers at the RWMC. It is presumed that this level of institutional control will be maintained at the RWMC through the year 2091.
The OU 7-08 ROD (DOE-ID 1994a) also stated that organic waste remaining in the pits could extend the time needed to achieve RAOs using the selected remedy, because the remaining organic waste could act as a “long-term” source of OCVZ. Once the remedy was implemented, it became apparent that the “phases” would last more than 2 years, because the remedy does not include removal or treatment of the buried waste. Removal or treatment of the remaining buried organic waste, which is the long-term source of the contamination, could reduce the time needed to reach remediation goals using the current OCVZ system. In 2004, the Accelerated Retrieval Project (Figure 10-1) began limited excavation and retrieval of selected waste streams from a designated area in the SDA—a 1/2-acre plot in the eastern portion of the SDA’s Pit 4. The OCVZ Project, though not directly affiliated with the Accelerated Retrieval Project, will benefit by the reduction of the organic source term in the SDA.
10.1.1.2 Remedial Action Objectives. The OU 7-08 ROD (DOE-ID 1994a) concluded that extraction and destruction of organic vapors from the vadose zone beneath the SDA would reduce direct exposure to the contaminants. Although the OU 7-08 ROD specifies cleanup goals for vapor in the vadose zone and does not specifically address cleanup of the SRPA, the objective of this remedial action is to prevent the migration of contaminants to the SRPA and keep them below federal and state MCLs after a 100-year period. The MCLs for the various organic compounds are the preliminary remediation goals for protection of the SRPA, which will be addressed in the OU 7-14 ROD. The OCVZ remedial action ensures protection of human health and the environment. The decision to implement this remedial action was based on the results of human-health and ecological-risk assessments.
10.1.1.3 Remedy Implementation. To implement the selected remedy described in the OU 7-08 ROD (DOE-ID 1994a), three RFTO units were installed within the SDA (Wilkening 2003). Operation of the RFTO units began in 1996. Units A and B were designed to extract and treat vapors from two wells each. Unit C was designed to extract and treat vapors from one well. During the spring of 2001, Unit C was decommissioned and removed from the SDA. Unit D—an electrically heated catalytic oxidizer—was installed at the previous Unit C location, began operating in July 2001, and was brought up to full-scale operation in March 2002. In February 2003, Unit B was decommissioned followed by Unit A in late September 2003. Units E and F, both electrically heated catalytic oxidizers, replaced Units A and B and became operational during the spring of 2004. On January 6, 2004, Unit F was started for testing and began full-scale operation on March 15, 2004. Unit E was started for testing on March 23, 2004, and began full-scale operation on April 6, 2004.
In 2000 and 2001, four wells were installed inside the SDA to support OU 7-08. These wells include a groundwater monitoring well, M17S, and three vapor extraction wells: DE1 (~480 ft bls), 7E (~110 ft bls), and 6E (~110 ft bls). Well DE1 also provides vapor monitoring.
Fourteen new wells were installed during 2002 and 2003 to support the OU 7-08 remedial action. These wells were completed as vapor extraction wells or as a combination of monitoring and extraction wells. The locations of the wells are shown in Figure 10-2. They were installed in clusters of three wells, one well having a shallow extraction (SE) interval located above the B-C interbed (i.e., ~110 ft bls),
10-5
one well having an intermediate extraction (IE) interval located between the B-C interbed (i.e., ~110 ft bls) and the C-D interbed (i.e., ~240 ft bls), and one well having a deep extraction (DE) interval located below the C-D interbed (i.e., ~240 ft bls). The new wells—SE3, IE3, DE3, IE4, DE4, SE6, IE6, DE6, SE7, IE7, DE7, SE8, IE8, and DE8—were installed in five distinct locations based primarily on proximity to buried organic waste.
Vapor sampling occurs at 174 monitoring ports (Figure 10-2). Monthly sampling is conducted at 141 of these monitoring ports, and all 174 monitoring ports are sampled quarterly. Vapor is being extracted from the vadose zone at the SDA and treated at 20 extraction wells. Table 10-3 shows the contaminants removed from the vadose zone as of the end of 2004.
10.1.2 Data Evaluation
As mentioned above, the OU 7-08 ROD (DOE-ID 1994a) addresses cleanup of the vadose zone rather than contaminants in the SRPA. However, the ROD does require groundwater sampling, because such sampling indicates the effectiveness of the OCVZ Project in containing and removing contamination before it reaches the SRPA.
Data from a number of monitoring wells in the RWMC area were reviewed for VOC concentrations in groundwater. CCl4 is the most common VOC detected in the groundwater samples over the past 5 years with consistent positive detections in approximately half of the monitoring wells in the monitoring network. Several wells are currently near or above the MCL of 5 µg/L; these wells include M7S, M16S, A11A31, and the RWMC production well. Detections of other VOC contaminants in the monitoring wells are much less frequent with occasional detections of TCE (in the RWMC production well at 0.3 µg/L in 2003) and methylene chloride (in the M1S well in 2002 and in the associated blank). All positive detections of these contaminants were well below their respective MCLs. Aquifer water samples collected at the RWMC are analyzed for other VOCs in addition to CCl4, PCE, and methylene chloride; most of the samples were nondetections in FY 2003. Chloroform, TCE, toluene, and 1,1,1-TCA were the only compounds detected at concentrations above the quantitation limit (WAG 7) or minimum reporting level (USGS). All compounds were below the respective MCLs. Samples were analyzed for 54 other organic compounds, but none of them was detected above the quantitation limit (WAG 7) or minimum reporting level (USGS).
Figure 10-3 shows the concentration history of CCl4 in aquifer wells in the vicinity of the RWMC. The following observations can be made by comparing the time trends in the concentration data spatially:
• A few of the wells northeast of the RWMC exhibit a generally persistent increasing concentration trend. These wells are M7S, USGS-87, and the RWMC production well. Since approximately 1997, however, the data indicate a decline in the rate of increase in M7S and the RWMC production well. USGS-90 showed an increasing concentration trend until it was last sampled in April 1999, after which the pump became inoperable. Because USGS-90 has not been sampled since that time, further trends cannot be observed in the well. Data from other wells might also be interpreted as showing increasing concentrations of CCl4 but to a much lesser extent than the wells discussed previously. Wells with possible increasing concentrations include M3S, M15S, and M16S, whose data are either highly variable or of short duration.
• Wells to the southwest generally show flat or decreasing concentration trends. CCl4 is not routinely detected in most of the wells in this area; these wells include M1S, OW-2, USGS-89, USGS-117, and USGS-119. Several other wells, including M6S and USGS-88, show either flat or decreasing trends.
10-6

* W ells Po rt s 3 V -1, 3 V -2 , M 10 S-1 and M 10 S-2 were remo ved and are no lo ng er o p erat io nal
17 7
4 4 8
2 16
3 7 6
6 1
19 7
9 5
3 8 8 3 9 0
3 6 2
4 0 6
3 5 1
2 9 2
2 16 2 16 2 18 2 2 0 2 16
4 4 34 4 1
5 4 0
5 5 7
5 9 1 5 8 1
5 4 8
2 8 3
7 9
4 5 4
7 4 6 6
4 3 9
7 6
9 7
4 8 1
2 6 0 2 5 1
2 19 2 2 32 2 6
9 2
2 2 7
15 0 14 0
19 9 19 8
12 1
5 5 5 5 4 7
5 8 8
5 5 2 5 6 6
5 5 9
19 6 18 9
2 4 0
3 3 3
2 4 0
5 7 0
3 9 6
3 2 0
6 1
19 8
2 3 0
2 0 0
2 3 0 2 2 9 2 3 1
2 0 9
6 97 3
9 7 8 8
5 8 0 5 6 9
2 8
4 6 3 6
4 12
4 7
2 7
4 4 3
3 7 5
15 7
12 8 12 8
14 7
16 6
8 7
16 9
14 7
4 5 5
4 9 0
4 5 5
5 0 5
13 3 13 8
18 7
4 4 0
4 0 5
2 2 1 2 3 0
2 5 5
12 7
15 5 14 5
19 0
2 5 1
4 3 2
3 0 2 2 9 5
8 5
4 3 5 0
6 3
9 7
5 3
3 0 2
12 3
5 9
9 1 7 9
6 7
8 8 8 1
9 3
4 7
6 7
5 3
7 57 7
3 5 7 3 6 73 6 6
3 6 0
7 5
3 19
3 3 5
9 2
6 56 9
10 8
4 9
12 5 13 5
6 8
3 3
3 4 3
3 9
6 3 5 7
4 3 3 73 5
4 3
8 5 7 8
111 10 1
3 5
13 4 0 13 6
10 3
2 9 5
18 3
16 8
13 3
18 1
12 3
7 77 4
12 5
7 77 77 1
6 4
13 1
2 3 1
0
100
200
300
400
500
600
WW
W1
77-1
78
-4D
O2
8801
8902
9301
9302
US
GS
118
VV
E1
M1S
VV
E3
M3S
VV
E4
M4D
VV
E6
M6S
VV
E7
M7S
VV
E10
M10
SM
10S
-R1E 2E 3E 4E 5E 1V 2V 3V 4V 5V 6V 7V 8V 9V 10
VO
CV
Z11
M11
SO
CV
Z13
M13
SO
CV
Z14
M14
SM
15S
M16
SM
17S
1898
DE
1IE
3D
E3
IE4
DE
4IE
6D
E6
IE7
DE
7IE
8D
E8
RW
MC
200
4
Dep
th (
ft
Port 1? Port 2? Port 3? Port 4? Port 5? Port 6? Port 7? Port 8?
Figure 10-2. Location and depth of vapor sampling ports in and around the Subsurface Disposal Area.
10-7

Table 10-3. Breakdown by operating cycle of the mass of contaminants removed to date. Operating
Period Year CHCl3
(lb) TCA (lb)
PCE (lb)
TCE (lb)
CCl4 (lb)
Total (lb)
1st 8 weeks 1996 1,001 277 183 855 4,447 6,763
% of total 15% 4% 3% 13% 66%
2nd 8 weeks 1996 671 209 168 646 3,090 4,784
% of total 14% 4% 4% 14% 65%
3rd 8 weeks 1996 501 149 104 449 2,211 3,413
% of total 15% 4% 3% 13% 65%
1st quarter 1997 443 108 62 320 1,938 2,871
% of total 15% 4% 2% 11% 68%
2nd quarter 1997 1,078 360 294 1,076 5,191 7,999
% of total 13% 5% 4% 13% 65%
3rd quarter 1997 643 119 145 604 2,800 4,311
% of total 15% 3% 3% 14% 65%
4th quarter 1997 1,202 342 241 987 5,391 8,162
% of total 15% 4% 3% 12% 66%
Mid-Year 1998 1,083 339 247 967 4,757 7,393
% of total 15% 5% 3% 13% 64%
End-Year 1998 1,452 376 412 1,537 5,942 9,719
% of total 15% 4% 4% 16% 61%
Mid-Year 1999 745 196 149 808 3,725 5,622
% of total 13% 3% 3% 14% 66%
End-Year 1999 1,149 367 320 1,337 5,492 8,664
% of total 13% 4% 4% 15% 63%
Mid-Year 2000 1,125 302 272 1,252 5,119 8,072
% of total 14% 4% 3% 16% 63%
End-Year 2000 630 128 69 567 2,934 4,329
% of total 15% 3% 2% 13% 68%
Mid-Year 2001 1,534 272 326 1,349 6,153 9,634
% of total 16% 3% 3% 14% 64%
End-Year 2001 1,720 513 332 1,849 7,349 11,763
% of total 15% 4% 3% 16% 62%
Mid-Year 2002 2,061 966 517 2,377 7,845 13,767
% of total 15% 7% 4% 17% 57%
End-Year 2002 2,412 1,016 535 2,516 8,477 14,956
% of total 16% 7% 4% 17% 57%
10-8

Table 10-3. (continued). Operating CHCl3 TCA PCE TCE CCl4 Total
Period (lb) (lb) (lb) (lb) (lb) (lb)Year
Mid-Year 2003 2,134 975 603 2,379 8,151 14,242
% of total 15% 7% 4% 17% 57%
End-Year 2003 765 290 164 740 2,388 4,347
% of total 18% 7% 4% 17% 55%
Mid-Year 2004 3,495 1,384 745 3,505 12,356 21,486
% of total 16% 6% 3% 16% 58%
End-Year 2004 3,180 1,230 1,062 3,042 10,919 19,433
% of total 16% 6% 5% 16% 56%
Total 1996–2004 191,730
PCE = tetrachloroethene TCA = trichloroethane TCE = trichloroethene
Wells Not Shown M14S CCl Concentrations in 5 - M11S (ND-0.8) (ND-2)
4 (2000 ft North) - M12S (ND) Groundwater at RWMC - M13S (ND-0.8)
0 87 89 91 93 95 97 99 01 03 05
Groundwater Monitoring Well 5
(1-5) Approximate Range of Measured M7S CCl Concentrations in ug/L (ppb)4 (3-8) CCl Concentration Time History 0
4 87 89 91 93 95 97 99 01 03 05 5
Plot, Scale: 0-8 ppb, 1987-2005 5
0 87 89 91 93 95 97 99 01 03 05 MCL=5 indicated with dashed line
Non-Detect (ND) plotted at 0.21 ppb 0
587 89 91 93 95 97 99 01 03 05 5
0 1000 feet 2000 5 87 0Last updated 3/2/05 by A.J. Sondrup
87 89 91 93 95 97 99 01 03 0587 89 91 93 95 97 99 01 03 05 (1-3) 0
USGS data through 8/04 M16S WAG 7 data through 9/04 M3S 0
87 89 91 93 95 97 99 01 03 05 (3-7)
5(ND-3)
89 RWMC M17S (ND since 1987) 0
(ND-3) (1-7) 87 89 91 93 95 97 99 01 03 05
Last sampled 4/99Pump inoperable 90
5M1S (1-4) (ND since 1992) 117 (ND since 1987) 0M10S 87 89 91 93 95 97 99 01 03 05 M15S
(1-7) (ND-2)
5 119 5
M10S data (ND-0.3) 88 unreliable after 10/95 5
(1-7) 0 0587 89 91 93 95 97 99 01 03 05 87 89 91 93 95 97 99 01 03 05
0
87 89 91 93 95 97 99 01 03 05 M4D (ND since 1992) 0
87 89 91 93 95 97 99 01 03 05 (deep well screen)
M6S (ND-4)
5
0 87 89 91 93 95 97 99 01 03 05
5 120 A11A31 55(1-7) (2500 ft South) OW-2 (3-7)
0 (ND-1) 87 89 91 93 95 97 99 01 03 05 00
87 89 91 93 95 97 99 01 03 05 87 89 91 93 95 97 99 01 03 05
Figure 10-3. CCl4 concentrations in aquifer monitoring wells in the vicinity of the Radioactive Waste Management Complex.
10-9

• The USGS-120 and A11A31 wells—located approximately 4,000 and 5,000 ft south of the RWMC, respectively—require a separate discussion. CCl4 concentrations in USGS-120 were less than 2 ppb from 1987 to 1997. Then, from 1997 to 1999, the concentrations increased slightly above the MCL and remained as such for 2 years. Since 2001, however, the concentrations have decreased and are currently at about 3 ppb. Concentrations in the A11A31 well have regularly been above the MCL since approximately 2001, but results from the last three quarters have been below the MCL. The considerable distance to both of these wells from the RWMC area and the consistent positive detections of CCl4 make estimating the total extent of contamination in the SRPA difficult. Sitewide (i.e., WAG 10) groundwater monitoring conducted has not detected CCl4 in the southern boundary wells (USGS-009, USGS-015, and USGS-109) using standard analysis techniques.
10.1.3 Progress since Last Review
Since the last five-year review (i.e., 2003), additional wells have been installed, the reliability of the treatment units has improved, downtime has been reduced, and data acquisition in deeper zones has improved. In addition, the Operations and Maintenance Plan for the OU 7-08 Organic Contamination in the Vadose Zone Project (INEEL 2004) has been revised, improving the monitoring of exhaust gases.
The mass of total VOCs removed each year increased significantly in 2004 (Figure 10-4) after a period of decommissioning and installation of new units—activities that consumed much of 2003. The VOC concentrations of samples taken from ports on the inlet lines (downstream of the ambient air intake valves) to the OCVZ units were used to calculate mass removal rates. Samples have been taken daily during the normal operations workweek (i.e., Monday through Thursday), and the results are averaged between sampling events. Actual operating hours and average unit operation parameters (i.e., flow rate, pressure, and temperature) were used for the mass removal calculations (EDF-2157). Results show that approximately 192,000 lb of total VOCs has been removed from the SDA during the period from January 1996 through December 2004.
Mass removed per Year
0
5000
10000
15000
20000
25000
30000
35000
40000
45000
1996
1997
1998
1999
2000
2001
2002
2003
2004
Year
Poun
ds r
emov
ed
Figure 10-4. Total mass of volatile organic compounds removed during each year of organic contamination in the vadose zone operation.
10-10
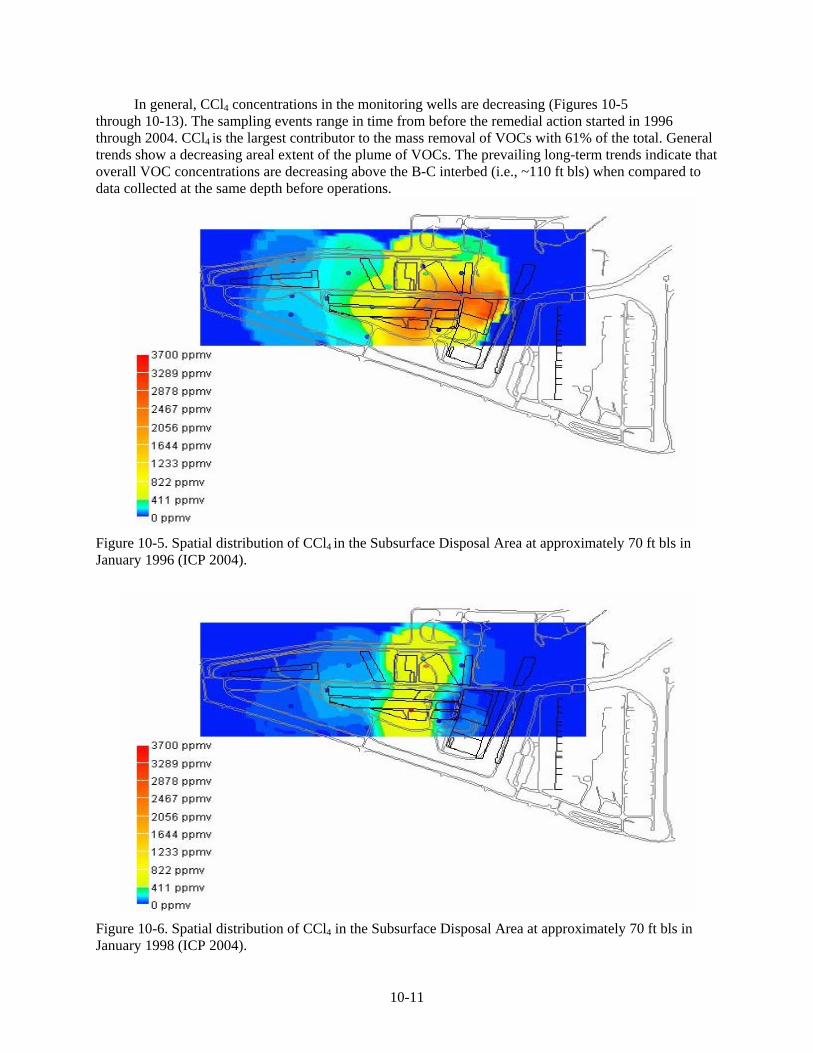
In general, CCl4 concentrations in the monitoring wells are decreasing (Figures 10-5 through 10-13). The sampling events range in time from before the remedial action started in 1996 through 2004. CCl4 is the largest contributor to the mass removal of VOCs with 61% of the total. General trends show a decreasing areal extent of the plume of VOCs. The prevailing long-term trends indicate that overall VOC concentrations are decreasing above the B-C interbed (i.e., ~110 ft bls) when compared to data collected at the same depth before operations.
Figure 10-5. Spatial distribution of CCl4 in the Subsurface Disposal Area at approximately 70 ft bls in January 1996 (ICP 2004).
Figure 10-6. Spatial distribution of CCl4 in the Subsurface Disposal Area at approximately 70 ft bls in January 1998 (ICP 2004).
10-11

Figure 10-7. Spatial distribution of CCl4 in the Subsurface Disposal Area at approximately 70 ft bls in January 2000 (ICP 2004).
Figure 10-8. Spatial distribution of CCl4 in the Subsurface Disposal Area at approximately 70 ft bls in January 2002 (ICP 2004).
10-12

Figure 10-9. Spatial distribution of CCl4 in the Subsurface Disposal Area at approximately 70 ft bls in October 2003 (ICP 2004).
Figure 10-10. Spatial distribution of CCl4 in the Subsurface Disposal Area at approximately 70 ft bls in January 2004 (ICP 2004).
10-13

Figure 10-11. Spatial distribution of CCl4 in the Subsurface Disposal Area at approximately 70 ft bls in March 2004 (ICP 2004).
Figure 10-12. Spatial distribution of CCl4 in the Subsurface Disposal Area at approximately 70 ft bls in July 2004 (ICP 2004).
10-14

Figure 10-13. Spatial distribution of CCl4 in the Subsurface Disposal Area at approximately 70 ft bls in September 2004 (ICP 2004).
10.1.4 Technical Assessment
Question A: Is the remedy functioning as intended by the decision documents?
Based on monitoring results, concentrations of contaminants are decreasing in the vast majority of the vadose zone monitoring points, especially above the B-C interbed (i.e., ~110 ft bls), where most of the extraction has occurred. Reductions in concentrations have been most steady in areas located away from source zones. Groundwater monitoring currently indicates two of 20 wells in the RWMC area (M7S and the RWMC production well) are above the MCLs for CCl4. Some of the wells continue to show a slightly increasing trend in CCl4 concentrations, while others indicate a flat or decreasing trend. The total extent of CCl4 contamination in the SRPA downgradient of the RWMC is unknown. Although not remediated under the OU 7-08 ROD (DOE-ID 1994a), groundwater will be further investigated in the OU 7-13/14 comprehensive ROD and is important in evaluating the effectiveness of OCVZ extraction and treatment. The impacts of OCVZ operations were not expected to be manifest in the groundwater for several years, but continued extraction under the OCVZ Project is anticipated to result in declining groundwater concentrations.
Institutional controls, such as controlled access and fencing, are in place and remain effective, based on periodic inspections and monitoring of the site.
Question B: Are the exposure assumptions, toxicity data, cleanup levels, and remedial action objectives used at the time of the remedy selection still valid?
There have been no changes in the physical conditions of the site that would affect the protectiveness of the remedy. There have been no changes in the RAOs found in the decision document and no new standards affecting the protectiveness of the remedy.
10-15

Question C: Has any other information come to light that could call into question the protectiveness of the remedy?
No.
10.1.5 Technical Assessment Summary
Issues that were discussed in the 2003 five-year review of OCVZ have been resolved favorably. The reliability of the OCVZ system has been greatly improved by replacing aging equipment. New extraction wells are in place to support the treatment units. Monitoring below the 240-ft interbed has been improved, as has the monitoring of exhaust gases. Based on monitoring results, concentrations of contaminants are decreasing in the vast majority of vadose zone monitoring points. Reductions in concentration have been most steady in areas located away from source zones. In addition, the source of the organic contaminants is being removed under separate remedial actions—i.e., plans call for most of the organics in Pit 4 to be removed. Removal of the source loading will have a positive impact on the conditions in the vadose zone below the SDA, as will the improved performance of the OCVZ treatment units.
Groundwater monitoring currently indicates that CCl4 concentrations in two of the wells in the RWMC area are above the MCLs. Several of the wells show an increase in CCl4 concentrations, but the rate of increase is slowing. Several other wells show a flat or decreasing trend in CCl4 concentrations. Groundwater will be further investigated in the OU 7-14 comprehensive ROD and is not remediated under the OU 7-08 ROD (DOE-ID 1994a), but recognizing contaminant detections above MCLs is important. It is also important to note that impacts from OCVZ operations, especially the focus on shallow extraction, were not anticipated to influence groundwater for several years. However, continued OCVZ operations are expected to result in a reduction of groundwater concentrations to less than MCLs.
10.1.6 Issues
There are no outstanding issues related to the OCVZ remedial activity. The operation of the OCVZ units and associated monitoring will continue for the foreseeable future.
10.1.7 Recommendations and Follow-up Actions
Recommendations are to continue OCVZ system operation and perform associated monitoring.
10.1.8 Protectiveness Statement
The OCVZ remedy is functioning as the OU 7-08 ROD intended (DOE-ID 1994a). Current monitoring data indicate that the remedy is functioning as required to achieve current cleanup goals. The long-term effectiveness of the remedy will be verified by monitoring of VOCs in the vadose zone and in groundwater within and outside of the SDA boundary. Monitoring will continue for the foreseeable future.
10.2 Operable Unit 7-10 (Pit 9)
Covering an area of about 1 acre, Pit 9 is one of 10 pits (and 58 trenches) in the SDA where TRU waste, mixed waste, and other radioactive waste from the Rocky Flats Plant and other waste generators were disposed of between November 1967 and June 1969. During that period, drums and boxes of waste were dumped into the pit using trucks or bulldozers, and cranes were used to place large
10-16

items in the pit. The waste was then covered with soil after weekly or daily operations, depending on procedure requirements at the time of disposal.
In accordance with the Action Plan attached to the FFA/CO (DOE-ID 1991), OU 7-10 consists of the Pit 9 process demonstration interim action. In 1993, the Record of Decision Declaration for Pit 9 at the Radioactive Waste Management Complex Subsurface Disposal Area at the Idaho National Engineering Laboratory was signed (DOE-ID 1993). The Pit 9 ROD specifies that OU 7-10 will be subject to a five-year review with the effectiveness of the Pit 9 interim action as a final action to be evaluated in OU 7-13 (i.e., the TRU-contaminated pits and trenches RI/FS).a The associated Remedial Design/Remedial Action Scope of Work and Remedial Design Work Plan: Operable Unit 7-10 (Pit 9 Project Interim Action) (EG&G 1993) documented the schedule and approach for implementation of the ROD; the DOE management and operating contractor subcontracted with Lockheed Martin Advanced Environmental Systems (LMAES) to perform the Pit 9 scope of work.
The Pit 9 scope of work was modified in Revision 1 of the associated Remedial Design/Remedial Action Scope of Work and Remedial Design Work Plan: Operable Unit 7-10 (Pit 9 Project Interim Action) (INEL 1995) to address details for design, construction, and operation approaches. This resulted in significant changes in cost estimates for the Pit 9 ROD (DOE-ID 1993), which in turn required issuance of the 1995 Explanation of Significant Differences to the Pit 9 Interim Action Record of Decision at the Radioactive Waste Management Complex at the Idaho National Engineering Laboratory (DOE-ID 1995).
LMAES designed and then began construction of a retrieval facility and TRU waste processing building. However, in response to missed milestones by LMAES, the DOE-ID prepared a contingency plan to address the possibility that LMAES might not fulfill the terms of the Pit 9 scope of work (EG&G 1993). That contingency plan developed into the staged interim action approach formalized in Revision 2 of the Remedial Design/Remedial Action Scope of Work and Remedial Design Work Plan: Operable Unit 7-10 (Pit 9 Project Interim Action) (INEL 1997). It identified performance objectives, milestones, and deliverables in the event that the LMAES contract was not completed. The LMAES contract was subsequently terminated, and work began on the OU 7-10 Staged Interim Action Project. The uncompleted LMAES retrieval and processing structures remain at the Pit 9 site and are planned for future decommissioning.
The Explanation of Significant Differences for the Pit 9 Interim Action Record of Decision at the Radioactive Waste Management Complex at the Idaho National Engineering and Environmental Laboratory (DOE-ID 1998) formalized adoption of a three-stage approach to satisfy requirements of the ROD and officially launched the OU 7-10 Staged Interim Action Project. The three stages of the OU 7-10 Staged Interim Action Project are as follows (INEL 1997, Appendix A):
• Stage I—Subsurface exploration of Pit 9 to support site selection for Stage II.
• Stage II—Retrieval of a selected area of Pit 9, including a waste retrieval demonstration, characterization of waste zone material and soil, and storage of retrieved waste zone material. Stage II also included design and construction, waste examination and packaging, and facility disposition.
• Stage III—Overall remediation of Pit 9 using information from Stage II.
a. The OU 7-13 TRU pits and trenches RI/FS was subsequently combined with the OU 7-14 WAG 7 comprehensive RI/FS into the OU 7-13/14 WAG 7 comprehensive RI/FS.
10-17

The purpose of the Stage I subsurface exploration was to obtain data from a portion of Pit 9 to support Stage II site selection for the limited excavation and retrieval of buried TRU waste. To meet the objectives of Stage I, a 40- × 40-ft study area was selected based on a review of inventory records of the pit and the results of noninvasive radiological and geophysical surveys of the pit. Subsurface exploration of this area included installation of tipped steel casings to allow probing by downhole data-logging instruments and subsequent coring to obtain samples for analysis and bench-scale treatability studies. The subsurface geophysical and radiation-detection logging in the cased probe holes was completed. Stage I objectives were effectively met with the selection of the location for the Stage II demonstration retrieval area.b
Requirements that applied to all three stages of the OU 7-10 Staged Interim Action Project were identified in the OU 7-10 Staged Interim Action Project System Requirements Document (LMITCO 1998), while the technical and functional requirements (TFRs) document—“Technical and Functional Requirements for the OU 7-10 Glovebox Excavator Method Project” (TFR-2527)—defined the Stage II scope and activities. TFR-2527 became the technical baseline used to develop the design for Stage II. The 90% design for Stage II was submitted to the agencies on June 15, 2000, as part of the Remedial Design/Remedial Action Scope of Work and Remedial Design Work Plan: Operable Unit 7-10 (Pit 9 Project Interim Action) (INEL 1997).
While the Stage II design met all technical requirements, the associated schedule did not meet the enforceable deadline for completion of the remedial action report. The DOE requested a schedule extension under the FFA/CO (DOE-ID 1991), but the request was denied by the agencies, resulting in a formal dispute in accordance with the provisions of the FFA/CO. As part of the dispute-resolution process, alternate concepts to demonstrate retrieval were developed. The alternate concepts focused on using simpler methods and shortening the overall duration of the retrieval demonstration. In some cases, the overall project objectives had to be modified from those of the original Stage II mission. The resulting concepts were documented in the Waste Area Group 7 Analysis of OU 7-10 Stage II Modifications (INEEL 2001). The concept selected was the glovebox excavator method (Figure 10-14). Through an agreement to resolve disputes (ARD) (DOE-ID 2002a), the agencies formally adopted the glovebox excavator method for accomplishing the Stage II mission and established new enforceable milestones for implementation of the Pit 9 Process Demonstration, including the future commencement of operations for Stage III. The Remedial Design Package for the OU 7-10 Glovebox Excavator Method Project (DOE-ID 2002b) was submitted to the agencies on October 1, 2002, and finally established the design requirements for implementing and completing Stage II through the glovebox excavator method. The agencies agreed to extend the remedial design and commence the Stage III construction milestone to March 31, 2008, in the Agreement to Extend Deadlines (DOE-ID 2004a).
Table 10-4 provides a chronology of significant events at OU 7-10.
10.2.1 Remedy Selection
Remedial action operations and maintenance activities for implementing Stage II of the OU 7-10 interim action included overburden removal, waste retrieval, underburden sampling, waste-drum storage, data collection and analysis, maintenance, and facility monitoring.
Overburden removal began on December 12, 2003. Waste zone retrieval operations began on January 5, 2004. On February 24, 2004, the DOE-ID notified the DEQ and the EPA of the completion of waste retrieval for the project.
b. OU 7-10 Stage I Subsurface Exploration and Treatability Studies Report (Draft) - Initial Probing Campaign (December 1999–June 2000), INEEL/EXT-2000-00403, Idaho National Engineering and Environmental Laboratory, July 2000
10-18

Figure 10-14. Site plan of the Operable Unit 7-10 Glovebox Excavator Method Project.
Table 10-4. Chronology of Operable Unit 7-10 events.
Event Date
The RWMC was established. 1950
Rocky Flats Plant and INL Site waste materials were disposed of in Pit 9. November 1967–June 1969
The Pit 9 Interim Action ROD (DOE-ID 1993) was signed by the agencies. October 1993
The 1995 ESD (DOE-ID 1995) was issued. January 1995
The Revised Pit 9 Scope of Work (INEL 1997) was issued. The revision included October 1997 a contingency for a staged interim action approach if the LMAES contract was not completed.
The LMAES subcontract for Pit 9 remediation was terminated. June 1998
The 1998 ESD (DOE-ID 1998) was issued. The ESD adopted the three-stage September 1998 approach to implement the Pit 9 interim action ROD.
The OU 7-10 Staged Interim Action Project System Requirement Document October 1998 (LMITCO 1998) was issued.
The OU 7-10 interim action project, Stage II RD/RA work plana was submitted June 2000 to the agencies.
The OU 7-10 Stage I Subsurface Exploration and Treatability Studies Report July 2000 (Draft)b was completed.
10-19

Table 10-4. (continued).
Event Date
The Waste Area Group 7 Analysis of OU 7-10 Stage II Modifications (INEEL 2001) was completed. The analysis recommends adopting the glovebox excavator method as an improved approach for a Stage II retrieval demonstration.
October 2001
The ARD (DOE-ID 2002a) was signed by the agencies. The ARD formally adopts the glovebox excavator method as the approach to complete Stage II.
April 2002
The Remedial Design Package for the OU 7-10 Glovebox Excavator Method Project (DOE-ID 2002b) and the Remedial Design Supplemental Package for the OU 7-10 Glovebox Excavator Method Project (DOE-ID 2002c) were submitted.
October 2002
The construction and installation of process equipment were completed on the Glovebox Excavator Method Project facility.
May 2003
The agency prefinal inspection for the glovebox excavator method was completed.
November 2003
Retrieval of buried waste in Pit 9 was initiated. January 2004
The Stage II/glovebox excavator method waste retrieval demonstration operations were completed. The design volume of 75 yd3 of buried waste was retrieved.
February 2004
The agency final inspection for the glovebox excavator method was completed. May 2004
The agreement to extend deadlines was signed by the EPA, DEQ, and DOE to memorialize that the Accelerated Retrieval Project met the Stage III 10% design milestone and to extend the completion date of the remedial design and commence the Stage III construction milestone until March 31, 2008 (DOE-ID 2004a).
June 2004
The Remedial Action Report for the OU 7-10 Glovebox Excavator Method Project (DOE-ID 2004b) was completed.
November 2004
The Action Memorandum for Accelerated Retrieval of a Described Area within Pit 4 (DOE-ID 2004c) was signed. Implementation of the Accelerated Retrieval Project non-time critical removal action in Pit 4 will meet the 10% design milestone for Stage III activities in Pit 9.
August 2004
Construction of the Accelerated Retrieval Project facility at Pit 4 was completed. September 2004 a. Binder A-I Remedial Design/Remedial Action Work Plan for Stage II of the Operable Unit 7-10 (OU 7-10) Staged Interim Action Project, DOE/ID-10767, Rev. Draft, U.S. Department of Energy Idaho Operations Office, June 2000 b. OU 7-10 Stage I Subsurface Exploration and Treatability Studies Report (Draft) - Initial Probing Campaign (December 1999–June 2000), INEEL/EXT-2000-00403, Idaho National Engineering and Environmental Laboratory, July 2000.
ARD = agreement to resolve disputes DEQ = [Idaho] Department of Environmental Quality DOE = U.S. Department of Energy DOE-ID = U.S. Department of Energy Idaho Operations Office EPA = U.S. Environmental Protection Agency ESD = Explanation of Significant Differences INEEL = Idaho National Engineering and Environmental Laboratory INEL = Idaho National Engineering Laboratory INL = Idaho National Laboratory LMAES = Lockheed Martin Advanced Environmental Systems OU = operable unit ROD = Record of Decision RWMC = Radioactive Waste Management Complex
10-20

During the retrieval effort, excavator operators took scoops of waste zone materials (see Figure 10-15) and placed them in transfer carts at one of three gloveboxes. Glovebox operators moved the transfer carts into the gloveboxes, segregated the waste zone material (see Figure 10-16), separated and measured suspect fissile material, and packaged the waste in appropriate storage containers (i.e., 55-gal drums) in a safe and compliant manner. When operators suspected fissile material in the waste, the suspect material was placed in a separate bucket and moved to a fissile material monitor for measurement and subsequent placement in an appropriate drum, ensuring that criticality limits were never exceeded. Once the drums were filled, operators changed out drums and transferred them for assay measurement and then to interim storage in Building WMF-628, Type II Storage Module #1. Composite samples were analyzed to support application of hazardous waste numbers. Each drum identification number was entered into the Integrated Waste Tracking System (IWTS).
A total of 454 drums were filled during the retrieval effort, most containing approximately 5 ft3
of waste materials, thus meeting a project objective of removing more than 75 yd3 of material. Waste drums found in the pit had little structural integrity due to corrosion. However, plastic bags and plastic containers had retained much of their integrity. Some bags were more brittle than others, but most were in extremely good condition. It was noted that writing and markings on plastic containers and labels protected by plastic were often still clear and legible. Operators removed six underburden cores from the interface of the waste zone and underburden. Cores contained in Lexan tubes were removed from the core barrel, bagged out of the retrieval confinement structure, and shipped to a laboratory at INTEC for analysis.
The milestone for completion of the Pit 9 Stage III 10% design by September 2005 is being met through the ongoing removal action in Pit 4 of the SDA. In August 2004, the agencies signed an action memorandum to conduct a non-time-critical removal action for limited excavation and retrieval of selected waste streams from a 1/2-acre plot in the eastern portion of Pit 4. The waste in this area is primarily from the Rocky Flats Plant. The area was selected by the DOE, the DEQ, and the EPA based on inventory evaluations identifying significant quantities of TRU and other contaminated waste disposed of in the area. The project is referred to as the Accelerated Retrieval Project.
The focused objective of the non-time-critical removal action is to perform a targeted retrieval of certain Rocky Flats Plant waste streams that are highly contaminated with TRU radionuclides, VOCs, and various isotopes of uranium. Performance of the action will accomplish the following:
• Remove targeted waste streams and associated contaminants from a portion of the SDA
• Reduce the overall TRU, VOC, and uranium inventory buried within the SDA
• Establish the administrative process for certifying and transferring the resulting retrieved TRU waste streams to the Waste Isolation Pilot Plant in New Mexico
• Provide information to support remedial work at the RWMC as defined by future CERCLA removal action documentation or the OU 7-13/14 ROD.
The agencies also are proposing a second phase non-time-critical removal action in the remaining portions of Pit 4. The agreement to extend deadlines (DOE-ID 2004a) provides an enforceable milestone to complete the remedial design for Stage III and commence construction no later than March 31, 2008, and to begin operations within the following 36 months. The enforceable deadline for submittal of a draft OU 7-13/14 ROD is December 31, 2007.
10-21

Figure 10-15. The glovebox excavator retrieving waste from Pit 9.
Figure 10-16. Glovebox excavator operators segregating waste retrieved from Pit 9.
10-22

10.2.2 Data Evaluation
Data collected during the Glovebox Excavator Method Project are presented in the Remedial Action Report for the OU 7-10 Glovebox Excavator Method Project (DOE-ID 2004b). A brief summary of environmental and waste management-related data is included in the following subsections. The data primarily include analyses of stack air emissions, radiological assay and solids sampling of retrieved waste, and sampling of underburden soils. This information will support the design efforts for future waste retrieval operations in the SDA and has been factored into the design planning for the Accelerated Retrieval Project. The data obtained from completion of Stage II provide information relevant to predicting impacts from future retrieval operations as they pertain to occupational exposures, waste classifications for disposition, and air emissions estimates.
Biased and composite sampling of waste zone material (i.e., soil and waste solids) was performed in the designated excavation area of Pit 9. The composite waste zone sampling process required the collection of small incremental subsamples from each cart used to fill each drum in a five-drum campaign. Subsamples from all carts used to fill five drums were composited into one sample representing the five-drum campaign. The sampling strategy was designed to provide a very accurate estimate of the population mean, because every drum contributes to the estimate by contributing to a five-drum composite.
Sample analysis results provided the basis for determining the upper 90% confidence limit (UCL90) of the mean concentration of the contaminants listed in the DQOs. As stated in Section 2.1.4 of the Field Sampling Plan for the OU 7-10 Glovebox Excavator Method Project (Salomon et al. 2003), the boundary of this characterization was the physical contents of the newly packaged drum population being characterized. Material type was limited to nondebris waste because, for the analyses required by the FSP, debris waste would be better characterized using acceptable knowledge and nondestructive analysis. The results from laboratory analyses of the composited waste samples are appropriately applied to only the population of nondebris, soil, and waste-solids drums.
A statistical analysis of the composite sample data was performed. The purpose of the statistical analysis of the data collected is to calculate the UCL90 for the population means and compare that to regulatory thresholds to determine whether hazardous waste codes should be assigned.
The interpretation of the UCL90 is that the project can be 90% confident that the true population mean is less than the UCL90 value computed from the sample mean and standard deviation. If the UCL90 value is less than the regulatory threshold, then the project has demonstrated with at least 90% confidence that the true population mean is less than the regulatory threshold.
The project collected 82 composite samples from the waste zone. The mean concentration, standard deviation, and UCL90 for each contaminant are presented in the following subsections by analysis type.
10.2.2.1 Polychlorinated Biphenyls. The total PCB result of 37 mg/kg is a sum of the UCL90 results for the PCB congeners. The result is below the TSCA (15 USC § 2601 et seq.) regulatory limit of 50 mg/kg. Total PCBs are identified as an underlying hazardous constituent (UHC) for the soil and waste-solids drum population, because the total is greater than 10 mg/kg.
10.2.2.2 Semivolatile Organic Compounds. No hazardous waste codes or UHC codes are applied to the soil and waste-solids drum population based on results of the semivolatile organic compound analysis.
10-23

10.2.2.3 Volatile Organic Compounds. Hazardous Waste Codes D028, D018, D019, D039, D040, and D043 are applied to the soil and waste-solids drum population based on the 1,2-dichloroethane, benzene, CCl4, PCE, TCE, and vinyl chloride analysis results, respectively. The 1,1,1-TCA, 1,1,2,2-PCE, 1,1,2-TCA, 1,1-dichloroethene, carbon disulfide, chlorobenzene, ethylbenzene, methanol, and toluene are identified as UHCs for the soil and waste-solids drum population.
10.2.2.4 Metals. Cadmium, chromium, lead, vanadium, and zinc are identified as UHCs for the soil and waste-solids drum population.
10.2.2.5 Nitrate. Analysis for nitrate was performed for each soil and waste-solids composite sample. No hazardous waste codes or UHCs were identified for the soil and waste-solids drum population.
10.2.2.6 Biased Samples. The project included biased sampling to identify potential drum subpopulations that could pose a safety risk or regulatory issue to the project. Included in this category were drums suspected of containing nitrate-bearing waste (because of their ignitable potential that affects both safety and regulatory issues), uncontainerized liquids potentially containing liquid PCBs, cyanide pellets or other special-case waste, outlier waste, and other unplanned sampling opportunities. During waste examination and packaging operations, four samples were collected from material that might contain nitrate-bearing waste. No uncontainerized liquids, cyanide pellets, or other special-case waste were identified for sampling during excavation. No hazardous waste codes were applied to the at-risk drums based on the biased samples collected.
The biased nitrate sample represents (proportionally) both suspect and nonsuspect material. Nonsuspect material (e.g., soil and other waste) would contribute to the sample in the approximate proportion that they exist compared to the suspect nitrate-bearing material in the cart. Therefore, while the results of the biased sampling are useful to support identification of at-risk (i.e., nitrate) drums, the reported concentrations are only representative of the cart and do not represent the contaminant concentrations of the nitrate-bearing waste or the final concentration of a particular drum.
Biased samples of sludge and biased samples of interstitial soil were collected to support ongoing OU 7-13/14 studies. Results will be presented in final reports for the retrieved waste and soils characterization and the preremedial design testing studies.
10.2.2.7 Volatile Organic Compound Monitoring. Photoionization detector readings were taken from the exhaust duct after the high-efficiency particulate air (HEPA) filters. Readings were taken on an intermittent basis from May 28, 2003, to February 25, 2004 (DOE-ID 2004b).
The SUMMA sampling was performed at various times from the exhaust duct after the HEPA filters (McIlwain 2004). These samples were sent to an off-Site laboratory for analysis. Results of these readings are presented in Figure 10-17 with a comparison to anticipated VOC levels, as documented in EDF-2376, “Estimates of Carbon Tetrachloride Air Concentrations within the OU 7-10 Retrieval Confinement Structure and Packaging Glovebox System during Various Phases of Stage II Retrieval Activities,” and with photo ionization detector readings. The results of the SUMMA grab sample analysis include total measured VOCs and measured CCl4. Measured VOCs were approximately half the anticipated levels over the measurement period.
10-24

0
10
20
30
40
50
60 1/
26/2
004
1/28
/200
4
1/30
/200
4
2/1/
2004
2/3/
2004
2/5/
2004
2/7/
2004
2/9/
2004
2/11
/200
4
2/13
/200
4
2/15
/200
4
2/17
/200
4
2/19
/200
4
2/21
/200
4
2/23
/200
4
Date
Res
ults
(in
ppm
)
Anticipated VOC Emissions
PID Reading
Total Measured VOCs
Measured CCL4
Figure 10-17. Comparison of anticipated volatile organic compound levels with photoionization detector readings and SUMMA canister grab sample analytical results.
10.2.2.8 Radiological Assay. Four hundred fifty-four drums were assayed. Most of them had only a small amount of TRU activity present, primarily from Am-241. Each of the isotopes Pu-238, Pu-239, Pu-240, Pu-241, U-235, U-238, Am-241, Np-237, Na-22, and Cs-137 was detected at least once. The dominant isotopes were Am-241 and Pu-239. The Pu-239 fissile gram equivalent values calculated for the assayed drums were all below 100 g, except for one drum, GEM030438, which calculated to 363 g with the inclusion of the 1-sigma error. Isotopic measurements showed isotopic distribution consistent with weapons-grade plutonium distributions. Sixty drums were found to be TRU waste, based on the assay value for total concentrations. If the 1-sigma error was included, the number of TRU waste drums increases to 193.
10.2.2.9 Underburden Sampling. The core sampling performed was intended to characterize contaminants of interest in the underburden and to support subsequent evaluations of the potential for contaminant migration. Five locations were sampled, and a duplicate core was obtained for one of the locations. Results of the analyses are presented in the Remedial Action Report (DOE-ID 2004b).
Results in the Remedial Action Report (DOE-ID 2004b) confirm that the presumed underburden contains high levels of TRU contaminants with two subsamples exhibiting Pu-239 concentrations greater than 100 nCi/g. Preliminary evaluation of the relative abundance of TRU elements within these subsamples suggests that this contamination most likely resulted from mixing of waste and underburden soil during waste retrieval. Variations in the relative abundance of Pu-239 and Am-241 from subsamples are suggestive of chemical transport processes.
10.2.3 Progress since Last Review
This is the first review of the remedy for OU 7-10. Periodic modifications to the remedy originally described in the 1993 OU 7-10 ROD (DOE-ID 1993) have occurred more often than 5-year intervals, precluding the need to perform a review before now.
10-25

10.2.4 Technical Assessment
Question A: Is the remedy functioning as intended by the decision documents?
The waste retrieval and processing demonstration from the Glovebox Excavator Method Project, as well as activities now under way for the Accelerated Retrieval Project, have shown that TRU waste removal at the SDA is technically viable. Stage III operations for Pit 9 are still in the design phase.
Question B: Are the exposure assumptions, toxicity data, cleanup levels, and remedial action objectives used at the time of the remedy still valid?
The OU 7-10 response action was undertaken as an interim action and a demonstration project. It is anticipated that the final cleanup levels and RAOs will be established either through the Stage III remedial design approval process or through issuance of a future ROD or ROD modification. The final exposure assumptions, toxicity data, cleanup levels, and RAOs for the SDA will be established through the issuance of the OU 7-13/14 ROD.
Question C: Has any other information come to light that could call into question the protectiveness of the remedy?
No.
10.2.5 Technical Assessment Summary
The remedy for OU 7-10 is a buried waste retrieval demonstration that is composed of three principal components. Stage I provided for further investigation of Pit 9 to identify a suitable location to conduct Stage II operations. Stage II provided for limited retrieval of a portion of Pit 9 and collection of data to support future waste retrieval operations at the SDA. Stage III will provide for waste retrieval operations over the remainder of Pit 9. Stage I and II operations have been completed and have successfully demonstrated that retrieval of buried waste at the SDA is technically viable. Remedial design activities for Stage III are under way and are being supported by the Accelerated Retrieval Project removal action in Pit 4.
10.2.6 Issues
Two open questions have been identified during this five-year review of the remedy for OU 7-10. First, the amount of retrieved waste that will require treatment to meet the waste acceptance criteria for the Waste Isolation Pilot Plant is unknown. This uncertainty complicates the ability to develop reliable cost estimates for Stage III operations and to determine compliance approaches for ARARs. Second, the RAOs, the ARARs, and the treatment train identified in the OU 7-10 ROD need to be updated. The original ROD was signed 11 years ago, and several developments since then create a need to update the requirements. These developments include the 1995 and 1998 ESDs (DOE-ID 1995; DOE-ID 1998), the 2002 ARD (DOE-ID 2002a), and the 2004 Agreement to Extend Deadlines (DOE-ID 2004a).
10.2.7 Recommendations and Follow-up Activities
The Accelerated Retrieval Project removal action is fulfilling the requirements in the ARD (DOE-ID 2002a) for a 10% Stage III remedial design by September 2005. Estimates of the amount of retrieved waste that will need to be treated will be obtained from experience gained through the removal actions. Assumptions about waste treatment volumes from the Accelerated Retrieval Project can be included in the 90% Stage III remedial design.
10-26

Significant changes in OU 7-10 ROD implementation have occurred since the LMAES subcontract was terminated; therefore, the RAOs, ARARs, treatment train, and enforceable schedules identified in the ROD have been modified through several subsequent documents. These requirements should be updated and consolidated in a single reference through either the Stage III remedial design process or a future ROD modification.
10.2.8 Protectiveness Statement
Upon completion, the OU 7-10 remedy is expected to be protective of human health and the environment. In the interim, exposure pathways that could result in unacceptable risk are being controlled. The OU 7-10 remedy is being implemented as a demonstration project and is not intended to be the final remedy for the SDA.
The milestone for completion of the Pit 9 Stage III 10% design is being met through the ongoing removal action in Pit 4 (i.e., the Accelerated Retrieval Project). The ARD (DOE-ID 2002a) establishes the milestone for commencement of operations for Stage III of the OU 7-10 demonstration project no later than March 31, 2010. The 2004 agreement to extend deadlines extends the deadline for remedial design and commencing construction until March 31, 2008 (DOE-ID 2004b). The final remedy for the SDA will be determined by the OU 7-13/14 ROD. The draft OU 7-13/14 ROD is scheduled for submittal to the DEQ and EPA no later than December 31, 2007.
10.3 Operable Unit 7-12 (Pad A)
Pad A is an aboveground, earthen-covered disposal site at the SDA where approximately 13,300 yd3 of containerized waste was placed from September 1972 to August 1978. The waste is composed primarily of nitrate salts, depleted uranium waste, and sewer sludge. Typically, the waste exhibited dose rates of less than 200 mR/hr at the surface of each container.
In 1978, Pad A was closed by placing plywood and/or polyethylene over the exposed containers. The waste pile was then covered by a layer of soil with an average thickness of 4 ft, and crested wheat grass was planted in the soil layer. Remediation of Pad A is addressed under OU 7-12 and was accomplished in accordance with the Record of Decision Declaration for Pad A at the Radioactive Waste Management Complex Subsurface Disposal Area at the Idaho National Engineering Laboratory (DOE-ID 1994b).
A risk assessment of Pad A indicated that it posed no current risk to workers or the public. Fate and transport modeling indicated that drinking water standards for nitrates might be exceeded in about 250 years if residents use the groundwater directly adjacent to the Pad A boundary, but the modeling used conservative assumptions to avoid underestimating the risks. Actual nitrate concentrations in groundwater were not expected to exceed drinking water standards at the WAG 7 boundary, thus Pad A was not expected to pose an unacceptable risk to human health or the environment (DOE-ID 1994b).
In 1997, the EPA completed the Two-Year Review Idaho National Engineering Laboratory Subsurface Disposal Area Pad A Operable Unit 7-12 (EPA 1997), which was reviewed by the DEQ. The DEQ certified that the limited action remedy for Pad A was protective of human health and the environment. However, subsidence of the soil cover, the frequency of inspections, and the inability to establish adequate grass cover were issues.
A two-phase limited action was completed in 1995 to prevent contact with waste disposed of at Pad A. Phase I consisted of recontouring the sides of the pad to establish appropriate slopes and grading the top of the pad to achieve a minimum 5% slope. Phase II consisted of installation of suction lysimeters
10-27

and neutron access tubes to provide early detection of potential contaminant releases to the environment. Results of this limited action are presented in the Remedial Action Report Pad A Limited Action Operable Unit 7-12 (Parsons Engineering Science 1995a).
In 2003, the Five-Year Review Report for OU 7-12 (Pad A) Idaho National Engineering and Environmental Laboratory (EPA 2003) was completed by the EPA and reviewed by the DEQ. The EPA determined that the remedy prescribed for Pad A was protective of human health and the environment. The data indicated that the cover was protective, ongoing maintenance and institutional controls precluded prolonged direct contact with Pad A contaminants, and the remedy was functioning as required. However, continued monitoring was recommended. The continued lack of vegetation in some areas was also a concern.
The SDA, including Pad A, is being evaluated in the WAG 7 comprehensive RI/FS. Future decisions about OU 7-13/14 could affect elements of Pad A long-term stewardship. Table 10-5 provides a chronology of significant events at OU 7-12.
Table 10-5. Chronology of significant Operable Unit 7-12 events. Event Date
Pad A was constructed and used to dispose of waste. 1972–1978 Environmental monitoring and investigations were conducted. 1978–1989 The INL Site received its final listing on the National Priorities List (54 FR 29820). November 21, 1991 The FFA/CO (DOE-ID 1991) for the INL Site was signed. December 9, 1991 Public scoping meetings for Pad A were held. December 1991 The Pad A RI/FS was made available to the public. January 1992 The Pad A proposed plan identifying the preferred remedy was presented to the public, and the public comment period began (INEL 1993).
July 1993
The ROD selecting the limited action remedy was signed (DOE-ID 1994b). January 27, 1994 The short-term monitoring plan was approved (Parsons Science Engineering 1995a, Appendix A).
June 1994
The Pad A limited action was completed. May 1995 The Remedial Action Report Pad A Limited Action Operable Unit 7-12 was completed (Parsons Engineering Science 1995a).
July 1995
The Pad A Limited Action Long-Term Monitoring Plan, Operable Unit 7-12 was approved (Parsons Engineering Science 1995b).
August 1995
The two-year review was completed. December 17, 1997 The operations, maintenance, and monitoring plan was revised (Parsons Engineering Science 1995a, Appendix N).
January 2001
The five-year review was completed. September 2003 Post-ROD monitoring is conducted. 1994–2005 The Operations and Maintenance Plan for the Pad A Limited Action Operable Unit 7-12 at the Radioactive Waste Management Complex was revised (Flynn 2005).
June 2005
DOE-ID = U.S. Department of Energy Idaho Operations Office FFA/CO = Federal Facility Agreement and Consent Order FR = Federal Register INEL = Idaho National Engineering Laboratory INL = Idaho National Laboratory RI/FS = remedial investigation/feasibility study ROD = Record of Decision
10-28

10.3.1 Remedial Actions
10.3.1.1 Remedy Selection. In 1994, a ROD was signed for OU 7-12 (DOE-ID 1994b). Later in 1994, the Remedial Design/Remedial Action (RD/RA) Work Plan, Pad A Limited Action Radioactive Waste Management Complex, Operable Unit (OU) 7-12 was signed (INEL 1994). The limited action described in the ROD prescribed that the waste be left in place and included recontouring and slope correction, cover maintenance and monitoring, and institutional controls. Pad A was intended to be a permanent solution where the waste could be reliably controlled in place. Treatment of the principal sources of contamination was not found to be necessary.
Because the remedy resulted in waste remaining onsite, continued maintenance and monitoring of Pad A were required. Maintenance was to include subsidence and erosion control of the Pad A cover. Monitoring also was prescribed to ensure the effectiveness of the existing cover. Groundwater, air, surface water, and soil monitoring were designed to provide early detection of a potential release to the subsurface, groundwater, or surface pathways and ensure that the cover remains effective.
Institutional controls were also to continue in order to protect human health and the environment.
10.3.1.2 Remedial Action Objectives. The focus of the RAOs was to maintain the effectiveness of the soil and grass cover on Pad A in order to prevent direct exposure to the waste and to minimize the potential for contamination to migrate from the waste. Since the last review, however, it was noted that revegetation efforts have not improved the vegetative cover in certain portions of Pad A, but no significant erosion has occurred in these areas. Therefore, the revegetation efforts have been suspended, as agreed upon by the agencies.
The RAOs also included the identification of PRGs that are established based on risk and frequently used standards or ARARs. The selected remedy for Pad A satisfies the criterion of overall protection of human health and the environment by minimizing the risk of potential contaminant migration to groundwater and by preventing direct contact with the Pad A waste materials. No chemical-specific ARARs are identified for the Pad A selected remedy.
10.3.1.3 Remedy Implementation. The Pad A remedy was implemented in two phases. The first phase consisted of recontouring the Pad A slopes, which was done between August and November 1995.
The second phase consisted of installing environmental monitoring equipment. This involved drilling boreholes, which were completed between April and July 1995. The RD/RA Work Plan (INEL 1994) specified that the EPA and DEQ would perform independent reviews of the maintenance and monitoring data within 2 years to ensure that the remedy continued to provide adequate protection of human health and the environment. The prefinal inspection for the first-phase recontouring activities was done on December 9, 1994. Outstanding items from the prefinal inspection were resolved and documented in the RD/RA Work Plan (INEL 1994). The EPA and DEQ determined that all remedial action construction activities, including implementation and monitoring of institutional controls, were performed according to specifications.
The ongoing phase of remedy implementation at Pad A consists of long-term monitoring and maintenance. The Operations and Maintenance Plan for the Pad Limited Action Operable Unit 7-12 at the Radioactive Waste Management Complex (Flynn 2005) has been revised. The primary activities associated with operations and maintenance include the following:
• Inspection and corrective maintenance of the soil cover
• Inspection and corrective maintenance of the rock armoring
10-29

• Monitoring of aquifer wells
• Monitoring of the vegetative cover, soil cover, and rock armor
• Inspection of institutional controls.
10.3.2 Data Evaluation
Seventy lysimeters and perched water wells at WAG 7 are sampled annually and analyzed for radionuclides, nitrate, metals, and VOCs (sample volume permitting). The locations of the lysimeters, perched water wells, and the contaminants detected there are shown in Figure 10-18.
At Pad A, the PA01, PA02, PA03, D06, and TW-1 lysimeter vadose zone wells have been sampled annually.c In addition, the USGS-092 perched water well is monitored for nitrate concentrations, which continue to increase. Figure 10-19 shows the trend for nitrates in Pad A lysimeters (including I4S:DL11) and in USGS-092. Elevated nitrate concentrations are observed in the vicinity of Pad A to depths around 100 ft bls (TW1 and I-4S). The drinking water MCL for nitrate is shown in Figure 10-18 for comparison only.
In addition, monthly operations and maintenance reports since the last review in 2003 indicate occasional small animal intrusions, minor weed growth, and minor subsidence events. One substantial subsidence event was noted on April 5, 2004, on the northeast side of Pad A. The subsidence was approximately three-quarters of the way to the top of the pad and was approximately 3 ft long, 1 ft wide, and 1 ft deep. The subsidence was repaired in accordance with the requirement in the ROD. Pad A still has no growth on the top and the north-northeast side.
Institutional controls at Pad A are monitored as part of the monthly operations and maintenance inspections and annually as part of the Sitewide institutional controls inspection. Institutional controls at Pad A are in place and functioning as intended. In addition, institutional controls are in place and functioning at the SDA, which surrounds the Pad A site.
Since the five-year review in 2003, the annual Pad A inspection report consisted of compiling all of the monthly inspections and submitting them along with a topographical map generated from the FY 2004 survey for agency review. No significant issues have been identified regarding the cap.
10.3.3 Progress since Last Review
In 2003, the Five-Year Review Report for OU 7-12 (Pad A) Idaho National Engineering and Environmental Laboratory (EPA 2003) was completed by the EPA and reviewed by the DEQ. The EPA determined that the remedy at Pad A was protective of human health and the environment. The data indicated that the cover was protective, ongoing maintenance and institutional controls preclude prolonged direct contact with the water, and the remedy is functioning as required to achieve cleanup goals. However, continued monitoring actions were recommended to ensure that concentrations of contaminants in groundwater continue to decrease as anticipated. The continued lack of vegetation in some areas also was an issue of concern as was the status of the Operations and Maintenance Plan and the Institutional Controls Plan.
c. The requirement to monitor preferentially for nitrates annually from the Pad A lysimeters has been eliminated from the revised Pad A Operations and Maintenance Plan based on cumulative risk assessments for OU 7-13/14 (Flynn 2005).
10-30
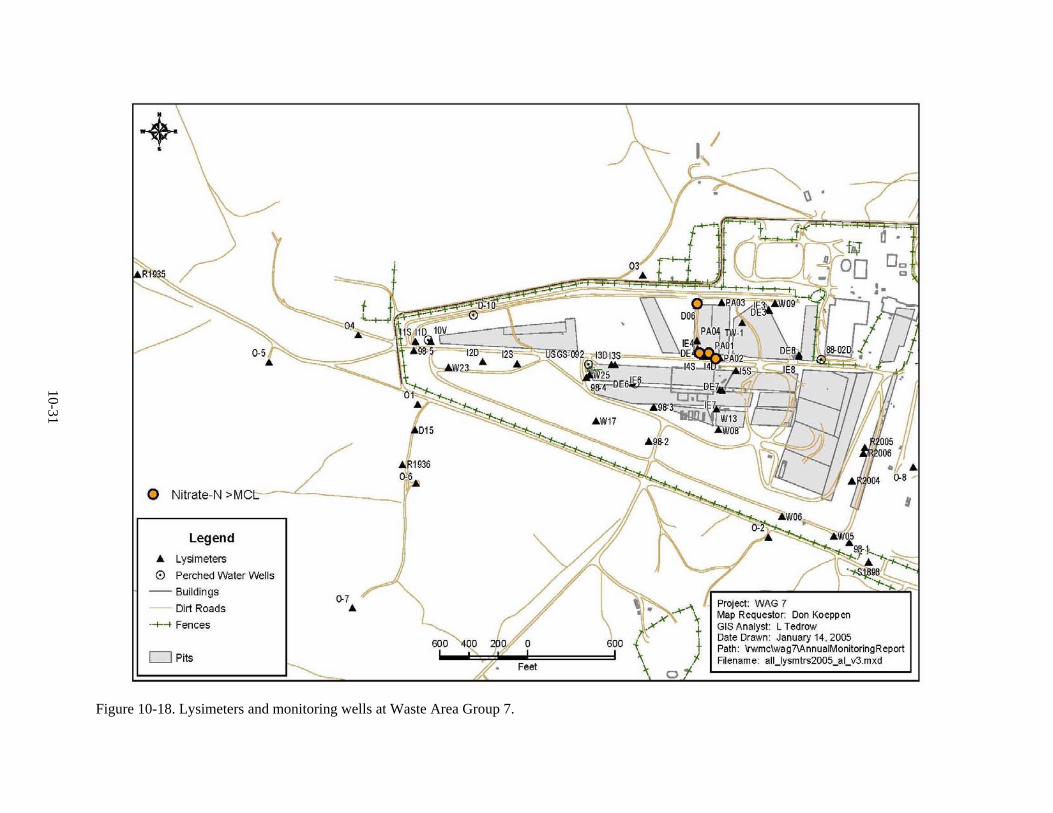
10-31
Figure 10-18. Lysimeters and monitoring wells at Waste Area Group 7.

Nitrate-N Lysimeters around Pad A
0
20
40
60
80
100
Mar
-97
Nov
-97
Aug
-98
May
-99
Jan-
00
Oct
-00
Jun-
01
Mar
-02
Dec
-02
Aug
-03
May
-04
mg/
L
PA02-L16 (9')
TW1-DL04 (102')
I4S-DL11 (97')
D06-DL02 (44')
Soil moisture background maxAquifer MCL
PA01-L15 (14')
D06-DL01 (88')
PA03-L33 (10')
USGS-92 (214')
Figure 10-19. Nitrogen concentrations in lysimeters located around Pad A and in the USGS-092 well.
Required operations and maintenance, inspection sampling, and monitoring have been performed, documented, and reported. Occasional subsidence has been reported and corrected. Since the last review, it was noted that revegetation efforts have not improved vegetative cover in certain portions of Pad A. However, no significant erosion has occurred in those areas. Therefore, the revegetation efforts have been suspended, as agreed upon by the agencies. The Pad A Operations and Maintenance Plan (Flynn 2005) was revised to remove the requirement for annual revegetation.
The requirement for annual preferential monitoring of nitrates at the Pad A lysimeters has also been eliminated from the revised Operations and Maintenance Plan (Flynn 2005), based on cumulative risk assessments for OU 7-13/14. The cumulative nitrate hazard index for the entire SDA using the upper-bound inventory for nitrates is 1 (Holden et al. 2002). The nitrate hazard index is based on best-estimate inventory and is less than the threshold value for remedial decision-making. Because Pad A nitrate sampling is conducted in conjunction with other WAG 7 sampling and the nitrate hazard index is 1, nitrates will be analyzed in lysimeter samples only when sufficient sample volume is available after other analytical priorities have been fulfilled. This change has been documented in the revised Operations and Maintenance Plan (Flynn 2005).
10.3.4 Technical Assessment
Question A: Is the remedy functioning as intended by the decision documents?
The remedy is functioning as intended by the OU 7-12 ROD. The subsidence events have been minimal since the last review and have been repaired. Revegetation efforts have been discontinued on the portions of Pad A that have consistently failed to produce vegetative cover. Operations and maintenance costs are consistent with previous costs.
10-32

The lysimeter and monitoring well network is sufficient to provide data to assess potential releases from the pad. Maintenance on the cap is sufficient to maintain the integrity of the cap.
The required institutional controls are in place and functioning as intended. No activities were observed that would have violated institutional controls. The fence around the site is intact and in good repair.
Question B: Are the exposure assumptions, toxicity data, cleanup levels, and remedial action objectives used at the time of the remedy still valid?
Yes.
Question C: Has any other information come to light that could call into question the protectiveness of the remedy?
Lysimeter and well samples show nitrate concentrations at low levels with increasing trends. In addition, these constituents have been detected at lower depths since the last review. These trends, while they do raise questions as to the protectiveness of the Pad A remedy, are best viewed in the context of the SDA as a whole. Pad A is being evaluated in the OU 7-13/14 comprehensive RI/FS for WAG 7.
10.3.5 Technical Assessment Summary
Results from the monitoring at WAG 7 indicate that some contaminants are migrating from the waste zone. Nitrates are routinely detected around Pad A and should continue to be evaluated cumulatively under OU 7-13/14. Concentration trends associated with nitrates around Pad A are significant (Koeppen et al. 2005).
The SDA, including Pad A, is being evaluated in the WAG 7 comprehensive RI/FS. Future decisions for OU 7-13/14 could affect elements of Pad A long-term stewardship.
10.3.6 Issues
Issues at Pad A include the continued detection of nitrates in the vadose zone. The significance of the detections is being evaluated in the context of the entire SDA in the OU 7-13/14 RI/FS.
10.3.7 Recommendations and Follow-up Actions
Operations, maintenance, and inspections should be continued at Pad A. Vadose zone monitoring should continue under OU 7-13/14 in accordance with priorities based on WAG-wide concerns. Semiannual aquifer monitoring should also continue.
10.3.8 Protectiveness Statement
The remedy at Pad A currently protects human health and the environment and is functioning as intended in the ROD. Ongoing maintenance and institutional controls preclude prolonged direct contact with the waste. Current monitoring data indicate that the remedy is functioning as required to achieve cleanup goals. However, the Pad A remedy will be reevaluated based on cumulative impacts as part of the WAG 7 comprehensive OU 7-13/14 RI/FS and ROD.
10-33

10.4 Section 10 References
54 FR 29820, 1989, “National Priorities List for Uncontrolled Hazardous Waste Sites: Update #9, Federal Facilities Sites,” FRL-3615-2, Federal Register, U.S. Environmental Protection Agency, July 14, 1989.
15 USC § 2601 et seq., 1976, “Toxic Substances Control Act of 1976,” United States Code, October 11, 1976.
DOE M 435.1-1, Change 1, 2001, “Radioactive Waste Management Manual,” U.S. Department of Energy, June 2001.
DOE-ID, 1991, Federal Facility Agreement and Consent Order for the Idaho National Engineering Laboratory, Administrative Docket No. 1088-06-29-120, U.S. Department of Energy Idaho Operations Office; U.S. Environmental Protection Agency, Region 10; Idaho Department of Health and Welfare, December 4, 1991.
DOE-ID, 1993, Record of Decision Declaration for Pit 9 at the Radioactive Waste Management Complex Subsurface Disposal Area at the Idaho National Engineering Laboratory, Document ID 5569, Rev. 0, U.S. Department of Energy Idaho Operations Office; U.S. Environmental Protection Agency, Region 10; and Idaho Department of Health and Welfare, October 1993.
DOE-ID, 1994a, Record of Decision Declaration for Organic Contamination in the Vadose Zone, Operable Unit 7-08, Idaho National Engineering Laboratory, Radioactive Waste Management Area, Subsurface Disposal Area, Document ID 5761, Rev. 0, U.S. Department of Energy Idaho Operations Office; U.S. Environmental Protection Agency; and Idaho Department of Health and Welfare, November 1994.
DOE-ID, 1994b, Record of Decision Declaration for Pad A at the Radioactive Waste Management Complex Subsurface Disposal Area at the Idaho National Engineering Laboratory, Document ID 5632, Rev. 0, U.S. Department of Energy Idaho Operations Office, U.S. Environmental Protection Agency, Idaho Department of Health and Welfare, February 1994.
DOE-ID, 1995, Explanation of Significant Differences Pit 9 Interim Action Record of Decision at the Radioactive Waste Management Complex at the Idaho National Engineering Laboratory, Document ID 5862, Rev. 0, U.S. Department of Energy Idaho Operations Office; U.S. Environmental Protection Agency, Region 10; and Idaho Department of Health and Welfare, January 1995.
DOE-ID, 1998, Explanation of Significant Differences for the Pit 9 Interim Action Record of Decision at the Radioactive Waste Management Complex at the Idaho National Engineering and Environmental Laboratory, Document ID 10537, Rev. 0, U.S. Department of Energy Idaho Operations Office; U.S. Environmental Protection Agency, Region 10; and Idaho Department of Health and Welfare, September 1998.
DOE-ID, 2002a, Agreement to Resolve Disputes, Document ID 10970, Rev. 0, State of Idaho, U.S. Environmental Protection Agency, U.S. Department of Energy, April 2002.
DOE-ID, 2002b, Remedial Design Package for the OU 7-10 Glovebox Excavator Method Project, DOE/ID-11032, Rev. 0, U.S. Department of Energy Idaho Operations Office, September 2002.
10-34

DOE-ID, 2002c, Remedial Design Supplemental Package for the OU 7-10 Glovebox Excavator Project, DOE/ID-11032-SUPPL, Rev. 0, U.S. Department of Energy Idaho Operations Office, October 2002.
DOE-ID, 2004a, Agreement to Extend Deadlines, Document ID 24868, Rev. 0, Idaho Department of Environmental Quality, U.S. Environmental Protection Agency, and U.S. Department of Energy, June 25, 2004.
DOE-ID, 2004b, Remedial Action Report for the OU 7-10 Glovebox Excavator Method Project, DOE/NE-ID-11155, Rev. 0, U.S. Department of Energy Idaho Operations Office, November 2004.
DOE-ID, 2004c, Action Memorandum for Accelerated Retrieval of a Described Area within Pit 4, DOE/NE-ID-11179, Rev. 0, U.S. Department of Energy Idaho Operations Office, August 2004.
DOE-ID, 2005, Engineering Evaluation/Cost Analysis for the Accelerated Retrieval Project II, DOE/NE-ID-11223, Rev. 0, U.S. Department of Energy Idaho Operations Office, March 2005.
EDF-2157, 2002, “Mass Removal Calculation Using Process Sampling Data for Operable Unit 7-08 Organic Contamination in the Vadose Zone,” Rev. 0, Idaho National Engineering and Environmental Laboratory, October 2002.
EDF-2376, 2003, “Estimates of Carbon Tetrachloride Air Concentrations within the OU 7-10 Retrieval Confinement Structure and Packaging Glovebox System during Various Phases of Stage II Retrieval Activities,” Rev. 1, Idaho National Engineering and Environmental Laboratory, March 2003.
EG&G, 1993, Remedial Design/Remedial Action Scope of Work and Remedial Design Work Plan: Operable Unit 7-10 (Pit 9 Project Interim Action), EGG-ER-11055, Rev. 0, Idaho National Engineering Laboratory, December 1993.
EPA, 1997, Two-Year Review Idaho National Engineering Laboratory Subsurface Disposal Area Pad A Operable Unit 7-12, U.S. Environmental Protection Agency Region 10 and Idaho Department of Health and Welfare Division of Environmental Quality, December 1997.
EPA, 2003, Five-Year Review Report for OU 7-12 (Pad A) Idaho National Engineering and Environmental Laboratory, U.S. Environmental Protection Agency Region 10, September 2003.
Flynn, S. C., 2005, Operations and Maintenance Plan for the Pad A Limited Action Operable Unit 7-12 at the Radioactive Waste Management Complex, ICP/EXT-04-00732, Rev. 0, Idaho National Laboratory, Idaho Cleanup Project, May 2005.
Holden, K. Jean, Bruce H. Becker, Nancy L. Hampton, L. Don Koeppen, Swen O. Magnuson, T. J. Meyer, Gail L. Olson, and A. Jeffrey Sondrup, 2002, Ancillary Basis for Risk Analysis of the Subsurface Disposal Area, INEEL/EXT-02-01125, Rev. 0, Idaho National Engineering and Environmental Laboratory, September 2002.
ICP, 2004, Environmental and Operational Mid-Year Data Report for the OU 7-08 Organic Contamination in the Vadose Zone Project – 2004, ICP/EXT-04-00509, Rev. 0, Idaho National Engineering and Environmental Laboratory, Idaho Completion Project, September 2004.
10-35

INEEL, 2001, Waste Area Group 7 Analysis of OU 7-10 Stage II Modifications, INEEL/EXT-01-01105, Rev. 0, Idaho National Engineering and Environmental Laboratory, October 2001.
INEEL, 2002, Data Quality Objectives Summary Report for Operable Unit 7-08 Post-Record of Decision Sampling, INEEL/EXT-2000-00814, Rev. 1, Idaho National Engineering and Environmental Laboratory, August 2002.
INEEL, 2004, Operations and Maintenance Plan for the OU 7-08 Organic Contamination in the Vadose Zone Project, INEEL/EXT-01-00016, Rev. 1, Idaho National Engineering and Environmental Laboratory, August 2004.
INEL, 1993, Proposed Plan for Pad A at the Radioactive Waste Management Complex, Idaho National Engineering Laboratory, Administrative Record AR 4.3-5342, Rev. 0, Idaho National Engineering Laboratory, July 1993.
INEL, 1994, Remedial Design/Remedial Action (RD/RA) Work Plan, Pad A Limited Action Radioactive Waste Management Complex, Operable Unit (OU) 7-12, Document ID 07.012.1.1.101.01, Rev. 1, Idaho National Engineering Laboratory, June 1994.
INEL, 1995, Remedial Design/Remedial Action Scope of Work and Remedial Design Work Plan: Operable Unit 7-10 (Pit 9 Project Interim Action), INEL-94/0110, Rev. 1, Idaho National Engineering Laboratory, January 1995.
INEL, 1997, Remedial Design/Remedial Action Scope of Work and Remedial Design Work Plan: Operable Unit 7-10 (Pit 9 Project Interim Action), INEL-94/0110, Rev. 2, Idaho National Engineering Laboratory, October 1997.
Koeppen, L. D., G. L. Olson, A. M. Parsons, M. A. Plummer, P. D. Ritter, and A. J. Sondrup, 2005, Fiscal Year 2004 OU 7-13/14 Environmental Monitoring Report for the Radioactive Waste Management Complex, ICP/EXT-05-00795, Rev. 0, Idaho National Laboratory, Idaho Cleanup Project, May 2005.
LMITCO, 1998, OU 7-10 Staged Interim Action Project System Requirements Document, INEEL/EXT-98-00310, Rev. 1, Idaho National Engineering and Environmental Laboratory, October 1998.
McIlwain, B. A., 2004, Sampling Plan to Support Design and Operations of the Accelerated Retrieval Project at Area G of Pit 4 within the Radioactive Waste Management Complex, ICP/EXT-03-00112, Rev. 0, Idaho National Engineering and Environmental Laboratory, Idaho Completion Project, January 2004.
Parsons Engineering Science, 1995a, Remedial Action Report Pad A Limited Action Operable Unit 7-12, INEL-95/0313, Parsons Document No. 07.012.0.320.01, Rev. 2, Idaho National Engineering Laboratory, July 1995.
Parsons Engineering Science, 1995b, Pad A Limited Action Long-Term Monitoring Plan, Operable Unit 7-12, INEL-95/0271, Parsons Document No. ES-14.6.9.8, Rev. 5, Idaho National Engineering Laboratory, August 1995.
10-36

Salomon, Hopi, Daryl R. Haefner, Beth A. McIlwain, Jila Banaee, Jeffrey J. Einerson, and Anna K. Podgorney, 2003, Field Sampling Plan for the OU 7-10 Glovebox Excavator Method Project, INEEL/EXT-02-00542, Rev. 2, Idaho National Engineering and Environmental Laboratory, October 2003
TFR-2527, 2002, “Technical and Functional Requirements for the OU 7-10 Glovebox Excavator Method Project,” Rev. 3, Idaho National Engineering and Environmental Laboratory, September 2002.
Wilkening, R. Matthew, 2003, The Five Year Review of the Action to Address Organic Contamination of the Vadose Zone at the Subsurface Disposal Area, WAG 7-08, INEEL, Idaho, U.S. Environmental Protection Agency, Region 10, August 18, 2003.
10-37

10-38

11. WASTE AREA GROUP 9 (MATERIALS AND FUELS COMPLEX)
The Materials and Fuels Complex (MFC)—formerly ANL-W—was established in the 1950s to research and develop nuclear reactors and fuel. Since then, three reactors have been constructed at the MFC: the Transient Reactor Test Facility, EBR-II, and the Zero Power Physics Reactor. None of these reactors is currently operating, but past operations and support activities have resulted in chemical and radioactive contamination.
To facilitate cleanup of the contamination, the MFC was designated as WAG 9 under the FFA/CO (DOE-ID 1991). To ascertain the extent of this contamination, a comprehensive RI/FS was completed in October 1997. Thirty-seven sites, collectively designated as OU 9-04, were evaluated during the RI/FS. Five of the sites were found to pose unacceptable risks to human health and/or the environment. This CERCLA (42 USC § 9601 et seq.) remedial action is proceeding in accordance with the Final Record of Decision Argonne National Laboratory-West, Operable Unit 9-04 (DOE, DEQ, and EPA 1998).
In order to effectively quantify the risks, two of the identified sites were subdivided into smaller areas because of the significantly different exposure pathways. The two sites that were subdivided are (1) the industrial waste pond and associated ditches, which were divided into three areas (industrial waste pond, Ditch A, and Ditch B), and (2) the interceptor canal, which was divided into two areas (canal and mound). Thus, a total of eight areas were identified in the OU 9-04 ROD (DOE, DEQ, and EPA 1998) as requiring remedial action.
Of the eight areas requiring remedial action, two posed unacceptable risks to humans, one posed unacceptable risks to humans and ecological receptors, and the remaining five posed unacceptable risks to ecological receptors only. The three sites that contained Cs-137 were the only MFC sites that posed a risk to human heath, and the sites that contained various inorganics posed unacceptable risks to the ecological receptors. Table 11-1 lists the MFC release sites that required remediation, the COCs at each site, and the cleanup goals for each site. Figure 11-1 shows the locations of the release sites at WAG 9 that required remediation. Risks from the remaining 32 sites were considered acceptable; thus, they required no further action.
Table 11-2 provides a chronology of significant events at WAG 9.
11.1 Remedial Actions
The following subsections describe the nature of, extent of, and remedial actions for the contamination at the eight CERCLA areas. These eight CERCLA areas pose unacceptable risks to human health and/or the environment. The eight areas were identified as containing hazardous substances that might endanger the public and/or environment if not addressed by actions identified in the ROD (DOE, DEQ, and EPA 1998).
11.1.1 Remedy Selection
The ROD (DOE, DEQ, and EPA 1998) identified phytoremediation as the selected remedy for OU 9-04 and identified excavation and disposal as the contingent remedy. The Final Explanation of Significant Differences to the Record of Decision for Argonne National Laboratory-West Operable Unit 9-04 (ANL-W 2000) issued in February 2000 implemented the contingent remedy of excavation and disposal for two areas: Ditch B and the east portion of the main cooling tower blowdown ditch.
11-1

Table 11-1. Contaminants of concern at Operable Unit 9-04.
95% UCL Remediation Site Code Area COC Concentration Goal
ANL-01 Industrial waste pond Chromium-III 1,030 50
Mercury 2.62 0.74
Selenium 8.41 3.4
Zinc 5,012 2,200
Cs-137 29.2 23.3
Ditch A Mercury 3.94 0.74
Ditch B Chromium 1,306 50
Zinc 3,020 2,200
ANL-01A Main cooling tower Chromium 709 50 blowdown ditch Mercury 8.83 0.74
ANL-04 Sewage lagoons Mercury 3.2 0.74
ANL-09 Interceptor canal-canal Cs-137 30.53 23.3
Interceptor canal-mound Cs-137 18 23.3
ANL-35 Industrial waste lift Silver 352 112 station discharge ditch
ANL = Argonne National Laboratory COC = contaminant of concern UCL = upper confidence limit
11-2

Figure 11-1. Areas that required remediation at the Materials and Fuels Complex.
11-3

Table 11-2. Chronology of the Waste Area Group 9 events. Event Date
The “Consent Order and Compliance Agreement” (EPA 1987) was signed. July 28, 1986 The FFA/CO (DOE-ID 1991) for the INL Site was signed. December 9, 1991 The Comprehensive Remedial Investigation/Feasibility Study for the Argonne National December 1997 Laboratory-West Operable Unit 9-04 at the Idaho National Engineering and Environmental Laboratory (Lee et al. 1997) was completed. The Final Record of Decision Argonne National Laboratory-West, Operable Unit 9-04 September 29, 1998 (DOE, DEQ, and EPA 1998) was completed. Bench-scale phytoremediation testing was completed. February 1999 The final Remedial Design/Remedial Action Work Plan for the Argonne National August 1999 Laboratory-West, Operable Unit 9-04 (ANL-W 1999) was completed. Implementation of phytoremediation began at four sites. May 17, 1999 The Final Explanation of Significant Differences to the Record of Decision for Argonne February 2000 National Laboratory-West Operable Unit 9-04 (ANL-W 2000) to implement the contingent remedy of excavation and disposal at the CFA landfill was published. The Phytoremediation 2-Year Field Season Demonstration Project Report, Argonne March 2001 National Laboratory-West (ANL-W 2001) was submitted to the regulatory agencies. The Sampling and Analysis Plan for the Post-Phytoremediation Characterization of July 2003 ANL-W CERCLA Sites (Portage 2003) was submitted to the regulatory agencies.
ANL-W = Argonne National Laboratory West CERCLA = Comprehensive Environmental Response, Compensation, and Liability Act DEQ = [Idaho] Department of Environmental Quality DOE = U.S. Department of Energy DOE-ID = U.S. Department of Energy Idaho Operations Office EPA = U.S. Environmental Protection Agency FFA/CO = Federal Facility Agreement and Consent Order
The Explanation of Significant Difference Argonne National Laboratory-West, Operable Unit 9-04 (DOE, DEQ, and EPA 2004) issued in 2004 implemented the contingent remedy of excavation and disposal for the industrial waste pond and hot spot removal in Ditch A and the industrial waste lift station discharge ditch. The one remaining area not yet undergoing remediation is the ANL-04 sanitary sewage lagoons. The remediation of that area is not scheduled to occur until its useful life is completed. Currently, the sanitary sewage lagoons are anticipated to remain in use until 2033.
11.1.2 Remedial Action Objectives
The RAOs for the eight areas of concern were developed in accordance with 40 CFR 300, “National Oil and Hazardous Substances Pollution Contingency Plan,” and CERCLA RI/FS guidance through meetings with the DEQ, EPA, and DOE. The RAOs result from risk assessments and are specific to the COCs and exposure pathways developed for OU 9-04.
The RAO for protection of human health and safety is to inhibit direct exposure to radionuclide COCs in soil that would result in a total excess cancer risk of greater than 1 in 10,000 to 1,000,000 (1E-04 to 1E-06) to current and future workers and future residents.
The RAO for protection of the environment is to prevent exposure to COCs in soils that may have potential adverse effects to resident populations of flora and fauna, as determined by a hazard quotient equal to 10 times the hazard quotient calculated from INL Site background soil concentrations.
11-4

To meet these RAOs, PRGs were established. The goals are quantitative cleanup levels based primarily on ARARs and risk-based doses. Final remediation goals are based on the results of the baseline risk assessment and an evaluation of expected exposures and risks for selected alternatives. Table 11-1 presents the final remediation goals. Remedial actions were completed to ensure that risk would be mitigated and exposure would not exceed the final remediation goals.
11.1.3 Remedy Implementation
The following subsections describe the remedial actions implemented at the OU 9-04 sites. A full description of the remedial actions can be found in the Final Remedial Design/Remedial Action Work Plan for the Argonne National Laboratory-West, Operable Unit 9-04 (ANL-W 1999) and the Remedial Design Argonne National Laboratory-West, Operable Unit 9-04 (ANL-W 2004). In 1999, the first Remedial Design Work Plan document implemented phytoremediation on four areas and excavation and disposal of Ditch B and the east portion of the main cooling tower blowdown ditch. The 2004 Remedial Design Work Plan implemented excavation and disposal of the industrial waste pond and hot spot removal of soil in two previously phytoremediated sites (Ditch A and the industrial waste lift station discharge ditch).
11.1.3.1 Industrial Waste Pond (ANL-01 Site). The industrial waste pond sediments contained low levels of Cs-137 that pose unacceptable risks to humans. The pond sediments also contained four inorganics (i.e., chromium, mercury, selenium, and zinc) that posed unacceptable risks to ecological receptors. In 2004, the decision was made to implement the contingent remedy of excavation and disposal rather than phytoremediation at this site because of potential future projects at MFC. The excavation and disposal activities were completed in 2004 with the soil being transported to the ICDF. A total of 1,351 tons of soil was removed during the first campaign, and confirmation sampling indicated one hot spot remained for chromium that exceeded the remediation goal. Consequently, a second campaign of excavation and disposal was conducted in November 2004 and removed all of the soil from this hot spot down to the basalt. The hot spot removal resulted in 136 tons of soil that was transported to the ICDF in November 2004. The shipments of waste to the ICDF were tracked using Waste Profile 4243P in the IWTS.
Tables 20 and 24 of the Data Quality Assessment Report for the Post-Remedial Action Confirmation Sampling of the ANL-W CERCLA Sites (Portage 2005a) show the statistical calculation of each COC for the surface and subsurface soils, respectively. After remediation, each of the five contaminants were below the established remediation goals for the surface and subsurface data sets with the exception of chromium in the surface soils. The chromium in the surface soils had a mean concentration of 433 mg/kg and a calculated UCL of 626 mg/kg, which exceeded the 500-mg/kg remediation goal. However, the State of Idaho and EPA agreed that since the pond will continue to be used as a pond, no vegetation (bunch grass) could grow underwater; thus, no pathway exists.
11.1.3.2 Ditch A (ANL-01 Site). In May 1999, phytoremediation actions were initiated at Ditch A, which contained mercury contamination that posed an unacceptable risk to ecological receptors. Phytoremediation was estimated to take 7 years to meet the remediation goal of 0.74 mg/kg for mercury. Preliminary results from a two-field season showed that phytoremediation with hybrid willows and poplars was working better than expected and that remediation goals could be met after 4 years rather than the estimated 7 years.
Phytoremediation activities continued in 2001 and 2002, and confirmation samples were collected in 2003 and summarized in the Data Quality Assessment Report for the Post-Phytoremediation Characterization of ANL-W CERCLA Sites (Portage 2005b). The sampling results indicated that hot spots remained; therefore, the decision was made to implement the contingent remedy of excavation and
11-5

disposal in 2004. The excavation and disposal activities also were completed in 2004 with the excavated soil being transported to the CFA bulky waste landfill and placed at a depth greater than 10 ft to prevent exposure to ecological receptors. The 50 yd3 of waste was tracked using Waste Profile 4428P in IWTS.
Tables 13 and 16 of the Data Quality Assessment Report for the Post-Remedial Action Confirmation Sampling of the ANL-W CERCLA Sites (Portage 2005a) show the statistical calculation of mercury for the surface and subsurface soils, respectively. The UCL values in the surface and subsurface soils were 0.64 mg/kg and 0.74 mg/kg, respectively, which are at or below the mercury remediation goal of 0.74 mg/kg.
11.1.3.3 Ditch B (ANL-01 Site). An ESD (ANL-W 2000) issued in February 2000 implemented the contingent remedy of excavation and disposal of the soil, rather than phytoremediation, at Ditch B. The excavation activities were conducted in June 2000 using front-end loaders and backhoes to remove the soil from the ditch down to the top of the basalt. Dump trucks moved the soil to the staging area. The soil was stockpiled near the ditch and covered with plastic material to prevent the spread of contamination from windblown dust, rainfall, and leachate. The soil remained at the stockpiled area until the soil could be accepted at a new waste cell in the CFA landfill. The soil was deposited in the bottom of the cell at a depth greater than 10 ft to prevent exposure to ecological receptors. Confirmation samples could not be collected because all the soil was removed. The 30 yd3 of waste was tracked using Waste Profile 2550P in IWTS.
11.1.3.4 Main Cooling Tower Blowdown Ditch (ANL-01A Site). Remediation activities for this site were initiated in May 1999. The main cooling tower blowdown ditch was divided into two portions based on location. The east portion of the ditch is located near the cooling tower inside the MFC protection area. The west portion of the ditch is located between the inner and outer security fences. Contaminant concentrations for the soil in these two portions varied by orders of magnitude, and the selected remedy of phytoremediation would only work on the west portion. The east portion received the cooling tower discharge and had the highest contaminant concentrations, and the west portion had much lower concentrations and conveyed the effluent to the industrial waste pond. Because of the concentration differences between these two portions of the same CERCLA site, the decision was made to use excavation and disposal on the east portion and phytoremediation on the west portion.
The east portion of the main cooling tower blowdown ditch lies within the MFC security protection area and was the receiving location for water discharged from the cooling tower. For that portion of the ditch, the contingent remedy of excavation and disposal of the soils—rather than phytoremediation—was implemented in accordance with an ESD issued in February 2000 (ANL-W 2000). The excavation activities were conducted in May 2000 using front-end loaders and backhoes to remove soil from the ditch down to a depth of 2 ft. The soil was stockpiled with the Ditch B soil and covered with plastic material to prevent the spread of contamination from windblown dust, rainfall, and leachate. Soil samples indicated that the remediation goals had not been achieved, and additional soil was removed to basalt (approximately 6 ft) in June 2000. The 130 yd3 of stockpiled soil was disposed of at the CFA landfill in July using IWTS Profile 2550P. The soil was placed in the bottom of the CFA landfill cell at a depth greater than 10 ft to prevent exposure to ecological receptors. Confirmation sampling results were not collected, because no soil existed above basalt and the ditch was backfilled with clean soil to grade.
Phytoremediation actions were initiated at the west portion of the main cooling tower blowdown ditch in May 1999. Initial activities included removal of soil from the area inside the two security fences and placing the soil inside the MFC controlled area. That action was necessary, because trees growing in the security area could have potentially provided concealment of threats to MFC. Phytoremediation was estimated to take 7 years to meet the remediation goals of 500 mg/kg and 0.74 mg/kg for chromium and mercury, respectively. The results after the first 2 years of implementation showed that phytoremediation
11-6

using the hybrid willows and poplars was working better than expected and remediation goals could be met after 4 years rather than the estimated 7 years. Phytoremediation activities continued in 2001 and 2002, and confirmation samples were collected in 2003. Tables 5 and 9 of the Data Quality Assessment Report for the Post-Phytoremediation Characterization of ANL-W CERCLA Sites (Portage 2005b) show the UCL values for chromium and mercury in the surface and subsurface soils, respectively. The UCLs for surface samples and subsurface for chromium were 54.8 mg/kg and 61 mg/kg, respectively, well below the remediation goal of 500 mg/kg. The UCL for mercury in the surface and subsurface was 0.42 mg/kg and 0.37 mg/kg, respectively, both below the remediation goal of 0.74 mg/kg.
11.1.3.5 Sanitary Sewage Lagoons (ANL-04 Site). The sanitary sewage lagoons contain mercury that poses an unacceptable risk to the ecological receptors. The OU 9-04 ROD (DOE, DEQ, and EPA 1998) delayed remediation of the sanitary sewage lagoons until the end of the useful life of the lagoons, which was anticipated to be in 2033. The selected remedy in the OU 9-04 RI/FS was phytoremediation with the contingent remedy of excavation and disposal.
Because the sanitary sewage lagoons will continue to be flooded by wastewaters in the foreseeable future, it is unlikely that the ecological receptor identified in the OU 09-04 ROD (i.e., Merriams shrew) will interact with the contaminated soil present in the bottom of the lagoons.
11.1.3.6 Interceptor Canal-Mound (ANL-09 Site). Phytoremediation actions were initiated at the interceptor canal-mound in May 1999. Phytoremediation was estimated to take 7 years to meet the remediation goal of 23.3 pCi/g. Results documented in the Phytoremediation 2-Year Field Season Demonstration Project Report, Argonne National Laboratory-West (ANL-W 2001) showed that phytoremediation using an annual planting of 750,000 kochia scoparia plants was working better than expected and that remediation goals could be met after 4 years rather than the estimated 7 years. The phytoremediation activities were again initiated for the 2001 and 2002 field seasons. After each field season, plant matter was collected, compacted, sampled, and placed into waste boxes. After 4 years of phytoremediation, the 10.6 yd3 of waste was transported to the RWMC for disposal as low-level waste using IWTS Profile 2334P. Sample results of soil taken in 2003 indicate that the Cs-137 concentration was below the established remediation goal. Tables 14 and 18 of the Data Quality Assessment Report of the Post-Phytoremediation Characterization of ANL-W CERCLA Sites (Portage 2005b) compare the surface and subsurface soils to the remediation goal. The UCLs for the surface and subsurface Cs-137 were 9.54 pCi/g and 2.48 pCi/g, respectively, well below the 23.3-pCi/g remediation goal. However, because the Cs-137 concentrations were greater than those that are acceptable for the occupational receptors, the site will remain under institutional controls until the levels decay to 2.3 pCi/g.
11.1.3.7 Interceptor Canal-Canal (ANL-09 Site). The interceptor canal-canal contains low levels of Cs-137 that pose unacceptable risks to humans for the occupational receptor scenario. The concentration of Cs-137 was found to be 18 pCi/g, which is below the established remediation goal for free release of 23.3 pCi/g. This site will remain under institutional controls. The Cs-137 contamination will decay to background levels in 2085. Thus, this site requires no remediation other than institutional controls and to continue completion of the five-year reviews.
11.1.3.8 Industrial Waste Lift Station Discharge Ditch (ANL-35 Site). Phytoremediation actions were initiated at the industrial waste lift station discharge ditch in May 1999. This site was remediated because of silver contamination that posed unacceptable risks to the ecological receptors. Initially, phytoremediation was estimated to take 7 years to meet the remediation goal of 112 mg/kg. Results of the Phytoremediation 2-Year Field Season Demonstration Project Report (ANL-W 2001) showed that phytoremediation with hybrid willows and poplars was working better than expected and remediation goals could be met after 4 years. Phytoremediation activities continued for the 2001 and 2002 field seasons with confirmation samples collected in 2003. Tables 22 and 26 of the Data Quality
11-7

Assessment Report for the Post-Phytoremediation Characterization of ANL-W CERCLA Sites, Argonne National Laboratory-West (Portage 2005b) show the surface and subsurface UCLs and remediation goal for silver. As shown, the UCL of 104 mg/kg for silver in the surface and 55.4 mg/kg for silver in the subsurface are below the remediation goal of 112 mg/kg. However, data indicated that a hot spot near the surface contributed significantly to the statistics and additional remediation was warranted.
As such, the decision was made to implement the contingent remedy of excavation and disposal in the 2004 ESD (DOE, DEQ, and EPA 2004). The excavation and disposal activities were conducted in the summer of 2004. Tables 5 and 9 of the Data Quality Assessment Report for the Post-Remedial Action Confirmation Sampling of the ANL-W CERCLA Sites (Portage 2005a) show that the UCL for silver in the surface was 191 mg/kg and the UCL for silver in the subsurface was 32.3 mg/kg, while the remediation goal was 112 mg/kg. Thus, the surface soil exceeded the remediation goal, and further excavation was warranted.
Consequently, in October 2004, the area with highest silver results was excavated to basalt. Approximately 100 yd3 of soil from the excavation events in 2004 was shipped and disposed of at the CFA bulky waste landfill. That soil was placed at a depth greater than 10 ft to prevent exposure to ecological receptors. Confirmation samples were not collected after the removal, because all soil in the targeted area was removed to basalt.
11.2 Data Evaluation
The OU 9-04 ROD (DOE, DEQ, and EPA 1998) stated that monitoring of the soil, groundwater, and vegetation will continue until 2018. Results from the sampling are submitted annually to the DOE contractor for incorporation into the INL annual site report. The most recent annual monitoring report is for calendar year 2003 and can be found at http://www.stoller-eser.com/annuals/2003. Review of these results indicates that soil or vegetation results have not increased from those levels recorded in 1998 and are well below the levels defined as hazardous waste.
The MFC groundwater monitoring program consists of one upgradient well and three downgradient wells. In addition, one production well is sampled from within the MFC security area. All wells are sampled twice annually—typically in April and October. Review of the groundwater data indicates that 22 occurrences were above the drinking water maximum contaminant levels (DWMCLs) from 1998 through 2004. The data for the 22 occurrences are shown in Table 11-3. The results for the upgradient monitoring well (ANL-MON-A-012) showed aluminum and thallium above the DWMCLs; aluminum, thallium, iron, sodium, lead, and nitrate were detected in the downgradient wells. None of these contaminants were COCs for the CERCLA sites. These data do not show a consistent pattern of increased trends and appear to be sampling anomalies. The one exception, however, is the sodium in ANL-MON-A-013, in which the sodium levels stay slightly above the MCL. Sodium, considered a secondary DWMCL, can cause problems for some individuals, but no receptor is currently drinking that water. ANL-MON-A-013 is used to monitor the industrial waste pond, and elevated levels of sodium are expected.
The groundwater level in the one upgradient and three downgradient wells has dropped approximately 12 ft since 1998. This drop has caused significant problems in the collection of samples. In May 2002, water samples could not be collected from the M-12 well, because the inlet to the pump was above the water table. In October 2002, the M-11 and M-12 wells could not be sampled because of a continued drop in the water table. As a result, all of the pumps for the four monitoring wells were lowered to within 1 ft of the bottom. In April 2004, water samples could not be collected from the M-11 well, because the water dropped below the pump inlet. This well was redrilled and lowered 50 ft. Continued
11-8

Table 11-3. Materials and Fuels Complex groundwater values exceeding drinking water maximum contaminant levels. Value DWMCLs Laboratory
Well Location Analyte (mg/L) (mg/L) Sample Date Sample Number Qualifiersa
11-9
ANL-MON-A-011 Iron 3.63 0.3 03/23/1999 AGW07501-C4/MW-11 —
ANL-MON-A-011 Iron 0.618 0.3 08/7/2001 ANL-206-01C4 —
ANL-MON-A-011 Thallium 0.0043 0.002 05/9/2002 ANL-104-02-C4 B
ANL-MON-A-012 Aluminum 0.0568 0.05 03/22/1999 AGW07601-C4/MW-12 B
ANL-MON-A-012 Aluminum 0.182 0.05 04/23/2001 ANL-006-01C4 B
ANL-MON-A-012 Thallium 0.0043 0.002 05/8/2002 ANL-072-02-C4 B
ANL-MON-A-012 Thallium 17.9 0.002 04/21/2003 ANL-008-03 B
ANL-MON-A-013 Sodium 21.9 20 10/12/1999 MW-13 —
ANL-MON-A-013 Sodium 21.3 20 06/27/2000 ANL-102-00C4 —
ANL-MON-A-013 Sodium 21.3 20 10/9/2000 ANL-217-00C4 —
ANL-MON-A-013 Sodium 20.4 20 04/23/2001 ANL-020-01C4 —
ANL-MON-A-013 Iron 0.479 0.3 10/7/2003 ANL-188-03 —
ANL-MON-A-013 Aluminum 0.0893 0.05 04/20/2004 07604 —
ANL-MON-A-013 Iron 0.363 0.3 04/20/2004 07604 —
ANL-MON-A-014 Lead 0.0162 0.015 01/29/1997 AGW03501C4 S
ANL-MON-A-014 Nitrate 137 10 01/29/1997 AGW03501ND —
ANL-MON-A-014 Iron 0.69 0.3 03/23/1999 AGW07801-C4/MW-14 —
ANL-MON-A-014 Thallium 0.0031 0.002 10/12/1999 MW-14 —
ANL-MON-A-014 Aluminum 0.0751 0.05 10/16/2000 ANL-244-00C4 B
ANL-MON-A-014 Iron 0.375 0.3 05/8/2002 ANL-115-02-C4 —
ANL-MON-A-014 Thallium 0.0034 0.002 05/8/2002 ANL-115-02-C4 B
EBR-II #2 Aluminum 0.0975 0.05 04/25/2001 ANL-051-01C4 B
a. The B-reported value was obtained from a reading that was less than the contract-required detection limit but greater than the instrument detection limit. The S-reported value was determined by the method of standard additions.
ANL = Argonne National Laboratory DWMCL = drinking water maximum contaminant level

drought and upgradient use of the groundwater by irrigators are being blamed on the drop in the water table below MFC. If the trend continues, the M-13 well will have to be redrilled and the pump lowered in order for water samples to be collected.
11.3 Progress since Last Review
This is the first five-year review of OU 9-04.
11.4 Technical Assessment
Question A: Is the remedy functioning as intended by the decision documents?
The functional status of the remedy for each of the OU 9-04 areas is provided in Table 11-4. For seven areas, the remedial action is complete, with the final signatures on the remedial action report pending. For three of these areas, continued institutional controls are required because of remaining concentrations of Cs-137. The institutional controls to prevent inadvertent access to these three areas have been implemented and are functioning as originally intended. At the three sites that contain Cs-137, institutional controls will continue until the levels reach the INL Site background of 2.3 pCi/g. Table 11-4 summarizes the responses to the functionality of the OU 9-04 remedies as of September 2004.
Question B: Are the exposure assumptions, toxicity data, cleanup levels, and remedial action objectives used at the time of the remedy still valid?
Of the toxicological criteria for COCs at OU 9-04, none has undergone any major revisions or updates that would decrease the final remediation goals. Therefore, once met, the final remediation goals (site-specific, risk-based cleanup levels) will remain protective of human health and the environment under current exposure scenarios. Monitoring results show that the contaminant concentrations are well below the established final remediation goals.
The original assumptions, cleanup levels, and RAOs used at the time of the remedy selection are still valid. Successful implementation of the phytoremediation and/or excavation and disposal remedies has reduced the concentrations of Cs-137 and inorganic contaminants to levels that are acceptable to humans and the ecological receptors.
Question C: Has any other information come to light that could call into question the protectiveness of the remedy?
No.
11.5 Technical Assessment Summary
Remedial actions have been completed in accordance with the decision documents at the ANL-01, ANL-01A, ANL-09, and ANL-35 sites. Based on the available data, the remedial actions at the sites were completed successfully and the remedies are functioning as intended. The exposure assumptions, toxicity data, cleanup levels, and RAOs used at the time of the remedy selections are still valid, and no new information has come to light that could call into question the protectiveness of the remedies. In addition to the remediation of these sites, institutional controls have been implemented at the industrial waste pond (ANL-01) and at both areas within ANL-09 (interceptor canal-canal and interceptor canal-mound) and are functioning as required.
11-10
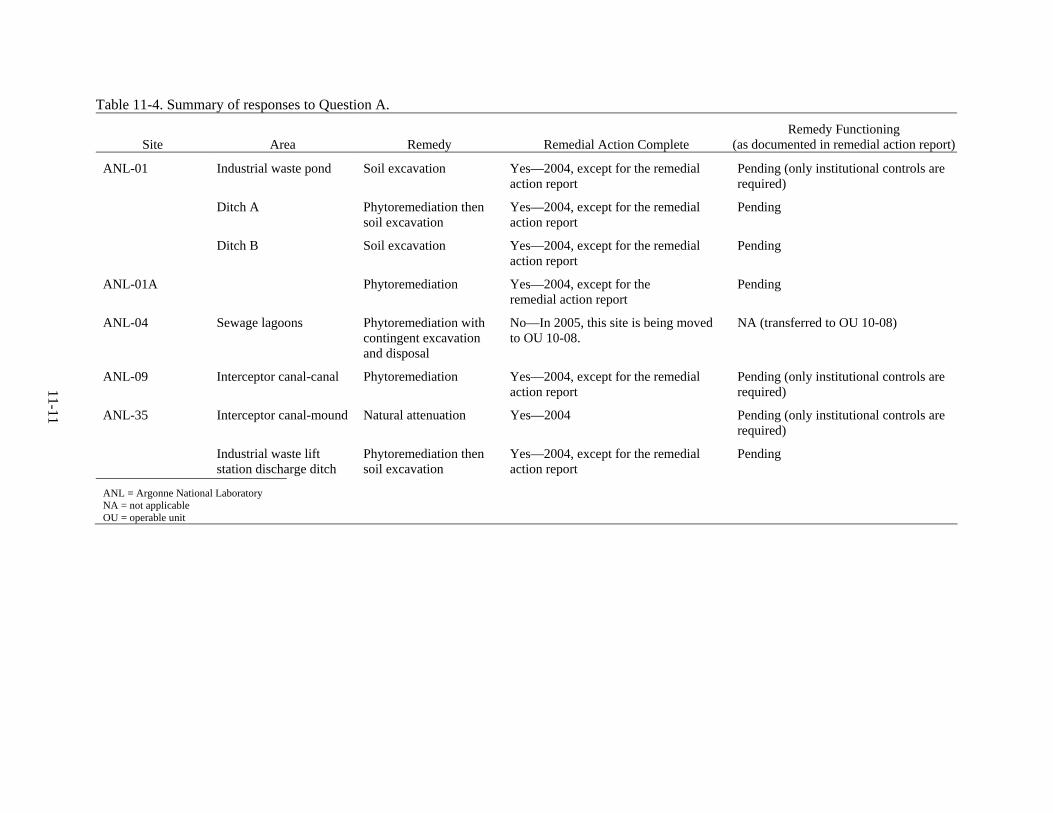
Table 11-4. Summary of responses to Question A.
Remedy Functioning Site Area Remedy Remedial Action Complete (as documented in remedial action report)
11-11
Industrial waste pond Soil excavation ANL-01 Yes—2004, except for the remedial Pending (only institutional controls are action report required)
Ditch A Phytoremediation then Yes—2004, except for the remedial Pending soil excavation action report
Ditch B Soil excavation Yes—2004, except for the remedial Pending action report
ANL-01A Phytoremediation Yes—2004, except for the Pending remedial action report
ANL-04 Sewage lagoons Phytoremediation with No—In 2005, this site is being moved NA (transferred to OU 10-08) contingent excavation to OU 10-08. and disposal
ANL-09 Interceptor canal-canal Phytoremediation Yes—2004, except for the remedial Pending (only institutional controls are action report required)
Interceptor canal-mound Natural attenuation ANL-35 Yes—2004 Pending (only institutional controls are required)
Industrial waste lift Phytoremediation then Yes—2004, except for the remedial Pending station discharge ditch soil excavation action report
ANL = Argonne National Laboratory NA = not applicable OU = operable unit

11.6 Issues No issues have been identified during the ongoing OU 9-04 remedial action activities that have not
been resolved through the two ESDs (ANL-W 2000; DOE, DEQ, and EPA 2004).
11.7 Recommendations and Follow-up Actions As discussed in the OU 9-04 ROD, remedial actions for the sanitary lagoons (ANL-04) were
delayed until the end of their useful lives. However, because the mission of MFC has changed, the sewage lagoons are scheduled to receive discharge until approximately 2033 in support of continued activities at the MFC. Because remedial actions have been completed at all of the CERCLA sites at WAG 9, it is recommended that the ANL-04 be transferred to OU 10-08, thus allowing the closure of WAG 9.
11.8 Protectiveness Statement Remedial actions have been completed at seven of the eight areas identified in the OU 9-04 ROD
(DOE, DEQ, and EPA 1998). These seven areas are awaiting final regulatory approval of the Remedial Action Report for Waste Area Group 9, Operable Unit 9-04 at the Idaho National Engineering and Environmental Laboratory (Portage 2005c). The remaining area that has not undergone remediation activities is the sanitary sewage lagoon site, which is being transferred to OU 10-08. This five-year review is being used to officially document the transfer of the sanitary sewage lagoons to OU 10-08, as discussed in Ceto (2005) and Faulk (2005). The remedies on the remaining areas at OU 9-04 are protective of human health and the environment.
11.9 Section 11 References
40 CFR 300, 2003, “National Oil and Hazardous Substances Pollution Contingency Plan,” Code of Federal Regulations, Office of the Federal Register, July 2003.
42 USC § 9601 et seq., 1980, “Comprehensive Environmental Response, Compensation and Liability Act of 1980 (CERCLA/Superfund),” United States Code, December 11, 1980.
ANL-W, 1999, Final Remedial Design/Remedial Action Work Plan for the Argonne National Laboratory-West, Operable Unit 9-04, Idaho National Engineering and Environmental Laboratory, August 1999.
ANL-W, 2000, Final Explanation of Significant Differences to the Record of Decision for Argonne National Laboratory-West Operable Unit 9-04, Idaho National Engineering and Environmental Laboratory, February 2000.
ANL-W, 2001, Phytoremediation 2-Year Field Season Demonstration Project Report, Argonne National Laboratory-West, Document ID 21868, Argonne National Laboratory-West, March 2001.
ANL-W, 2004, Remedial Design Argonne National Laboratory-West, Operable Unit 9-04, W7500-xxx, Idaho National Engineering and Environmental Laboratory, May 2004.
Ceto, N., EPA Region 10 Hanford/INL Project Office, to K. E. Hain, U.S. Department of Energy Idaho Operations Office, May 10, 2005, “Request to Place WAG 9 ANL-04 Sewage Lagoons in OU 10-08 for Administrative Control,” Document No. 24903.
11-12

DOE, DEQ, and EPA, 1998, Final Record of Decision Argonne National Laboratory-West, Operable Unit 9-04, W7500-000-ES-04, U.S. Department of Energy, Idaho Department of Environmental Quality, and U.S. Environmental Protection Agency, September 1998.
DOE, DEQ, and EPA, 2004, Explanation of Significant Difference Argonne National Laboratory-West, Operable Unit 9-04, Document ID 24867, U.S. Department of Energy, Idaho Department of Environmental Quality, and U.S. Environmental Protection Agency, May 2004.
DOE-ID, 1991, Federal Facility Agreement and Consent Order for the Idaho National Engineering Laboratory, Administrative Docket No. 1088-06-29-120, U.S. Department of Energy Idaho Field Office; U.S. Environmental Protection Agency, Region 10; Idaho Department of Health and Welfare, December 4, 1991.
EPA, 1987, “Consent Order and Compliance Agreement,” U.S. Environmental Protection Agency, U.S. Department of Energy Idaho Operations Office, and U.S. Geological Survey, Administrative Docket No. 1085-10-07-3008, July 1987.
Faulk, D., EPA Region 10 Hanford/INL Project Office, to Hain, K. E., U.S. Department of Energy Idaho Operations Office, April 4, 2005, “ANL-04 Transfer,” Document No. 24898.
Koch, D. F., Idaho Department of Environmental Quality, to Hain, K., U.S. Department of Energy Idaho Operations Office, March 15, 2005, “DOE Letter Request of March 7, 2005 to place WAG 9, ANL-04, Sewage Lagoon in Operable Unit 10-08 for Administrative Control (FMDP-FFA/CO-05-123).”
Lee, S. D., M. J. Rohe, A. S. Rood, and I. E. Stepan, 1997, Comprehensive Remedial Investigation/Feasibility Study for the Argonne National Laboratory-West Operable Unit 9-04 at the Idaho National Engineering and Environmental Laboratory, W7500-0000-ES-02, Idaho National Engineering Laboratory, December 1997.
Portage, 2003, Sampling and Analysis Plan for the Post-Phytoremediation Characterization of ANL-W CERCLA Sites, Portage-03/001, Rev. 2, Portage Environmental, Inc., July 2003.
Portage, 2005a, Data Quality Assessment Report for the Post-Remedial Action Confirmation Sampling of the ANL-W CERCLA Sites, 04-015, Rev. 1, Portage Environmental, Inc., January 2005.
Portage, 2005b, Data Quality Assessment Report for the Post-Phytoremediation Characterization of ANL-W CERCLA Sites, 04-011, Rev. 1, Portage Environmental, Inc., January 2005.
Portage, 2005c, Remedial Action Report for Waste Area Group 9, Operable Unit 9-04 at the Idaho National Engineering and Environmental Laboratory, 05-002, Rev. 0, Portage Environmental, Inc., January 2005.
11-13

11-14

12. WASTE AREA GROUP 10 (SITEWIDE AREA)
WAG 10 comprises miscellaneous surface sites and liquid disposal areas throughout the INL Site that are not included within other WAGs (WAGs 1 through 9). WAG 10 also includes INL Site-related concerns about the SRPA that cannot be addressed on a WAG-specific basis.
The scope of WAG 10 was expanded from the original FFA/CO concept (DOE-ID 1991). Several new sites have been identified and a facility assessment has been completed since the initial signing of the INL Site FFA/CO, as discussed in the Comprehensive Remedial Investigation/Feasibility Study for Waste Area Groups 6 and 10 Operable Unit 10-04 (DOE-ID 2001). Other changes in scope have resulted in the creation of OU 10-08 within WAG 10 to evaluate INL Site groundwater concerns. The WAG 6 comprehensive RI/FS (OU 6-05) was incorporated into OU 10-04 in accordance with the FFA/CO (DOE-ID 1991).
The FFA/CO originally identified 42 release sites under WAG 10, which were separated into one no-action OU (called “OU none”) and five action OUs (10-01 through 10-05). Since the initial preparation of the FFA/CO, however, additional sites and three OUs (10-06 through 10-08) have been added to WAG 10.
OU 10-01 contained two disposal pits: the Liquid Corrosive Chemical Disposal Area (LCCDA)-01, which operated between 1960 and about 1971, and LCCDA-02, which operated from about 1970 until the area was closed in 1981 (EG&G 1986). The LCCDA, which is located approximately 0.6 mi east of the main RWMC entrance, was used to dispose of solid and liquid corrosive chemicals such as nitric acid, sulfuric acid, and sodium hydroxide. The LCCDA-01 and LCCDA-02 sites were retained for evaluation in the OU 10-04 comprehensive RI/FS because of uncertainties attributed to the limited number of samples collected for the Track 2 investigations.
Included in OU 10-02 was the Organic-Moderated Reactor Experiment (OMRE) leach pond, which was used for wastewater disposal from the OMRE reactor. The reactor operated between 1957 and 1963 in the southern portion of the INL Site, approximately 2 mi east of the CFA. Between 1 and 2 million gal of radioactive wastewater, possibly contaminated with organic coolant and decomposition waste, are estimated to have been discharged to the pond, where the water either evaporated or infiltrated into the ground. The leach pond area underwent D&D in 1978, when it was remediated by excavating the more contaminated soil and then filling the pond with clean soil. The site was retained for further evaluation under the OU 10-04 comprehensive RI/FS.
The ordnance areas at the INL Site were addressed in OU 10-03 and included 29 areas (including the Naval Ordnance Disposal Area [NODA]) that contained ordnance or explosives-contaminated soil. Walk-downs of the ordnance sites occurred from 1993 through 1997 and in 2000 in search of unexploded ordnance (UXO). An interim action commenced in 1993 to address six of the ordnance areas originally identified under OU 10-03 and designated as OU 10-05. Twenty-seven of the 29 ordnance areas were retained for evaluation under the OU 10-04 comprehensive RI/FS.
OU 10-04 includes the SRPA and two sites identified at the STF, including the STF-601 sump and pits and the STF gun range. Although the SRPA was originally part of OU 10-04, it will be evaluated in the OU 10-08 RI/FS. The WAG 10 sites (Figure 12-1) assessed under the comprehensive OU 10-04 RI/FS included 27 sites consisting of 10 miscellaneous sites, two sites at the LCCDA, one site at the OMRE, two sites at the STF, three large (primary) ordnance areas (one of that included 16 smaller ordnance areas), nine ordnance areas either outside the boundaries of the larger ordnance areas or containing soil contamination, and the fly ash pit (added to OU 10-04 for an ecological risk assessment).
12-1

The three primary ordnance areas include the Naval Proving Ground (also know as the Naval Gun Range), the Arco High-Altitude Bombing Range, and the Twin Buttes Bombing Range. Most of the ordnance, UXO, and ordnance-related areas at the INL Site resulted from ordnance testing, demolition of explosives, and bombing practice conducted during the 1940s, when a portion of the INL Site was a naval proving ground.
Table 12-1 lists the COCs and corresponding remediation goals for OU 10-04 sites requiring cleanup. Note that the UXO sites, while requiring remediation for the ordnance, do not have remediation goals listed, because UXO does not pose a hazard to human health and the environment in terms normally considered for sites requiring remediation; instead, the UXO in these areas presents an unacceptable risk of acute physical injury from fire or explosion.
OU 10-05 was cited in the FFA/CO (DOE-ID 1991) as the “Ordnance Interim Action.” The six sites covered by OU 10-05 are a subset of the ordnance sites evaluated under OU 10-03. The sites consisted of the CFA gravel pit, the explosive storage bunkers north of INTEC, the NOAA grid, the CFA-633 naval firing site and downrange area, the Fire Station II zone and range fire burn area, and the Anaconda power line. The Declaration of the Record of Decision Ordnance Interim Action Operable Unit 10-05 Waste Area Group 10 Idaho National Engineering Laboratory (DOE-ID 1992) was signed in 1992, and the interim action was completed in 1994, as reported in the Preliminary Scoping Track 2 Summary Report for Operable Unit 10-03 Ordnance (DOE-ID 1998).
OU 10-06 was developed to assess radionuclide-contaminated soil areas at several of the WAGs. OU 10-06 also included a non-time-critical removal action to remediate several radionuclide-contaminated soil sites at different WAGs. The “ownership” of the sites outside of WAGs 6 and 10 reverted to the respective WAGs after the OU 10-06 non-time-critical removal action was completed. The residual risk at the two WAG 6 sites that were remediated under OU 10-06 (the EBR-15 and BORAX-08 sites) also was evaluated in the comprehensive RI/FS for WAGs 6 and 10 (DOE-ID 2001).
OU 10-07 comprises the U.S. West buried telecommunications cable that was installed by the American Telephone and Telegraph Company (AT&T) in the early 1950s. The cable is approximately 36.5 mi long and is buried approximately 3 to 4 ft deep, parallel to and approximately 100 yd east of Lincoln Boulevard at the INL Site. The cable consists of copper wiring, paper insulation, and lead sheathing approximately 1/8-in. thick. It is wrapped in spiraled steel and enclosed in jute wrapping impregnated with an asphalt-like substance. The cable originates at CFA and extends along Lincoln Boulevard to INTEC, the RTC (formerly the TRA), the NRF, and TAN. The cable was cut and abandoned by U.S. West in 1990, and a new fiber optic cable was installed.
OU 10-08 includes INL-related concerns about the SRPA that cannot be addressed on a WAG-specific basis. With concurrence from the DOE, EPA, and DEQ, OU 10-08 also includes new sites discovered at other WAGs after their RODs have been signed and if the site cannot be addressed by an existing remedy. As provided in the Waste Area Group 10, Operable Unit 10-08 Remedial Investigation/Feasibility Study Work Plan (Final) (DOE-ID 2002a), the OU 10-08 ROD will be the final decision document to be prepared under the terms of the FFA/CO (DOE-ID 1991). The draft OU 10-08 RI/FS work plan is to be submitted to the EPA and DEQ within 15 months of the signature date for the final site-specific ROD (currently the OU 7-13/14 ROD) with the draft OU 10-08 RI/FS to be completed within 24 months of the final site-specific ROD. The current enforceable date for submittal of the draft OU 7-13/14 ROD is December 2007 with signature to follow approximately 6 months after in order to allow for reviews of the draft and draft final versions of the document.
Table 12-2 provides a chronology of significant events at WAG 10.
12-2

Figure 12-1. Waste Area Group 10 CERCLA sites.
12-3

12-4

Table 12-1. Contaminants of concern for Operable Unit 10-04.
Site (Site Code) Contaminant Concentration Remediation Goal
STF Gun Range (STF-02 )
Arco High-Altitude Bombing Range (ORD-01)
Naval Ordnance Disposal Area 2 (ORD-06)
National Oceanic and Atmospheric Administration (ORD-08)
Twin Buttes Bombing Range (ORD-09)
Fire Station II Zone and Range Fire Burn Area (ORD-10)
Mass Detonation Area (ORD-13)
Experimental Field Station (ORD-15)
Rail Car Explosion Area (ORD-19)
Land Mine Fuze Burn Area (ORD-24)
NA = not applicable RDX = cyclotrimethylene trinitroamine STF = Security Training Facility TNT = trinitrotoluene UCL = upper confidence limit UXO = unexploded ordnance
Lead Maximum 24,000 mg/kg 400 mg/kg
UXO NA NA
RDX Maximum 328 mg/kg 4.4 mg/kg
UXO NA NA
1,3-Dinitrobenzene Maximum 27 mg/kg 6.1 mg/kg
RDX 95% UCL, 1.78 mg/kg 4.4 mg/kg
TNT 95% UCL, 1,900 mg/kg 16 mg/kg
UXO NA NA
UXO NA NA
RDX Maximum 3.7 mg/kg 4.4 mg/kg
TNT Maximum 130 mg/kg 16 mg/kg
UXO NA NA
1,3-Dinitrobenzene Maximum 14 mg/kg 6.1 mg/kg
TNT Maximum 1,100 mg/kg 16 mg/kg
UXO NA NA
UXO NA NA
TNT Maximum 79,000 mg/kg 16 mg/kg
UXO NA NA
12-5

Table 12-2. Chronology of Waste Area Group 10 events.
Event Date
The Naval Proving Ground was established. 1942
The testing of guns commenced. November 20, 1943
The OMRE reactor began operations. September 17, 1957
The Experimental Organic-Cooled Reactor was placed in standby status (never operated).
December 1962
OMRE operations ceased. April 1963
The Declaration of the Record of Decision Ordnance Interim Action Operable Unit 10-05 Waste Area Group 10 Idaho National Engineering Laboratory (DOE-ID 1992) was completed.
1992
The Engineering Evaluation/Cost Analysis (EE/CA) for Non-Time-Critical Removal Action at Unexploded Ordnance Locations at the Idaho National Engineering Laboratory (INEL), Operable Unit (OU) 10-03 (INEL 1994a) was completed.
April 1994
The Remedial Action Report for the Interim Action to Cleanup Unexploded Ordnance Locations at the INEL (Operable Unit 10-05) (Wyle 1994) was completed.
May 1994
The Department of Energy Idaho Field Operations Office Lead Agency Action Memorandum for the Non-Time Critical Removal Action at Unexploded Ordnance Locations at the Idaho National Engineering Laboratory (INEL) (DOE-ID 1994a) was completed.
June 1994
The Engineering Evaluation/Cost Analysis for a Non-Time Critical Removal Action of TNT- and RDX-Contaminated Soil at the Idaho National Engineering Laboratory (INEL 1994b) was completed.
June 1994
The Department of Energy Idaho Operations Office Lead Agency Action Memorandum for the Non-Time Critical Removal Action of TNT- and RDX-Contaminated Soil, Idaho National Engineering Laboratory (DOE-ID 1994b) was completed.
July 1994
The Removal Action Report for the Ordnance Removal Action, Operable Unit 10-03 (Wyle 1995a) was completed.
March 1995
The Addendum to the Removal Action Report for the Ordnance Removal Action, Operable Unit 10-03 (Wyle 1995b) was completed.
October 1995
The U.S. Department of Energy, Idaho Operations Office Lead Agency Action Memorandum Time-Critical Removal Action Ordnance Areas Operable Unit 10-03 Idaho National Engineering Laboratory (INEL) (DOE-ID 1996) was completed.
September 1996
The Final Action Report for the Time Critical Removal Action, Operable Unit 10-03 (Parsons 1997) was completed.
January 1997
The Engineering Evaluation Cost Analysis for Nontime-Critical Removal Action for Unexploded Ordnance at the Idaho National Engineering and Environmental Laboratory Operable Unit 10-03 (DOE-ID 1997) was completed.
June 1997
The Summary Report for the 1997 Non-Time Critical Removal Action for Ordnance at Operable Unit 10-03 (INEEL 1999) was completed.
January 1999
The Comprehensive Remedial Investigation/Feasibility Study for Waste Area Groups 6 and 10 Operable Unit 10-04 (DOE-ID 2001) was completed.
August 2001
12-6

Table 12-2. (continued).
Event Date
The Waste Area Group 10, Operable Unit 10-08, Remedial Investigation/Feasibility Study Work Plan (Final) (DOE-ID 2002a) was completed.
August 2002
The Record of Decision – Experimental Breeder Reactor-I/Boiling Water Reactor Experiment Area and Miscellaneous Sites (DOE-ID 2002b) was completed.
November 2002
The Operable Units 6-05 and 10-04, Experimental Breeder Reactor-I/Boiling Water Reactor Experiment Area and Miscellaneous Sites, Remedial Design/Remedial Action Scope of Work (DOE-ID 2003a) was completed.
February 2003
The U.S. Department of Energy Idaho Operations Office, Lead Agency Action Memorandum Time-Critical Removal Action for Unexploded Ordnance, Operable Unit 10-04, Idaho National Engineering and Environmental Laboratory (INEEL 2003a) was completed.
February 2003
The Remedial Design/Remedial Action Work Plan for Operable Units 6-05 and 10-04, Phase I (DOE-ID 2004a) was completed.
February 2004
The Summary Report for the 2004 Time-Critical Removal Action for Unexploded Ordnance at Operable Unit 10-04 (ICP 2004) was completed.
July 2004
The Remedial Design/Remedial Action Work Plan for Operable Units 6-05 and 10-04, Phase II (DOE-ID 2004b) was completed.
August 2004
The Remedial Action Report for Operable Units 6-05 and 10-04, Phase I (DOE-ID 2005a) was completed.
January 2005
DOE-ID = U.S. Department of Energy Idaho Operations Office EE/CA = engineering evaluation/cost analysis ICP = Idaho Cleanup Project INEEL = Idaho National Engineering and Environmental Laboratory INEL = Idaho National Engineering Laboratory ORME = Organic-Moderated Reactor Experiment OU = operable unit RDX = cyclotrimethylene trinitroamine TNT = trinitrotoluene
12.1 Remedial Actions
WAG 10 has completed one ROD with an interim action, four time-critical removal actions, one non-time-critical removal action, and Phase I of four phases to be completed under the OU 10-04 comprehensive ROD. In 1992, the Declaration of the Record of Decision Ordnance Interim Action Operable Unit 10-05 Waste Area Group 10 Idaho National Engineering Laboratory (DOE-ID 1992) under OU 10-05 addressed the remediation of 170 acres at six ordnance sites consisting of the CFA-633 naval firing site, the CFA gravel pit and French drain, the explosive storage bunkers, the NOAA site, the Fire Station II zone and range fire burn area, and the Anaconda power line. During the interim action prescribed by the ROD, the action destroyed 130 pieces of UXO, detonated 134 lb of trinitrotoluene (TNT) and 104 lb of cyclotrimethylene trinitroamine (RDX), incinerated (off-Site) 185 yd3 of contaminated soil, and landfilled 8,423 lb of metal fragments.
A 1994 non-time-critical removal action addressed 141 acres consisting of three ordnance sites, including NODA (surface only), the CFA landfill, and the Twin Buttes Bombing Range. The action destroyed 1,408 pieces of UXO, detonated 22 lb of bulk high explosives, and landfilled 70,440 lb of metal fragments. The 1994 non-time-critical removal action continued into 1995, when it addressed 22.56 acres of subsurface ordnance at NODA. The 1995 action destroyed 462 pieces of UXO, detonated 18 lb of bulk high explosives, and landfilled 39,470 lb of metal fragments.
12-7

A 1996 time-critical removal action addressed 45 acres consisting of four ordnance sites, including UXO east of the RTC, the rail car explosion area, the land mine fuze burn area, and the projectiles in the riverbed adjacent to the rail car area. The action destroyed 221 pieces of UXO, detonated 64 lb of bulk high explosives, and landfilled 40,250 lb of metal fragments.
A 1997 non-time-critical removal action addressed 204 acres at eight ordnance sites: NODA, the rail car explosion area, the mass detonation area, the NOAA site, the Experimental Field Station, Fire Station II, the craters east of INTEC, and the land mine fuze burn area. The action destroyed 146 pieces of UXO, detonated 343 lb of bulk high explosives, and landfilled 40,182 lb of scrap.
A 2004 time-critical removal action addressed the removal and disposal by detonation of 66 pieces of UXO found at NODA and east of INTEC. The action destroyed 55 5-in. anti-aircraft common rounds and 11 fuzes.
Phase I of the Record of Decision – Experimental Breeder Reactor-I/Boiling Water Reactor Experiment Area and Miscellaneous Sites (DOE-ID 2002b) established institutional controls at 28 WAG 10 sites across the INL Site that have been contaminated by various means, including operations and activities associated with the testing of ordnance and explosives. The WAG 10 sites addressed under OU 10-04 include miscellaneous INL sites such as the OMRE leach pond; the sites related to the Experimental Organic-Cooled Reactor (EOCR), which later became the STF; and numerous ordnance areas. In addition, the Phase I remedial action included development of a comprehensive INL Sitewide approach for establishing, implementing, enforcing, and monitoring institutional controls and implementing a long-term comprehensive approach for ecological monitoring to ensure protection of the ecosystem at the INL Site.
Details of the interim action, time-critical removal actions, non-time-critical removal actions, and Phase I of the comprehensive ROD are described below. Because fieldwork associated with Phases II, III, and IV of the OU 10-04 comprehensive ROD has not yet taken place, any discussion pertaining to these phases is deferred to the next five-year review with the exception of a discussion in Section 12.3, “Progress since Last Review.”
12.1.1 Remedy Selection
12.1.1.1 Operable Unit 10-05 Interim Action. As outlined in the Declaration of the Record of Decision Ordnance Interim Action Operable Unit 10-05 Waste Area Group 10 Idaho National Engineering Laboratory (DOE-ID 1992), the selected remedy for the interim remedial action included the following actions:
• A comprehensive search of historical records pertaining to the Naval Proving Ground and other suspected ordnance sites at the INL Site
• Posting of signs where the public has access to ordnance areas
• A field search of the six identified areas for UXO
• Controlled detonation of the ordnance
• Field sampling of detonation areas and other areas suspected of contamination with explosive compounds
12-8

• Excavation of contaminated soils exceeding action levels
• Off-Site incineration and disposal of contaminated soils.
This alternative was preferred over the others outlined in the ROD, because it best achieved the goals of the evaluation criteria, given the scope of the action.
12.1.1.2 1994 Non-Time-Critical Removal Action. A non-time-critical removal action was conducted in 1994 under OU 10-03. The governing documents for the action were as follows:
• Department of Energy Idaho Field Operations Office Lead Agency Action Memorandum for the Non-Time Critical Removal Action at Unexploded Ordnance Locations at the Idaho National Engineering Laboratory (INEL) (DOE-ID 1994a)
• Engineering Evaluation/Cost Analysis (EE/CA) for Non-Time-Critical Removal Action at Unexploded Ordnance Locations at the Idaho National Engineering Laboratory (INEL), Operable Unit (OU) 10-03 (INEL 1994a)
• Department of Energy Idaho Operations Office Lead Agency Action Memorandum for the Non-Time Critical Removal Action of TNT- and RDX-Contaminated Soil, Idaho National Engineering Laboratory (DOE-ID 1994b)
• Engineering Evaluation/Cost Analysis for a Non-Time Critical Removal Action of TNT- and RDX-Contaminated Soil at the Idaho National Engineering Laboratory (INEL 1994b)
The three TNT- and RDX-contaminated soil sites addressed under the action included the CFA-633 naval firing site, the NOAA area, and the Fire Station II area. The three UXO sites included a 40-acre area within NODA, a 90-acre area within the former Twin Buttes Bombing Range, and four 16-in. shells located east of Lincoln Boulevard near Mile Marker 17. For the UXO, the primary objective of the removal action was to mitigate the hazard of uncontrolled detonation of ordnance to site workers, facilities, and public roads. A secondary objective of the removal action was to provide information for planning and conducting the overall OU 10-03 ordnance areas’ assessment scheduled for 1998. For the TNT- and RDX-contaminated soils, the primary objective of the removal action was to mitigate the potential excess cancer risk associated with personnel inhalation, ingestion, and dermal absorption of soils contaminated with TNT and RDX. The secondary objective was to identify a cost-effective method for treating soil contaminated with explosive residues at the INL Site.
12.1.1.3 1996 Time-Critical Removal Action. As outlined in the U.S. Department of Energy, Idaho Operations Office Lead Agency Action Memorandum Time-Critical Removal Action Ordnance Areas Operable Unit 10-03 Idaho National Engineering Laboratory (INEL) (DOE-ID 1996), a time-critical removal action was selected as the alternative to clear four sites (discussed above) of UXO based on a report issued in May 1996 by the Army Corps of Engineers. The memorandum indicated that the time-critical removal action was justified if the ordnance is exposed and directly threatens human lives. The four areas met these criteria. To accomplish the goal of mitigating the threat from the ordnance, the purpose of the time-critical removal action was to locate, clear, and detonate UXO and clear ordnance and explosive waste at the four sites.
12.1.1.4 1997 Non-Time-Critical Removal Action. As outlined in the Engineering Evaluation Cost Analysis for Nontime-Critical Removal Action for Unexploded Ordnance at the Idaho National Engineering and Environmental Laboratory Operable Unit 10-03 (DOE-ID 1997), a non-time-critical removal action was performed to clear UXO at eight sites at the INL Site: NODA, the rail car explosion
12-9

area, the mass detonation area, the NOAA grid, the Experimental Field Station, Fire Station II, the craters east of INTEC, and the land mine fuze burn area. The 1997 removal action addressed 111 acres at NODA, 52 acres at the rail car explosion area, 74 acres at the mass detonation area, 27.3 acres at the NOAA grid, 2 acres at the Experimental Field Station, 2.5 acres at Fire Station II, 5 acres at the land mine fuze burn area, and 10 acres at the craters east of INTEC.
The recommended alternative for the removal action was search and detonation of UXO. This alternative was selected, because it was the only one that fully mitigated the explosive hazard to INL Site workers. It was a proven method of eliminating the explosive hazard of uncontrolled detonation and was a cost-effective remedy that could be implemented in a timely fashion.
12.1.1.5 2004 Time-Critical Removal Action. As outlined in the U.S. Department of Energy Idaho Operations Office, Lead Agency Action Memorandum Time-Critical Removal Action for Unexploded Ordnance, Operable Unit 10-04, Idaho National Engineering and Environmental Laboratory (INEEL 2003a), a time-critical removal action was warranted to remove UXO discovered after a range fire burned through an area between CFA and the RTC. In addition, several “live” pieces of UXO were discovered east of INTEC. The removal and destruction of UXO by high-order detonation using additional explosives to initiate the detonation addressed the immediate hazards associated with the UXO, namely inadvertent detonation and injury to personnel.
12.1.1.6 Operable Unit 10-04 Phase I Remedial Action. As outlined in the Remedial Design/Remedial Action Work Plan for Operable Units 6-05 and 10-04, Phase I (DOE-ID 2004a), the Phase I activities for the comprehensive remedial action consisted of developing and implementing institutional controls at OU 10-04 sites and developing and implementing INL Sitewide plans for both institutional control and ecological monitoring. Phase I of the RD/RA for OU 10-04 also provided for the removal or isolation of identified surface UXO and TNT/RDX fragments that pose an unacceptable near-term physical hazard. Removal or isolation activities during Phase I of the OU 10-04 RD/RA will not initiate full remediation of the contaminated areas.
12.1.2 Remedial Action Objectives
The following subsections describe the RAOs for each of the time-critical and non-time-critical removal actions, the interim action, and Phase I of the OU 10-04 remedial action.
12.1.2.1 Operable Unit 10-05 Interim Action. A baseline risk assessment was not completed for OU 10-05 at the time of the interim action ROD but has subsequently been performed under the Record of Decision – Experimental Breeder Reactor-I/Boiling Water Reactor Experiment Area and Miscellaneous Sites, Remedial Design/Remedial Action Scope of Work (DOE-ID 2002b). The main risk associated with the six sites addressed under the interim action was the potential explosive hazard associated with the uncontrolled detonation of UXO. To that end, the primary purpose of the interim action was to reduce those risks by finding and disposing of UXO from the six areas identified for the interim action.
Additional risks resulting from exposure to soils contaminated with explosive residues also were addressed during the interim action. Risk-based soil concentrations were back-calculated from the established National Contingency Plan target risk range of 1E-04 to 1E-06 for carcinogenic contaminants and a hazard index of 1 for noncarcinogenic contaminants. Based on those criteria, screening action levels of 440 mg/kg for TNT and 180 mg/kg for RDX were selected to address soils that had concentrations of contaminants exceeding the 1E-04 risk-based soil levels with cleanup standards for the interim action of 44 mg/kg for TNT and 18 mg/kg for RDX, based on the 1E-05 risk-based soil concentrations.
12-10

12.1.2.2 1994 Non-Time-Critical Removal Action. As previously stated, the non-time-critical removal action was conducted at three sites for UXO and three separate sites for TNT- and RDX-contaminated soils. The cleanup standards for soils were 44 ppm for TNT and 18 ppm for RDX. The cleanup standards represented the maximum concentration of soil contaminants allowed to remain in place after excavation of the contaminated locations. The standards were based on the results of risk analysis conducted for the OU 10-04 interim remedial action with concentrations of 44 ppm for TNT and 18 ppm for RDX, representing an excess cancer risk of 1E-05 based on an occupational dermal contact exposure scenario. This scenario was selected, because it resulted in the lowest risk-based concentrations for the exposure pathway.
12.1.2.3 1996 Time-Critical Removal Action. The 1996 time-critical removal action was implemented at four areas that had recently been discovered and presented an imminent risk to INL Site personnel and the public. It was concluded from a site report by the Army Corps of Engineers ordnance experts that these areas presented a risk that should be addressed immediately. This was based on the corps listing the sites with a risk assessment code of 1, which indicated an immediate hazard. The risk assessment code of 1 was based on the ordnance being exposed and human lives threatened, justifying the implementation of a time-critical removal action. Therefore, the action was taken to remove the UXO from the four areas in an effort to reduce the risk posed by its presence.
12.1.2.4 1997 Non-Time-Critical Removal Action. The primary objective of the 1997 removal action was to mitigate the explosive hazard of uncontrolled detonation of ordnance to INL Site workers. The secondary objective was to remove the soil contaminated with explosives. Sites identified as exceeding the remediation goals were evaluated and remediated in 1998. The remediation goals for TNT, RDX, and dinitrotoluene were as follows:
• 47 mg/kg for TNT
• 180 mg/kg for RDX
• 35 mg/kg for dinitrotoluene.
12.1.2.5 2004 Time-Critical Removal Action. The primary objective of the 2004 time-critical removal action was to remove exposed UXO from critical areas at the INL Site. The projectiles and fuzes identified in these areas presented an imminent risk to INL Site personnel and the public. As previously discussed in the section pertaining to the 1996 time-critical removal action, the guidance from the Army Corps of Engineers indicated that a time-critical removal action is warranted in situations when there is an immediate threat due to exposure to ordnance with the risk of serious injury or death. The critical areas identified for the 2004 time-critical removal action contained 5-in. anti-aircraft projectiles and fuzes that presented an explosion hazard due to high explosives. In addition to the explosion hazard, the items also presented a security risk of deliberate detonation.
12.1.2.6 Operable Unit 10-04 Phase I Remedial Action. Institutional controls will be maintained for the WAG 10 sites where risk is greater than 1E-04 (1 in 10,000) for a hypothetical current residential scenario. For purposes of evaluating the need for institutional controls at WAG 10, the potential for current residential risk in excess of 1E-04 was inferred from the risk assessment for the 100-year future residential scenario. Any site with an estimated risk of 1E-06 or greater for the 100-year future residential scenario was assumed to pose a current residential risk of 1E-04. Institutional controls will be implemented and maintained until at least 2095 at WAG 10 sites that pose such a risk, based on the Idaho National Engineering and Environmental Laboratory Comprehensive Facility and Land Use Plan (DOE-ID 2005b), or until the site is released for unrestricted use based either on successful remediation of the site or agency agreement in a five-year review that the site is released for unrestricted use.
12-11

In addition to implementation of institutional controls at WAG 10 sites, the Record of Decision – Experimental Breeder Reactor-I/Boiling Water Reactor Experiment Area and Miscellaneous Sites, Remedial Design/Remedial Action Scope of Work (DOE-ID 2002b) mandated development of a comprehensive INL-wide approach for establishing, implementing, enforcing, and monitoring institutional controls in accordance with EPA Region 10 policy (EPA 1999). The ROD also provided that an institutional control status report would be submitted to the agencies within 6 months of the ROD signature and that the report would be updated at least annually thereafter until the first five-year review. The ROD (DOE-ID 2002b) also mandated implementation of an INL-wide, long-term comprehensive approach for ecological monitoring to ensure protection of the ecosystem at the INL Site.
12.1.3 Remedy Implementation
12.1.3.1 Operable Unit 10-05 Interim Action. The results of the OU 10-05 interim action are documented in the Remedial Action Report for the Interim Action to Cleanup Unexploded Ordnance Locations at the INEL (Operable Unit 10-05) (Wyle 1994). The specific mission of the interim action was to locate, identify, detonate, and dispose of UXO and associated shrapnel and to characterize, remove, and incinerate soils contaminated with explosive residues at six sites. The six sites addressed under the interim action were the CFA gravel pit, the unexploded storage bunkers north of INTEC, the NOAA grid, the CFA-633 naval firing site, and the Anaconda power line. The specific tasks included the completion of visual and geophysical searches, removal of ordnance and explosive particulate, initial sampling of selected areas, removal of contaminated soil, verification sampling of excavated areas, reclamation of the sites, and shipment of contaminated soil for disposal.
Ordnance was located and either disposed of by detonation or demilitarized, with the scrap metal disposed of at the CFA landfill, and the explosive was disposed of by detonation. Items included an electric squib, illumination candles, grenades, projectiles, fuze components, and miscellaneous UXO. During searches to locate UXO, evidence of soil contamination was found and flagged for sampling. Soil contamination was noted at Fire Station II, the CFA-633 naval firing site, and the NOAA area. Locations identified during the sampling effort that exceeded the action levels of 440 ppm TNT and 180 ppm RDX were excavated and containerized for shipment off-Site for disposal by incineration. In most cases, the sampling results indicated that the contamination was limited to within 4 in. of the surface. An iterative process of excavation followed by verification sampling was implemented to ensure that contamination exceeding the action levels had been removed. A total of 201 1-yd3 boxes were filled with contaminated soil, most of which originated from the CFA-633 area with smaller amounts coming from the NOAA and Fire Station II areas. The areas impacted by the excavation activities were reseeded.
12.1.3.2 1994 Non-Time-Critical Removal Action. The 1994 action was carried out over 16 months, beginning in 1994 with the cleanup of the Twin Buttes Bombing Range, the four projectiles located east of Lincoln Boulevard at Mile Marker 17, and a portion of the NODA. Cleanup of the remainder of the NODA site was completed during the summer and fall of 1995. The Removal Action Report for the Ordnance Removal Action, Operable Unit 10-03 (Wyle 1995a) summarizes the work performed in 1994, and the Addendum to the Removal Action Report for the Ordnance Removal Action, Operable Unit 10-03 (Wyle 1995b) updates the report as to the work completed in 1995. Work-specific tasks included mobilization to the site, a visual UXO search of the site followed by a geophysical search, and ordnance and scrap removal. The located UXO was either destroyed in place or transported to the mass detonation area for disposal by high-order detonation. Demilitarized UXO was inspected to ensure that no hazard remained and was then taken to the CFA landfill for disposal.
The selected remedy for the TNT- and RDX-contaminated soils was bioremediation. A treatability study was completed in 1999, as documented in the Waste Area Group 10 RDX/TNT CERCLA Treatability Study Final Report (INEEL 2000). The study demonstrated that the technology
12-12

was technically feasible; however, the ROD (DOE-ID 2002b) provides a selected remedy of removal by excavation over bioremediation. The TNT and RDX portion of the 1994 non-time-critical removal action has not been completed but will be addressed under Phase II of the OU 10-04 remedial action scheduled for 2007.
12.1.3.3 1996 Time-Critical Removal Action. The results of the 1996 time-critical removal action are documented in the Final Action Report for the Time Critical Removal Action, Operable Unit 10-03 (Parsons 1997). The primary tasks included mobilization to the site, visual search for UXO, ordnance and scrap removal, a geophysical search for UXO followed by analysis of geophysical survey data, demilitarization of ordnance items, and disposal of ordnance and explosive items by detonation. Within the land mine fuze burn area, a total of 1,018 individual fuzes were removed, 118 of which contained explosives. Additionally, over 36,000 lb of scrap and approximately 60 lb of raw explosive also were removed from the area. Scrap removed from the rail car explosion area included over 4,250 lb of inert materials, including rail car components and ordnance residue. In addition, several other explosive items, including portions of 18 aerial bombs and 10 5-in. projectiles were collected from various locations and destroyed during demolition operations. All loose explosives encountered during the project were collected and destroyed during the demolition of the UXO.
12.1.3.4 1997 Non-Time-Critical Removal Action. The Summary Report for the 1997 Non-Time Critical Removal Action for Ordnance at Operable Unit 10-03 (INEEL 1999) presents the results of the 1997 non-time-critical removal action. The areas included were the NODA, the NOAA grid, the Fire Station II zone, the mass detonation area, the Experimental Field Station, the rail car explosion area, the land mine fuze burn area, and the craters east of INTEC. Ordnance removal was completed at four of the eight sites: the NOAA grid, the Fire Station II zone, the Experimental Field Station, and the craters east of INTEC. Further removal of ordnance was required at the remaining four sites after the 1997 non-time-critical removal action was completed. The removal action at these four sites was not completed in 1997 because of programmatic funding constraints. However, the removal action for the NODA grid was completed as part of the 2004 time-critical removal action. Removal actions for the mass detonation area, the rail car explosion area, and the land mine fuze burn area will be addressed under Phase IV of the OU 10-04 remedial action, which is currently planned to begin in 2007.
12.1.3.5 2004 Time-Critical Removal Action. The Summary Report for the 2004 Time-Critical Removal Action for Unexploded Ordnance at Operable Unit 10-04 (ICP 2004) summarizes the results of the 2004 time-critical removal action. The objective of the time-critical removal action was to remove, transport, and destroy UXO that was found near the NODA and INTEC. The UXO was recovered, transported to the mass detonation area, and destroyed by high-order detonation. In total, 55 5-in. anti-aircraft common rounds and 11 fuzes were recovered and disposed of.
12.1.3.6 Operable Unit 10-04 Phase I Remedial Action. Implementation of the OU 10-04 Phase I remedial action is discussed in the Remedial Action Report for Operable Units 6-05 and 10-04, Phase I (DOE-ID 2005a). The primary purpose of the Phase I remedial action was to establish institutional controls at 28 WAG 10 sites that have been contaminated by various means, including operations and activities associated with the testing of ordnance and explosives. The WAG 10 sites assessed under Phase I of OU 10-04 included the LCCDA; the OMRE leach pond; the sites related to the EOCR (which later became the STF); the STF sumps, pits, and gun range; and numerous ordnance areas.
Implementation of institutional controls included emplacement of institutional control signs at the applicable WAG 10 sites and visible access restrictions to the INL Site. Land use restrictions for the WAG 10 sites require that the DOE-ID notify the EPA and DEQ before any transfer, sale, or lease to a nonfederal entity (such as a state or local government or a private person) of any DOE-ID-managed real property that is the subject to institutional controls required by the ROD (DOE-ID 2002b). Restrictions on
12-13

drilling or excavation activities within the institutionally controlled WAG 10 sites require completion of an environmental checklist, with conditions that must be met before beginning a project that might disturb soil within a specified site. The checklist also must identify the applicable instructions that the drilling/excavation project must comply with as well as any ARARs.
The Operations and Maintenance Plan for Operable Units 6-05 and 10-04, Phase I (DOE-ID 2004c) describes the long-term RD/RA activities for Phase I of OU 10-04 at the INL Site. These activities include removal or isolation of surface ordnance and explosives discovered during routine operations that, based on expert evaluation, pose an unacceptable near-term physical hazard. The INEEL Sitewide Institutional Controls Plan (DOE-ID 2004d) documents the site-specific institutional controls currently in place at the INL Site. The plan identifies common institutional control measures and describes methods used to inspect institutionally controlled sites and methods to evaluate whether the institutional control requirements are being met. The Long-Term Ecological Monitoring Plan for the Idaho National Engineering and Environmental Laboratory (INEEL 2004) presents the approach for INL long-term ecological monitoring and two primary objectives. The first is to verify that the objectives of each INL Site remedial action are maintained. The second is to determine that the long-term, INL Sitewide ecological impact of the contamination left in place is within acceptable limits. In accordance with that plan, an annual FSP will be prepared to describe the field investigations to be performed within a fiscal year. Once the monitoring is completed for a particular year, an annual report that summarizes the results of the monitoring effort will be prepared.
12.2 Data Evaluation
12.2.1 Site Inspections
Institutional control inspections are conducted annually at WAG 10 sites. The following summaries discuss annual inspections sites conducted at WAG 10 within the timeframe of this five-year review.
Institutional control inspections were required within 6 moths of signature of the ROD and were completed in March 2003 (INEEL 2003b). No deficiencies were identified during the 2003 inspection; however, the sites were posted with “Environmentally Controlled Area” signs, which needed to be replaced with the standardized institutional control sign. Signs were replaced during inspections conducted in June 2004 (DOE-ID 2004e). Visible access restrictions, control of activities, and land-use restrictions were evaluated, and no deficiencies were identified.
Operations and maintenance at WAG 10 consist of removal or isolation of surface ordnance and explosives discovered during routine operations. Consequently, dedicated operations and maintenance inspections are not conducted at WAG 10.
12.2.2 Time-Critical Removal Actions
For the 1996 time-critical removal action and the 2004 time-critical removal action, actions were implemented to reduce the risk to personnel and the public due to the presence of UXO. No remediation of contaminated soils was performed; therefore, no data were collected. The selected remedy for the 1994 non-time-critical removal action for TNT- and RDX-contaminated soils was bioremediation. As discussed previously, the TNT and RDX portion of the 1994 non-time-critical removal action was not completed; therefore, no data evaluation is required. For the OU 10-04 comprehensive ROD, the remedial actions have yet to be performed. Data evaluation is limited to the OU 10-05 interim action.
12-14

12.2.2.1 Operable Unit 10-05 Interim Action. As stated previously, sampling during the OU 10-05 interim action was performed at Fire Station II, the CFA-633 naval firing site, and the NOAA area. The cleanup standards for the interim action were 44 mg/kg for TNT and 18 mg/kg for RDX. For the CFA-633 area, the TNT verification sample results ranged from below the method detection limit to a maximum of 6.4 mg/kg, with a single result outside of the normal range of 228 mg/kg. The RDX results ranged from below the method detection limit to a maximum of 24 mg/kg. The maximum results were below the defined action levels for the interim action.
The NOAA area TNT verification sample results ranged from below the method detection limit to a maximum of 6.7 mg/kg. All RDX verification sample results were below the method detection limit. For the Fire Station II area, the TNT verification sample results ranged from below the method detection limit to a maximum of 29 mg/kg, while the RDX verification sample results ranged from below the method detection limit to a maximum of 1.1 mg/kg.
12.2.2.2 1997 Non-Time-Critical Removal Action. For the 1997 non-time-critical removal action, sampling was not completed at seven of the eight sights, because either the ordnance removal was not complete or insufficient time remained in the 1997 field season. Soil sampling for these seven sites was deferred to the OU 10-04 RI/FS. Sampling was completed during the 1997 non-time-critical removal action at the mass detonation area. The remediation goals for TNT, RDX, and dinitrotoluene were defined as 47 mg/kg, 180 mg/kg, and 35 mg/kg, respectively. The RDX results were below the method detection limit. The dinitrotoluene results ranged from below the method detection limit to a maximum of 1.6 mg/kg. The TNT results ranged from below the method detection limit to a maximum of 94 mg/kg.
12.3 Progress since Last Review
This is the first five-year review conducted for WAG 10. However, ongoing remediation activities include the maintenance of institutional controls at the WAG 10 sites and continued operations and maintenance activities and ecological monitoring, as defined for the OU 10-04 Phase I remedial action. Future activities include implementation of OU 10-04 Phases II through IV and preparation of the OU 10-08 RI/FS and subsequent ROD.
12.3.1 Operable Unit 10-04 Phase I Activities
As discussed previously, the OU 10-04 Phase I remedial action consists of the following four main activities:
• Implementation and maintenance of institutional controls at WAG 10 sites
• Operations and maintenance activities, specifically to include the removal and disposal of ordnance and explosives that pose an imminent hazard to human health
• Preparation and implementation of an INL Sitewide institutional controls plan
• Preparation and implementation of an INL Sitewide long-term ecological monitoring plan.
12-15

The 28 WAG 10 sites requiring institutional controls are as follows:
• OMRE-01: OMRE leach pond
• ORD-01: Arco High-Altitude Bombing Range
• ORD-03: CFA-633 naval firing site and downrange area
• ORD-04: CFA gravel pit
• ORD-05: CFA sanitary landfill area
• ORD-06: NODA
• ORD-07: Explosive storage bunkers—north of INTEC
• ORD-08: NOAA area
• ORD-09: Twin Buttes Bombing Range
• ORD-10: Fire Station II zone and range fire burn area
• ORD-11: Anaconda power line
• ORD-12: old military structures
• ORD-13: mass detonation area
• ORD-14: dairy farm revetments
• ORD-15: Experimental Field Station
• ORD-16: UXO east of the RTC (formerly the TRA)
• ORD-17: burn ring south of the Experimental Field Station
• ORD-18: igloo-type structures northwest of the Experimental Field Station
• ORD-19: rail car explosion area
• ORD-20: UXO east of the Army Reentry Vehicle Facility site
• ORD-21: Juniper Mine
• ORD-22: projectiles found near Mile Markers 17, 18, and 19
• ORD-24: land mine fuze burn area
• ORD-25: ordnance and dry explosives east of the Big Lost River (same as ORD-19)
• ORD-26: zone east of the Big Lost River
• ORD-27: dirt mounts near the Experimental Field Station, NOAA, and NRF
• ORD-28: craters east of INTEC
• STF-02: STF gun range.
Institutional controls will remain in place at these 28 sites until the remediation is either successfully completed or the controls are discontinued based on the results of a five-year review.
12-16

12.3.2 Operable Unit 10-04 Phase II Activities
The requirements for the OU 10-04 Phase II activities are delineated in the Remedial Design/Remedial Action Work Plan for Operable Units 6-05 and 10-04, Phase II (DOE-ID 2004b). Specifically, Phase II addresses the removal and destruction of TNT and RDX fragments found on five sites and remediation of chemically contaminated (principally TNT and RDX) soil found at the explosive test sites. The following five sites are located within the Naval Proving Ground:
• Fire Station II zone and range fire burn area
• Experimental Field Station
• Land mine fuze burn area
• NOAA area
• NODA.
The remediation of the TNT/RDX-contaminated soil sites will include (1) establishing and maintaining institutional controls during Phase I (as required) until the contamination is removed or reduced to acceptable levels, (2) performing a visual survey to identify any UXO and TNT/RDX fragments and stained soil coupled with a geophysical survey for UXO, (3) excavating contaminated soil, (4) segregating and disposing of TNT/RDX fragments at the mass detonation area, (5) sampling and analyzing soil to determine excavation requirements and when the remediation goals have been achieved, (6) backfilling and contouring excavated areas, (7) revegetating affected areas, and (8) monitoring air and soil during the remedial action.
The current working schedule for the Phase II activities provides that the remedial action field work will commence in October 2007 with a projected completion date of August 2008. The draft Phase II remedial action report will be submitted to the agencies in November 2008 with an enforceable date of November 30, 2015.
12.3.3 Operable Unit 10-04 Phase III Activities
The “Remedial Design/Remedial Action Work Plan for Operable Units 6-05 and 10-04, Phase III (Draft)”a outlines the requirements for the OU 10-04 Phase III activities that address the remediation of lead-contaminated soil at the STF-02 gun range. Remediation of the gun range will include (1) excavation of contaminated soil, (2) physical separation of copper and lead for recycling (if allowed by DOE policy), (3) returning to the site any separated soils that are below the remediation goal, (4) stabilization of contaminated soils as required, (5) disposal of the separated soils that exceed the remediation goal, (6) encapsulation of creosote-contaminated railroad ties and disposal, (7) removal and disposal of the wooden building and asphalt pads found at the gun range, (8) sampling and analysis of soil to determine excavation requirements and when the remediation goals have been met, (9) backfilling and contouring excavated areas, and (10) revegetating the affected area.
The current working schedule for the Phase III activities provides that the remedial action fieldwork will commence in October 2009 with completion slated for October 2010. The draft Phase III remedial action report will be submitted to the agencies in March 2011 with an enforceable date of August 31, 2018.
a. “Remedial Design/Remedial Action Work Plan for Operable Unit 6-05 and 10-04, Phase III (Draft),” DOE/NE-ID-11202, Rev. 0, U.S. Department of Energy Idaho Operations Office, March 2005.
12-17

12.3.4 Operable Unit 10-04 Phase IV Activities
The OU 10-04 Phase IV activities address the remediation of UXO-contaminated sites. The RD/RA work plan for Phase IV will be prepared in FY 2006. The three main sites requiring remediation for UXO include the Naval Proving Ground, the Arco High-Altitude Bombing Range, and the Twin Buttes Bombing Range. The Naval Proving Ground includes 29 smaller ordnance sites; six of the sites have a high probability for and/or the confirmed presence of UXO. These six smaller sites include the Experimental Field Station, the NOAA area, the land mine fuze burn area, the mass detonation area, the rail car explosion area, and NODA. Because the mass detonation area will be used for the disposal of UXO and explosives by detonation, the area will be further assessed for the presence of explosives during the Phase IV activities and remediated for explosives in addition to UXO, as necessary.
As defined in the Operable Units 6-05 and 10-04, Experimental Breeder Reactor I/Boiling Water Reactor Experiment Area and Miscellaneous Sites, Remedial Design/Remedial Action Scope of Work (DOE-ID 2003a), the draft RD/RA work plan will be prepared in FY 2006 with an enforceable date of submittal to the agencies for review by July 31, 2006. The remedial action fieldwork will commence with the mobilization for UXO surveys in February 2011 followed by UXO removal and disposal by detonation. The working schedule date for the Phase IV remedial action report provides for submittal of the draft for review by the agencies in November 2013 with an enforceable date of September 2020. The working schedule date for the remedial action report might be accelerated based on the new contract for INL Site cleanup; the fieldwork schedule might be moved forward as well.
12.3.5 Operable Unit 10-08 New Sites, Track 1s, and Track 2s
In accordance with the Comprehensive Remedial Investigation/Feasibility Study for Waste Area Group 6 and 10, Operable Unit 10-04 (DOE-ID 2001), the OU 10-04 responsibilities discussed in the FFA/CO (DOE-ID 1991) have been modified by the inclusion of OU 10-08. The OU 10-08 RI/FS scope includes the evaluation of the INL Sitewide groundwater concerns, the evaluation of new sites that are passed to WAG 10 by other WAGs, and the evaluation of new sites that are discovered after the OU 10-04 RI/FS process is completed. OU 10-08 may also be responsible for characterizing and performing necessary remedial activities at new sites discovered inside the boundaries of WAGs 1 through 7.
To date, a total of 76 new sites have been included for evaluation under OU 10-08. These sites include three from CFA, three from PBF, 15 from the RTC, nine from TAN, and 48 miscellaneous sites outside of the other WAGs. Table 12-3 summarizes the OU 10-08 sites and the current determination for each of them.
12.3.6 Operable Unit 10-08 Snake River Plain Aquifer
One of the primary purposes of OU 10-08 is the comprehensive evaluation of impacts to groundwater from operations at the INL Site. Some of these operations have introduced radioactive and hazardous contaminants into the environment, and a number of these contaminants have been found in the SRPA. The potential impacts to the groundwater from INL Site activities are being thoroughly investigated as part of the OU 10-08 RI/FS.
12-18

Table 12-3. Operable Unit 10-08 new sites.
12-19
WAG of Approval Origin Site Code Description Activity Recommendation Datea
1 TAN-30 TAN/TSF Fire Station wastewater system NSI No action 01/31/2005 discharge drainage ditch
1 TSF-08 TSF Heat Transfer Reactor Experiment ESD Risk reevaluation under OU 10-08 RI/FS Pending III mercury spill area
1 TSF-49 1-TAN IDWR #1 TAN-702 NSI No action Pending
1 TSF-50 2-TAN IDWR#2 TAN-724 NSI No action Pending
1 TSF-51 TAN-607A pool release NSI in preparation — —
1 TSF-52 TAN-607 Decontamination Shop waste NSI Evaluate under the OU 10-08 RI/FS. Pending discharge pipe
1 TSF-53 Saturated soil on the west side of NSI in preparation — — TAN-633
1 TSF-54 Soil beneath TAN-607 Decontamination NSI Evaluate under the OU 10-08 RI/FS. Pending Shop sump
1 TSF-55 Soil in pipe trench west of TAN-666 NSI Evaluate under the OU 10-08 RI/FS. Pending
2 TRA-56 TRA acid transfer line from TRA-631 to Track 1 To be evaluated under OU 10-08 comprehensive 02/26/2003 TRA-645 RI/FS; maintain institutional controls
2 TRA-57 Abandoned buried diesel fuel oil line Track 1 To be evaluated under OU 10-08 comprehensive 05/09/2002 RI/FS
2 TRA-59 Abandoned buried acid line from Track 1 No further action 02/26/2003 TRA-631 to TRA-671
2 TRA-60 Fenced area north of TRA-608 Track 2 No further action Pending
2 TRA-62 Abandoned discharge lines, TRA-608 Track 2 investigation — — area to TRA-701 chemical leach pond ongoing
2 TRA-63 TRA-605 warm waste line Track 2 No further action Pending
2 TRA-64 5-TRA IDWR #12 TRA FD5 NSI No action Pending
2 TRA-65 7-TRA IDWR#15 TRA FD7 NSI No action Pending
2 TRA-66 8-TRA IDWR#16 TRA FD8 NSI No action Pending

Table 12-3. (continued).
12-20
WAG of Approval Origin Site Code Description Activity Recommendation Datea
2 TRA-67 13-TRA IDWR#21 TRA FD13 NSI No action Pending
2 TRA-68 14-TRA IDWR#22 TRA FD14 NSI No action Pending
2 TRA-69 15-TRA IDWR#23 TRA FD15 NSI No action Pending
2 TRA-70 19-TRA IDWR#27 TRA FD19 NSI No action Pending
2 TRA-71 20-TRA IDWR#None TRA FD20 NSI No action Pending
2 TRA-72 21-TRA IDWR#None TRA FD21 NSI No action Pending
4 CFA-10A Soil-filled concrete ring adjacent to Track 2 No action Pending CFA-667
4 CFA-53 Soil beneath CFA-617 wastewater piping NSI No further action Pending and drains
4 CFA-54 Buried waste pipe south of CFA-674 Track 2 Investigation ongoing Pending
5 PBF-33 Abandoned debris trench Track 1 No action; remove asbestos-containing debris. Pending
5 PBF-34 Abandoned debris located near the Mixed Track 1l No action Pending Waste Storage Facility
5 PBF-35 Abandoned power and control cables Track 1 No action 01/14/2005 between buildings at the PBF Complex
10 MISC-01 Debris along the Big Lost River near the Track 1 No further action 03/29/2002 RWMC
10 MISC-02 Car body south of Highway 33 on the Track 1 No further action 08/25/2004 INL Boundary Road
10 MISC-03 Car body adjacent to the Big Lost River Track 1 No further action 04/02/2002
10 MISC-04 Diesel-saturated dirt pile near Track 1 Characterize for hydrocarbons 01/14/2005 Experimental Field Station
10 MISC-05 Excavation pit/mound and debris east of Track 1 No further action Pending Guard Gate 3
10 MISC-06 Cistern north of NRF Track 1 No further action 04/02/2002
10 MISC-07 Debris near cinder pit on the INL Track 1 No further action 04/02/2002 southern border

Table 12-3. (continued).
12-21
WAG of Origin Site Code Description Activity Recommendation
Approval Datea
10 MISC-08 Debris near intersection of Highways 33 and 22
Track 1 No further action Pending
10 MISC-09 Debris south of Highway 33 east of TAN Track 1 No action 09/03/2004
10 MISC-10 Debris in canal west of Guard Gate 3 Track 1 No action 01/14/2005
10 MISC-11 Debris west of the southern end of Highway 22
Track 1 No further action 04/02/2002
10 MISC-12 Debris north of Highway 33 near the west entrance
Track 1 No further action 04/02/2002
10 MISC-13 Debris next to canal inside boundary of NRF
Track 1 No further action 04/02/2002
10 MISC-14 Debris in the Big Lost River sinks area Track 1 No further action 04/02/2002
10 MISC-15 Navy debris in canal between the RTC and the NRF
Track 1 No further action Pending
10 MISC-16 Farming debris in Big Lost River sinks area
Track 1 No further action 09/03/2004
10 MISC-17 Staining on East Butte Road Track 1 No action 01/14/2005
10 MISC-18 Uncapped well in Big Lost River sinks area
Track 1 No action; abandon in accordance with Idaho Administrative Procedures Act standards.
01/14/2005
10 MISC-19 Homestead site at Birch Creek and Cedar Canyon Road
Track 1 No further action 04/02/2002
10 MISC-20 Stained road near NRF Track 1 No further action 04/02/2002
10 MISC-21 Staining on Road 17 from STF to Portland Road
Track 1 No action 01/14/2005
10 MISC-22 Rusty metal debris adjacent to Highway 28
Track 1 No action 09/03/2004
10 MISC-23 Debris in Birch Creek drainage gravel pit Track 1 No further action 04/02/2002
10 MISC-24 Homestead site northwest of the Specific Manufacturing Capability
Track 1 No further action 04/02/2002

Table 12-3. (continued).
12-22
WAG of Approval Origin Site Code Description Activity Recommendation Datea
10 MISC-25 Mounds, cans, and drums northeast of Track 1 Perform total petroleum hydrocarbon analyses Pending NRF to determine the need for a Track 2.
10 MISC-26 Detonation pit between NRF and TRA Track 1 ESD to OU 10-04 ROD for inclusion 01/14/2005
10 MISC-27 Mound near East Portland/East Ogden Track 1 No action 01/14/2005 intersection
10 MISC-28 Canal builder’s campsite Track 1 No action 01/14/2005
10 MISC-29 Asphalt near main guard gate Track 1 No further action 09/03/2004
10 MISC-30 Debris on Richard Butte Track 1 Remove batteries and analyze soil for zinc; if 01/14/2005 noncompliant, include in OU 10-08; if compliant, no action
10 MISC-31 Two 8-in.-diameter rounds Track 1 No action 01/14/2005
10 MISC-32 Mound near RWMC gravel pit Track 1 No action 01/14/2005
10 MISC-33 Experimental test drum in EOCR-01 Track 2 No action Pending leach pond
10 MISC-34 Howe Peak diesel spill Track 1 No action 01/14/2005
10 MISC-35 Detonation pits north of EOCR Track 1 ESD to OU 10-04 ROD for inclusion 01/14/2005
10 MISC-36 Debris southwest of Highway 28 Track 1 No action 09/03/2004
10 MISC-37 Lids by Experimental Field Station Track 1 No action 01/14/2005
10 MISC-38 Uncapped well east of the MFC Track 1 No action; abandon in accordance with Idaho 01/14/2005 Administrative Procedures Act regulations.
10 MISC-39 Ammunition remains in EOCR area Track 1 No action 01/14/2005
10 MISC-40 Mound southeast of EOCR buildings Track 1 No action 01/14/2005
10 MISC-41 Pits/mounds northeast of EOCR Track 1 No action 01/14/2005
10 MISC-42 Construction debris northeast of EOCR Track 1 No action 01/14/2005
10 MISC-43 Construction pit northwest of EOCR Track 1 No action 01/14/2005
10 MISC-44 Concrete-lined depression west of CFA Track 1 No action 01/14/2005

12-23
Table 12-3. (continued).
WAG of Origin Site Code Description Activity Recommendation
Approval Datea
10 MISC-45 Dirt pile with naval smoke cans near INTEC
Track 1 Track 2 01/14/2005
Track 2 investigation ongoing
— —
10 MISC-46 Test apparatus west of CFA Track 1 No further action; remove the trash. 09/03/2004
10 MISC-47 Small fuel tank north of INTEC Track 1 No action; remove the tank. 01/14/2005
10 MISC-48 Mud Lake landfill NSI No action Pending
a. Documents identified as pending require agency approval/signoff by one or more of the agencies.
CFA = Central Facilities Area EOCR = Experimental Organic-Cooled Reactor ESD = explanation of significant differences FD = field drain IDWR = Idaho Department of Water Resources INL = Idaho National Laboratory INTEC = Idaho Nuclear Technology and Engineering Center MFC = Materials and Fuels Complex NRF = Naval Reactors Facility NSI = new site identification OU = operable unit PBF = Power Burst Facility RI/FS = remedial investigation/feasibility study ROD = Record of Decision RTC = Reactor Technology Complex RWMC = Radioactive Waste Management Complex STF = Security Training Facility TAN = Test Area North TRA = Test Reactor Area TSF = Technical Support Facility WAG = waste area group

The comprehensive nature and scope of OU 10-08 necessitate that monitoring data be collected over many years and long-term integration be maintained among individual WAGs to ensure that all data needed are available for the OU 10-08 RI/FS. The large area of the OU 10-08 domain and the long groundwater travel times require long-term monitoring of water quality and water levels to adequately characterize the SRPA for risk-assessment calculations. In addition, it is critical that the OU 10-08 numerical and conceptual model be interfaced with the other individual WAG models to create a comprehensive understanding of the aquifer flow regime, contaminant sources, and contaminant transport in the SRPA. An integrated understanding of the overall health of the SRPA beneath the INL Site is critical for communicating INL impacts to others who use SRPA water.
The work scope of the OU 10-08 RI/FS is based on filling data gaps originally identified in the OU 10-08 RI/FS Work Plan (DOE-ID 2002a). The activities in the work scope are necessary to characterize and assess INL-wide groundwater risks and will ultimately be used in the OU 10-08 ROD. It is important to note that many of the tasks done under the OU 10-08 RI/FS also support individual WAGs. For example, the groundwater flow characteristics and INL-scale subsurface stratigraphy are used as boundary conditions for the smaller “windows” in the SRPA studied by individual WAGs. In addition, assessment of intermingling plumes between INTEC and RWMC will impact risk assessment calculations. The tasks identified in the OU 10-08 RI/FS Work Plan and the progress made toward their completion are summarized in reports published annually. To date, the Waste Area Group 10, Operable Unit 10-08, Remedial Investigation/Feasibility Study Annual Report for Fiscal Year 2003 (DOE-ID 2004f) and the Waste Area Group 10, Operable Unit 10-08, Remedial Investigation/Feasibility Study Annual Status Report for Fiscal Year 2004 (DOE-ID 2005c) have been submitted to the agencies for their review.
The 11 main tasks required to be completed for the OU 10-08 RI/FS are as follows:
1. Develop a comprehensive database of groundwater sample results
2. Evaluate the groundwater
3. Evaluate the alternative groundwater sampling and purging methodology
4. Evaluate the potentially commingled plumes
5. Evaluate the groundwater quality for current compliance with MCLs or other risk-based concentrations
6. Develop a method to incorporate new sites into OU 10-08
7. Evaluate phytoremediation of mercury in soil at the TSF-08 site
8. Revise the Sitewide groundwater model
9. Implement institutional controls
10. Evaluate the risk to groundwater
11. Verify water-level measuring points.
12-24

To date, Tasks 1, 3, 6, 9, and 11 have been completed. For Task 1, all sampling data are now entered into the Environmental Data Warehouse, which was developed under the purview of the Long-Term Stewardship Project. The evaluation of alternative groundwater sampling and purging methodology that comprise Task 3 was completed in FY 2003 with a report of the study provided in Appendix C of the Waste Area Group 10, Operable Unit 10-08, Remedial Investigation/Feasibility Study Annual Report for Fiscal Year 2003 (DOE-ID 2004f). Task 6 has been satisfied with the completion and implementation of Management Control Procedure (MCP) -3448, “Inclusion of New Sites under the Federal Facility Agreement and Consent Order,” which details the procedures for reporting new sites and provides direction for listing them with the appropriate WAG. Implementation of institutional controls, as required by Task 9, has been accomplished through the development of the INEEL Sitewide Institutional Controls Plan (DOE-ID 2004d), which was completed as part of the Remedial Design/Remedial Action Work Plan for Operable Units 6-05 and 10-04, Phase I (DOE-ID 2004a) in FY 2004. Task 11, consisting of the verification of water-level measuring points, was completed in FY 2004 and was documented in the Long-Term Stewardship Fiscal Year 2004 Well Surveillance/Maintenance Report (ICP 2005).
With the exception of Task 7 (the evaluation of phytoremediation of mercury in the soil at the TSF-08 site), the remaining tasks revolve around evaluating the groundwater defined by the SRPA and preparing updated conceptual and numerical groundwater models for OU 10-08. The Idaho National Engineering and Environmental Laboratory Operable Unit 10-08 Sitewide Groundwater Model Work Plan (DOE-ID 2004g) outlines the work elements associated with modeling efforts required to support OU 10-08. These models will support a comprehensive evaluation and cumulative risk analysis of environmental impacts from INL Site operations to the underlying SRPA for the OU 10-08 RI/FS. Additionally, the model will serve to integrate knowledge gained during investigations of individual WAGs into a comprehensive aquifer management tool for long-term stewardship responsibilities. The efforts will consist of revising and documenting the subregional conceptual model of groundwater flow at the INL Site based on current knowledge, identification of data gaps and the recommended approach for filling those gaps, preparation of an OU 10-08 numerical model of subregional groundwater flow based on the updated conceptual model, and development of a numerical model of contaminant transport to support a comprehensive INL Site groundwater risk assessment.
For Task 7 (the residual risk associated with the mercury contamination remaining at the TSF-08 site), a removal action was performed in 1994, and the area was backfilled with clean gravel. Post-removal sampling showed low levels of mercury at least 2.5 ft below ground surface. The site was transferred to WAG 10, based on agency agreement that the site should be included under the OU 10-08 RI/FS and future ROD. The Explanation of Significant Differences for the Record of Decision for the Test Area North Operable Unit 1-10 (DOE-ID 2003b) outlines this change. A reevaluation of the final remediation goal for mercury is now warranted for human and ecological receptors, because new guidance and information from the EPA are available. The risk to human health and the environment will be evaluated in FY 2005 under OU 10-08.
12.4 Technical Assessment
Question A: Is the remedy functioning as intended by the decision documents?
According to sampling data and site inspections, all COCs are at or below action levels as defined for the actions that have taken place to date. It is important to recognize that key remedial actions have yet to be performed, as defined in the ROD (DOE-ID 2002b). At sites where contaminant concentrations prohibit free release of the site or remedial actions have yet to be implemented, institutional controls have been established in accordance with Phase I of the OU 10-04 remedial action.
12-25

Question B: Are the exposure assumptions, toxicity data, cleanup levels, and remedial action objectives used at the time of the remedy still valid?
For interim actions with certain exposure assumptions or toxicological parameters that were used to derive the specified cleanup levels, changes in the parameters have occurred that would negatively impact the original assumptions. With the subsequent development of the ROD (DOE-ID 2002b), the new exposure assumptions and toxicological parameters were used to assess all of the OU 10-04 contaminated soil sites. Based on these revised parameters, updated remediation goals have been developed for the OU 10-04 sites where contamination that poses an unacceptable risk to human health or the environment exists. Those sites will subsequently be remediated for TNT, RDX, or 1,2-dinitrobenzene contamination, as applicable, during Phase II of the OU 10-04 remedial action scheduled to begin in October 2007.
Question C: Has any other information come to light that would call into question the protectiveness of the remedy?
As previously stated, the ROD (DOE-ID 2002b) addresses sites requiring remediation based on current exposure and toxicological data. Once implemented, the remedy will be protective of human health and the environment.
12.5 Issues
There are no issues regarding the remedial actions that have been completed at WAG 10.
12.6 Recommendations and Follow-up Actions
No additional recommendations need to be provided at this time, given that the remedial actions involving the TNT/RDX-contaminated soil sites, the lead-contaminated soil at the STF-02 gun range, and the UXO sites are yet to be implemented and the OU 10-08 comprehensive ROD is yet to be written.
12.7 Protectiveness Statement
Institutional controls have been implemented at WAG 10 sites where contamination currently exists and might pose an unacceptable risk to human health or the environment. The use of institutional controls will preclude the inadvertent exposure of personnel and the public until such time as the remedial action is implemented. Overall protectiveness of the defined remedy will be evaluated upon completion.
12.8 Section 12 References
DOE-ID, 1991, Federal Facility Agreement and Consent Order for the Idaho National Engineering Laboratory, Administrative Docket No. 1088-06-29-120, U.S. Department of Energy Idaho Operations Office; U.S. Environmental Protection Agency, Region 10; Idaho Department of Health and Welfare, December 4, 1991.
DOE-ID, 1992, Declaration of the Record of Decision Ordnance Interim Action Operable Unit 10-05 Waste Area Group 10 Idaho National Engineering Laboratory, Document ID 5137, Rev. 0, U.S. Department of Energy Idaho Operations Office, June 1992.
12-26

DOE-ID, 1994a, Department of Energy Idaho Field Operations Office Lead Agency Action Memorandum for the Non-Time-Critical Removal Action at Unexploded Ordnance Locations at the Idaho National Engineering Laboratory (INEL), Document ID 10.03.1.122.01, Rev. 1, U.S. Department of Energy Idaho Operations Office, June 1994.
DOE-ID, 1994b, Department of Energy Idaho Operations Office Lead Agency Action Memorandum for the Non-Time Critical Removal Action of TNT- and RDX-Contaminated Soil, Idaho National Engineering Laboratory, Document ID 10.03.2.122.01, Rev. 2, U.S. Department of Energy Idaho Operations Office, July 1994.
DOE-ID, 1996, U.S. Department of Energy, Idaho Operations Office Lead Agency Action Memorandum, Time-Critical Removal Action Ordnance Areas Operable Unit 10-03 Idaho National Engineering Laboratory (INEL), INEL-96/0313, Rev. 0, U.S. Department of Energy Idaho Operations Office, September 1996.
DOE-ID, 1997, Engineering Evaluation Cost Analysis for Nontime-Critical Removal Action for Unexploded Ordnance at the Idaho National Engineering and Environmental Laboratory Operable Unit 10-03, DOE/ID-10577, Rev. 1, U.S. Department of Energy Idaho Operations Office, June 1997.
DOE-ID, 1998, Preliminary Scoping Track 2 Summary Report for Operable Unit 10-03 Ordnance, DOE/ID-10566, Rev. 0, U.S. Department of Energy Idaho Operations Office, January 1998.
DOE-ID, 2001, Comprehensive Remedial Investigation/Feasibility Study for Waste Area Groups 6 and 10 Operable Unit 10-04, DOE/ID-10807, Rev. 0, U.S. Department of Energy Idaho Operations Office, August 2001.
DOE-ID, 2002a, Waste Area Group 10, Operable Unit 10-08 Remedial Investigation/Feasibility Study Work Plan (Final), DOE/ID-10902, Rev. 0, U.S. Department of Energy Idaho Operations Office, August 2002.
DOE-ID, 2002b, Record of Decision – Experimental Breeder Reactor-I/Boiling Water Reactor Experiment Area and Miscellaneous Sites, DOE/ID-10980, Rev. 0, U.S. Department of Energy Idaho Operations Office, November 2002.
DOE-ID, 2003a, Operable Units 6-05 and 10-04, Experimental Breeder Reactor-I/Boiling Water Reactor Experiment Area and Miscellaneous Sites, Remedial Design/Remedial Action Scope of Work, DOE/ID-11035, Rev. 0, U.S. Department of Energy Idaho Operations Office, February 2003.
DOE-ID, 2003b, Explanation of Significant Differences for the Record of Decision for the Test Area North Operable Unit 1-10, DOE/ID-11050, Rev. 0, U.S. Department of Energy Idaho Operations Office, April 2003.
DOE-ID, 2004a, Remedial Design/Remedial Action Work Plan for Operable Units 6-05 and 10-04, Phase I, DOE/ID-11101, Rev. 0, U.S. Department of Energy Idaho Operations Office, February 2004.
DOE-ID, 2004b, Remedial Design/Remedial Action Work Plan for Operable Units 6-05 and 10-04, Phase II, DOE/NE-ID-11127, Rev. 0, U.S. Department of Energy Idaho Operations Office, August 2004.
12-27

DOE-ID, 2004c, Operations and Maintenance Plan for Operable Units 6-05 and 10-04, Phase I, DOE/ID-11102, Rev. 1, U.S. Department of Energy Idaho Operations Office, February 2004.
DOE-ID, 2004d, INEEL Sitewide Institutional Controls Plan, DOE/ID-11042, Rev. 1, U.S. Department of Energy Idaho Operations Office, June 2004.
DOE-ID, 2004e, Remedial Action Report for Operable Units 6-05 and 10-04, Phase I, DOE/NE-ID-11186, Rev. 0, U.S. Department of Energy Idaho Operations Office, January 2005.
DOE-ID, 2004f, Waste Area Group 10, Operable Unit 10-08, Remedial Investigation/Feasibility Study Annual Report for Fiscal Year 2003, DOE/ID-11116, Rev. 0, U.S. Department of Energy Idaho Operations Office, April 2004.
DOE-ID, 2004g, Idaho National Engineering and Environmental Laboratory Operable Unit 10-08 Sitewide Groundwater Model Work Plan, DOE/NE-ID-11188, Rev. 0, U.S. Department of Energy Idaho Operations Office, December 2004.
DOE-ID, 2005a, Remedial Action Report for Operable Units 6-05 and 10-04, Phase I, DOE/NE-ID-11186, Rev. 0, U.S. Department of Energy Idaho Operations Office, January 2005.
DOE-ID, 2005b, Idaho National Engineering and Environmental Laboratory Comprehensive Facility and Land Use Plan, http://cflup.inel.gov, visited May 18, 2005.
DOE-ID, 2005c, Waste Area Group 10, Operable Unit 10-08, Remedial Investigation/Feasibility Study Annual Status Report for Fiscal Year 2004, DOE/NE-ID-11198, Rev. 0, U.S. Department of Energy Idaho Operations Office, March 2005.
EG&G, 1986, Installation Assessment Report for EG&G Idaho, Inc., Operations at the Idaho National Engineering Laboratory, EGG-WM-6875, Rev. 0, EG&G Idaho, Inc., January 1986.
EPA, 1999, “Region 10 Final Policy on the Use of Institutional Controls at Federal Facilities,” Office of Environmental Cleanup, Office of Waste and Chemicals Management, and Office of Regional Counsel, U.S. Environmental Protection Agency, Seattle, Washington, May 1999.
ICP, 2004, Summary Report for the 2004 Time-Critical Removal Action for Unexploded Ordnance at Operable Unit 10-04, ICP/EXT-04-00437, Rev. 0, Idaho Completion Project, July 2004.
ICP, 2005, Long-Term Stewardship Fiscal Year 2004 Well Surveillance/Maintenance Report, ICP/EXT-04-00727, Rev. 0, Idaho Completion Project, January 2005.
INEEL, 1999, Summary Report for the 1997 Non-Time Critical Removal Action for Ordnance at Operable Unit 10-03, INEEL/EXT-97-01354, Rev. 0, Idaho National Engineering and Environmental Laboratory, January 1999.
INEEL, 2000, Waste Area Group 10 RDX/TNT CERCLA Treatability Study Final Report, INEEL/EXT-99-01043, Rev. 0, Idaho National Engineering and Environmental Laboratory, March 2000.
12-28

INEEL, 2003a, U.S. Department of Energy Idaho Operations Office, Lead Agency Action Memorandum Time-Critical Removal Action for Unexploded Ordnance, Operable Unit 10-04, Idaho National Engineering and Environmental Laboratory, INEEL/EXT-02-01033, Rev. 2, Idaho National Engineering and Environmental Laboratory, February 2003.
INEEL, 2003b, Institutional Controls Status Report for Waste Area Groups 6 and 10, INEEL/EXT-03-00199, Rev. 0, Idaho National Engineering and Environmental Laboratory, April 2003.
INEEL, 2004, Long-Term Ecological Monitoring Plan for the Idaho National Engineering and Environmental Laboratory, INEEL/EXT-02-01191, Rev. 1, Idaho National Engineering and Environmental Laboratory, January 2004.
INEL, 1994a, Engineering Evaluation/Cost Analysis (EE/CA) for Non-Time-Critical Removal Action at Unexploded Ordnance Locations at the Idaho National Engineering Laboratory (INEL), Operable Unit (OU) 10-03, 10.003.2.1.201.01, Rev. 2, Idaho National Engineering Laboratory, April 1994.
INEL, 1994b, Engineering Evaluation/Cost Analysis for a Non-Time Critical Removal Action of TNT- and RDX-Contaminated Soil at the Idaho National Engineering Laboratory, Document ID 10.03.2.121.02, Rev. 2, Idaho National Engineering Laboratory, June 1994.
MCP-3448, 2004, “Inclusion of New Sites under the Federal Facility Agreement and Consent Order,” Rev. 6, Environmental Protection and Compliance, Idaho National Engineering and Environmental Laboratory, July 2004.
Parsons, 1997, Final Action Report for the Time Critical Removal Action, Operable Unit 10-03, Parsons Infrastructure and Technology Group, Inc., January 28, 1997.
Wyle, 1994, Remedial Action Report for the Interim Action to Cleanup Unexploded Ordnance Locations at the INEL (Operable Unit 10-05), 31-ICP-06, Rev. 3, Wyle Laboratories Scientific Services & Systems Group, May 20, 1994.
Wyle, 1995a, Removal Action Report for the Ordnance Removal Action, Operable Unit 10-03, 31-ICP-06-1, Rev. 2, Wyle Laboratories Scientific Services & Systems Group, March 24, 1995.
Wyle, 1995b, Addendum to the Removal Action Report for the Ordnance Removal Action, Operable Unit 10-03, Wyle Laboratories Scientific Services & Systems Group, October 31, 1995.
12-29

12-30

13. SUMMARY AND CONCLUSIONS
Based on the review of remedial actions at the INL Site, completed remedies are functioning as intended in the decision documents. Remedial actions have been completed at WAGs 2, 4, 5, and 9 and are nearing completion at OU 1-10. The evidence presented in the upcoming remedial action reports is expected to indicate that the selected remedies have achieved the remedial action objectives.
Past remedial actions at the INL Site used risk-based concentrations provided by the Fromm (1996) memorandum. Those remedial actions should be considered effective, because Cs-137 is the primary radionuclide of concern and the remediation activities used a lower (more conservative value) than would be required under the new guidance issued by the EPA. By cleaning to the more protective level, it is assumed that any other radionuclides that would have been present are also now at acceptable levels.
Changes in the slope factor and guidance on the calculation of radionuclide PRGs presented on the EPA website (http://epa-prgs.ornl.gov/radionuclides/) should be considered in all future assessments and cleanup at the INL Site. This includes the new slope factors as well as changes to the calculations of any PRGs, including the use of a gamma shielding factor. The DOE-ID will discuss this issue with the agencies to determine how to best address the use of shielding in calculating risks at the site.
The use of institutional controls prevents uncontrolled exposures until the remedial actions that are not yet in place are implemented. Thus, these actions are protective of human health and the environment. When the remedial actions are completed, the remedies are expected to function as intended in accordance with the decision documents and the protection of human health and the environment will continue.
Because the mission for the MFC (WAG 9) has been changed, the sewage lagoons there are expected to be used until approximately 2030. Therefore, they have been administratively transferred to WAG 10 to allow for closure of WAG 9.
Remedies for the no-further-action or institutionally controlled sites appear to be effective at limiting unauthorized access and excavation. Based on results from the annual assessments of institutionally controlled sites, the controls are in place and the Sitewide approach to institutional controls has streamlined the assessment process.
13.1 Section 13 References
Fromm, J., Idaho Department of Health and Welfare, Department of Environmental Quality, to Waste Area Group Managers and Technical Support Staff, January 3, 1996, “Radionuclide Risk-Based Concentration Tables,” Document ID 27760.
13-1

13-2

14. NEXT REVIEW
The next sitewide five-year review at the INL Site will be conducted within 5 years of this report being issued.
14-1

14-2

Appendix A
Evaluation of Slope Factors and Risk-Based Concentration Changes
A-1

A-2

Appendix A
Evaluation of Slope Factors and Risk-Based Concentration Changes
A-1. INTRODUCTION
Based on U.S. Environmental Protection Agency (EPA) five-year review guidance, toxicity values (slope factors and reference doses [RfDs]) and associated risk-based concentrations (RBCs) used in the risk assessments should be reviewed for changes. This appendix compared the slope factors, RfDs, and RBCs (also called preliminary remediation goals [PRGs] by the EPA) used in the waste area group (WAG) risk assessments to the newest values available from the Integrated Risk Information System (IRIS) (http://www.epa.gov/iris/), Health Effects Assessment Summary Tables (HEAST), or other approved sources. Slope factors for several nonradionuclides have changed or have been developed since 1997. The changes were minimal and should not impact the remediation decisions. The changes to the radionuclide slope factor and new guidance for calculating RBCs for radionuclides are more significant. Recommendations for addressing those changes are included in this appendix.
A-2. RADIONUCLIDES
The EPA classifies all radionuclides as Group A carcinogens. The EPA provides a radionuclide table (http://www.epa.gov/radiation/heast/) that lists ingestion, inhalation, and external exposure cancer slope factors (risk coefficients for total cancer morbidity) for radionuclides in conventional units of picocuries (pCi). Ingestion and inhalation slope factors are central estimates in a linear model of the age-averaged, lifetime-attributable radiation cancer incidence (fatal and nonfatal cancer) risk per unit of activity inhaled or ingested, expressed as risk/pCi. External exposure slope factors are central estimates of lifetime attributable radiation cancer-incidence risk for each year of exposure to external radiation from photon-emitting radionuclides distributed uniformly in a thick layer of soil and are expressed as risk/yr per pCi/gram soil. These slope factors, when combined with site-specific media concentration data and appropriate exposure assumptions, are used to estimate lifetime cancer risks at the Idaho National Laboratory (INL) Site as a result of radionuclide exposures.
The slope factors also are used to calculate RBCs/PRGs for use in screening and developing cleanup goals. The PRGs and the methodology used to develop them are presented at http://epa-prgs.ornl.gov/radionuclides/. Both the slope factors and RBCs that were used in the initial risk assessments performed for the WAGs undergoing a five-year review have changed because of new EPA guidance. The changes are discussed in the following subsections.
A-2.1 Radionuclide Slope Factors
Radionuclide slope factors used in the assessments for the comprehensive remedial investigations and feasibility studies performed before the middle of 2001 for the WAGs in this five-year review were taken from HEAST (EPA 1995). On April 16, 2001, HEAST was updated to incorporate all new values, based on Federal Guidance Report No. 13, which was developed by the EPA’s Office of Radiation and Indoor Air (Eckerman and Ryman 1993). The update incorporates state-of-the-art models and methods that take into account age and gender dependence for radionuclide intake, metabolism, dosimetry, radiogenic cancer risk, and competing risks. Major differences between the risk coefficients of Federal Guidance Report No. 13 (as incorporated into the current radionuclide slope factors) and the
A-3

preceding generation of radionuclide slope factors (published in the November 1995 HEAST) include the following:
• Consideration of revised dosimetric models, including a revised lung model, age-dependent biokinetic models, gastrointestinal absorption factors for internal dose estimates, and revised external dose coefficients for external dose estimates
• Consideration of age- and gender-dependent inhalation and ingestion rates
• Incorporation of updated vital statistics and baseline cancer mortality data
• Specification of separate values for ingestion of water, food products, and soil, based on the different age-dependent intake rate functions for such materials instead of the single ingestion value for each radionuclide presented previously.
The age- and gender-specific radiogenic cancer risk models for each of the 14 potential cancer sites used to compute the risk coefficients in Federal Guidance Report No. 13 are similar to those used for previous radionuclide slope-factor calculations, based on the EPA report Estimating Radiogenic Cancer Risks (EPA 1994). However, the risk models have been updated to incorporate more recent baseline cancer mortality data and other minor adjustments. The estimate of total radiogenic cancer risk attributable to uniform total-body exposure from low doses of low-linear energy transfer radiation has increased by approximately 11 to 13% from the previous estimates, primarily because of changes in the baseline cancer mortality rates for the U.S. population.
Table A-1 presents a comparison of the 1995 slope factors to the 2001 values. The list of radionuclides includes those from the WAGs in this five-year review and those in the Fromm (1996) risk-based concentration tables. Some important differences are apparent. First, slope factors are now available for ingestion of water, food products, and soil. Previously, only one general slope factor for ingestion was available from HEAST (EPA 1995). Conservatively, the lowest of either the food or the soil ingestion value from the 2001 values was compared to the 1995 ingestion values. Based on Federal Guidance Report No. 13 (Eckerman and Ryman 1993), beta emitters now include external dose. This produced major changes to the Sr-90 and C-14 slope factors, because they now have a slope factor for external exposure.
A larger slope factor equates to a greater possible risk to the receptor. As can be seen from the radionuclides included in this list, over 50% have a greater slope factor; therefore, risk assessments performed using these values may not be conservative. As noted, however, most of these values are less than 10 times greater for most radionuclides with the exception of the external slope factors. The external slope factors have changed significantly. That is, both Sr-90 and C-14 have an external slope factor, and the slope factor for Tc-99 is more than 100 times greater than it was in 1995.
A-2.2 Radionuclide Preliminary Remediation Goals
Since 1996, INL Site personnel have screened radionuclides and used the RBCs for cleanup goals provided by the Fromm (1996) memorandum. It developed radionuclide RBCs for 43 radionuclides using the HEAST 1995 slope factors and the assumptions about shielding at that time. The exposure scenarios from Fromm (1996) address 25-year worker and 30-year residential exposure durations. The risk-based concentrations are based on a current exposure scenario or on a scenario occurring either 30 or 100 years in the future. In the 100-year future scenario, a worker would be exposed from 100 to 125 years from the present, while a residential receptor would be exposed from 100 to 130 years from the present. The
A-4

equations used were adapted from those in DOE-ID (1994), which in turn were adapted from the Risk Assessment Guidance for Superfund, Vol. I, Human Health Evaluation Manual (EPA 1991).
Based on the 2001 guidance and slope factors, the EPA has developed PRGs for the current worker (outdoor and indoor), residential soil, agricultural soil, residential soil, tap water, fish ingestion, and groundwater protection. The approach used by the EPA to calculate PRGs includes the use of a gamma-shielding factor that provides for a more realistic assessment of exposure.
Table A-2 presents a comparison of the new EPA PRGs to the RBCs presented in Fromm (1996). To provide the comparison, current resident values were decayed to 2095, as described in Fromm (1996). This provided a future residential PRG similar to that used at the INL Site for the 100-year residential scenario. In addition, the outdoor worker soil PRGs were compared to the current worker PRGs from Fromm (1996).
The EPA changes have both increased and decreased the associated slope factors and PRGs from those used in the past for cleanup at the INL Site. Because of the improved guidance, the new EPA slope factors and PRGs should provide a more accurate evaluation of risk. However, the changes were not immediately addressed, because the primary driver for cleanup at most INL sites is Cs-137. Based on new EPA PRGs, the cleanup goal for Cs-137 would be 40 pCi/g, whereas it is currently 23 pCi/g.
A-2.3 Discussion
As shown in Table A-1, although many of the slope factors have increased, a corresponding increase in the EPA PRGs is not evident, as shown in Table A-2. This is due to the fact that the new guidance for development of PRGs allows for the inclusion of several factors that reduce the exposure in the calculations—primarily, a gamma-shielding factor (GSF) and an area correction factor (ACF). These factors were not included in the development of Fromm’s (1996) RBC and generally reduce the amount of exposure and result in a higher PRG.
The GSF is the ratio of the external gamma radiation level indoors onsite to the radiation level outdoors onsite. The GSF is based on the fact that a building provides shielding against penetration of gamma radiation. Therefore, the calculation of the risk posed by gamma radiation from radionuclides in the soil should take into account this shielding effect. The EPA’s previous GSF default value—taken from Part B of the Risk Assessment Guidance for Superfund, Vol. I, Human Health Evaluation Manual (EPA 1991)—is 0.8, which assumes that the external gamma radiation level indoors is 20% lower than the outdoor gamma radiation level. This value was not included in the calculation of RBCs for the INL Site provided by Fromm (1996) and was not included in the risk calculations.
The EPA did a further review of the literature presented in the EPA report Reassessment of Radium and Thorium Soil Concentrations and Annual Dose Rates (EPA 1996). The review revealed numerous publications that address indoor/outdoor GSFs as applied to radioactive fallout from nuclear weapons and reactor accidents. In the Risk Assessment Guidance for Superfund Volume I Human Health Evaluation Manual (Part A) (EPA 1989), the authors reviewed experimentally measured reduction factors from fallout. The authors concluded that “reduction factors of 0.4 to 0.2 are recommended as representative values for aboveground lightly constructed (wood frame) and heavily constructed (block and brick) homes, respectively.” On the basis of that review, EPA (1996) suggests that a default GSF of 0.4 based solely on the contribution of terrestrial radiation might be a more appropriate value to use at sites with soil contaminated with radionuclides than the previous EPA default of 0.8, which also included the effects of cosmic radiation and the inherent radioactivity in structure materials. Based on that rationale, the EPA adopted in its new guidance the value of 0.4 as the default GSF.
A-5

To accommodate the fact that in most residential settings the assumption of an infinite slab source will result in overly conservative soil screening levels, an adjustment for source area is considered to be an important modification to the Risk Assessment Guidance for Superfund, Vol. I, Human Health Evaluation Manual Part B model (EPA 1991). Thus, an ACF has been added to the calculation of soil screening levels (EPA 2000). The default is 0.9.
Based on the availability of this new guidance, the State of Idaho is currently in the process of developing a radionuclide calculator and RBCs. When the calculator becomes available or based on the EPA’s RBCs, the cleanup values at the INL Site should be evaluated against the new guidance. Although the approach used at the INL Site was extremely conservative to ensure protection of the human receptors and the environment, it is advisable to minimize expenditures for cleanup activities and eliminate unnecessary institutional controls. The new EPA PRG guidance also allows for the development of site-specific PRGs that should also be considered.
A-2.4 Recommendations
Past remediation efforts at the INL Site used RBCs provided by Fromm (1996). Those remediation efforts should be considered effective, because Cs-137 is the primary radionuclide of concern and the remediation activities used a lower, more conservative value than would be required by the new EPA guidance. By cleaning to the more protective level, it is assumed that any other radionuclides that were present would also be at acceptable levels. The changes in the slope factors and guidance on the calculation of radionuclide PRGs presented on the EPA website (http://epa-prgs.ornl.gov/radionuclides/) should be incorporated into all future assessments and cleanup at the INL Site. This includes the new slope factors as well as the use of a GSF and an ACF.
The overall remedial action objectives (RAOs) remain the same, because the RAOs are based on a cancer incidence of 1E-04 or a hazard index of less than 1. However, the new information provided by the EPA should supersede the previous remediation goals, and new cleanup goals should be developed.
A-3. NONRADIONUCLIDES
Slope factors and RfDs are constantly being updated as new toxicity data become available. They are primarily developed using the toxicological data from laboratory studies on animals. Human data from epidemiologic studies are used when available. The INL Site personnel obtained most of the RfDs and slope factors used to calculate the health risk limits from the IRIS, an electronic database containing health risk and regulatory information on more than 500 chemicals. The EPA acknowledges IRIS as the source for reference doses and slope factors that have undergone the most thorough and standardized scientific review.
Table A-3 is a compilation of the contaminants of potential concern (COPCs) identified at each WAG undergoing a five-year review; the table also presents the toxicity values used in the associated risk assessment. The values for chronic oral and inhalation RfDs and chronic oral and inhalation slope factors are compared to those currently presented in IRIS. A higher toxicity value indicates greater toxicity. A lower toxicity value indicates less toxicity. Therefore, if a toxicity value has changed from that used in a risk assessment and the new value is less than the old, then the risk assessment is overly conservative. However, if the new value is higher, then it is possible that the risk assessment was not conservative enough. As can be seen, the toxicity factors for several of the contaminants have changed. Most of the changes are less than an order of magnitude larger. Generally, the radionuclides drive cleanup activities at INL sites; therefore, any of the changes would be unlikely to have an impact on previous remediation decisions.
A-6

The largest changes are in the area of the development of new and more realistic inhalation values. The slope factors for inhalation appear to present some of the largest changes, with new values now available for polychlorinated biphenyls (PCBs). The inhalation RfDs also have changed but not to the same extent. These changes are not expected to make a significant impact on the results of any of the baseline risk assessment results currently under five-year review.
The comprehensive remedial investigations/feasibility studies (RI/FSs) at the INL Site use conceptual site models to identify for assessment the following exposure scenarios, exposure pathways, and exposure routes:
• Exposure scenarios
- Current occupational
- Future occupational
- Residential intrusion
• Exposure pathways
- Groundwater
- Air captured
• Soil exposure routes
- Ingestion
− Soil
− Groundwater (residential intrusion scenario only)
− Homegrown produce (residential intrusion scenario only)
- Inhalation
− Fugitive dust
− Volatiles from soil.
For inhalation, all retained sites that have contamination in the top 10 ft of soil are assumed to have a contaminant source that can be released into the air pathway. The exposure routes that are evaluated as part of the air pathway analysis are as follows:
• Inhalation of fugitive dust
• Inhalation of volatiles.
The concentration of each COPC in the respirable particulate matter is assumed to equal the average soil concentration. Averaging contaminant concentrations above the site for the air pathway produces one contaminant-specific risk estimate for each air pathway exposure route (i.e., for each time period, each air pathway exposure route has the same risk or hazard index at every retained site). The equations used were designed to produce high estimates of airborne COPC concentrations, because no credit is taken for dilution of airborne concentrations caused by dust blown from uncontaminated areas of the INL Site.
A-7

To quantify risks for the future residential receptor, contaminant concentrations in groundwater were modeled. For the groundwater pathway analysis, every contaminant that is not eliminated by the contaminant screening process was assumed to have the potential for migrating to groundwater. The following exposure routes are evaluated as part of the groundwater pathway analysis:
• Ingestion of groundwater
• Dermal absorption of groundwater
• Inhalation of volatiles produced by indoor use of groundwater.
This approach generally has resulted in inhalation being a minor contributor to the total risk. Table A-4 shows a comparison of the changes to risk if the inhalation is reevaluated for the future resident based on the WAG 5 Operable Unit (OU) 5-12 comprehensive RI/FS (DOE-ID 1999). Only the risk from fugitive dust will be evaluated, because there was no risk from volatiles in soil or groundwater at WAG 5 (DOE-ID 1999, Appendix B).
As is shown in Table A-4, WAG 5 was broken into six groups. As discussed above, the fugitive dust was calculated across these groups and then added back into the total risk by site. The total risk by each site is compared to the percent of risk contributed by fugitive dust. As can be seen, all but the ARA-24 site has inhalation risk that contributes more than 0.1% to the total risk. Table A-3 was evaluated to determine the COPCs that had major changes in their slope factors, and the risk from these COPCs is addressed individually. Many of the PCBs now have a slope factor to calculate risk, and they have been included; cadmium has increased from 1.8E-03 to 6.3 and has been included; chromium (VI) has increased from 1.2E-02 to 4.2E+01 and is discussed; and arsenic is included, because it is one of the largest contributors from risk.
Table A-4 presents both the original results and the recalculated results. Although a cadmium slope factor was presented in Table B-20 of the OU 5-12 RI/FS, the cadmium slope factor was not calculated. In addition, a thallium slope factor for inhalation is not presented in Table B-20, but it is assumed that the ingestion slope factor was to calculate the value presented for conservatism. Additionally, although only total chromium was sampled for at WAG 5 sites (DOE-ID 1999, Appendix B), the risk assessment assumed that both chromium (III) and chromium (VI) were represented by the total chromium concentration. Chromium is most likely to be in a chromium (III) form at the INL Site, and assuming that the total concentration contains a large portion of chromium (VI) in the soil is unrealistic. Chromium should be assessed as chromium (III), because chromium is not expected to persist in the environment at the INL Site in the chromium (VI) form (Bartlett and Kimble 1976; Rai, Eary, and Zachara 1989). Sample data collected from 10 grid locations at the PBF-10 site (a dried pond site) for both chromium (VI) and (III) support this assumption. The average ratio of the chromium (VI) to (III) soil concentrations is 0.0085 (ranging from 0.00017 to 0.053). Based on the total chromium sampling, the intake of chromium (VI) was calculated to be 1.44E-10 mg/kg-day (DOE-ID 1999, Table B-60). Based on the average ratio of chromium (VI) to chromium (III) (as calculated from PBF-10 data), this should be reduced to 1.2E-12 mg/kg-day (i.e., 0.0085 times 1.44E-10 mg/kg-day) for Group 1 and 2.6E-10 mg/kg-day (i.e., 0.0085 times 3.18E-08 mg/kg-day) for Group 2. Therefore, the risk from inhalation of chromium (VI) was recalculated using these more realistic assumptions.
Based on these observations and new information, the risk contribution from inhalation decreases at all sites, as shown in Table A-4. The risk driver for the ARA-24 site was the risk of inhalation of chromium. This is still the largest contributor to total risk, but based on this more realistic approach, the risk is now lower than before even when using the larger slope factors.
A-8

In summary, it is apparent that inhalation is not a driver in the risk assessments using the approach accepted at the INL Site. The changes made to the slope factors and RfDs should not impact the conclusions made in the individual WAG comprehensive baseline risk assessment. Currently, the EPA is including the evaluation of indoor air quality due to particulates emitted from soil for both residents and workers. If the risk assessment approach is updated at the INL Site, the inclusion of this exposure route should be considered.
A-4. REFERENCES
Bartlett, R. J. and J. M. Kimble, 1976, “Behavior of Chromium in Soils: II. Hexavalent Forms,” Journal Environmental Quality, Vol. 5, No. 1, pp. 383–386.
DOE-ID, 1994, Track 2 Sites: Guidance for Assessing Low Probability Hazard Sites at the INEL, DOE/ID-10389, Rev. 6, U.S. Department of Energy Idaho Operations Office, January 1994.
DOE-ID, 1999, Waste Area Group 5, Operable Unit 5-12 Comprehensive Remedial Investigation/Feasibility Study, DOE/ID-10607, Rev. 0, U.S. Department of Energy Idaho Operations Office, January 1999.
Eckerman, K. F. and J. C. Ryman, 1993, External Exposure to Radionuclides in Air, Water, and Soil, Federal Guidance Report No. 13, EPA 402-R-93-081, U.S. Environmental Protection Agency.
EPA, 1989, Risk Assessment Guidance for Superfund Volume I Human Health Evaluation Manual (Part A), EPA/540/1/1-89/002, U.S. Environmental Protection Agency, December 1989.
EPA, 1991, Risk Assessment Guidance for Superfund, Vol. I, Human Health Evaluation Manual, Supplemental Guidance: “Standard Default Exposure Factors” (Interim Final), Office of Emergency and Remedial Response, OSWER Directive 9285.6-03 [NTIS Order Number: PB 91-921314].
EPA, 1994, Estimating Radiogenic Cancer Risks, 402-R-93-076, U.S. Environmental Protection Agency, June 1994.
EPA, 1995, Health Effects Assessment Summary Tables, FY-1995 Annual, EPA/540/R-95/036, U.S. Environmental Protection Agency, May 1995.
EPA, 1996, Reassessment of Radium and Thorium Soil Concentrations and Annual Dose Rates, U.S. Environmental Protection Agency, Office of Radiation and Indoor Air, July 22, 1996.
EPA, 2000, Soil Screening Guidance for Radionuclides: User's Guide, Office of Emergency and Remedial Response and Office of Radiation and Indoor Air, OSWER No. 9355.4-16A, http://www.epa.gov/superfund/resources/radiation/radssg.htm#user.
Fromm, J., Idaho Department of Health and Welfare, Department of Environmental Quality, to Waste Area Group Managers and Technical Support Staff, January 3, 1996, “Radionuclide Risk-Based Concentration Tables,” Document ID 27760.
Rai, O., L. E. Eary, and J. M. Zachara, 1989, “Environmental Chemistry of Chromium,” The Science of Total Environment, Vol. 86, pp. 15–23.
A-9

A-10

Table A-1. Comparison of 2001 slope factors to 1995 values.
Isotope
from HEAST 2001 from HEAST 1995 Is new slope factor greater than (+)
or less than (-) old? How many times greater?
Water Ingestion (Risk/pCi)
Food Ingestion (Risk/pCi)
Soil Ingestion (Risk/pCi)
Max Ingestion Slope Factor (Risk/pCi)
Inhalation (Risk/pCi)
External Exposure (Risk/y per pCi/g)
Ingestion (Risk/pCi)
Inhalation (Risk/pCi)
External (Risk/y per pCi)
(The lower the slope factor the less the risk.)
Ingestion Inhalation External
Ag-108m 8.14E-12 1.12E-11 1.92E-11 1.92E-11 2.67E-11 7.18E-06 6.05E-12 7.02E-11 5.61E-06 + — - — + 1.3 Am-241 1.04E-10 1.34E-10 2.17E-10 2.17E-10 2.81E-08 2.76E-08 3.28E-10 3.85E-08 4.59E-09 - — - — + 6.0 Ba-133 6.81E-12 9.44E-12 1.39E-11 1.39E-11 1.16E-11 1.44E-06 2.70E-12 4.03E-12 9.15E-07 + — + — + 1.6 Bi-212 7.10E-13 9.99E-13 1.78E-12 1.78E-12 7.77E-11 8.87E-07 6.20E-13 3.65E-11 6.67E-07 + — + — + 1.3
Bi-214 1.92E-13 2.65E-13 4.33E-13 4.33E-13 2.90E-11 7.48E-06 1.95E-13 1.46E-11 6.02E-06 + — + — + 1.2 Ce-144+D 3.53E-11 5.19E-11 1.02E-10 1.02E-10 1.10E-10 2.44E-07 2.97E-11 1.08E-10 1.56E-07 + 3.4 + 1.0 + 1.6 C-14 1.55E-12 2.00E-12 2.79E-12 2.79E-12 7.07E-12 7.83E-12 1.03E-12 6.99E-15 No SF + 2.7 + 1011.4 + a Co-57 1.04E-12 1.49E-12 2.78E-12 2.78E-12 2.09E-12 3.55E-07 9.70E-13 2.90E-12 2.10E-07 + 2.9 - — + 1.7 Co-58 2.95E-12 4.18E-12 7.44E-12 7.44E-12 5.99E-12 4.48E-06 2.80E-12 5.20E-12 3.70E-06 + 2.7 + 1.2 + 1.2
Co-60 1.57E-11 2.23E-11 4.03E-11 4.03E-11 3.58E-11 1.24E-05 1.89E-11 6.88E-11 9.76E-06 + 2.1 - — + 1.3 Cs-134 4.22E-11 5.14E-11 5.81E-11 5.81E-11 1.65E-11 7.10E-06 4.73E-11 2.89E-11 5.88E-06 + 1.2 - — + 1.2 Cs-137+D 3.04E-11 3.74E-11 4.33E-11 4.33E-11 1.19E-11 2.55E-06 3.16E-11 1.91E-11 2.09E-06 + 1.4 - — + 1.2 Cm-242 3.85E-11 5.48E-11 1.05E-10 1.05E-10 1.51E-08 7.73E-11 3.83E-11 3.16E-09 2.34E-11 + 2.7 + 4.8 + 3.3 Cm-244 8.36E-11 1.08E-10 1.81E-10 1.81E-10 2.53E-08 4.85E-11 2.11E-10 2.43E-08 2.07E-11 - — + 1.0 + 2.3
Eu-152 6.07E-12 8.70E-12 1.62E-11 1.62E-11 9.10E-11 5.30E-06 5.73E-12 7.91E-11 4.08E-06 + 2.8 + 1.2 + 1.3 Eu-154 1.03E-11 1.49E-11 2.85E-11 2.85E-11 1.15E-10 5.83E-06 9.37E-12 9.15E-11 4.65E-06 + 3.0 + 1.3 + 1.3 Eu-155 1.90E-12 2.77E-12 5.40E-12 5.40E-12 1.48E-11 1.24E-07 1.65E-12 9.60E-12 6.08E-08 + 3.3 + 1.5 + 2.0 H-3 (organic) 1.12E-13 1.44E-13 2.20E-13 2.20E-13 1.99E-13 No SF 7.15E-14 9.59E-14 No SF + 3.1 + 2.1 + NA H-3 (vapor) 5.07E-14 6.51E-14 9.25E-14 9.25E-14 5.62E-14 No SF No SF No SF No SF NA NA NA NA NA NA I-129 1.48E-10 3.22E-10 2.71E-10 3.22E-10 6.07E-11 6.10E-09 1.84E-10 1.22E-10 2.69E-09 + 1.8 - — + 2.3
Fe-55 8.62E-13 1.16E-12 2.09E-12 2.09E-12 7.99E-13 No SF 3.51E-13 5.60E-13 No SF + 6.0 + 1.4 + — Pb-214 3.44E-13 4.85E-13 8.51E-13 8.51E-13 3.63E-11 9.82E-07 2.94E-13 6.23E-12 7.09E-07 + 2.9 + 5.8 + 1.4 Mn-54 2.28E-12 3.11E-12 5.14E-12 5.14E-12 5.88E-12 3.89E-06 1.96E-12 3.69E-12 3.26E-06 + 2.6 + 1.6 + 1.2 Np-237+D 6.74E-11 9.10E-11 1.62E-10 1.62E-10 1.77E-08 7.97E-07 3.00E-10 3.45E-08 4.62E-07 - — - — + 1.7 Ni-59 2.74E-13 3.89E-13 7.33E-13 7.33E-13 4.66E-13 No SF 1.85E-13 4.01E-13 No SF + 4.0 + 1.2 + —
Ni-63 6.70E-13 9.51E-13 1.79E-12 1.79E-12 1.64E-12 No SF 5.50E-13 1.01E-12 No SF + 3.3 + 1.6 + — Nb-95 2.45E-12 3.50E-12 6.36E-12 6.36E-12 5.44E-12 3.53E-06 2.30E-12 3.10E-12 2.90E-06 + 2.8 + 1.8 + 1.2 Pu-238 1.31E-10 1.69E-10 2.72E-10 2.72E-10 3.36E-08 7.22E-11 2.95E-10 2.74E-08 1.94E-11 - — + 1.2 + 3.7 Pu-239 1.35E-10 1.74E-10 2.76E-10 2.76E-10 3.33E-08 2.00E-10 3.16E-10 2.78E-08 1.26E-11 - — + 1.2 + 15.9 Pu-240 1.35E-10 1.74E-10 2.77E-10 2.77E-10 3.33E-08 6.98E-11 3.15E-10 2.78E-08 1.87E-11 - — + 1.2 + 3.7
A-11

Table A-1. (continued).
Isotope
from HEAST 2001 from HEAST 1995 Is new slope factor greater than (+)
or less than (-) old? How many times greater?
Water Ingestion (Risk/pCi)
Food Ingestion (Risk/pCi)
Soil Ingestion (Risk/pCi)
Max Ingestion Slope Factor (Risk/pCi)
Inhalation (Risk/pCi)
External Exposure (Risk/y per pCi/g)
Ingestion (Risk/pCi)
Inhalation (Risk/pCi)
External (Risk/y per pCi)
(The lower the slope factor the less the risk.)
Ingestion Inhalation External
Pu-241b 1.76E-12 2.28E-12 3.29E-12 3.29E-12 3.34E-10 4.11E-12 3.33E-10 3.88E-08 4.59E-09 - — - — - — Pu-242 1.28E-10 1.65E-10 2.63E-10 2.63E-10 3.13E-08 6.25E-11 3.00E-10 2.64E-08 1.55E-11 - — + 1.2 + 4.0 K-40 2.47E-11 3.43E-11 6.18E-11 6.18E-11 1.03E-11 7.97E-07 1.25E-11 7.46E-12 6.11E-07 + 4.9 + 1.4 + 1.3 Ra-226 +D 3.86E-10 5.15E-10 7.30E-10 7.30E-10 1.16E-08 8.49E-06 2.96E-10 2.75E-09 6.74E-06 + 2.5 + — + 1.3 Ru-106+D 4.22E-11 6.11E-11 1.19E-10 1.19E-10 1.02E-10 9.66E-07 3.45E-11 1.15E-10 7.57E-07 + 3.4 - — + 1.3
Sb-125+D 5.13E-12 7.21E-12 1.32E-11 1.32E-11 1.93E-11 1.81E-06 3.54E-12 5.85E-12 1.34E-06 + 3.7 + 3.3 + 1.4 Sr-90+D 7.40E-11 9.53E-11 1.44E-10 1.44E-10 1.13E-10 1.96E-08 5.59E-11 6.93E-11 No SF + 2.6 + 1.6 + a Tc-99 2.75E-12 4.00E-12 7.66E-12 7.66E-12 1.41E-11 8.14E-11 1.40E-12 2.89E-12 6.19E-13 + 5.5 + 4.9 + 131.5 Th-228+D 3.00E-10 4.22E-10 8.09E-10 8.09E-10 1.43E-07 7.76E-06 2.31E-10 9.68E-08 9.94E-07 + 3.5 + 1.5 + 7.8 Th-230 9.10E-11 1.19E-10 2.02E-10 2.02E-10 2.85E-08 8.19E-10 3.75E-11 1.72E-08 4.40E-11 + 5.4 + 1.7 + 18.6
Th-232 1.01E-10 1.33E-10 2.31E-10 2.31E-10 4.33E-08 3.42E-10 3.28E-11 1.93E-08 1.97E-11 + 7.0 + 2.2 + 17.4 U-232 2.92E-10 3.85E-10 5.74E-10 5.74E-10 1.95E-08 5.98E-10 8.12E-11 5.29E-08 3.42E-11 + 7.1 - — + 17.5 U-233 7.18E-11 9.69E-11 1.60E-10 1.60E-10 1.16E-08 9.82E-10 4.50E-11 1.40E-08 3.50E-11 + 3.6 - — + 28.1 U-234 7.07E-11 9.55E-11 1.58E-10 1.58E-10 1.14E-08 2.52E-10 4.44E-11 1.40E-08 2.14E-11 + 3.6 - — + 11.8 U-235+D 7.18E-11 9.76E-11 1.63E-10 1.63E-10 1.01E-08 5.43E-07 4.70E-11 1.30E-08 2.65E-07 + 3.5 - — + 2.0
U-236 6.70E-11 9.03E-11 1.49E-10 1.49E-10 1.05E-08 1.25E-10 4.21E-11 1.32E-08 1.72E-11 + 3.5 - — + 7.3 U-238+D 8.71E-11 1.21E-10 2.10E-10 2.10E-10 9.35E-09 1.14E-07 6.20E-11 1.24E-08 5.25E-08 + 3.4 - — + 2.2 Zn-65 1.17E-11 1.54E-11 2.45E-11 2.45E-11 5.81E-12 2.81E-06 9.93E-12 9.98E-12 2.27E-06 + 2.5 - — + 1.2 Zr-93 1.11E-12 1.44E-12 2.12E-12 2.12E-12 7.29E-12 No SF 5.21E-13 5.26E-12 No SF + 4.1 + 1.4 NA NA Zr-95 4.59E-12 6.59E-12 1.23E-11 1.23E-11 1.65E-11 3.40E-06 3.92E-12 6.48E-12 2.81E-06 + 3.1 + 2.5 - 1.2 Note: For tritium, two sets of values are provided for ingestion and inhalation pathways. The values in the first line represent ingestion of H-3 in the form of tritiated water and inhalation of tritiated water vapor, while values in the second line represent ingestion of organically bound tritium and inhalation of H-3 in particulate form (with default International Commission on Radiological Protection lung absorption Type M). The corresponding value for inhalation of H-3 in organically bound gas would be greater than the value for tritiated water vapor by a factor of 2.3, while the value for inhalation of elemental hydrogen gas would be lower by a factor of 10,000. Fromm (1996) did not differentiate these factors.
a. There were no external exposure values in the 1995 HEAST. b. Pu-241 was assessed with its daughter product in 1996 (Fromm 1996). However, the new HEAST does not present this radionuclide with its daughter.
HEAST = Health Effects Assessment Summary Table NA = not applicable
A-12

Table A-2. Comparison of 1996 risk-based concentrations with U.S. Environmental Protection Agency preliminary remediation goals.
Isotope
Risk-Based Concentration from Fromm (1996) PRGs Soil to Groundwater
EPA PRG for Residential Soil Decayed to 2095
(pCi/g)
EPA PRG is greater (+) or less (-) than old? How many times less? Future
Resident (pCi/g)
Current Resident (pCi/g)
Current Worker (pCi/g)
Residential Soil
(pCi/g)
Agricultural Soil
(pCi/g)
Outdoor Worker
Soil (pCi/g)
Indoor Worker
Soil (pCi/g)
Tap Water
(pCi/gL)
Fish Ingestion (pCi/g)
DAF = 20 (pCi/g)
DAF = 1 (pCi/g) Current Worker Current Resident Future 2095 Resident
Ag-108m NA NA NA 1.68E-02 6.29E-03 3.25E-02 7.32E-02 5.85E+00 1.57E-01 3.99E-01 1.99E-02 2.75E-02 NA NA NA NA NA NA
Am-241 2.90E+00 2.50E+00 1.00E+01 1.87E+00 1.32E-02 5.67E+00 1.19E+01 4.58E-01 1.32E-02 2.58E+00 1.29E-01 2.16E+00 - 1.8 - 46.6 - 46.6
Ba-133 NA NA NA 1.75E-01 1.61E-01 3.06E-01 6.89E-01 6.99E+00 1.87E-01 5.96E+01 NA NA NA NA NA NA
Bi-212 NA NA NA 2.26E+04 2.24E+04 3.70E+04 8.33E+04 6.71E+01 1.77E+00 5.24E+09 NA NA NA NA NA NA
Bi-214 NA NA NA 8.19E+03 8.19E+03 1.34E+04 3.01E+04 2.48E+02 6.66E+00 1.78E+20 NA NA NA NA - NA
Ce-144+D 2.90E+39 1.50E+01 6.30E+01 1.14E+01 3.45E+00 1.99E+01 4.49E+01 1.35E+00 3.40E-02 5.64E+02 2.82E+01 7.53E+35 - 3.2 - 1.3 + 3,851.7
C-14 7.90E+02 7.80E+02 3.10E+03 4.56E-01 5.63E-05 1.23E+03 2.24E+03 1.29E+00 8.82E-01 4.01E+01 2.00E+00 4.61E-01 - 2.5 - 1,710.5 - 1,713.7
Co-57 NA NA NA 8.73E+00 9.66E-02 1.44E+01 3.23E+01 4.58E+01 1.18E+00 1.68E+02 8.40E+00 2.70E+37 NA NA NA NA NA NA
Co-58 NA NA NA 2.66E+00 1.27E-01 4.36E+00 9.80E+00 1.61E+01 4.22E-01 1.11E+03 5.56E+01 1.25E+140 NA NA NA NA NA NA
Co-60 7.40E+03 1.60E-02 7.20E-02 3.61E-02 9.01E-04 6.02E-02 1.35E-01 3.03E+00 7.91E-02 2.41E+00 1.21E-01 4.99E+03 - 1.2 + + 1.5
Cs-134 2.40E+13 8.40E-02 3.60E-01 1.57E-01 7.47E-03 2.59E-01 5.82E-01 1.13E+00 3.43E-02 1.65E+02 8.24E+00 2.23E+12 - 1.4 + + 10.8
Cs-137+D 2.30E-01 2.40E-02 1.20E-01 5.97E-02 1.20E-03 1.13E-01 2.53E-01 1.57E+00 4.72E-02 5.66E+01 2.83E+00 4.78E-01 - 1.1 + +
Cm-242 2.40E+70 4.60E+03 1.50E+04 3.22E+02 1.89E+01 3.20E+03 5.92E+03 1.24E+00 3.22E-02 4.62E+03 2.31E+02 1.50E+63 - 4.7 - 14.3 - 16,019,678.3
Cm-244 2.90E+02 6.60E+00 2.40E+01 6.69E+00 3.04E-01 3.79E+01 6.90E+01 5.70E-01 1.63E-02 4.35E+01 2.17E+00 2.10E+02 + + + 1.4
Eu-152 2.70E+00 1.80E-02 8.20E-02 4.16E-02 3.76E-02 7.37E-02 1.66E-01 7.84E+00 2.03E-01 4.53E+00 - 1.1 + +
Eu-154 5.20E+01 2.10E-02 9.60E-02 4.99E-02 4.72E-02 8.57E-02 1.93E-01 4.62E+00 1.18E-01 5.98E+01 - 1.1 + + 2.6
Eu-155 2.90E+06 2.80E+00 1.20E+01 3.80E+00 3.74E+00 6.34E+00 1.43E+01 2.51E+01 6.37E-01 1.10E+06 - 1.9 + +
H-3 (organic) 6.50E+06 2.50E+04 8.80E+04 2.28E+00 1.60E-01 1.42E+00 3.20E+00 1.22E+01 3.49E+02 - 61,971.8 - 10,964.9 - 18,624.4
H-3 (vapor) NA NA NA 1.44E+02 1.65E+02 8.25E+00 NA NA NA NA NA NA
I-129 4.30E+00 4.30E+00 1.70E+01 5.96E-01 2.76E-05 1.09E+01 2.08E+01 3.22E-01 5.48E-03 4.60E-03 2.30E-04 5.96E-01 - 1.6 - 7.2 - 7.2
Fe-55 2.50E+15 2.30E+04 7.60E+04 2.69E+03 8.21E-01 2.21E+04 3.97E+04 5.52E+01 1.52E+00 1.02E+03 5.08E+01 2.91E+13 - 3.4 - 8.6 - 85.9
Pb-214 1.40E+13 6.30E-01 2.70E+00 4.63E+04 3.49E+04 7.56E+04 1.70E+05 1.38E+02 3.64E+00 2.85E+12 1.43E+11 6.26E+16 + + +
Mn-54 3.30E+34 5.80E-01 2.50E+00 6.92E-01 3.69E-01 1.13E+00 2.55E+00 2.09E+01 5.67E-01 7.42E+02 3.71E+01 2.72E+31 - 2.2 + + 1,215.3
Np-237+D 7.60E-02 7.60E-02 3.90E-01 1.30E-01 4.48E-04 2.72E-01 6.11E-01 7.07E-01 1.94E-02 9.00E-02 4.50E-03 1.30E-01 - 1.4 + +
Ni-59 4.30E+03 4.30E+03 1.70E+04 2.08E+02 2.15E+00 1.23E+04 2.22E+04 1.74E+02 4.53E+00 2.05E+02 1.03E+01 2.08E+02 - 1.4 - 20.7 - 20.7
Ni-63 3.20E+03 1.60E+03 6.40E+03 9.48E+01 1.01E+00 5.55E+03 9.99E+03 7.11E+01 1.85E+00 3.80E+01 1.90E+00 1.82E+02 - 1.2 - 16.9 - 17.6
Nb-95 NA NA NA 6.81E+00 6.81E+00 1.11E+01 2.50E+01 1.94E+01 5.04E-01 5.83E+281 - NA - NA NA NA
Pu-238 6.70E+00 3.10E+00 1.20E+01 2.97E+00 7.31E-03 1.60E+01 2.91E+01 3.64E-01 1.04E-02 1.75E+00 8.76E-02 6.05E+00 + - 1.0 - 1.1
Pu-239 2.50E+00 2.50E+00 1.00E+01 2.59E+00 6.09E-03 1.40E+01 2.54E+01 3.53E-01 1.01E-02 1.56E+00 7.80E-02 2.60E+00 +
+
+
Pu-240 2.60E+00 2.50E+00 1.00E+01 2.60E+00 6.10E-03 1.41E+01 2.56E+01 3.53E-01 1.01E-02 1.56E+00 7.81E-02 2.62E+00 +
+
+
A-13
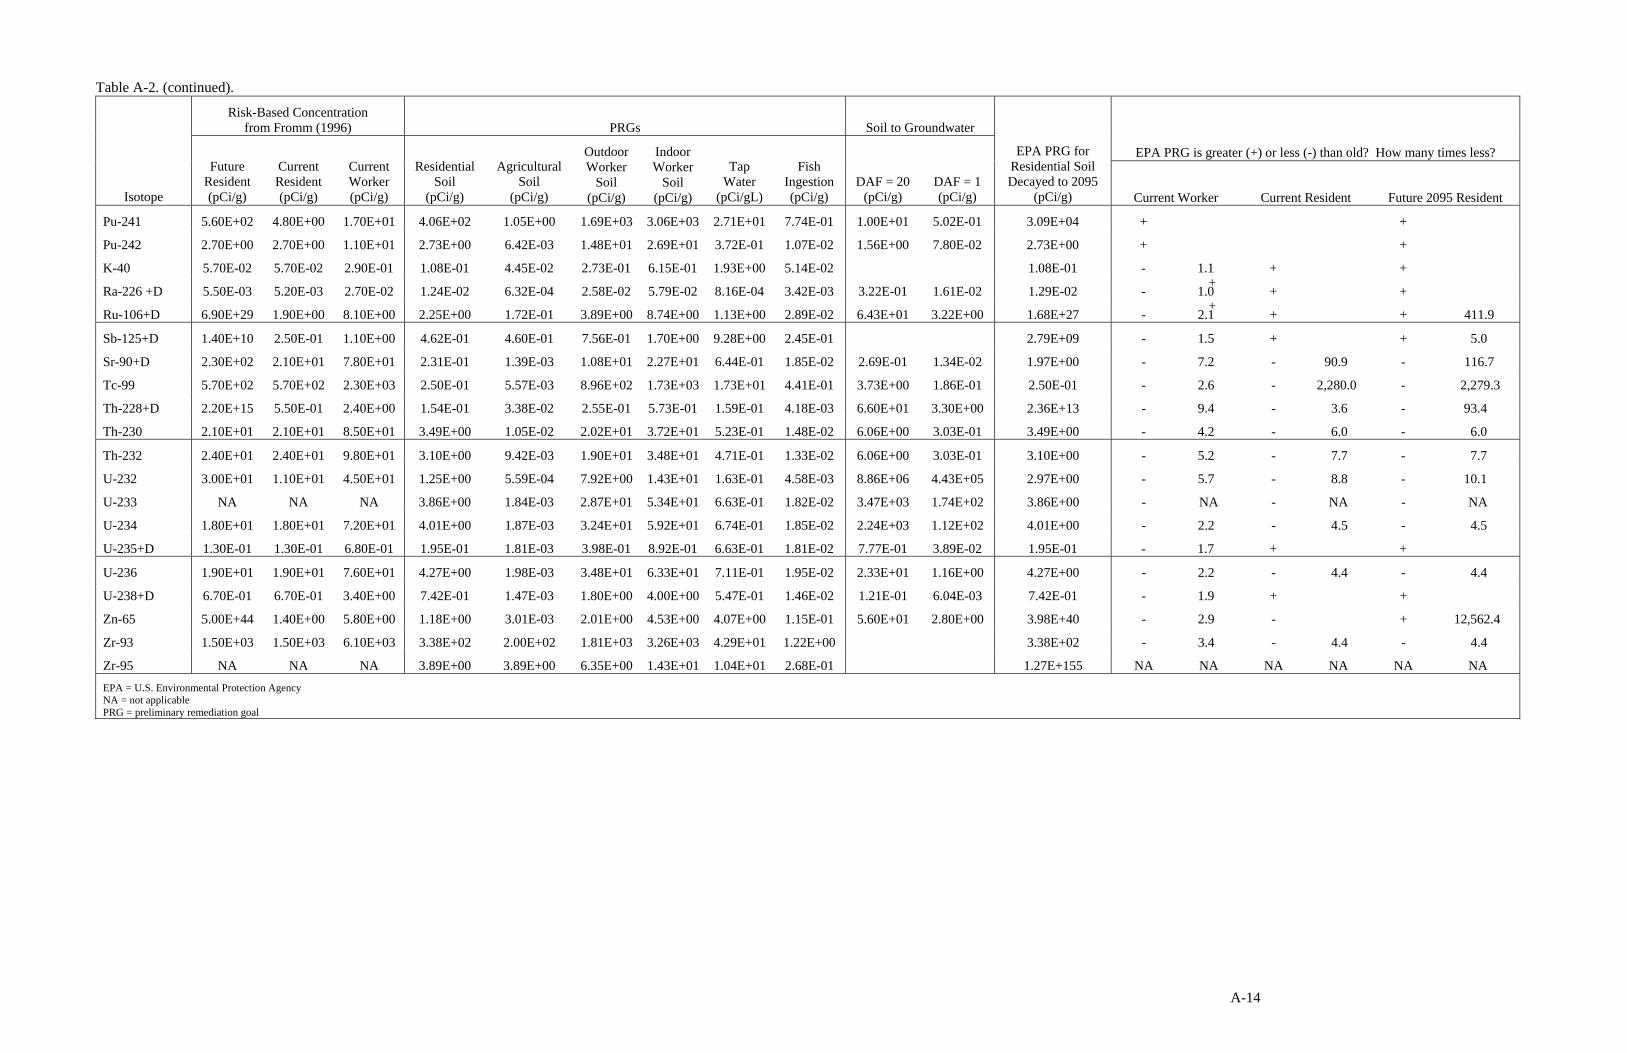
Table A-2. (continued).
Isotope
Risk-Based Concentration from Fromm (1996) PRGs Soil to Groundwater
EPA PRG for Residential Soil Decayed to 2095
(pCi/g)
EPA PRG is greater (+) or less (-) than old? How many times less? Future
Resident (pCi/g)
Current Resident (pCi/g)
Current Worker (pCi/g)
Residential Soil
(pCi/g)
Agricultural Soil
(pCi/g)
Outdoor Worker
Soil (pCi/g)
Indoor Worker
Soil (pCi/g)
Tap Water
(pCi/gL)
Fish Ingestion (pCi/g)
DAF = 20 (pCi/g)
DAF = 1 (pCi/g) Current Worker Current Resident Future 2095 Resident
Pu-241 5.60E+02 4.80E+00 1.70E+01 4.06E+02 1.05E+00 1.69E+03 3.06E+03 2.71E+01 7.74E-01 1.00E+01 5.02E-01 3.09E+04 +
+
+
Pu-242 2.70E+00 2.70E+00 1.10E+01 2.73E+00 6.42E-03 1.48E+01 2.69E+01 3.72E-01 1.07E-02 1.56E+00 7.80E-02 2.73E+00 +
+
+
K-40 5.70E-02 5.70E-02 2.90E-01 1.08E-01 4.45E-02 2.73E-01 6.15E-01 1.93E+00 5.14E-02 1.08E-01 - 1.1 + +
Ra-226 +D 5.50E-03 5.20E-03 2.70E-02 1.24E-02 6.32E-04 2.58E-02 5.79E-02 8.16E-04 3.42E-03 3.22E-01 1.61E-02 1.29E-02 - 1.0 + +
Ru-106+D 6.90E+29 1.90E+00 8.10E+00 2.25E+00 1.72E-01 3.89E+00 8.74E+00 1.13E+00 2.89E-02 6.43E+01 3.22E+00 1.68E+27 - 2.1 + + 411.9
Sb-125+D 1.40E+10 2.50E-01 1.10E+00 4.62E-01 4.60E-01 7.56E-01 1.70E+00 9.28E+00 2.45E-01 2.79E+09 - 1.5 + + 5.0
Sr-90+D 2.30E+02 2.10E+01 7.80E+01 2.31E-01 1.39E-03 1.08E+01 2.27E+01 6.44E-01 1.85E-02 2.69E-01 1.34E-02 1.97E+00 - 7.2 - 90.9 - 116.7
Tc-99 5.70E+02 5.70E+02 2.30E+03 2.50E-01 5.57E-03 8.96E+02 1.73E+03 1.73E+01 4.41E-01 3.73E+00 1.86E-01 2.50E-01 - 2.6 - 2,280.0 - 2,279.3
Th-228+D 2.20E+15 5.50E-01 2.40E+00 1.54E-01 3.38E-02 2.55E-01 5.73E-01 1.59E-01 4.18E-03 6.60E+01 3.30E+00 2.36E+13 - 9.4 - 3.6 - 93.4
Th-230 2.10E+01 2.10E+01 8.50E+01 3.49E+00 1.05E-02 2.02E+01 3.72E+01 5.23E-01 1.48E-02 6.06E+00 3.03E-01 3.49E+00 - 4.2 - 6.0 - 6.0
Th-232 2.40E+01 2.40E+01 9.80E+01 3.10E+00 9.42E-03 1.90E+01 3.48E+01 4.71E-01 1.33E-02 6.06E+00 3.03E-01 3.10E+00 - 5.2 - 7.7 - 7.7
U-232 3.00E+01 1.10E+01 4.50E+01 1.25E+00 5.59E-04 7.92E+00 1.43E+01 1.63E-01 4.58E-03 8.86E+06 4.43E+05 2.97E+00 - 5.7 - 8.8 - 10.1
U-233 NA NA NA 3.86E+00 1.84E-03 2.87E+01 5.34E+01 6.63E-01 1.82E-02 3.47E+03 1.74E+02 3.86E+00 - NA - NA - NA
U-234 1.80E+01 1.80E+01 7.20E+01 4.01E+00 1.87E-03 3.24E+01 5.92E+01 6.74E-01 1.85E-02 2.24E+03 1.12E+02 4.01E+00 - 2.2 - 4.5 - 4.5
U-235+D 1.30E-01 1.30E-01 6.80E-01 1.95E-01 1.81E-03 3.98E-01 8.92E-01 6.63E-01 1.81E-02 7.77E-01 3.89E-02 1.95E-01 - 1.7 + +
U-236 1.90E+01 1.90E+01 7.60E+01 4.27E+00 1.98E-03 3.48E+01 6.33E+01 7.11E-01 1.95E-02 2.33E+01 1.16E+00 4.27E+00 - 2.2 - 4.4 - 4.4
U-238+D 6.70E-01 6.70E-01 3.40E+00 7.42E-01 1.47E-03 1.80E+00 4.00E+00 5.47E-01 1.46E-02 1.21E-01 6.04E-03 7.42E-01 - 1.9 + +
Zn-65 5.00E+44 1.40E+00 5.80E+00 1.18E+00 3.01E-03 2.01E+00 4.53E+00 4.07E+00 1.15E-01 5.60E+01 2.80E+00 3.98E+40 - 2.9 - + 12,562.4
Zr-93 1.50E+03 1.50E+03 6.10E+03 3.38E+02 2.00E+02 1.81E+03 3.26E+03 4.29E+01 1.22E+00 3.38E+02 - 3.4 - 4.4 - 4.4
Zr-95 NA NA NA 3.89E+00 3.89E+00 6.35E+00 1.43E+01 1.04E+01 2.68E-01 1.27E+155 NA NA NA NA NA NA EPA = U.S. Environmental Protection Agency NA = not applicable PRG = preliminary remediation goal
A-14

Table A-3. Comparison of slope factors and reference doses used in the risk assessment to new values in the Integrated Risk Information System. Is new Is new Is new greater New greater greater Inhalation New Is new
Oral New Oral than or Inhalation Inhalation than or than or RfD Inhalation greater than
COPCs WAG Contaminant
Type Slope Factor (mg/kg-day)-1
Slope Factor (mg/kg-day)-1
less than old?
Slope Factor (mg/kg-day)-1
Slope Factor (mg/kg-day)-1
less than old?
Oral RfD (mg/kg-day)
New Oral RfD (mg/kg-day)
less than old?
(mg/kg-day)
RfD (mg/kg-day)
or less than old? Comments
Acenaphthene 1 Organic — — — — — 6.00E-02 6.00E-02a Same — — — — Acetone 2 Organic — — — — — — 1.00E-01 9.00E-01a Greater — — — — Acrylonitrile 2 Organic 5.40E-01 5.40E-01a Same 5.70E-04 2.38E-01a Greater 1.00E-03 1.00E-03a Same 5.70E-04 5.71E-04 Same — Anthracene 2 Organic — — — — — 3.00E-01 3.00E-01a Same — — — — Aroclor-1242 5 Organic 4.00E-01 4.00E-01ao Same — 3.50E-01a New — — — — — — — Aroclor-1248 5 Organic 4.00E-01 4.00E-01ao Same — 3.50E-01a New — — — — — — — Aroclor-1254 4,5 Organic 4.00E-01 4.00E-01ao Same — 3.50E-01a New 2.00E-05 2.00E-05a Same — — — — Aroclor-1260 1,2,3 Organic 7.70E+00 4.00E-01ao Less — 3.50E-01a New — — — — — — Aroclor-1260 4 Organic 4.00E-01 4.00E-01ao Same — 3.50E-01a New 2.00E-05 — Used 1254 — — — — Aroclor 1260b 5 Organic 4.00E-01 4.00E-01ao Same — 3.50E-01a New — — — — — — — Benzo[a]anthracene 1 Organic 7.30E-01 7.30E-01 Same 6.10E-01 — — — — — — — — — Benzo[a]anthracene 4 Organic 7.30E-01 7.30E-01 Same 3.10E-01 — — — — — — — — — Benzo[b]fluoranthene 1,2 Organic 7.30E-01 7.30E-01a Same 6.10E-01 3.08E-01a Less — — — — — — — Benzo[b]fluoranthene 4 Organic 7.30E-01 7.30E-01a Same 3.10E-01 3.08E-01a Same — — — — — — — Benzo[a]pyrene 1 Organic 7.30E+00 7.30E+00a Same 6.00E+00 3.08E+00a Less — — — — — — — Benzo[a]pyrene 3 Organic 7.30E+00 7.30E+00a Same 6.10E-01 3.08E+00a Greater — — — — — — — Benzo[g,h,i]perylene 4 Organic 7.30E-01 — Less 3.10E-01 — Less — — — — — Used benzo(a)pyrene
values for screening Bis(2-ethylhexyl)phthalate 2,5 Organic 1.40E-02 1.40E-02a Same — — Same 2.00E-02 2.00E-02a Same — — — — Butyl benzyl phthalate 2 Organic — — — — — Same 2.00E-01 2.00E-01a Same — — — — Carbon disulfide 2 Organic — — — — Same 1.00E-01 1.00E-01a Same 2.90E-03 2.00E-01 Greater — Carbon tetrachloride 2 Organic 1.30E-01 1.30E-01a Same 5.25E-02 5.25E-02a Same 7.00E-04 7.00E-04a Same 5.70E-04 — Less — Chloroaniline, p- 2 Organic — — — — — Same 4.00E-03 4.00E-03a Same — — — — Chloroform 2 Organic 6.10E-03 6.10E-03a Same 8.05E-02 8.05E-02a Same 1.00E-02 1.00E-02a Same — — — — Chrysene 2 Organic 7.30E-03 7.30E-03a Same — 3.08E-03a New — — — — — — — DDT 2 Organic 3.40E-01 3.40E-01a Same 3.40E-01 3.40E-01a Same 5.00E-04 5.00E-04a Same — — — — Dibenzofuran 2 Organic — — — — — — 4.00E-03 4.00E-03a Same — — — — Dibutyl Phthalate 2,4 Organic — — — — — — 1.00E-01 1.00E-01a Same — — — — Dichlorobenzene, 1,4- 2,5 Organic 2.40E-02 2.40E-02a Same — — — 3.00E-02 — — 2.30E-01 2.29E-01 Same — Dichloroethylene, 1,1- 5 Organic 6.00E-01 6.00E-01a Same 1.20E+00 1.75E-01a Less 9.00E-03 5.00E-02a Greater — 5.71E-02 Less — Dichlorodifluoromethane 1 Organic — — — — — — 2.00E-01 2.00E-01a Same 5.71E-02 5.71E-02 Same — Dichloroethylene, 1,2-cis- 1 Organic — — — — — — 9.00E-03 1.00E-02 Greater — — — — Dichloroethylene, 1,2-trans- 1 Organic — — — — — — 9.00E-03 2.00E-02a Greater — — — — Dimethylphenol, 2,4- 2 Organic — — — — — — 2.00E-02 2.00E-02a Same — — — — Dinitrotoluene, 2,4- 2 Organic — 6.80E-01a New — — — 2.00E-03 2.00E-03a Same — — — — Fluoranthene 2 Organic — — — — — — 4.00E-02 4.00E-02a Same — — — — Fluorene 2 Organic — — — — — — 4.00E-02 4.00E-02a Same — — — — Indeno[1,2,3-cd]pyrene 2 Organic 7.30E-01 7.30E-01a Same — 3.08E-01a New — — — — — — — Isophorone 2 Organic 9.50E-04 9.50E-04a Same — — — 2.00E-02 2.00E-01a Same — — — —
A-15

Table A-3. (continued). Is new Is new Is new greater New greater greater Inhalation New Is new
Oral New Oral than or Inhalation Inhalation than or than or RfD Inhalation greater than
COPCs WAG Contaminant
Type Slope Factor (mg/kg-day)-1
Slope Factor (mg/kg-day)-1
less than old?
Slope Factor (mg/kg-day)-1
Slope Factor (mg/kg-day)-1
less than old?
Oral RfD (mg/kg-day)
New Oral RfD (mg/kg-day)
less than old?
(mg/kg-day)
RfD (mg/kg-day)
or less than old? Comments
Octyl phthalate, di-N- 1,2 Organic — — — — — — 2.00E-02 4.00E-02 Greater — — — — Chlordecone (Kepone) 3 Organic — 8.00E+00 New — — — — 2.00E-04 New — — — — Methylene chloride 2 Organic 7.50E-03 7.50E-03a Same 1.64E-03 1.65E-03a Same 6.00E-02 6.00E-02a Same 8.60E-01 8.57E-01 Same — Methylphenol, 4 2 Organic — — — — — — — — — — — — Naphthalene, 2-methyl 2 Organic — — — — — — — 4.00E-03a New — — — — Naphthalene 1,2 Organic — — — — — — 4.00E-02 2.00E-02a Less — 8.57E-04 New — Nitrobenzene 2 Organic — — — — — — 5.00E-04 5.00E-04a Same 5.71E-04 5.71E-04 Same — Nitrophenol, 2 2 Organic — — — — — — — — — — — — — Phenanthrene 2,3,5 Organic — — — — — — — — — — — — — Phenanthrene 4 Organic — — — — — — 4.00E-03 — ? — — — — Phenol 2 Organic — — — — — — 6.00E-01 3.00E-01a Less — — — — Pyrene 2 Organic — — — — — — 3.00E-02 3.00E-02a Same — — — — Tetrachloroethane, 1,1,2,2- 2 Organic 2.00E-01 2.00E-01a Same 2.00E-01 2.03E-01a Same — 6.00E-02 New — — — — Tetrachloroethylene 1,2,5 Organic 5.20E-02 5.20E-02a Same 2.00E-03 2.03E-03a Same 1.00E-02 1.00E-02a Same 1.00E-02 1.71E-01 — WAGs 2 and 5 did not
present an RfD for inhalation.
Tetrahydrofuran 2 Organic — — — — — — — — — — — — — Toluene 2 Organic — — — — — — 2.00E-01 2.00E-01a Same — 1.14E-01 New — Toluene 2 Organic — — — — — — 2.00E-01 2.00E-01a Same — 1.14E-01 New — Trichloroethane, 1,1,1- 2 Organic — — — — — — 9.00E-02 2.00E-01a Greater 2.90E-01 6.29E-01 Greater — Xylene, mixture 2 Organic — — — — — — 2.00E+00 2.00E-01a Less — 2.86E-02 New — Aluminum 3 Inorganic — — — — — — 1.00E+00 1.00E+00 Same — 1.43E-03 New — Antimony (metallic) 2,5 Inorganic — — — — — — 4.00E-04 4.00E-04a Same — — — — Arsenic, inorganic 1 Inorganic 1.50E+00 1.50E+00a Same 5.00E+01 1.51E+01a Less 3.00E-04 3.00E-04a Same — — — — Arsenic, inorganic Inorganic 1.75E+00 1.50E+00a Less 1.50E+00 1.51E+01a Greater 3.00E-04 3.00E-04a Same — — — — Arsenic, inorganic 3 Inorganic 1.50E+00 1.50E+00a Same 1.50E+00 1.51E+01a Greater 3.00E-04 3.00E-04a Same — — — — Arsenic, inorganic 4 Inorganic 1.50E+00 1.50E+00a Same 1.50E+02 1.51E+01a Less 3.00E-04 3.00E-04a Same — — — — Arsenic, inorganic 5 Inorganic 1.80E+00 1.50E+00a Less 1.50E+01 1.51E+01a Same 3.00E-04 3.00E-04a Same — — New — Barium 1,2,3,5 Inorganic — — — — — — 7.00E-02 7.00E-02a Same 1.43E-04 1.43E-04 — — Beryllium and compounds 2 Inorganic 4.30E+00 4.30E+00a Same 8.40E+00 8.40E+00a Same 5.00E-03 2.00E-03a Less — 5.71E-06 — — Cadmium (diet) 2 Inorganic — — — 6.30E+00 6.30E+00a Same 5.00E-04 1.00E-03a Greater — — — — Cadmium (diet) 3 Inorganic — — — 6.30E+00 6.30E+00a Same 1.00E-03 1.00E-03a Same — — — — Cadmium (diet) 5 Inorganic — — — 1.80E-03 6.30E+00a Greater 5.00E-04 1.00E-03a Greater — — — — Cadmium (water) — Inorganic — — — — 6.30E+00a Same — 5.00E-04a Same — — — Used cadmium for water
for screening Chloride 2,3,5 Inorganic — — — — — — — — + — — — — Chromium (III) (insoluble 1,2,3 Inorganic — — — — — — — 1.50E+00a + — — — — salts) Chromium (III) (insoluble 5 Inorganic — — — —1.2E-02 — Less 1.00E+00 1.50E+00a Greater — — — — salts) Chromium VI (particulates) 5 Inorganic — — — 1.20E-02 4.20E+01a Greater 5.00E-03 3.00E-03a Less — 2.86E-05 New —
A-16

Table A-3. (continued). Is new Is new Is new greater New greater greater Inhalation New Is new
Oral New Oral than or Inhalation Inhalation than or than or RfD Inhalation greater than
COPCs WAG Contaminant
Type Slope Factor (mg/kg-day)-1
Slope Factor (mg/kg-day)-1
less than old?
Slope Factor (mg/kg-day)-1
Slope Factor (mg/kg-day)-1
less than old?
Oral RfD (mg/kg-day)
New Oral RfD (mg/kg-day)
less than old?
(mg/kg-day)
RfD (mg/kg-day)
or less than old? Comments
Chromium VI (particulates) 2 Inorganic — — — 2.90E+02 4.20E+01a Less 5.00E-03 3.00E-03a Less — 2.86E-05 New — Cobalt 2,5 Inorganic — — — — 9.80E+00a New 6.00E-02 2.00E-02 Less 2.90E-04 5.71E-06 Less — Copper 2,5 Inorganic — — — — — — 3.70E-02 4.00E-02a Less — — — — Fluoride 2 Inorganic — — — — — — 6.00E-02 — Less — — — — Lead and compounds 2,3,4,5 Inorganic — — — — — — — — — — — — Manganese (diet) 1,2,3,5 Inorganic — — — — — — 1.40E-01 1.40E-01a Same 1.40E-05 1.43E-05 Same — Manganese (water) 1,2,3 Inorganic — — — — — — 5.00E-03 4.60E-02a Greater 1.40E-05 1.43E-05 — — Mercury, inorganic salts 1,3,5 Inorganic — — — — — — 3.00E-04 3.00E-04a Same 8.57E-04 — — Conservatively used
elemental value for inhalation
Mercury, inorganic salts 4 Inorganic — — — — — — 3.00E-04 3.00E-04a Same 8.57E-05 — — Conservatively used elemental value for inhalation
Nickel, soluble salts 5 Inorganic — — — — — — 2.00E-02 2.00E-02a Same — — — — Nitrate 2,3 Inorganic — — — — — — 1.60E+00 1.60E+00a Same — — — — Nitrite 2 Inorganic — — — — — — 1.00E-01 1.00E-01a Same — — — — Osmium 3 Inorganic — — — — — — — — — — — — — Orthophosphate 2 Inorganic — — — — — — — — — — — — — Selenium 2,5 Inorganic — — — — — — 5.00E-03 5.00E-03a Same — — — — Silver 2,5 Inorganic — — — — — — 5.00E-03 5.00E-03a Same — — — — Strontium, stable 2 Inorganic — — — — — — 6.00E-01 6.00E-01a Same — — — — Sulfate 2,3 Inorganic — — — — — — — — — — — — — Sulfide 2 Inorganic — — — — — — — — — — — — — Thallium (soluble salts) 2,3 Inorganic — — — — — — — — — — — — — Thallium (soluble salts) 5 Inorganic 7.00E-05 — Same — — — — — — — — — — Tin 2 Inorganic — — — — — — 6.00E-01 6.00E-01a Same — — — — Uranium (soluble salts) 1,3 Inorganic — — — — — — 3.00E-03 6.00E-04a Less — — — — Vanadium, metallic 2,5 Inorganic — — — — — — 7.00E-03 7.00E-03a Same — — — — Zinc (metallic) 2,5 Inorganic — — — — — — 3.00E-01 3.00E-01a Same — — — — a. Footnote information is found in HEAST (EPA 1995). b. Aroclor-1260 was sampled for, but not detected at WAG 5. COPC = contaminant of potential concern EPA = U.S. Environmental Protection Agency HEAST = Health Effects Assessment Summary Table RfD = reference dose WAG = wastes area group
A-17

Table A-4. Evaluation in changes in total risk due to changes in inhalation slope factors.
Group 1 Group 2 Group 3 Group 5 Group 6
ARA-01 ARA-02
Soils
ARA-02 Seepage
Pit ARA-03 ARA-16 ARA-23 ARA-12 ARA-24 PBF-10 PBF-12 PBF-21 PBF-22 PBF-26
Inhalation risk
Total risk
Percent of total
2.E-08 2.E-08 2.E-08 2.E-08 2.E-08 2.E-08
8.E-04 4.E-04 2.E-03 2.E-05 4.E-04 1.E-04
0.0% 0.0% 0.0% 0.1% 0.0% 0.0%
2.E-06 2.E-06
2.E-03 2.E-06
0.1% 100.0%
3.E-18 3.E-18
2.E-05 2.E-05
0.0% 0.0%
2.E-17
1.E-05
0.0%
2.E-07 2.E-07
2.E-04 3.E-04
0.1% 0.1%
Original Results
Aroclor-1242 NTD NTD NTD NTD NTD NTD NA NA NA NA NA NA NA
Aroclor-1254a NA NA NA NA NA NA NA NA NA NA NA 5.E-09 5.E-09
Arsenic 8.E-09 8.E-09 8.E-09 8.E-09 8.E-09 8.E-09 NA NA NA NA NA 2.E-07 2.E-07
Cadmiumb NTD NTD NTD NTD NTD NTD NA NA NA NA NA NA NA
Chromium-III 9.E-10 9.E-10 9.E-10 9.E-10 9.E-10 9.E-10 2.E-07 2.E-07 NA NA NA NA NA
Chromium-VI 6.E-09 6.E-09 6.E-09 6.E-09 6.E-09 6.E-09 1.E-06 1.E-06 NA NA NA NA NA
Thalliumc 5.E-09 5.E-09 5.E-09 5.E-09 5.E-09 5.E-09 NA NA NA NA NA NA NA
Sum 2.E-08 2.E-08 2.E-08 2.E-08 2.E-08 2.E-08 1.E-06 1.E-06 0.E+00 0.E+00 0.E+00 2.E-07 2.E-07
Recalculated
Aroclor-1242 4.E-13 4.E-13 4.E-13 4.E-13 4.E-13 4.E-13 NA NA NA NA NA NA NA
Aroclor-1254 NA NA NA NA NA NA NA NA NA NA NA 5.E-09 5.E-09
Arsenic 8.E-09 8.E-09 8.E-09 8.E-09 8.E-09 8.E-09 NA NA NA NA NA 2.E-07 2.E-07
Cadmium 6.E-11 6.E-11 6.E-11 6.E-11 6.E-11 6.E-11 NA NA NA NA NA NA NA
Chromium III NTD NTD NTD NTD NTD NTD NTD NTD NA NA NA NA NA
Chromium VI 5.E-11 5.E-11 5.E-11 5.E-11 5.E-11 5.E-11 1.E-08 1.E-08 NA NA NA NA NA
Thallium NTD NTD NTD NTD NTD NTD NA NA NA NA NA NA NA
Sum 8.E-09 8.E-09 8.E-09 8.E-09 8.E-09 8.E-09 1.E-08 1.E-08 0.E+00 0.E+00 0.E+00 2.E-07 2.E-07 a. Although the aroclor-1254 slope factor for inhalation was not presented, it was calculated in Table B-85 of DOE-ID (1999). It appears that the currently accepted value (0.35 1/[mg/kg-day]) was used. b. Although a cadmium slope factor was presented, it was not calculated. c. Although a thallium slope factor for inhalation is not presented in Table B-20 of DOE-ID (1999), the ingestion slope factor was used. Group 3 risk from inhalation is due to radionuclides (see DOE-ID 1995, Table B-85)
ARA = Auxiliary Reactor Area COPC = contaminant of potential concern DOE-ID = U.S. Department of Energy Idaho Operations Office NTD = no toxicity data NA= not applicable (COPC not detected at site) PBF = Power Burst Facility
A-18

Appendix B
Activities Completed since September 30, 2004
B-1

B-2

Appendix B
Activities Completed since September 30, 2004 Waste Area Group 1
Since September 30, 2004, the following activities have been performed at Waste Area Group (WAG) 1:
TSF-26 – PM-2A
• Shipped PM2A Tanks V-13 and V-14 to the Idaho CERCLA Disposal Facility (ICDF)
• Disposed of Tank V-13 at the ICDF
• Designed and constructed Tank V-14 contents’ treatment process
• Treated Tank V-14 contents.
TSF-09/18 – V-Tanks (V-1, V-2, V-3, and V-9)
• Excavated the soil to the top of the V-Tanks
• Removed and disposed of ancillary piping
• Constructed the waste transfer and treatment system
• Removed the waste from Tanks V-1, V-2, and V-3 to the treatment/consolidation tanks
• Began treatment of the consolidated V-Tanks waste
• Disposed of the caustic tank (V-4)
• Disposed of the V-Tanks sand filter.
Operable Unit (OU) 1-07B Remedial Action Reports
The following interim remedial action reports have been completed since September 30, 2004:
• In Situ Bioremediation Interim Remedial Action Report, Test Area North, Operable Unit 1-07B, DOE/NE-ID-11221, Rev. 1, June 2005
• Monitored Natural Attenuation Interim Remedial Action Report, Test Area North, Operable Unit 1-07B, DOE/NE-ID-11229, Rev. 0, August 2005.
B-3

Waste Area Group 2
Since September 30, 2004, the following activities have been performed at WAG 2:
• Completed two new perched water monitoring wells (TRA-1933 and TRA-1934)
• Installed petro traps in the TRA-1933, TRA-1934, and PW-13 wells to collect free-phase diesel product
• Initiated monthly monitoring in November 2004 for the presence and thickness of free product in the TRA-1933, TRA-1934, and PW-13 wells.
(A detailed discussion of the petro trap monitoring and interface probe monitoring is presented in the Annual Groundwater Monitoring Status Report for Waste Area Group 2 for Fiscal Year 2005 [ICP/EXT-05-00967].)
Waste Area Group 3
Since September 30, 2004, the following activities have been performed at WAG 3:
• Implementation of Phase I of OU 3-13, Group 3, Other Surface Soils Remediation Sets 1–3, began in accordance with the Operable Unit 3-13, Group 3, Other Surface Soils Remediation Sets 1–3 (Phase I) Remedial Design/Remedial Action Work Plan (DOE/ID-11089). The status includes the following:
- Completed remedial actions at the CPP-67 site
- Prepared the Site Completion Report for Area CPP-67, WAG 3, OU 3-13, Group 3 Other Surface Soil (DOE/NE-ID-11234)
- Initiated remediation at the CPP-34A and CPP-34B sites, including the following:
− Collection of confirmation samples for ICDF approval process
− Excavation and hauling of contaminated soil to the ICDF
− Collection of verification samples
− Backfilling of the excavation with clean dirt
− Cleanup (activities are currently ongoing and expected to be complete by the end of the 2005 construction season)
- Completed characterization activities to support waste profile development for CPP-92, CPP-97, CPP-98, and CPP-99. This waste is planned for disposal at the ICDF.
B-4

Additional activities planned for the 2005 construction season include the following:
• Collection of characterization samples for the CPP-34b and CPP-34c sites
• Initiation of remedial actions at the CPP-92, CPP-97, CPP-98, and CPP-99 sites.
The remaining Group 3 sites will be included in Phase II.
NOTE: The CPP-81 site consists of a vent off-gas pipe from Building 637 at the Idaho Nuclear Technology and Engineering Center. The OU 3-13 Record of Decision (ROD) signed in October 1999 stated that there was insufficient information to make a decision on the CPP-81 site and that it should be included for further evaluation under OU 3-13. The explanation of significant differences (ESD) to the OU 3-13 ROD signed in January 2004 assessed previous decontamination efforts for this pipe, including five nitric acid flushes, 14 water rinses, and subsequent rinsate sampling and camera inspection. Based on this information, the ESD determined that the site qualified as a no-action site due to the previous decontamination efforts. However, during decontamination and decommissioning (D&D) activities at Building 637 in 2005, the pipe was cut and residual waste was discovered, bringing into question the no-action classification assigned in the ESD. Consequently, the U.S. Environmental Protection Agency (EPA) and the Idaho Department of Environmental Quality (DEQ) have requested that this site be evaluated as a Group 3 site under the OU 3-13 ROD.
Waste Area Group 4
Since September 30, 2004, the following activities have been performed at WAG 4:
• Installation of two aquifer water monitoring wells (CFA-1931 and CFA-1932), which were also equipped with vapor ports
• Repair of the subsidence at Central Facilities Area (CFA) Landfill III and reporting of the repair in the INL Sitewide Operations and Maintenance Report for CERCLA Response Actions—FY 2005 (DOE/ID-11249).
Waste Area Group 5
Since September 30, 2004, the following activities have been performed at WAG 5:
• Completed the Remedial Action Report for the Operable Unit 5-12 Remedial Action (DOE/NE-ID-11205)
• Completed the Operations and Maintenance Report for Operable Unit 5-12 (DOE/NE-ID-11228)
• Completed D&D activities pertaining to the Power Burst Facility (PBF) reactor complex (PER-620) in accordance with the requirements delineated in the Engineering Evaluation/Cost Analysis for Phase 1 of the Decommissioning for the Power Burst Facility Reactor Building (PER-620) (DOE/NE-ID-11196); Phase I activities completed under a time-critical removal action include the following:
B-5

- Removal and dispositioning of low-level radioactive liquids from PER-620
- Removal and dispositioning of liquids in the PER-706 evaporation tank
- Removal and dispositioning of most of the shielding lead and all cadmium sheeting
- Removal and dispositioning of the in-pile tube
- Installation of shielding over the reactor after removal of the reactor vessel water
- Removal and disposing of some radioactive hot spots to reduce worker exposures during removal of shielding lead
- Isolation of utility lines and other piping to the PBF reactor building and weatherproofing it
- Managing and disposing of other waste generated incidental to accomplishing this scope as Comprehensive Environmental Response, Compensation, and Liability Act (CERCLA) waste.
Waste Area Group 6
No additional remedial activities have been conducted at WAG 6 since September 30, 2004.
Waste Area Group 7
No additional remedial activities have been conducted at WAG 7 since September 30, 2004.
Waste Area Group 9
No additional remedial activities have been conducted at WAG 9 since September 30, 2004.
Waste Area Group 10
No additional remedial activities have been conducted at WAG 10 since September 30, 2004.
B-6

Appendix C
Issues Identified during the INL Sitewide Five-Year Review of 2005
C-1

C-2

Appendix C
Issues Identified during the INL Sitewide Five-Year Review of 2005
C-1. INTRODUCTION
Table C-1 provides a list of issues identified within each waste area group during the five-year review conducted in the year 2005. Also provided are recommendations for follow-up action, with anticipated completion date, and a qualitative determination as to the protection it provides.
C-3

Table C-1. Issues identified during the Idaho National Laboratory Sitewide five-year review of 2005.
Issues
Affects Protectiveness (Y/N)
Recommendations/Follow-up Actions
Anticipated Completion
Date
Follow-up Actions Affect Protectiveness
(Y/N)
Current Future Current Future
SITEWIDE
Applies to WAG 5 and other INL sites. The EPA guidance for the free release concentration of Cs-137 has been revised to account for the soil shielding factor included in the latest risk models. As a result, institutional controls at the ARA-03, PBF-22, and PBF-26 sites could be discontinued based on the new EPA guidance.
No No The DOE with the concurrence from the EPA and the State of Idaho DEQ will evaluate how to best address the impact of the new guidelines on institutionally controlled sites and will determine whether institutional controls should be discontinued at ARA-03, PBF-22, and PBF-26.
Prior to the next five-year review, 2010
No No
WAG 1
Establish and maintain the vegetative cover on WAG 1 OU 1-10 WRRTF Burn Pits II and IV.
No Yes Revegetation and weed control measures are implemented in accordance with established operation and maintenance requirements. Affected areas will be reseeded with appropriate seed mix for the sites.
Nov. 2009 No Yes
WAG 2
Establishment and maintenance of desirable vegetation on the native soil covers for the chemical waste pond, the sewage leach pond, and the sewage leach pond soil contamination area where
No Yes Revegetation and weed control measures are implemented in accordance with established operation and maintenance requirements. Affected areas will be reseeded with appropriate seed mix for the sites.
Nov. 2007 No Yes
C-4

Table C-1. (continued).
Issues
Affects Protectiveness (Y/N)
Recommendations/Follow-up Actions
Anticipated Completion
Date
Follow-up Actions Affect Protectiveness
(Y/N)
Current Future Current Future
WAG 3
(1) Tc-99 is present in the SRPA at 2X the MCLs. Observed concentrations are higher than predicted.
No Yes (1) This is being assessed in the OU 3-14 RI/FS. The draft OU 3-14 ROD is scheduled for submittal in December 2006 and will contain groundwater (GW) monitoring/modeling results and will specify the proposed groundwater remedy.
(1) June 2006 release draft proposed plan
No Yes
(2) Northern perched water zone is being addressed under OU 3-13 Group 4.
(1 & 2) ROD submittal, Dec. 2006.
(1) Northern perched water zone has persisted following relocation of the percolation ponds in 2002.
No Yes (1 & 2) Remedy implemented, March 2008
No Yes
WAG 4
Subsidence was identified at the CFA Landfill III that compromised the integrity of the cover, creating the potential to allow surface water to contact the waste and potentially carry contaminants into the SRPA.
Yes Yes The area of subsidence will be filled and repaired in accordance with established operation and maintenance requirements for the CFA landfills.
Nov. 2006 Yes Yes
WAG 5
No issues, other than the Sitewide issue were identified during this review.
No No NA NA No No
WAG 6
No issues were identified at WAG 6 during this five-year review.
No No NA NA NA NA
C-5

Table C-1. (continued).
C-6
Issues
Affects Protectiveness (Y/N)
Recommendations/Follow-up Actions
Anticipated Completion
Date
Follow-up Actions Affect Protectiveness
(Y/N)
Current Future Current Future
WAG 7
Pit 9 Pit 9 Pit 9 Pit 9 Pit 9 Pit 9 Pit 9
The volume of retrieved waste that will require treatment to meet waste acceptance criteria for the Waste Isolation Pilot Plant is unknown, resulting in complications in preparing the cost estimates for Stage III operations and in determining compliance approaches for ARARs.
No No (1) This issue is internal to CWI and does not impact the protectiveness of the remedy. Standard estimating practices will be followed to develop a cost estimate for the Stage III operations.
(1) NA (1) NA (1) NA
The RAOs, ARARs, and the treatment train identified in the OU 7-10 ROD need to be updated.
Yes Yes (2) This issue will be discussed between DOE, the agencies, and the CWI contractor.
Nov. 2008 (2) No (2) Yes
Pad A Pad A Pad A Pad A Pad A Pad A Pad A
Nitrates continue to be detected in the vadose zone. The significance of these detections needs to be evaluated.
Yes Yes (1) The significance of the detections is being evaluated in the context of the entire SDA in the OU 7-13/14 RI/FS.
Nov. 2008 TBD (depends on results of the OU 7-13/14 RI/FS)
TBD (depends on results of the OU 7-13/14 RI/FS)
OCVZ (Organic Contamination in the Vadose Zone) Vapor vacuum extraction with treatment is operating with PRGs that were updated in 2005. These PRGs are a range of carbon tetrachloride concentrations that span Region A and B, Zones 1–3 in the vadose zone. The PRGs are documented in the Data Quality Objectives Summary Report for Operable Unit 7-08 Post-Record of Decision Sampling (INEEL/EXT-2000-00814, Rev 2, June 2005). As active extraction continues, the measured subsurface carbon
OCVZ
No
OCVZ
Yes
OCVZ
Being evaluated in the context of the entire SDA in the OU 7-13/14 RI/FS.
OCVZ
April 2008
OCVZ
TBD (depends on results of the OU 7-13/14 RI/FS)
OCVZ
TBD (depends on results of the OU 7-13/14 RI/FS)

Table C-1. (continued).
Issues
Affects Protectiveness (Y/N)
Recommendations/Follow-up Actions
Anticipated Completion
Date
Follow-up Actions Affect Protectiveness
(Y/N)
Current Future Current Future tetrachloride concentrations need to be compared to the PRGs to determine the effectiveness of the extraction operation. If subsurface concentrations are approaching the PRGs, a decision to shut down the operation for rebound needs to be made. The PRGs need to be assessed to determine whether adjustments are needed and these remediation goals should be referred to as final remediation goals.
WAG 9
The sanitary lagoon site (ANL-04) was administratively transferred to OU 10-08 to facilitate closure of WAG 9 and allow for the completion of the WAG 9 Remedial Action Report.
No No The sanitary lagoon site (ANL-04) was transferred from WAG 9 to WAG 10 OU 10-08 in 2005. This transition will be documented in the OU 10-08 ROD.
July 2009 No No
WAG 10
No issues were identified at WAG 10 during this five-year review.
NA NA NA NA NA NA
C-7