Embed Size (px)
Citation preview
Five Year Review of the Health Star Rating System – Consultation Paper: Options for System Enhancement
October 2018

Table of Contents
Glossary ................................................................................................................................................... 4
Chapter 1 – Context and purpose of this Consultation Paper ..................................................................... 7 Important note .................................................................................................................................... 8
Chapter 2 – Our approach to identifying the issues ................................................................................... 9 Process for identifying issues ................................................................................................................ 9 Performance of the HSR System ......................................................................................................... 10 Alignment with Dietary Guidelines ..................................................................................................... 11 Principles for approaching the issues .................................................................................................. 14 Key issues for examination ................................................................................................................. 15 Issues not explored in this Consultation Paper .................................................................................... 16
Chapter 3 – Scope of the HSR System ...................................................................................................... 18 Overview ........................................................................................................................................... 18 Fresh or minimally processed fruits and vegetables ............................................................................ 18 Non-dairy beverages .......................................................................................................................... 22
Chapter 4 – Risk nutrients ...................................................................................................................... 28 Overview ........................................................................................................................................... 28 Sugars ................................................................................................................................................ 28 Sodium .............................................................................................................................................. 35
Chapter 5 – Positive nutrients ................................................................................................................ 39 Overview ........................................................................................................................................... 39 Protein .............................................................................................................................................. 39 Fibre and wholegrain ......................................................................................................................... 43
Chapter 6 – Product specific issues ......................................................................................................... 46 Overview ........................................................................................................................................... 46 Oils and oil-based spreads .................................................................................................................. 46 Salty snacks ....................................................................................................................................... 49 Dairy desserts .................................................................................................................................... 52 Ice confections and jellies ................................................................................................................... 54
Chapter 7 – Impact of proposed changes ................................................................................................ 56 Summary of preferred options ........................................................................................................... 56 Combined impact of changes on specific product types ....................................................................... 59 Combined effect of changes ............................................................................................................... 62
Chapter 8 – Next steps ........................................................................................................................... 63
Appendix 1 – The HSR Calculator ............................................................................................................ 64 Overview ........................................................................................................................................... 64 How the HSR Calculator works ........................................................................................................... 64
Appendix 2 – The TAG database ............................................................................................................. 66
Appendix 3 – Impact of proposed changes .............................................................................................. 68
Appendix 4 – Examples of products and the impact of proposed changes ................................................ 71
Bibliography .......................................................................................................................................... 75
Five Year Review of the Health Star Rating System: Consultation Paper, October 2018 Page 4 of 77
Glossary Term Meaning
ADG (Australian Dietary Guidelines) 2013
The ADG provide advice about the amount and types of foods that should be eaten for health and wellbeing, with recommendations based on scientific evidence.
AHS (Australian Health Survey) 2011-13
The AHS is the largest and most comprehensive health survey conducted in Australia. The AHS was undertaken by the Australian Bureau of Statistics (ABS) and collected a range of information about health-related issues.
AHS Discretionary Foods List
The AHS Discretionary Foods List was developed by the Australian Bureau of Statistics (ABS) in 2014 for the purpose of the 2011-12 National Nutrition and Physical Activity Survey. It classifies foods as discretionary based on the AGD.
Australia New Zealand Foods Standards Code (the Code)
The standards in the Code are legislative instruments and include standards for food safety, food composition and labelling and foods that need pre-approval such as genetically modified foods. The Code sets out regulatory requirements for food labelling and other information requirements on foods, plus food standards for: substances that can be added to or present in food; contaminants and resides; foods requiring pre-market clearance; microbiological limits; specific standards for food categories; food safety and primary production standards (Australia only).
Baseline points In the NPSC system, baseline points are allocated for the negative components considered in that system (energy, saturated fatty acids, total sugars and sodium). In the HSR Calculator, baseline points are allocated to these same risk-associated components (energy, saturated fatty acids, total sugars and sodium). HSR baseline points contribute inversely to the final HSR.
Category 1 A HSR Category that covers beverages other than dairy beverages and alcoholic beverages.
Category 1D A HSR Category that covers dairy beverages that meet the calcium content requirements of Schedule 4 of Standard 1.2.7 of the Code. Category 1D may include milk and dairy beverage alternatives derived from legumes, cereals, nuts or seeds, providing they meet the criterion for calcium content.
Category 2 A HSR Category that covers all foods other than those in Categories 1 and 1D, 2D, 3 and 3D.
Category 2D A HSR Category that covers dairy foods other than those included in Categories 1D or 3D. This may include all cheeses with a calcium content ≤ 320mg/100g, yoghurt and other fermented milk products. Category 2D may include cheese and yoghurt alternatives derived from legumes providing the cheeses meet the criterion for 2D foods for calcium content.
Category 3 A HSR Category that covers oils and spreads, defined as follows in the Code:
• edible oil as defined in Standard 2.4.1 • edible oil spreads as defined in Standard 2.4.2 • margarine as defined in Standard 2.4.2 • butter as defined in Standard 2.5.5
Category 3D A HSR Category that covers cheese and processed cheese as defined in Standard 2.5.4 of the Code (with calcium content >320mg/100g). Category 3D may include cheese alternatives derived from legumes providing they meet the criterion for 3D foods for calcium content.
Five Year Review of the Health Star Rating System: Consultation Paper, October 2018 Page 5 of 77
Term Meaning
Component In the context of the HSR System, components are the nutrients, ingredients and other parameters used to determine a product’s HSR, including the energy, saturated fat, total sugars, sodium, protein, fibre and FVNL content.
Dietary Guidelines Collectively refers to the ADG and the NZEAG.
Discretionary foods Discretionary foods and drinks are those not necessary to provide the nutrients the body needs. Many of these are high in saturated fats, sugars, salt and/or alcohol. They can be included in the diet occasionally in small amounts by those who are physically active but are not a necessary part of the diet. This includes cakes, biscuits, confectionary, jellies, ice confections (gelato, sorbet), dairy desserts (custards and creams), salty snacks (potato crisps and other fatty/salty snack foods) and sugar-sweetened beverages.
Energy icon An optional element in the HSR System that can be used with or without the HSR stars (e.g. for small pack sizes and some confectionery and beverage products).
Fibre points (F points)
HSR Category 2 and 3 products score points for the proportion of fibre present. Category 1 products cannot score F points.
Five/Four Food Group (FFG) foods
FFG foods also known as ‘core’ foods are described by Dietary Guidelines as the basis of a healthy diet. This includes fruit and vegetables, grain foods (mostly wholegrain or high fibre varieties), dairy foods such as milk, cheese and yogurt (mostly reduced fat), legumes, nuts, seeds, lean meats, eggs, tofu, etc.
Front-of-Pack Labelling (FoPL)
The concept of putting simplified nutritional information on the front of food or beverage product packages, either numerically or graphically.
The Forum Australia and New Zealand Ministerial Forum on Food Regulation
Food Standards Australia New Zealand (FSANZ)
FSANZ is a statutory authority in the Australian Government Health portfolio which develops and administers the Code.
Fruit, vegetable, nut, legume (FVNL) content
Fruit, vegetable, nut, legume content as defined in Schedule 5 of the Code. This term is used in both the HSR system and the NPSC.
Industry Guide The Guide for Industry to the HSR Calculator provides detailed information about how the HSR is calculated, including example calculations. This document contains important information that allows industry to calculate the HSR.
Health Star Rating Advisory Committee (HSRAC)
HSRAC is the trans-Tasman body responsible for overseeing the voluntary implementation of the HSR system, including in particular the monitoring and evaluation component of the system in Australia and New Zealand and the social marketing campaign in Australia.
HSR Calculator The HSR Calculator calculates the HSR for products based on input of their nutrition information. The HSR Calculator considers four components of a food associated with increasing the risk factors of chronic diseases (energy, saturated fat, sodium and total sugars content). Certain ‘positive’ aspects of a food such as FVNL content, and in some instances, fibre and protein content are also considered. Points are allocated based on the nutritional composition of 100g or 100mL of the product, following the units used in the NIP of a packaged product. The points are converted to a star rating (from 0.5 to 5 stars). The HSR Calculator is a modified version of the NPSC developed by FSANZ for the regulation of health claims in Australia and New Zealand and prescribed in Standard 1.2.7 – Nutrition, Health and Related Claims of the Code.
Five Year Review of the Health Star Rating System: Consultation Paper, October 2018 Page 6 of 77
Term Meaning
See Appendix 1 for a more detailed description of the HSR Calculator.
HSR category The HSR system is based on six different product categories (1, 1D, 2, 2D, 3 and 3D).
Modifying points In the NPSC, modifying points are calculated as part of the nutrient profiling score. Modifying points are allocated for the positive components (%FVNL and, in some instances, protein, fibre) present in foods and beverages, in accordance with Schedule 5 of Standard 1.2.7 of the Code. In the HSR Calculator, extended modifying points are allocated to the same positive components, increasing the final HSR for a product.
Nutrition Information Panel (NIP)
Nutrition Information Requirements in Standard 1.2.8 of the Code requires nutrition information on most food labels in the form of a NIP. In the NIP, information on the amount of energy, protein, total fat, saturated fat, carbohydrate, total sugars and sodium must be displayed. Manufacturers can elect to sub-label protein, carbohydrates and fats. Total sugars declarations can declare sub groups as specific sugars, such as lactose, if desired.
Nutrient Profiling Scoring Calculator (NPSC)
The NPSC is a nutrient profiling system referred to in Standard 1.2.7 and detailed in Schedule 5 of The Code. The NPSC is used in Australia and New Zealand to determine whether a food is suitable to make a health claim, based on its nutrient profile. Only foods that meet a certain score will be allowed to have health claims made about them. The HSR algorithm is based on the NPSC with some modifications to better meet the needs of a scale rather than binary application.
New Zealand Eating and Activity Guidelines 2015 (NZEAG)
The NZEAG provide evidence-based population health advice on healthy eating and being physically active. The document is written for health practitioners and others who provide advice on nutrition and physical activity for New Zealand adults.
Protein points (P points)
In the HSR system, food products score P points for the amount of protein present in the food. Protein points contribute to modifying points and can be scored if a food product scores less than 13 baseline points in the HSR Calculator. A food product that scores more than or equal to 13 baseline points can only score protein points if the food scores 5 or more V points in the HSR Calculator.
Rescaling Current scaling of each HSR category is based on the outputs produced by the HSR Calculator using the database used to develop and test the HSR System. The intention of scaling is to distribute products within each category across the range of HSRs available (i.e. from 0.5-5.0), thereby providing greater differentiation between rankings. HSR categories could be rescaled to redistribute products according to their relative nutrient content if a new distribution of products displays less differentiation.
Style Guide The Style Guide provides guidance for the application of the HSR System on product packaging.
TAG (Technical Advisory Group)
The TAG consists of a tripartite (government, food industry, public health) group of experts with relevant technical skills. The TAG’s role is to analyse and review the performance of the HSR Calculator and respond to technical issues and related matters referred to it by the HSRAC.
FVNL points (V points)
In the NPSC and the HSR System, products score V points for the proportion of their ingredients comprising of FVNL (fruits, vegetables, nuts and legumes including coconut, spices, herbs, fungi, seeds and algae). Note that V points have been expanded in the HSR Calculator compared to the table in the NPSC.
Five Year Review of the Health Star Rating System: Consultation Paper, October 2018 Page 7 of 77
Chapter 1 – Context and purpose of this Consultation Paper
The Health Star Rating (HSR) System is a voluntary front-of-pack labelling (FoPL) scheme that rates the overall nutritional profile of packaged food and assigns it a rating from 0.5 to 5 stars. With a focus on processed packaged foods, the objective of the HSR System is to provide convenient, relevant and readily understood nutrition information and/or guidance to assist consumers to make informed food purchases and healthier eating choices. In July 2017, mpconsulting was engaged to undertake a Five Year Review of the HSR System (the Review). The Review is considering the extent to which the objectives of the HSR System have been met, and identifying options for improvements to the ongoing implementation of the System. Over the past 12 months, we have consulted extensively with stakeholders regarding the: • objectives and impact of the HSR System • uptake, governance and communications around the System • the scope of the System and performance of the HSR Calculator. In January 2018, we released a Navigation Paper detailing some early findings, and highlighting key issues raised by stakeholders for further examination. Throughout February to April 2018, we facilitated nine public forums across Australia and in New Zealand to hear from stakeholders on a range of key issues. Consumers plus industry, public health and government representatives identified key areas in which they felt the System is, and is not, meeting expectations. Many stakeholders acknowledged they did not have a strong understanding of the detailed workings of the HSR Calculator (which determines the HSR of a product) and would value further modelling to understand the extent of any perceived ‘problems’ with the System, and the impact of options for addressing any such issues. The Health Star Rating Advisory Committee (HSRAC) has worked closely with the Technical Advisory Group (TAG) to develop a range of technical papers on various issues identified by stakeholders. These papers are available at the mpconsulting website. Drawing on these technical papers, as well as the Dietary Guidelines (the Australian Dietary Guidelines (ADG)1 and the New Zealand Eating and Activity Guidelines (NZEAG)2), monitoring data, relevant evidence and consultations, we have independently identified what we consider are the main issues for the Review, as they relate to the scope of the HSR System (the products on which it appears) and the HSR Calculator. We have proposed a range of options for addressing identified issues and, where possible, specified our preferred option. We are mindful that some of these options differ to those modelled by the HSRAC/TAG (as reflected in the technical papers). Where this is the case, we have explained our reasoning for proposing different or additional options. We now seek stakeholder views on the issues and the options. We also welcome input on the impacts of the various options, and any suggestions for alternative options to address the identified issues. This paper deals only with issues and options relating to the scope of the HSR System and the performance of the HSR Calculator. It does not deal with the range of other issues that the Review is examining including the impact of the System, the governance of the System and whether the System should remain voluntary or
1 National Health and Medical Research Council, February 2013, Australian Dietary Guidelines – Providing the scientific evidence for healthier Australian diets, Canberra 2 Ministry of Health, October 2015, Eating and Activity Guidelines for New Zealand Adults, Wellington
Five Year Review of the Health Star Rating System: Consultation Paper, October 2018 Page 8 of 77
be mandated. These elements of the Review have been informed through stakeholder submissions and discussions at public forums. We also await further impact data from the National Heart Foundation (in Australia) and the Ministry for Primary Industries (in New Zealand). Stakeholders will have an opportunity to comment on these broader issues (and see them dealt with in the context of any recommended changes to the System) in the Draft Review Report to be published for comment in early 2019. We would like to take the opportunity to thank the HSRAC and the TAG for their significant work in modelling options and developing the technical papers. We also extend our appreciation to the wide range of academics, consumers, nutritionists and representatives from government, public health and industry who have shared their experiences and expertise, and provided valuable information to inform the Review. We look forward to continuing to engage with you as the Review progresses.
Important note In the development of this Consultation Paper we have drawn on a range of sources, including Australian Bureau of Statistics (ABS) data, modelling undertaken by the TAG, and data provided by stakeholders. • Unless otherwise specified, where we have quoted statistics regarding population level intakes of nutrients
and/or foods, we have used: − for Australia, the 2011-12 Australian Health Survey (AHS)3 − for New Zealand, the 2008/09 New Zealand Adult Nutrition Survey (NZANS)4.
We acknowledge that these datasets are dated and that, in some cases, more recent studies based on smaller datasets produce different results. However, these surveys are widely considered the largest, most comprehensive and reliable datasets available with regard to national health and nutrition.
• When we refer to Dietary Guidelines, we are referring collectively to the ADG and NZEAG. We acknowledge that these Dietary Guidelines differ in important respects and, where these differences are directly relevant to the discussion, we have highlighted these differences.
• We have relied upon the Australian Health Survey’s (AHS) Discretionary Foods List5 as the best available reference for classifying foods as discretionary (foods for limited intake). The list was developed based on the ADGs. The list is unique to Australia and has some limitations. While it provides a general guide as to foods that are FFG or discretionary, this Consultation Paper explores areas where it may not be a useful guide to the performance of the HSR in terms of differentiating FFG and discretionary foods.
• The TAG has undertaken modelling to inform the options presented in this Consultation Paper. At the time of modelling, the TAG database comprised 5,885 products with data provided voluntarily by industry. We acknowledge that the TAG database has limited representation across some product types, and does not include ingredient information. Following stakeholder feedback on the options, we will explore avenues for modelling preferred options using larger databases.
• A number of stakeholders, including industry and public health organisations, have provided data and
information to inform this Consultation Paper. Where possible, we have used this information to corroborate or supplement analysis undertaken by the TAG.
Much of the discussion in this Consultation Paper relies on an understanding of the HSR Calculator and the Guide for Industry to the HSR Calculator (Industry Guide. Further information is available at Appendix 1 and on the HSR website. 3 Australian Bureau of Statistics, Australian Health Survey 2011-12 4 Ministry of Health, A Focus on Nutrition: Key Findings of the 2008/09 New Zealand Adult Nutrition Survey 5 Australian Bureau of Statistics, 9 May 2014, 4363.0.55.001 - Australian Health Survey: Users' Guide, 2011-13, Discretionary Foods
Five Year Review of the Health Star Rating System: Consultation Paper, October 2018 Page 9 of 77
Chapter 2 – Our approach to identifying the issues
Process for identifying issues Over the course of the Review, stakeholders have raised a wide range of issues relating to the products on which the HSR appears and the way the HSR is calculated. When the Navigation Paper was published in January 2018 (and public forums were subsequently conducted throughout February – April 2018) we sought to distil the key problems requiring consideration – identifying those that might be addressed through changes to the HSR System, and those that could not. Overall, there were a number of key themes emerging from stakeholder consultations regarding the areas of focus for the Review: • how well the HSR System aligns with the Dietary Guidelines and whether the System adequately
promotes the Four/Five Food Group (FFG) foods (i.e. foods that form the basis of a healthy diet) • whether the HSR System should apply to packaged fresh fruits and vegetables (and also whether such
foods should automatically receive an HSR of 5) • whether the HSR Calculator is appropriately rating non-dairy beverages and what HSR System graphic
non-dairy beverages should display • whether the HSR Calculator appropriately accounts for sugars and, specifically, whether the HSR
Calculator should take account of added sugars • whether protein should continue to be included as a positive nutrient in the HSR Calculator, as the
majority of Australians and New Zealanders meet or exceed recommended intakes for protein • whether wholegrain content should be factored into the HSR Calculator to better reflect Dietary
Guideline recommendations to eat grain foods, mostly wholegrain and/or high cereal fibre varieties • some areas of concern relating to specific product categories or subcategories such as certain dairy
desserts, oils and spreads, salty snacks, jellies and ice confection.
Stakeholders also generally acknowledged that: • changes should only be made where necessary (including to avoid negatively impacting on consumer
confidence and industry willingness to participate) • where possible, we should seek closer alignment with Dietary Guidelines (noting that absolute alignment
is not possible because the ADG and NZEAG differ in some respects) • the products of particular interest to stakeholders (in terms of whether the HSR System is ‘working’ as
expected) are breakfast cereals, ‘lunch box’ foods (including muesli bars), ready-to-eat meals, some dairy products and non-dairy beverages such as juices. Many of these products are also the subject of draft targets for reformulation in Australia (under the Healthy Food Partnership).
This Chapter: • describes the performance of the HSR System (by way of context for consideration of any changes) • details how well the HSR System aligns with Dietary Guidelines and whether the System adequately
distinguishes FFG and discretionary foods • describes how the issues have been further refined based on available data about the performance of
the System, particularly in relation to alignment with Dietary Guidelines (and discernment of FFG and discretionary foods).
Five Year Review of the Health Star Rating System: Consultation Paper, October 2018 Page 10 of 77
Performance of the HSR System Monitoring shows that: • uptake of the HSR System continues to increase, with the HSR having been displayed on 10,333 products
in Australia and over 4,000 products in New Zealand since inception. Uptake is highest in cereals, convenience foods, packaged fruits and vegetables, sauces and spreads, confectionery, sugar-sweetened beverages, cakes, muffins and bakery products. 6 7 The official monitoring of the HSR System does not currently provide the proportion of eligible products displaying the HSR or the yearly totals.
− Using a different methodology, a study published in July 20188 found that uptake of the HSR System
is increasing in Australia, with a total of 7,922 products displaying the HSR between 30 June 2014 and 30 June 2018. In 2017 alone, 4,348 out of 15,767 eligible products (28%) displayed the HSR. The study found that uptake of the HSR was highest on convenience foods (44%), cereals (36.7%) and fruits and vegetable products (35.9%), and that 118 manufacturers were using the HSR System in Australia.
• the HSR System is becoming increasingly recognised and used by consumers, with most respondents in
Australia believing the HSR System is easy to use (76%), understand (76%) and makes choosing foods easier (63%). In New Zealand, 76% of respondents were aware of the HSR System when prompted, 49% understood how to use the HSR System and 59% of those who had used the HSR System were influenced to buy a product they would not normally purchase.9
• There is a reasonable level of confidence in the HSR System, with most Australian respondents believing the HSR System is credible (63%), reliable (61%), trustworthy (59%) and open and transparent (58%).10 In New Zealand, 47% of respondents felt confident to use the HSR System to choose packaged foods, 40% said they trust the HSR System and 59% agree the HSR System can help them make food shopping decisions for them and their families.11
• For companies displaying the HSR, compliance in calculating the HSR is high. In Australia, at the end of June 2016 for individual products with complete data available, 97% were displaying the correct HSR (1,755 of 1,804 products sampled). Of the 49 products for which the HSR displayed did not match the calculated HSR, 30 had understated the HSR and 19 had overstated the HSR.12
In addition, feedback from industry indicates the HSR System is encouraging manufacturers to reformulate to reduce sodium, sugars and/or saturated fats and, in some cases, increase the content of ingredients with nutritional benefits such as dietary fibre to increase the product’s HSR. This feedback is consistent with:
6 Uptake figures for Australia as at end March 2018. National Heart Foundation, April 2018, Report for Wave 7 of additional update monitoring of the Health Star Rating (HSR) System, in Australia. February-March 2018, prepared for the Department of Health 7 Uptake figures for New Zealand as at end June 2018. Data provided by industry to the Ministry of Primary Industries, 24 September 2018 8 Jones, A, Shahid, M & Neal, B ‘Uptake of Australia’s Health Star Rating System’, Nutrients, July 2018 9 Colmar Brunton, 2018, 2018 Health Star Rating monitoring and evaluation: Year 2 follow-up research report, prepared for the Health Promotion Agency 10 National Heart Foundation, April 2018, Report on the monitoring of the implementation of the Health Star Rating system: Area of Enquiry 2 – Consumer awareness and ability to use the Health Star Rating system correctly, prepared for the Department of Health 11 Colmar Brunton, 2018, 2018 Health Star Rating monitoring and evaluation: Year 2 follow-up research report, prepared for the Health Promotion Agency 12 Health Star Rating Advisory Committee, April 2017, Two year progress review report on the implementation of the Health Star Rating system – June 2014 - June 2016
Five Year Review of the Health Star Rating System: Consultation Paper, October 2018 Page 11 of 77
• an Australian study published in May 201813 that analysed the change in composition for products displaying HSR from 2013-2016. It found the average energy density of products displaying the HSR was lower post implementation of the HSR System. Products that did not display the HSR showed less reduction (or even some increases) in energy density. Findings suggested the HSR System’s impact on product reformulation has the potential to generate increasing health benefits and reduce mean population body weight
• a New Zealand study published in August 201714 showed that products displaying the HSR had significantly lower mean saturated fat, total sugar and sodium, and higher fibre content, than products not displaying the HSR. Small but statistically significant changes were observed in mean energy density, sodium and fibre contents of products displaying the HSR compared with their composition prior to their adoption of the HSR. Reformulation of products displaying the HSR was greater than that of products that did not display the HSR over the same period. It was concluded that the roll-out of the HSR System is driving healthier reformulation of some products.
Alignment with Dietary Guidelines Dietary Guidelines aim to promote the benefits of healthy eating, not only to reduce the risk of diet-related disease but also to improve community health and wellbeing. Dietary Guidelines provide advice on the types and amounts of foods and beverages people should consume, with recommendations based on whole foods rather than specific food components or nutrients (noting however, that they do recommend avoiding foods high in certain nutrients). The ADG classify foods as FFG (foods that form the basis of a healthy diet) or discretionary (foods to limit in the diet). While the NZEAG do not use these terms, advice is consistent regarding recommendations to limit intake of foods high in added sugars, sodium and/or saturated fats. In contrast, the HSR System uses a product’s nutritional composition to provide an empirical scale of its relative healthiness (rating products at 10 intervals between 0.5 and 5 stars). Given the different focus of the HSR System, it cannot be expected to align entirely with the Dietary Guidelines, nor communicate all of the messages embedded in the Dietary Guidelines (including in relation to a product’s portion size/quantity or a person’s whole diet). However, one way of examining the alignment of the HSR system with Dietary Guidelines (particularly in the Australian context) is to consider how well it scores products against the AHS Discretionary Foods List. The Discretionary Foods List was developed by the Australian Bureau of Statistics (ABS) in 2014 for the purpose of the 2011-12 National Nutrition and Physical Activity Survey. It provides a binary system for classifying foods into core (FFG) and discretionary (foods for limited intake) based on the ADG. While the List has some limitations, it provides a general indication of foods that are FFG or discretionary. A principle in the development of the HSR System was to ensure, where possible, that products eligible to carry a health claim and FFG products score an HSR ≥ 3, while discretionary products score an HSR < 3.15 Recent monitoring data shows that 95% of consumers believe an HSR ≥ 4 is ‘healthy’, while 97% of consumers believe an HSR ≤3.5 is ‘unhealthy’.16
13 Mantilla Herrera, A.M., Crino, M., Erskine, H.E., Sacks, G., Ananthapavan, J., Mhurchu, C.N., Lee, Y.Y. Cost-Effectiveness of Product Reformulation in Response to the Health Star Rating Food Labelling System in Australia. Nutrients 2018, 10, 614. 14 Ni Mhurchu, C, Eyles, H & Choi, Y, ‘Effects of a Voluntary Front-of-Pack Nutrition Labelling System on packaged food reformulation: the Health Star Rating system in New Zealand’, Nutrients, (2017), 9, 918 15 TAG technical paper, October 2018, History and development of the HSR algorithm, p.11 16 National Heart Foundation, August 2018, Report on the monitoring of the implementation of the Health Star Rating system: Area of Enquiry 2 – Consumer awareness and ability to use the Health Star Rating system correctly, prepared for the Department of Health
Five Year Review of the Health Star Rating System: Consultation Paper, October 2018 Page 12 of 77
Based on modelling undertaken by the TAG (and described in more detail in the technical papers): • there is 72% overall alignment with Dietary Guidelines (with 84% of FFG foods scoring an HSR ≥ 3 and
61% of discretionary foods scoring an HSR < 3) • ‘outliers’ were classified as FFG foods with an HSR < 3 and discretionary foods with an HSR ≥ 3
− FFG outliers are mainly cheeses and yoghurts − discretionary outliers are mainly savoury sauces and gravies (31%), soups and stocks (12%), ice
creams and confections (11%) and muesli bars (8%) • of the 1,435 outliers:
− 32% indicate potential issues with the HSR System. These products included some muesli/cereal bars, recipes/sauce mixes, ice confection, ice cream, dry gravy mixes, salty snacks, coffee-based beverages, sugar-based desserts (jelly and dairy desserts), processed meats and breakfast cereals
− 68% indicate potential issues with the ADG (based on the AHS Discretionary Foods List): o 31% had either a low HSR and a relatively poor nutritional profile but were categorised as FFG
(e.g. some rice crackers, instant noodles, peanut butter, smoked salmon products), or had a high HSR and a relatively healthy nutritional profile but were categorised as discretionary (e.g. some tomato-based sauces, crumbed fish, vegetable and legume-based dips and oven baked potato products)
o 37% had a low HSR and, within their product category, a relatively poor nutritional profile, but were categorised as FFG (e.g. full fat cheeses, yoghurts, flavoured milks, custards).
A number of other reviews have also examined the alignment of the HSR System with Dietary Guidelines: • Research undertaken by the George Institute for Global Health (George Institute) published in
April 201817 found there is 86.6% overall alignment with the ADG, with FFG foods scoring an average HSR of 4 and discretionary foods scoring an average HSR of 2. Of the outliers, 83% were characterised as an ADG failure (based on the AHS Discretionary Foods List due to challenges in defining FFG and discretionary) rather than an HSR System failure. 17% of the outliers were attributed to issues with the HSR System, including in relation to sauces, dressings, spreads and dips, savoury snacks, meats and meat products, convenience foods, fruits and flavoured yoghurts.
• A study published in January 201818 found the median HSR displayed on discretionary foods was 2.5, significantly lower than the median HSR of 4 for FFG foods.
• Research commissioned by the NSW Ministry of Health in 201519 found that 79% of foods and beverages classified as FFG score an HSR of ≥3.5, while only 14% of foods and beverages classified as discretionary score an HSR of ≥3.5.
• A study published in May 201620 found that, for dairy products, the HSR System largely aligned with the Nutrient Profiling Scoring Criterion (NPSC) used for determining eligibility for health claims. Both systems appeared to be consistent with the ADG for dairy products, with lower-fat products rating higher.
• A study published in August 201621 found the HSR System rated packaged dairy foods and beverages broadly in line with the ADG by assigning FFG foods higher HSRs and discretionary foods lower HSRs.
17 Jones, A, Radholm, K and Neal, B ‘Defining ‘Unhealthy’: a systematic analysis of alignment between the Australian Dietary Guidelines and the Health Star Rating System’, Nutrients 2018, 10, 501 18 Lawrence, M, Dickie, S and Woods, J. ‘Do nutrient-based front-of-pack labelling schemes support or undermine food-based dietary guideline recommendations? Lessons from the Australian Health Star Rating System’, Nutrients, 5 January 2018 19 Dunford, E, Cobcroft, M, Thomas, M, & Wu, J.H. (2015) Technical Report: Alignment of NSW Healthy Food Provision Policy with the Health Star Rating System, Sydney, NSW: NSW Ministry of Health 20 Wellard, L, Hughes, C, Watson, WL. ‘Investigating nutrient profiling and Health Star Ratings on core dairy products in Australia’, Public Health Nutrition, 2 May 2016, 19 (15) p. 2860-5 21 Carrad, AM, Louie, J.C., Yeatman, H.R., Dunford, E.K., Neal, B.C., Flood, V.M., ‘A nutrient profiling assessment of packaged foods using two star-based front-of-pack labels’, Public Health Nutrition, 19 August 2016
Five Year Review of the Health Star Rating System: Consultation Paper, October 2018 Page 13 of 77
Examples of the way in which foods may be miscategorised applying the AHS Discretionary Foods List include: • FFG foods with relatively poor nutrient profiles:
− All cheeses are FFG although some are high in saturated fats and/or sodium (using the UK Traffic Light System to assess ‘low’ or ‘high’).
− All yoghurts are FFG, although some are high in saturated fats and/or total sugars. − Dried fruit products are FFG, although some are high in total sugars. − Smoked salmon is FFG, although relatively high in saturated fats and/or sodium. − Some breakfast cereals are FFG despite being high in total sugars (i.e. up to and including 30g
total sugars per 100g). • Discretionary foods with relatively healthy nutrient profiles:
− All savoury sauces are discretionary (except homemade tomato-based sauces), although some are low in saturated fats, total sugars and sodium.
− All dips are discretionary, although some are low in saturated fats, total sugars and sodium. − All muesli, cereal and nut-based bars are discretionary, although some are low in saturated fats,
total sugars and sodium. The performance monitoring, TAG modelling and other studies have assisted in distilling the issues for examination. For example, the information highlights that there are: • some areas where the Dietary Guidelines do not necessarily align with consumer expectations. For
example, where foods are classified as FFG but are relatively high in total sugars such as certain breakfast cereals, flavoured milks and yoghurts
• some products of high consumer interest where alignment with Dietary Guidelines could be improved, such as muesli or cereal style bars, salty snacks, sugar-based desserts (jelly and ice confection) and oils and oil-based spreads
• other areas where alignment could be improved, but there is less consumer interest or the foods do not make a significant contribution to the diet such as recipe mixes, savoury sauces and spreads, stocks and dry gravy mixes, coffee-based beverages and flavoured teas.
Five Year Review of the Health Star Rating System: Consultation Paper, October 2018 Page 14 of 77
Principles for approaching the issues In exploring these issues and developing options we have sought to apply the following principles: 1. Clearly articulate the problem to be addressed and target solutions to the problem
− Where problems have been broadly expressed, we have sought to understand the underlying concern and why the problem (if any) manifests in the HSR System.
− We have sought to recommend a solution that targets the specific concern without unnecessarily impacting the System more broadly.
2. Retain the integrity of the HSR System and maintain alignment with other regulation (including the
Nutrient Profiling Scoring Criterion (NPSC)) where possible − The HSR System is generally performing well such that broad or large-scale changes (that would
fundamentally disrupt or replace the existing System) are not proposed. The HSR System should continue to provide an overall view of a product based on a combination of components.
− The HSR System is based on the NPSC, using the same relevant definitions, with some key differences and extrapolations. Where possible we will continue to seek alignment with the NPSC but will explore, in particular, the effectiveness of any areas where the HSR System diverges from the NPSC.
3. Be evidence based
− We have drawn on the best available evidence but acknowledge that much of the evidence is disputed. On some issues there is either limited evidence or stakeholders have vastly different interpretations of the evidence.
4. Remain as simple as possible
− It is important that any changes do not overly complicate the HSR System to ensure that industry and consumers can easily use it.
− The HSR System should avoid creating special rules and exceptions for certain products or HSR Categories wherever possible.
5. Align, as far as possible, with Dietary Guidelines − While the purpose of the Dietary Guidelines differs to that of the HSR System, the HSR System
should be used as a tool to complement the Dietary Guidelines. − One way of examining alignment is to consider how well the HSR System differentiates FFG and
discretionary foods. However, as noted above, there are challenges with applying this at the individual product level. As well as inconsistencies between the ADG and the NZEAG, the AHS Discretionary Foods List seeks to dichotomise foods as FFG or discretionary, whereas the HSR System provides an empirical scale based on the balance of risk-associated nutrients and positive nutrients.
6. Enable maximum discernment between like foods with different nutritional profiles − The HSR System is intended to support consumers to choose between like products. While the
System needs to be broadly credible across the food supply, direct comparisons across HSR categories should be discouraged (e.g. comparing a dairy beverage to a biscuit).
− However, there are some foods that could be argued to fall in one or another category where this categorisation may affect the HSR. In considering how products are categorised, we have considered how consumers are likely to compare products when they shop.
Five Year Review of the Health Star Rating System: Consultation Paper, October 2018 Page 15 of 77
7. Recognise the scope of the HSR System and avoid using the HSR System to address problems beyond its scope − The HSR System is not intended as a complete source of dietary advice. − The System is intended to complement other guidelines, tools and campaigns that support
consumers to make healthier dietary choices. Other levers (such as portion sizes) may be more appropriate to address some of the concerns highlighted by stakeholders.
8. Continue to incentivise food manufacturers to decrease risk-associated nutrients
− Changes should aim to drive achievable positive reformulation, particularly to reduce risk nutrients.
Key issues for examination
Issue Topic Specific issue Examples
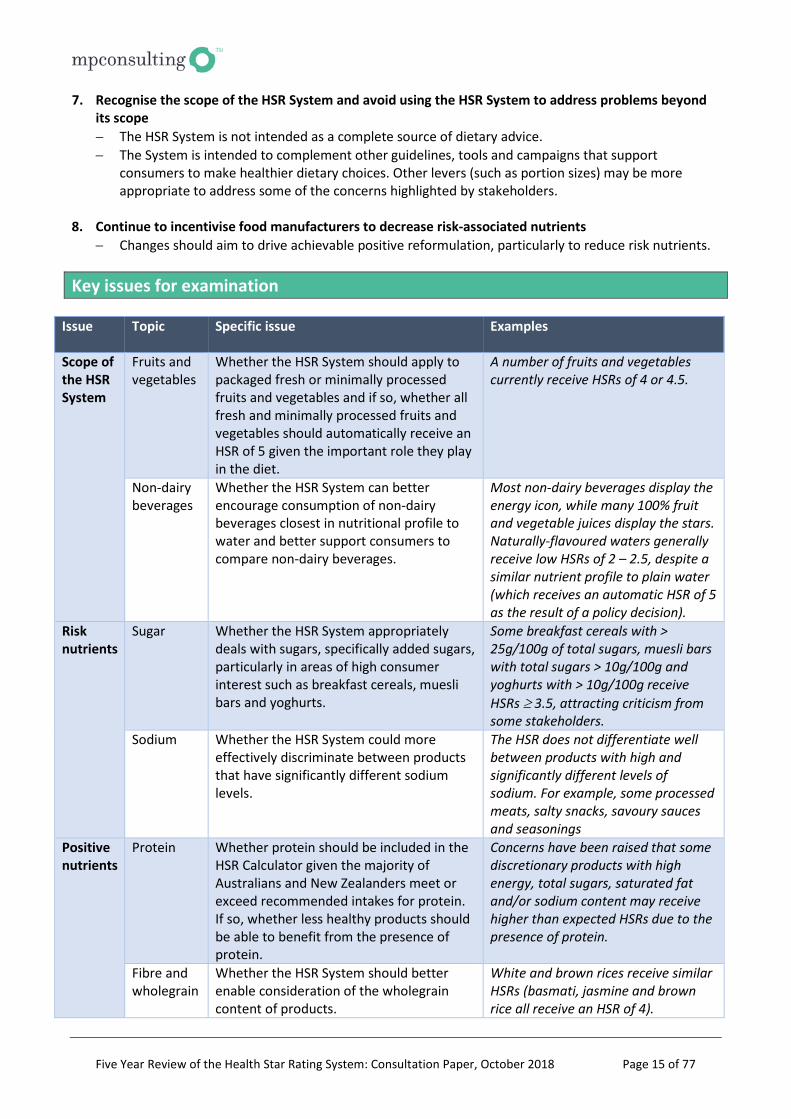
Scope of the HSR System
Fruits and vegetables
Whether the HSR System should apply to packaged fresh or minimally processed fruits and vegetables and if so, whether all fresh and minimally processed fruits and vegetables should automatically receive an HSR of 5 given the important role they play in the diet.
A number of fruits and vegetables currently receive HSRs of 4 or 4.5.
Non-dairy beverages
Whether the HSR System can better encourage consumption of non-dairy beverages closest in nutritional profile to water and better support consumers to compare non-dairy beverages.
Most non-dairy beverages display the energy icon, while many 100% fruit and vegetable juices display the stars. Naturally-flavoured waters generally receive low HSRs of 2 – 2.5, despite a similar nutrient profile to plain water (which receives an automatic HSR of 5 as the result of a policy decision).
Risk nutrients
Sugar Whether the HSR System appropriately deals with sugars, specifically added sugars, particularly in areas of high consumer interest such as breakfast cereals, muesli bars and yoghurts.
Some breakfast cereals with > 25g/100g of total sugars, muesli bars with total sugars > 10g/100g and yoghurts with > 10g/100g receive HSRs ≥ 3.5, attracting criticism from some stakeholders.
Sodium Whether the HSR System could more effectively discriminate between products that have significantly different sodium levels.
The HSR does not differentiate well between products with high and significantly different levels of sodium. For example, some processed meats, salty snacks, savoury sauces and seasonings
Positive nutrients
Protein Whether protein should be included in the HSR Calculator given the majority of Australians and New Zealanders meet or exceed recommended intakes for protein. If so, whether less healthy products should be able to benefit from the presence of protein.
Concerns have been raised that some discretionary products with high energy, total sugars, saturated fat and/or sodium content may receive higher than expected HSRs due to the presence of protein.
Fibre and wholegrain
Whether the HSR System should better enable consideration of the wholegrain content of products.
White and brown rices receive similar HSRs (basmati, jasmine and brown rice all receive an HSR of 4).
Five Year Review of the Health Star Rating System: Consultation Paper, October 2018 Page 16 of 77
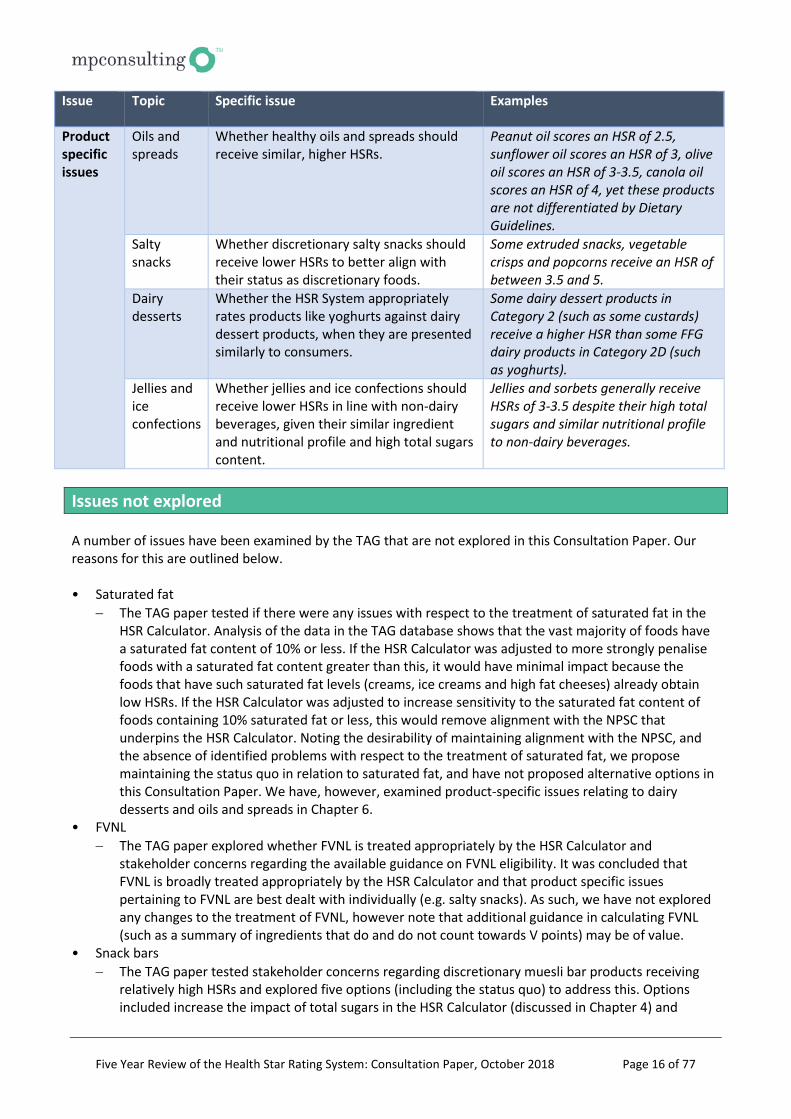
Issue Topic Specific issue Examples
Product specific issues
Oils and spreads
Whether healthy oils and spreads should receive similar, higher HSRs.
Peanut oil scores an HSR of 2.5, sunflower oil scores an HSR of 3, olive oil scores an HSR of 3-3.5, canola oil scores an HSR of 4, yet these products are not differentiated by Dietary Guidelines.
Salty snacks
Whether discretionary salty snacks should receive lower HSRs to better align with their status as discretionary foods.
Some extruded snacks, vegetable crisps and popcorns receive an HSR of between 3.5 and 5.
Dairy desserts
Whether the HSR System appropriately rates products like yoghurts against dairy dessert products, when they are presented similarly to consumers.
Some dairy dessert products in Category 2 (such as some custards) receive a higher HSR than some FFG dairy products in Category 2D (such as yoghurts).
Jellies and ice confections
Whether jellies and ice confections should receive lower HSRs in line with non-dairy beverages, given their similar ingredient and nutritional profile and high total sugars content.
Jellies and sorbets generally receive HSRs of 3-3.5 despite their high total sugars and similar nutritional profile to non-dairy beverages.
Issues not explored A number of issues have been examined by the TAG that are not explored in this Consultation Paper. Our reasons for this are outlined below. • Saturated fat
− The TAG paper tested if there were any issues with respect to the treatment of saturated fat in the HSR Calculator. Analysis of the data in the TAG database shows that the vast majority of foods have a saturated fat content of 10% or less. If the HSR Calculator was adjusted to more strongly penalise foods with a saturated fat content greater than this, it would have minimal impact because the foods that have such saturated fat levels (creams, ice creams and high fat cheeses) already obtain low HSRs. If the HSR Calculator was adjusted to increase sensitivity to the saturated fat content of foods containing 10% saturated fat or less, this would remove alignment with the NPSC that underpins the HSR Calculator. Noting the desirability of maintaining alignment with the NPSC, and the absence of identified problems with respect to the treatment of saturated fat, we propose maintaining the status quo in relation to saturated fat, and have not proposed alternative options in this Consultation Paper. We have, however, examined product-specific issues relating to dairy desserts and oils and spreads in Chapter 6.
• FVNL − The TAG paper explored whether FVNL is treated appropriately by the HSR Calculator and
stakeholder concerns regarding the available guidance on FVNL eligibility. It was concluded that FVNL is broadly treated appropriately by the HSR Calculator and that product specific issues pertaining to FVNL are best dealt with individually (e.g. salty snacks). As such, we have not explored any changes to the treatment of FVNL, however note that additional guidance in calculating FVNL (such as a summary of ingredients that do and do not count towards V points) may be of value.
• Snack bars − The TAG paper tested stakeholder concerns regarding discretionary muesli bar products receiving
relatively high HSRs and explored five options (including the status quo) to address this. Options included increase the impact of total sugars in the HSR Calculator (discussed in Chapter 4) and
Five Year Review of the Health Star Rating System: Consultation Paper, October 2018 Page 17 of 77
adding wholegrain to the HSR Calculator (discussed in Chapter 5). The TAG paper also explored two options that involve removing snack bars into a separate Category. These were not explored in this Consultation Paper as they would require significant changes to the HSR Calculator and adversely impact the logic of the HSR System. It is suggested that concerns regarding the relatively high HSRs of snack bars may be addressed through changes to the treatment of total sugars and protein in the HSR Calculator.
• Confectionery − The TAG paper considered a range of options regarding stakeholder concerns that confectionery
products display stars, which some consumers may misconstrue as a sign of health. TAG analysis indicates that the majority of confectionery products receive appropriately low HSRs of less than 3.5 (with most receiving HSRs between 0.5 and 1.5).
• Frozen milk products − While ice confection and jelly are discussed under product specific issues, frozen milk products are
not explored in this Consultation Paper. Some stakeholders have noted there is a lack of differentiation between frozen milk products. However, TAG analysis indicates these products are appropriately distributed based on saturated fat, total sugars and energy content. As such, this issue is not explored in this Consultation Paper, although it is expected that any changes to the treatment of sugars may impact on the HSRs of frozen milk products.
• Calcium − The TAG paper explored the potential to include calcium as an explicit component of the HSR
Calculator, however concluded that this would be redundant. Calcium is largely, though indirectly, accounted for by the inclusion of protein in the HSR Calculator and the separate dairy categories. As such, this issue is not explored in this Consultation Paper.
The TAG has developed technical papers for each of these issues, to which we direct stakeholders seeking further information.
‘As prepared’
In parallel to the Review, the HSRAC has reappraised the ‘as prepared’ rules. This issue was progressed in advance of the Review due to significant stakeholder interest. As such, options to address the ‘as prepared’ issue have not been explored in this Consultation Paper, but outcomes are outlined below. The Industry Guide includes provisions for products that must be prepared prior to consumption, known as the form of the food (or ‘as prepared’) rules. These rules only apply if the food is intended to be prepared according to instructions for use prior to consumption. In September-October 2017, the HSRAC consulted with stakeholders (through a public submission process and workshops) to discuss potential options and to seek feedback on the appropriateness of various solutions proposed. Four options were proposed to address the issue. These were explored and potential impacts were modelled by the TAG (available at the HSR website). The HSRAC sought additional stakeholder feedback on these options before agreeing on a preferred option for recommendation to the Australia and New Zealand Ministerial Forum on Food Regulation (the Forum) for implementation. The Forum agreed in June 2018 to limit the application of the HSR System to the product ‘as sold.’ That is, the HSR should be calculated and displayed on the basis of the product as it appears on the shelf. Specific exemptions will apply for products that must be rehydrated with water, diluted with water, drained of water or drained of brine. It is proposed that this decision is implemented alongside and in the context of the Review.22
22 Department of Health, 8 August 2018, Form of the Food (‘As Prepared’) Rules, viewed on 27 August 2018
Five Year Review of the Health Star Rating System: Consultation Paper, October 2018 Page 18 of 77
Chapter 3 – Scope of the HSR System
Overview This Chapter relates to the scope of the HSR System, and whether the HSR System should apply to certain product types. The HSR System has been optimised for application to packaged food products presented for retail sale through supermarkets and similar retail outlets. All products that carry a Nutrition Information Panel (NIP) are expected to display the HSR. Products exempt from NIP labelling include: • products with inherently low nutritional contribution such as herbs, spices, vinegar, salt, pepper, tea,
coffee, herbal infusions, gelatine and setting compounds • small packages less than 100mm2 • certain ‘fresh value-added products’, such as packaged fruit, vegetables, meat, poultry, fish,
pre-packaged rolls and sandwiches (i.e. short shelf-life products intended to be consumed shortly after purchase).
Products that should not display the HSR include: • certain special purpose foods in Part 2.9 of the Code (such as infant formula products, foods for infants,
and some formulated supplementary foods, or foods for special medical purposes) • alcoholic beverages, alcohol kits and kava • products listed in 1.2.7-5, Standard 1.2.7 of the Code, which include products intended for further
processing.
Monitoring indicates that the scope of the HSR System broadly aligns with consumer expectations. Products displaying the HSR broadly reflect those where consumers consider it important they display the HSR, (including breakfast cereals, ready-to-eat meals, snack bars, yoghurts, biscuits and cakes).23 In relation to the scope of the HSR System and the products to which it is expected to apply, two key issues have been identified: • whether the HSR System should apply to packaged fresh (or minimally processed) fruit and vegetables,
and if so whether such foods should all display an HSR of 5, noting the role that fruits and vegetables play in the diet
• how the HSR should apply to non-dairy beverages to best support consumers to compare products across the category, and select the healthiest options.
This Chapter examines each of these issues.
Fresh or minimally processed fruits and vegetables
Issue
The HSR System was not intended to apply to fresh fruits and vegetables, being aimed primarily at ‘processed, packaged foods’. However, since the HSR was implemented, fresh fruits and vegetables are increasingly being packaged and displaying the HSR. There are two issues for consideration:
23 National Heart Foundation, August 2017, Report on the monitoring of the implementation of the Health Star Rating system: Area of Enquiry 2 – Consumer awareness and ability to use the Health Star Rating system correctly, prepared for the Department of Health
Five Year Review of the Health Star Rating System: Consultation Paper, October 2018 Page 19 of 77
• whether the HSR System should apply to packaged fresh or minimally processed fruits and vegetables • if the HSR System applies to packaged fresh or minimally processed fruits and vegetables whether:
− the HSR for fresh fruit and vegetables should align with that of minimally processed fruits and vegetables such as frozen or canned vegetables with no additions other than water
− it is appropriate for different fruits and vegetables to receive different HSRs (predominantly based on fibre and sugar content) or whether, because of the important role that fruits and vegetables play in the diet, they should all receive an HSR of 5.
Decisions in relation to fresh (or minimally processed) fruits and vegetables also have implications for the treatment of fruit juices. For example, some stakeholders have expressed concern that fruit juices can obtain HSRs higher than their parent fruits because of the different way that HSRs are assigned for non-dairy beverages compared to general foods (see Appendix 1). This is discussed in more detail later in this Chapter. The TAG modelled three options to address this issue, two of which are explored below. TAG option 2 considered removing fruits from Category 2 into a separate category. This option was not explored in this Consultation Paper as it would require significant changes and to the HSR Calculator and adversely impacts the logic of the HSR System by removing one component from the HSR Calculator for one specific product category.
Considerations
Current treatment in the HSR System
• Fruits and vegetables are currently within Category 2. • The Style Guide notes that the Food Standards Code exempts certain products such as
packaged fruit and vegetables from NIP labelling. While the HSR may be used in relation to such foods, there is no expectation that such packages would carry HSR labelling unless the products are of standardised composition and label space permits.
• HSRAC have noted that ‘Although it may be applied, the System is not intended for unprocessed or minimally processed fruits and vegetables’24.
• Fruit, vegetable, nut and legume (FVNL), fibre and total sugars are the operative components for fruits and vegetables (i.e. most strongly influence the HSR).
Dietary Guidelines
• Dietary Guidelines recommend the regular (every day) consumption of plenty of fruits and vegetables. This can include fruits and vegetables with minimal processing.
• Fruits and vegetables provide many beneficial nutrients such as vitamins, minerals, antioxidants and dietary fibre. They protect against conditions like heart disease, stroke and some cancers.
• The ADG recommend: – ‘plenty of vegetables of different types and colours’ – a minimum of five servings of vegetables and two servings of fruit per day – that different vegetables can help protect the body in different ways, so it’s
important to choose a variety of colours and types. • The NZEAG recommend:
– ‘plenty of vegetables and fruit’ – a minimum of three servings of vegetables and two servings of fruit per day – ‘seasonal fresh vegetables and fruit are great choices, but frozen and low-salt or
low-sugar canned options are also good’ – ‘include vegetables and/or fruit at each meal time and as snacks’.
Intake • Research highlights that Australians and New Zealanders are not meeting their 24 HSRAC anomalies table, 11 March 2016
Five Year Review of the Health Star Rating System: Consultation Paper, October 2018 Page 20 of 77
Current treatment in the HSR System
• Fruits and vegetables are currently within Category 2. • The Style Guide notes that the Food Standards Code exempts certain products such as
packaged fruit and vegetables from NIP labelling. While the HSR may be used in relation to such foods, there is no expectation that such packages would carry HSR labelling unless the products are of standardised composition and label space permits.
• HSRAC have noted that ‘Although it may be applied, the System is not intended for unprocessed or minimally processed fruits and vegetables’24.
• Fruit, vegetable, nut and legume (FVNL), fibre and total sugars are the operative components for fruits and vegetables (i.e. most strongly influence the HSR).
recommended fruit and vegetable intake. – In 2014-15, 49.8% of Australian adults met the recommended daily serves of fruit,
7% met recommendations for vegetables and only 5.1% met both recommendations.25
– In 2011-12, 48.3% of Australian adults met the recommended daily serves of fruit, 8.3% met recommendations for vegetables and only 5.6% met both recommendations.
– In 2008-09, 66% of the New Zealand population over the age of 15 met the recommended daily serves of fruit and 60.4% met recommendations for vegetables.
HSR statistics
• Most fresh fruits receive an average HSR of 4.5, with some receiving an HSR of 4 or 5 and vegetables receive an average HSR of 5.
• For example: – Pineapple, lychees and avocados receive an HSR of 4. – Rockmelon, apples, blueberries, bananas, lemons, oranges, strawberries, grapes,
mango and kiwifruit receive an HSR of 4.5. – Lettuce, carrot, cucumber, eggplant, potato, pumpkin, corn, tomatoes, zucchini and
capsicum receive an HSR of 4.5. – Some fruits and most other vegetables receive an HSR of 5.
Relevant TAG papers
• Unprocessed fruits and unprocessed vegetables.
Options to address issue
A. Status quo for fruits and vegetables
Under this option, the policy position would continue to be that, although the HSR may be applied, the HSR System is not intended for unprocessed or minimally processed fruits and vegetables. Where such fruits and vegetables are packaged and the manufacturer chooses to display the HSR, they would use the HSR Calculator to determine the HSR such that, depending on the fruit or vegetable, the HSR may range from 4 to 5. The advantages of this include: • the HSR System would continue to attribute high HSRs to fruits and vegetables • the System would continue to treat fruits and vegetables consistently with other foods within the scope
of the System • the HSR would be based on the nutritional profile of the particular fruit or vegetable, allowing for some
differentiation between fruits and vegetables. This broadly aligns with Dietary Guideline recommendations to eat more vegetables than fruit.
25 Australian Bureau of Statistics, 4364.0.55.001 - National Health Survey: First Results, 2014-15
Five Year Review of the Health Star Rating System: Consultation Paper, October 2018 Page 21 of 77
The disadvantages of this include: • broader healthy eating messages encourage people to consume plenty of fruits and vegetables, without
distinguishing between the different types • some fruit and vegetable juices currently score higher than their whole equivalent, which is inconsistent
with Dietary Guidelines • there is a lack of clarity regarding which packaged fruits and vegetables are eligible to carry the HSR.
While the Style Guide notes that the HSR is not expected on products that do not carry the NIP (and the HSRAC has since advised that ‘the System is not intended for unprocessed or minimally processed fruits and vegetables’), the appearance of HSR on some packaged products (such as frozen vegetables) but not on their packaged, fresh counterparts may appear inconsistent for consumers.
B. All fresh and minimally processed fruits and vegetables automatically receive an HSR of 5
Under this option, packaged fruits and vegetables carrying a NIP would be eligible to display the HSR, regardless of whether the product is fresh, frozen or canned. All packaged fresh or minimally processed fruits and vegetables would automatically receive an HSR of 5. Noting there is currently no definition of ‘minimally processed’ in the Dietary Guidelines, this is proposed to include all packaged fruit and vegetable products that have been frozen, cut, washed, canned, peeled and/or blanched to increase their functionality without significantly altering their nutrient content or other properties (through for example juicing, dehydration, addition of other ingredients) and/or preparations and interventions. This definition may also allow for the addition of additives that do not influence the nutritional profile of the fruit or vegetable. Products receiving an automatic HSR of 5 may include: salad mixes with no added dressing, croutons or other foods; frozen peas and berries; apples covered in a glazing agent such as beeswax to improve appearance; and canned water chestnuts with water and acidity regulator to improve shelf-life stability (citric acid). The advantages of this option include: • improved consistency with Dietary Guidelines in promoting the consumption of a variety of fruits and
vegetables • clarity regarding those fruits and vegetables eligible to carry the HSR (fruits and vegetables in
standardised packaging carrying the NIP) • that fruit and vegetable juices would not score higher than their whole equivalents (this is discussed in
more detail under non-dairy beverages) • Australians and New Zealanders are not meeting the recommended intake of fruit or vegetables, so
encouraging their consumption is important. The key disadvantage of this option is that it lessens consumers’ ability to differentiate between fruits and vegetables based on small nutritional differences. This impact is not, however, expected to be great as: • relatively few fruits and vegetables receive an HSR below 5 • most consumers do not differentiate between the relative nutritional value of fruits (for example,
comparing a pineapple to a rockmelon) • the Dietary Guidelines do not distinguish between different types of fruits and vegetables, instead
encouraging consumption of a wide range of these foods.
Summary and consultation
Five Year Review of the Health Star Rating System: Consultation Paper, October 2018 Page 22 of 77
On the basis of our examination of the issues to date, the preferred option is currently Option B. Given the significant proportion of Australians and New Zealanders not meeting the recommended intake of fruits and vegetables, this change would encourage their consumption and ensure that no other food or beverage (e.g. fruit juices) score higher than fruits and vegetables. We note that further work would be required to define ‘minimally processed’ in relation to fruits and vegetables. We seek stakeholder views regarding the above options, their impacts and relevant further considerations.
Non-dairy beverages
Issues
For all of the products within the scope of the HSR System, the Style Guide describes a hierarchy of options for the elements to be displayed in the HSR System graphic: 1. Health Star Rating + energy icon + 3 prescribed nutrient icons + 1 optional nutrient icon. 2. Health Star Rating + energy icon + 3 prescribed nutrient icons. 3. Health Star Rating + energy icon. 4. Health Star Rating (e.g. when pack size does not accommodate more complete versions). 5. Energy icon (e.g. for small pack sizes and some confectionery and beverage products). While the Style Guide encourages use of as many elements of the HSR System graphic as possible, any of the options may be used on any product. The Style Guide describes small pack sizes, confectionery and beverage products as examples where the energy icon may be used. As the result of a policy decision, packaged plain water automatically receives an HSR of 5. For all other non-dairy beverages, the HSR is awarded based on the combination of nutrients. • For non-dairy beverages with FVNL content > 40%, this is the operative component of the HSR Calculator
(i.e. most strongly influences the HSR), which is why they generally receive an HSR of 4-5. • For other non-dairy beverages with FVNL content ≤ 40%, the operative components of the HSR
Calculator are energy and total sugars, which is why they generally receive low HSRs (for example, unsweetened flavoured water receives an HSR of 2).
Within the non-dairy beverage category, both the energy icon and stars are used (with the energy icon generally used for low scoring products and the stars used for high scoring products). This makes it difficult for consumers to compare a 100% juice with an unsweetened flavoured water (a lower energy option). A study published in August 2018 found that of the 762 non-dairy beverages sampled, 6.8% displayed the stars while 28.5% displayed the energy icon. For beverages displaying the stars, 94.2% displayed an HSR of 5 and, of these, 85.7% were 100% fruit and vegetable juices.26 Given the significant contribution of non-dairy beverages to total sugars in Australian and New Zealander diets, it is important that the HSR promotes healthier products that are lower in total sugars. However, in Australia the energy icon is not well understood by consumers, with monitoring data indicating the energy icon is the least preferred HSR logo (with 1% of respondents preferring it). Only 2% find it the easiest graphic to understand, 4% find it the easiest graphic to recognise and 4% find it provides sufficient information.27
26 Brownbill, A, Miller, C, Braunack-Myer, A, 29 August 2018, Health Star Ratings: What’s on the labels of Australian beverages? Health Promotion Journal of Australia 27 National Heart Foundation, April 2018, Report on the monitoring of the implementation of the Health Star Rating system: Area of Enquiry 2 – Consumer awareness and ability to use the Health Star Rating system correctly, prepared for the Department of Health
Five Year Review of the Health Star Rating System: Consultation Paper, October 2018 Page 23 of 77
A further concern of stakeholders is that some 100% fruit and vegetable juices receive HSRs that exceed their whole fruit equivalent (due to the scaling and weighting of components within different HSR categories). We note that if a policy decision is made that fresh and minimally processed fruits and vegetables automatically receive an HSR of 5 (as discussed above), then no 100% juices will score more than their whole equivalent, which may address this concern. Non-dairy beverages are intrinsically difficult to profile nutritionally, as many have minimal nutritional value and the HSR Calculator depends on a balance of positive and negative components in order to score a product. International FoPL systems (such as the French Nutri-Score) have also encountered challenges determining appropriate labelling for non-dairy beverages, including how to reflect the relative nutritional values of non-dairy beverage products. From a policy perspective, the HSR System should encourage consumers to drink water. If consumers are selecting drinks other than water, the System should encourage selection of those closest in nutritional profile to water, with the same hydrating qualities and no or low calories (e.g. unsweetened flavoured waters). More contentious is the extent to which the HSR should direct people to 100% juices, with different recommendations in the Australian and New Zealand Dietary Guidelines. Noting the above, the key issues for the Review are: • whether all non-dairy beverages should display the energy icon, whether they should display the stars
(to better enable consumers to compare products across the category), or whether there should continue to be flexibility to apply either the energy icon or the stars
• the appropriateness of relative HSRs of non-dairy beverages when compared across the category, noting that unsweetened flavoured waters: − score lower than 100% fruit juices, despite juices being higher in energy − score the same as diet drinks despite generally being perceived as a healthier alternative (despite
the total sugar and energy being similar).
Considerations
Current treatment in the HSR System
• As the result of a policy decision to encourage consumption of water, packaged plain water with no additives (as regulated in the Code Standard 2.6.2) receives an automatic HSR of 5.
• Beverage categories: – Category 1 includes non-dairy beverages (e.g. flavoured waters, fruit and vegetable
juices and drinks, cordials, soft drinks, energy drinks, coconut waters) – Category 1D includes dairy beverages (with calcium content > 80mg/100mL)
• For Category 1: – energy and sugars are the operative nutrients (for non-dairy beverages other than
100% juices) – products with FVNL content > 40% or concentrated fruit and vegetable content >
25% can claim modifying V points (up to a maximum of 8).
Dietary Guidelines
• Dietary Guidelines recommend water as the healthiest beverage. • ADG note that whole fruit is preferable to fruit juice, however the occasional 125mL
serve of fruit juice may assist with nutrient intake when fresh, frozen or canned supply of fruit is sub-optimal. Fruit juice is energy dense and, if consumed in excess, it can displace other nutritious foods from the diet and lead to health concerns such as obesity.
• NZEAG recommend eating fresh fruit and drinking plain water rather than drinking fruit
Five Year Review of the Health Star Rating System: Consultation Paper, October 2018 Page 24 of 77
Current treatment in the HSR System
• As the result of a policy decision to encourage consumption of water, packaged plain water with no additives (as regulated in the Code Standard 2.6.2) receives an automatic HSR of 5.
• Beverage categories: – Category 1 includes non-dairy beverages (e.g. flavoured waters, fruit and vegetable
juices and drinks, cordials, soft drinks, energy drinks, coconut waters) – Category 1D includes dairy beverages (with calcium content > 80mg/100mL)
• For Category 1: – energy and sugars are the operative nutrients (for non-dairy beverages other than
100% juices) – products with FVNL content > 40% or concentrated fruit and vegetable content >
25% can claim modifying V points (up to a maximum of 8).
juice.
Intake • Research highlights that non-dairy beverages are a major source of total sugars and the leading source of free sugars in Australian and New Zealand diets. – 26.9% of total sugars in Australian diets comes from non-dairy beverages (AHS). – 52% of free sugars in Australian diets comes from non-dairy beverages, with the
leading beverages being soft drinks, electrolyte and energy drinks (19%), fruit and vegetable juices and drinks (13%) and cordial (4.9%) (AHS).
– 16.7% of total sugars in New Zealand diets comes from non-dairy beverages (NZANS).
HSR statistics
• Based on monitoring of the HSR System, as at 31 March 2018, 562 non-dairy beverages were displaying the HSR28. – 99% of 100% fruit and vegetable juices and drinks that use the HSR display the stars. – 84% of those displaying stars have an HSR of 5. – 82% of soft drinks that use the HSR display the energy icon.
• Based on TAG modelling: – 100% fruit and vegetable juices would generally receive an HSR of between 4 and 5. – Most sugar-sweetened beverages would receive an HSR of between 0.5 and 1.5.
• Data from the George Institute’s FoodSwitch database29 supports this: – For 100% fruit and vegetable juices, the mean HSR is 4.6. 30.6% of these products
display the stars and only 2% display the energy icon. – For sports drinks, soft drinks, diet soft drinks, fruit drinks, cordials and flavoured
waters the mean HSRs range between 1.3 and 2. Only 5.5% of all these products display stars, while 27.3% display the energy icon.
Relevant TAG papers
• Non-dairy beverages • Unprocessed fruits and vegetables • Fruit, Vegetables, Nut and Legume (FVNL) content
Options to address issue
A. Status quo for non-dairy beverages
This option would result in no change to the HSRs of non-dairy beverages, and allow them to continue to display either the energy icon or the stars. HSRs for unsweetened flavoured waters would continue to be
28 National Heart Foundation, April 2018, Report on the monitoring of the implementation of the Health Star Rating system: Area of Enquiry 2 – Consumer awareness and ability to use the Health Star Rating system correctly, prepared for the Department of Health 29 The George Institute for Global Health, 11 September 2018, Uptake of the HSR System
Five Year Review of the Health Star Rating System: Consultation Paper, October 2018 Page 25 of 77
low, despite their low total sugars and energy content. The likely impact of this option is that the majority of 100% fruit and vegetable juices will continue to display the stars, and the majority of other non-dairy beverages will continue to display the energy icon. The advantages of this option include: • the energy content is the main issue of relevance for consumers drinking non-dairy beverages so
widespread use of the energy icon may support consumers in decision making • the ADG note that fruit juices can occasionally count as a serve of fruit so a high HSR on 100% juices may
be appropriate (although the NZEAG recommend limiting intake of fruit juices) • it provides flexibility for industry within a category where:
− the HSR System is currently less effective at rating products relative to each other − there is debate regarding the dietary value of some beverages (e.g. juices) − package sizes vary considerably − there are a number of other initiatives in play including reformulation targets and industry-driven
sugar reduction pledges to reduce sugar across all categories of non-alcoholic drinks by 20 per cent by 2025.
The disadvantages of this option include: • the status quo does not enable consumers to readily compare different non-dairy beverages because the
energy icon is not meaningful to consumers30, and within this category, the energy icon and stars are used differentially, depending on the HSR of the product. However, understanding of the energy icon could be improved with consumer awareness initiatives supported by the non-alcoholic beverages industry
• it does not address stakeholder concerns regarding the appropriateness of relative HSRs of non-dairy beverages when compared across the category (particularly juices compared to unsweetened flavoured waters)
• it option does not promote drinks that are similar in nutritional profile to water and contain no or low calories.
B. Non-dairy beverages (other than water) may only display the energy icon
The key advantages of this option are: • consumers could compare across the category because all non-dairy beverages would be using the same
HSR System graphic (the energy icon) • energy and sugars are the operative components for most non-dairy beverages (other than 100% juices),
so differentiation based on energy may support consumers to choose healthier options • the energy icon is appropriate for all label sizes • it clearly positions water as the healthiest beverage option, and enables consumers to compare other
options based on their energy content.
The disadvantages of this option are: • based on energy, 100% fruit and vegetable juices would perform relatively poorly compared to some
other non-dairy beverages. This may be undesirable, as the ADG note that a serve of fruit may occasionally be supplemented with 125mL of 100% juice
30 National Heart Foundation, April 2018, Report on the monitoring of the implementation of the Health Star Rating system: Area of Enquiry 2 – Consumer awareness and ability to use the Health Star Rating system correctly, prepared for the Department of Health
Five Year Review of the Health Star Rating System: Consultation Paper, October 2018 Page 26 of 77
• monitoring data shows that Australian consumers do not find the energy icon easy to understand and use. Given the significant contribution of non-dairy beverages to Australian and New Zealand intake of total sugars, meaningful labelling is important.
C. Non-dairy beverages may only display the stars
The main advantage of this option is that consumers will more readily be able to compare beverage options. The main disadvantages of this are: • it would reduce the HSR System graphic options available to non-dairy beverage manufacturers
compared to other food manufacturers • industry may choose not to display the HSR on non-dairy beverages, particularly on those that score a
low HSR and/or have a small package size. This would reduce the FoPL information available to consumers (noting the reasonably high uptake of the energy icon on non-dairy beverages)
• it would highlight, to an even greater extent, some of the inherent challenges in attributing stars to non-dairy beverages (i.e. the relative positioning of non-dairy beverages does not always appropriately represent their relative nutritional value).
A variation on this option, is for Category 1 products to display the stars based solely on energy content. This would involve setting threshold ranges for each star increment (for example, that products with between 0 to 20kJ/100mL receive 4.5 stars, products with 21 to 50 kJ/100mL receive 4 stars, etc.). D. Non-dairy beverages are ineligible to score modifying points for FVNL content
The main advantages of this option are: • fruit and vegetable juices would score a lower HSR, differentiating them from water and other low sugar
alternatives • fruit and vegetable juices would not score the same or higher than their whole fruit or vegetable
alternative. The main disadvantages of this option are: • fruit and vegetable juices may receive equal or lower scores to some sugar sweetened beverages,
despite having greater nutritional value • it adversely impacts the logic of the HSR System by removing one component from the HSR Calculator
for one specific product category • it reduces consistency with the NPSC, which allows beverages to score modifying points for fruit and
vegetable content. If this option were preferred, it could be implemented together with Option C (stars only) above. E. Plain packaged water is the only non-dairy beverage to score an HSR of 5, combinations of juice and
water with no other additives score an HSR of 4.5 and all other non-dairy beverages calculate their HSR using the HSR Calculator
In addition to the existing policy decision (that packaged plain water receives an automatic HSR of 5), under this option further policy decisions would be made such that: • water (still or carbonated) with no additives would automatically receive an HSR of 5
Five Year Review of the Health Star Rating System: Consultation Paper, October 2018 Page 27 of 77
• water (still or carbonated) in any combination with fruit and vegetable juices (including food additives described in Schedule 14 of the Code) and with no added sugar or other additives would automatically receive an HSR of 4.5
• all 100% fruit and vegetable juices would also automatically receive an HSR of 4.5 • all other non-dairy beverages must calculate their HSR based on the HSR Calculator. The main advantages of this option are: • it clearly positions water with no additions as the healthiest option • it promotes consumption of still and carbonated flavoured water products (with no added sugars) that
are close in nutritional profile to water (4.5 stars) • it acknowledges the nutritional value of fruit and vegetable juices, including where diluted with water so
as to reduce their energy and/or total sugars content • discretionary beverages such as sports drinks, energy drinks, fruit drinks, sweetened carbonated soft
drinks and cordials, and waters sweetened with sugar will necessarily score a lower HSR than the healthier options of water, juices and combinations of water and juice (with no other additions).
The main disadvantages of this option are: • it introduces additional policy considerations and adds complexity to the system • it reduces consistency with the NPSC, and removes the ability to differentiate between fruit and
vegetable juices in any combination with water. If this option were preferred, it could be implemented together with Option C (stars only) above.
Summary and consultation
There are two key issues relating to beverages: how to ensure the appropriate rating of non-dairy beverages relative to each other; and how to ensure consumers are best supported to make choices through FoPL. At this time, we are not presenting a preferred option (or combination of options) noting the disadvantages of the options detailed. We seek stakeholder views regarding the value of the HSR System in relation to non-dairy beverages, the impacts of the above options, and any other possible options for addressing the identified issues.
Five Year Review of the Health Star Rating System: Consultation Paper, October 2018 Page 28 of 77
Chapter 4 – Risk nutrients
Overview The HSR Calculator considers multiple components of a product to provide an overall rating of a product’s healthiness within a category based on its nutritional composition. The HSR Calculator considers energy, the negative components the Dietary Guidelines recommend limiting (saturated fat, total sugars and sodium) and the foods Dietary Guidelines recommend eating more of (fruits, vegetables, nuts and legumes (FVNL) and in some instances, dietary fibre and protein). In the HSR Calculator, risk-associated components (energy, saturated fat, total sugars and sodium) receive negative baseline points, while positive components (FVNL, dietary fibre and protein) receive positive modifying points. The final HSR presents a rating of the product compared to other similar products based on the relative quantities of each of these components. The main issue raised by stakeholders in relation to the risk-associated components of the HSR System relates to sugars, with a specific concern being that some products with relatively high levels of added sugars receive inappropriately high HSRs. While not specifically raised by many stakeholders, analysis undertaken by the TAG and others of the alignment of the HSR System with the Dietary Guidelines also highlighted that the HSR Calculator does not appear to effectively discriminate between products that have significantly different sodium levels.31 32 This Chapter examines these two issues in detail.
Sugars
Issue
While there is no universally agreed definition for ‘added sugars’, in Australia sugars are generally understood as follows: • ‘Intrinsic sugars’ are those naturally present in the structure of products such as intact fruits, vegetables
and milk. • ‘Added sugars’ refers to dextrose, fructose, sucrose, lactose, sugar syrups and fruit juices added to
products. • ‘Free sugars’ include all added sugars plus the sugars from honey, fruit and vegetable concentrates and
juices. ‘Total sugars’ include all of the above. Foods can contain a combination of added and naturally occurring sugars however, foods high in added sugars may displace more nutritious foods in the diet. To prevent adverse health outcomes, Dietary Guidelines recommend limiting consumption of foods and beverages containing added sugars. Added sugars and free sugars are chemically the same as intrinsic sugars, which makes it difficult to distinguish between added and naturally occurring sugars using analytical methods. There is no standard method for analysing the added sugars content of foods and beverages, and no requirement to include
31 Jones, A, Radholm, K and Neal, B ‘Defining ‘Unhealthy’: a systematic analysis of alignment between the Australian Dietary Guidelines and the Health Star Rating System’, Nutrients 2018, 10, 501 32 Dunford, E, Cobcroft, M, Thomas, M, & Wu, J.H. (2015) Technical Report: Alignment of NSW Healthy Food Provision Policy with the Health Star Rating System, Sydney, NSW: NSW Ministry of Health
Five Year Review of the Health Star Rating System: Consultation Paper, October 2018 Page 29 of 77
added sugars in the NIP (noting there is work underway to explore options for labelling of sugars on packaged foods and drinks for sale in Australia and New Zealand).33 The most significant area of stakeholder concern with respect to the HSR Calculator relates to the treatment of sugars, with concerns raised around the perceived inappropriately high HSRs of some products with relatively high levels of added sugars. Stakeholders referred to: • certain breakfast cereals with ‘high’ levels of added sugars obtaining an HSR of 3.5 or more • the HSR System failing to adequately distinguish between added sugars and intrinsic sugars (noting that
Dietary Guidelines recommend limiting intake of added sugars) • the World Health Organization (WHO) Guidelines that strongly recommend reduced intake of free sugars
throughout the life course34. The extent to which there is a ‘problem’ with the treatment of sugars in the HSR Calculator is contested, with different stakeholders having different views about the appropriateness of the HSRs of different types of foods. From our perspective, it is not possible to scientifically establish the parameters of the ‘sugars problem’. However, we consider it is desirable to: • better align the HSR System with Dietary Guidelines (including to better discern FFG and discretionary
foods) wherever possible • address some of the consumer perceptions around the HSR Calculator’s treatment of sugars (where
these risk undermining confidence in the HSR System) • further encourage reformulation of foods to reduce added sugars. To this end, a range of options have been considered including: • replacing total sugars with added sugars in the HSR Calculator • harsher penalisation of total sugars in the HSR Calculator (across some or all HSR categories) • creating ‘caps’ within categories such that certain products with total sugars above a threshold could not
score an HSR > 3, or • where a product’s total sugars exceed a threshold, it may not score any modifying points. To inform the discussion, modelling was sought from the TAG regarding these different options. In considering these options, we sought to identify whether they improve alignment of the HSR System with Dietary Guidelines to better discern FFG and discretionary foods, and whether they might address the product types of concern to consumers, such as breakfast cereals and ready to eat foods such as muesli bars and sweetened yoghurts.
Considerations
33 Food Regulation Secretariat, Joint Food Regulation System, 11 July 2018, Consultation Regulation Impact Statement: Labelling of sugars on packaged foods and drinks, Department of Health 34 World Health Organisation, 2015, Guideline: Sugars intake for adults and children, Geneva
Five Year Review of the Health Star Rating System: Consultation Paper, October 2018 Page 30 of 77
Current treatment in the HSR System
• Total sugars are a risk nutrient in the HSR Calculator. • For Categories 1, 1D, 2 and 2D:
– A product with > 5g total sugars per 100g scores baseline points (starting from 1). – A product with > 99g total sugars per 100g scores a maximum of 22 baseline points.
• For Categories 3 and 3D: – A product with > 5g total sugars per 100g scores baseline points (starting from 1). – A product with > 45g total sugars per 100g scores a maximum of 10 baseline points.
Dietary Guidelines
• Dietary Guidelines recommend limiting intake of added sugars. • WHO Guidelines recommend reducing free sugars intake to less than 10% of total daily
energy intake.
AHS List • Noting the challenges inherent in the AHS classifications (discussed in Chapter 2), the AHS Discretionary Foods List categorises: – breakfast cereals with no added fruit with total sugars ≤ 30% as FFG – breakfast cereals with added fruit with total sugars ≤ 35% as FFG – flavoured, sugar-sweetened yoghurts and milks as FFG (regardless of the total sugars
content).
Intake • Over half of Australians and New Zealanders exceed WHO recommendations on sugars intake (AHS).
• The majority (81%) of free sugars in Australia are consumed from discretionary foods and beverages (AHS).
• The largest proportion of free sugars intake in Australia comes from beverages (52%), followed by cake-like desserts (8.7%), sugar products and dishes (7.6%), chocolate and chocolate-based confectionery (5%), sweet biscuits (4%), frozen milk products (4%), breakfast cereals (3%), other confectionery (2.7%), flavoured milk (2.3%) and yoghurts (1.8%) (AHS).
HSR statistics
• The Dietary Guidelines do not provide a definition for ‘high’ sugars. However, the UK Traffic Light System defines high total sugars as > 22.5g/100g (22.5%)35.
• In the TAG database: – 51 breakfast cereals with more than 22.5% sugars have an HSR of ≥ 3.5. – 53 muesli or cereal style bars with more than 10% sugars have an HSR of ≥ 3.5 – 65 yoghurts with more than 10% sugars have an HSR of ≥ 3.5.
• George Institute data shows: – 50 breakfast cereals with more than 22.5% sugars have an HSR of ≥ 3.5. – 71 muesli or cereal style bars with more than 10% sugars have an HSR of ≥ 3.5 – 38 yoghurts with more than 10% sugars have an HSR of ≥ 3.5.
Relevant TAG papers
• Sugars (added and total) in the HSR System
Options to address issue
A. Status quo for sugars
35 Department of Health and Food Standards Agency, Guide to creating a front of pack (FoP) nutrition label for pre-packaged products sold through retails outlets, November 2016
Five Year Review of the Health Star Rating System: Consultation Paper, October 2018 Page 31 of 77
This option would result in no changes to the treatment of sugars in the HSR Calculator. The HSR Calculator would continue to calculate total sugars and indirectly address added sugars by awarding baseline points for total sugars and modifying points for % FVNL (to offset sugar in fruit) or protein (to offset lactose in milk).36 The main advantage of this option is that research indicates the HSR System generally distinguishes well between FFG and discretionary foods, with total sugars having the greatest individual capacity to discriminate between FFG and discretionary products37. The main disadvantage of this option is that it does not address stakeholder concerns regarding products high in total sugars receiving a high HSR, particularly for products such as breakfast cereals, ‘lunch box’ foods such as muesli bars, and sweetened yoghurts. Nor does it take the opportunity to further encourage reformulation. It could also be argued that there are a range of initiatives outside of the HSR System that may impact on the high population level intakes of added sugars, including the following Government-led initiatives: • Government activities are wide-ranging, but many aim to reduce consumption of sugar-sweetened
beverages. Examples include restricting high sugar foods and beverages in school canteens and health care settings, plus health promotion messages through social marketing.
• The Healthy Food Partnership is a joint initiative between government, industry and public health groups focusing on increasing health knowledge, healthier choices and better health outcomes for the Australian population.
• As part of the New Zealand Government’s Childhood Obesity Plan the Healthy kids industry pledge involves partnerships with the food and beverage industry to make commitments that will make a contribution to reducing the incidence of childhood obesity.
• The Healthy Bodies Need Healthy Drinks resources promote healthy drink choices and discourage excessive consumption of sugar-sweetened drinks among Aboriginal and Torres Strait Islander children.
State and Territory Governments and industry bodies are also undertaking a range of initiatives relating to sugars, including: • New Zealand Food and Grocery Council Healthier New Zealanders Initiative aims to promote health and
wellness across the New Zealand population through product labelling, consumer education and marketing initiatives. Many of the programs under this initiative are part of broader work in non-communicable disease prevention.
• The Sugar Research Advisory Service is funded by the Australian Sugar Industry Alliance and New Zealand Sugar, and is managed by health professionals including dietitians from Australia and New Zealand. It aims to provide an evidence-based view on the role of carbohydrates, and particularly sugars, in nutrition and health by disseminating scientific research to health care professionals.
• Rethink sugary drink is a partnership between 13 public health organisations aimed at promoting reduced intake of sugar-sweetened beverages, and calling for activities in a range of areas such as investigating the possibility of a tax on sugar-sweetened beverages, social media campaigns to raise awareness of the health impacts of consumption of sugar-sweetened beverages and reducing children’s exposure to their marketing.
However, stakeholders have suggested that there are limited interventions targeting sugars in New Zealand. B. Replace total sugars with added sugars
36 TAG technical paper, October 2018, History and development of the HSR algorithm, p.13 37 Peters, S, Dunford, E, Jones, A, Ni Mhurchi, C, Crino, M, Taylor, F, Woodward, M & Neal, B ‘Incorporating added sugar improves the performance of the Health Star Rating front-of-pack labelling system in Australia’, Nutrients, 2017, 9, 701, p.1-12
Five Year Review of the Health Star Rating System: Consultation Paper, October 2018 Page 32 of 77
Under this option, the HSR Calculator would consider added sugars rather than total sugars (and would also require changes to the sugars table38). A number of stakeholders supported this approach, with some citing a study published in July 201739 that found the HSR System currently discriminates well between FFG and discretionary foods but may be improved by incorporating added sugars as well as total sugars in the HSR Calculator. The UK Ofcom Nutrient Profiling Model (NPM) - on which the NPSC and the HSR System are based - is currently undergoing review, exploring the inclusion of added sugars rather than total sugars.40 TAG modelling explored the option of replacing total sugars with added sugars, with modelling suggesting that: • substituting total sugars with added sugars results in a mean increase in HSRs across most product
categories because added sugars content is lower than total sugars content and therefore, fewer negative points are scored. It does not have the desired impact on those products of concern, generally resulting in increases to the HSRs for breakfast cereals, muesli bars and yoghurts
• while this option (with rescaling of the sugars table) may decrease the HSRs for some discretionary products and increase the HSRs for some FFG products high in intrinsic sugars (such as fruits and dairy), it still would not have the desired impact on the products of concern.
This outcome is also broadly consistent with a study published in December 201741, which found that when added sugars were used in place of total sugars in the HSR Calculator, the number of discretionary products that received an HSR of ≥ 3.5 increased by 7.6%. The study found that while using added sugars resulted in some improved alignment with Dietary Guidelines, there was no significant difference in the median HSR of breakfast cereals. This study also found that, even when the HSR is calculated with added sugars, fresh fruit and vegetables do not receive an HSR of 5; in fact, the HSR for these products is not elevated at all. Further disadvantages of this option include: • it would diminish alignment with the NPSC (which uses total sugars) • it would represent a significant change and a potential barrier to uptake for industry (in terms of
quantifying added sugars rather than total sugars). There is currently no analytical method for measuring only the added sugars of a product, as this is indistinguishable when conducting a nutrient analysis. However, some stakeholders have noted that added sugars content may be estimated from ingredients lists and that both the United States and the UK are exploring methods to quantify added sugars
• in Australia and New Zealand there is currently no agreed definition of added sugar, and it is not a requirement to display added sugars content in the NIP. While this presents an additional challenge, we do not consider that this alone presents an insurmountable barrier to implementation of this option. A definition could, for example, be linked to criteria for claims of no added sugar as set out in Schedule 4 of the Code42 43. Technical guidance on how added sugars should be quantified would also be required
38 As a product’s added sugars will always be less than or equal to its total sugars, the sugars points table would need to be adjusted to ensure more baseline points are awarded to a lower proportion of added sugars than currently exists for total sugars. 39 Peters, S, Dunford, E, Jones, A, Ni Mhurchi, C, Crino, M, Taylor, F, Woodward, M & Neal, B ‘Incorporating added sugar improves the performance of the Health Star Rating front-of-pack labelling system in Australia’, Nutrients, 2017, 9, 701, p.1-12 40 Public Health England, March 2018, Annex A: The 2018 review of the UK Nutrient Profiling Model 41 Menday, H, Neal, B, Wu, J, Crino, M, Baines, S & Peterson, K. ‘Use of added sugars instead of total sugars may improve the capacity of the Health Star Rating system to discriminate between core and discretionary foods’, Journal of the Academy of Nutrition and Dietetics, December 2017, Volume 117, No.12 42 The Code does not define added sugars, however in outlining conditions for health claims of ‘no added sugars’ products must not contain: hexose monosaccharides and disaccharides, including dextrose, fructose, sucrose and lactose; starch hydrolysate; glucose syrups, maltodextrin and similar products; products derived at a sugars refinery, including brown sugar and molasses; icing sugar; invert sugar; fruit sugar syrup; honey, malt or malt extracts; or added concentrated fruit juice or deionised fruit juice. 43 FSANZ, 2017, Australian and New Zealand Food Standards Code – Schedule 4 Nutrition, health and related claims
Five Year Review of the Health Star Rating System: Consultation Paper, October 2018 Page 33 of 77
• added sugars are chemically identical to intrinsic sugars and are processed by the body in the same way44, such that some argue they should not be treated differently.
Rather than replacing total sugars with added sugars in the HSR Calculator, we suggest that: • increasing the impact of total sugars may be more desirable and better able to target the problem (see
discussion on Option C) • there are a range of other initiatives occurring in parallel designed to address added sugars that would
complement the treatment of total sugars in the HSR. − The Australia and New Zealand Ministerial Forum on Food Regulation (the Forum) is currently
exploring options for labelling of sugars on packaged foods and drinks for sale in Australia and New Zealand. The outcomes of this work may provide consumers with additional contextual information about sugars to enable them to make informed choices in support of the Dietary Guidelines.45
− The Healthy Food Partnership’s Reformulation Working Group has developed draft reformulation targets for sugars across foods that represent the highest contributors of free sugars to Australian population level intakes. Reformulation targets are specifically proposed for: soft drinks and energy drinks; flavoured water, mineral water, soda water and iced teas; breakfast cereals; flavoured milks; yoghurts; and muesli or cereal style bars.
We note that the TAG also modelled a hybrid option that more strongly penalises total sugars (as per Option C), but only when added sugars are present. However, this has many of the same disadvantages of replacing total sugars in the HSR Calculator with added sugars, along with added complexity in determining the parameters adopted to capture products with added sugars. The impacts of this option, as modelled by the TAG, are similar to the impacts of Option C (particularly if a policy decision is made such that all fresh or minimally processed fruits and vegetables automatically receive an HSR of 5) and as such, we have not examined it further. C. Increase the baseline points awarded for total sugars to reduce the HSRs for products relatively high in
total sugars
This option would require changes to the HSR Calculator to increase the weighting of total sugars, changing the existing 22 point table to, for example, a 25 point table. Increasing the points for total sugars means that products would receive more baseline points for the total sugars content, and therefore generally lower HSRs. The impact of this (and the number of products affected) depends on the proposed change to the points table. The TAG examined two possibilities: moving to a 25 point table or a 30 point table, against the current 22 point table (status quo). Modelling found that a 25 point table affects 289 of the 5,885 products in the TAG database (5%), causing some decreases (of between 0.5-1.5) in the HSRs in the product categories of: • breakfast cereals • muesli and cereal bars • flavoured milks and yoghurts • dairy based desserts, cream cheeses, custards, ice creams • fruit drinks and soft drinks • dried fruits and jams
44 Hess, J.; Latulippe, M.E.; Ayoob, K.; Slavin, J. The confusing world of dietary sugars: Definitions, intakes, food sources and international dietary recommendations. Food Funct. 2012, 3, 477–486 45 Food Regulation Secretariat, Joint Food Regulation System, 11 July 2018, Consultation Regulation Impact Statement: Labelling of sugars on packaged foods and drinks, Department of Health
Five Year Review of the Health Star Rating System: Consultation Paper, October 2018 Page 34 of 77
• sugar-based desserts, sweet biscuits and cakes • ice creams • sugar-based confectionery • mayonnaise and savoury sauces. By contrast, a 30 point table impacts on 814 of the 5,885 products in the TAG database (14%), causing decreases (of between 0.5-1.5) in the HSRs in the above product categories as well as fruit juices, processed fruits and chocolate-based confections. Both of these sub-options reduce the HSRs for products relatively high in total sugars and without significant nutritional value (in the form of FVNL, protein or fibre). They also appear to target products of concern, including breakfast cereals, ready to eat foods such as muesli and cereal bars and sweetened and flavoured milks and yoghurts (as well as cakes and sweet biscuits, confectionery, ice creams and desserts, some jams and mayonnaises and some savoury sauces). This option maintains some alignment with the NPSC in continuing to use total sugars, but changes to the points table mean it will not completely align with the NPSC. A 30 point table would also align with the 30 point tables used for saturated fat and sodium. For the purposes of modelling total system enhancements in Chapter 7, we have used a 25 point table. D. Remove modifying points or restrict the HSR for products relatively high in total sugars to reduce their
HSRs
Other options to address concerns regarding sugars involve greater disruption to the broader HSR System. Options include, for example, providing that products with total sugars over a certain threshold: a) cannot receive modifying points for protein, fibre and/or FVNL content, or b) cannot receive an HSR of 3 or higher. These options are not preferred because: • they remove a significant degree of differentiation between products high in sugars • they disadvantage products that may have nutritional value from protein, fibre and/or FVNL such that
overall the product is an FFG food • they impact on the logic of the HSR System, which aims to provide an overall view of a product based on
a combination of nutrients • a threshold for high total sugars would need to be determined (for example, the UK Traffic Light System
uses 22.5g/100g). Depending on the threshold, this may affect a significant proportion of products (not just the products of concern) and require changes to the labels of many products currently displaying the HSR
• while these options may encourage some reformulation to decrease sugars for products just exceeding the threshold, they would remove incentives for reformulation in high-sugar products to increase positive nutrients as they would be ineligible to receive modifying V, F and/or P points or an HSR of more than 3 regardless.
Summary and consultation
We acknowledge the concerns of a number of stakeholders about the focus on sugar, the risk of penalising sugar disproportionally to other risk nutrients, and the desire for scientific justification for any changes to the HSR Calculator in relation to sugars.
Five Year Review of the Health Star Rating System: Consultation Paper, October 2018 Page 35 of 77
Having said this, we are acutely aware that media and stakeholder consultations have raised the HSR System’s treatment of sugars as a key concern for the Review’s consideration. In particular, we note the existing incongruence around certain products (such as breakfast cereals and ready to eat foods) receiving high HSRs despite being relatively high in added sugars. These concerns are such that they risk loss of confidence in the broader HSR System. Despite such foods not contributing significantly to the overall diet (or the overall contribution of total sugars to the diet)46, the reasons for such concerns are understandable: • these products form part of the weekly shopping basket, and are foods that parents include in lunch
boxes or encourage children to consume • these products are marketed strongly and, given the nature of the products, children are exposed to
such marketing47 48 • the HSRs of these products can widely vary. For these reasons, we are of the view that changes to the HSR System are warranted in relation to sugars, but that these changes should be as targeted as possible (to address the specific concerns of stakeholders), encourage reformulation as far as possible, and minimise disruption to the integrity of the HSR System. On the basis of our examination of the issues to date, the preferred option is currently Option C. We note that Option C could also be implemented in parallel with any changes agreed by Ministers and/or industry in relation to labelling of added sugars and reformulation targets. We seek stakeholder views regarding each of the options, particularly Option C, and the likely impacts.
Sodium
Issue
For HSR Categories 1 and 2, the NPSC table that allocates up to 10 baseline points for sodium content > 900mg was extended to cover the entire food supply to a maximum of 30 baseline points for sodium content > 8,106mg/100g. For Category 3, the table was extended to a maximum of 30 baseline points for sodium content > 2,700mg/100g. While the tables are generally treating sodium appropriately (as reflected in the TAG technical paper on sodium), concerns have been raised that the sodium table for Categories 1 and 2 has been extended too far in order to cover the entire food supply. Extending the tables to cover products with sodium content up to > 8,106mg/100g results in large differences in sodium between the cut-offs for baseline points (i.e. a large change in sodium is required to have any impact on the baseline points a product receives for sodium). However, the majority of products in the food supply have a sodium content < 900mg/100g (only 8% of products in the TAG database have a sodium content > 900mg/100g), making this high upper limit unnecessary. As a result of extending the sodium table for Categories 1 and 2, the HSR Calculator does not effectively discriminate between products in these categories that have significantly different sodium levels. This may
46 Australian Bureau of Statistics, Australian Health Survey 2011-12 47 Signal L N, Stanley J, Smith M, Barr M B, Chambers T J, Zhou J, Duane A, Gurrin C, Smeaton A F, McKerchar C, Pearson A L, Hoek J, Jenkin G L S, Ni Mhurchu C, Children’s everyday exposure to food marketing: an objective analysis using wearable cameras, International Journal of Behavioural Nutrition and Physical Activity, 14 (137) 48 Vandevijvere S, Swinburn B, 3 July 2015, Getting serious about protecting New Zealand children against unhealthy food marketing, New Zealand Medical Association, 128 (1417)
Five Year Review of the Health Star Rating System: Consultation Paper, October 2018 Page 36 of 77
be a disincentive for manufacturers to reformulate to reduce sodium, as large and unrealistic decreases may be required before an increase in the HSR is achieved. Modelling undertaken by the TAG has identified key products of concern, including salty snacks, processed meats, soups, stocks and seasonings and savoury sauces. The TAG modelled four options to address this issue: • status quo • adjust the sodium table for Categories 1 and 2 to a maximum of 30 baseline points for sodium content >
2,700mg/100g (in line with Category 3) • adjust the sodium table for Categories 1 and 2 to a maximum of 30 baseline points for sodium content >
2,000mg/100g • restrict products with high sodium content to a maximum HSR. Having reviewed the available options, this Consultation Paper focuses on two conceptual approaches: • retaining the status quo • adjusting the sodium table for Categories 1 and 2. Restricting products with high sodium content to a maximum HSR is discussed under salty snacks in Chapter 6.
Considerations
Current treatment in the HSR System
• Sodium is a risk nutrient in the HSR Calculator. • For Categories 1, 1D, 2 and 2D:
– A product with > 90mg/100g sodium scores baseline points (starting from 1). – A product with > 8,106mg/100g sodium scores a maximum of 30 baseline points.
• For Categories 3 and 3D: – A product with > 90mg/100g sodium scores baseline points (starting from 1). – A product with > 2,700mg/100g sodium scores a maximum of 30 baseline points.
Dietary Guidelines
• Dietary Guidelines recommend limiting intake of sodium. • The terms salt and sodium are often used interchangeably but they refer to different
things, as sodium is one component of salt. • ADG recommend:
– limit intake of foods and drinks containing added salt – choose lower sodium options among similar foods – limit intake of sodium to less than 2,300mg per day (approx. 6g of salt).
• NZEAG recommend foods and drinks low in salt (sodium) and, if using salt, choose iodised salt.
Intake • AHS 2011-12 indicates that 59% of Australians exceed the recommended intake for sodium. – The largest proportion of sodium intake in Australia comes from cereal and cereal
products (43%), milk products (8%), processed meat (6%) and snack foods (1.9%).
HSR statistics • Most foods in the TAG database have a sodium content < 900mg/100g. – Only 389 products (8%) have a sodium content > 900mg/100g. – 58 products in the TAG database have a sodium content > 2,700mg/100g.
Five Year Review of the Health Star Rating System: Consultation Paper, October 2018 Page 37 of 77
Current treatment in the HSR System
• Sodium is a risk nutrient in the HSR Calculator. • For Categories 1, 1D, 2 and 2D:
– A product with > 90mg/100g sodium scores baseline points (starting from 1). – A product with > 8,106mg/100g sodium scores a maximum of 30 baseline points.
• For Categories 3 and 3D: – A product with > 90mg/100g sodium scores baseline points (starting from 1). – A product with > 2,700mg/100g sodium scores a maximum of 30 baseline points.
– 106 products in the TAG database have a sodium content > 2,000mg/100g. – Most products with sodium > 900mg/100g currently score an HSR of 3 or lower
(with the exception of some reduced fat cheeses).
Relevant TAG papers
• Sodium • Salty snacks and hot potato products
Options to address issue
A. Status quo for sodium
This option would result in no changes to the sodium tables, and no change to the treatment of sodium in the HSR Calculator. Under this option, there would continue to be some differentiation between products with very high levels of sodium (i.e. >2,700mg/100g). However, very few products in the food supply exceed this level of sodium, so this option limits broader discrimination in sodium content in order to cover a limited number of additional products. The main disadvantages of this option include: • it does not address concerns regarding the limited ability of the HSR System to discriminate between
products that have significantly different sodium levels • it does not provide an incentive for manufacturers to reformulate to reduce sodium, as large and
unrealistic decreases are required before an increase in the HSR is achieved • it does not address consumer concerns regarding the HSRs of products such as salty snacks. B. Decrease the maximum sodium levels used to determine baseline points for sodium to better reflect
the range of sodium levels in the food supply
This option would require changes to the HSR Calculator to reduce the upper limit of the sodium table for Categories 1 and 2 from a maximum of 30 baseline points for sodium content > 8,106mg/100g to a maximum of 30 baseline points for sodium content > 2,700mg/100g. To retain alignment with the NPSC, there would be no changes to the sodium table below 900mg/100g. While the TAG also modelled the option of reducing the upper limit of the sodium table to a maximum sodium content > 2,000mg/100g, 2,700mg/100g has been selected as it aligns the sodium tables across the HSR System. Only 58 products in the TAG database would be impacted by this option, including some sauces, dips and condiments, mixed cereal-based products (e.g. pizzas, cakes), meat and poultry dishes, preserved vegetable products and salty snack foods. The scope of changes is generally in the range of a 0.5 to 1 star decrease in the HSRs of products impacted.
Five Year Review of the Health Star Rating System: Consultation Paper, October 2018 Page 38 of 77
The main advantages of this include: • it improves sodium sensitivity for products with sodium content between 900mg/100g and
2,700mg/100g, as products in this range can incur baseline points faster • the decreased upper limit of the sodium table more appropriately reflects the range and frequency of
sodium values in the food supply • it will encourage reformulation in products with sodium levels >900mg/100g • the impact is limited to products with sodium levels >900mg/100g, so this option will not necessitate
changes to the HSRs of a wide range of products • it aligns the sodium tables across all HSR Categories • it retains alignment with the NPSC • it is relatively simple to implement and communicate • it provides some increased alignment with Dietary Guideline recommendations to avoid foods high in
sodium. The key disadvantage of this option is it does not impact on the majority of products (i.e. those with sodium content < 900mg/100g), and so will not address the issue with salty snacks (discussed under Chapter 6).
Summary and consultation
On the basis of our examination of the issues to date, the preferred option is currently Option B. We seek stakeholder views regarding the above options, their impacts and relevant further considerations.
Five Year Review of the Health Star Rating System: Consultation Paper, October 2018 Page 39 of 77
Chapter 5 – Positive nutrients
Overview This Chapter relates to stakeholder comments regarding the treatment of protein and fibre in the HSR System, and the potential for including wholegrain in the HSR Calculator. HSR modifying points may be scored for the positive components of a product: • V points can be scored for the amount of FVNL or concentrated fruit and vegetable content in a food –
from 1 point (for > 40% FVNL or > 25% concentrated fruit and vegetable content) to a maximum of 8 points (for 100% FVNL content).
• P points can be scored for the amount of protein in a product, only if the product scores 13 or less baseline points or scores more than 13 baseline points but also scores 5 or more V points – from 1 to a maximum of 15 points (for more than 50% protein).
• F points can be scored for the amount of dietary fibre in a product for Category 2, 2D, 3 and 3D foods only (i.e. beverages cannot score F points) – from 1 to a maximum of 15 points (for more than 20% fibre).
The key issues raised by stakeholders in relation to positive nutrients are: • concern regarding the inclusion of protein in the HSR Calculator when the majority of Australians and
New Zealanders meet or exceed the recommended intake of protein • concern that manufacturers may add refined fibres (such as Inulin) to products in order to drive up the
HSR • concern that modifying points for fibre do not consider wholegrain content, resulting in a lack of
differentiation between products containing wholegrains compared to those products that are more refined.
This Chapter examines each of these issues.
Protein
Issue
Some stakeholders have questioned whether protein should be included as a positive nutrient in the HSR Calculator, as the majority of Australians and New Zealanders meet or exceed recommended intakes for protein. Protein is included in the HSR Calculator as it is part of the NPSC and the UK NPM on which the NPSC is based. Evidence underpinning the UK NPM demonstrates that protein is a reasonable surrogate for iron and calcium content49, which are both lacking in the Australian and New Zealander populations. As neither iron nor calcium content is mandated in the NIP, it is also more practical to use protein as a surrogate in the HSR Calculator.
49 Rayner, M., Scarborough, P. & Lobstein, T, October 2009, The UK Ofcom Nutrient Profiling Model: Defining ‘healthy’ and ‘unhealthy’ foods and drinks for TV advertising for children
Five Year Review of the Health Star Rating System: Consultation Paper, October 2018 Page 40 of 77
In the HSR System, P points can only be scored where: • the product scores 13 or fewer baseline points (from energy, total sugars, sodium and/or saturated fat
content), or • the product scores more than 13 baseline points but also scores 5 or more V points (from FVNL content). This represents a change from the UK NPM. When the NPSC was developed, a more lenient approach to eligibility for P points was taken. In adapting the UK NPM, eligibility for P points was changed from 11 or fewer baseline points to 13 or fewer baseline points, meaning that a product can receive more baseline points before becoming ineligible. This means that the NPSC (and consequently the HSR Calculator) makes it easier for less healthy products higher in risk nutrients to benefit from their protein content. The products affected by this are generally breakfast cereals, muesli bars and bakery products with added sugars or saturated fats (such as iced buns, scones and cheese-topped rolls). Stakeholders have also raised concerns that manufacturers may add protein (such as whey or casein) to products to offset risk nutrients to gain a higher HSR, without delivering health benefits.
Considerations
Current treatment in the HSR System
• Protein is a positive nutrient in the HSR Calculator. – A product with > 1.6% protein can score modifying protein points (starting from 1). – A product with > 50% protein can score a maximum of 15 modifying protein points.
• A product scoring 13 or more baseline points (for high energy, sugars, sodium and/or saturated fat levels) is ineligible to receive protein points unless the product also scores 5 or more V points (for FVNL content).
• Protein provides a surrogate for iron and calcium content.
Dietary Guidelines
• Sources of dietary protein include lean meat, poultry and fish, eggs, dairy products like milk, yoghurt and cheese, seeds and nuts, beans and legumes (such as lentils and chickpeas) and soy products like tofu.
• Dietary Guidelines recommend eating a variety of foods containing lean meats and poultry, fish, eggs, nuts and seeds, and legumes/beans as they provide many nutrients, including protein, iron, zinc and other minerals and vitamins.
• ADG recommend adults consume 37-65 g of protein per day.
Intake • Almost all Australians (99%) and New Zealanders (98%) meet or exceed the recommended estimated average requirements for protein.
• The main sources of protein for adult Australians are unprocessed beef, sheep and pork (11.2%), cereals (10.9%), poultry (8.2%) and breads and bread rolls (7.1%) (AHS). Cereals and bread are significant contributors to protein intake as they are consumed in large amounts and contain wholegrains, gluten and wheat proteins.
HSR statistics • Based on the TAG database:
– 64% of nuts, 36% of dips, 29% of snack foods such as potato crisps and muesli bars and 27% of breakfast cereals benefit from protein points.
– Some cakes, biscuits, creams and ice creams also benefit from protein points.
Relevant TAG papers • Protein
Five Year Review of the Health Star Rating System: Consultation Paper, October 2018 Page 41 of 77
Options to address issue
A. Status quo for protein
Under this option, protein would continue to be a part of the HSR Calculator, with eligibility to score modifying P points for products with 13 or fewer baseline points. The main advantages of this are: • the inclusion of protein in the HSR Calculator generally provides a pragmatic, if indirect, surrogate for
iron and calcium content, both of which are lacking to some degree in Australian and New Zealand diets • many FFG products (nuts, breakfast cereals, lean meats) are being appropriately promoted through the
consideration of protein content. The main disadvantages of this option are: • based on the TAG modelling, it may inappropriately advantage some products with high protein content
that do not confer other health benefits • stakeholders have suggested that the inclusion of protein in the HSR Calculator may encourage the
addition of protein to products in order to increase their HSR. − Analysis undertaken by the George Institute shows that added protein is most common in cereal and
nut bars, protein bars, pizzas and processed meats. However, only 3.4% (4/112) of breakfast cereals benefiting from protein points contained any added protein. Except for protein bars, added proteins were mostly found lower down in the ingredients list, suggesting they were not a major component of the product and not a major driver of the modifying protein points.50
A study published in August 201751 analysing the nutritional composition of foods from 2015 to 2016 found that the average protein content of products displaying the HSR was unchanged. Further, industry has advised that given the expense of protein as an ingredient, this would likely limit its use in large quantities to increase a product’s HSR. B. Adjust the threshold at which products can claim modifying protein points to reduce the ability for less
healthy products to increase their HSR through protein
Under this option, eligibility to score protein points would be changed from 13 or fewer baseline points to 11 or fewer baseline points (in line with the UK NPM on which the NPSC is based). In adapting the UK NPM, the NPSC (and consequently the HSR Calculator) made it easier for products high in risk nutrients to be eligible for modifying P points. The products affected by this are generally breakfast cereals, muesli bars and bakery products with added sugars or saturated fats (such as iced buns, scones, cheese-topped rolls). The TAG modelled the potential impact of changing the eligibility for P points from 13 or fewer baseline points to either 12 or 11. Modelling indicates that under either option the product types impacted would include some: • dips • snacks (such as muesli bars, potato crisps, extruded snacks and popcorn) • breakfast cereals 50 The George Institute for Global Health, 20 September 2018, Uptake of the HSR System 51 Ni Mhurchu, C, Eyles, H & Choi, Y, ‘Effects of a Voluntary Front-of-Pack Nutrition Labelling System on packaged food reformulation: the Health Star Rating system in New Zealand’, Nutrients, (2017), 9, 918
Five Year Review of the Health Star Rating System: Consultation Paper, October 2018 Page 42 of 77
• bakery/cake mixes • biscuits (both sweet and savoury) • cream and ice cream • processed meats. Changing the eligibility for protein points to 12 or fewer baseline points would impact on 116 products in the TAG database (approximately 2%). Changing it to 11 or fewer baseline points would impact on 192 products in the TAG database (approximately 3%). The main advantages of changing the eligibility for P points include: • protein is retained in the HSR Calculator as a surrogate for iron and calcium content • the adjustment would impact on relatively few products overall, while preventing those that are higher
in risk nutrients from being advantaged by protein content • it may address stakeholder concerns regarding the potential for manufacturers to add protein to
products to offset risk nutrients to gain a higher HSR, without delivering health benefits • it targets those products that have been raised as a concern including breakfast cereals, muesli bars,
salty snacks and processed meats • it may incentivise reformulation amongst the products impacted (i.e. in order to meet the new eligibility
criterion so as to maintain current HSRs, energy, total sugars, sodium and/or saturated fat content would need to be reduced).
The main disadvantage of this option is that it reduces alignment with the NPSC (however it restores alignment with the original UK NPM on which the NPSC is based). C. Remove protein from the HSR Calculator
This option would remove protein as a positive nutrient from the HSR Calculator, such that products would not receive modifying protein points for their protein content. Modelling suggests that this option would impact on 400 products in the TAG database (approximately 7%), including some FFG products such as nuts, meats and fish, processed fruits and vegetables and cheeses. The main advantages of this are that: • protein consumption does not need to be promoted within the diet • removing protein may encourage some industry reformulation to reduce energy, total sugars, sodium
and/or saturated fat content, as the baseline points for these nutrients would no longer be offset by modifying protein points.
The main disadvantages of this are: • the inclusion of protein in the HSR Calculator provides a surrogate for iron and calcium content, both of
which are lacking in Australian and New Zealander diets • many FFG products (nuts, breakfast cereals, lean meats) are being appropriately promoted through
protein content. Removing protein from the HSR Calculator would disadvantage these products • the HSR System would no longer align with the NPSC, nor with the UK NPM.
Summary and consultation
On the basis of our examination of the issues to date, the preferred option is currently Option B. This Option addresses concerns by lifting the point at which products higher in risk components become eligible for
Five Year Review of the Health Star Rating System: Consultation Paper, October 2018 Page 43 of 77
modifying P points. We seek stakeholder views regarding the above options, their impacts and relevant further considerations.
Fibre and wholegrain
Issue
Dietary Guidelines recommend eating grain foods, mostly wholegrain and/or high cereal fibre varieties. Wholemeal or wholegrain varieties are preferable because they provide more dietary fibre, vitamins and minerals than refined grain (cereal) foods. The ADG note that at least two-thirds of our choices should be wholegrain varieties, and that most Australians consume less than half the recommended quantity of wholegrain foods but eat too much refined grain (cereal) food. While the HSR Calculator does account for fibre content, it does not directly consider wholegrain. This means that products with very different wholegrain content may receive a similar, or the same, HSR. For example, white rices and brown rices generally receive similar HSRs (basmati, jasmine and brown rice all receive an HSR of 4). Stakeholders have raised concern that the HSR System does not adequately promote consumption of wholegrains over more refined fibres, and have suggested that including wholegrain in the HSR Calculator will enable improved differentiation between products with ‘natural’ fibre and those with refined fibre such as inulin. In considering technical solutions to this issue, it is noted that: • declaration of wholegrain content is not required on food packaging, except where wholegrain is a
characterising ingredient • it is not possible to analytically determine the content of wholegrain in food • the Code does not regulate the use of wholegrain content claims; however, the Grains & Legumes
Nutrition Council’s Code of Practice for Whole Grain Ingredient Content Claims (Industry Code of Practice) provides a guide for the use of wholegrain content claims on food labels in Australia and New Zealand52
• there is a definition of wholegrain in the Code, which is the same as that used in the Industry Code of Practice to regulate wholegrain content claims for food.
The TAG’s technical paper on wholegrain analysed two options (in addition to the status quo) for including wholegrain in the HSR Calculator. Both of the options modelled by the TAG contain significant disadvantages and complexities, without adequately accounting for both fibre content and wholegrain content. Consequently, another option has been modelled separately by the TAG and is described below. The TAG also prepared a paper on fibre, which assessed whether the HSR Calculator appropriately deals with dietary fibre. While the TAG identified that it would be relatively simple to change the fibre content at which modifying F points can be scored, we do not consider there is a strong policy rationale for doing this (noting the importance of fibre in the diet). On the issue of whether refined fibre could be added to foods to improve a product’s HSR, analysis undertaken by the George Institute shows this may occur to some extent, with 5.8% of the products analysed (926/15,767) containing at least one added fibre ingredient. This was most common in cereal and nut bars, protein bars, and breakfast.53
52 Grains & Legumes Nutrition Council, June 2017, Code of Practice for Whole Grain Ingredient Content Claims 53 The George Institute for Global Health, 20 September 2018, Uptake of the HSR System
Five Year Review of the Health Star Rating System: Consultation Paper, October 2018 Page 44 of 77
Considerations
Current treatment in the HSR System
• Fibre is a positive nutrient in the HSR Calculator. • A product with > 0.9% fibre can score modifying F points (starting from 1). • A product with > 20% fibre can score a maximum of 15 modifying F points. • Wholegrain is not currently a part of the HSR System but is indirectly accounted for by
fibre.
Dietary Guidelines • Dietary Guidelines:
– recommend adults eat 25–30g of dietary fibre every day – note that grain foods, especially breads, are one of the key sources of dietary fibre – recommend eating grain (cereal) foods, mostly wholegrain and/or high cereal fibre
varieties, such as breads, cereals, rice, pasta, noodles, polenta, couscous, oats, quinoa and barley
– recommend eating six serves of grain per day. • Wholegrain is defined as ‘products which use every part of the grain including the outer
layers, bran and germ even if these parts are separated during processing and regardless of whether the grain is in one piece or milled into smaller pieces’.
Intake • AHS 2011-12 found that: – The average daily intake of dietary fibre for Australian adults is 22.9g. – In Australia, the majority of dietary fibre is sourced from consuming cereal and cereal
products (cereals, bread, pasta, barley, quinoa, etc. (29.3%)), cereal-based products (biscuits, cakes, pastries, etc (19%)), fruit (17.7%) and vegetables (14.4%).
• NZEAG 2008/09 found that: – The average daily intake of dietary fibre for New Zealand adults is 20g. – In New Zealand the majority of dietary fibre is sourced from consuming bread
(17.1%), vegetables (16.4%), potatoes, kumara and taro (11.7%), fruit (11.5%), grains and pasta (8.3%), breakfast cereals (7.2%), bread-based dishes (5.1%) and cakes and muffins (2.3%).
• The ADG note that most Australians consume less than half the recommended quantity of wholegrain foods, but eat too much refined grain (cereal) food.
HSR statistics • Based on the TAG database:
– fibre content does not necessarily correlate to wholegrain content. – the mean fibre content for bread is 5%, breakfast cereals is 9.17%, biscuits 3.4%,
muesli bars 7.2%, yoghurts 0.31%
Relevant TAG papers • Fibre
• Wholegrain
Options to address issue
A. Status quo for fibre
Under this option, the HSR Calculator would continue to award modifying F points for fibre content, and wholegrain content would not be considered separately. The status quo retains alignment with the NPSC (on which the HSR Calculator is based), which does not consider wholegrain. However, this option would continue to inadequately discriminate between foods with
Five Year Review of the Health Star Rating System: Consultation Paper, October 2018 Page 45 of 77
different wholegrain content, and fail to promote products higher in wholegrain, which Dietary Guidelines recommend consuming. Other labelling tools are available to industry to promote wholegrain – for example, wholegrain claims can be made in line with the Industry Code of Practice. B. Enable foods to receive more modifying F points where more wholegrains are present in the food
This option would require changes to the HSR Calculator so that a product containing wholegrain would receive a proportional loading to its fibre content such that it receives more F points (using the existing fibre table) when more wholegrain is present, and may receive a higher HSR. For example, if a maximum 20% loading was applied to 100% wholegrain content: • A product with 5.3g/100g fibre and 100% wholegrain would:
− receive a 20% loading, resulting in a scaled fibre content of 6.36g − receive 7 modifying F points.
• A product with 8g/100g fibre and 50% wholegrain would: − receive a 10% loading, resulting in a scaled fibre content of 8.8g − receive 9 modifying F points.
Noting the limitation on wholegrain data in the TAG database (which results in a small sample size), the TAG modelling indicates that this option would affect few products, with a maximum increase in HSR of 0.5. Products affected include breads, breakfast cereals, rices, pastas, extruded snacks and muesli bars. The TAG modelling indicates that a 20% loading for 100% wholegrain may provide improved differentiation between white and wholegrain breads, breakfast cereals, pastas, rices and other grains. The 20% loading effectively targets products, such that they require a high proportion of wholegrain (generally > 40%) to achieve an increase in HSR. It is also targeted enough to ensure the HSRs of products high in risk-associated nutrients are not unduly increased due to wholegrain content. The main advantages of this option are: • it recognises the dietary value of fibre from wholegrain over other sources. This would increase the
ability to distinguish between foods lower and higher in wholegrain, resulting in improved alignment with Dietary Guideline recommendations to eat fibre mainly from wholegrains
• it may also encourage positive reformulation to increase wholegrain content in some products. The main disadvantages of this option are: • manufacturers would need to determine the wholegrain content of their products to calculate the F
points. Wholegrain is not mandated to be identified on the NIP and its inclusion in the HSR System may represent a significant change and a potential barrier to uptake for industry (in terms of quantifying wholegrain)
• further consideration would need to be given to the adequacy of the existing definition of wholegrain • it would diminish alignment with the NPSC (which does not consider wholegrain).
Summary and consultation
As noted above, limitations of the TAG database pose particular challenges in terms of analysing the impact of Option B. While Option B is intuitively attractive (by rewarding wholegrain without disrupting fibre, and better aligning with the Dietary Guidelines) further advice is sought from stakeholders about the likely impacts of this option.
Five Year Review of the Health Star Rating System: Consultation Paper, October 2018 Page 46 of 77
Chapter 6 – Product specific issues
Overview This Chapter relates to concerns regarding some specific product types including: • oils and oil-based spreads – there is a wide range of HSRs for oils and oil-based spreads in cases where
there is little nutritional differentiation. Furthermore, some healthy oils and spreads obtain HSRs below 3.5, which does not account for their healthy unsaturated fat content, and is inconsistent with Dietary Guidelines recommendations
• salty snacks – analysis of the HSR System and its alignment with Dietary Guidelines reveals that some salty snacks (such as potato crisps and popcorn) receive relatively high HSRs despite their status as a discretionary food and sometimes high saturated fat and sodium content, due to the modifying effect of their FVNL, fibre and/or protein content
• dairy desserts – some dairy dessert products (such as custards) in Category 2 receive higher HSRs than some nutritionally similar dairy products that fall into Category 2D (such as yoghurts). This makes it difficult for consumers to differentiate between similar products
• jellies and ice confections – jellies and ice confections are similar in nutritional profile to non-dairy beverages, but receive higher HSRs by virtue of being in Category 2, despite their high sugars content.
This Chapter describes the issues and proposed options to address these product specific issues.
Oils and oil-based spreads
Issue
Dietary Guidelines recommend replacing high fat foods that contain predominantly saturated fats (such as butter, cream, cooking margarine, coconut and palm oil) with foods which contain predominantly polyunsaturated and monounsaturated fats (such as oils, spreads, nut butters/pastes and avocado). Fats, oils and oil-based spreads are in their own category in the HSR System – Category 3. The TAG modelling shows that the HSR Calculator differentiates reasonably well between fats, oils and oil-based spreads high or low in saturated fat, with products high in saturated fat consistently receiving low HSRs (≤ 2). However, there is a wide spread of HSRs for some healthy oils and spreads with small differences in saturated fats. The HSRs for some healthy oils and spreads are also lower than expected, given that these products are recommended by the Dietary Guidelines. For example, peanut oil scores an HSR of 2.5, sunflower oil scores an HSR of 3, olive oil scores an HSR of 3-3.5, canola oil scores an HSR of 4, yet these products are not differentiated by Dietary Guidelines. The energy and sodium content of these products is the same, so the difference in HSRs are due to differences in saturated fat content: olive oil (16% saturated fat), sunflower (11%) and canola (7.6%). The concerns are that there is a wide range of HSRs for ‘healthy’ oils and spreads where there is little nutritional differentiation, and that many healthy oils and spreads obtain HSRs below 3.5. As oils are a single ingredient product, there is also no opportunity to reformulate these products to improve their HSR. A study published in August 201854 found that oils were the category with the worst alignment between the
54 Dunford, E.K., Huang, L., Peters, S.A.E., Crino, M.; Neal, B.C., Ni Mhurchu, C. Evaluation of Alignment between the Health Claims Nutrient Profiling Scoring Criterion (NPSC) and the Health Star Rating (HSR) Nutrient Profiling Models. Nutrients 2018, 10, 1065
Five Year Review of the Health Star Rating System: Consultation Paper, October 2018 Page 47 of 77
HSR System and the NPSC. Most oils had an HSR < 3.5 but most were also eligible to display health claims under the Code55. The TAG modelled four options to address this issue. This Consultation Paper does not explore two of these options (including trans fats in the HSR Calculator and removing edible oils from the HSR System) as these respectively reduce alignment with the NPSC and add complexity to the HSR Calculator, and do not support consumers to select healthier choices in this category.
Considerations
Current treatment in the HSR System
• Fats, oils and spreads are in their own category in the HSR System – Category 3. • For Categories 3 and 3D:
– A product with > 1% saturated fat scores baseline points (starting from 1). – A product with > 30% saturated fat scores a maximum of 30 baseline points.
• The HSR Calculator does not consider unsaturated fats or trans fats.
Dietary Guidelines
• Dietary Guidelines recommend: – replace high fat foods that contain predominantly saturated fats such as butter,
cream, cooking margarine, coconut and palm oil with foods that contain predominantly polyunsaturated and monounsaturated fats such as oils, spreads, nut butters/pastes and avocado.
• WHO recommends less than 30% total energy intake from fats, including: – less than 10% from saturated fats (e.g. from fatty meat, butter, palm and coconut oil,
cream, cheese, ghee and lard). – more unsaturated fats (e.g. from fish, avocado, nuts, sunflower, canola and olive
oils).56
Intake • AHS 2011-12 found the average daily intake in Australian adults of: – saturated fat (including trans fatty acids) contributed an average 12% energy,
exceeding the recommended 10% contribution of saturated fat to total energy – monounsaturated fat contributed an average 12% energy – polyunsaturated fat contributed an average 4.7% energy.
• NZANS 2008-09 found the median usual daily intake for New Zealand adults of: – saturated fat was 13% total energy, exceeding the recommended 10% contribution
of saturated fat to total energy – monounsaturated fat was 29.7g or 12.35% daily total energy intake – polyunsaturated fat was 11.35g or 4.85% daily total energy intake.
• These suggest that intake of saturated fat is higher than recommended, and intake of unsaturated fat (particularly polyunsaturated fat) is lower than recommended.
HSR statistics • High saturated fat products such as butter and lard generally score a lower HSR, oils and
full fat spreads generally score an HSR between 2 and 4, and fat-reduced spreads generally score an HSR of 4-5.
Relevant TAG papers • Fats, oils and oil-based spreads
55 FSANZ, 2017, Australian and New Zealand Food Standards Code – Schedule 4 Nutrition, health and related claims 56 World Health Organization, 24 August 2018, Healthy Diet, [http://www.who.int/news-room/fact-sheets/detail/healthy-diet]
Five Year Review of the Health Star Rating System: Consultation Paper, October 2018 Page 48 of 77
Options to address issue
A. Status quo for oils and oil-based spreads
This option would continue to give a wide spread of HSRs for oils and oil-based spreads, including some HSRs below 3.5 for some ‘healthy’ oils and spreads. The range of HSRs for healthy oils and spreads high in unsaturated fats is wide and overlaps with the HSR of some discretionary products. This is inconsistent with Dietary Guidelines, and may confuse consumers regarding the relative nutritional value of some oils. As there is limited opportunity to reformulate oils, the status quo may discourage manufacturers from displaying the HSR particularly where it may misrepresent the product. B. Rescale Category 3 upwards to increase and narrow the range of HSRs for oils and oil-based spreads so
that healthy oils receive higher HSRs which better represent their relative nutritional value
This option would require changes to the HSR Calculator to rescale Category 3 upwards. This would increase the HSRs of healthy oils and spreads to ensure better discrimination between products, and reduce the range of HSRs for products classified as FFG, to improve consistency with Dietary Guidelines. The TAG modelled the impacts of this option against 94 fats, oils and oil-based spreads in the TAG database: 53 products were affected. Modelling shows that, under this option, there is little to no change in the HSRs of unhealthy fats and oil products with an HSR ≤ 1.5 (including Copha, lard, butter, palm, coconut). For products with an HSR > 1.5, HSRs are generally increased by 0.5. The HSR of macadamia, avocado, sunflower and olive oils would increase from 3-3.5 to 4, and canola oil from 4-4.5 to 5. Broadly, products with saturated fat content < 12% would receive an HSR of 5, while products with saturated fat content > 25% would receive an HSR ≤ 2. Advantages of this option include: • it would increase the scores of healthy oils and spreads to provide better discrimination between
healthier oils and oil-based spreads, without impacting on those products that already receive a low HSR • it would decrease the range of HSRs within these products to more appropriately represent the relative
nutritional value of oils and spreads high in unsaturated fats. • it would consequently address concerns that some oils are being inappropriately favoured over others,
improve consistency with Dietary Guidelines, improve consistency with the NPSC criteria to display health claims and provide more consistent messaging to consumers.
The main disadvantage of this option is that, in reducing the spread of HSRs, it may remove some discrimination between oils, such that it is less clear which oils are higher in saturated fats.
Summary and consultation
On the basis of our examination of this issue, the preferred option is currently Option B. This provides a targeted solution to a product-specific concern. We seek stakeholder views regarding the above options, their impacts and relevant further considerations.
Five Year Review of the Health Star Rating System: Consultation Paper, October 2018 Page 49 of 77
Salty snacks
Issue
Dietary Guidelines recommend limiting intake of discretionary salty snacks such as potato crisps due to their high energy, saturated fat and sodium content. Based on TAG analysis, as well as other studies57 and stakeholder submissions, some of these products receive a relatively high HSR due to their content of FVNL, fibre and/or protein and, relative to similar products, lower saturated fat and sodium content. For example, some extruded snacks or vegetable crisps receive an HSR of up to 4. The range of HSRs of salty snacks supports consumers to make healthier choices when comparing similar products, however the fact that a number of these discretionary products are scoring HSRs ≥ 3.5 does not align well with consumer expectations of the HSR on such foods, nor with Dietary Guidelines. While the role of the HSR System is to provide a measure of a product’s relative healthiness within a category (and comparisons across categories are discouraged), salty snacks have been noted by stakeholders as an area of incongruence and this may impact on confidence in the system. As such, we are exploring options to address this issue in the Review. The TAG paper also explored whether hot potato products (such as over-baked chips and wedges) score appropriate HSRs. It was concluded that, while these products have higher HSRs than expected for discretionary foods, they are relatively low in negative nutrients and have a nutritional profile more similar to potato bakes or mashed potato, which are considered FFG. As such, the TAG paper does not consider options to address this issue and it is not explored in this Consultation Paper.
Considerations
Current treatment in the HSR System
• Sodium and saturated fat are risk nutrients in the HSR Calculator. • Salty snack products are classified as Category 2. • For Categories 1, 1D, 2 and 2D:
– A product with > 90mg/100g sodium scores baseline points (starting from 1). – A product with > 8106mg/100g sodium scores a maximum of 30 baseline points.
Dietary Guidelines
• Dietary Guidelines recommend: – limiting intake of foods high in saturated fat such as potato chips, crisps and other
savoury snacks – limiting intake of foods containing added salt and saturated fat.
Intake • AHS 2011-12 found: – 35% of total daily energy intake for Australian adults is from discretionary foods,
including 1.5% from snack foods (potato snacks, corn snacks, extruded or reformed snacks, etc)
– 2% of daily sodium intake for Australian adults is from snack foods – 2.4% of daily fat intake for Australian adults is from snack foods.
• NZANS 2008/09 found: – 0.6% of total energy intake for New Zealand adults is from snack foods (corn chips,
popcorn, extruded snacks, grain crisps) – 6.4% of energy intake for New Zealand adults is from potato (including potato crisps),
57 Jones, A, Radholm, K and Neal, B ‘Defining ‘Unhealthy’: a systematic analysis of alignment between the Australian Dietary Guidelines and the Health Star Rating System’, Nutrients 2018, 10, 501
Five Year Review of the Health Star Rating System: Consultation Paper, October 2018 Page 50 of 77
Current treatment in the HSR System
• Sodium and saturated fat are risk nutrients in the HSR Calculator. • Salty snack products are classified as Category 2. • For Categories 1, 1D, 2 and 2D:
– A product with > 90mg/100g sodium scores baseline points (starting from 1). – A product with > 8106mg/100g sodium scores a maximum of 30 baseline points.
kumara and taro – 0.8% of daily saturated fat intake for New Zealand adults is from snack foods – 6.4% of daily saturated fat intake for New Zealand adults is from potato, kumara and
taro.
HSR statistics
• The TAG modelling found the mean HSR of salty snacks is 2, with approximately 20% scoring an HSR ≥ 3.
• Salty snacks with an HSR ≥ 3 or above have a healthier nutritional profile (lower fat and/or salt and higher protein, fibre and/or FVNL content). – For salty snacks with an HSR ≥ 3, the mean content per 100g of saturated fat is 2.6g,
sodium is 391mg, fibre is 5.2g, protein is 8.9g, FVNL is 29.5%. – For salty snacks with an HSR < 3, the mean content per 100g of saturated fat is 7.5g,
sodium is 612mg, fibre is 3.6g, protein is 9g, FVNL is 18.6%. • Research commissioned by the NSW Ministry of Health58 found the mean HSR of salty
snacks, chips and pretzels is 2.8, with approximately 40% scoring an HSR ≥ 3.5.
Relevant TAG papers
• Salty snacks
Options to address issue
A. Status quo for salty snacks
This option would continue to award relatively high HSRs to some salty snacks despite their poor nutritional profile and status (in Australia) as a discretionary food. The TAG modelling shows that the HSR System currently discriminates well between more-healthy and less-healthy salty snacks, awarding higher HSRs to products with lower fat and/or salt, and higher protein, fibre and/or FVNL content. The salty snacks receiving a higher HSR (such as corn chips, wasabi peas, popcorn and some vegetable crisps) represent healthier versions within this category. However, when compared across other categories of food, the high HSRs of some salty snacks may not appropriately reflect their status as a discretionary food. If no changes were made to address salty snacks in particular, but changes proposed in relation to other aspects of the HSR Calculator were adopted, this would reduce the high HSRs of some salty snacks. For example: • some snacks high in sodium (i.e. those with sodium > 900mg/100g) would be addressed through changes
to how baseline points for sodium are calculated (discussed in Chapter 4), • some snacks benefiting from modifying P points would be addressed through changes to how P points
are scored (discussed in Chapter 5).
Based on TAG modelling, these changes would impact some, but not the majority of salty snacks that receive HSRs of ≥ 3.5. 58 Dunford, E, Cobcroft, M, Thomas, M, & Wu, J.H. (2015) Technical Report: Alignment of NSW Healthy Food Provision Policy with the Health Star Rating System, Sydney, NSW: NSW Ministry of Health
Five Year Review of the Health Star Rating System: Consultation Paper, October 2018 Page 51 of 77
If the status quo were retained, there are initiatives outside of the HSR System that may impact on the high sodium content of salty snacks. For example, the Healthy Food Partnership’s Reformulation Working Group has developed draft reformulation targets for sodium across foods that represent the highest contributors of sodium to Australian population level intakes. Draft reformulation targets are specifically proposed for potato snacks, extruded snacks, corn snacks, vegetable, grain and other snacks (as well as a number of other products including ready meals and pizzas, bread and pastries, processed meats (including ham, bacon, frankfurts, saveloys, sausages), gravies and sauces, cheddar and processed cheeses, crumbed and battered meats and seafoods, cakes, muffins and slices, breakfast cereals, savoury biscuits, crackers, corn and rice cakes and soups). However, it should be noted that this is an Australian initiative, with no equivalent in New Zealand. B. Remove modifying points or restrict the HSR for salty snacks to reduce their HSRs in line with their
status as discretionary foods
Two possible ways to address concerns regarding the HSRs of salty snacks include providing that salty snacks: a) cannot receive modifying points for protein, fibre and/or FVNL content b) cannot receive an HSR of 3.5 or higher. Both of these options would require a threshold for high sodium to be determined. Depending on the threshold, this may impact on a significant proportion of products, not just salty snacks. Using the UK Traffic Light System threshold of 600mg/100g, 986 (17%) products in the TAG database would be affected, including ready meals, sauces and condiments, processed vegetables, processed meats, FFG cheeses, savoury biscuits and breakfast cereals, bakery products, nuts and meat substitutes. Only 67 of these 986 products are discretionary snack products. These options are not preferred because: • they remove a significant degree of differentiation between high sodium products • they disadvantage products that may have nutritional value from protein, fibre and/or FVNL, providing
limited differentiation between like products • they impact on the logic of the HSR System, which aims to provide an overall view of a product based on
a combination of components • while it may encourage reformulation to decrease sodium content for products close to the threshold,
where products are not close to this threshold, there is no incentive. This option therefore limits the ability of industry to reformulate to reduce negative nutrients, or increase positive components, to receive a higher HSR.
Summary and consultation
While the separation of salty snacks into their own category (such that Option B could be applied only to salty snacks) has been considered, it is not desirable to create more categories or subcategories within the HSR System. This would add further complexity to the HSR Calculator and disrupt the logic of the HSR System in supporting consumers to compare like products. It would also require agreement upon a definition of salty snacks. Option B has significant disadvantages, breaking the logic of the HSR System by singling out one nutrient of concern, and will have a widespread impact on other products high in sodium.
Five Year Review of the Health Star Rating System: Consultation Paper, October 2018 Page 52 of 77
We therefore prefer Option A noting that the HSRs for 20% of the salty snacks in the TAG database would be decreased by 0.5 to 1.5 stars due to the stronger penalisation of high sodium content and the change to the threshold at which products can score modifying protein points (as discussed in Chapters 4 and 5). We seek stakeholder views regarding the significance of this product specific issue relative to others, the impacts of the above options, and any other possible options for addressing the identified issues.
Dairy desserts
Issue
The six categories within the HSR Calculator were created to allow different scaling within each category, to ensure appropriate discrimination between FFG and discretionary products. Dairy categories were created so that dairy products (which are a valuable source of calcium in the diet and are recommended by Dietary Guidelines) were not penalised for their intrinsic sugars and natural fat content, so that FFG dairy products receive HSRs > 3. Category 2D includes all cheeses with calcium content ≤ 320mg/100g, yoghurt and fermented milk products. ‘Dairy desserts’ such as custards, desserts, cream cheeses, ice-creams and creams are not considered dairy foods by the HSR Calculator, and as such are classified as Category 2 foods. Due to the way the HSR Calculator deals with different categories, products in Category 2 receive higher HSRs than nutritionally similar products in Category 2D. Stakeholders have suggested that some Category 2D products (such as yoghurts) receive an HSR that is too low for an FFG food, and this does not appropriately rate these products when compared to similar products in Category 2 (such as custards). Since the implementation of the HSR System, yoghurts have undergone innovation such that there is a wide range of relative healthiness and nutrient profiles, ranging from ‘pure’ yoghurts through to those that are more similar to dairy desserts. Yoghurts are also usually found in the same location of the supermarket as custards and other dairy desserts. While the HSR System is intended to provide a measure of a product’s nutritional value relative to other products in its category, it is likely these products would be compared by consumers. A study published in August 201859 found that yoghurts were an area of misalignment between the HSR System and the NPSC. 335 yoghurts had an HSR < 3.5 but were eligible to display health claims under the Code60. The TAG has not developed a paper exploring this issue, however information regarding this is available in the HSRAC register of potential anomalies (application number 2016-5).
Considerations
59 Dunford, E.K., Huang, L., Peters, S.A.E., Crino, M.; Neal, B.C., Ni Mhurchu, C. Evaluation of Alignment between the Health Claims Nutrient Profiling Scoring Criterion (NPSC) and the Health Star Rating (HSR) Nutrient Profiling Models. Nutrients 2018, 10, 1065 60 FSANZ, 2017, Australian and New Zealand Food Standards Code – Schedule 4 Nutrition, health and related claims
Five Year Review of the Health Star Rating System: Consultation Paper, October 2018 Page 53 of 77
Current treatment in the HSR System
• Category 1D includes dairy beverages (with calcium content > 80mg/100g). • Category 3D includes cheese and processed cheese (with calcium content >
320mg/100g) • Category 2D includes dairy foods other than those included in 1D and 3D (cheeses with
calcium content ≤ 320mg/100g, yoghurt and fermented milk products) • ‘Dairy desserts’ such as custards, desserts, cream cheese, ice-cream and cream are not
considered as dairy foods by the HSR Calculator, and are currently classified as Category 2 foods.
• The HSR Calculator does not account specifically for calcium as a positive nutrient, but uses protein as a proxy.
Dietary Guidelines
• Dietary Guidelines recommend consuming reduced-fat dairy products. – ADG recommend consuming two servings of reduced-fat milk, yoghurt, cheese or
alternatives every day. – NZEAG recommend consuming two servings of milk products (milk, yoghurt, cheese)
and alternatives (choose low-fat or reduced-fat options). – ‘Dairy desserts’ such as custards, desserts, cream cheese, ice-cream and cream are
considered discretionary.
HSR statistics
• Dairy desserts generally score HSRs between 0.5 and 3.5.
Options to address issue
A. Status quo for dairy desserts
This option would continue to award some discretionary dairy desserts (that are high in sugars and saturated fats) with HSRs that are higher than some yoghurts with similar or better nutritional profile. This would result in continued confusion regarding the relative nutritional value of dairy desserts and FFG dairy products such as yoghurts. B. Redefine Category 2D to include dairy desserts, and rescale to ensure that healthier options receive
higher HSRs and comparability is improved between similar dairy products
Under this option, the Category 2D definition would be amended such that it captures dairy desserts. The Category would also be rescaled to maintain a spread of HSRs across products. This option would require a definition of dairy dessert, but this could be linked to the proportion of dairy in the product against other ingredients (such as added sugars and flavours). Including additional discretionary products in Category 2D, without rescaling, would see a large cluster of products at the lower end of the scale, which would not support consumers to choose between such products. Rescaling will redistribute the entire Category: the addition of more ‘unhealthy’ products would condense the top end of the Category (i.e. the HSRs would increase for some yoghurts, soft cheeses and healthier dairy desserts – those lower in total sugars and saturated fat and/or higher in protein and fibre), and the middle to lower end of the Category would expand (i.e. the HSRs would decrease for some dairy desserts) to accommodate the new range of products. Based on the TAG modelling, this option would impact on 404 (6.9%) products in the TAG database. It would reduce the HSRs of 32 products (dairy desserts and custards) by between 0.5 and 2 stars. However, 372 products (yoghurts, soft cheeses and some of the healthier dairy desserts i.e. those lower in sugars and higher in protein) would see an increase of between 0.5 and 2 stars.
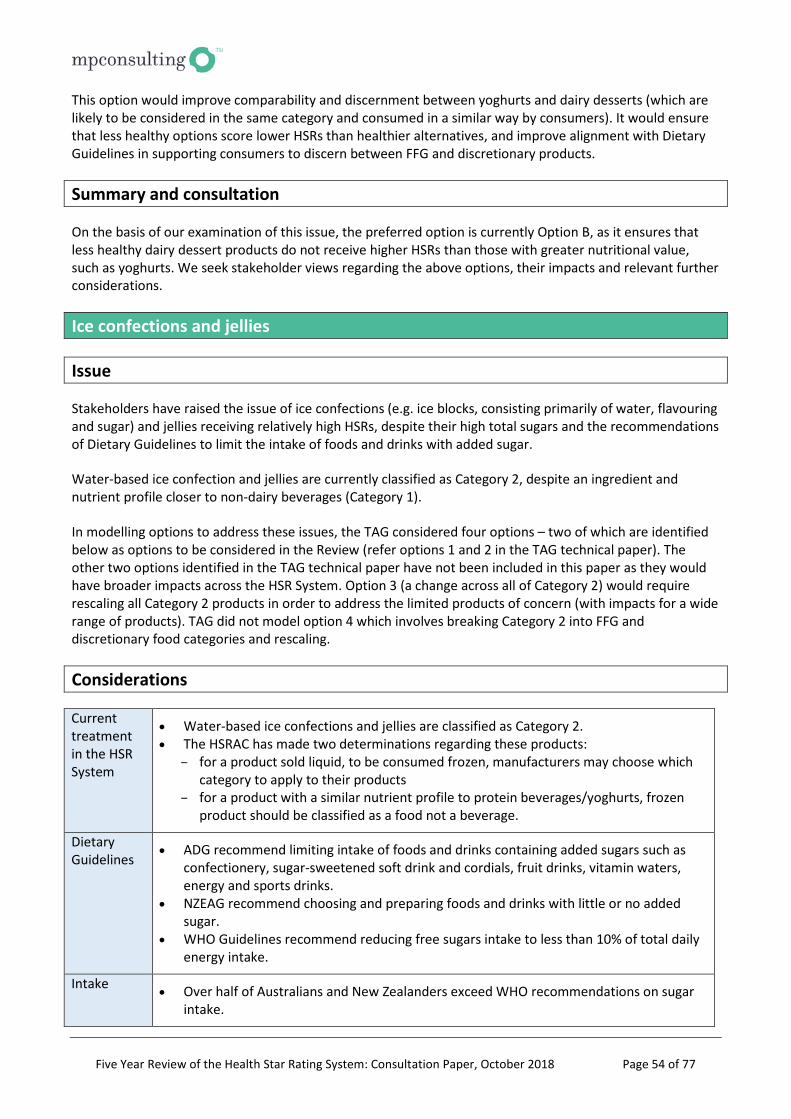
Five Year Review of the Health Star Rating System: Consultation Paper, October 2018 Page 54 of 77
This option would improve comparability and discernment between yoghurts and dairy desserts (which are likely to be considered in the same category and consumed in a similar way by consumers). It would ensure that less healthy options score lower HSRs than healthier alternatives, and improve alignment with Dietary Guidelines in supporting consumers to discern between FFG and discretionary products.
Summary and consultation
On the basis of our examination of this issue, the preferred option is currently Option B, as it ensures that less healthy dairy dessert products do not receive higher HSRs than those with greater nutritional value, such as yoghurts. We seek stakeholder views regarding the above options, their impacts and relevant further considerations.
Ice confections and jellies
Issue
Stakeholders have raised the issue of ice confections (e.g. ice blocks, consisting primarily of water, flavouring and sugar) and jellies receiving relatively high HSRs, despite their high total sugars and the recommendations of Dietary Guidelines to limit the intake of foods and drinks with added sugar. Water-based ice confection and jellies are currently classified as Category 2, despite an ingredient and nutrient profile closer to non-dairy beverages (Category 1). In modelling options to address these issues, the TAG considered four options – two of which are identified below as options to be considered in the Review (refer options 1 and 2 in the TAG technical paper). The other two options identified in the TAG technical paper have not been included in this paper as they would have broader impacts across the HSR System. Option 3 (a change across all of Category 2) would require rescaling all Category 2 products in order to address the limited products of concern (with impacts for a wide range of products). TAG did not model option 4 which involves breaking Category 2 into FFG and discretionary food categories and rescaling.
Considerations
Current treatment in the HSR System
• Water-based ice confections and jellies are classified as Category 2. • The HSRAC has made two determinations regarding these products:
– for a product sold liquid, to be consumed frozen, manufacturers may choose which category to apply to their products
– for a product with a similar nutrient profile to protein beverages/yoghurts, frozen product should be classified as a food not a beverage.
Dietary Guidelines
• ADG recommend limiting intake of foods and drinks containing added sugars such as confectionery, sugar-sweetened soft drink and cordials, fruit drinks, vitamin waters, energy and sports drinks.
• NZEAG recommend choosing and preparing foods and drinks with little or no added sugar.
• WHO Guidelines recommend reducing free sugars intake to less than 10% of total daily energy intake.
Intake • Over half of Australians and New Zealanders exceed WHO recommendations on sugar intake.
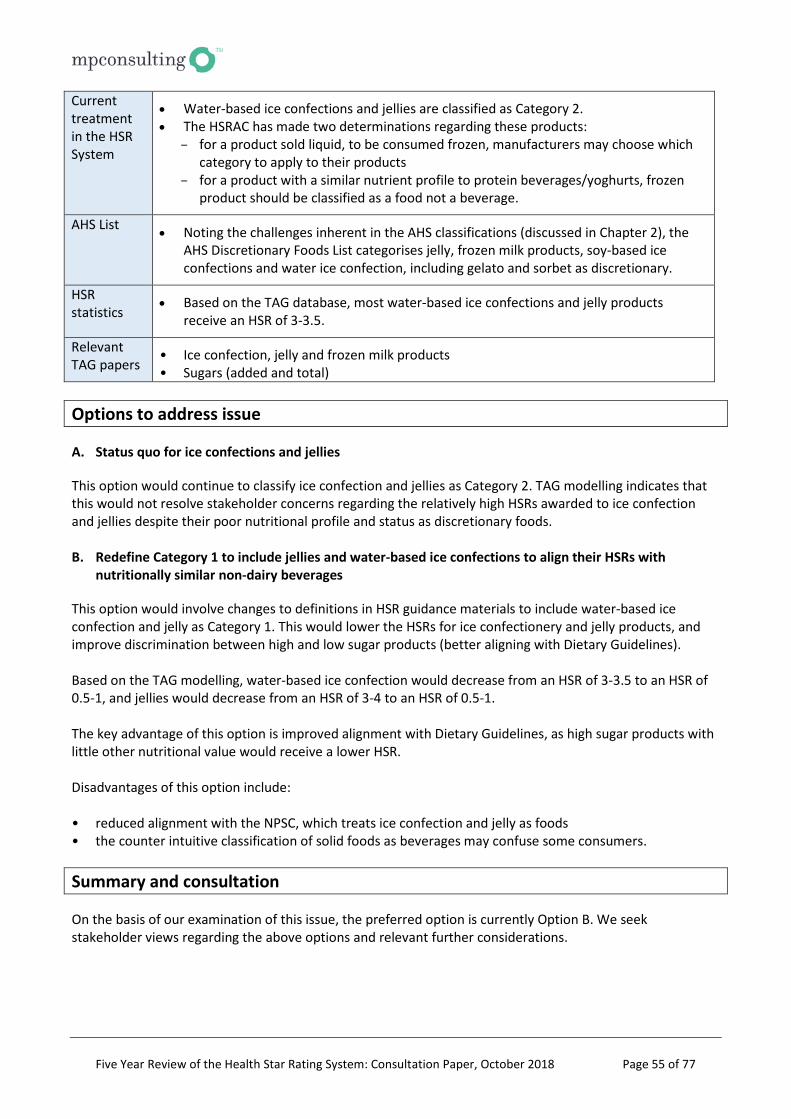
Five Year Review of the Health Star Rating System: Consultation Paper, October 2018 Page 55 of 77
Current treatment in the HSR System
• Water-based ice confections and jellies are classified as Category 2. • The HSRAC has made two determinations regarding these products:
– for a product sold liquid, to be consumed frozen, manufacturers may choose which category to apply to their products
– for a product with a similar nutrient profile to protein beverages/yoghurts, frozen product should be classified as a food not a beverage.
AHS List • Noting the challenges inherent in the AHS classifications (discussed in Chapter 2), the AHS Discretionary Foods List categorises jelly, frozen milk products, soy-based ice confections and water ice confection, including gelato and sorbet as discretionary.
HSR statistics
• Based on the TAG database, most water-based ice confections and jelly products receive an HSR of 3-3.5.
Relevant TAG papers
• Ice confection, jelly and frozen milk products • Sugars (added and total)
Options to address issue
A. Status quo for ice confections and jellies
This option would continue to classify ice confection and jellies as Category 2. TAG modelling indicates that this would not resolve stakeholder concerns regarding the relatively high HSRs awarded to ice confection and jellies despite their poor nutritional profile and status as discretionary foods. B. Redefine Category 1 to include jellies and water-based ice confections to align their HSRs with
nutritionally similar non-dairy beverages
This option would involve changes to definitions in HSR guidance materials to include water-based ice confection and jelly as Category 1. This would lower the HSRs for ice confectionery and jelly products, and improve discrimination between high and low sugar products (better aligning with Dietary Guidelines). Based on the TAG modelling, water-based ice confection would decrease from an HSR of 3-3.5 to an HSR of 0.5-1, and jellies would decrease from an HSR of 3-4 to an HSR of 0.5-1. The key advantage of this option is improved alignment with Dietary Guidelines, as high sugar products with little other nutritional value would receive a lower HSR. Disadvantages of this option include: • reduced alignment with the NPSC, which treats ice confection and jelly as foods • the counter intuitive classification of solid foods as beverages may confuse some consumers.
Summary and consultation
On the basis of our examination of this issue, the preferred option is currently Option B. We seek stakeholder views regarding the above options and relevant further considerations.
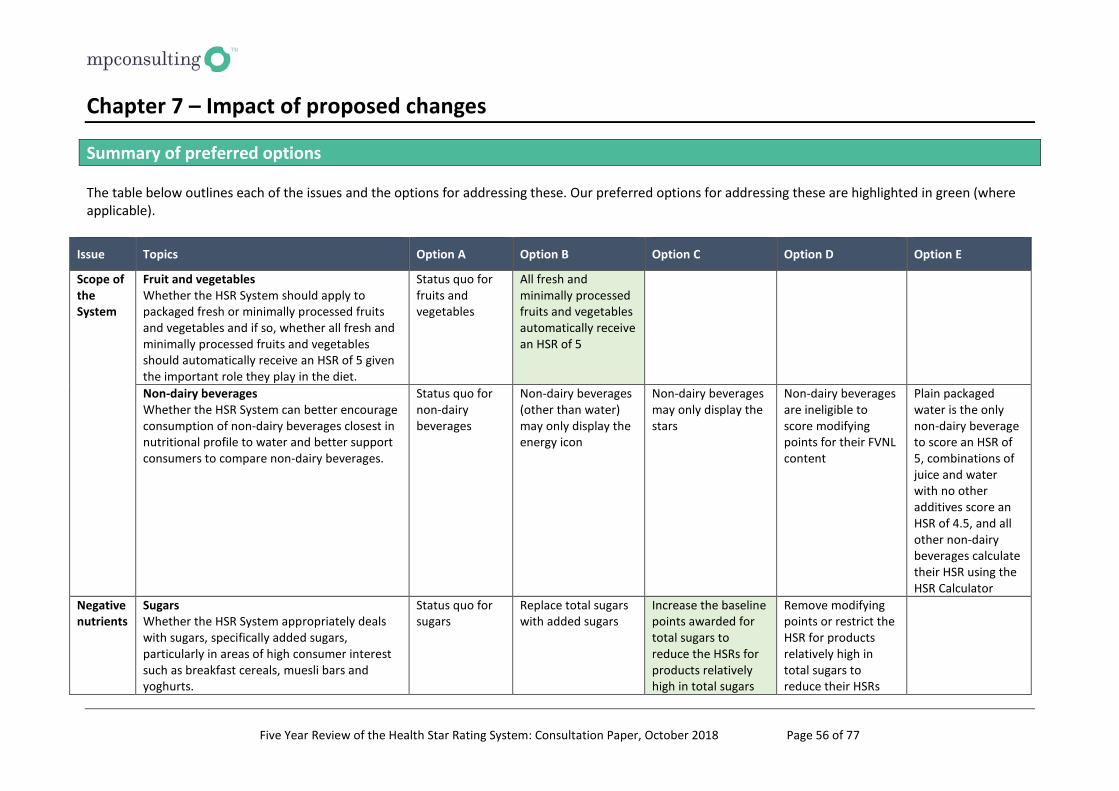
Five Year Review of the Health Star Rating System: Consultation Paper, October 2018 Page 56 of 77
Chapter 7 – Impact of proposed changes
Summary of preferred options The table below outlines each of the issues and the options for addressing these. Our preferred options for addressing these are highlighted in green (where applicable).
Issue Topics Option A Option B Option C Option D Option E
Scope of the System
Fruit and vegetables Whether the HSR System should apply to packaged fresh or minimally processed fruits and vegetables and if so, whether all fresh and minimally processed fruits and vegetables should automatically receive an HSR of 5 given the important role they play in the diet.
Status quo for fruits and vegetables
All fresh and minimally processed fruits and vegetables automatically receive an HSR of 5
Non-dairy beverages Whether the HSR System can better encourage consumption of non-dairy beverages closest in nutritional profile to water and better support consumers to compare non-dairy beverages.
Status quo for non-dairy beverages
Non-dairy beverages (other than water) may only display the energy icon
Non-dairy beverages may only display the stars
Non-dairy beverages are ineligible to score modifying points for their FVNL content
Plain packaged water is the only non-dairy beverage to score an HSR of 5, combinations of juice and water with no other additives score an HSR of 4.5, and all other non-dairy beverages calculate their HSR using the HSR Calculator
Negative nutrients
Sugars Whether the HSR System appropriately deals with sugars, specifically added sugars, particularly in areas of high consumer interest such as breakfast cereals, muesli bars and yoghurts.
Status quo for sugars
Replace total sugars with added sugars
Increase the baseline points awarded for total sugars to reduce the HSRs for products relatively high in total sugars
Remove modifying points or restrict the HSR for products relatively high in total sugars to reduce their HSRs
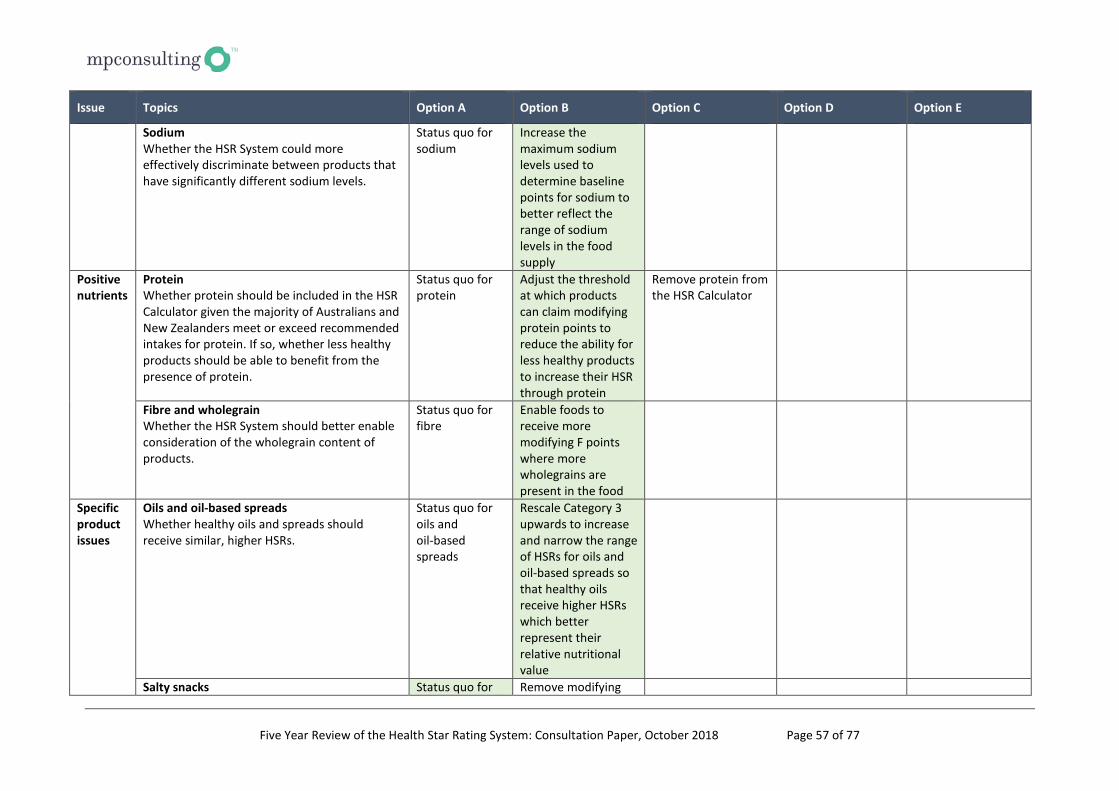
Five Year Review of the Health Star Rating System: Consultation Paper, October 2018 Page 57 of 77
Issue Topics Option A Option B Option C Option D Option E
Sodium Whether the HSR System could more effectively discriminate between products that have significantly different sodium levels.
Status quo for sodium
Increase the maximum sodium levels used to determine baseline points for sodium to better reflect the range of sodium levels in the food supply
Positive nutrients
Protein Whether protein should be included in the HSR Calculator given the majority of Australians and New Zealanders meet or exceed recommended intakes for protein. If so, whether less healthy products should be able to benefit from the presence of protein.
Status quo for protein
Adjust the threshold at which products can claim modifying protein points to reduce the ability for less healthy products to increase their HSR through protein
Remove protein from the HSR Calculator
Fibre and wholegrain Whether the HSR System should better enable consideration of the wholegrain content of products.
Status quo for fibre
Enable foods to receive more modifying F points where more wholegrains are present in the food
Specific product issues
Oils and oil-based spreads Whether healthy oils and spreads should receive similar, higher HSRs.
Status quo for oils and oil-based spreads
Rescale Category 3 upwards to increase and narrow the range of HSRs for oils and oil-based spreads so that healthy oils receive higher HSRs which better represent their relative nutritional value
Salty snacks Status quo for Remove modifying
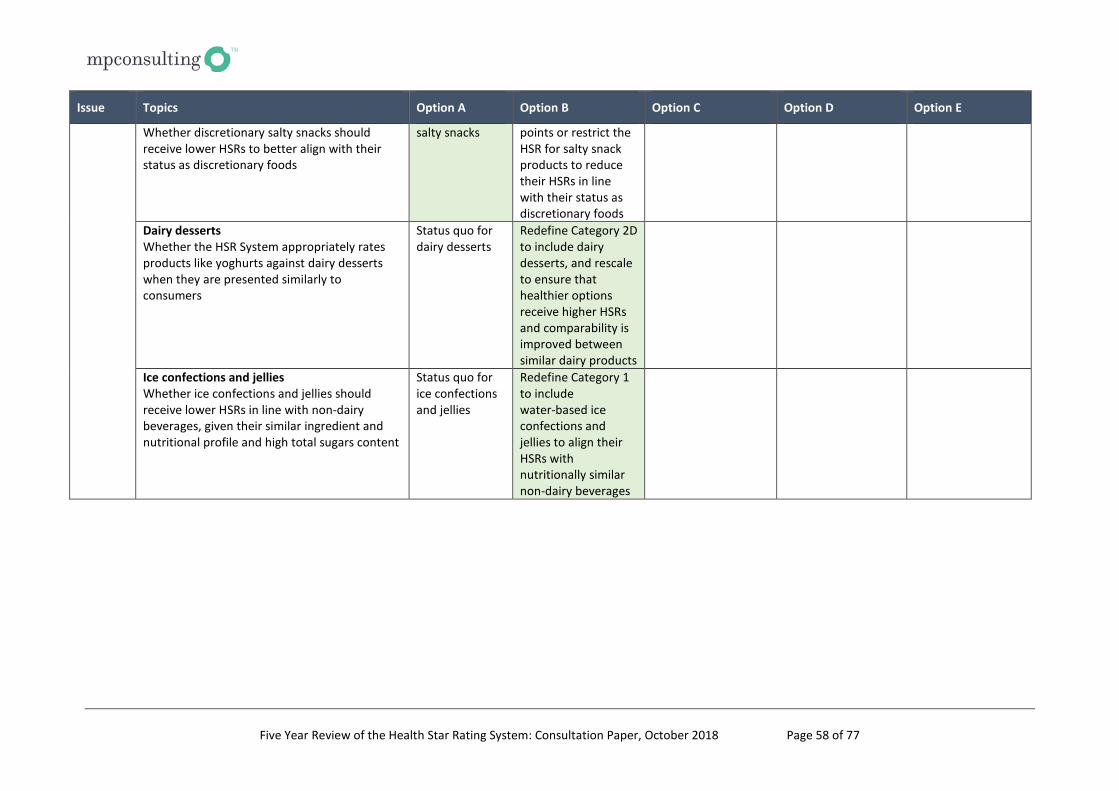
Five Year Review of the Health Star Rating System: Consultation Paper, October 2018 Page 58 of 77
Issue Topics Option A Option B Option C Option D Option E
Whether discretionary salty snacks should receive lower HSRs to better align with their status as discretionary foods
salty snacks points or restrict the HSR for salty snack products to reduce their HSRs in line with their status as discretionary foods
Dairy desserts Whether the HSR System appropriately rates products like yoghurts against dairy desserts when they are presented similarly to consumers
Status quo for dairy desserts
Redefine Category 2D to include dairy desserts, and rescale to ensure that healthier options receive higher HSRs and comparability is improved between similar dairy products
Ice confections and jellies Whether ice confections and jellies should receive lower HSRs in line with non-dairy beverages, given their similar ingredient and nutritional profile and high total sugars content
Status quo for ice confections and jellies
Redefine Category 1 to include water-based ice confections and jellies to align their HSRs with nutritionally similar non-dairy beverages
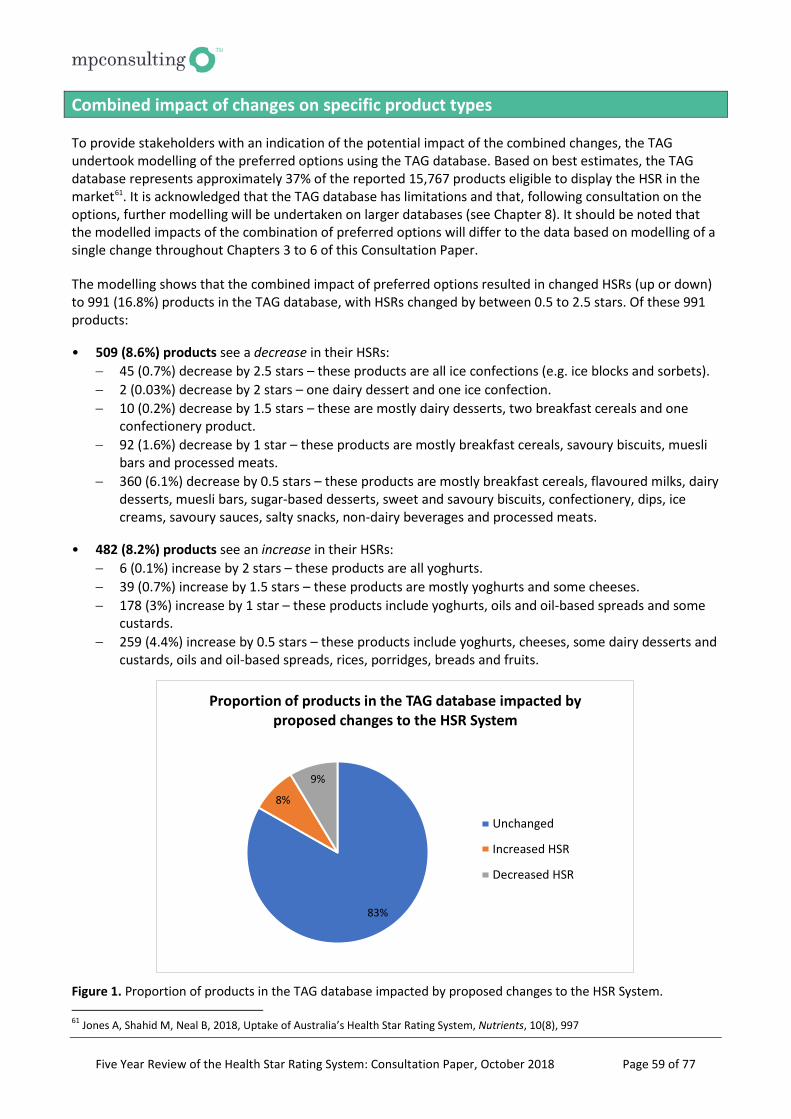
Five Year Review of the Health Star Rating System: Consultation Paper, October 2018 Page 59 of 77
Combined impact of changes on specific product types To provide stakeholders with an indication of the potential impact of the combined changes, the TAG undertook modelling of the preferred options using the TAG database. Based on best estimates, the TAG database represents approximately 37% of the reported 15,767 products eligible to display the HSR in the market61. It is acknowledged that the TAG database has limitations and that, following consultation on the options, further modelling will be undertaken on larger databases (see Chapter 8). It should be noted that the modelled impacts of the combination of preferred options will differ to the data based on modelling of a single change throughout Chapters 3 to 6 of this Consultation Paper. The modelling shows that the combined impact of preferred options resulted in changed HSRs (up or down) to 991 (16.8%) products in the TAG database, with HSRs changed by between 0.5 to 2.5 stars. Of these 991 products: • 509 (8.6%) products see a decrease in their HSRs:
− 45 (0.7%) decrease by 2.5 stars – these products are all ice confections (e.g. ice blocks and sorbets). − 2 (0.03%) decrease by 2 stars – one dairy dessert and one ice confection. − 10 (0.2%) decrease by 1.5 stars – these are mostly dairy desserts, two breakfast cereals and one
confectionery product. − 92 (1.6%) decrease by 1 star – these products are mostly breakfast cereals, savoury biscuits, muesli
bars and processed meats. − 360 (6.1%) decrease by 0.5 stars – these products are mostly breakfast cereals, flavoured milks, dairy
desserts, muesli bars, sugar-based desserts, sweet and savoury biscuits, confectionery, dips, ice creams, savoury sauces, salty snacks, non-dairy beverages and processed meats.
• 482 (8.2%) products see an increase in their HSRs:
− 6 (0.1%) increase by 2 stars – these products are all yoghurts. − 39 (0.7%) increase by 1.5 stars – these products are mostly yoghurts and some cheeses. − 178 (3%) increase by 1 star – these products include yoghurts, oils and oil-based spreads and some
custards. − 259 (4.4%) increase by 0.5 stars – these products include yoghurts, cheeses, some dairy desserts and
custards, oils and oil-based spreads, rices, porridges, breads and fruits.
Figure 1. Proportion of products in the TAG database impacted by proposed changes to the HSR System. 61 Jones A, Shahid M, Neal B, 2018, Uptake of Australia’s Health Star Rating System, Nutrients, 10(8), 997
83%
8%
9%
Proportion of products in the TAG database impacted by proposed changes to the HSR System
Unchanged
Increased HSR
Decreased HSR
Five Year Review of the Health Star Rating System: Consultation Paper, October 2018 Page 60 of 77
These impacts are outlined in more detail below. While this information represents changes across the products in the TAG database, not all of these products currently display the HSR. The actual labelling changes required as a result of any changes to the HSR System would be a subset of the products affected.
Increased HSRs
• All fresh and minimally processed packaged fruits and vegetables would automatically score an HSR of 5, increasing the HSRs for some fruits and vegetables HSRs by 0.5 to 1 star. − This would affect 50 products (53% of the unprocessed fruits and vegetables) in the TAG database. − This acknowledges the important role that fruits and vegetables play in the diet and means that no
product (including juice) would score higher than fresh or minimally processed fruits and vegetables. • The HSRs for oils and oil-based spreads would be increased by 0.5 to 1 star due to changes to rescale
Category 3. − This would affect 53 products (56% of the fats, oils and oil-based spreads) in the TAG database, with
the range of HSRs between 0.5 and 5. − Products high in saturated fats (such as butter) would receive HSR between 0.5 and 2 and oils and
oil-based spreads would receive HSRs between 3 and 5. − The increase in scores of healthy oils and spreads would enable consumers to better discriminate
between FFG and discretionary products, without impacting on those products that already receive low HSRs.
• The HSRs for some soft cheeses and yoghurts would be increased by 0.5 to 2 stars due to the redefining
and rescaling of Category 2D to account for dairy desserts. − This would affect 336 products (81% of the soft cheeses and yoghurts) in the TAG database, with the
range of HSRs between 0.5 and 5. − This would deliver higher HSRs for FFG dairy products and provide a better spread of relative ratings
across similar products, with those lower in saturated fat and total sugars receiving higher HSRs. − This would also ensure that less healthy, similar products do not score equal to or better than their
healthier counterparts. • The HSRs for some dairy desserts would also increase by 0.5 to 1 star due to the redefining and rescaling
of Category 2D to account for dairy desserts. − This would affect 36 products (44% of the custards/desserts) in the TAG database, with the range of
HSRs between 0.5 and 4.5. • The HSRs for some wholegrain rices, breads and breakfast cereals would be increased by 0.5 stars due to
the proportional loading added to fibre when wholegrain is present. − This would affect 25 products in the TAG database (less than 5% of the products for which
wholegrain content is known), targeting those with ≥ 40% wholegrain.
Decreased HSRs
• The HSRs for a number of breakfast cereals, particularly those higher in total sugars, would decrease by 0.5 to 1.5 stars. − This would affect 100 products (33% of the breakfast cereals) in the TAG database, with the range of
HSRs between 1.5 and 5.
Five Year Review of the Health Star Rating System: Consultation Paper, October 2018 Page 61 of 77
− Of these, 48 would decrease by 0.5 stars, 50 would decrease by 1 star and 2 would decrease by 1.5 stars.
− The average total sugars content of the breakfast cereal products affected is 20.6g/100g, indicating that those breakfast cereals higher in total sugars, and of particular concern to consumers, are effectively targeted by the proposed changes.
− This is a result of the stronger penalisation of total sugars, and the change to the threshold at which products can score modifying protein points.
• The HSRs for some non-dairy beverages would be reduced by 0.5 stars due to the stronger penalisation
of total sugars. − This would affect 11 products (3% of the non-dairy beverages) in the TAG database, with the range
of HSRs to between 0.5 and 5. − Products affected include some 100% fruit juices (reducing HSRs from 5 to 4.5, or 4.5 or 4), fruit
drinks, soft drinks and flavoured waters. − If the Option C was preferred option for non-dairy beverages such that the HSR was set at 4.5 for all
waters flavoured with juice or 100% juices, this would mean that the stronger penalisation of total sugars would not affect 100% juices, or waters flavoured only with juices (with no added sugars).
• The HSRs for some dairy desserts and flavoured milks would be reduced by 0.5 to 2 stars due to the
redefining and rescaling of Category 2D to account for dairy desserts, and the stronger penalisation of total sugars. − This would affect 13 flavoured milk products (3% of the dairy beverages) in the TAG database and 51
dairy desserts, including a cream and some cream cheeses, ice creams and custards (6% of the dairy dessert products) in the TAG database, with the range of HSRs between 0.5 and 5.
• The HSRs for some biscuits (both sweet and savoury) would be decreased by 0.5 to 1 star due to the
stronger penalisation of total sugars and high levels of sodium. − This would affect 41 products (16% of the biscuits) in the TAG database, with the range of HSRs
between 0.5 and 4.5. • The HSRs for some confectionery (mainly lollies) and bakery products would be decreased by 0.5 to 1
star due to stronger penalisation of total sugars. − This would affect 27 confectionery products (29% of the confectionery products) in the TAG
database and 18 cake/bakery products (15% of the bakery products) in the TAG database and with the range of HSRs between 0.5 and 2 for confectionery, and between 0.5 and 3.5 for bakery products.
• The HSRs for jellies and water-based ice confection would be decreased by 0.5 to 2.5 stars due to the
redefining and rescaling of Category 1, and stronger penalisation of total sugars. − This would affect 11 jellies (55% of the jelly products) in the TAG database and 46 water-based ice
confections (100% of the water-based ice confection products) in the TAG database, with the range of HSRs between 0.5 and 1.
• The HSRs for muesli or cereal style bars would be decreased by 0.5 to 1.5 stars due to the stronger
penalisation of total sugars, and the change to the threshold at which products can score modifying protein points. − This would affect 48 muesli or cereal style bars (36% of the muesli bar products) in the TAG
database, with the range of HSRs between 0.5 and 5. • The HSRs for some salty snacks would be decreased by 0.5 to 1.5 stars due to the stronger penalisation
of high sodium content, and the change to the threshold at which products can score modifying protein points.
Five Year Review of the Health Star Rating System: Consultation Paper, October 2018 Page 62 of 77
− This would affect 18 salty snacks including potato crisps, extruded snacks and popcorns (20% of the salty snack products) in the TAG database, with the range of HSRs between 0.5 and 5.
• The HSRs for some processed meats would be decreased by 0.5 to 1 star due to the stronger treatment
of high sodium content, and the change to the threshold at which products can score modifying protein points. − This would affect 27 processed meats, mostly hams, bacons and deli meats (8% of the meat
products) in the TAG database, with the range of HSRs between 0.5 and 3.5. • Other changes include reductions in the HSRs of some:
− jams, spreads, mayonnaises, dressings, savoury sauces and relishes (due to stronger treatment of total sugars and high levels of sodium)
− ready meals and meal bases (due to the change to the threshold at which products can score modifying protein points and stronger treatment of high levels of sodium)
− dips (due to the change to the threshold at which products can score modifying protein points) − stocks and seasonings (due to stronger treatment of high levels of sodium).
Appendix 3 and Appendix 4 provide more detailed data regarding the impact of the preferred options on specific product types.
Combined effect of changes In combination, the changes: • better distinguish FFG and discretionary foods • support consumers to better distinguish between similar products • encourage further reformulation by incentivising realistic decreases in negative components and/or
increases in positive components to retain or increase a product’s HSR • decrease the HSRs of foods relatively high in total sugars (such as certain breakfast cereals, muesli and
cereal bars and flavoured milks and yoghurts of particular concern to consumers) • increase the HSRs of some FFG products such as fruits and vegetables, wholegrain rices, wholegrain
breads and wholegrain breakfast cereals, yoghurts and cheeses. The impact of the changes in terms of labelling modifications required, depends on the level of HSR uptake for different products and therefore the number of products for which changes need to be made. Based on data from the George Institute’s FoodSwitch database and the categories of foods most likely to be impacted by the proposed changes, the following is a summary of HSR uptake across those categories: • 44.4% of eligible convenience foods display the HSR • 36.7% of eligible cereal and grain products display the HSR • 35% of eligible fruit and vegetable products display the HSR • 29.5% of eligible non-dairy beverage products display the HSR • 29.2% of eligible meat products display the HSR • 28.7% of eligible confectionery products display the HSR • 26.7% of eligible bread and bakery products display the HSR • 20.1% of eligible dairy products display the HSR • 18.3% of eligible snack products display the HSR • 18% of eligible oil products display the HSR • 14.2% of eligible sauces, dressing and dip products display the HSR.
Five Year Review of the Health Star Rating System: Consultation Paper, October 2018 Page 63 of 77
Chapter 8 – Next steps
We are seeking stakeholder feedback on the options presented in this Consultation Paper. You can provide feedback through the Department of Health’s Consultation Hub. Consultation closes on 23 November 2018. mpconsulting will also be facilitating public forums seeking stakeholder feedback regarding the issues raised in this Consultation Paper in: • Sydney on Wednesday, 14 November 2018 • Auckland on Friday, 16 November 2018 • Melbourne on Monday, 19 November 2018. To register your attendance at the forums, please visit the HSR website. As a result of the consultation, we anticipate being able to narrow the range of viable options. We will also explore ways to model the combination of preferred changes on larger datasets. We intend to do this by: • working with the National Heart Foundation to explore modelling options using the FoodTrack database
− FoodTrack is a food and nutrient database developed by the Heart Foundation in conjunction with the CSIRO. It supports the collection and monitoring of nutrition and product data for foods and beverages in Australian supermarkets. The database contains product data from fresh and packaged foods in major Australian supermarkets such as product descriptors, NIP information, ingredient lists, front-of-pack labels and images of the product. Data is updated on an annual basis.
• working with the George Institute for Global Health to explore modelling options using the FoodSwitch database − The Australian FoodSwitch database comprises information including images of food packaging,
front-of-pack label, nutrient declarations, ingredients list, manufacturer details, and estimated HSR value where this information is not provided directly by the manufacturer. Information is sourced through in-store surveys conducted annually at the same four supermarkets in metropolitan Sydney (Coles, Woolworths, Aldi and IGA). This annual collection is referred to as the FoodSwitch Monitoring Dataset. When combined with additional product information either provided directly by the food industry or sourced through crowd-sourcing via the FoodSwitch smartphone application, it forms the Full FoodSwitch Database.
• working with the University of Auckland to explore modelling options using the New Zealand Nutritrack database − The New Zealand Nutritrack database comprises annually-updated information on packaged foods
and beverages in New Zealand including images of food packaging, barcode and brand, all nutrient values on the NIP, ingredients list, and front-of-pack nutrition labels. Information is sourced from annual in-store surveys in the same four supermarkets in Auckland (Countdown, New World, PAK’nSAVE, and 4Square). Estimated HSR values and eligibility to display a health claim (using FSANZ NPSC) are calculated automatically for each product. The full Nutritrack database holds information on approximately 88,000 packaged products. The 2018 database (one year only) contains information for 15,193 products.
• examining market penetration of the HSR System based on sales weighted data in both Australia and New Zealand.
We propose detailing the results of further modelling in a draft Review Report that will be made available for public consultation in early 2019.
Five Year Review of the Health Star Rating System: Consultation Paper, October 2018 Page 64 of 77
Appendix 1 – The HSR Calculator
Overview The Food Standards Code (the Code) requires most packaged foods to display a Nutrition Information Panel (NIP) providing mandatory information on the average quantity per 100g or 100mL of energy, protein, total fat, saturated fat, carbohydrate, sugars and sodium. The HSR System complements the NIP by providing interpretive information on the front of packaged food products. The HSR Calculator awards a star rating based on the quantity of specific components within the product. These components are: • risk components: energy, saturated fat, total sugars and sodium • positive components: protein, dietary fibre, and fruit, vegetable, nut and legume (FVNL) content. The HSR System has been optimised for application to packaged food and beverage products presented for retail sale through supermarkets and similar retail outlets.
How the HSR Calculator works The HSR Calculator is used by industry to determine the HSR for products. The following is a simplified outline of how the HSR Calculator works. For a comprehensive description of the HSR Calculator, please refer to the Industry Guide on the HSR website. 1. Determine the category of food. The six categories of foods in the HSR Calculator are: • Category 1 – Non-dairy beverages
− E.g. fruit and vegetables juices, cordials, flavoured waters, soft drinks • Category 1D – Dairy beverages and alternatives with calcium content ≥ 80mg per 100g
− E.g. milk, flavoured milk, soy milk, nut milk • Category 2 – All foods not included in Category 1, 1D, 2D, 3 or 3D
− E.g. packaged fruits and vegetables, rice, quinoa, breakfast cereals, muesli bars, ready to eat meals, biscuits, chips, confectionery, salty snacks, dairy desserts, ice confections and jellies
• Category 2D – All dairy foods and alternatives not included in Category 1D or 3D − E.g. yoghurts, cheese with calcium content ≤ 320mg per 100g
• Category 3 – Oils and spreads − E.g. olive oil, coconut oil, butter, margarine, peanut butter
• Category 3D – Cheeses and alternatives − E.g. cheese with calcium content more than 320mg per 100g
2. Determine the form of the food for the HSR62 The HSR (and hence nutrient content values used to determine it) should apply to the form of the food as determined in accordance with the following: • the food as sold if the food can be either prepared with other foods or consumed as sold 62 The Forum agreed in June 2018 to limit the application of the HSR System to the product ‘as sold.’ This decision will be implemented alongside and in the context of the Review.
Five Year Review of the Health Star Rating System: Consultation Paper, October 2018 Page 65 of 77
• the food as prepared if the food is required to be prepared and consumed according to directions on the label
• the food after it is reconstituted with water and ready for consumption if the food requires reconstituting with water, or
• the food after it is drained and ready for consumption if the food requires draining before consuming. The HSR should be based on the form of food for which the NIP information has been displayed. 3. Calculate HSR baseline points HSR baseline points are calculated for the average quantity risk-associated components per 100 g or 100 mL of the product (based on the units used in the NIP): • energy up to a maximum of 11 points for more than 3685 kJ per 100 g/mL of a product for all Categories • saturated fat up to a maximum of 30 points for more than 90% saturated fat in a product for all
Categories • total sugars up to a maximum of 22 points for more than 99% total sugars in a product for Category 1,
1D, 2 and 2D, and up to a maximum of 10 points for more than 45% total sugars in a product for Category 3 and 3D
• sodium up to a maximum of 30 points for more than 8.106% sodium in a product for Category 1, 1D, 2 and 2D, and up to a maximum of 30 points for more than 2.7% sodium in a product for Category 3 and 3D.
Baseline points are calculated based on the points tables which can be found in the Industry Guide. 4. Calculate HSR modifying points HSR modifying points may be scored for the positive components in a product: • V points can be scored for the amount of fruits, nuts, vegetables and legumes (FVNL) or concentrated
fruit and vegetable content in a food – from 1 point (for > 40% FVNL or > 25% concentrated fruit and vegetable content) to a maximum of 8 points (for 100% FVNL/concentrated fruit and vegetable content)
• P points can be scored for the amount of protein in a product, only if the product scores 13 or less baseline points, or scores more than 13 baseline points but also scores 5 or more V points – from 1 up to a maximum of 15 points for more than 50% protein
• F points can be scored for the amount of dietary fibre in a product for Category 2, 2D, 3 and 3D foods only (i.e. beverages cannot score F points) – from 1 up to a maximum of 15 points for more than 20% fibre.
5. Calculate the final HSR score The Final HSR Score is calculated by subtracting the modifying points (V, P and/or F points) from the HSR baseline points, using the below formula: Final HSR Score = baseline points – (V points) – (P points) – (F points) 6. Step 6: Assignment of a rating to food based on the final HSR score The HSR score is determined based on the Final HSR Score and the Category the product is in. Products can score from half a star (least healthy) to five stars (most healthy) in half-star increments (i.e. on a 10 point scale).
Five Year Review of the Health Star Rating System: Consultation Paper, October 2018 Page 66 of 77
Appendix 2 – The TAG database
Prior to the implementation of the HSR System, the Technical Design Working Group established a database of foods against which the System could be tested. Since that time the database has been updated and expanded with data provided by the food industry. The TAG database currently includes data for 5,885 products across 42 categories based on the AGHE food groups (e.g. fats and oils, various cereals and dairy, processed and unprocessed fruits and vegetables, animal and vegetable protein, etc.). While there are challenges inherent in estimating the total number of products eligible to display the HSR on the market at any given time, based on best estimates, the TAG database represents approximately 37% of the reported 15,767 eligible products (2018).63 It is acknowledged that there are a number of limitations with the TAG database. For example: • industry data were provided on a confidential basis and the database is not directly available to the
Review. We do, however, acknowledge the significant work of the TAG and the Department undertaking modelling to inform the Review
• the data have not been independently verified • data are lacking for some categories. For example:
− while calcium values were provided for 960 products in 29 AGHE categories (representing most FFG dairy categories) calcium values are limited for non-dairy categories
− wholegrain values were provided for 1,258 products across 36 AGHE categories but most of these products did not have an appreciable amount of wholegrain. Modelling regarding wholegrain was therefore restricted to 596 foods across the most relevant categories (FFG cereals and relevant discretionary foods categories). While most of the key foods of interest (i.e. breads, breakfast cereals, pasta/flour/grains, sweet and savoury biscuits, snacks) are well represented, data are lacking for bakery/cake mixes
− additional information was provided by food manufacturers on the added sugars content of 1,875 foods and beverages using the WHO definition for ‘free sugars’. Almost all 42 AGHE categories are represented, with good coverage of most key categories (e.g. breakfast cereals, dairy beverages, biscuits, sauces/condiments, soups/stocks, ice confectionery, ice cream, snacks). However, added sugars data for non-dairy beverages and some other relevant foods (e.g. yoghurts/soft cheeses, custards/dairy desserts, confectionery, meals/meal bases) are limited.
As noted in Chapter 8, there are other databases which could be drawn on to model options. These databases also have strengths and limitations and comparisons cannot always be reliably made across databases. For example: • different databases apply different food categorisation systems • given the diversity of the food supply and its constant evolution, databases that represent different data
collection periods will necessarily return different results • some collections are cumulative (i.e. with new products added each year) whereas others remove
products no longer found in supermarkets from the database • for nutrients not included on the NIP, some databases use estimates for the purposes of calculating the
HSR (for example, estimates of FVNL content based on ingredients). The challenges inherent in modelling changes to the HSR System have been well canvassed during consultations informing the Review and will be acknowledged as part of our draft Review Report. 63 Jones A, Shahid M, Neal B, 2018, Uptake of Australia’s Health Star Rating System, Nutrients, 10(8), 997
Five Year Review of the Health Star Rating System: Consultation Paper, October 2018 Page 67 of 77
However, as noted in Chapter 8, once the range of possible options has been narrowed (informed by feedback from consultations on this Consultation Paper) we intend working with other organisations to further test changes to the HSR System. Key results will be detailed in the draft Review Report, which will be available for further consultation in early 2019.
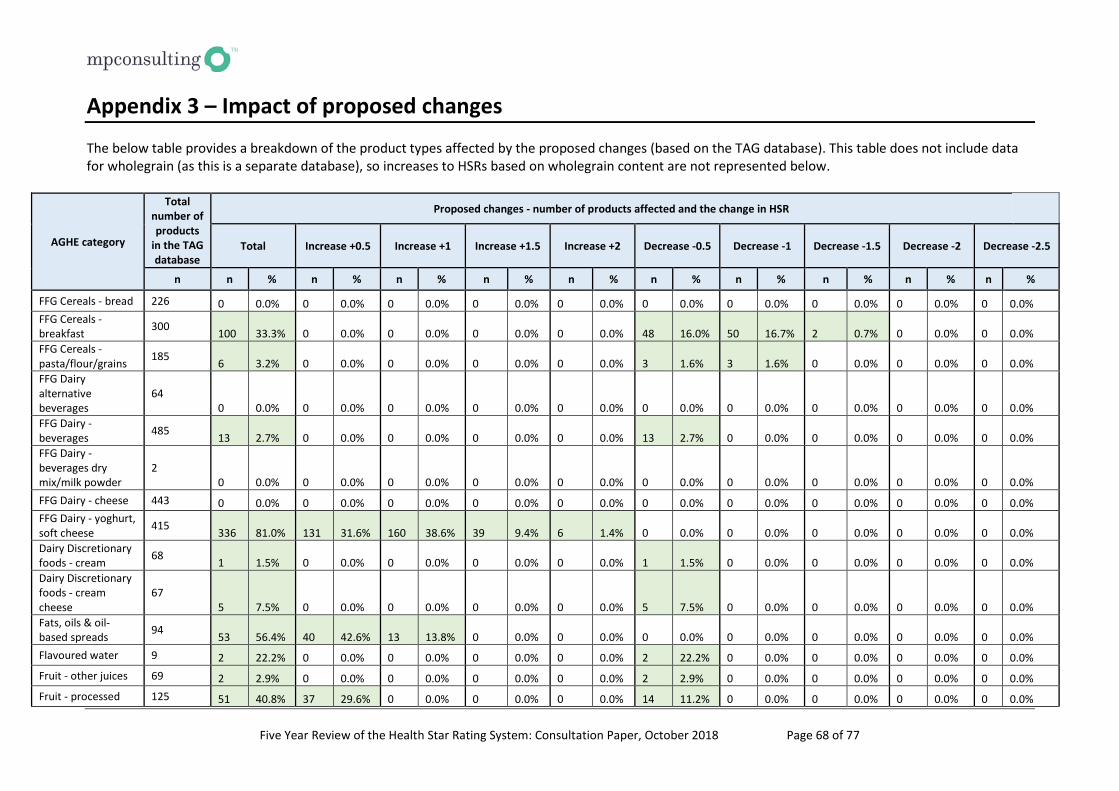
Five Year Review of the Health Star Rating System: Consultation Paper, October 2018 Page 68 of 77
Appendix 3 – Impact of proposed changes
The below table provides a breakdown of the product types affected by the proposed changes (based on the TAG database). This table does not include data for wholegrain (as this is a separate database), so increases to HSRs based on wholegrain content are not represented below.
AGHE category
Total number of products
in the TAG database
Proposed changes - number of products affected and the change in HSR
Total Increase +0.5 Increase +1 Increase +1.5 Increase +2 Decrease -0.5 Decrease -1 Decrease -1.5 Decrease -2 Decrease -2.5
n n % n % n % n % n % n % n % n % n % n %
FFG Cereals - bread 226 0 0.0% 0 0.0% 0 0.0% 0 0.0% 0 0.0% 0 0.0% 0 0.0% 0 0.0% 0 0.0% 0 0.0% FFG Cereals - breakfast 300 100 33.3% 0 0.0% 0 0.0% 0 0.0% 0 0.0% 48 16.0% 50 16.7% 2 0.7% 0 0.0% 0 0.0% FFG Cereals - pasta/flour/grains 185 6 3.2% 0 0.0% 0 0.0% 0 0.0% 0 0.0% 3 1.6% 3 1.6% 0 0.0% 0 0.0% 0 0.0% FFG Dairy alternative beverages
64 0 0.0% 0 0.0% 0 0.0% 0 0.0% 0 0.0% 0 0.0% 0 0.0% 0 0.0% 0 0.0% 0 0.0%
FFG Dairy - beverages 485 13 2.7% 0 0.0% 0 0.0% 0 0.0% 0 0.0% 13 2.7% 0 0.0% 0 0.0% 0 0.0% 0 0.0% FFG Dairy - beverages dry mix/milk powder
2 0 0.0% 0 0.0% 0 0.0% 0 0.0% 0 0.0% 0 0.0% 0 0.0% 0 0.0% 0 0.0% 0 0.0%
FFG Dairy - cheese 443 0 0.0% 0 0.0% 0 0.0% 0 0.0% 0 0.0% 0 0.0% 0 0.0% 0 0.0% 0 0.0% 0 0.0% FFG Dairy - yoghurt, soft cheese 415 336 81.0% 131 31.6% 160 38.6% 39 9.4% 6 1.4% 0 0.0% 0 0.0% 0 0.0% 0 0.0% 0 0.0% Dairy Discretionary foods - cream 68 1 1.5% 0 0.0% 0 0.0% 0 0.0% 0 0.0% 1 1.5% 0 0.0% 0 0.0% 0 0.0% 0 0.0% Dairy Discretionary foods - cream cheese
67 5 7.5% 0 0.0% 0 0.0% 0 0.0% 0 0.0% 5 7.5% 0 0.0% 0 0.0% 0 0.0% 0 0.0%
Fats, oils & oil-based spreads 94 53 56.4% 40 42.6% 13 13.8% 0 0.0% 0 0.0% 0 0.0% 0 0.0% 0 0.0% 0 0.0% 0 0.0% Flavoured water 9 2 22.2% 0 0.0% 0 0.0% 0 0.0% 0 0.0% 2 22.2% 0 0.0% 0 0.0% 0 0.0% 0 0.0% Fruit - other juices 69 2 2.9% 0 0.0% 0 0.0% 0 0.0% 0 0.0% 2 2.9% 0 0.0% 0 0.0% 0 0.0% 0 0.0% Fruit - processed 125 51 40.8% 37 29.6% 0 0.0% 0 0.0% 0 0.0% 14 11.2% 0 0.0% 0 0.0% 0 0.0% 0 0.0%
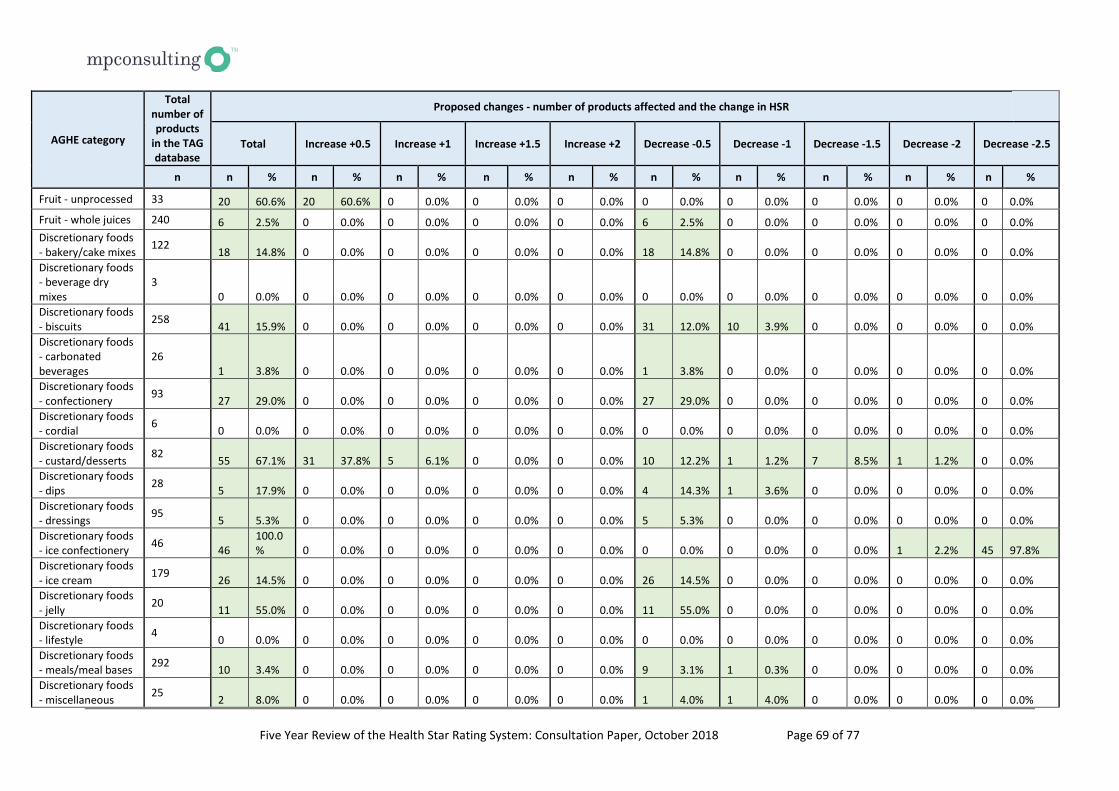
Five Year Review of the Health Star Rating System: Consultation Paper, October 2018 Page 69 of 77
AGHE category
Total number of products
in the TAG database
Proposed changes - number of products affected and the change in HSR
Total Increase +0.5 Increase +1 Increase +1.5 Increase +2 Decrease -0.5 Decrease -1 Decrease -1.5 Decrease -2 Decrease -2.5
n n % n % n % n % n % n % n % n % n % n %
Fruit - unprocessed 33 20 60.6% 20 60.6% 0 0.0% 0 0.0% 0 0.0% 0 0.0% 0 0.0% 0 0.0% 0 0.0% 0 0.0% Fruit - whole juices 240 6 2.5% 0 0.0% 0 0.0% 0 0.0% 0 0.0% 6 2.5% 0 0.0% 0 0.0% 0 0.0% 0 0.0% Discretionary foods - bakery/cake mixes 122 18 14.8% 0 0.0% 0 0.0% 0 0.0% 0 0.0% 18 14.8% 0 0.0% 0 0.0% 0 0.0% 0 0.0% Discretionary foods - beverage dry mixes
3 0 0.0% 0 0.0% 0 0.0% 0 0.0% 0 0.0% 0 0.0% 0 0.0% 0 0.0% 0 0.0% 0 0.0%
Discretionary foods - biscuits 258 41 15.9% 0 0.0% 0 0.0% 0 0.0% 0 0.0% 31 12.0% 10 3.9% 0 0.0% 0 0.0% 0 0.0% Discretionary foods - carbonated beverages
26 1 3.8% 0 0.0% 0 0.0% 0 0.0% 0 0.0% 1 3.8% 0 0.0% 0 0.0% 0 0.0% 0 0.0%
Discretionary foods - confectionery 93 27 29.0% 0 0.0% 0 0.0% 0 0.0% 0 0.0% 27 29.0% 0 0.0% 0 0.0% 0 0.0% 0 0.0% Discretionary foods - cordial 6 0 0.0% 0 0.0% 0 0.0% 0 0.0% 0 0.0% 0 0.0% 0 0.0% 0 0.0% 0 0.0% 0 0.0% Discretionary foods - custard/desserts 82 55 67.1% 31 37.8% 5 6.1% 0 0.0% 0 0.0% 10 12.2% 1 1.2% 7 8.5% 1 1.2% 0 0.0% Discretionary foods - dips 28 5 17.9% 0 0.0% 0 0.0% 0 0.0% 0 0.0% 4 14.3% 1 3.6% 0 0.0% 0 0.0% 0 0.0% Discretionary foods - dressings 95 5 5.3% 0 0.0% 0 0.0% 0 0.0% 0 0.0% 5 5.3% 0 0.0% 0 0.0% 0 0.0% 0 0.0% Discretionary foods - ice confectionery 46 46
100.0% 0 0.0% 0 0.0% 0 0.0% 0 0.0% 0 0.0% 0 0.0% 0 0.0% 1 2.2% 45 97.8%
Discretionary foods - ice cream 179 26 14.5% 0 0.0% 0 0.0% 0 0.0% 0 0.0% 26 14.5% 0 0.0% 0 0.0% 0 0.0% 0 0.0% Discretionary foods - jelly 20 11 55.0% 0 0.0% 0 0.0% 0 0.0% 0 0.0% 11 55.0% 0 0.0% 0 0.0% 0 0.0% 0 0.0% Discretionary foods - lifestyle 4 0 0.0% 0 0.0% 0 0.0% 0 0.0% 0 0.0% 0 0.0% 0 0.0% 0 0.0% 0 0.0% 0 0.0% Discretionary foods - meals/meal bases 292 10 3.4% 0 0.0% 0 0.0% 0 0.0% 0 0.0% 9 3.1% 1 0.3% 0 0.0% 0 0.0% 0 0.0% Discretionary foods - miscellaneous 25 2 8.0% 0 0.0% 0 0.0% 0 0.0% 0 0.0% 1 4.0% 1 4.0% 0 0.0% 0 0.0% 0 0.0%
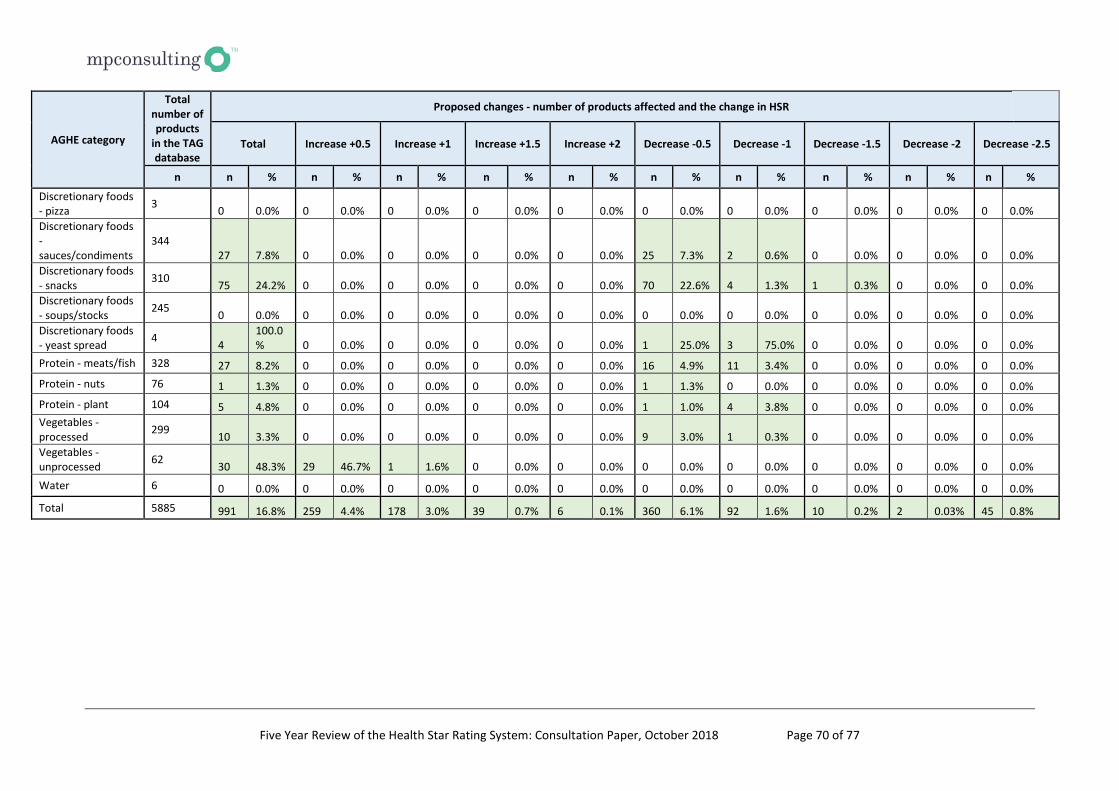
Five Year Review of the Health Star Rating System: Consultation Paper, October 2018 Page 70 of 77
AGHE category
Total number of products
in the TAG database
Proposed changes - number of products affected and the change in HSR
Total Increase +0.5 Increase +1 Increase +1.5 Increase +2 Decrease -0.5 Decrease -1 Decrease -1.5 Decrease -2 Decrease -2.5
n n % n % n % n % n % n % n % n % n % n %
Discretionary foods - pizza 3 0 0.0% 0 0.0% 0 0.0% 0 0.0% 0 0.0% 0 0.0% 0 0.0% 0 0.0% 0 0.0% 0 0.0% Discretionary foods - sauces/condiments
344 27 7.8% 0 0.0% 0 0.0% 0 0.0% 0 0.0% 25 7.3% 2 0.6% 0 0.0% 0 0.0% 0 0.0%
Discretionary foods - snacks 310 75 24.2% 0 0.0% 0 0.0% 0 0.0% 0 0.0% 70 22.6% 4 1.3% 1 0.3% 0 0.0% 0 0.0% Discretionary foods - soups/stocks 245 0 0.0% 0 0.0% 0 0.0% 0 0.0% 0 0.0% 0 0.0% 0 0.0% 0 0.0% 0 0.0% 0 0.0% Discretionary foods - yeast spread 4 4
100.0% 0 0.0% 0 0.0% 0 0.0% 0 0.0% 1 25.0% 3 75.0% 0 0.0% 0 0.0% 0 0.0%
Protein - meats/fish 328 27 8.2% 0 0.0% 0 0.0% 0 0.0% 0 0.0% 16 4.9% 11 3.4% 0 0.0% 0 0.0% 0 0.0% Protein - nuts 76 1 1.3% 0 0.0% 0 0.0% 0 0.0% 0 0.0% 1 1.3% 0 0.0% 0 0.0% 0 0.0% 0 0.0% Protein - plant 104 5 4.8% 0 0.0% 0 0.0% 0 0.0% 0 0.0% 1 1.0% 4 3.8% 0 0.0% 0 0.0% 0 0.0% Vegetables - processed 299 10 3.3% 0 0.0% 0 0.0% 0 0.0% 0 0.0% 9 3.0% 1 0.3% 0 0.0% 0 0.0% 0 0.0% Vegetables - unprocessed 62 30 48.3% 29 46.7% 1 1.6% 0 0.0% 0 0.0% 0 0.0% 0 0.0% 0 0.0% 0 0.0% 0 0.0% Water 6 0 0.0% 0 0.0% 0 0.0% 0 0.0% 0 0.0% 0 0.0% 0 0.0% 0 0.0% 0 0.0% 0 0.0%
Total 5885 991 16.8% 259 4.4% 178 3.0% 39 0.7% 6 0.1% 360 6.1% 92 1.6% 10 0.2% 2 0.03% 45 0.8%
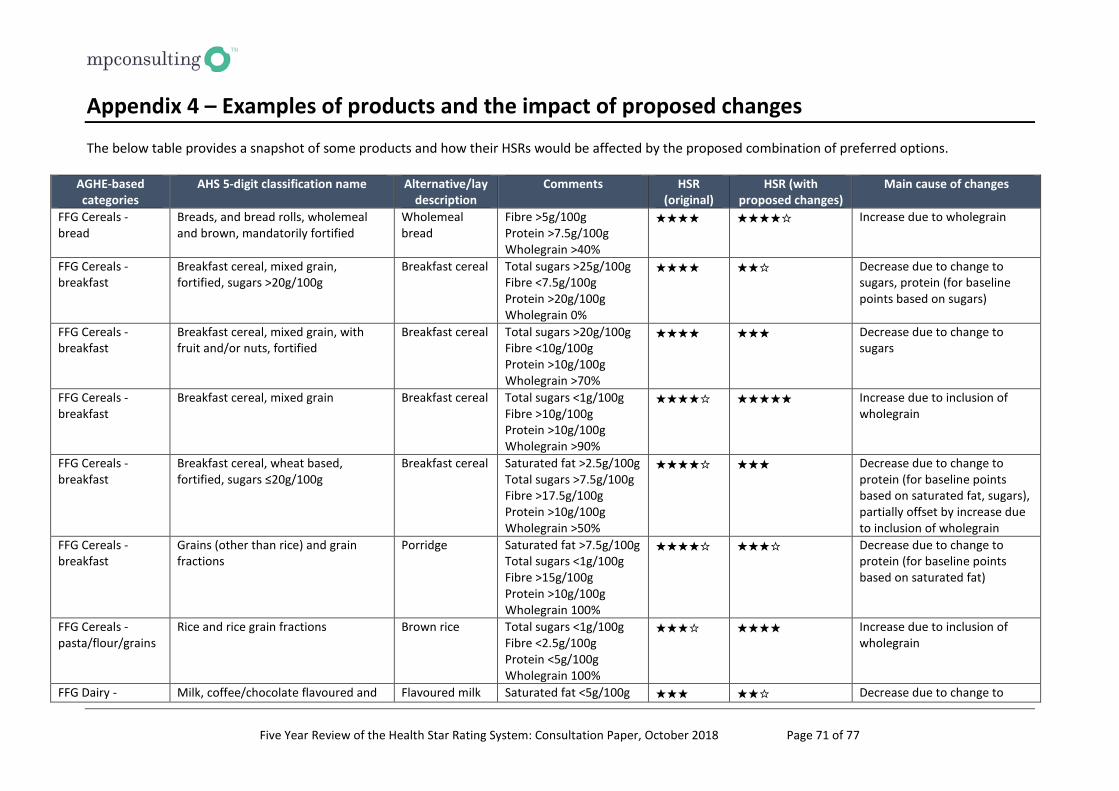
Five Year Review of the Health Star Rating System: Consultation Paper, October 2018 Page 71 of 77
Appendix 4 – Examples of products and the impact of proposed changes
The below table provides a snapshot of some products and how their HSRs would be affected by the proposed combination of preferred options.
AGHE-based categories
AHS 5-digit classification name Alternative/lay description
Comments HSR (original)
HSR (with proposed changes)
Main cause of changes
FFG Cereals - bread
Breads, and bread rolls, wholemeal and brown, mandatorily fortified
Wholemeal bread
Fibre >5g/100g Protein >7.5g/100g Wholegrain >40%
★★★★ ★★★★☆ Increase due to wholegrain
FFG Cereals - breakfast
Breakfast cereal, mixed grain, fortified, sugars >20g/100g
Breakfast cereal Total sugars >25g/100g Fibre <7.5g/100g Protein >20g/100g Wholegrain 0%
★★★★ ★★☆ Decrease due to change to sugars, protein (for baseline points based on sugars)
FFG Cereals - breakfast
Breakfast cereal, mixed grain, with fruit and/or nuts, fortified
Breakfast cereal Total sugars >20g/100g Fibre <10g/100g Protein >10g/100g Wholegrain >70%
★★★★ ★★★ Decrease due to change to sugars
FFG Cereals - breakfast
Breakfast cereal, mixed grain Breakfast cereal Total sugars <1g/100g Fibre >10g/100g Protein >10g/100g Wholegrain >90%
★★★★☆ ★★★★★ Increase due to inclusion of wholegrain
FFG Cereals - breakfast
Breakfast cereal, wheat based, fortified, sugars ≤20g/100g
Breakfast cereal Saturated fat >2.5g/100g Total sugars >7.5g/100g Fibre >17.5g/100g Protein >10g/100g Wholegrain >50%
★★★★☆ ★★★ Decrease due to change to protein (for baseline points based on saturated fat, sugars), partially offset by increase due to inclusion of wholegrain
FFG Cereals - breakfast
Grains (other than rice) and grain fractions
Porridge Saturated fat >7.5g/100g Total sugars <1g/100g Fibre >15g/100g Protein >10g/100g Wholegrain 100%
★★★★☆ ★★★☆ Decrease due to change to protein (for baseline points based on saturated fat)
FFG Cereals - pasta/flour/grains
Rice and rice grain fractions Brown rice Total sugars <1g/100g Fibre <2.5g/100g Protein <5g/100g Wholegrain 100%
★★★☆ ★★★★ Increase due to inclusion of wholegrain
FFG Dairy - Milk, coffee/chocolate flavoured and Flavoured milk Saturated fat <5g/100g ★★★ ★★☆ Decrease due to change to
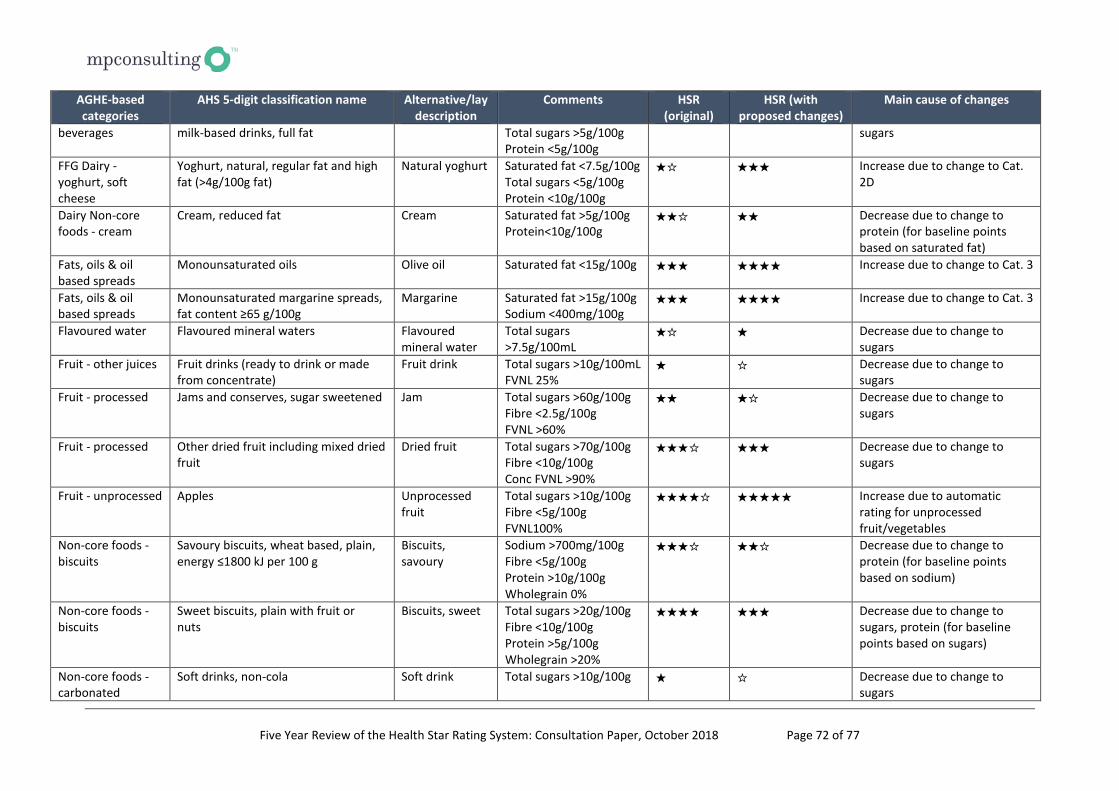
Five Year Review of the Health Star Rating System: Consultation Paper, October 2018 Page 72 of 77
AGHE-based categories
AHS 5-digit classification name Alternative/lay description
Comments HSR (original)
HSR (with proposed changes)
Main cause of changes
beverages milk-based drinks, full fat Total sugars >5g/100g Protein <5g/100g
sugars
FFG Dairy - yoghurt, soft cheese
Yoghurt, natural, regular fat and high fat (>4g/100g fat)
Natural yoghurt Saturated fat <7.5g/100g Total sugars <5g/100g Protein <10g/100g
★☆ ★★★ Increase due to change to Cat. 2D
Dairy Non-core foods - cream
Cream, reduced fat Cream Saturated fat >5g/100g Protein<10g/100g
★★☆ ★★ Decrease due to change to protein (for baseline points based on saturated fat)
Fats, oils & oil based spreads
Monounsaturated oils Olive oil Saturated fat <15g/100g ★★★ ★★★★ Increase due to change to Cat. 3
Fats, oils & oil based spreads
Monounsaturated margarine spreads, fat content ≥65 g/100g
Margarine Saturated fat >15g/100g Sodium <400mg/100g
★★★ ★★★★ Increase due to change to Cat. 3
Flavoured water Flavoured mineral waters Flavoured mineral water
Total sugars >7.5g/100mL
★☆ ★ Decrease due to change to sugars
Fruit - other juices Fruit drinks (ready to drink or made from concentrate)
Fruit drink Total sugars >10g/100mL FVNL 25%
★ ☆ Decrease due to change to sugars
Fruit - processed Jams and conserves, sugar sweetened Jam Total sugars >60g/100g Fibre <2.5g/100g FVNL >60%
★★ ★☆ Decrease due to change to sugars
Fruit - processed Other dried fruit including mixed dried fruit
Dried fruit Total sugars >70g/100g Fibre <10g/100g Conc FVNL >90%
★★★☆ ★★★ Decrease due to change to sugars
Fruit - unprocessed Apples Unprocessed fruit
Total sugars >10g/100g Fibre <5g/100g FVNL100%
★★★★☆ ★★★★★ Increase due to automatic rating for unprocessed fruit/vegetables
Non-core foods - biscuits
Savoury biscuits, wheat based, plain, energy ≤1800 kJ per 100 g
Biscuits, savoury
Sodium >700mg/100g Fibre <5g/100g Protein >10g/100g Wholegrain 0%
★★★☆ ★★☆ Decrease due to change to protein (for baseline points based on sodium)
Non-core foods - biscuits
Sweet biscuits, plain with fruit or nuts
Biscuits, sweet Total sugars >20g/100g Fibre <10g/100g Protein >5g/100g Wholegrain >20%
★★★★ ★★★ Decrease due to change to sugars, protein (for baseline points based on sugars)
Non-core foods - carbonated
Soft drinks, non-cola Soft drink Total sugars >10g/100g ★ ☆ Decrease due to change to sugars
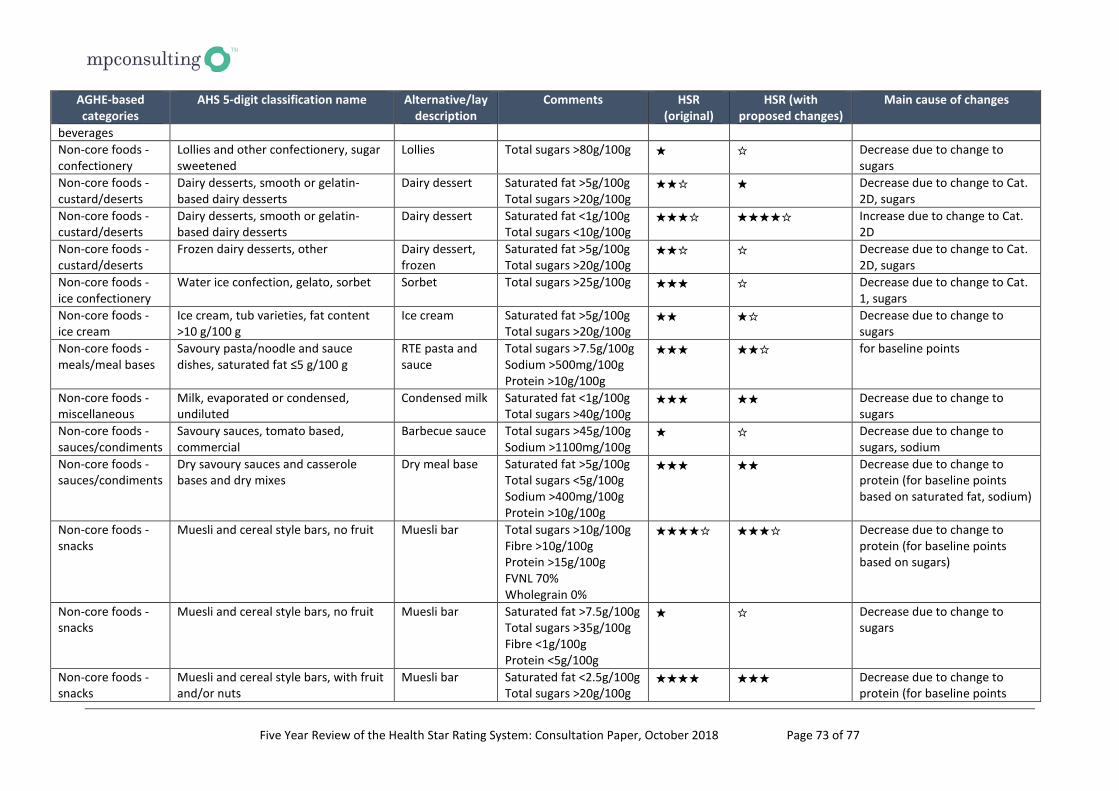
Five Year Review of the Health Star Rating System: Consultation Paper, October 2018 Page 73 of 77
AGHE-based categories
AHS 5-digit classification name Alternative/lay description
Comments HSR (original)
HSR (with proposed changes)
Main cause of changes
beverages Non-core foods - confectionery
Lollies and other confectionery, sugar sweetened
Lollies Total sugars >80g/100g ★ ☆ Decrease due to change to sugars
Non-core foods - custard/deserts
Dairy desserts, smooth or gelatin-based dairy desserts
Dairy dessert Saturated fat >5g/100g Total sugars >20g/100g
★★☆ ★ Decrease due to change to Cat. 2D, sugars
Non-core foods - custard/deserts
Dairy desserts, smooth or gelatin-based dairy desserts
Dairy dessert Saturated fat <1g/100g Total sugars <10g/100g
★★★☆ ★★★★☆ Increase due to change to Cat. 2D
Non-core foods - custard/deserts
Frozen dairy desserts, other Dairy dessert, frozen
Saturated fat >5g/100g Total sugars >20g/100g
★★☆ ☆ Decrease due to change to Cat. 2D, sugars
Non-core foods - ice confectionery
Water ice confection, gelato, sorbet Sorbet Total sugars >25g/100g ★★★ ☆ Decrease due to change to Cat. 1, sugars
Non-core foods - ice cream
Ice cream, tub varieties, fat content >10 g/100 g
Ice cream Saturated fat >5g/100g Total sugars >20g/100g
★★ ★☆ Decrease due to change to sugars
Non-core foods - meals/meal bases
Savoury pasta/noodle and sauce dishes, saturated fat ≤5 g/100 g
RTE pasta and sauce
Total sugars >7.5g/100g Sodium >500mg/100g Protein >10g/100g
★★★ ★★☆ for baseline points
Non-core foods - miscellaneous
Milk, evaporated or condensed, undiluted
Condensed milk Saturated fat <1g/100g Total sugars >40g/100g
★★★ ★★ Decrease due to change to sugars
Non-core foods - sauces/condiments
Savoury sauces, tomato based, commercial
Barbecue sauce Total sugars >45g/100g Sodium >1100mg/100g
★ ☆ Decrease due to change to sugars, sodium
Non-core foods - sauces/condiments
Dry savoury sauces and casserole bases and dry mixes
Dry meal base Saturated fat >5g/100g Total sugars <5g/100g Sodium >400mg/100g Protein >10g/100g
★★★ ★★ Decrease due to change to protein (for baseline points based on saturated fat, sodium)
Non-core foods - snacks
Muesli and cereal style bars, no fruit Muesli bar Total sugars >10g/100g Fibre >10g/100g Protein >15g/100g FVNL 70% Wholegrain 0%
★★★★☆ ★★★☆ Decrease due to change to protein (for baseline points based on sugars)
Non-core foods - snacks
Muesli and cereal style bars, no fruit Muesli bar Saturated fat >7.5g/100g Total sugars >35g/100g Fibre <1g/100g Protein <5g/100g
★ ☆ Decrease due to change to sugars
Non-core foods - snacks
Muesli and cereal style bars, with fruit and/or nuts
Muesli bar Saturated fat <2.5g/100g Total sugars >20g/100g
★★★★ ★★★ Decrease due to change to protein (for baseline points
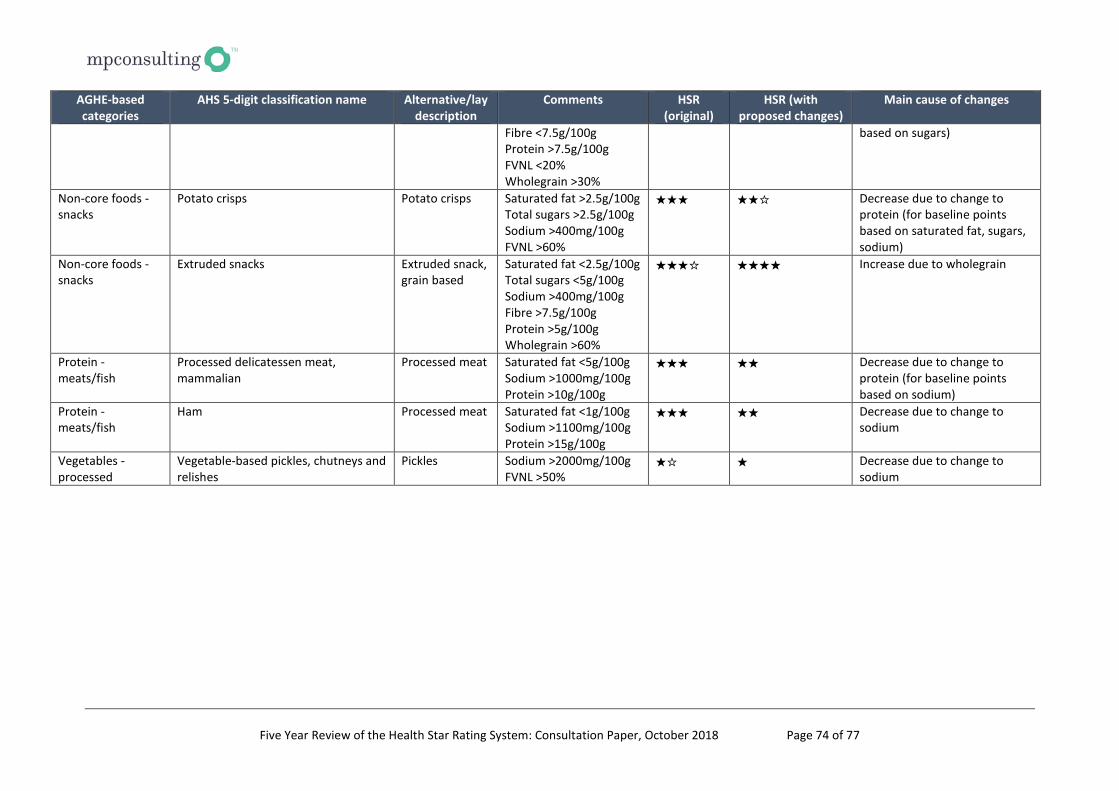
Five Year Review of the Health Star Rating System: Consultation Paper, October 2018 Page 74 of 77
AGHE-based categories
AHS 5-digit classification name Alternative/lay description
Comments HSR (original)
HSR (with proposed changes)
Main cause of changes
Fibre <7.5g/100g Protein >7.5g/100g FVNL <20% Wholegrain >30%
based on sugars)
Non-core foods - snacks
Potato crisps Potato crisps Saturated fat >2.5g/100g Total sugars >2.5g/100g Sodium >400mg/100g FVNL >60%
★★★ ★★☆ Decrease due to change to protein (for baseline points based on saturated fat, sugars, sodium)
Non-core foods - snacks
Extruded snacks Extruded snack, grain based
Saturated fat <2.5g/100g Total sugars <5g/100g Sodium >400mg/100g Fibre >7.5g/100g Protein >5g/100g Wholegrain >60%
★★★☆ ★★★★ Increase due to wholegrain
Protein - meats/fish
Processed delicatessen meat, mammalian
Processed meat Saturated fat <5g/100g Sodium >1000mg/100g Protein >10g/100g
★★★ ★★ Decrease due to change to protein (for baseline points based on sodium)
Protein - meats/fish
Ham Processed meat Saturated fat <1g/100g Sodium >1100mg/100g Protein >15g/100g
★★★ ★★ Decrease due to change to sodium
Vegetables - processed
Vegetable-based pickles, chutneys and relishes
Pickles Sodium >2000mg/100g FVNL >50%
★☆ ★ Decrease due to change to sodium
Five Year Review of the Health Star Rating System: Consultation Paper, October 2018 Page 75 of 77
Bibliography Technical Advisory Group technical papers, October 2018 • Alignment of the HSR system with the Australian and New Zealand Dietary Guidelines: Analysis of alignment and
identification of outliers • Calcium • Confectionery • Fats, oils and oil-based spreads • Fibre • Fruit, vegetable, nut and legume content • Glossary • History and development of the HSR algorithm • Ice confection, jelly and frozen milk products • Non-dairy beverages • Protein • Salty snacks and hot potato products • Saturated fat • Snack bars • Sodium • Sugars (added and total) • Unprocessed fruits and vegetables • Wholegrain Additional modelling and data provided by the TAG as requested. National data and statistics Australian Bureau of Statistics, Australian Health Survey 2011-12 Australian Bureau of Statistics, Australian Health Survey: Consumption of Added Sugars, 2011-12 Australian Bureau of Statistics, Australian Health Survey: Consumption of food groups from the Australian Dietary Guidelines Australia 2011-12 Australian Bureau of Statistics, National Health Survey: First Results, 2014-15 Australian Bureau of Statistics, Australian Health Survey: Users' Guide, 2011-13, Discretionary Foods Australian Bureau of Statistics, Australian Health Survey: Usual Nutrient Intakes, 2011-12 Ministry of Health, A Focus on Nutrition: Key Findings of the 2008/09 New Zealand Adult Nutrition Survey Dietary Guidelines Ministry of Health, October 2015, Eating and Activity Guidelines for New Zealand Adults, Wellington National Health and Medical Research Council, February 2013, Australian Dietary Guidelines – Providing the scientific evidence for healthier Australian diets, Canberra Monitoring data Colmar Brunton, 2018, 2018 Health Star Rating monitoring and evaluation: Year 2 follow-up research report, prepared for the Health Promotion Agency
Five Year Review of the Health Star Rating System: Consultation Paper, October 2018 Page 76 of 77
National Heart Foundation, April 2018, Report for Wave 7 of additional (point-in-time) update monitoring of the Health Star Rating (HSR) System, in Australia. February-March 2018, prepared for the Department of Health National Heart Foundation, April 2018, Report on the monitoring of the implementation of the Health Star Rating system: Area of Enquiry 2 – Consumer awareness and ability to use the Health Star Rating system correctly, prepared for the Department of Health National Heart Foundation, August 2017, Report on the monitoring of the implementation of the Health Star Rating system: Area of Enquiry 2 – Consumer awareness and ability to use the Health Star Rating system correctly, prepared for the Department of Health National Heart Foundation, August 2018, Report on the monitoring of the implementation of the Health Star Rating system: Area of Enquiry 2 – Consumer awareness and ability to use the Health Star Rating system correctly, prepared for the Department of Health Health Star Rating System resources Guide for Industry to the Health Star Rating Calculator (HSRC) version 6, February 2018, [http://www.healthstarrating.gov.au/internet/healthstarrating/publishing.nsf/Content/guide-for-industry-document] Health Star Rating System Style Guide, version 5, December 2017, [http://www.healthstarrating.gov.au/internet/healthstarrating/publishing.nsf/Content/style-guide] Research regarding the HSR System Brownbill, A, Miller, C, Braunack-Myer, A, 29 August 2018, Health Star Ratings: What’s on the labels of Australian beverages? Health Promotion Journal of Australia Carrad, AM, Louie, J.C., Yeatman, H.R., Dunford, E.K., Neal, B.C., Flood, V.M., ‘A nutrient profiling assessment of packaged foods using two star-based front-of-pack labels’, Public Health Nutrition, 19 August 2016 Dunford, E, Cobcroft, M, Thomas, M, & Wu, J.H. (2015) Technical Report: Alignment of NSW Healthy Food Provision Policy with the Health Star Rating System, Sydney, NSW: NSW Ministry of Health Dunford, E.K., Huang, L., Peters, S.A.E., Crino, M.; Neal, B.C., Ni Mhurchu, C. Evaluation of Alignment between the Health Claims Nutrient Profiling Scoring Criterion (NPSC) and the Health Star Rating (HSR) Nutrient Profiling Models. Nutrients 2018, 10, 1065. Jones, A, Radholm, K and Neal, B ‘Defining ‘Unhealthy’: a systematic analysis of alignment between the Australian Dietary Guidelines and the Health Star Rating System’, Nutrients 2018, 10, 501 Jones, A, Shahid, M & Neal, B ‘Uptake of Australia’s Health Star Rating System’, Nutrients, July 2018, 10, 997. Lawrence, M, Dickie, S and Woods, J. ‘Do nutrient-based front-of-pack labelling schemes support or undermine food-based dietary guideline recommendations? Lessons from the Australian Health Star Rating System’, Nutrients, 5 January 2018 Mantilla Herrera, A.M., Crino, M., Erskine, H.E., Sacks, G., Ananthapavan, J., Mhurchu, C.N., Lee, Y.Y. Cost-Effectiveness of Product Reformulation in Response to the Health Star Rating Food Labelling System in Australia. Nutrients 2018, 10, 614. Menday, H, Neal, B, Wu, J, Crino, M, +Baines, S & Peterson, K. ‘Use of added sugars instead of total sugars may improve the capacity of the Health Star Rating system to discriminate between core and discretionary foods, Journal of the Academy of Nutrition and Dietetics, December 2017, Volume 117, No.12 Ni Mhurchu, C, Eyles, H & Choi, Y, ‘Effects of a Voluntary Front-of-Pack Nutrition Labelling System on packaged food reformulation: the Health Star Rating system in New Zealand’, Nutrients, (2017), 9, 918
Five Year Review of the Health Star Rating System: Consultation Paper, October 2018 Page 77 of 77
Peters, S, Dunford, E, Jones, A, Ni Mhurchi, C, Crino, M, Taylor, F, Woodward, M & Neal, B ‘Incorporating added sugar improves the performance of the Health Star Rating front-of-pack labelling system in Australia’, Nutrients, 2017, 9, 701, p.1-12 Wellard, L, Hughes, C, Watson, WL. ‘Investigating nutrient profiling and Health Star Ratings on core dairy products in Australia’, Public Health Nutrition, 2 May 2016, 19 (15) p. 2860-5 Additional resources Department of Health and Food Standards Agency, Guide to creating a front of pack (FoP) nutrition labelfor pre-packaged products sold through retails outlets, November 2016 Department of Health, 8 August 2018, Form of the Food (‘As Prepared’) Rules, viewed on 27 August 2018 Food Regulation Secretariat, Joint Food Regulation System, 11 July 2018, Consultation Regulation Impact Statement: Labelling of sugars on packaged foods and drinks, Department of Health FSANZ, 2017, Australian and New Zealand Food Standards Code – Schedule 4 Nutrition, health and related claims FSANZ, 2017, Australian and New Zealand Food Standards Code – Standard 1.2.8 – Nutrition information requirements Grains & Legumes Nutrition Council, June 2017, Code of Practice for Whole Grain Ingredient Content Claims Health Star Rating Advisory Committee anomalies table, 11 March 2016, [http://www.healthstarrating.gov.au/internet/healthstarrating/publishing.nsf/Content/Applying-to-your-products#anomalies] Hess, J.; Latulippe, M.E.; Ayoob, K.; Slavin, J. The confusing world of dietary sugars: Definitions, intakes, food sources and international dietary recommendations. Food Funct. 2012, 3, 477–486 Rayner, M., Scarborough, P. & Lobstein, T, October 2009, The UK Ofcom Nutrient Profiling Model: Defining ‘healthy’ and ‘unhealthy’ foods and drinks for TV advertising for children Signal L N, Stanley J, Smith M, Barr M B, Chambers T J, Zhou J, Duane A, Gurrin C, Smeaton A F, McKerchar C, Pearson A L, Hoek J, Jenkin G L S, Ni Mhurchu C, Children’s everyday exposure to food marketing: an objective analysis using wearable cameras, International Journal of Behavioural Nutrition and Physical Activity, 14 (137) Vandevijvere S, Swinburn B, 3 July 2015, Getting serious about protecting New Zealand children against unhealthy food marketing, New Zealand Medical Association, 128 (1417) World Health Organization, 24 August 2018, Healthy Diet, [http://www.who.int/news-room/fact-sheets/detail/healthy-diet] World Health Organization, Guideline: Sugars intake for adults and children, Geneva, 2015


![1003. Designing a Five Star Team R Peterson [Read-Only]. Designing a Five Star T… · Buildinga Five Star Leadership Team @RalphPeterson08. 11/6/2017 2 CMS STAR RATING Excellent](https://img.pdfslide.net/doc/110x75/5f959e979cf8f4408e170e90/1003-designing-a-five-star-team-r-peterson-read-only-designing-a-five-star.jpg)