Embed Size (px)
Citation preview
Finding the Right Sovereign ESG Indicators: A Greek Tragedy?
On our mini odyssey through the vast seas of sovereign
ESG indicators, we sought to identify data and scores
from reliable third parties—which would not only provide
benchmarking criteria between countries, but also serve as
an effective screening tool to identify outliers.
BARINGS INSIGHTS
FIXED INCOME
Cem KaracadagHead of Emerging Markets
Sovereign Debt
Kawtar Ed-DahmaniManaging Director, Emerging
Markets Sovereign Debt
Dr. Ricardo AdroguéHead of Global Sovereign
Debt and Currencies
FEBRUARY 2021 1
The team would like to thank Tallie Hausser and
Raja Panjwani for excellent research assistantship.
BARINGS INSIG HT S FEBRUARY 2021 2
In Greek mythology, heroes go to meet their destiny even though they know it will end
tragically. The motivation is often to rise to a challenge that the gods or circumstances
have forced upon them, and the only way to take control and ownership is to choose
the fight, even if you get the sense that the fight may be hopeless.
In a much less emphatic way, we were in a similar state of mind when, in mid
2020, we embarked on our mini odyssey through the vast seas of sovereign
environmental, social and governance (ESG) indicators. We knew the journey may
be arduous—even inconclusive—as per our previously published paper on the topic.
But we deemed it worth the exploit. While a case study approach will provide a
more comprehensive and relevant assessment1, the questions around measurability
and replicability that it could raise are understandable. In this paper, we thus seek to
complement our case study approach by identifying data and scores from reliable
third parties that are focused on these issues and specialized in data gathering
and cleaning. In addition to providing benchmarking criteria between countries,
this data can serve as an effective screening tool for sovereign analysts to identify
outliers or emerging issues.
Tied to the Mast of Methodology (Approaching the Sirens)
Staying the course during this journey was necessary so as not to be lost among the
profusion of existing ESG metrics. Any ESG methodology has to have clear objectives
and clear reasons for targeting those objectives. This helps define which indicators
help track country performance in reaching these objectives. Therefore, we imposed
the following criteria on E, S and G indicators:
• Set objective criteria for each pillar, i.e. what is the goal from gathering such
ESG indicators?
• Be consistent with our ESG principles including measuring policies and not
outcomes, where possible.
• Accurately predict the measurable end goal.
1. A forthcoming paper will provide details on the Barings sovereign ESG diagnostics methodology.
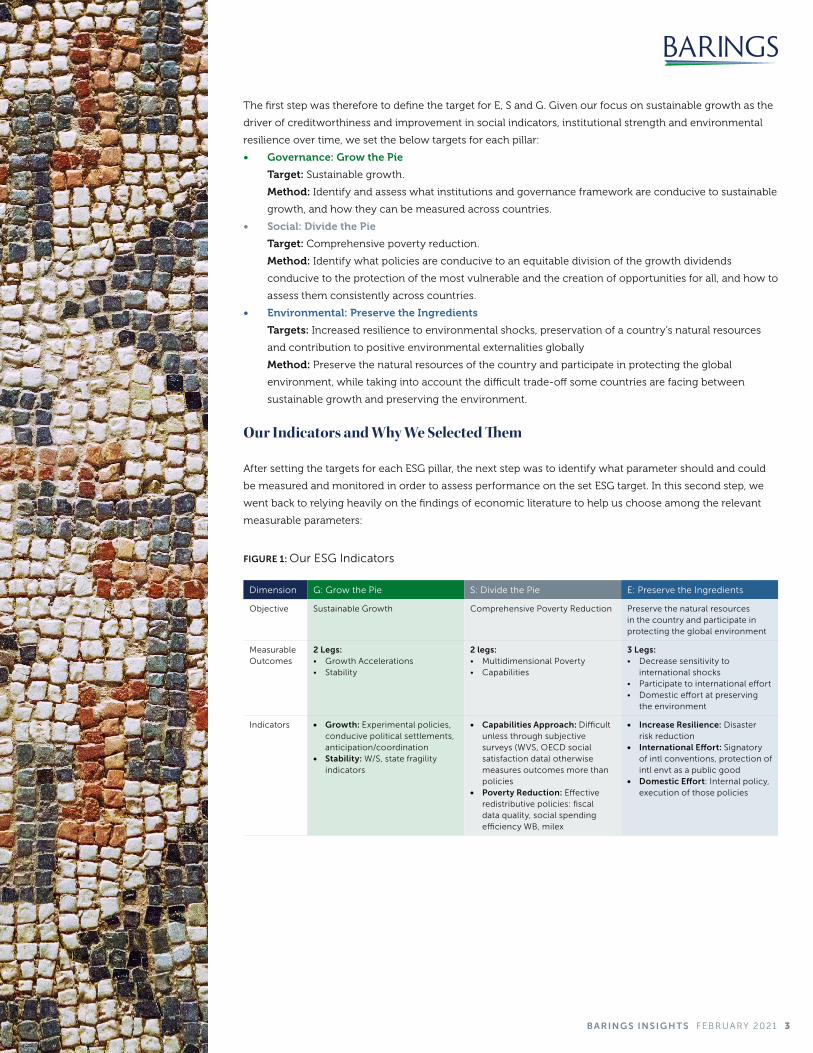
ESG
Sustainable Growth Episodes
Better Development OutcomesHigher Creditworthiness
Low DevelopmentLow Creditworthiness
BARINGS INSIG HT S FEBRUARY 2021 3
The first step was therefore to define the target for E, S and G. Given our focus on sustainable growth as the
driver of creditworthiness and improvement in social indicators, institutional strength and environmental
resilience over time, we set the below targets for each pillar:
• Governance: Grow the Pie
Target: Sustainable growth.
Method: Identify and assess what institutions and governance framework are conducive to sustainable
growth, and how they can be measured across countries.
• Social: Divide the Pie
Target: Comprehensive poverty reduction.
Method: Identify what policies are conducive to an equitable division of the growth dividends
conducive to the protection of the most vulnerable and the creation of opportunities for all, and how to
assess them consistently across countries.
• Environmental: Preserve the Ingredients
Targets: Increased resilience to environmental shocks, preservation of a country’s natural resources
and contribution to positive environmental externalities globally
Method: Preserve the natural resources of the country and participate in protecting the global
environment, while taking into account the difficult trade-off some countries are facing between
sustainable growth and preserving the environment.
Our Indicators and Why We Selected Them
After setting the targets for each ESG pillar, the next step was to identify what parameter should and could
be measured and monitored in order to assess performance on the set ESG target. In this second step, we
went back to relying heavily on the findings of economic literature to help us choose among the relevant
measurable parameters:
Dimension G: Grow the Pie S: Divide the Pie E: Preserve the Ingredients
Objective Sustainable Growth Comprehensive Poverty Reduction Preserve the natural resources in the country and participate in protecting the global environment
Measurable Outcomes
2 Legs: • Growth Accelerations • Stability
2 legs: • Multidimensional Poverty • Capabilities
3 Legs: • Decrease sensitivity to
international shocks• Participate to international effort• Domestic effort at preserving
the environment
Indicators • Growth: Experimental policies, conducive political settlements, anticipation/coordination
• Stability: W/S, state fragility indicators
• Capabilities Approach: Difficult unless through subjective surveys (WVS, OECD social satisfaction data) otherwise measures outcomes more than policies
• Poverty Reduction: Effective redistributive policies: fiscal data quality, social spending efficiency WB, milex
• Increase Resilience: Disaster risk reduction
• International Effort: Signatory of intl conventions, protection of intl envt as a public good
• Domestic Effort: Internal policy, execution of those policies
FIGURE 1: Our ESG Indicators
BARINGS INSIG HT S FEBRUARY 2021 4
GOVERNANCE: GROW THE PIE
Rationale
As described in our previous paper, insights from development
economics literature indicate that a necessary condition for
development is achieving consistent growth acceleration episodes
over a long period of time. While the drivers of such growth episodes
are difficult to isolate, factors such as conducive institutions, resilience
to shocks and political stability play a determinant role in enabling
these growth accelerations.2 There has been much debate in the
literature around what type of institutions are the most conducive to
sustainable growth, and we have reviewed some of this institutional
economics literature in our previous paper. Some have focused on
corruption or “Doing Business” databases as the best indicators of an
institutional environment conducive to growth.
Based on our review of the literature3, we believe, taking everything
into account, that key institutional factors to sustainable growth to
monitor are:
• Competitiveness of the political and economic elites4, as
defined in Douglass North’s work, and namely their ability
and willingness to be productive versus rentier. However, this
feature is difficult to comprehensively assess cross country and
will be the focus of our case study methodology.
2. Source: Hausmann, R., L. Pritchett, and D. Rodrik. “Growth accelerations.” Journal of Economic Growth, 10 (4): 303–329 (2005). Rodrik, D. “Where did all the growth go? External shocks, social conflict, and growth collapses.” Journal of Economic Growth, 4 (4): 385–412. (1999).
3. Source: See literature review by Bluhm R., Szirmai, A. “Institutions and long-run growth performance: An analytic literature review of the institutional determinants of economic growth”. (2012). Maastricht Economic and Social Research Institute on Innovation and Technology, Working Paper Series on Institutions and Economic Growth: IPD WP02.
4. Source: North, D.C., J.J. Wallis, S.B. Webb, and B.R. Weingast. (2007). “Limited access orders in the developing world: A new approach to the problems of development.” World Bank Policy Research Working Paper Series, 4359.
5. Source: See M. Khan on the importance of policy innovation for technology adoption: “Technology Policies and Learning with Imperfect Governance”, in Stiglitz, Joseph and Justin Yifu Lin (eds) The Industrial Policy Revolution I. The Role of Government Beyond Ideology, London: Palgrave pp. 79-115. (2013).
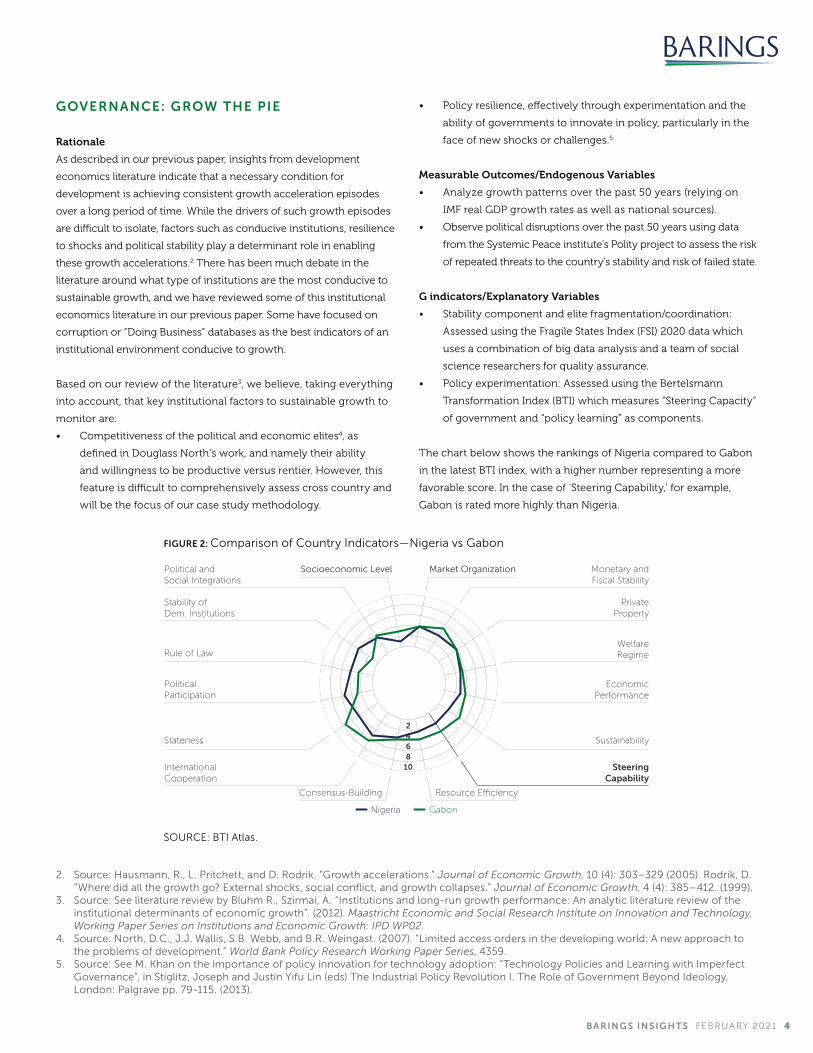
SOURCE: BTI Atlas.
FIGURE 2: Comparison of Country Indicators—Nigeria vs Gabon
Nigeria Gabon
Sustainability
EconomicPerformance
WelfareRegime
PrivateProperty
Monetary andFiscal Stability
Stateness
PoliticalParticipation
Rule of Law
Stability of Dem. Institutions
Political andSocial Integrations
Socioeconomic Level Market Organization
SteeringCapability
InternationalCooperation
Consensus-Building Resource E�ciency
108642
• Policy resilience, effectively through experimentation and the
ability of governments to innovate in policy, particularly in the
face of new shocks or challenges.5
Measurable Outcomes/Endogenous Variables
• Analyze growth patterns over the past 50 years (relying on
IMF real GDP growth rates as well as national sources).
• Observe political disruptions over the past 50 years using data
from the Systemic Peace institute’s Polity project to assess the risk
of repeated threats to the country’s stability and risk of failed state.
G indicators/Explanatory Variables
• Stability component and elite fragmentation/coordination:
Assessed using the Fragile States Index (FSI) 2020 data which
uses a combination of big data analysis and a team of social
science researchers for quality assurance.
• Policy experimentation: Assessed using the Bertelsmann
Transformation Index (BTI) which measures “Steering Capacity”
of government and “policy learning” as components.
The chart below shows the rankings of Nigeria compared to Gabon
in the latest BTI index, with a higher number representing a more
favorable score. In the case of ‘Steering Capability,’ for example,
Gabon is rated more highly than Nigeria.
BARINGS INSIG HT S FEBRUARY 2021 5
SOCIAL: DIVIDE THE PIE
Rationale
The S dimension is often viewed as a heteroclite category that includes a wide range of elements, from
inequalities to minority rights to political freedoms to health infrastructure, generally with little consistency.
In our sovereign ESG analysis, we have decided to focus the Social component on comprehensive poverty
reduction overtime. Poverty is a complex and multidimensional issue. It refers not only to income poverty
but also to poverty in rights, opportunities and, as famously described by Amartya Sen, in capabilities6.
Poverty measurement is essential as it enables governments to better target and evaluate their welfare
policies. However, poverty measurement can also be tricky. Although a lot of progress has been made over
the past few decades on this issue, there are still debates on how to best measure poverty (such as absolute
vs relative, income poverty vs other types of poverty, the use and thresholds of poverty lines, poverty
assessment in rural areas, gender-specific poverty, broader welfare targets). In addition to difficulties related
to the outcome variable, there are multiple factors affecting poverty reduction that can be exogenous and
endogenous to government policy, which is the main focus of our approach.
Measurable Outcomes/Endogenous Variables
Multidimensional Poverty Index developed by SOPHIA at Oxford University + alternatives when countries
not covered by OPHI.
S Indicators/Explanatory Variables
Although it is difficult at our level to do academic justice to this complex and important issue, we thought
the following variables would give us a good idea of how efficient poverty reduction policies are:
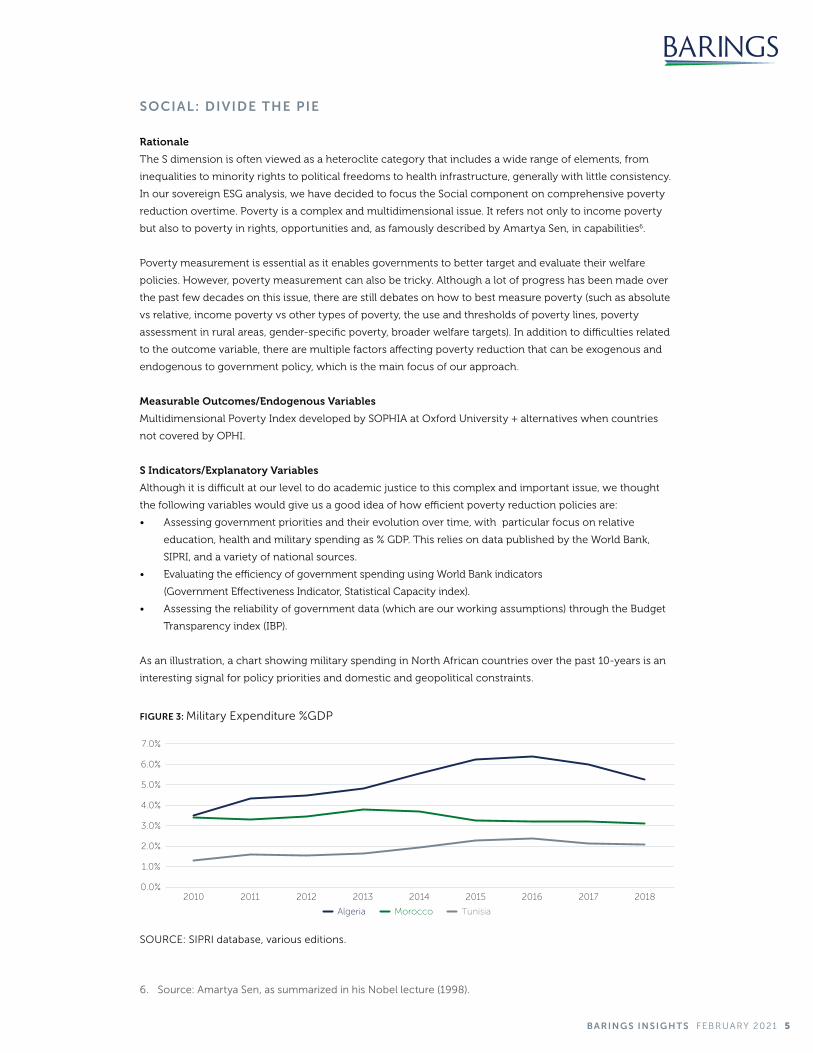
• Assessing government priorities and their evolution over time, with particular focus on relative
education, health and military spending as % GDP. This relies on data published by the World Bank,
SIPRI, and a variety of national sources.
• Evaluating the efficiency of government spending using World Bank indicators
(Government Effectiveness Indicator, Statistical Capacity index).
• Assessing the reliability of government data (which are our working assumptions) through the Budget
Transparency index (IBP).
As an illustration, a chart showing military spending in North African countries over the past 10-years is an
interesting signal for policy priorities and domestic and geopolitical constraints.
6. Source: Amartya Sen, as summarized in his Nobel lecture (1998).
SOURCE: SIPRI database, various editions.
FIGURE 3: Military Expenditure %GDP
7.0%
6.0%
5.0%
4.0%
3.0%
2.0%
0.0%
1.0%
2010 2011 2012 2013 2014 2015 2016 2017 2018
Algeria Morocco Tunisia
BARINGS INSIG HT S FEBRUARY 2021 6
ENVIRONMENTAL: PRESERVE THE INGREDIENTS
Rationale
While we recognize the tragedy of the commons at the global scale, it is in the long-term interest of all
countries to participate in the global effort to preserve the environment, even though some countries would
need to be compensated for their opportunity costs and costs of changing their processes of production in
the short and medium term. We therefore selected indicators that informed us of governments’ seriousness
concerning both domestic and global environmental issues, without penalizing countries that needed to
rely on less eco-friendly commodities or industries to develop their economies in the short term.
Measurable Outcomes/Endogenous Variables:
• Decrease sensitivity to international shocks/increase resilience to environmental disasters.
• Participate in the international effort to preserve the environment.
• Domestic effort at preserving the environment on a national scale.
E Indicators/Explanatory Variables
• Increased Resilience: Climate disaster risk reduction as assessed through the INFORM database.
• International Effort: Signatory of international conventions and ecological footprint (as assessed
through ND GAIN sub-indexes).
• Domestic Effort: Internal policy and execution of those policies as proxied by the Yale index for Waste
Management.
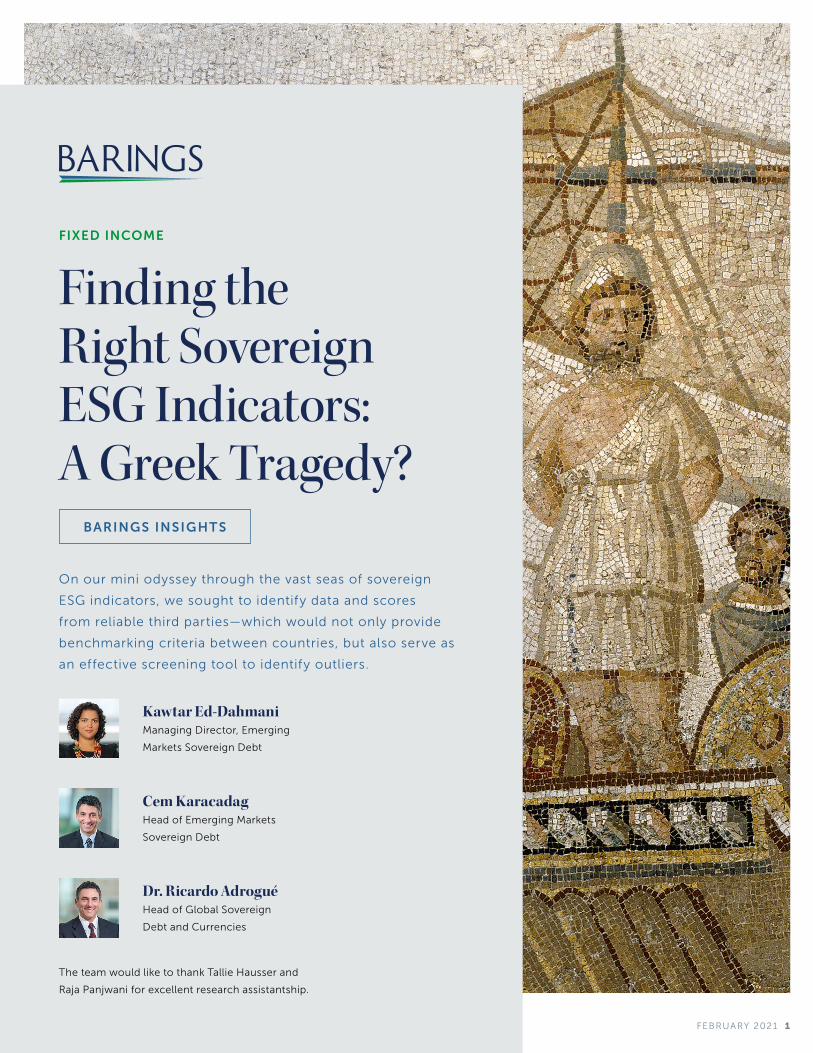
To illustrate, the below ranking for the Waste Management indicator of the Yale EPI underlines Colombia’s
performance at the top, ranking at par with Nordic countries.
SOURCE: Wendling, Z. A., Emerson, J. W., de Sherbinin, A., Esty, D. C., et al. (2020). 2020 EnvironmentalPerformance Index. New Haven, CT: Yale Center for Environmental Law & Policy.
Country Rank EPI Score
Columbia 1 100
Netherlands 1 100
Denmark 3 99.8
Sweden 3 99.8
Singapore 5 99.6
FIGURE 4: Comparison of Country Rankings on Waste Management
BARINGS INSIG HT S FEBRUARY 2021 7
Sailing Past the Sirens: Avoiding the Call of a Huge Database and a Simplistic Scoring Approach
At this stage of the journey, it could have been tempting to go further, as many have, to compute
synthetic ESG country scores using various indicators, establish a ranking and observe the evolution
of the scores over time. Some even go so far as to establish thresholds for the scores which are
then used to deem some countries un-investible. Others demonstrate the relevance of their ESG
scores by regressing them on the financial performance of the country’s Eurobonds. While these
approaches can be useful as a quick temperature gauge, we have decided to move past them due
to methodological concerns and their tendency to oversimplify what is inherently complex.
ESG country scoring, in particular, raises significant issues:
Data Issues: Constructing synthetic score implies normalization and aggregation of data; however:
• Normalization suggests that all data are on the same scale (in terms of magnitude and
direction) in order to aggregate them into a single score, across the different ESG indicators
and dimensions. This is problematic in that ESG indicators are not always of the same nature
(can be qualitative, quantitative, or categorical) and using thresholds and categories can
be quite arbitrary. Further, consistency of coverage in the indicators is not always there,
geographically nor chronologically.
• Aggregation also presents potential issues. It is defined as bringing together the
components into a single score, but the question is how do you do so, and what does the
synthetic score mean? Does it make sense to have a score by dimension (E-S-G) and then
add up the three scores? What if the dimensions have a different number of indicators,
or have different scales of variance? Do you give different weights to the dimensions or
indicators? If yes, on what grounds?
Consistency Issues: A synthetic score is incompatible with our ESG, research and
investment philosophy:
• ESG inconsistency: Each pillar of our ESG method targets an important parameter and seeks
to explain it through variables related to policy. For instance, the S dimension targets poverty
reduction and seeks to assess it through indicators of the efficacy of government social policy.
It doesn’t make much sense, in our view, to then go on and add up social spending and budget
transparency with state fragility indicators in the G dimension or international conventions
indicators in the E dimension. However, we will be able to compare countries more
meaningfully on each dimension, for instance: country X is making more efforts than country
Y on the E dimension, or country Z has been better able at tackling poverty than country W.
• Research inconsistency: Our research approach is based on country-specific, bottom-up
analysis. This is true for all of the dimensions we analyze when covering a country, whether
macroeconomic, political or ESG. In this regard, a synthetic score could cause us to overlook
important country-specific characteristics. If we only monitored the country’s ESG ranking,
for instance, would we be aware of what issues are the most pressing for the country: a new,
lower commitment to protecting the environment? A deterioration in the country’s institutions?
A less efficient / more unfair social policy following a government change? We believe these
questions are more essential to our research process than watching ranking changes.
• Investment inconsistency: As explained in our previous paper, we consider a country’s
direction of travel to be more important than current levels. We believe investing in countries
whose creditworthiness and ESG metrics are improving over time deliver returns for
investors. Therefore, ESG scores showing Nordic countries in the top 10 for years, or failed
states at the bottom and excluded from our investment space, tend to be less insightful when
it comes to potentially delivering alpha to our investors. Investing is also a way to influence
and excluding badly scoring governments will not incentivize improvements.
This philosophy is all the more crucial as the indicators themselves, either the ones we shortlisted or others widely used by
peers and competitors, suffer from various faults and shortcomings, including their sources and construction. For example,
several indicators, in particular on the governance side, are based on surveys by “country experts” whose expertise is
sometimes questionable and often biased. In addition, there is a glaring lack of data standardization: years, country availability,
and even geographical boundaries differ in these indicators. Ultimately, this can not only bias cross-country comparisons, but
also limit the relevance of a synthetic ESG score over time, as important datapoints might be missing for a specific country. We
provide in the appendix examples of indicators dropped due to data or methodological reasons, for each dimension.
Finally, while formulaic country scores based on cross-country indicators are not the best way, in our view, to provide an
accurate ESG assessment of the country, we do summarize our analysis for each country into a short evaluation and give
each sovereign an ESG rating on current levels (Strong, Moderate or Weak ESG evaluation) and trend (Improving, Stable or
Deteriorating, slow or fast pace). This evaluation and rating are then used for country positioning in the portfolio. Overall,
we view cross country indicators as a screening tool more than an active selection tool, the same way that we monitor the
macro indicators table for each country but we then need to understand the whole story before sizing it in the portfolio. It
means we may disqualify countries if they have weak, deteriorating ESG scores, but having good scores on these indicators
is not enough to build a sizable position in the portfolio.
Conclusion: Was the Journey Worth it?
After sailing through the ocean of ESG indicators and reaching the shore, we derived a few important takeaways from our journey:
• What to keep: A useful dataset to dive into and monitor important and relevant ESG factors. Across our sovereign debt
platform, monitoring the dataset is an integral part of our country analysis process.
• What to toss: A long list of indicators that are interesting per se, but irrelevant when used improperly and inconsistent
with our ESG methodology.
Above all, we remain tied to the mast (in our case of our methodology) rather than being drawn to the tempting but often
ineffective—at best, and hazardous at worst—pool of ESG indicators. Our approach instead will continue to focus on taking
deep dives into countries with ESG case studies, which will be the focus of a dedicated forthcoming piece. We believe
ESG country diagnostics rather than ESG country scores are the most relevant step further in this process. That said, these
diagnostics will focus on the most relevant ESG issue for the country, using some of the notions we have uncovered in this
process, such as resilience to climate change, political settlement process conducive to policy experimentation to promote
growth, social contracts that are directed toward creating more welfare and reducing poverty. In other words, assessing the
country’s ESG weaknesses as well as the severity of those weaknesses. Complementary analysis can also look into historical
factors, demographics or migration dynamics. The next step will be to identify necessary policy reforms to lift the growth
and resilience potential of the country, and therefore its creditworthiness
A final note: An important point is to acknowledge the subjectivity of some elements in the ESG approach and incorporate
the implications. We have explained how we believe ESG aligns the interests of investors and other stakeholders as
governments grow, distribute and preserve resources. However, we acknowledge that different investors may have specific
preferences and priorities, such as gender parity, renewable energy or freedom of the press. In that case, investors may
benefit from adopting a constructive rather than punitive approach, by redirecting investments in priority to countries that
have dedicated projects on those issues rather than penalizing those that do not prioritize the same ESG dimensions. The
development of well-structured and credible green bonds, SDG-bonds and related instruments will certainly help in this
direction. For every Odysseus, his own bow.
BARINGS INSIG HT S FEBRUARY 2021 9
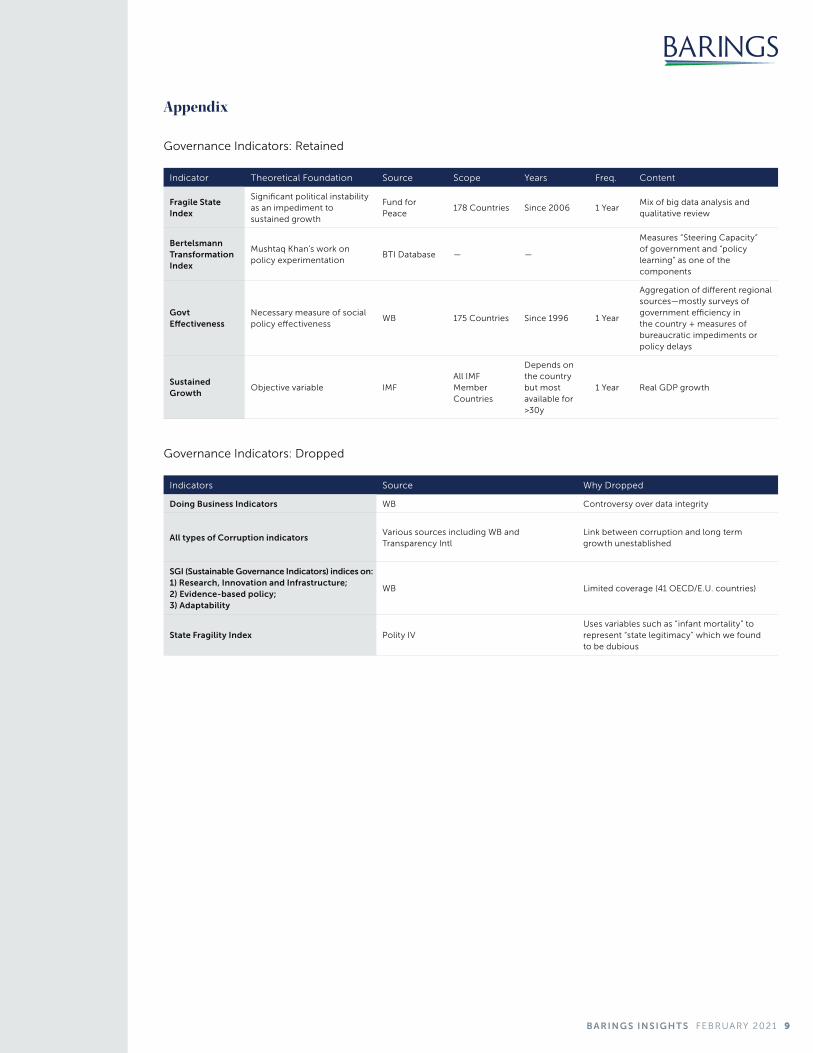
Appendix
Indicator Theoretical Foundation Source Scope Years Freq. Content
Fragile State Index
Significant political instability as an impediment to sustained growth
Fund for Peace
178 Countries Since 2006 1 YearMix of big data analysis and qualitative review
Bertelsmann Transformation Index
Mushtaq Khan’s work on policy experimentation
BTI Database — —
Measures “Steering Capacity” of government and “policy learning” as one of the components
Govt Effectiveness
Necessary measure of social policy effectiveness
WB 175 Countries Since 1996 1 Year
Aggregation of different regional sources—mostly surveys of government efficiency in the country + measures of bureaucratic impediments or policy delays
Sustained Growth
Objective variable IMFAll IMF Member Countries
Depends on the country but most available for >30y
1 Year Real GDP growth
Indicators Source Why Dropped
Doing Business Indicators WB Controversy over data integrity
All types of Corruption indicators Various sources including WB and Transparency Intl
Link between corruption and long term growth unestablished
SGI (Sustainable Governance Indicators) indices on: 1) Research, Innovation and Infrastructure; 2) Evidence-based policy; 3) Adaptability
WB Limited coverage (41 OECD/E.U. countries)
State Fragility Index Polity IVUses variables such as “infant mortality” to represent “state legitimacy” which we found to be dubious
Governance Indicators: Retained
Governance Indicators: Dropped
BARINGS INSIG HT S FEBRUARY 2021 10
Appendix Cont.
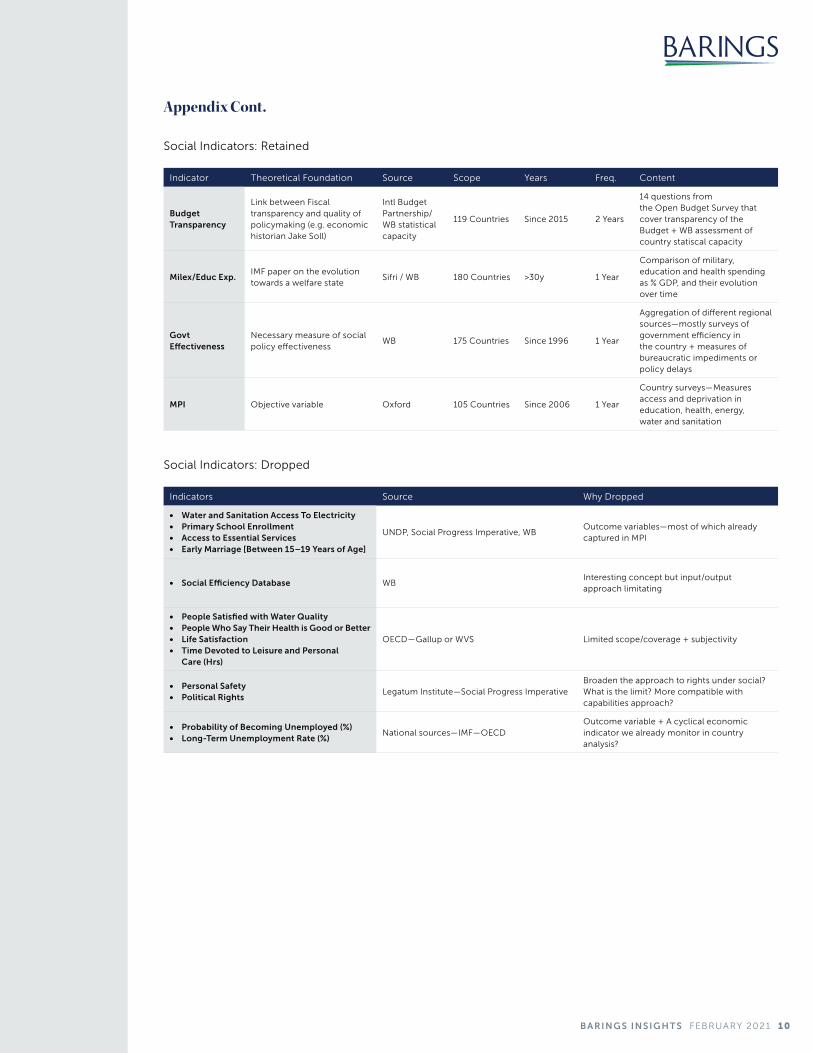
Social Indicators: Dropped
Indicators Source Why Dropped
• Water and Sanitation Access To Electricity • Primary School Enrollment • Access to Essential Services • Early Marriage [Between 15–19 Years of Age]
UNDP, Social Progress Imperative, WBOutcome variables—most of which already captured in MPI
• Social Efficiency Database WBInteresting concept but input/output approach limitating
• People Satisfied with Water Quality • People Who Say Their Health is Good or Better • Life Satisfaction • Time Devoted to Leisure and Personal
Care (Hrs)
OECD—Gallup or WVS Limited scope/coverage + subjectivity
• Personal Safety • Political Rights
Legatum Institute—Social Progress ImperativeBroaden the approach to rights under social? What is the limit? More compatible with capabilities approach?
• Probability of Becoming Unemployed (%) • Long-Term Unemployment Rate (%)
National sources—IMF—OECDOutcome variable + A cyclical economic indicator we already monitor in country analysis?
Indicator Theoretical Foundation Source Scope Years Freq. Content
Budget Transparency
Link between Fiscal transparency and quality of policymaking (e.g. economic historian Jake Soll)
Intl Budget Partnership/WB statistical capacity
119 Countries Since 2015 2 Years
14 questions fromthe Open Budget Survey that cover transparency of the Budget + WB assessment of country statiscal capacity
Milex/Educ Exp.IMF paper on the evolution towards a welfare state
Sifri / WB 180 Countries >30y 1 Year
Comparison of military, education and health spending as % GDP, and their evolution over time
Govt Effectiveness
Necessary measure of social policy effectiveness
WB 175 Countries Since 1996 1 Year
Aggregation of different regional sources—mostly surveys of government efficiency in the country + measures of bureaucratic impediments or policy delays
MPI Objective variable Oxford 105 Countries Since 2006 1 Year
Country surveys—Measures access and deprivation in education, health, energy, water and sanitation
Social Indicators: Retained
BARINGS INSIG HT S FEBRUARY 2021 11
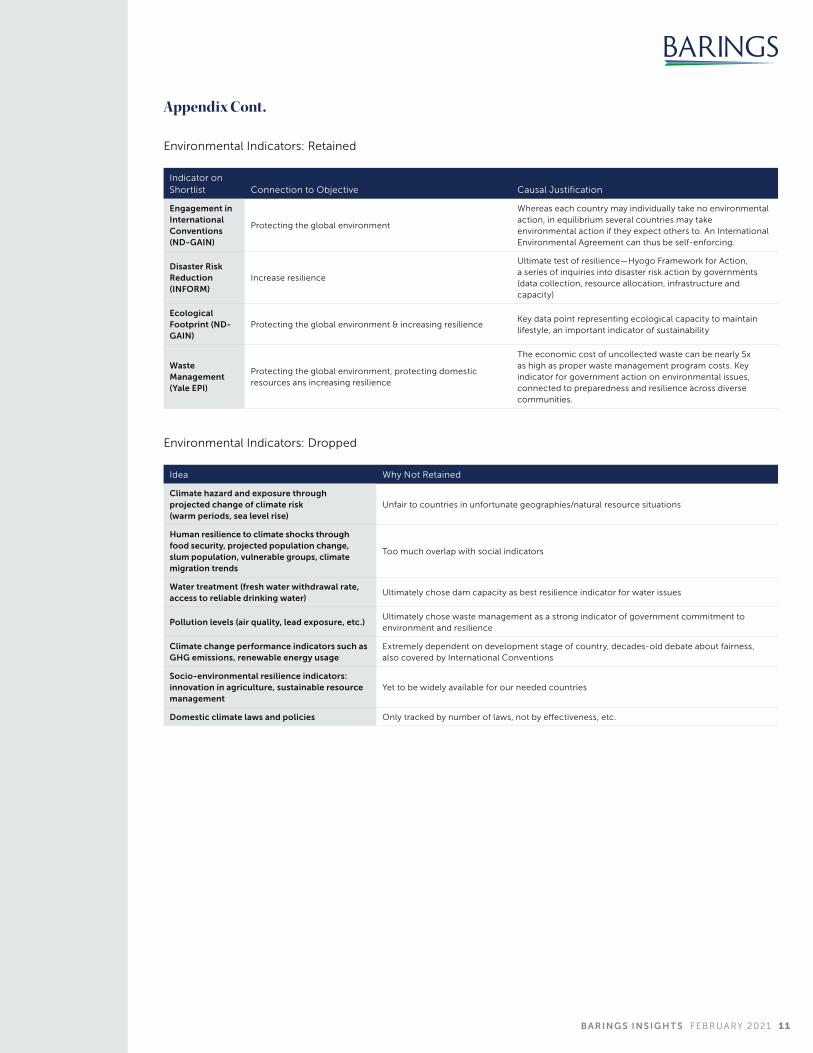
Environmental Indicators: Retained
Environmental Indicators: Dropped
Indicator on Shortlist Connection to Objective Causal Justification
Engagement in International Conventions (ND-GAIN)
Protecting the global environment
Whereas each country may individually take no environmental action, in equilibrium several countries may take environmental action if they expect others to. An International Environmental Agreement can thus be self-enforcing.
Disaster Risk Reduction (INFORM)
Increase resilience
Ultimate test of resilience—Hyogo Framework for Action, a series of inquiries into disaster risk action by governments (data collection, resource allocation, infrastructure and capacity)
Ecological Footprint (ND-GAIN)
Protecting the global environment & increasing resilienceKey data point representing ecological capacity to maintain lifestyle, an important indicator of sustainability
Waste Management (Yale EPI)
Protecting the global environment, protecting domestic resources ans increasing resilience
The economic cost of uncollected waste can be nearly 5x as high as proper waste management program costs. Key indicator for government action on environmental issues, connected to preparedness and resilience across diverse communities.
Idea Why Not Retained
Climate hazard and exposure through projected change of climate risk (warm periods, sea level rise)
Unfair to countries in unfortunate geographies/natural resource situations
Human resilience to climate shocks through food security, projected population change, slum population, vulnerable groups, climate migration trends
Too much overlap with social indicators
Water treatment (fresh water withdrawal rate, access to reliable drinking water)
Ultimately chose dam capacity as best resilience indicator for water issues
Pollution levels (air quality, lead exposure, etc.) Ultimately chose waste management as a strong indicator of government commitment to environment and resilience
Climate change performance indicators such as GHG emissions, renewable energy usage
Extremely dependent on development stage of country, decades-old debate about fairness, also covered by International Conventions
Socio-environmental resilience indicators: innovation in agriculture, sustainable resource management
Yet to be widely available for our needed countries
Domestic climate laws and policies Only tracked by number of laws, not by effectiveness, etc.
Appendix Cont.
IMPORTANT INFORMATION
Any forecasts in this document are based upon Barings opinion of the market at the date of preparation and are
subject to change without notice, dependent upon many factors. Any prediction, projection or forecast is not
necessarily indicative of the future or likely performance. Investment involves risk. The value of any investments
and any income generated may go down as well as up and is not guaranteed by Barings or any other person.
PAST PERFORMANCE IS NOT NECESSARILY INDICATIVE OF FUTURE RESULTS. Any investment results, portfolio
compositions and or examples set forth in this document are provided for illustrative purposes only and are not
indicative of any future investment results, future portfolio composition or investments. The composition, size of,
and risks associated with an investment may differ substantially from any examples set forth in this document. No
representation is made that an investment will be profitable or will not incur losses. Where appropriate, changes
in the currency exchange rates may affect the value of investments. Prospective investors should read the offering
documents, if applicable, for the details and specific risk factors of any Fund/Strategy discussed in this document.
Barings is the brand name for the worldwide asset management and associated businesses of Barings LLC and its
global affiliates. Barings Securities LLC, Barings (U.K.) Limited, Barings Global Advisers Limited, Barings Australia Pty
Ltd, Barings Japan Limited, Baring Asset Management Limited, Baring International Investment Limited, Baring Fund
Managers Limited, Baring International Fund Managers (Ireland) Limited, Baring Asset Management (Asia) Limited,
Baring SICE (Taiwan) Limited, Baring Asset Management Switzerland Sarl, and Baring Asset Management Korea
Limited each are affiliated financial service companies owned by Barings LLC (each, individually, an “Affiliate”).
NO OFFER: The document is for informational purposes only and is not an offer or solicitation for the purchase
or sale of any financial instrument or service in any jurisdiction. The material herein was prepared without any
consideration of the investment objectives, financial situation or particular needs of anyone who may receive it.
This document is not, and must not be treated as, investment advice, an investment recommendation, investment
research, or a recommendation about the suitability or appropriateness of any security, commodity, investment, or
particular investment strategy, and must not be construed as a projection or prediction.
Unless otherwise mentioned, the views contained in this document are those of Barings. These views are made
in good faith in relation to the facts known at the time of preparation and are subject to change without notice.
Individual portfolio management teams may hold different views than the views expressed herein and may make
different investment decisions for different clients. Parts of this document may be based on information received
from sources we believe to be reliable. Although every effort is taken to ensure that the information contained in
this document is accurate, Barings makes no representation or warranty, express or implied, regarding the accuracy,
completeness or adequacy of the information.
Any service, security, investment or product outlined in this document may not be suitable for a prospective
investor or available in their jurisdiction.
Copyright and Trademark
Copyright © 2020 Barings. Information in this document may be used for your own personal use, but may not be
altered, reproduced or distributed without Barings’ consent.
The BARINGS name and logo design are trademarks of Barings and are registered in U.S. Patent and Trademark
Office and in other countries around the world. All rights are reserved.
*As of September 30, 2020
21-1487423
LEARN MORE AT BARINGS.COM
Barings is a $354 billion* global investment manager sourcing differentiated opportunities and building
long-term portfolios across public and private fixed income, real estate and specialist equity markets. With investment
professionals based in North America, Europe and Asia Pacific, the firm, a subsidiary of MassMutual, aims to serve
its clients, communities and employees, and is committed to sustainable practices and responsible investment.