Embed Size (px)
Citation preview

Fixed Income: Weekly Strategy 13 May 2013
Adam Donaldson Head of Debt Research T. +612 9118 1095 E. [email protected] Philip Brown Quantitative Strategist T. +613 9675 7522 E. [email protected] Alex Stanley Interest Rate Strategist T. +612 9118 1125 E. [email protected] Tariq Chotani Credit Research Analyst T. +612 9280 8058 E. [email protected] Tally Dewan Credit Research Analyst T. +612 9118 1105 E. [email protected]
Important Disclosures and analyst certifications regarding subject companies are in the Disclosure and Disclaimer Appendix of this document and atwww.research.commbank.com.au. This report is published, approved and distributed by Commonwealth Bank of Australia ABN 48 123 123 124 AFSL 234945.
The good (semis), the bad (US Treasuries) and the ugly (the AUD)
US QE debate weighing on bonds and adding to a steeper domestic curve and AUD weakness from RBA rate cut.
Semi-governments enjoyed a strong rally last week as issuance flowed despite the lack of any real news from APRA.
Technicals supporting narrower cash spreads but we book some profits and remain cautious on CDS for now.
The RBA joined seven other central banks in easing policy last week. But ACGB performance was poor, as the market took direction from the rout in US Treasuries. The US 10Y yield is up 30bp on re-priced expectations for QE and as the USD outperforms. We re-iterate our views for: higher yields, a steeper curve, semi outperformance, consolidation in corporate CDS spreads and solid performance in AUD corporate cash.
The decisive break of resistance at 1.80% on Friday means US 10Y can move above 2.0% in our view. We expect this momentum to flow through to a steeper ACGB and swap curve. So we added 2/4Y swap steepener last Wednesday. The Aus-US 10Y spread hit the tight end of its 2012-13 range at 130bp after the RBA meeting, but has since widened to 135bp. We still think the RBA has more easing to do, which should be supportive of further spread tightening. But we look for a retracement towards 150bp before positioning for a tighter 10Y spread.
There’s a growing chorus calling for the FOMC to outline a clearer exit strategy to highly accommodative policy. To be sure, the recent soft patch in economic data and ongoing fiscal issues make timing this process a challenge. But the Fed must also take account of surging risk asset performance- especially record highs in equities and multi-year tights in credit spreads. We expect debate about the exit strategy to linger and contribute to higher US and global bond yields in 2H-13.
For now though, liquidity is free-flowing and financial risks are manageable. Issuers are taking advantage and hitting aggressive bids. Around $8bn of deals priced in the AUD market last week. Against this backdrop, most AUD spread product looks attractive. Even semis performed exceptionally well, tightening 10-15bp to swap. This supports our view (and key trades) for swap and semi outperformance to bond. We expect this performance to remain solid following APRA’s liquidity announcement and through Budget season (which kicked off with Victoria last week). The Commonwealth Budget tomorrow is likely to confirm ongoing deficits and growth in CGS supply. We expect to see only a gradual step-down in net new issuance.
Cash spreads as the market easily digested an avalanche of new issues and taps last week. Market technicals of limited supply and a healthy maturity profile continue to support cash spreads. The iTraxx Australia widened 2bp last week and while still trading inside our short-term trading range. We expect the iTraxx Australia to trend towards 105bp and consolidate there. We expect cash spreads to outperform CDS spreads in the short-term. After the strong performance, we have taken the opportunity to book profits on two of our trades (Long WSTP 3.625% Feb-23 and Long WOWAU 4.00% Sept-20), which are close/at our price targets. We have initiated a new U$ RV trade (see p2).
AUD plays catch-up to the big bond rally
Source: Bloomberg, CBA
Key Strategy Views
Tactical (<2 mth)
Strategic (>6 mths)
Policy rate* 2.75% 2.50%
3yr bond 2.75% 3.0%
10yr bond 3.25% 3.5%
10yr BEI 270 280
3/10 curve 60bp 70bp
10yr v US 140bp 110bp
3yr EFP 25bp 20bp
10yr EFP 50bp 40bp
iTraxx 115 105*Note: Strategy Team views. CBA Economics lowered their forecast to a 2.5% cash rate last week.
0.97
0.99
1.01
1.03
1.05
1.07
1.09
2.6
2.8
3.0
3.2
3.4
3.6
3.8
4.0
4.2
4.4
Jan-12 May-12 Sep-12 Jan-13 May-13
ACGB 10Y Yield (LHS)
AUD/USD (RHS)

Global Markets Research
Fixed Income: Weekly Strategy
2
Key Trades
Bonds
Trade Entry Current Profit Target Stop Comment Buy the ACGB Aug-15i vs the Oct-15 Receive ZCS at 2.65%.
250bp (30-Mar-12)
Hold: The trade is now (close to) an 8bp per annum annuity.
Buy the QTC Feb-20 to the NSWTC Mar-19
36bp (13-Nov-12)
30bp 6bp+2bp carry = 8bp
10bp 50bp Hold: S&P should keep Qld at AA+/Stable, but NSW AAA/neg to remain under pressure
Buy the Jan-18 ACGB vs the Feb-17 12bp (21-Nov-12)
14bp -2bp+1bp carry = -1bp
0bp 20bp Hold: There is a clear kink in the curve and a promising carry profile.
Buy the NSWTC Feb-17 against the NSWTC May-20
48bp (12-Feb-13)
49bp 1bp-2bp carry = -1bp
60bp 42bp Hold: This looks attractive on an RV basis, generally flattening is hurting
Buy the QTC Apr-16 against the ACGB Jun-16
54.5bp (4-Mar-13)
39bp 15.5bp +1.5bp carry = +17bp
30bp 65bp Hold: QTC Apr-16 looks cheap and the carry is attractive
Buy the TCV Nov-16 against NSWTC Apr-15
31.5bp (6-Mar-13)
24bp +7.5bp+2bp carry = 9.5bp
15bp 37bp Hold: TCV cheap in 2016 section, while NSWTC is dear. Prefer the mid curve.
Buy QTC Jul-23 on ASW basis 51bp (22-Apr-13)
37bp +14bp 25bp 42bp Hold: Positive credit & demand/supply dynamics should help narrow spreads. The stop has been pulled in & target lowered.
Buy TCV Nov-18 on an ASW basis (s/q)
11.5bp (3-May-13)
-1bp +12.5bp Take Profit: Strong move almost immediately.
2013 to date +48bps (including +1.5bp from closed trades)
Swap
Trade Entry Current Profit Target Stop Comment Short Feb-17, long Oct-14 ACGB on an ASW basis.
-29bp (30-Jan-13)
-27bp +2bp -10bp -35bp Hold: The swap-bond spreads curve is too steep.
2Y/4Y swap steepening trade 36bp 37bp +1bp 45bp 30bp New Trade: Combination of RBA cuts and long-end sell-offs should steepen the curve.
2013 to date 106.5bps (including +103.5bp from closed trades)
Credit
Trade Entry Current Profit Target Stop Comment
Buy WOWAU 4% Sep-20 (U$) on ASW basis
138.0 (23-Jan-13)
104.0 +34.0 100bps 157bps Book Profits Trade performed inline with expectations
Buy WSTP 3.625% Feb-23 (U$) on ASW basis
190.0 (7-Jan-13)
162.0 +28.0 160bps 205bps Book Profits Trade performed inline with expectations
Buy WESAU 6.25% Mar-19 vs WOWAU 6.% Mar-19 on ASW basis
30.0 (30-Aug-12)
18.3 +11.7 10bp 25bp Hold: Coles should continue to outperform Woolworths. Stop tightened.
Buy RIO 3.75% Sep-21 (U$) vs BHP 3.5% Nov-21 (U$) on ASW basis
43.0 (13-Feb-13)
43.5 -0.5 20bp 55bp Hold: RIO US$ long-end is steep relative
BHP U$ curve
Buy EIB 6.00% Aug-20 (A$) vs EIB 6.25% Apr-15 (A$) on ASW basis
45.0 (15-Mar-13)
41.2 +3.8 25bp 60bp Hold: Initiated curve flattener
Buy IFC 5.75% Jun-14 (A$) on ASW 12.0 (4-Apr-13)
9.0 +3.0 5bp 15bp Hold: ‘Washington’ names have under-performed slightly & are attractive over 3%.
Buy WPLAU 8.75% Mar-19 (U$) on ASW v. 1.18x WPLAU 5yr CDS
62.0 (17-Apr-13)
59.6 +2.4 Hold: 2019 bonds offer value at current levels. Hedged via CDS (1.18x Notional)
Buy NAB 2.75% Mar-17 vs WSTP 2.00% Aug-17 on ASW
15.0 (13-May-13)
15.0 0.0 5bp 25bp New Trade: NAB U$ 2017 wide relative to WSTP U$ 2017
2013 to date +120.7 bp

Global Markets Research
Fixed Income: Weekly Strategy
3
Short term interest rates
BBSW and OIS rates hit new lows after the RBA’s rate cut but have since rebounded with the falling AUD and sell-off in global bonds.
The RBA cut was in line with the Strategy team’s core view that cash will get to at least 2.5%, but transpired a little earlier than expected. We see distinct downside risks to the economy, as domestic demand fails to fill the large gap left by the pending peak in mining capex. Low inflation, fiscal tightening, deleveraging, the high AUD and tight financial conditions all point to further easing.
The RBA provided little guidance on their next move. August looks most likely for another cut. But their willingness to move early and their low inflation forecast means the door remains wide open for a move at any stage. Terminal rate pricing could easily fall further from the current level of 2.45%, unless the sharp fall in the AUD extends further (not our base case, but a very real possibility).
BBSW remains relatively tight to OIS at 13bp. We think spreads will remain tight given limited issuance and ample liquidity (seasonality will still drive spreads intra-month variation).
CBA’s Economics team changed their forecast to 2.5% cash rate. They forecast GDP to be around trend at 2.9% in 2013, with inflation remaining near the bottom of the 2-3% band.
Commonwealth bond curve
Despite the RBA rate cut, global yields have been moving higher, causing the ACGB curve to bear steepen this week. The 3Y sold off 8bp and the 10Y sold-off 15bp, for a 7bp steepening.
Notwithstanding RBA views, we continue to look for a modest sell-off this year. The Australian front-end is fully priced for another rate cut and has scope to move lower if data disappoints. However, much like this week, there is likely to be medium-term selling pressure from offshore which should see longer end rates slowly increase and the curve steepen.
The US sell-off that drove the Australian long end this week was driven by speculation of an early exit from QE, a likely foretaste of moves to come. We still see the US recovery as solid and look for yields to gradually lift this year as investors question the Fed’s QE commitment and move more decisively into risk assets. That points to a generally steeper AUS curve; we expect the mid-section (3-7Y) to underperform.
We view expected bond returns as unattractive with yields at these levels. The Federal Budget is likely to reveal a funding task for 2013 of around $50b which will add to selling pressure.
Commonwealth bond spreads
The run of weak global data has eased a little and, with risky assets continuing to rally, speculation of an early end to QE has taken US 10Y back to a six week high of 1.93%. The direct contrast with the RBA decision helped take the Aus-US 10Y spread to a seven month low of 130bp during the week.
We look for further AUS-US bond spread compression over time on fundamental grounds. But Australia’s high beta means we struggle to see that trade performing while risk appetite is picking up and yields are rising. QE restricts moves in the US but has less direct impact in Australia, leaving adjustment to include a strong AUD over time.
The spread has widened a little back to 135bp today. We look for a range between 130bp and 150bp in the near term.
AUD money market
ACGB curve
AUS-US 10Y bond spread
Source: Bloomberg, CBA
0
20
40
60
80
100
2.0
2.5
3.0
3.5
4.0
4.5
Jan-12 Apr-12 Jul-12 Oct-12 Jan-13 Apr-13
Cash rate
3m OIS
3m BBSW
%
3m BBSW-OIS margin (rhs)
bp
30
40
50
60
70
80
1.5
2.0
2.5
3.0
3.5
4.0
4.5
Jan-12 Apr-12 Jul-12 Oct-12 Jan-13 Apr-13
%
3-10yr futures curve (rhs)
bpAust 10yr bond yield
(lhs)
3yr bond yield (lhs)
100
125
150
175
200
225
250
1.0
2.0
3.0
4.0
Jan-12 Apr-12 Jul-12 Oct-12 Jan-13 Apr-13
%
Aust-US 10yr bond spread(rhs)
bp
Aust 10yr bond yield (lhs)
US 10yr bond yield (lhs)

Global
Fixed
Inflat
Ta
WfoTs
Dthfrothlo
Tnpcli
Intere
SOsato
Ainpsimle
Wea
WcAthth
AUD/
Wfo
Tmsdabg
SlictoHothth
Markets Resear
d Income: W
ion Market
The sharp steafter the RBA
We continue toreseeable fu
Tradeables infstrong AUD.
Despite the lohe RBA bandrom 4Y and t
out. With littlehe wider sideow CPI prints
The Apr-15 bono natural buyprotection andcontinue to trakely to contin
est rate swa
Swap spreadsOIS spreads aswap spreadsalong the curvo cash and y
At the long enn recent weekpositioning onsupporting tigmpact the froeaves better v
We expect theend carry nowadd some pay
We prefer an icurve. Our cuACGB spreadhe 3Y-7Y sechis tenor have
/USD Bills/L
We expect thaoreseeable fu
Traditionally, imain driver ofspreads meandeal flow to pand slow systbanks to replagradual and th
SSA deal flowmited the bid
confined towao offset any p
However, spreopening the dhe back-end he curve.
rch
Weekly St
s
epening of thlowered thei
to expect Ausuture. Wagesflation repres
ow outlook, pd for most inshe ACGB BEe supply avaie and long-ens expected in
ond is shorteyers. The bod there is no ade cheap onnue.
ap spreads
s remain undeand tightenings at the front ve, particularlields are star
nd, paying preks as the AUDn the back of ghter spreadsont end more,value in recei
e box to remaw steeply negying pressure
incremental aurrent trades d tightening) actor. Even the narrowed a
Libor sprea
at the bills/Libuture, given J
issuance by Af bills/libor spns there’s somick up in the em credit gro
ace maturitieshe upward pr
w has been ligd from that keard the front opotential longeads have tig
door for issuaof the basis c
trategy
he front end or December 2
stralian inflatis are growingsents weak gl
riced inflationstruments. ZCEI are 2.5% orlable, we still
nd BEI is likely coming quar
ning and chend is too shocarry rationan the curve an
s
er tightening g bank CDS pof the curve. ly now that Arting to rise.
essure from tD/JPY is trada more dovis
s. While shifti, the steepneiving the long
ain under flatative, hedger
e there (espec
approach to p(2Y/4Y sprea
are biased towough the trad
against swap
ads
bor curve willPY weakness
Australian bapreads. Matume scope formonths aheaowth should os. We expecressure on sp
ght since Januey investor baof the curve, ger-term coveghtened marknce to re-emcurve to tight
of the ZCS cu2013 CPI fore
on to remain g only slowly. obal demand
n remains in tCS are greater higher from think BEIs wy to remain hrters.
eapening becaort to provide le. The bondnd the curren
pressure. Naprovide a stro We expect t
ACGBs again
he AUD/JPY ding back undsh RBA view ing RBA viewss of the swa
g end. We tar
tening pressurs seem likelycially in 1-3Y
positioning foad slope flatteward spread de is yet to pethe most (se
l remain quites and likely fl
nks offshore rities and tigh
r Australian baad. However,offset some ot that issuanc
preads limited
uary while JPase. Investorleaving little i
ered issuancekedly in the paerge. That cten a little furt
urve continueecast to 2.00
low for the Low
d as well as th
the top half oer than 2.5% the Aug-20 a
will remain on high despite t
ause there arinflation
d is likely to nt inversion is
arrow BBSWong anchor fothis to extendlook expensi
has dissipatder 102. Re-is also
ws typically ap-bond box rget 50bp.
ure. With froy to step in anrates).
or a flatter EFener and QTCtightening froerform, semise below).
e steep for thows.
has been thehter wholesalank offshore , ample liquidof the need foce flow will bed.
PY weakness r appetite wasin the back-ee by banks. ast two weekould pressure
rther and flatt
ed %.
he
of
and
he
re
s
W-or d ve
ed
nt nd
P C to om s in
e
e le
dity or e
s end
ks, e en
ACGB
AUD sw
AUD/U
Source:
0.00
0.50
1.00
1.50
2.00
2.50
3.00
3.50
4.00
Ju
70
80
90
100
110
Jan 1
JPY
inflation link
wap spread
USD bills-libo
: Bloomberg, C
un-12 Aug-12 O
Aug-15
Sep-30
10 Oct 10
2-10yr bas(
daily
ked bonds
or spread
CBA
Oct-12 Dec-12
Aug-20
10Y BEI
Jul 11 Apr 1
sis swap slope (rhs)
Feb-13 Apr-13
Sep-25
Jul-22 N
2 Jan 13
AUD/JPY
4
Nom
-10
0
10
20
30
40
50bp

Global Markets Research
Fixed Income: Weekly Strategy
5
Semi-governments
Semi spreads have snapped back to bond over the past couple of weeks, reflecting both an expected tightening to swap but also narrower bond-swap spreads. We continue to expect swap spreads to recede (as above) and thus view semis favourably.
Spreads have also begun to narrow to swap. We take profit on a TCV 2017 to swap trade today following a 12bp contraction. But we’re happy to hold our QTC 2016 trade to bond and the QTC 2023 ASW position on the view that semi spreads will tighten further.
Mid-curve swaps are attractive and underpin solid semi appetite around 4-7Y, where curves are steep and well over 2.75% cash. However, the back-end is now looking cheap by comparison, even after the rally.
While revenue remains under pressure (and borrowing requirements will thus increase somewhat), existing estimates point to a $10bn fall in the new funding requirement in each of the next two years as states tighten up to protect their credit ratings. At the same time, we expect bank demand to remain firm despite lack of clear (public) guidance from APRA that banks should further improve the composition of their liquid assets. AUD related selling should ease up before long, allowing semis to move sub swap.
RV and core credit views direct us to QTC 2020s against NSWTCs 2019s and to TCV 2016s against NSWTC 2015s. We see NSW as remaining under pressure from S&P, but believe QTC will hold firm at AA+. WATC has probably cheapened enough from prior premium levels. But TCV isn’t being adequately rewarded for its ‘safe-haven’ status, as confirmed in last week’s Budget.
SSAs
Technicals took hold of the markets last week as SSA A$ curves tightened between 3-10bp helped by improved sentiment, limited supply and large AAA’ maturity profile in May. Aided by the sharp rally in semis, the back end of the curve has finally begun to tighten and flatten curves. SSA A$ issuance continued to trickle with one new issue and one tap during the week. Year to date issuance is A$7.43b (vs 2012 YTD A$10.45b).
The ‘Washington and Asian’ names flat-lined in 2012. The long-end of their A$ curve has now also moved slightly wider, but out-performed the European names. While we find it hard to get excited about the ‘Washington and Asian’ SSAs at current levels, wider swap to bond spreads have taken some short bonds above cash, opening up value for short tenors.
Near term sovereign downgrade risk (that could impact repo eligibility) and the ongoing macro and political risks in Europe will be the main driver of sentiment & demand for European SSAs. With a government in Italy finally in place, we expect a slight improvement in sentiment for the European names in the short term.
Year-to-date buying continues to be focused on the short end of the curve (2yr & 3yr) causing steepness in the long end (5yr to 7yr). But we continue to hold on our EIB A$ 2020-2015 curve flattener to take advantage of this steepness and on the view that the back-end will catch up when AUD flows stabilise. We continue to believe global appetite for AUD fixed income will remain strong and the current steep SSA curve should start to flatten over the coming months. Diminishing Japanese selling should help.
2022 semi-govt to bond spread
Semi to swap spread
Select SSA A$ Curve
Source: Bloomberg
30
60
90
120
150
180
1-Jul-11 1-Dec-11 1-May-12 1-Oct-12 1-Mar-13
QTC Semi (21-Jul-22)TCV Semi (17-Oct-22)WATC Semi (15-Jul-21)NSWTC Semi (01-Mar-22)
bp
-20
0
20
40
60
80
Apr-12 Jul-12 Oct-12 Jan-13 Apr-13
QTC Semi (22-Jul-24)QTC Semi (21-Jul-23)SAFA Semi (20-May-21)QTC Semi (21-Feb-18)QTC Semi (21-Apr-16)NSWTC Semi (01-Mar-22)TCV Semi (15-Nov-18)NSWTC Semi (20-Feb-17)
bp
0
20
40
60
80
100
120
0.0 2.0 4.0 6.0 8.0 10.0
Sp
read
to A
SW
Years to Maturity
ASIA COEEIB EUROFIADB IBRD

Global Markets Research
Fixed Income: Weekly Strategy
6
Credit Markets
CDS spreads consolidated last week after the strong moves the week before. The theme of last week was issuance with over A$7.7b of bonds easily absorbed by the market. While the new issues traded well, old issues were under slight selling pressure and moved out 1-3bp over the week. The iTraxx Australia widened 2bp over the last week.
Economic data and news flow in the US remains encouraging, but Europe continues to struggle. Domestically the RBA cut cash rate by 25bp to 2.75% citing low inflation and a high dollar. While the rate cut did little to move the A$ market, the lower cash rate adds to the attractiveness of the spread component in credit, providing strong underlying support for the sector. Along with global QE.
There were three new issues and one large tap last week, with Westpac’s A$1.3b tap being the highlight. All the deals are trading well in the secondary market with spreads tighter by 1-3bp over swap already. Primary issuance (A$38.56b YTD) is 9.5% lower than last year.
Limited supply, improving global sentiment, and large near term maturity profile (~A$43b worth of bonds maturing by June-end) are very supportive of tighter cash spreads in the near term. After the recent moves in CDS, we expect cash to outperform CDS in the near term.
Medium to longer term we remain optimistic and expect credit spreads – cash and CDS – to tighten given the supportive monetary policy globally and the relative health of corporate Australia. Central bank policies have successfully encouraged investors to take more risk and we expect them to hold that path at least till early 2014.
CDS Markets
The iTraxx Australia index is currently trading just off the tights of the year and the index is 52% tighter than its June 2012 levels. Since the start of 2013, the iTraxx Australia has performed very well relative to other major indices. However over the last couple of weeks the iTraxx Australia has underperformed the ITraxx Europe. The iTraxx Australia is currently trading 7bp wider than iTraxx Europe.
Telstra successfully secured licenses in the 700MHz and 2.5GHz band in the spectrum auction at a total cost of A$1.302b. The price was close to the reserved price and lower than consensus estimates. The investment will be funded predominantly through debt and payment will be made in the third quarter of 2014 (FY15). The lower than expected spectrum cost is a positive development. Telstra’s credit metrics could see some pressure in the short term. However, the high cash balance and strong cash flow generation capability gives the company a great degree of financial flexibility. On our estimates, with the current capex estimates, Net Debt /EBITDA (S&P method) would deteriorate to 1.65x in FY15 (FY13e: 1.61x) but will remain well below the 2.0x threshold level set by S&P’s ‘A’ rating.
The iTraxx Australia is currently trading through our year-end target of 105bp. While we are sellers of protection over the long term, we see limited upside from current levels. The iTraxx Australia is currently trading at Oct-2010 levels. We expect the index to give back some of the recent gains in the short-term and consolidate at around 105bp levels.
Select CDS Indices
Source: Bloomberg
2013 Maturity Profile (Corp+SSA+Semi+ACGS)
Source: Bloomberg
iTraxx Australia RV performance to Major Indices
Source: Bloomberg
80
120
160
200
Mar-12 Jul-12 Oct-12 Jan-13 May-13
bps
iTraxx Australia
iTraxx Europe
iTraxx AsiaXJ
0
5
10
15
20
25
30
35
40
May Jun Jul Aug Sep Oct Nov Dec
in A$ billion
0.80
1.00
1.20
1.40
1.60
1.80
Mar-12 Jul-12 Oct-12 Jan-13 May-13
RV to iTraxx AsiaXJ
RV to CDX-NA
RV to iTraxx Europe

Global Markets Research
Fixed Income: Weekly Strategy
7
Financials
Macquarie Group reported a 17% YoY increase in net profits and, continuing with the recent trend set by banks, increased dividend for 2H13 and increased target dividend payout ratio to 60-80%. The FY13 results were credit neutral and the company should remain well capitalised even after taking into account the increase in dividend.
Australian banks continue to maintain their strong position relative to global peers. Wholesale funding cost pressures have eased notably and the banks continue to strengthen capital and liquidity positions. Asset quality in the banks’ domestic book continues to remain stable with NPLs at ~1.5% of total loans (well below the 1.9% post-GFC high). Although profitability and returns have remained strong thanks to lower funding costs, lower credit costs and cost controls, the banks face slight earnings headwind in a slow credit growth environment. The risk in the near term is growing competition especially on the back of slow credit growth.
The main concern for Australian banks is the liquidity ratio under Basel III. APRA has now confirmed it will not follow the Basel Committee by relaxing the Liquidity Coverage Ratio (LCR) implementation schedule. But is has adopted the bulk of the relaxed assumptions for cash inflows and outflows, pointing to a lower liquidity bill that we assess to be favourable for the banks.
Anaemic credit growth means Australian bank issuance should be limited to refinancing in 2013. The 4 Majors have consistently paid down debt and we do not expect this trend to change any time soon. Westpac in its earnings release noted that the bank had already completed ~55% of its term wholesale funding needs with ~42% of the new issuance in U$. Last week Westpac tapped the A$ market and raised A$1.3b.
With that back drop, we expect domestic and international investor demand for 4M term paper to remain strong. At current levels we look to the short end (<2yr) of the 4M A$ curves for a yield pick up over cash rates. Relative to the seniors, we continue to prefer the callable pre-Basel III LT2 bonds as they offer great value.
Non-Financial Corporates
We expect supply of Australian corporate paper to be limited due to limited capex plans (outside mining). We saw a barrage of new issues last week (totalling A$7.7b) but not one corporate issue. Australian corporates will continue to be opportunistic in tapping domestic markets. Over the last few years they have done well to manage and repair balance sheets (read: A-REITS). We expect limited corporate bond supply in the domestic market and for non-financial spreads to be well supported.
While it is tempting to consider higher yielding issuers in a spread tightening environment, and select names have performed well, we prefer to be positioned on an individual credit perspective. In select sectors we continue to expect best-in-class names to continue to outperform even though they trade at already tight spreads.
Mirvac released their strategic update and reaffirmed their FY13 EPS guidance last week. While the strategic review has rejigged the model a little bit, most of it remained the same. The company widened gearing target range from 20-25% to 20-30% and indicated its intention to acquire a ‘BBB+’ from S&P. One day after the strategic review the company announced the acquisition of 7 office properties in for A$625m (64% equity funded) inline with their newly laid down strategy.
Select 5Yr Aus CDS - 3M Absolute Change
Source: Bloomberg
Select CDS and Bonds
Source: Bloomberg. Bonds – Spread to ASW
Corporate Spread to ASW
Source: CBA
-120 -80 -40 0 40
QBE
LLC
QAN
TAH
WBC
CWN
iTraxx Aus
WPL
BHP
WOW
RIO
WES
Tighter
Wider
50
150
250
350
Mar-12 Jul-12 Oct-12 Jan-13 May-13
bps NAB 7.25% 18WSTP 6.00% 17ANZ 5y CDSiTraxx Eu Sn FinCDX America Sn Fin
50
150
250
350
450
550
650
750
Jan-09 Feb-10 Mar-11 Apr-12 May-13
bps AA (5yrs) AA- (5yrs)
A- (5yrs) BBB (5yrs)

Global Markets Research
Fixed Income: Weekly Strategy
8
We remain neutral on Crown Ltd (CWN). The company received approval to increase its stake in Echo from 10% to 23% by the NSW ILGA. We expect CWN to adopt a wait-and-watch attitude, till the NSW government’s steering committee gives their verdict by the end of next month. CWN credit metrics look soft (relative to credit agency expectations) for FY13. But based on our assumptions of normalised EBIDTA growth of 6-8% in FY14, we expect the credit metrics to recover and stay in line with credit agency threshold limits.
Covered bonds
Covered bond spreads have narrowed by around 100bps since issuance in late 2011. That 4yr paper is currently trading at a 40% premium to senior unsecured notes. This premium has widened over the year and points to a cautious near-term outlook. At current levels we believe that covered bonds are trading at fair value relative to the seniors. Covered bonds are viewed as defensive in nature and therefore in a narrowing market we expect the covered bonds to underperform the seniors and vice-a-versa.
To date, Australian banks have issued around A$53 billion covered bonds, leaving around $94b in spare issuance capacity. There has been modest issuance this year at about A$7.5bn, raising the risk it doesn’t reach our expected A$35bn in 2013. There is sizeable room for banks to tap the covered bond market, but the strength of other funding options (incl RMBS) should dampen issuance, particularly in AUD. Demand from offshore investors means new issues have been concentrated in USD and EUR. We do, however, anticipate other regional bank(s) to join the covered bond market.
RMBS/ABS
We expect RMBS issuance to be highly opportunistic and driven by prevailing market conditions. The four major banks (~80% of lending market) are well funded. However, for the smaller ADI’s, RMBS should remain a key source of funding and their share of total securitisation should remain high.
ABS/RMBS issue margins lagged the tightening seen in the broader credit market in 2012. But they narrowed markedly late in 2012 and early 2013. Prime RMBS transactions for 2-3 WAL have compressed by around 30bps compared to end of last year. We believe that the observed rally on issue spreads has reached a plateau and do not foresee any major contraction in the near term.
The arrears rate measured by various rating agencies shows a slight increase in Q1. We believe that natural disasters in Queensland and northern NSW, coupled with other seasonal factors may have contributed to the rise in arrears. We continue to believe that monetary easing should improve loan serviceability for 2013.
Suncorp-Metway Ltd. priced A$1.15b prime RMBS that was upsized from the initial launch of A$750m. The ‘Apollo Series 2013-1 Trust” has four classes of Notes. The Class A and Class B1 Notes priced tighter than the initial guidance by 1bp and 20bp, respectively. The Class A (3.4Y), Class AB (5.9Y), Class B1 (5.9Y), and Class B2 priced at 95bps, 170bps, 280bps and 325bps over 1m BBSW. As expected, the issue spreads remained consistent with recent deals and there was no further price tightening.
Aust banks A$ covered bonds vs senior debt
Source: CBASpectrum
Covered and Senior bonds
Source: Bloomberg, CBA
RMBS, ABS and CMBS Issue Margin (2-4yr)
Source: Bloomberg, CBA
30
60
90
120
150
180
210
Jul-11 Feb-12 Sep-12 Apr-13
bps WBC (18-Nov-16)
CBAC (25-Jan-17)
WBC (09-May-16)
WBCC (06-Feb-17)
WBC (20-Feb-17)
0
10
20
30
40
50
60
70
Aug-12 Oct-12 Dec-12 Feb-13 Apr-13
YTM
Sp
read
ove
r C
over
ed (b
ps)
WSTP 1.40% 2015 (U$)
WSTP 2.13% 2016 (€)
WSTP 5.75% 2017 (A$)
0
100
200
300
400
500
Jan-07 Aug-08 Mar-10 Oct-11 May-13
bps
CMBS
ABS
RMBS
Global Markets Research
Fixed Income: Weekly Strategy
9
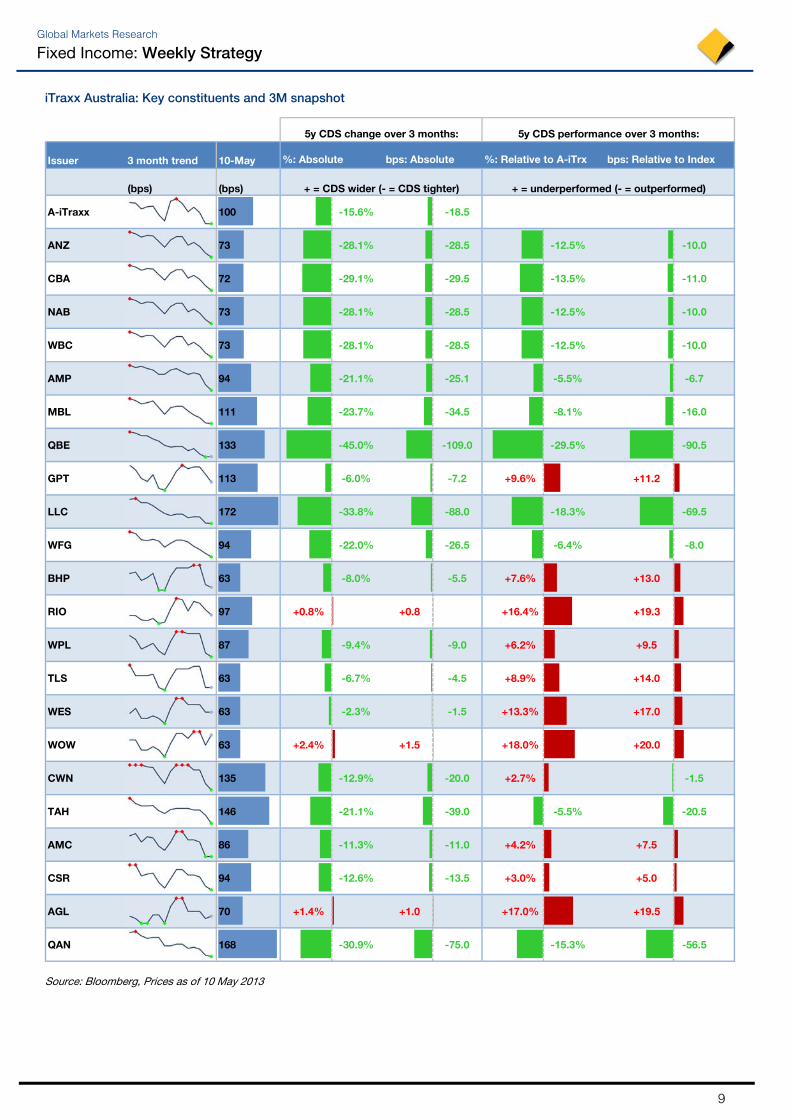
iTraxx Australia: Key constituents and 3M snapshot
Source: Bloomberg, Prices as of 10 May 2013
5y CDS change over 3 months: 5y CDS performance over 3 months:
Issuer 3 month trend 10-May %: Absolute bps: Absolute %: Relative to A-iTrx bps: Relative to Index
(bps) (bps) + = CDS wider (- = CDS tighter) + = underperformed (- = outperformed)
A-iTraxx 100 -15.6% -18.5
ANZ 73 -28.1% -28.5 -12.5% -10.0
CBA 72 -29.1% -29.5 -13.5% -11.0
NAB 73 -28.1% -28.5 -12.5% -10.0
WBC 73 -28.1% -28.5 -12.5% -10.0
AMP 94 -21.1% -25.1 -5.5% -6.7
MBL 111 -23.7% -34.5 -8.1% -16.0
QBE 133 -45.0% -109.0 -29.5% -90.5
GPT 113 -6.0% -7.2 +9.6% +11.2
LLC 172 -33.8% -88.0 -18.3% -69.5
WFG 94 -22.0% -26.5 -6.4% -8.0
BHP 63 -8.0% -5.5 +7.6% +13.0
RIO 97 +0.8% +0.8 +16.4% +19.3
WPL 87 -9.4% -9.0 +6.2% +9.5
TLS 63 -6.7% -4.5 +8.9% +14.0
WES 63 -2.3% -1.5 +13.3% +17.0
WOW 63 +2.4% +1.5 +18.0% +20.0
CWN 135 -12.9% -20.0 +2.7% -1.5
TAH 146 -21.1% -39.0 -5.5% -20.5
AMC 86 -11.3% -11.0 +4.2% +7.5
CSR 94 -12.6% -13.5 +3.0% +5.0
AGL 70 +1.4% +1.0 +17.0% +19.5
QAN 168 -30.9% -75.0 -15.3% -56.5

Global Markets Research
Fixed Income: Weekly Strategy
10
Please view our website at www.research.commbank.com.au. The Commonwealth Bank of Australia ABN 48 123 123 124 AFSL 234945 ("the Bank") and its subsidiaries, including Commonwealth Securities Limited ABN 60 067 254 399 AFSL 238814 ("CommSec"), Commonwealth Australia Securities LLC, CBA Europe Ltd and Global Markets Research, are domestic or foreign entities or business areas of the Commonwealth Bank Group of Companies (CBGOC). CBGOC and their directors, employees and representatives are referred to in this Appendix as “the Group”. This report is published solely for informational purposes and is not to be construed as a solicitation or an offer to buy any securities or financial instruments. This report has been prepared without taking account of the objectives, financial situation and capacity to bear loss, knowledge, experience or needs of any specific person who may receive this report. No member of the Group does, or is required to, assess the appropriateness or suitability of the report for recipients who therefore do not benefit from any regulatory protections in this regard. All recipients should, before acting on the information in this report, consider the appropriateness and suitability of the information, having regard to their own objectives, financial situation and needs, and, if necessary seek the appropriate professional, foreign exchange or financial advice regarding the content of this report. We believe that the information in this report is correct and any opinions, conclusions or recommendations are reasonably held or made, based on the information available at the time of its compilation, but no representation or warranty, either expressed or implied, is made or provided as to accuracy, reliability or completeness of any statement made in this report. Any opinions, conclusions or recommendations set forth in this report are subject to change without notice and may differ or be contrary to the opinions, conclusions or recommendations expressed elsewhere by the Group. We are under no obligation to, and do not, update or keep current the information contained in this report. The Group does not accept any liability for any loss or damage arising out of the use of all or any part of this report. Any valuations, projections and forecasts contained in this report are based on a number of assumptions and estimates and are subject to contingencies and uncertainties. Different assumptions and estimates could result in materially different results. The Group does not represent or warrant that any of these valuations, projections or forecasts, or any of the underlying assumptions or estimates, will be met. Past performance is not a reliable indicator of future performance. The Group has provided, provides, or seeks to provide, investment banking, capital markets and/or other services, including financial services, to the companies described in the report and their associates. This report is not directed to, or intended for distribution to or use by, any person or entity who is a citizen or resident of or located in any locality, state, country or other jurisdiction where such distribution, publication, availability or use would be contrary to law or regulation or which would subject any entity within the Group to any registration or licensing requirement within such jurisdiction. All material presented in this report, unless specifically indicated otherwise, is under copyright to the Group. None of the material, nor its content, nor any copy of it, may be altered in any way, transmitted to, copied or distributed to any other party, without the prior written permission of the appropriate entity within the Group. In the case of certain products, the Bank or one of its related bodies corporate is or may be the only market maker. The Group, its agents, associates and clients have or have had long or short positions in the securities or other financial instruments referred to herein, and may at any time make purchases and/or sales in such interests or securities as principal or agent, including selling to or buying from clients on a principal basis and may engage in transactions in a manner inconsistent with this report.
US Investors: If you would like to speak to someone regarding the subject securities described in this report, please contact Commonwealth Australia Securities LLC (the “US Broker-Dealer”), a broker-dealer registered under the U.S. Securities Exchange Act of 1934 (the “Exchange Act”) and a member of the Financial Industry Regulatory Authority (“FINRA”) at 1 (212) 336-7737. This report was prepared, approved and published by Global Markets Research, a division of Commonwealth Bank of Australia ABN 48 123 123 124 AFSL 234945 ("the Bank") and distributed in the U.S. by the US Broker-Dealer. The Bank is not registered as a broker-dealer under the Exchange Act and is not a member of FINRA or any U.S. self-regulatory organization. Commonwealth Australia Securities LLC (“US Broker-Dealer”) is a wholly owned, but non-guaranteed, subsidiary of the Bank, organized under the laws of the State of Delaware, USA, with limited liability. The US Broker-Dealer is not authorized to engage in the underwriting of securities and does not make markets or otherwise engage in any trading in the securities of the subject companies described in our research reports. The US Broker-Dealer is the distributor of this research report in the United States under Rule 15a-6 of the Exchange Act and accepts responsibility for its content. Global Markets Research and the US Broker-Dealer are affiliates under common control. Computation of 1% beneficial ownership is based upon the methodology used to compute ownership under Section 13(d) of the Exchange Act. The securities discussed in this research report may not be eligible for sale in all States or countries, and such securities may not be suitable for all types of investors. Offers and sales of securities discussed in this research report, and the distribution of this report, may be made only in States and countries where such securities are exempt from registration or qualification or have been so registered or qualified for offer and sale, and in accordance with applicable broker-dealer and agent/salesman registration or licensing requirements. The preparer of this research report is employed by Global Markets Research and is not registered or qualified as a research analyst, representative, or associated person under the rules of FINRA, the New York Stock Exchange, Inc., any other U.S. self-regulatory organization, or the laws, rules or regulations of any State.
European Investors: This report is published, approved and distributed in the UK by the Bank and by CBA Europe Ltd (“CBAE”). The Bank and CBAE are both registered in England (No. BR250 and 05687023 respectively) and authorised and regulated in the UK by the Financial Services Authority (“FSA”). This report does not purport to be a complete statement or summary. For the purpose of the FSA rules, this report and related services are not intended for retail customers and are not available to them. The products and services referred to in this report may put your capital at risk. Investments, persons, matters and services referred to in this report may not be regulated by the FSA. CBAE can clarify where FSA regulations apply.
Singapore Investors: This report is distributed in Singapore by Commonwealth Bank of Australia, Singapore Branch (company number F03137W) and is made available only for persons who are Accredited Investors as defined in the Singapore Securities and Futures Act and the Financial Advisers Act. It has not been prepared for, and must not be distributed to or replicated in any form, to anyone who is not an Accredited Investor.
Hong Kong Investors: This report was prepared, approved and published by the Bank, and distributed in Hong Kong by the Bank's Hong Kong Branch. The Hong Kong Branch is a registered institution with the Hong Kong Monetary Authority to carry out the Type 1 (Dealing in securities) and Type 4 (Advising on securities) regulated activities under the Securities and Futures Ordinance. Investors should understand the risks in investments and that prices do go up as well as down, and in some cases may even become worthless. Research report on collective investment schemes which have not been authorized by the Securities and Futures Commission is not directed to, or intended for distribution in Hong Kong.
All investors: Analyst Certification and Disclaimer: Each research analyst, primarily responsible for the content of this research report, in whole or in part, certifies that with respect to each security or issuer that the analyst covered in this report: (1) all of the views expressed accurately reflect his or her personal views about those securities or issuers; and (2) no part of his or her compensation was, is, or will be, directly or indirectly, related to the specific recommendations or views expressed by that research analyst in the report. The analyst(s) responsible for the preparation of this report may interact with trading desk personnel, sales personnel and other constituencies for the purpose of gathering, synthesizing, and interpreting market information. Directors or employees of the Group may serve or may have served as officers or directors of the subject company of this report. The compensation of analysts who prepared this report is determined exclusively by research management and senior management (not including investment banking). No inducement has been or will be received by the Group from the subject of this report or its associates to undertake the research or make the recommendations. The research staff responsible for this report receive a salary and a bonus that is dependent on a number of factors including their performance and the overall financial performance of the Group, including its profits derived from investment banking, sales and trading revenue.
Unless agreed separately, we do not charge any fees for any information provided in this presentation. You may be charged fees in relation to the financial products or other services the Bank provides, these are set out in the relevant Financial Services Guide (FSG) and relevant Product Disclosure Statements (PDS). Our employees receive a salary and do not receive any commissions or fees. However, they may be eligible for a bonus payment from us based on a number of factors relating to their overall performance during the year. These factors include the level of revenue they generate, meeting client service standards and reaching individual sales portfolio targets. Our employees may also receive benefits such as tickets to sporting and cultural events, corporate promotional merchandise and other similar benefits. If you have a complaint, the Bank’s dispute resolution process can be accessed on 132221.
Unless otherwise noted, all data is sourced from Australian Bureau of Statistics material (www.abs.gov.au).
Global Markets Research
Fixed Income: Weekly Strategy
11
Research
Commodities Telephone Email Address
Luke Mathews
Lachlan Shaw
Vivek Dhar
Agri Commodities
Mining & Energy Commodities
Mining & Energy Commodities
+612 9118 1098
+613 9675 8618
+613 9675 6183
Economics Telephone Email Address
Michael Blythe
Michael Workman
John Peters
Gareth Aird
Diana Mousina
Chief Economist
Senior Economist
Senior Economist
Economist
Economist
+612 9118 1101
+612 9118 1019
+612 9117 0112
+612 9118 1100
+612 9118 6394
Fixed Income Telephone Email Address
Adam Donaldson
Philip Brown
Alex Stanley
Tariq Chotani
Tally Dewan
Kevin Ward
Head of Debt Research
Fixed Income Quantitative Strategist
Interest Rate Strategist
Credit Research Analyst
Credit Research Analyst
Database Manager
+612 9118 1095
+612 9118 1090
+612 9118 1125
+612 9280 8058
+612 9118 1105
+612 9118 1960
Foreign Exchange and International Economics Telephone Email Address
Richard Grace
Joseph Capurso
Peter Dragicevich
Andy Ji
Chris Tennent-Brown
Martin McMahon
Chief Currency Strategist & Head of International Economics
Currency Strategist
Currency Strategist
Asian Currency Strategist
FX Economist
Economist Europe
+612 9117 0080
+612 9118 1106
+612 9118 1107
+65 6349 7056
+612 9117 1378
+44 20 7710 3918
Delivery Channels & Publications Telephone Email Address
Monica Eley
Ai-Quynh Mac
Internet/Intranet
Information Services
+612 9118 1097
+612 9118 1102
New Zealand Telephone Email Address
Nick Tuffley
Jane Turner
Christina Leung
Daniel Smith
ASB Chief Economist
Economist
Economist
Economist
+649 301 5659
+649 301 5660
+649 301 5661
+649 301 5853
Sales
Institutional Telephone Equities Telephone
Syd FX
Fixed Income
Japan Desk
Melb
Lon FX
Debt & Derivatives
Credit
HK
Sing
NY
+612 9117 0190
+612 9117 0341
+612 9117 0020
+612 9117 0025
+613 9675 7498
+44 20 7329 6266
+44 20 7329 6444
+44 20 7329 6609
+852 2844 7539
+65 6349 7074
+1212 336 7750
Syd
Asia
Lon/Eu
NY
+612 9118 1446
+613 9675 6967
+44 20 7710 3573
+1212 336 7749
Corporate Telephone
NSW
VIC
SA/NT
WA
QLD
NZ
Metals Desk
Agri Desk
+612 9117 0377
+613 9675 7737
+618 8463 9011
+618 9215 8201
+617 3015 4525
+64 9375 5738
+612 9117 0069
+612 9117 0145