Embed Size (px)
Citation preview

Fixed Partitioning and Salient Points with
MPEG-7 Cluster Correlograms for Image
Categorization
Azizi Abdullah
Remco C. Veltkamp
Marco A. Wiering
Technical Report UU-CS-2009-008
April 2009
Department of Information and Computing Sciences
Utrecht University, Utrecht, The Netherlands
www.cs.uu.nl

ISSN: 0924-3275
Department of Information and Computing Sciences
Utrecht University
P.O. Box 80.089
3508 TB Utrecht
The Netherlands

1
Fixed Partitioning and Salient Points with
MPEG-7 Cluster Correlograms for Image
CategorizationAzizi Abdullah, Remco C. Veltkamp, and Marco A. Wiering
Abstract
In this paper we describe a new method to combine visual MPEG-7 descriptors with spatial infor-
mation, by the use of cluster correlograms. We employ two approaches for dividing up an images for
region-based image retrieval and categorization. We compare fixed partitioning and salient points schemes
for dividing an image into patches, and low-level MPEG-7 visual descriptors are used to represent the
patches with particular patterns. A clustering technique is applied to construct a compact representation
by grouping similar patterns into a cluster codebook. The codebook will then be used to encode the
patterns into visual keywords. In order to obtain high-level information about the relational context of
an image, a correlogram is constructed from the spatial relations between visual keyword indices in
an image. For classifying images a k-nearest neighbors (k-NN) and a support vector machine (SVM)
algorithm are used and compared. The techniques are compared to other methods on two well-known
datasets, namely Corel and PASCAL. To measure the performance of the proposed algorithms, average
precision, a confusion matrix, and ROC-curves are used. The results show that the cluster correlogram
outperforms the cluster histogram. The saliency based scheme performs similarly to the fixed partioning
scheme and the support vector machine significantly outperforms the k-NN classifier.
I. INTRODUCTION
The use of digital image content in applications such as biomedicine, surveillance, and commerce
has increased dramatically with the advent of digital imaging sensors. Thus, the need for an efficient
Azizi Abdullah ([email protected]) and Remco C. Veltkamp ([email protected]) are with the Department of Information
and Computing Sciences at Utrecht University, and Marco A. Wiering ([email protected]) is with the Department of Artificial
Intelligence, the University of Groningen, The Netherlands

2
system to facilitate users in searching and organizing image collections in a large scale database is
crucial. However, developing such systems is quite difficult, because an image is an ill-defined entity
[1] consisting of complex and highly variable structures. In addition, digital images can be disturbed
by geometric transformations, photometric transformations or other disturbance agents. Even though the
images can be of a complex nature, it is not impossible to extract an approximation of the generic
meaning from the complex data of images. In literature, one of the main issues addressed in finding
images from large image collections is the quality of the retrieval results. It is common experience for
the user to retrieve meaningless information from the query of digital images. Therefore, effective image
representation and indexing in a large database are needed and so remain a challenge in computer vision
research.
Recently, the use of generic visual categorization (GVC) approaches has increased for identifying an
object in an image [2]. In general, GVC is an approach that enables retrieving and categorizing a given
test image with little or no supervision. This is in contrast with several proposals in literature suggesting
methods such as segmentation and annotation to characterize the image content. The GVC method is
inspired by the success of text-based information retrieval systems that use keywords to represent semantic
information about text documents. Unlike the text keywords, GVC uses visual keywords to support
querying and browsing of image data. The keywords are generated from a training set and contain high-
level components related to a semantic representation of image features. The components are usually
derived from the primitive features by using a clustering algorithm which allows the grouping of many
features into a single visual keyword (a cluster). The clustering algorithm should ensure that each keyword
sufficiently represents more compact information for the image content. Furthermore, a set of visual
keywords is used to index images and different learning algorithms can be used to learn to classify
images.
Constructing a set of visual keywords from an image is the most common approach in GVC. For
instance, a set of visual keywords is used to retrieve images from a large dataset as described in [2]. The
results are promising, even though little or no supervision is used to construct the keywords. In [3], the
authors extended the idea to categorize a given test image for natural scene categories and the results
are promising. Besides that, the method is also widely used in the PASCAL challenges [4]. In the 2006
challenge, results showed that different methods using visual keywords and a machine learning algorithm
can detect objects and categorize images in a large and complex dataset efficiently.
We compare two different methods for dividing an image into informative patches. The first method
is based on the fixed partitioning scheme where an image is divided into several blocks of the same size.
3
The next method is based on Speed Up Robust Features (SURF) [5]. The SURF algorithm is based upon
finding locations (called keypoints) which correspond to the local extrema points at different scales or
sizes. After an image has been divided into rectangular patches (fixed size or different sizes), the MPEG-7
features are used to represent these patches, and a clustering technique is applied to group similar patterns
into a cluster codebook. The codebook is then used to encode patterns into visual keywords. The visual
keyword indices will then be used to construct the cluster correlogram which in contrast to histograms,
represents spatial relations between visual keywords. Next, a k-NN and support vector machine (SVM)
algorithm [6] are used to learn to classify a given test image in the Corel and PASCAL datasets. We
finally compare these methods to each other and to some other methods. The methods are implemented
in our image recognition system called CIREC (Cluster correlogram Image REtrieval and Categorization)
[7].
The methods proposed in this paper can be considered an extension of the methods of [8] and [9].
Unlike [8], we use selected MPEG-7 visual descriptors which are believed to be reliable in representing
image blocks or patches. After that, the spatial arrangement is constructed by using the correlogram as
mentioned in [9]. We have extended the method in [9] by using the spatial relations between visual
keywords in an image so that the recognition performance could be improved. Another difference with
[8], [9], [7] is that this paper compares fixed partitioning and SURF to determine interest points.
The methods are tested on the Corel and PASCAL datasets. The Corel dataset involves large objects
or natural scenes which should be classified, and in this dataset background information can be very
useful for recognizing an image category. The PASCAL dataset involves much smaller objects where
background information is much less useful for recognizing an object.
The originality of our work is: (1) We compare new methods to efficiently combine MPEG-7 features
with spatial information (2) We compare the fixed partitioning scheme to the saliency-based scheme
(3) We demonstrate their effectiveness when the descriptors are combined. MPEG-7 features alone are
not the best method to describe real world images, but an efficient combination of them can be (4)
The comparative study of two popular learning classifier techniques for an automatic classification and
categorization of real world images.
The rest of the paper is organized as follows. Section II describes related work in content-based
image retrieval (CBIR) and content-based image categorization (CBIC). Section III describes the fixed
partitioning and salient point methods for dividing up an image in patches. Section IV describes our
system for retrieving and categorizing images with focus on the MPEG-7 visual descriptors combined
with cluster correlograms. Experimental results on the Corel and PASCAL datasets are shown in Section

4
V. Section VI discusses the results on the Corel and PASCAL datasets. Section VII concludes the paper.
II. RELATED WORK
In this section, we briefly describe some CBIR and CBIC systems and their properties, but for a much
more elaborated survey we refer to [10] and [4]. Then we describe basic image features which have been
used in CIREC such as the k-means algorithm and the color correlation histogram for image indexing.
A. Content Based Image Retrieval
In 1992, T. Kato [11] and his group carried out an experiment to investigate the effect of lower-level
visual features on automatic retrieving of images from a database. Since then, the term ”automatic image
retrieval” has been used frequently and became a practice to describe the process of retrieving images
from databases on the basis of primitive features. Most of the retrieving operations are determined by
comparing extracted features in two or more images in a given feature space. Usually, each image is
represented by a feature vector and a distance function is used to measure the similarity between them. The
features are normally extracted either globally from the whole image or locally as in region-based image
schemes. Furthermore, in the region-based model, each image can be represented using segmentation,
sliding windows, fixed region or saliency-based schemes. Once the image is divided in a set of regions,
the next steps are to select a visual descriptor to index the regions with features and to select a machine
learning algorithm.
In literature the most frequently cited image features found are color, texture and shape [12], [13],
[14], [9], but the most commonly used feature to represent images is color. The color histogram is the
best known and most popularly used color feature in CBIR systems and is used in systems such as QBIC
[15] and PhotoBook [16]. The color histogram is (almost) invariant to rotation, translation and scaling.
This approach works well especially in labeling the image content as a whole that the user is interested in
(e.g. sunrises, sunsets, flowers, etc.), but it has problems when conveying image information that contains
foreground and background objects and possible correlations between them. This is because the color
histogram does not take into account the spatial information that is contained in an image, resulting in
information loss and coarse indexing. Such indexing can potentially give false results on image queries,
and sometimes two images with dramatically different semantics give rise to similar histograms.
To reduce the problem, Pass and Zabih [9] proposed a split histogram called color coherence vector
(CCV). The results produced by this method are quite promising compared to a color histogram. Besides
that, Huang et al. [9] proposed another kind of feature called the color correlogram which enables

5
computation of the correlation between colors using spatial information in an image. However, these
methods still could not fully solve the problem of fuzziness and primitiveness of the color features
inherently exhibited in the color histogram. The color layout feature was also introduced to overcome
the drawbacks of a color histogram. In this method images are partitioned into several blocks and the
average color of each block is calculated and combined [12]. However, the color layout is sensitive to
shifting, cropping, scaling, and rotation because images are represented by fixed blocks.
The methods which have been mentioned above reveal that it is quite difficult to construct a good
retrieval system. Most of the systems are based on features that are semantically too primitive. The prob-
lem might be more difficult if the images and important objects in them are disturbed by transformations,
partial occlusion or cluttered with other objects. One way to overcome these problems is a technique that
can localize and determine object positions in an image. A technique that uses a certain region-based
representation such as segmentation or local features is believed to be promising to resolve the issues.
Region-based approaches are quite popular to represent local image content. One region based approach
tries to apply an image segmentation technique to extract regions from images [13]. Then, similarity
between images are measured by calculating the correspondences between their regions. Typical examples
of region-based retrieval systems include Blobworld [13], IRM [12], VisualSEEK [14], and SIMPLIcity
[12]. However, it is quite difficult to achieve accurate segmentation in an image especially for images
with less distinctive objects [14].
Besides image segmentation, another way to overcome the limitations of the global feature approach
is to use the fixed partitioning approach. In fixed partitioning, an image is divided into a fixed number
of rectangular windows or blocks. The approach shows remarkable performance in some applications as
reported in [7], [3] and [17]. Instead of the fixed partitioning, in [18] a scheme is used in which randomly
generated patches are combined. The performance of this method is also quite promising in handling
object class recognition. Besides that, the sliding windows approach is also possible to represent the local
image content, but is inefficient for processing the visual content: one has to visit every portion of the
image content, resulting in thousands of evaluations that have to be performed. The fixed partitioning
technique is quite simple and easy to implement, but might be facing problems if the images are disturbed
by transformations, occlusions or object clutter.
Recently, an alternative approach in representing the image with local regions was developed. The
saliency-based approach is said to be capable in handling images with complex structures. What makes the
method quite efficient is its point detector. There are many point detectors as mentioned in literature such
as corner, blob-like structure and multi-resolution detectors. Probably the most widely used is the Harris

6
corner detector [19]. However, this detector is not invariant to scale change, thus it is not a stable candidate
to represent the image patches. In 1999, David Lowe proposed a method called SIFT (Scale-invariant
feature transform) [20]. SIFT builds an image pyramid at increasing scales and then takes the Difference
of Gaussians (DoG) between layers. To locate the interest points the Hessian matrix determinant is used.
This point detector is claimed to be robust and invariant to scale, rotation, viewpoints and illumination.
Besides the SIFT detector, its descriptor is also widely used especially in baseline matching applications
and image indexing. For example the descriptor is used in CBIR systems as reported in [21]. Not only
SIFT but also its variations such as PCA-SIFT [22] and reduced SIFT [23] are used in retrieving image
content.
As mentioned in literature, the regular Gaussian convolution introduced in SIFT is not a fast method and
its descriptor for computing gray value gradients in multiple directions has high dimensionality. Therefore,
alternative algorithms have been proposed to deal with these problems. The most recent algorithm called
SURF (Speeded Up Robust Features) [5] is claimed to be comparable to or even better than SIFT in
both speed and recognition accuracy. Therefore, this is the main reason to try and use SURF in this
study together with a fixed partitioning approach as described in [7]. SURF will be explained in the next
section.
B. Content Based Image Categorization
The goal of image categorization is to determine the object or scene categories for a given image [24].
The problem is quite challenging because a system has to distinguish between many different classes
and cope with many object types simultaneously in an image. Ten years ago people used the color
histogram or other global descriptors for image recognition, but they could not handle many variabilities
such as different viewpoints, clutter or occlusions. After that, methods that need prior segmentation
were proposed. However, it is quite impossible to achieve accurate segmentation if the images have less
distinctive objects. Furthermore, the used descriptors are not robust to occlusion and not invariant to
image transformations in general.
Recently, an approach which was inspired by the success of text-based information retrieval systems
was proposed. The idea is that if we could describe the content of images by using words, then certainly
we could also retrieve the images by these words. Following this, a bag of keywords was proposed
and claimed to be effective in coping with many large inter and intra-class variabilities in an image.
Even though the approach was not able to discriminate between complex shapes or geometric structures
efficiently, it seems sufficient to represent generic classes of objects [24]. This approach generates a

7
number of image patches or blocks from both foreground and background pixels. The patches are
generated from a special point detector such as SIFT or SURF which is invariant to geometric and
photometric transformations or just simply by a fixed partitioning approach. For example, a bag of
keypoints model for GVC was proposed in [25]. They used the Harris affine detector to detect extrema
points in an image. After that, the SIFT descriptor is used to represent patches and a clustering technique
is applied to group similar patterns into a cluster codebook. Finally, a bag of keypoints or histogram is
constructed by counting the number of patches in an image assigned to each cluster. The naive Bayes
classifier and support vector machine (SVM) are then used for visual categorization. However, this
approach does not consider the spatial information between keywords for effective object categorization.
Another work introduced a model to capture relationships or spatial arrangements between codewords
and a Bayesian hierarchal model is used to learn and recognize natural scene categories [3]. Besides that,
in [26] a fragment-based representation approach was used to capture the spatial arrangement between
patches. In this technique, common image fragments are used as building blocks to represent a variety
of different objects. A recent example to incorporate the spatial arrangement between patches around
interest points is to use the co-occurrence matrix. In [8] a multi-resolution wavelet algorithm was used to
extract interest points which are described by relational functions to the gray-value differences of pixels.
Finally, a co-occurrence matrix was constructed to determine spatial relations between points.
C. The Correlogram
A spatial relation structure is important for visual perception tasks. For example, the coarseness of
textures can be measured by measuring its distribution changes with the distance condition. The co-
occurrence matrix [27] is a standard tool for statistical texture analysis and keeps track of the number of
pairs of certain intensity pixels that occur at a certain distance and direction in an image.
Let I be an image, quantized into m colors c1, ..., cm. Let p be a pixel p = (x, y) ∈ I, and let p1 ∈ Ici
mean that pixel p1 is of color ci. The color correlogram [9] matrix C of I is defined by the joint empirical
probability on the image that a color ci co-occurs with a color cj at given distance δ and angle ϕ as:
Cδϕ(ci, cj) = P(p1 ∈ Ici∧ p2 ∈ Icj
∧D(p1, p2) = (δ, ϕ)) (1)
Here P means probability, and D(x, y) denotes a distance function using polar coordinates, where δ >
0 and ϕ ∈ [0, 2π]. Usually we take a small value for δ since correlation between pixels is more relevant
on small distance [28].

8
D. k-means Clustering
k-means clustering attempts to subdivide samples consisting of feature values into a set of clusters based
on the distances between the samples. Feature vectors that are close to each other will be grouped together
[29]. The method is quite fast, simple and has been applied and shown to be useful in many applications.
To briefly explain the concept of the k-means algorithm suppose the observations are {xi : i = 1, ..., L}.
The goal of the k-means algorithm is to partition the observations into k groups with mean x̂1, x̂2, ..., x̂k
such that
KCL(k) =L∑
i=1
min1≤j≤k
(xi − x̂j)2 (2)
is minimized. k-means clustering works by iterating the following two steps until convergence: (1) assign
each observation to the closest cluster-mean, and (2) update the cluster-mean to the centroid of all
observations assigned to it in the previous step.
III. FIXED PARTITIONING AND SALIENT POINT SCHEMES
Generally, region-based feature extraction is developed to enhance CBIR systems [12], [13]. The
advantage of a region-based approach is that more high-level features over the regions can be computed,
such as shape or texture information, instead of using individual pixel features. Besides that, region based
retrieval is more natural and intuitive than retrieval using the whole image content. Various types of image
representations have been proposed to capture more relevant information about regions.
A. The Fixed Partitioning Approach
The fixed partitioning representation is described in [7], [30]. In our fixed partitioning scheme, each
image is divided into B x B blocks as shown in Fig. 1(Left). The blocks are represented by quantized
feature vectors and the relations between blocks are computed to capture the spatial distribution using
the correlogram. This is in contrast with several proposals in literature suggesting methods such as
color-based segmentation to characterize the spatial distribution of color information [31]. Each block is
represented by a cluster (also known as visual keyword) index and the correlogram is used to capture
the spatial relation between blocks. Thus, a more compact representation is obtained by constructing a
two-dimensional cluster correlogram. However, the correlogram size depends on the number of clusters
used in the k-means algorithm and its complexity increases quadratically when increasing this parameter.
Problems might arise if the fixed partitioning divides an important object in two or more parts.
Therefore, a more recent technique named the saliency-based approach is proposed.

9
Fig. 1. Left: Partitioned image. Right: Detected interest points.
B. The Saliency-Based Approach
Images taken from scenes usually have many variabilities such as viewpoint, clutter and occlusion. Most
of these are quite difficult to handle with a global based approach like segmentation or fixed partitioning.
There exists a technique that can cope with these problems named the saliency-based approach. The
approach is claimed to be local and so it is robust to occlusion and clutter. Besides that, it is robust to
photometric information and therefore provides more distinctive and well localisable features, and it is
also invariant to image transformations and illumination changes. Furthermore, the algorithm does not
need prior segmentation of the images, but is based on the repeatable computation of local extrema points
between the scale spaces of an image.
The saliency-based approach is quite popular for finding image correspondences between two images
taken under various types of transformations of the same scene or object. Nowadays, it is also quite
frequently used in image recognition systems. There are three main steps that have to be performed
using this approach: (1) interest points detection, (2) interest points description, and (3) matching. The
first step is to detect interest point locations. A point detector is used to detect the locations where the
pattern of the local region is salient. Usually, the points are detected based on extrema thresholds in
the current image’s scale-space. An ideal point detector would be repeatable against any chosen viewing
conditions. Once the interest points are detected, the next step is to describe the patches around the
selected points with a feature vector. A good feature descriptor would be distinctive, robust to noise, and
robust to geometric and photometric deformations [19]. Finally, the similarity between interest points
descriptions in two different images is measured by using a distance metric such as the Manhattan or
Chi-square distance function.
As mentioned, there are different techniques to detect and describe interest points such as SIFT and
SURF. We will use SURF in the saliency based scheme, because it is fast and was shown to perform

10
well. Fig. 1(Right) shows an example of the detected interest points using SURF.
C. Speeded Up Robust Feature (SURF)
Only the first two processes of the SURF algorithm are described, since the SURF descriptor and points
matching functions are not used in this paper, because we use MPEG-7 features. The overall process is
illustrated in Fig. 2.
Fig. 2. SURF’s flowchart.
1) Preprocessing: Usually interest points are detected under illumination changes in an image. There-
fore, the first step is to convert color images to grayscale images. The grayscale type is used because
it is simple to interpret and enhance. Besides using the grayscale values for every pixel, each image in
the dataset is also to be resized in order to increase the performance of the points detector algorithm.
Therefore, particular input images are down-sampled in order to decrease the number of pixels, whilst
maintaining its aspect ratio so that the image quality can almost be preserved.
2) Points Detection: Once the image is transformed into the grayscale level, the next step is to localize
the interest points. The interest points are detected based on the extrema thresholds found in the image’s
scale-space. In SURF, the integral image and the Hessian matrix are used to detect the extrema points.
The integral image is computed only once for an image and then re-used frequently to compute other
related functions.
The integral image ii is an intermediate representation for the original image I. For an image I, the
sum of gray scale intensity values could be defined as [32]:
ii(x, y) =x∑
x′=0
y∑
y′=0
I(x′, y′) (3)

11
The integral image can be computed recursively by using the following pair of recurrences:
s(x,y) = s(x, y− 1) + I(x, y) (4)
ii(x, y) = ii(x− 1, y) + s(x, y) (5)
where s(x,y) is the cumulative row sum, with s(x,-1) = 0, and ii(-1,y) = 0. The equations show that the
integral image can be computed in only one scan over the input data. This can be used to significantly
speed-up the point detector algorithm.
Once the integral image is constructed, the next step is to build the image’s scale space. SURF
approximates the Gaussian function with several box filters. The box filter masks with different sizes
are used to convolve all intensity values at different scale layers in the integral image. The size of the
integral image will not be reduced during this process, and as a result the same resolution input is used in
each scale. The filtered images are then subtracted from each other to obtain the Difference of Gaussians
(DoG) approximation. SURF uses a 9 x 9 filter as the initial scale layer which is equivalent to Gaussian
derivatives with σ = 1.2. Fig. 3 and 4 show corresponding Gaussian second order derivatives with the
box filters in the y-direction and xy-direction respectively.
Fig. 3. Left: Gaussian second order partial derivatives in y-direction. Right: approximation of using box filter. Source: [5]
Fig. 4. Left: Gaussian second order partial derivatives in xy-direction. Right: approximation of using box filter. Source: [5]
Once the approximation of the DoG is determined, the next step is to construct functions that can
be used to select extrema points. The local maxima and minima functions correspond to a 3 x 3 x 3
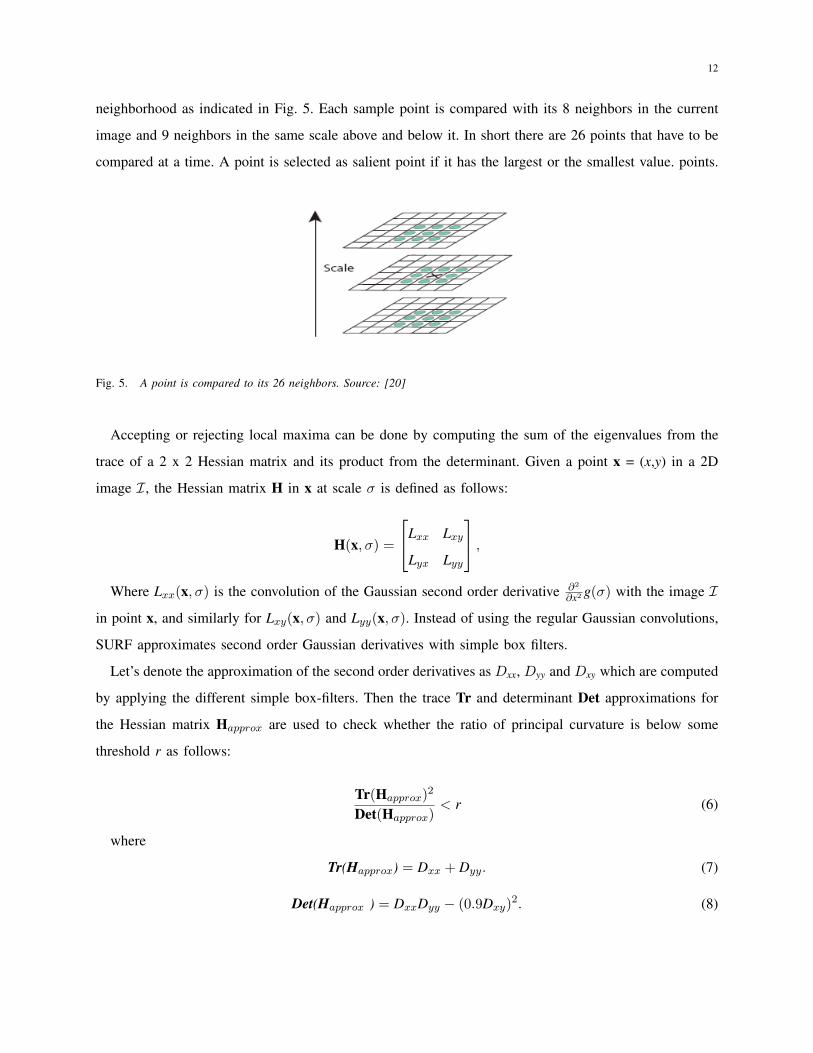
12
neighborhood as indicated in Fig. 5. Each sample point is compared with its 8 neighbors in the current
image and 9 neighbors in the same scale above and below it. In short there are 26 points that have to be
compared at a time. A point is selected as salient point if it has the largest or the smallest value. points.
Fig. 5. A point is compared to its 26 neighbors. Source: [20]
Accepting or rejecting local maxima can be done by computing the sum of the eigenvalues from the
trace of a 2 x 2 Hessian matrix and its product from the determinant. Given a point x = (x,y) in a 2D
image I, the Hessian matrix H in x at scale σ is defined as follows:
H(x, σ) =
Lxx Lxy
Lyx Lyy
,
Where Lxx(x, σ) is the convolution of the Gaussian second order derivative ∂2
∂x2 g(σ) with the image Iin point x, and similarly for Lxy(x, σ) and Lyy(x, σ). Instead of using the regular Gaussian convolutions,
SURF approximates second order Gaussian derivatives with simple box filters.
Let’s denote the approximation of the second order derivatives as Dxx, Dyy and Dxy which are computed
by applying the different simple box-filters. Then the trace Tr and determinant Det approximations for
the Hessian matrix Happrox are used to check whether the ratio of principal curvature is below some
threshold r as follows:
Tr(Happrox)2
Det(Happrox)< r (6)
where
Tr(Happrox) = Dxx + Dyy. (7)
Det(Happrox ) = DxxDyy − (0.9Dxy)2. (8)

13
The constant 0.9 is used here to empirically improve the performance and r is optimized in the
experiments. Following this, the selected interest points and its corresponding scale are sent to the next
stage for making a representation of the image.
IV. IMAGE REPRESENTATION IN CIREC
Image representation is one of the main factors for effective and efficient retrieval and categorization
of visual images. CIREC works with local image features that are composed of groups of pixels and
uses MPEG-7 features to describe the patches. The region-based approaches introduced in CIREC work
well with a clustering approach to extract codewords from the low-level basic features in an image.
The keywords corresponding to a region are produced by the discretization in a clustering algorithm,
and therefore can be directly used to construct the cluster correlogram to capture spatial relations in an
image.
A. MPEG-7 Content Descriptors
Image features for visual content description is crucial. Good features help to discover meaningful
patterns in the image. Until now, there is no agreement what type of features should be used to produce
an optimal query result for all images. For instance, a color histogram is quite good to capture the color
distribution, but suffers from lack of spatial relation information and discrimitive higher-level features.
MPEG-7 has been proposed to provide a standard for indexing for multimedia content [33]. We will use
these features as primitives for computing different cluster correlograms in CIREC.
The MPEG-7 standard defines a comprehensive, standardized set for effective searching, identifying,
filtering, and browsing in multimedia contents such as images, videos, audios, and other digital or even
analog materials [33], [34]. To support various types of descriptors, MPEG-7 is organized into several
groups. In CIREC, we have chosen four primitive MPEG-7 visual descriptors. MPEG-7 contains different
primitive descriptors that enable to describe characteristics of real-world images. Instead of using them
separately, it might be a good idea to combine the descriptors together, since this increases the amount of
information about an image. We want to test the effectiveness of using MPEG-7’s features in the cluster
correlogram, because they are easy and fast to compute and have been shown to work well in practice
[7]. Finally, it gives an easy way to compare our algorithm with other systems that are based on the same
standard.
In CIREC, we use the following MPEG-7 visual descriptors namely three color descriptors and one
texture descriptor.
14
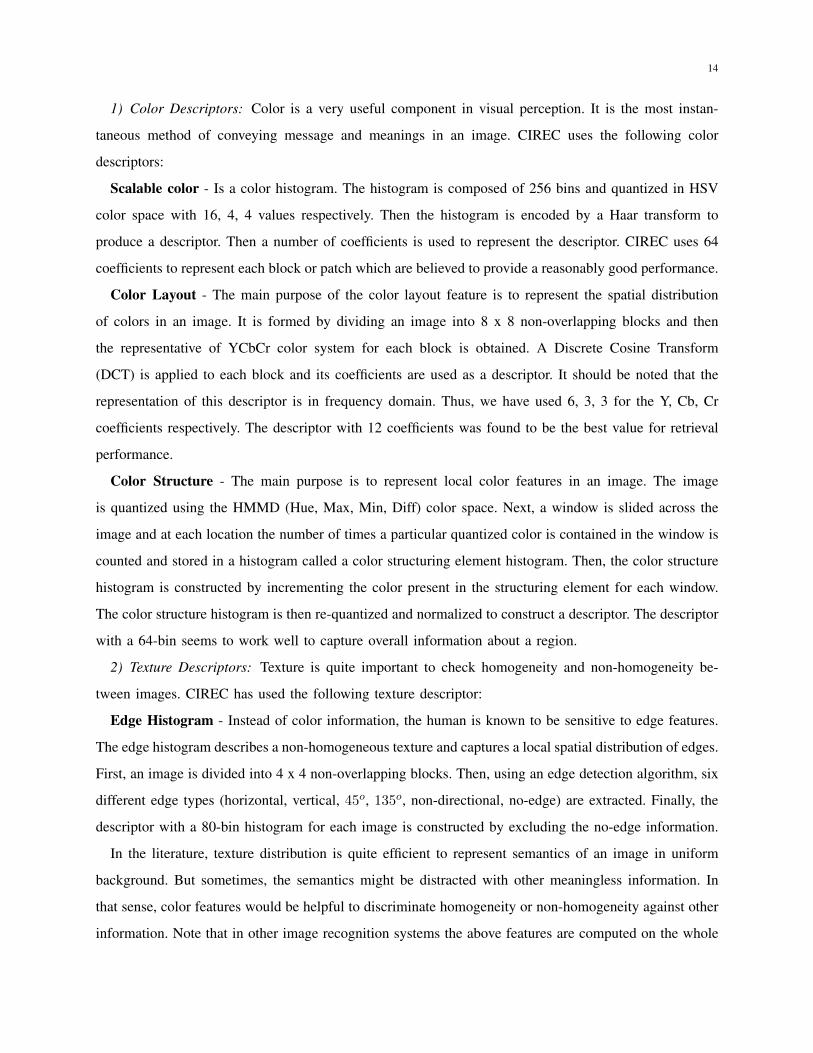
1) Color Descriptors: Color is a very useful component in visual perception. It is the most instan-
taneous method of conveying message and meanings in an image. CIREC uses the following color
descriptors:
Scalable color - Is a color histogram. The histogram is composed of 256 bins and quantized in HSV
color space with 16, 4, 4 values respectively. Then the histogram is encoded by a Haar transform to
produce a descriptor. Then a number of coefficients is used to represent the descriptor. CIREC uses 64
coefficients to represent each block or patch which are believed to provide a reasonably good performance.
Color Layout - The main purpose of the color layout feature is to represent the spatial distribution
of colors in an image. It is formed by dividing an image into 8 x 8 non-overlapping blocks and then
the representative of YCbCr color system for each block is obtained. A Discrete Cosine Transform
(DCT) is applied to each block and its coefficients are used as a descriptor. It should be noted that the
representation of this descriptor is in frequency domain. Thus, we have used 6, 3, 3 for the Y, Cb, Cr
coefficients respectively. The descriptor with 12 coefficients was found to be the best value for retrieval
performance.
Color Structure - The main purpose is to represent local color features in an image. The image
is quantized using the HMMD (Hue, Max, Min, Diff) color space. Next, a window is slided across the
image and at each location the number of times a particular quantized color is contained in the window is
counted and stored in a histogram called a color structuring element histogram. Then, the color structure
histogram is constructed by incrementing the color present in the structuring element for each window.
The color structure histogram is then re-quantized and normalized to construct a descriptor. The descriptor
with a 64-bin seems to work well to capture overall information about a region.
2) Texture Descriptors: Texture is quite important to check homogeneity and non-homogeneity be-
tween images. CIREC has used the following texture descriptor:
Edge Histogram - Instead of color information, the human is known to be sensitive to edge features.
The edge histogram describes a non-homogeneous texture and captures a local spatial distribution of edges.
First, an image is divided into 4 x 4 non-overlapping blocks. Then, using an edge detection algorithm, six
different edge types (horizontal, vertical, 45o, 135o, non-directional, no-edge) are extracted. Finally, the
descriptor with a 80-bin histogram for each image is constructed by excluding the no-edge information.
In the literature, texture distribution is quite efficient to represent semantics of an image in uniform
background. But sometimes, the semantics might be distracted with other meaningless information. In
that sense, color features would be helpful to discriminate homogeneity or non-homogeneity against other
information. Note that in other image recognition systems the above features are computed on the whole

15
image, but in CIREC these features are computed in each region separately.
B. Cluster Correlogram Indexing
Histograms of codewords have been widely used and demonstrated impressive levels of performance
in image classification and categorization applications [3], [2], [25]. However, because these methods
disregard information about the spatial relation between local features, existing results still leave room
for improvements. Here, we propose cluster correlograms using MPEG-7 descriptors as features to be
fed into classification techniques. Besides the spatial relation, more high-level features such as shape or
texture information can be captured to improve the indexing performance.
Once the low-level features are extracted, the next step is to organize these features to obtain high-level
information about context in the images. Based on these considerations, we have proposed two methods
to represent regions in an image that can work with any type of low-level visual descriptor as shown in
Fig. 6.
Fig. 6. Top-half: The Fixed partitioning correlogram indexing. Bottom-half: The Saliency-based correlogram indexing.
1) Cluster Correlogram using Fixed Partitioning Approach: As mentioned, in this scheme each image
is divided into a certain number of fixed size rectangular blocks shown in Fig. 1(left). The cluster
correlogram is now computed based on the cluster indices in the fixed regions, where the cluster indices

16
are obtained by k-means clustering on MPEG-7 descriptions of all blocks of all images. Thus, the
cluster correlogram uses cluster indices of regions instead of pixel colors, and the rest is similar to the
color correlogram described by Equation (1). Clusters which have a regional distance smaller than 2
are used for computing the cluster correlogram (which means that every region is correlated with its 8
neighbors). Note that since we cluster the four MPEG-7 descriptions separately, we finally obtain four
cluster correlograms. If we would combine them in a Cartesian product, the combined correlogram would
become too large. Furthermore, we will feed the cluster correlograms to a machine learning algorithm
that can find non-linear patterns in an automatic data-driven way.
Fig. 7. Difference between fixed partitioning correlogram descriptor and saliency-based correlogram descriptor. Left: A
descriptor is formed by applying a distance δ and phase ϕ to the specific region. Right: A descriptor is formed by finding the
δ nearest patches to the current patch points.
2) Cluster Correlogram using Saliency-based Approach: In this scheme, SURF is used to divide an
image into various rectangular patches. The patches which are processed recursively, are composed of
different sizes and locations as shown in Fig 1(right). For speed reasons we do not perform the orientation
related computations on these patches. Once the cluster index for each patch is calculated, the next step
is to construct the cluster correlogram. The spatial relation is constructed by considering the δ nearest
patches from a current patch point. Finally, all points will be visited to construct the correlogram. Fig. 7
shows the difference between the fixed partitioning and saliency-based approaches for the construction
of the cluster correlogram.
C. Similarity Matching and Classification
Once the signatures of all images are obtained, they can be used to determine the category of an
unlabeled test image. The feature vector of each signature is represented by a 2D m x m matrix where m

17
is the number of clusters. Note that since we use four feature descriptors, we have four different signatures.
The m value is varied and it depends on the number of clusters used in the clustering algorithm. If m
clusters are used then the feature dimension size for each image would be 4m2.
1) k-Nearest Neighbors Classifier: First, the k-nearest neighbors (k-NN) algorithm is used to classify
a given test image. The k-NN is a simple classifier based on the idea that similar observations belong
to similar classes. This learning algorithm consists of a training phase and testing phase. In the training
phase, a training dataset is constructed which could be described by the set of labeled examples P =
{(a1, c1), (a2, c2), ..., (ai, ci)} where ai is a training pattern in the training data set, ci is its corresponding
class and i = 1...n is the number of training patterns. In the testing phase, the query starts at a given
unlabeled point and the algorithm generates a list of the k nearest records from the entire set of training
patterns. Then, the classification is done by a majority voting scheme to label the class of a test image.
The similarity between two feature vectors is measured by using the Manhattan distance between two
images described by four cluster correlograms. We chose the Manhattan distance because it gives the
best performance in our experiments.
2) SVM Classifier: Besides k-NN classification, we employ an SVM [6] to classify and categorize the
input images. The one-vs-one approach is used to train and classify images in the Corel and PASCAL
datasets. The cluster correlogram is quite large and therefore we use SVM’s linear kernel for learning
and classifying images [35].
Initially, all attributes in training and testing were normalized to the interval [-1,+1]. The normalization
is used to avoid numerical difficulties during the calculation and to make sure the larger values do not
dominate the smaller ones. To optimize the classification performance, of course the kernel parameter C
has to be determined. In our case, all experiments were performed for
values of C in the interval from 24 to 1024, in 100 steps using the libSVM library [36].
V. EXPERIMENTS
For a more robust comparison between the proposed algorithms, a variety of datasets are needed.
Besides that, the datasets used should be familiar to CBIR and machine vision researchers. To demonstrate
the performance of our proposed algorithms, we have used two well known datasets namely Corel1 and
PASCAL2. These datasets contain various image sizes and were categorized into 10 different classes.
1The dataset is available from http://www.corel.com2PASCAL stands for pattern analysis, statistical modeling and computational learning. The dataset is available from
http://www.pascal-network.org/challanges/VOC/

18
We will explain the evaluation measures, the datasets, and the performance results of our proposed
algorithms compared to other systems in the following subsections.
A. Evaluation Methods
In the experiments we have used three evaluation measures, namely the average precision, a confusion
matrix and receiver operating characteristics curve (ROC-curve). The reason why we have chosen to use
these measures is that they are standardized, and they will enable us to compare our proposed algorithms
with other systems.
1) Average precision: For evaluating CIREC’s retrieval performance, we compute the average precision
on the queries. In general, we want to have N images returned having the same category as the query
image. In our comparison all images will be used one time as a query image. The precision is then
computed as follows. Let Rank(Q, Ii) ε [1,n] be the rank of retrieved image Ii from the database, where
n is the number of images in a dataset and Q is a query image. The images having a rank below some
number N may contain relevant and irrelevant images. Next, let C(Q, Ii) denote that the retrieved image
Ii has the same category as the query image Q. The precision (P) of the first N retrieved images for a
query Q is defined as:
P (Q, N) =| {Ii|Rank(Q, Ii) ≤ N
∧C(Q, Ii)} |
N(9)
We used it to compare our algorithms with other systems for the Corel dataset.
2) Confusion matrix: The confusion matrix is used to compute the accuracy of the classification
models. It can be used to visualize the errors on a given image category. A k-nearest neighbor classifier
using majority voting of the retrieved images and an SVM are used to categorize a test image. For the
k-NN classifier various values of k are tested. We have introduced a rule which says that when multiple
categories have the same number of votes with a particular k > 1, the query image is assigned to the
category with the lowest index.
3) Receiver Operating Characteristic Curve (ROC): The ROC-curve is generally used to evaluate
a classifier’s performance or to compare different classifiers. It is widely used especially to determine
the threshold that gives a large number of correct classifications while keeping the number of false
positive matches low. The ROC curve is measured by calculating the relationship between the sensitivity
(True Positive Rate (TPR)) and the specificity (False Positive Rate (FPR)). To have a single performance
measure, we compute the area under the ROC curve (AUC). This measure is used to compare our

19
TABLE I
PARAMETERS USED IN COREL DATASET
Visual Descriptors Fixed Partitioning Salient Points
size cluster neighbor cluster
Scalable Color 16x16 24 8 24
Color Layout 16x16 24 8 24
Color Structure 24x24 32 8 24
Edge Histogram 16x16 24 32 24
TABLE II
PARAMETERS USED IN PASCAL DATASET
Visual Descriptors Fixed Partitioning Salient Points
size cluster neighbor cluster
Scalable Color 28x28 32 30 32
Color Layout 28x28 32 30 32
Color Structure 28x28 32 30 32
Edge Histogram 28x28 32 30 32
algorithms with other systems on the PASCAL dataset. We do not use accuracy here, since an image in
the PASCAL dataset can consist of multiple objects that need to be detected.
B. Evaluation on Datasets
We have used two different datasets to measure the performance of the proposed algorithms. The Corel
and PASCAL datasets are used to compare the two schemes to each other and some other algorithms
like the MPEG-7 features and the color correlogram. We test the algorithms with different numbers of
blocks, clusters, and neighbors using the k-NN classifier as mentioned in Table I and Table II. The values
of the parameters were determined in the training session by a trial and test approach. Finally, the best
parameters are then used for the k-NN and the SVM classifiers.
1) Corel dataset: The Corel dataset has become a de-facto standard in demonstrating the performance
of CBIR systems [12][13]. In general, Corel contains a collection of more than 800 photo CDs and
about 100 images for each theme. We used the first 10 categories and a total of 10x100=1000 images
for evaluation, also known as the Wang dataset [12]. These images are all in JPEG format with size 384

20
x 256 or 256 x 384 and were categorized into 10 different groups namely Africans, beaches, buildings,
buses, dinosaurs, elephants, flowers, horses, mountains and foods. In this dataset, there is only one interest
object category for each image and its appearance looks consistently good. The position of the interest
object is approximately centered or takes up most of the whole image size. Besides that, the pictures
taken in each group tend to be similar in viewpoints and orientations. The images seem to be simple with
little or no occlusion and clutter. Fig. 8 shows the ground truth for different groups in the Corel dataset.
Fig. 8. Image examples with ground truth for different groups namely Africans, beaches, buildings, buses, dinosaurs, elephants,
flowers, horses, mountains and foods respectively.
For evaluating the fixed partitioning and saliency-based approach and further comparing it to using the
color correlogram and global MPEG-7 features, we first compute the precision of the retrieved images
on the queries. In our comparison all images will be used one time as a query image. The precision is
then computed using equation (9). Table III shows the average precision of the fixed partitioning (M1) ,
salient points (M2), color correlogram (M3) and MPEG-7 visual descriptors (M4) (with δ = 1) over 10,
20, 30, 40 and 50 retrieved images for each group using the k-NN classifier. The results clearly show
that the cluster correlogram with the fixed partitioning and salient points schemes outperforms the other
methods and that the fixed partitioning performs slightly better than the salient points scheme.
We have also compared our proposed algorithms with another CBIR system based on the wavelet
correlogram [37]. In this comparison, the same methodology of evaluation is used to compute the average
precision for every query image. When retrieving 10 images, the precision of the wavelet correlogram is

21
TABLE III
THE AVERAGE PRECISION ON THE DIFFERENT APPROACHES. M1=FIXED PARTITIONING, M2=SALIENT POINTS,
M3=COLOR CORRELOGRAM, AND M4=MPEG-7.
Number of retrieved images
10 20 30 40 50
M1 0.80 0.76 0.73 0.70 0.67
M2 0.78 0.74 0.71 0.68 0.65
M3 0.71 0.65 0.61 0.58 0.56
M4 0.62 0.56 0.52 0.50 0.47
TABLE IV
THE AVERAGE CATEGORIZATION PRECISION RESULTS USING A K-NEAREST NEIGHBORS CLASSIFIER. THE BEST RESULT IS
MARKED IN BOLDFACE.
k 1 3 5 7 9 19
Fixed Partitioning 87.9 89.4 89.2 89.7 88.2 88.0
Salient Points 85.4 86.5 87.4 88.6 87.5 87.1
Color Correlogram 80.7 81.2 80.4 80.7 81.5 80.0
MPEG− 7 71.4 74.8 74.8 74.5 73.7 72.8
0.73, which is much lower than the performance of our proposed systems.
To measure the fixed partitioning and saliency-based performances for image categorization, we have
tested these schemes in combination with the k-nearest neighbor method (k-NN). Table IV shows the
overall image categorization performance of the fixed partitioning and saliency-based schemes using the
k-nearest neighbors classifier. We have tested with various values of k namely k = 1, 3, 5, 7, 9, and 19. In
this experiment, the fixed partitioning gives the best performance with k = 7 and yields 89.7% correctly
classified images. Other state-of-the-art categorization systems that have been applied to categorize images
of the same Corel dataset are: (1) the use of a set of features and support vector machines (SVMs) [38],
(2) invariant feature histogram [39], and (3) a system that combined five different features [40]. These
systems scored 81.5%, 84.5%, and 87.3% respectively, on the same dataset. This indicates that the fixed
partitioning with MPEG-7 correlograms performs very well and works well in combination with a simple
k-NN classifier.
We have also done experiments with a support vector machine using the cluster correlogram and a
bag of keywords (or cluster histogram). Table V shows the results for the experiment with the SVM.

22
TABLE V
THE AVERAGE CATEGORIZATION PRECISION RESULTS USING AN SVM.
Cluster Correlogram Cluster Histogram
fixed partitioning salient points fixed partitioning salient points
93.4 91.8 92.9 90.8
TABLE VI
THE CONFUSION MATRIX OF IMAGE CATEGORIZATION USING THE FIXED PARTITIONING WITH SVM. A=AFRICANS,
B=BEACHES, C=BUILDINGS, D=BUSES, E=DINOSAURS, F=ELEPHANTS, G=FLOWERS, H=HORSES, I=MOUNTAINS, AND
J=FOODS.
A B C D E F G H I J
A 89 1 1 0 1 7 0 0 1 0
B 2 85 2 1 0 0 1 1 8 0
C 1 4 86 2 0 4 1 0 0 2
D 0 1 0 98 0 0 0 0 0 1
E 0 0 0 0 100 0 0 0 0 0
F 1 0 1 0 0 94 0 3 1 0
G 0 0 0 0 0 0 99 0 0 1
H 0 1 0 0 0 0 0 99 0 0
I 0 7 0 0 0 3 0 0 90 0
J 2 1 0 1 0 0 0 0 2 94
It is shown that the SVM significantly outperforms the k-NN. Furthermore, the cluster correlogram
outperforms the cluster histogram even though we experimentally optimized the number of clusters for
the cluster histogram. Finally we have used 320 clusters when fixed partitioning was used and 256 clusters
using salient points. The clustering using k-means clustering took much more computational time than
the use of the small number of clusters that were used in the cluster correlogram. Therefore the results
show that the cluster correlogram clearly has advantages for the Corel dataset compared to a cluster
histogram.
We also show the results of using the fixed partitioning for image categorization with SVM in a
confusion matrix in table VI. The confusion matrix is a square matrix that shows the various classifications
and misclassifications of the classifier. In the confusion matrix, numbers on the diagonal are correct
classifications and off-diagonal numbers correspond to misclassifications. A detailed examination of the

23
Fig. 9. Some sample images are misclassified. The first row is misclassified as ”Beaches” and the second row as ”Mountains
(with glaciers)”. The first and second rows should be classified as ”Mountains (with glaciers)” and ”Beaches” respectively.
TABLE VII
THE CONFUSION MATRIX OF IMAGE CATEGORIZATION USING THE SALIENT POINTS WITH SVM. A=AFRICANS,
B=BEACHES, C=BUILDINGS, D=BUSES, E=DINOSAURS, F=ELEPHANTS, G=FLOWERS, H=HORSES, I=MOUNTAINS, AND
J=FOODS.
A B C D E F G H I J
A 88 2 3 0 0 6 0 0 0 1
B 3 80 2 1 0 2 1 0 9 2
C 1 1 90 1 0 2 1 0 3 1
D 0 1 0 99 0 0 0 0 0 0
E 0 0 0 0 99 0 0 0 0 1
F 4 1 2 0 0 87 0 3 3 0
G 1 0 0 0 0 1 98 0 0 0
H 0 1 0 0 0 0 0 99 0 0
I 0 8 1 0 0 3 3 1 84 0
J 0 3 1 0 0 0 0 0 2 94
confusion matrix shows that there are two distinct misclassifications (the underlined numbers in Table VI).
The model is slightly confused to make distinctions between ”Beaches” and ”Mountains (with glaciers)”.
The difficulty of distinguishing between these two categories has also been noted in other studies. Fig. 9
shows misclassified images from both categories. For a detailed comparison the confusion matrix of the
salient points scheme is displayed in Table VII. The salient points scheme performs better for predicting
buildings and much worse for mountains than fixed partitioning. Finally, the confusion matrix also shows
that often Africans are categorized as Elephants, which can be explained by the similar backgrounds.
2) PASCAL dataset: This dataset is used to compare our algorithms with other systems as reported
in the 2006 PASCAL challenge. The dataset is designed to recognize objects from a number of visual

24
object classes in realistic scenes. Ten object classes are provided in the dataset namely bicycle, bus, car,
motorbike, cat, cow, dog, horse, sheep and person. Each category has a different number of photos and
have various image sizes. The images are collected from the photo-sharing web-site ”flickr”3 and some are
provided by Microsoft Research Cambridge4. In total there are 5304 images that contain 9507 annotated
object in the dataset. The dataset is quite complicated and sometimes quite difficult for recognition
purposes. The images are taken from different points of view and orientations and objects do not take up
most of the image. Many objects are occluded and there is background clutter with unwanted objects.
Besides that, the quality of the images is not as good in the Corel dataset. Fig. 11 shows the ground
truth for different groups in the PASCAL dataset.
Fig. 10. Image examples with ground truth for different groups namely Bicycles, buses, cars, cats, cows, dogs, horses, motorbikes,
persons, and sheep.
In the PASCAL challenge [4], there were three types of image sets provided to be used in the
classification task, namely training data, validation data and test data. The dataset is split into 2618
images for training or validation and 2686 images for testing. Here k-NN and the SVM algorithms
are used on this dataset to measure the performance of the cluster correlogram and cluster histogram
with the fixed partitioning and saliency-based approaches. In the cluster histogram, we used 200 visual
3The photos can be accessed at http://www.flickr.com/4http://research.microsoft.com/cambridge/

25
codewords by clustering MPEG-7 features with k-means. Note that, the clustering algorithm takes a long
time to obtain 200 visual codewords from the training or validation images. Therefore, we saved time
by choosing only 50 images for clustering from each group. In total, we used 500 images to construct
the visual codewords. After that, we represent each image as the histogram of visual keywords. For the
cluster correlogram we used the parameters of Table II. Table VIII shows the overall image categorization
performance of the k-NN and SVM classifiers and different approaches. For k-NN, we have tested the
classifier with various values of k. We found that k = 21, 35, 41, 45, 49 and 35 gave the best performance
for M1, M2, M3, M4, M5 and M6 respectively.
The best result as measured by the ROC curve is underlined. In contrast to the previous experiment,
this time the saliency based approach outperforms the fixed partitioning scheme in many categories.
The cluster correlogram clearly outperforms the cluster histogram, color correlogram, and the use of
MPEG-7 features alone. The SVM outperforms the K-NN. THe system clearly has most difficulties with
recognizing persons. Finally, we have compared our approaches with other experimental results using
the average ROC curve values on ten categories. In the first round of the PASCAL 2006 challenge,
the best team, QMULLSPCH achieved an average AUC of 0.936 whereas the lowest ranked team (at
place 18), AP06Batra, achieved an AUC of 0.702. The fixed partitioning and salient points approaches
would be ranked top ten (at place 6 and 7 respectively) in the competition and therefore seem to perform
reasonably well on this dataset. In contrast with the best result in this challenge, our methods are based
on indexing on whole images. This indicates that the cluster correlogram is quite well without using a
time-consuming detector to search for objects in an image.
VI. DISCUSSION
The proposed cluster correlogram with MPEG-7 features can deal very well with large objects or natural
scenes where background information is informative. This system clearly outperforms other state of the
art systems for the Corel dataset. However, since our system categorizes the whole image, it performs
a bit worse for recognizing small objects as needed for the PASCAL dataset. The fixed partitioning
performs better on the Corel dataset and the salient points method performs better on the PASCAL
dataset. Especially for recognizing objects, there can be an advantage for the salient point scheme.
On the Corel dataset, the confusion matrices in Table VI and Table VII show that the salient points
scheme is lacking in categorizing the beaches category compared to the fixed partitioning scheme.
Generally, there are four factors that could influence the correlogram indexing, namely number of boxes,
number of clusters, number of neighbors and size of boxes. This will indirectly affect the retrieval and

26
TABLE VIII
RESULTS ON DIFFERENT CLASSIFIERS AND APPROACHES AS MEASURED BY THE AREA UNDER THE ROC CURVE (AUC).
THE BEST RESULT IS UNDERLINED. M1=CLUSTER CORRELOGRAM WITH FIXED PARTITIONING, M2=CLUSTER
CORRELOGRAM WITH SALIENT POINTS, M3=COLOR CORRELOGRAM, M4=MPEG-7, M5=CLUSTER HISTOGRAM WITH
FIXED PARTITIONING AND M6=CLUSTER HISTOGRAM WITH SALIENT POINTS
k-NN SVM
Categories M1 M2 M3 M4 M5 M6 M1 M2 M3 M4 M5 M6
bicycle 0.860 0.862 0.768 0.764 0.851 0.845 0.886 0.909 0.825 0.876 0.845 0.847
bus 0.896 0.919 0.796 0.809 0.870 0.883 0.950 0.951 0.877 0.913 0.896 0.899
car 0.933 0.939 0.834 0.855 0.905 0.917 0.949 0.953 0.846 0.934 0.905 0.918
cat 0.841 0.837 0.790 0.751 0.851 0.845 0.876 0.875 0.817 0.861 0.864 0.855
cow 0.878 0.881 0.839 0.787 0.892 0.899 0.908 0.911 0.860 0.896 0.881 0.885
dog 0.784 0.798 0.723 0.717 0.803 0.817 0.817 0.814 0.752 0.810 0.816 0.807
horse 0.814 0.773 0.717 0.670 0.808 0.773 0.845 0.850 0.742 0.837 0.789 0.784
motorbike 0.848 0.898 0.740 0.762 0.838 0.874 0.924 0.940 0.839 0.894 0.854 0.868
person 0.742 0.748 0.646 0.639 0.677 0.692 0.771 0.778 0.706 0.762 0.660 0.678
sheep 0.881 0.892 0.860 0.810 0.896 0.903 0.908 0.913 0.879 0.910 0.876 0.906
average 0.848 0.855 0.771 0.756 0.839 0.845 0.883 0.889 0.814 0.869 0.839 0.845
categorization performance. For instance, in Fig 11, it is clearly shown why fixed partitioning outperforms
the salient points in the beaches category of the Corel dataset. The number of salient points only covers
a very small portion of the beach scene. As a result there is information loss and less distinctive indexing
of an image.
Fig. 11. The effect of the number of patches in correlogram and histogrram construction. Salient points (right) would result
in coarse indexing when the number of salient points is small. This problem is not happening when using the fixed partitioning
scheme (left).
VII. CONCLUSION
We have introduced a new method to combine visual MPEG-7 descriptors with spatial information,
by the use of cluster correlograms. The primitives of MPEG-7 visual descriptors are used to extract and
group similar patterns into a keyword index. The k-NN and SVM algorithms are used to classify the

27
test images. The experiments show that the proposed methods provide useful information to represent
images. Our experimental results on real world datasets show that the use of MPEG-7 visual descriptors
in a clustering algorithm provide very good results on the Corel dataset, but perform less on the PASCAL
dataset. Interesting research directions that remain are the modeling of visual objects in the PASCAL
dataset more explicitly and rely less on background information. We will also use other descriptors such
as the SIFT descriptor [20] and combine them with the MPEG-7 features.
ACKNOWLEDGMENT
The authors want to thank the providers of the MPEG-7 standard from http://www.semanticmetadata.net/features/
and Hado van Hasselt for helpful comments. The first author also wants to thank the government of
Malaysia for the Ph.D. grant.
REFERENCES
[1] S. Santini and R. Jain, “Beyond query by example,” IEEE Second Workshop on Multimedia Signal Processing, pp. 3–8,
1998.
[2] F. Perronnin, C. Dance, G. Csurka, and M. Bressan, “Adapted vocabularies for generic visual categorization,” European
Conference on Computer Vision (ECCV 2006), pp. 464–475, 2006.
[3] F.-F. Li and P. Perona, “A Bayesian hierarchical model for learning natural scene categories,” in CVPR ’05: Proceedings of
the 2005 IEEE Computer Society Conference on Computer Vision and Pattern Recognition (CVPR’05), vol. Vol. 2. IEEE
Computer Society, 2005, pp. 524–531.
[4] M. Everingham, A. Zisserman, C. K. I. Williams, and L. Van Gool, “The PASCAL Visual Object Classes Challenge 2006
(VOC2006) Results,” http://www.pascal-network.org/challenges/VOC/voc2006/results.pdf.
[5] H. Bay, T. Tuytelaars, and L. van Gool, “SURF: Speeded up robust features,” The ninth European Conference on Computer
Vision, vol. Vol. III, pp. 404–417, 2006.
[6] V. Vapnik, “The nature of statistical learning theory. springer-verlag, new york,” 1995.
[7] A. Abdullah and M. A.Wiering, “CIREC : Cluster correlogram image retrieval and categorization using MPEG-7
descriptors,” IEEE Symposium on Computational Intelligence in Image and Signal Processing, pp. 431 – 437, 2007.
[8] L. Setia, A. Teynor, A. Halawani, and H. Burkhardt, “Image classification using cluster co-occurrence matrices of local
relational features.” in Multimedia Information Retrieval. ACM, 2006, pp. 173–182.
[9] J. Huang, S. Kumar, M. Mitra, W. Zhu, and R. Zabih, “Image indexing using color correlograms,” in Proceedings of the
1997 Conference on Computer Vision and Pattern Recognition (CVPR ’97)., 1997, pp. 762–768.
[10] R. Veltkamp, M. Tanase, and D. Sent, “Features in content-based image retrieval systems: A survey,” in State-of-the-Art
in Content-Based Image and Video Retrieval. Kluwer, 2001, pp. 97–124.
[11] K. Hirata and T. Kato, “Query by visual example-content based image retrieval,” Proc. of 3rd international conference on
extending database technology, vol. Vol. 580, pp. 56–71, March 1992.
[12] J. Z. Wang, J. Li, and G. Wiederhold, “SIMPLIcity: Semantics-sensitive integrated matching for picture Libraries,” IEEE
Transactions on Pattern Analysis and Machine Intelligence, vol. Vol. 23, no. 9, pp. 947–963, 2001.

28
[13] C. Carson, M. Thomas, S. Belongie, J. M. Hellerstein, and J. Malik, “Blobworld: A system for region-based image indexing
and retrieval,” Third International Conference on Visual Information Systems, pp. 509–516, 1999.
[14] J. R. Smith and S.-F. Chang, “Visualseek: A fully automated content-based image query system,” in ACM Multimedia,
1996, pp. 87–98.
[15] M. Flickner, H. Sawhney, W. Niblack, J. Ashley, Q. Huang, and B. Dom, “Query by image and video content: The QBIC
system,” in IEEE Computer Magazine, 1995, pp. 23–30.
[16] A. Pentland, R. Picard, and S. Sclaroff, “Photobook: Content-based manipulation of image databases,” International Journal
of Computer Vision, pp. 233–254, 1996.
[17] V. Ferrari, T. Tuytelaars, and L. van Gool, “Simultaneous object recognition and segmentation by image exploration,”
Lecture Notes in Computer Science, vol. Vol. 3021/2004, pp. 145–172, 2006.
[18] R. Maree, P. Geurts, J. Piater, and L. Wehenkel, “Random subwindows for robust image classification,” Computer Vision
and Pattern Recognition, 2005. CVPR 2005. IEEE Computer Society Conference on, vol. Vol. 1, pp. 34–40, 2005.
[19] T. Tuytelaars and K. Mikolajczyk, “A survey on local invariant features,” The ninth European Conference on Computer
Vision 2006 Tutorial, 2006.
[20] D. Lowe, “Distinctive image features from scale-invariant keypoints,” International Journal of Computer Vision, pp. 315–
333, 2004.
[21] J. Wang, H. Zha, and R. Cipolla, “Combining interest points and edges for content-based image retrieval,” International
Conf. on Image Processing, vol. Vol. III, pp. 1256–1259, 2005.
[22] Y. Ke and R. Sukthankar, “PCA-SIFT: a more distinctive representation for local image descriptors,” in Proceedings of
IEEE Conference on Computer Vision and Pattern Recognition, 2004, pp. II: 506–513.
[23] L. Ledwich and S. Williams, “Reduced SIFT features for image retrieval and indoor localisation,” Australian Conf. on
Robotics and Automations, 2004.
[24] A. Pinz, “Object categorization,” Foundations and Trends in Computer Graphics and Vision, pp. 1(4): 255–353, 2006.
[25] G. Csurka, C. Dance, L. Fan, and C. Bray., “Visual categorization with bag of keypoints,” in The 8th European Conference
on Computer Vision, 2004, pp. III:513–516.
[26] S. Ullman, E. Sali, and M. Vidal Naquet, “A fragment-based approach to object representation and classification,” Lecture
Notes in Computer Science, vol. Vol. 2059, pp. 85–102, 2001.
[27] R. Haralick, “Statistical and structural approaches to texture,” Proceedings of IEEE, vol. Vol. 67, no. 5, pp. 786–804, 1979.
[28] T. Reed and J. du Buf, “A review of recent texture segmentation and feature extraction techniques,” Computer Vision
Graphics and Image Processing: Image Understanding, vol. Vol. 57, no. 3, pp. 359–372, 1993.
[29] A. K. Jain, M. N. Murty, and P. J. Flynn, “Data clustering: a review,” ACM Computing Surveys, vol. Vol. 31, no. 3, pp.
264–323, 1999.
[30] K. Ishwar, I. Sethi, and Coman, “Color-WISE : A system for image similarity retrieval using color,” Proc. Storage and
Retrieval for Image and Video Databases, vol. Vol. 3312, pp. 140–149, 1997.
[31] J. Smith and S.-F. Chang, “Tools and techniques for color image retrieval,” in Storage and Retrieval for Image and Video
Databases (SPIE), 1996, pp. 426–437.
[32] P. Viola and M. Jones, “Rapid object detection using a boosted cascade of simple features,” in Proc. on Computer Vision
and Pattern Recognition (CVPRO ’01), 2001, pp. I:511–518.
[33] MPEG-7, “MPEG-7 overview of the MPEG-7 standard (version 5.0),” in ISO/IEC JTC1/SC29/WG11 N4031, 2001.
29
[34] B. Manjunath, P. Salembier, and T. Sikora, “Introduction to MPEG 7: Multimedia content description language,” in Wiley,
New York, 2001.
[35] C. Hsu, C. Chang, and C. Lin, “A practical guide to support vector classification,” 2001. [Online]. Available:
citeseer.ist.psu.edu/689242.html
[36] C. Chang and C. Lin, “Libsvm: a library for support vector machines,” 2001. [Online]. Available:
citeseer.ist.psu.edu/chang01libsvm.html
[37] H. Abrishami, A. Roohi, and T. Taghizadeh, “Wavelet correlogram: A new approach for image indexing and retrieval,”
The Journal of the Pattern Recognition Society, pp. 2506–2518, 2005.
[38] Y. Chen and J. Wang, “Image categorization by learning and reasoning with regions,” Journal of Machine Learning
Research, vol. Vol. V, pp. 913–939, 2004.
[39] T. Deselaers, D. Keysers, and H. Ney, “Features for image retrieval: A quantitative comparison,” Lecture Notes in Computer
Science, vol. Vol. 2021/2004, pp. 40–45, 2004.
[40] ——, “Classification error rate for quantitative evaluation of content-based image retrieval systems,” In ICPR 2004,
International Conference on Pattern Recognition,Cambridge, UK,, vol. Vol. I, pp. 248–251, August 2004.