Embed Size (px)
Citation preview
Fixing Philippine Public FinanceIs Federalism the Answer?
Ronald Umali Mendoza, PhDAteneo School of Government
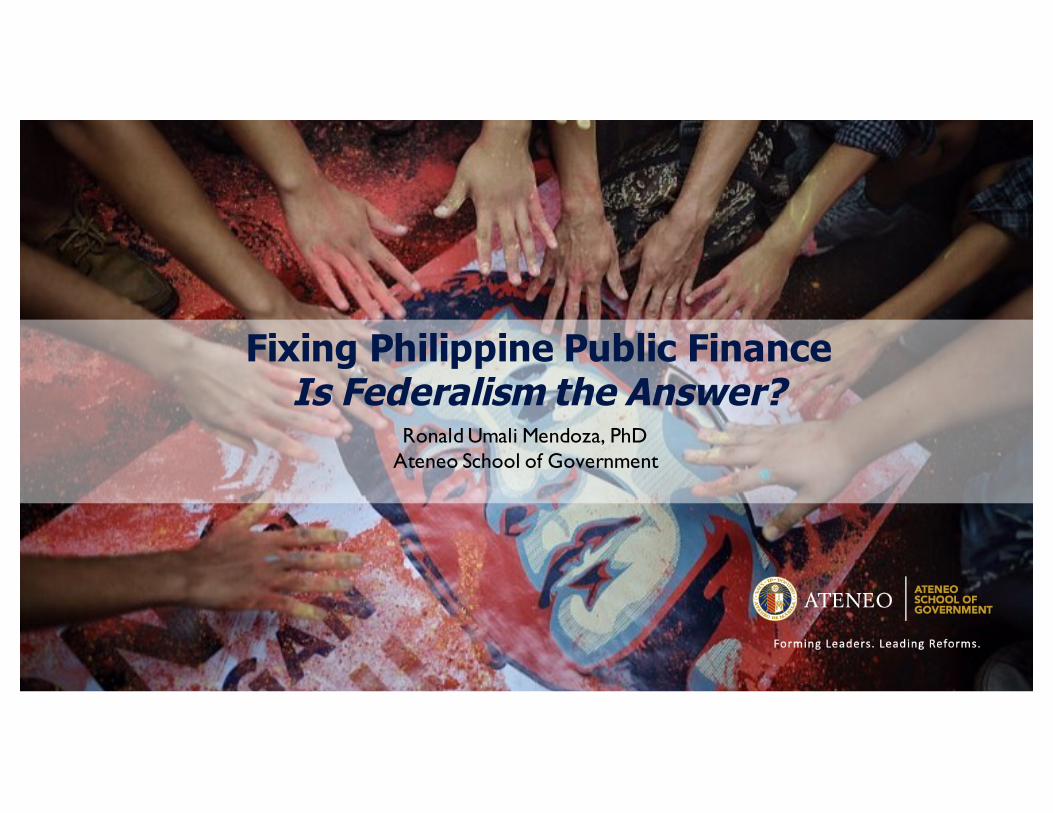
Two lost decades…
500
1000
1500
2000
2500
3000
1960
1962
1964
1966
1968
1970
1972
1974
1976
1978
1980
1982
1984
1986
1988
1990
1992
1994
1996
1998
2000
2002
2004
2006
2008
2010
2012
2014
2016
Tradeliberalizationandimportsubstitution
Exportpromotion
Economicexpansionandprivatizationofstate-ownedenterprise
Postponementofliberalizationonsomesectorsand
increasingprotectionism
Debt– drivengrowth
Expansionofservicesectoranddeclinein
manufacturingRapideconomic
growth
Garcia Macapagal Marcos C.Aquino RamosEstrada
ArroyoAquino
Duterte
TWOFOLDINCREASEINTHEECONOMY,1960TOPRESENT
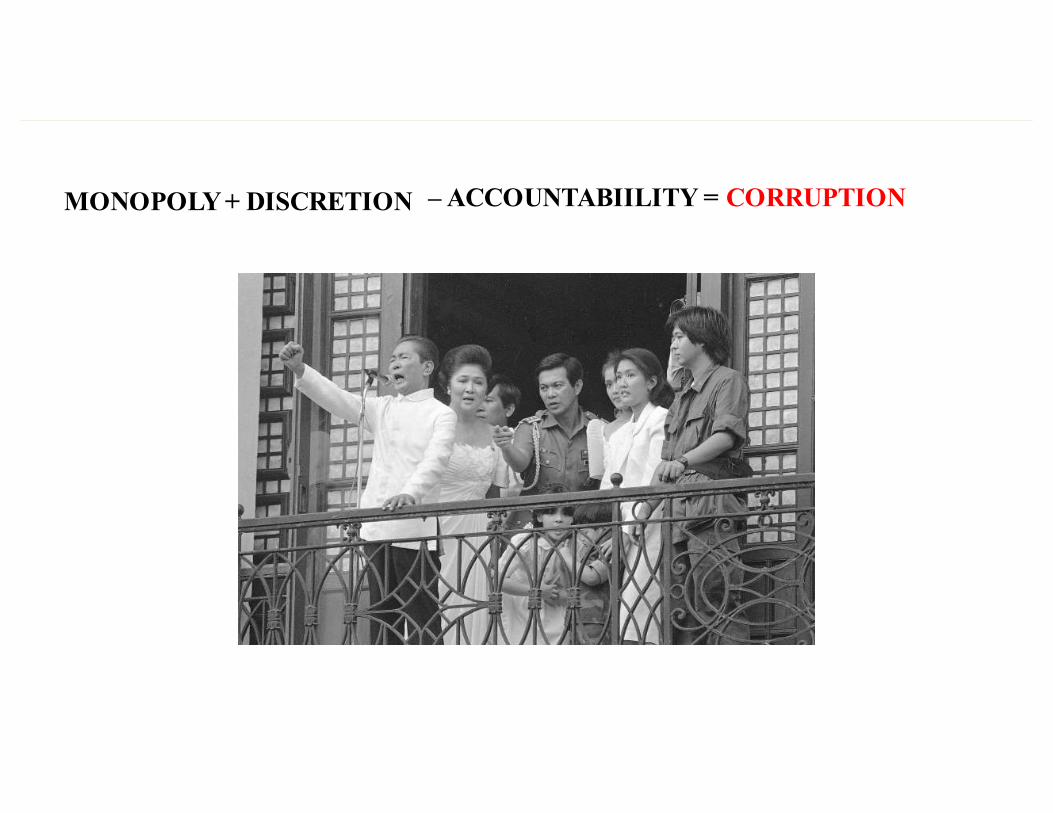
TextMONOPOLY + DISCRETION – ACCOUNTABIILITY = CORRUPTION
Text
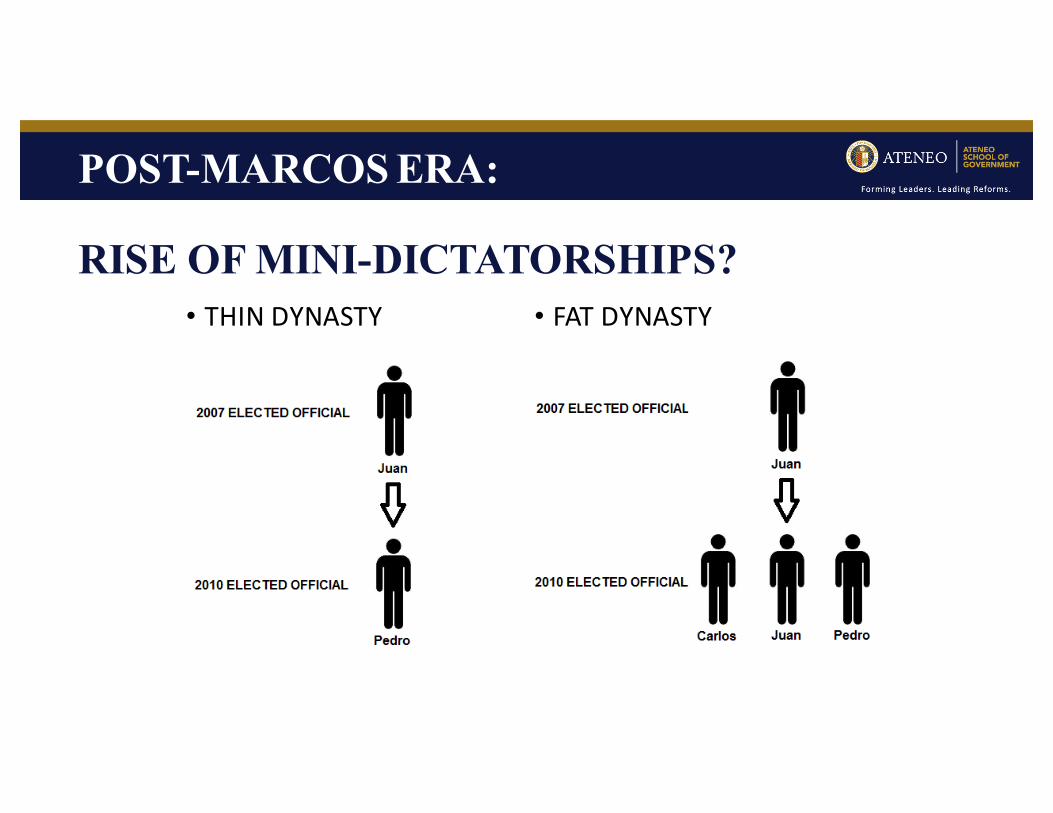
• THINDYNASTY • FATDYNASTY
POST-MARCOS ERA:
RISE OF MINI-DICTATORSHIPS?
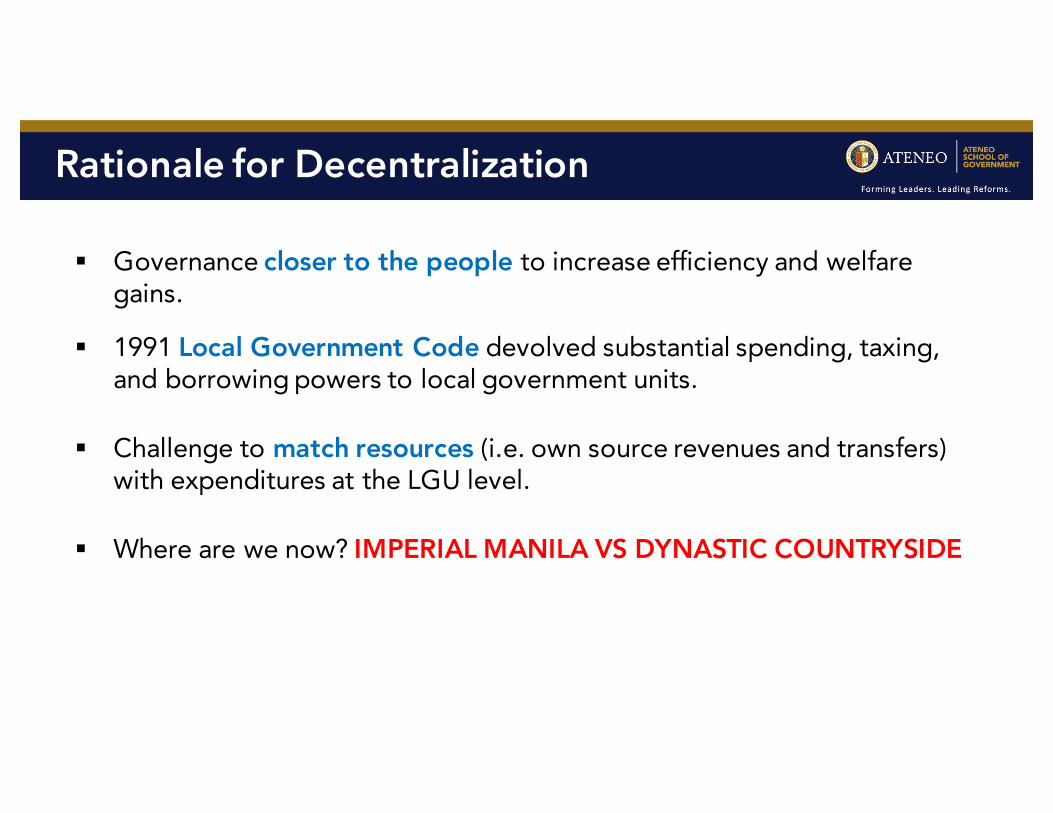
TextRationale for Decentralization
§ 1991 Local Government Code devolved substantial spending, taxing, and borrowing powers to local government units.
§ Governance closer to the people to increase efficiency and welfare gains.
§ Challenge to match resources (i.e. own source revenues and transfers) with expenditures at the LGU level.
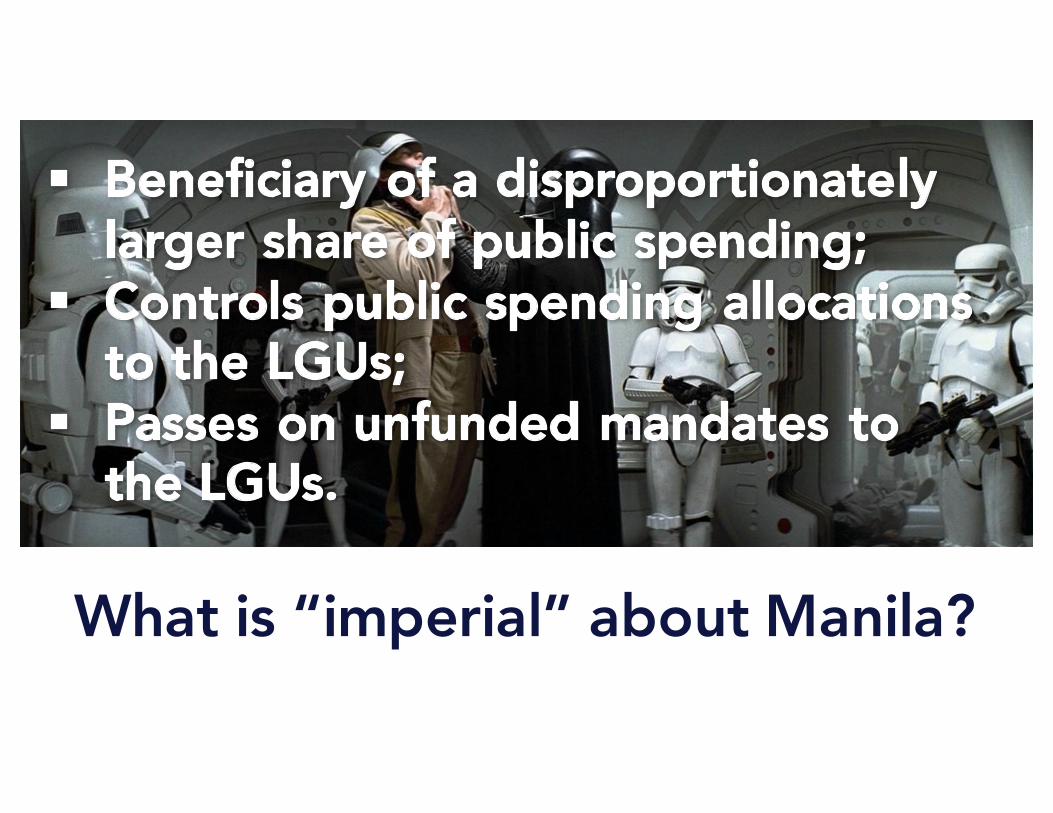
§ Where are we now? IMPERIAL MANILA VS DYNASTIC COUNTRYSIDE
Text
Is imperial Manila the problem?
Text
What is “imperial” about Manila?
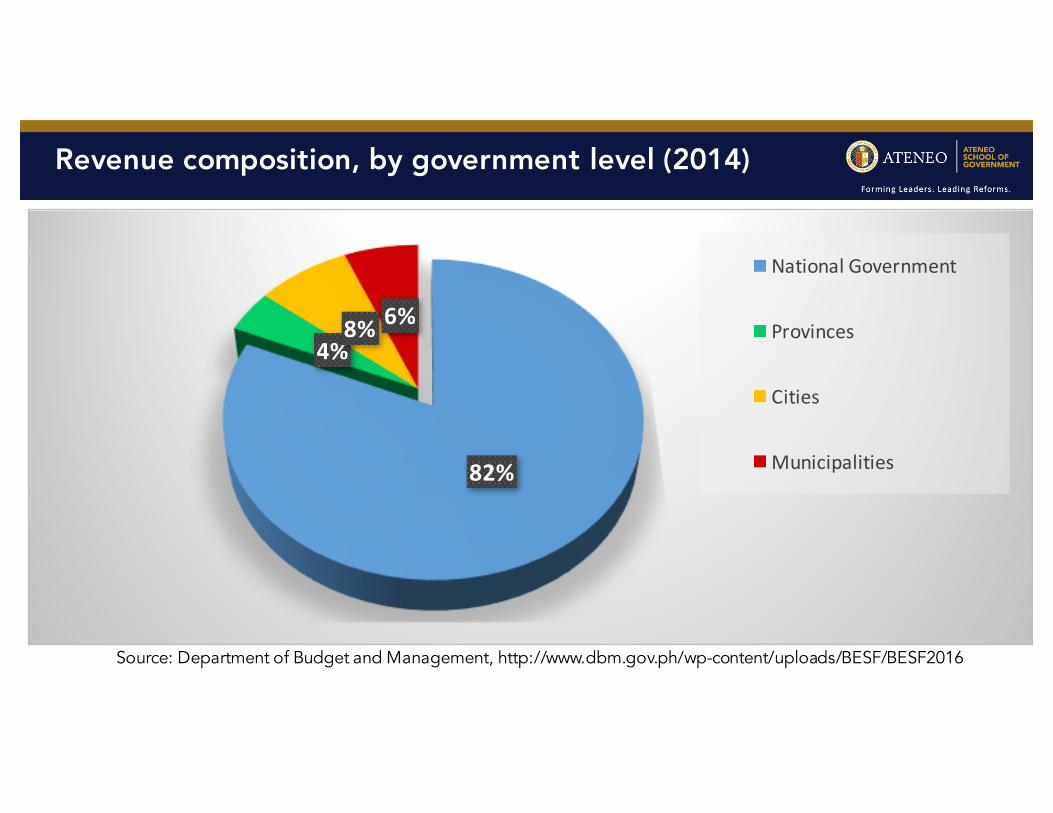
TextRevenue composition, by government level (2014)
Source: Department of Budget and Management, http://www.dbm.gov.ph/wp-content/uploads/BESF/BESF2016
82%
4%8% 6%
NationalGovernment
Provinces
Cities
Municipalities
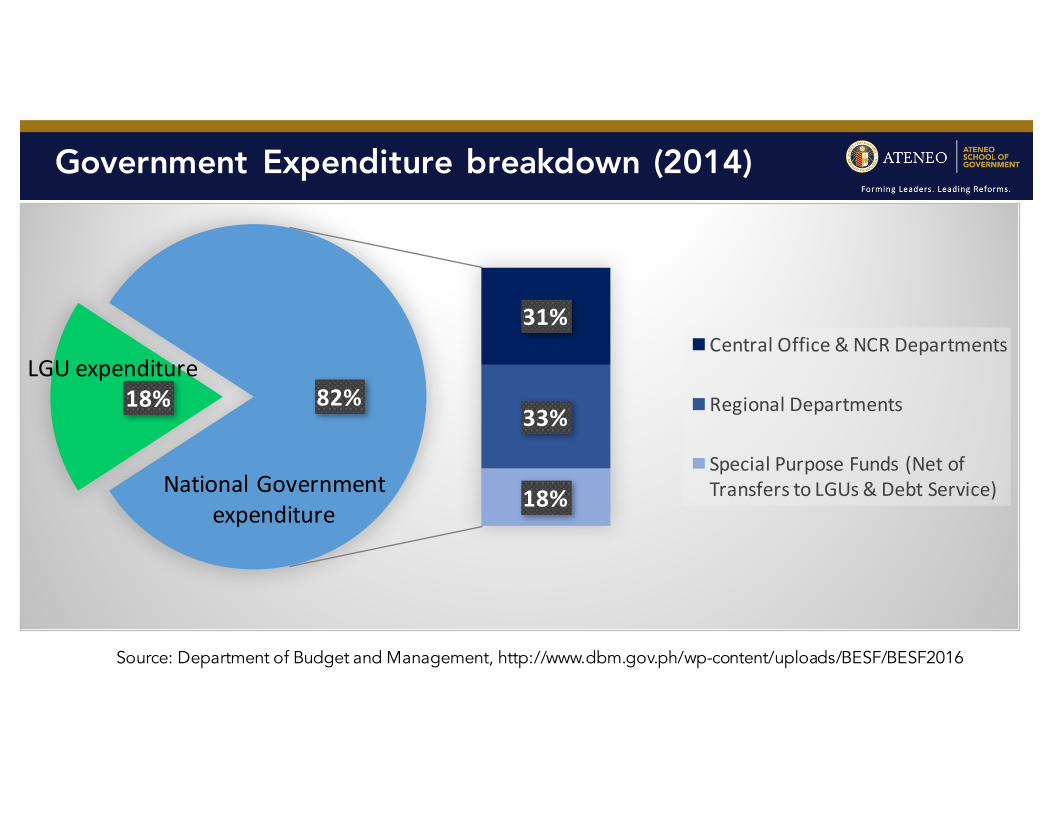
TextGovernment Expenditure breakdown (2014)
Source: Department of Budget and Management, http://www.dbm.gov.ph/wp-content/uploads/BESF/BESF2016
18%
31%
33%
18%
82%
CentralOffice&NCRDepartments
RegionalDepartments
SpecialPurposeFunds(NetofTransferstoLGUs&DebtService)
LGUexpenditure
NationalGovernmentexpenditure
Text
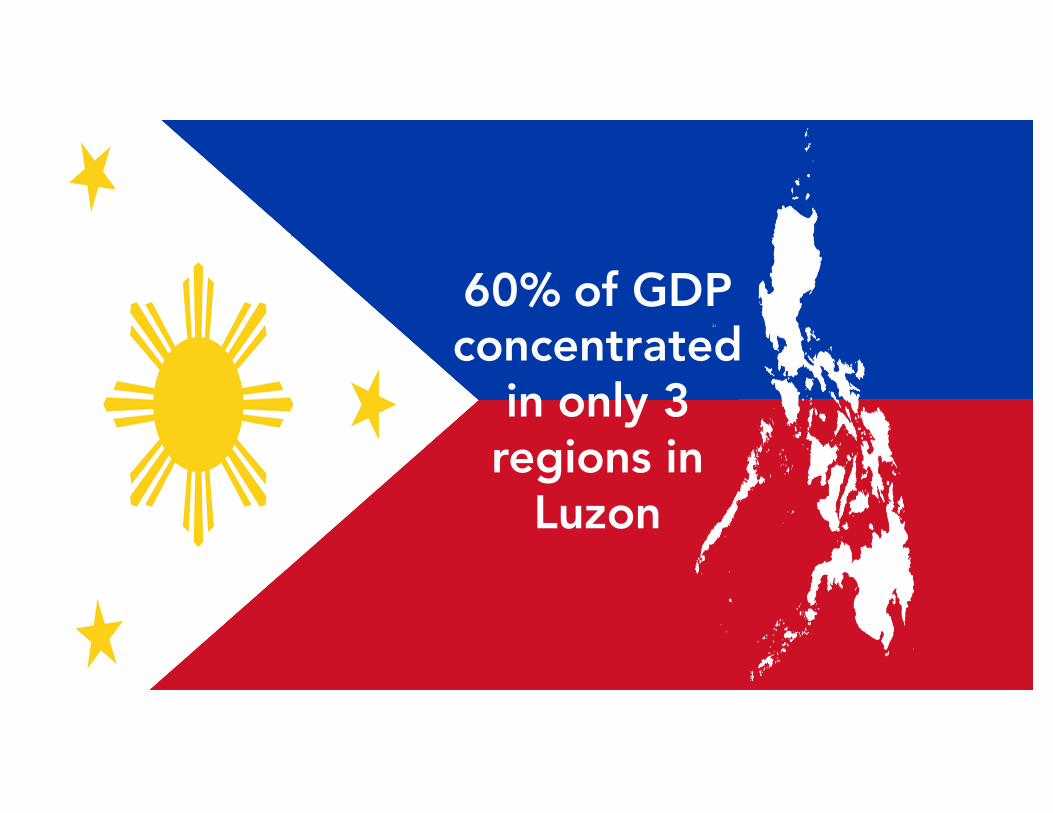
60% of GDP concentrated
in only 3 regions in
Luzon
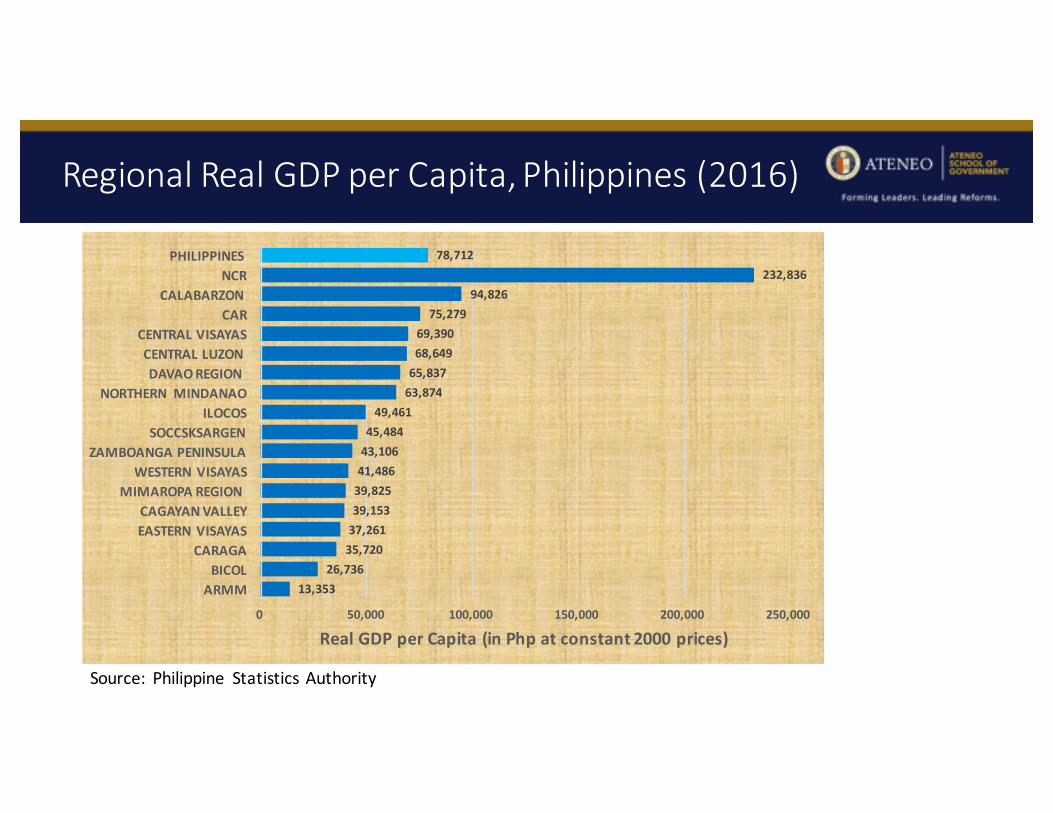
RegionalRealGDPperCapita,Philippines(2016)
13,35326,736
35,72037,26139,15339,82541,48643,10645,48449,461
63,87465,83768,64969,39075,279
94,826232,836
78,712
0 50,000 100,000 150,000 200,000 250,000
ARMMBICOL
CARAGAEASTERNVISAYASCAGAYANVALLEY
MIMAROPAREGIONWESTERNVISAYAS
ZAMBOANGAPENINSULASOCCSKSARGEN
ILOCOSNORTHERN MINDANAO
DAVAOREGIONCENTRALLUZONCENTRALVISAYAS
CARCALABARZON
NCRPHILIPPINES
RealGDPperCapita(inPhp atconstant2000prices)
Source: Philippine StatisticsAuthority
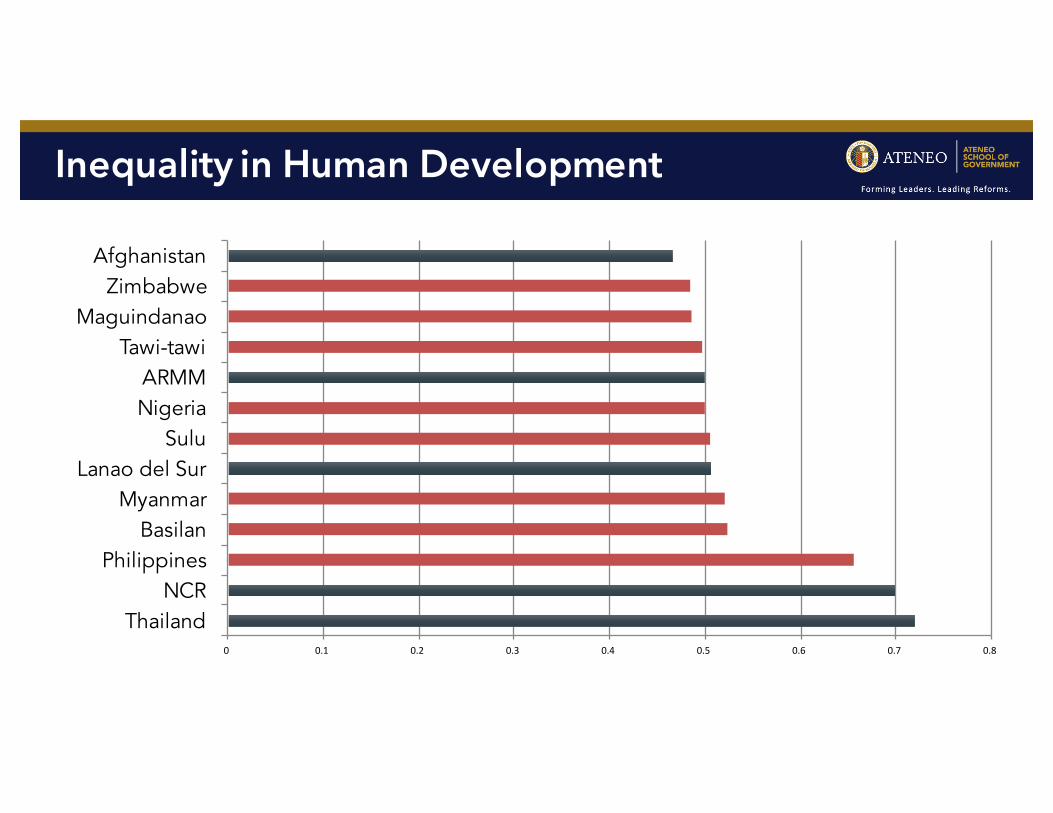
TextInequality in Human Development
0 0.1 0.2 0.3 0.4 0.5 0.6 0.7 0.8
ThailandNCR
PhilippinesBasilan
MyanmarLanao del Sur
SuluNigeriaARMM
Tawi-tawiMaguindanao
ZimbabweAfghanistan
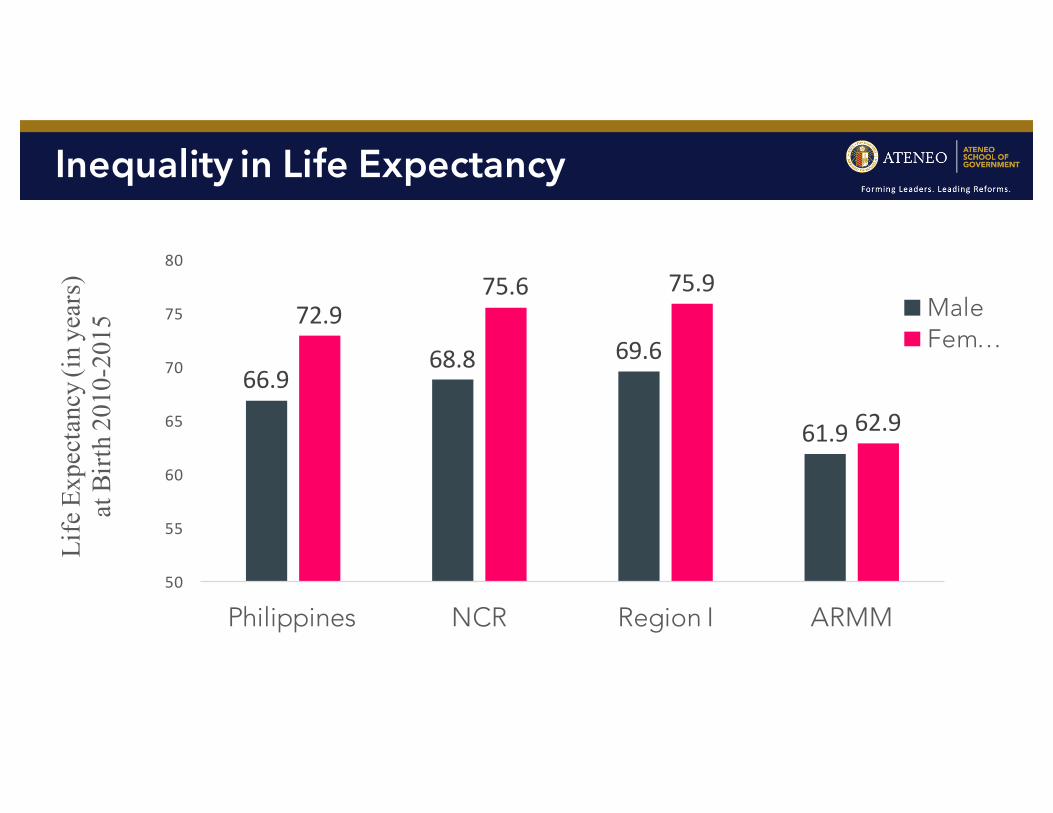
TextInequality in Life Expectancy
66.968.8 69.6
61.9
72.975.6 75.9
62.9
50
55
60
65
70
75
80
Philippines NCR Region I ARMM
Life
Exp
ecta
ncy (
in y
ears
) at
Birt
h 20
10-2
015 Male
Fem…
Text
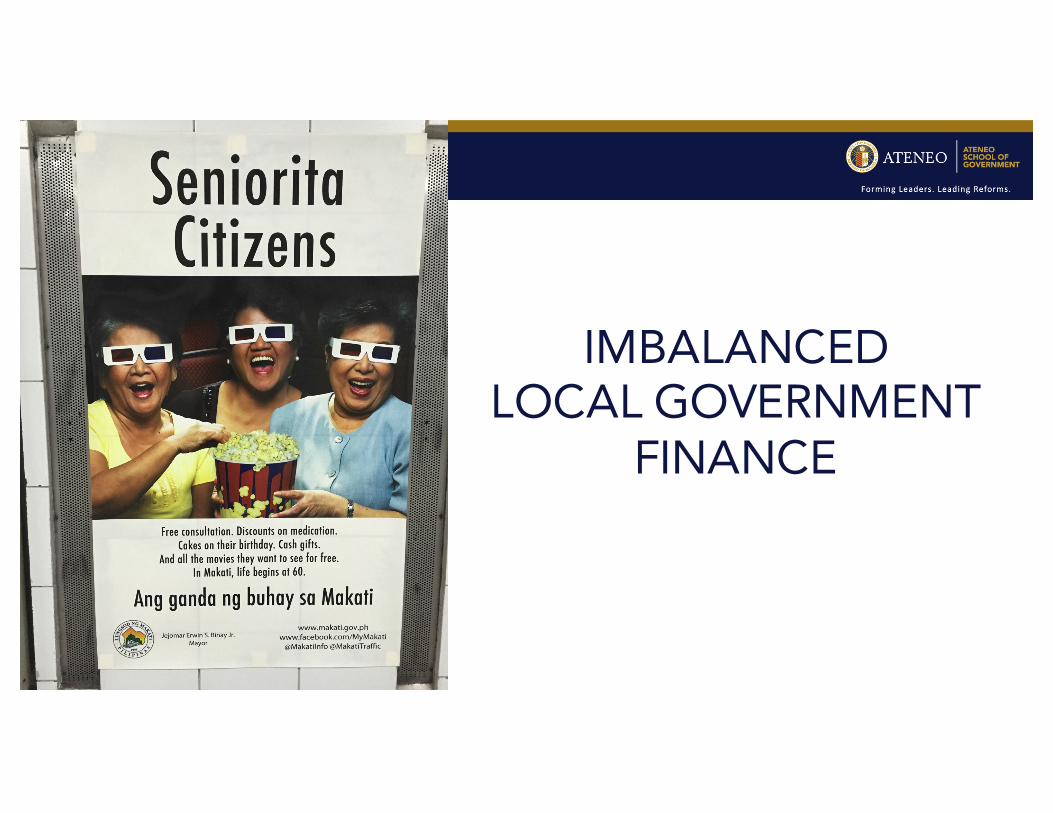
IMBALANCED LOCAL GOVERNMENT
FINANCE
Text
If Imperial Manila is a problem for development, then is the dynastic
countryside any better?
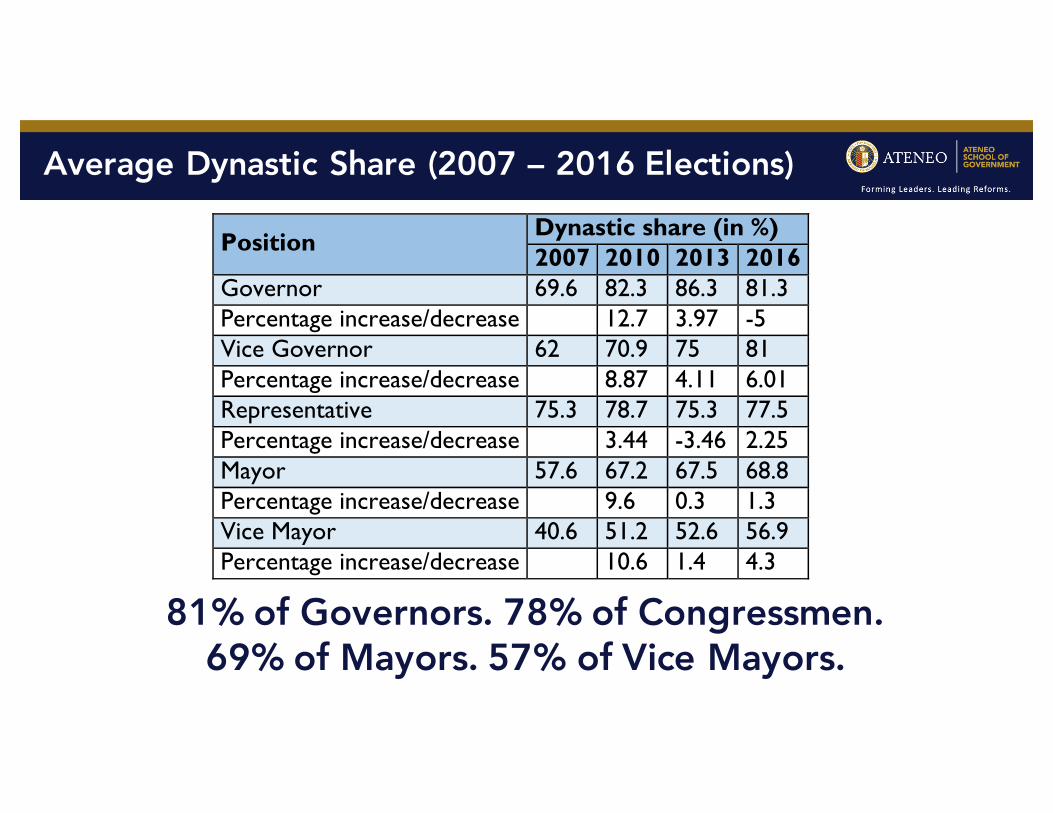
TextAverage Dynastic Share (2007 – 2016 Elections)
Position Dynastic share (in %) 2007 2010 2013 2016
Governor 69.6 82.3 86.3 81.3 Percentage increase/decrease 12.7 3.97 -5 Vice Governor 62 70.9 75 81 Percentage increase/decrease 8.87 4.11 6.01 Representative 75.3 78.7 75.3 77.5 Percentage increase/decrease 3.44 -3.46 2.25 Mayor 57.6 67.2 67.5 68.8 Percentage increase/decrease 9.6 0.3 1.3 Vice Mayor 40.6 51.2 52.6 56.9 Percentage increase/decrease 10.6 1.4 4.3
81% of Governors. 78% of Congressmen. 69% of Mayors. 57% of Vice Mayors.
Text
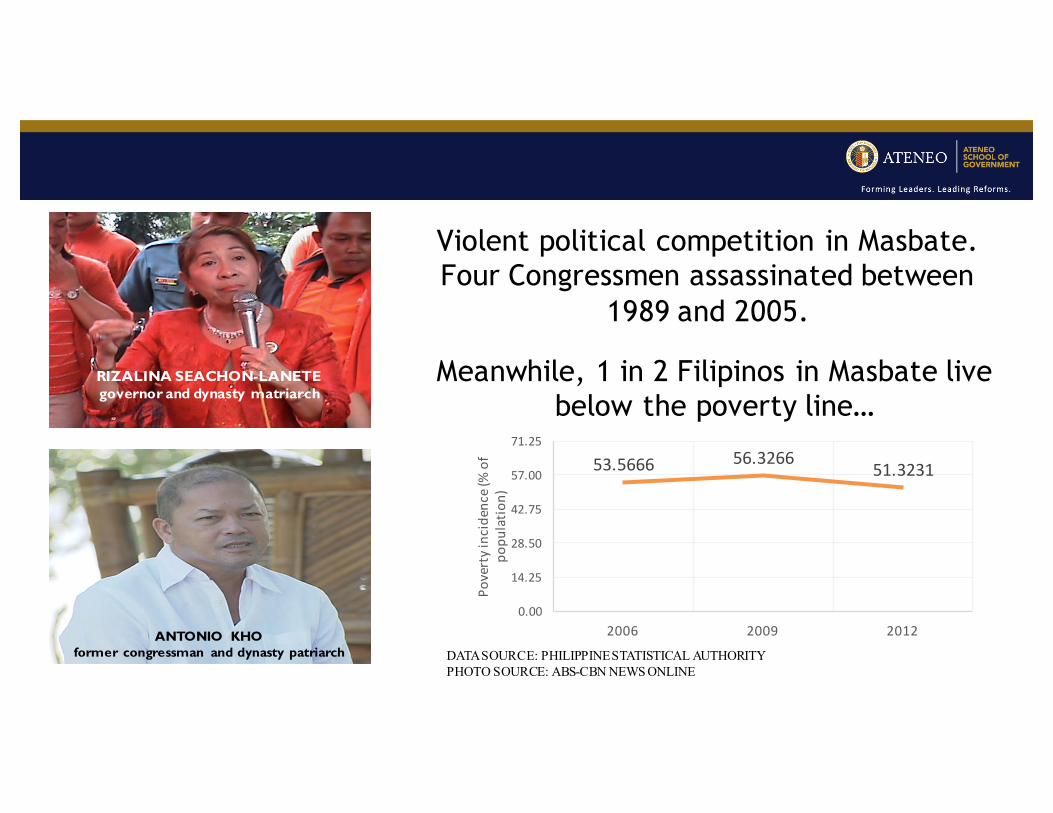
Violent political competition in Masbate. Four Congressmen assassinated between
1989 and 2005.
Meanwhile, 1 in 2 Filipinos in Masbate live below the poverty line…
RIZALINA SEACHON-LANETEgovernor and dynasty matriarch
ANTONIO KHOformer congressman and dynasty patriarch
53.5666 56.3266 51.3231
0.00
14.25
28.50
42.75
57.00
71.25
2006 2009 2012
Povertyincidence(%
of
popu
latio
n)
DATA SOURCE: PHILIPPINE STATISTICAL AUTHORITYPHOTO SOURCE: ABS-CBN NEWS ONLINE
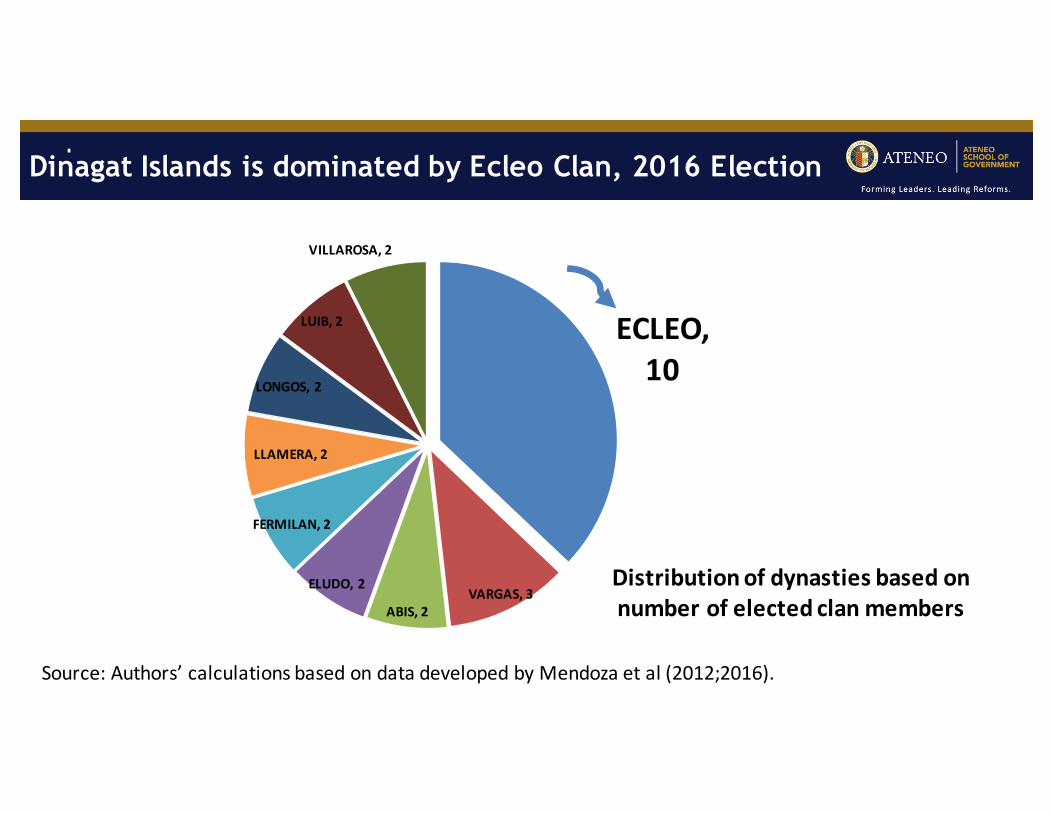
TextTextDinagat Islands is dominated by Ecleo Clan, 2016 Election
ECLEO,10
VARGAS,3ABIS,2
ELUDO,2
FERMILAN,2
LLAMERA,2
LONGOS,2
LUIB,2
VILLAROSA,2
Distributionofdynastiesbasedonnumberofelectedclanmembers
Source:Authors’calculationsbasedondatadevelopedbyMendozaetal(2012;2016).
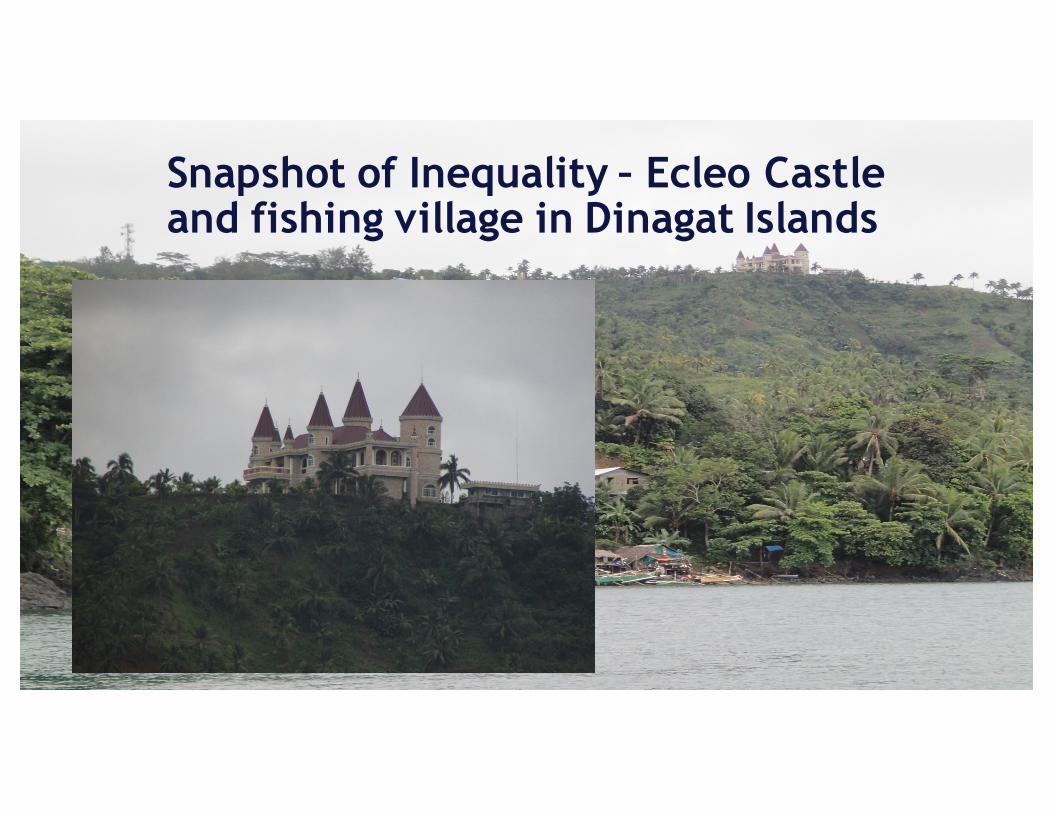
Text Snapshot of Inequality – Ecleo Castle and fishing village in Dinagat Islands
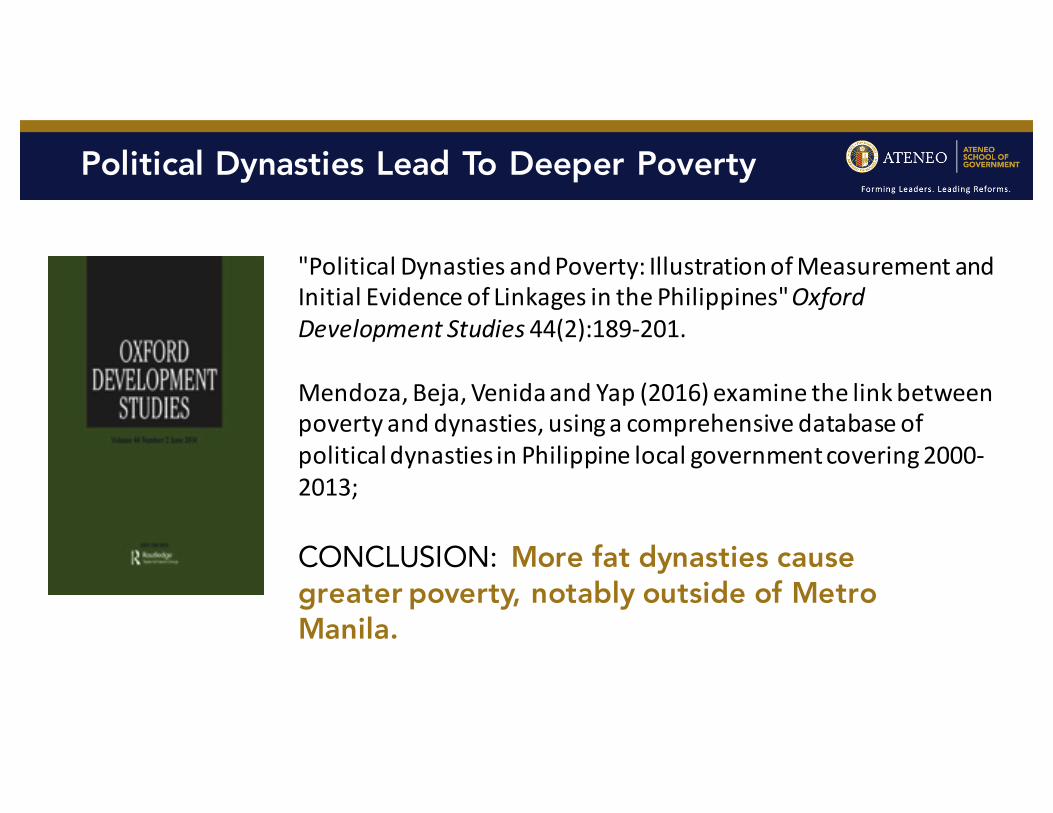
TextPolitical Dynasties Lead To Deeper Poverty
"PoliticalDynastiesandPoverty:IllustrationofMeasurementandInitialEvidenceofLinkagesinthePhilippines"OxfordDevelopmentStudies 44(2):189-201.
Mendoza,Beja,VenidaandYap(2016)examinethelinkbetweenpovertyanddynasties,usingacomprehensivedatabaseofpoliticaldynastiesinPhilippinelocalgovernmentcovering2000-2013;
CONCLUSION: More fat dynasties cause greater poverty, notably outside of Metro Manila.
Text
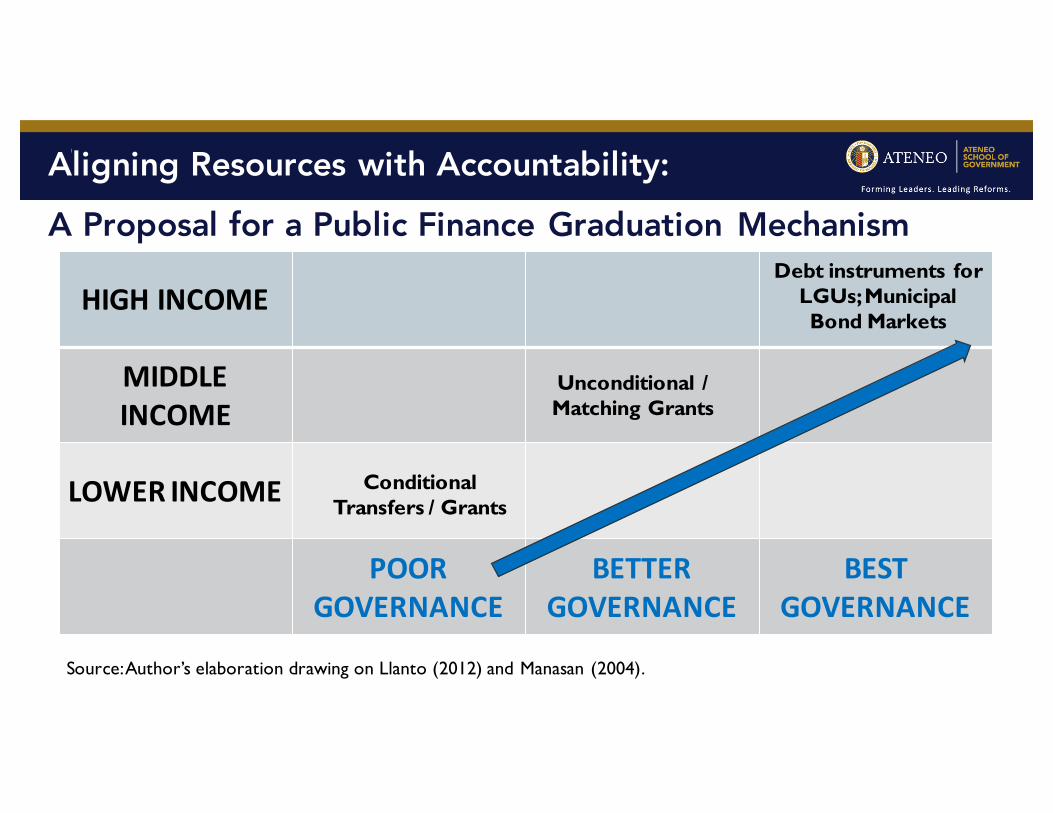
Source: Author’s elaboration drawing on Llanto (2012) and Manasan (2004).
Aligning Resources with Accountability:
A Proposal for a Public Finance Graduation Mechanism
HIGHINCOME
MIDDLEINCOME
LOWERINCOME
POORGOVERNANCE
BETTERGOVERNANCE
BESTGOVERNANCE
Conditional Transfers / Grants
Unconditional / Matching Grants
Debt instruments for LGUs; Municipal Bond Markets
Text
For further data and research visit: http://buildinganinclusivedemocracy.org