Embed Size (px)
Citation preview
Flammability Limits,
Ignition Energy and Flame Speeds
in H2–CH4–NH3–N2O–O2–N2 Mixtures
short title: Flammability, Ignition Energy and Flame Speed
U.J. Pfahl, M.C. Ross and J.E. Shepherd
Graduate Aeronautical LaboratoriesCalifornia Institute of Technology
Pasadena, CA 91125, USA
K.O. Pasamehmetoglu and C. Unal
Technology & Safety Assessment DivisionLos Alamos National Laboratory
Los Alamos, NM 87545, USA
submitted as full-length article in:Combustion and Flame
Revised version of March 25, 2000.
corresponding author:
Joseph E. ShepherdCaltech, 105-50Pasadena, CA 91125
Phone: 626-395-3283Fax: 626-449-2677E-Mail: [email protected]
Flammability Limits,
Ignition Energy and Flame Speeds
in H2–CH4–NH3–N2O–O2–N2 Mixtures
U.J. Pfahl, M.C. Ross and J.E. Shepherd
Graduate Aeronautical LaboratoriesCalifornia Institute of Technology
Pasadena, CA 91125, USA
K.O. Pasamehmetoglu and C. Unal
Technology & Safety Assessment DivisionLos Alamos National Laboratory
Los Alamos, NM 87545, USA
Abstract
Experiments on flammability limits, ignition energies, and flame speeds were carriedout in a 11.25- and a 400-liter combustion vessel at initial pressures and tempera-tures of 100 kPa and 295 K, respectively. Flammability maps of hydrogen–nitrousoxide–nitrogen, methane–nitrous oxide–nitrogen, ammonia–nitrous oxide–nitrogen, andammonia–nitrous oxide–air, as well as lean flammability limits of various hydrogen–methane–ammonia–nitrous oxide–oxygen–nitrogen mixtures were determined. Ignitionenergy bounds of methane–nitrous oxide, ammonia–nitrous oxide, and ammonia–nitrousoxide–nitrogen mixtures have been determined and the influence of small amounts ofoxygen on the flammability of methane–nitrous oxide–nitrogen mixtures has been inves-tigated. Flame speeds have been measured and laminar burning velocities have beendetermined for ammonia–air–nitrous oxide and various hydrogen–methane–ammonia–nitrous oxide–oxygen–nitrogen mixtures. Lower and upper flammability limits (mix-ing fan on, turbulent conditions) for ignition energies of 8 J are: H2-N2O: 4.5∼5.0%H2(LFL), 76∼80% H2(UFL); CH4-N2O: 2.5∼3.0% CH4(LFL), 43∼50% CH4(UFL); NH3-N2O: 5.0∼5.2% NH3(LFL), 67.5∼68% NH3(UFL). Inerting concentrations are: H2-N2O-N2: 76% N2; CH4-N2O-N2: 70.5% N2; NH3-N2O-N2: 61% N2; NH3-N2O-air: 85% air.Flammability limits of methane–nitrous oxide–nitrogen mixtures show no pronounceddependence on small amounts of oxygen (< 5%). Generally speaking, flammable gaseswith large initial amounts of nitrous oxide or ammonia show a strong dependence offlammability limits on ignition energy.
1 Introduction 1
1 Introduction
The nuclear wastes stored in underground storage tanks at Hanford site are known togenerate, by complex chemical reactions, a flammable gas mixture that comprises mainlyhydrogen, ammonia, methane, and nitrous oxide. The flammable gas mixture generatedin the waste is periodically released into the dome space of storage tanks with variousquantities. Tank 101-SY has been found to release concentrations greater than lowerflammability limits (LFL) of hydrogen during episodic gas release events. In the unlikelyevent that an ignition source were present during episodic gas releases, a burn or explo-sion could occur. An ignition of the flammable gas mixture is a significant safety hazardand can result in tank dome pressures exceeding structural limits, which in turn couldresult in unacceptable structural damage to the tanks and release of radioactive mater-ial. A mixer pump is installed into Tank 101-SY to eliminate the episodic releases as apart of the proposed mitigation strategy. Sullivan et al. [1] systematically assesses thesafety issues associated with the installation, operation and removal of the mixer pumpin Tank 101-SY. They identify several representative postulated flammable gas burn acci-dent scenarios. The characterization of combustion behavior of H2-CH4-NH3-N2O-O2-N2
mixtures was necessary to assess the consequences of burn accidents. The combustionbehavior of H2-CH4-NH3-N2O-O2-N2 mixtures is not well understood. Particularly, thereis a lack of data on the flammability limits in terms of ignition energies and flame speedsat various concentrations.
The goals of this study are to experimentally characterize the combustion behaviorof hydrogen, methane and ammonia with nitrous oxide or air. Our approach is to carryout laboratory experiments with a spark ignition system in closed vessels of 11.25 and400 liter capacity. Measurements of pressure vs. time and video recordings of schlierenvisualization were used to determine the ignition limits as a function of stored energy inspark discharge system. Our study determines flammability limits empirically by findingthe limiting concentrations of reactants for which we can initiate combustion and haveit propagate throughout the vessel.
Traditional evaluations of explosion hazards rely on comparing the fuel concentrationto the measured flammability limit. However, the flammability limit depends on thechoice of ignition method and sample preparation. Consequently, different methods ofmeasuring flammability have been devised such as the flashpoint test [2], spark ignition[3], temperature limit method [4], and concentration limit method [5]. Each of these usesdifferent ignition methods: an open pilot flame in the flashpoint test; a capacitive sparkin the spark ignition test; an electrically heated fuse-wire in the temperature limit test;and either a fuse wire or an electric arc in the concentration limit method. The mostcommonly used method of all, the flammability limit tube developed at the Bureau ofMines [6, 7, 8], has never been standardized. This method uses various ignition sources;one commonly employed is a quasi-continuous arc produced by a neon-sign transformer(20 kV, 30 mA) across a 0.25-in gap. Our experience [9, 10] at Caltech is that resultsobtained with a 100-J spark igniter in a closed vessel are similar to those obtained with
1 Introduction 2
the Bureau Mines apparatus using a neon-sign transfromer arc. In the present study,stored energies of up to 8 J were used since this level is reasonable to achieve withoutcreating the large amount of electrical noise that a 100 J spark produces.
Various ideas have been advanced to explain the phenomena of flammability andthe relationship to tests developed in the process industries to determine flammabilitylimits. It is important to note the distinction between the use of the term “flammabilitylimit” by the safety community and by the combustion basic research community. Safetystudies are concerned with experimentally determining limiting concentrations, beyondwhich combustion can be assured not to occur. The experimental determination ofsuch limits is inextricably intertwined with the apparatus, including method of ignition,the test protocol, and the criteria for determining when ignition has occured. Basicresearchers prefer to think of limits in the abstract. Starting with Spalding [11], thegenerally accepted definition has become that the flammability limit is that state atwhich steady propagation of a one-dimensional premixed flame fails to be possible. Thetheoretical determination of a limit defined in this fashion is likewise tied a specificconfiguration, a chemical kinetic model, diffusive and radiative transport models, andnumerical solution methods. Recently there has been some progress towards connectingthese two approaches to flammability.
From a theoretical point of view, limits arise because mechanisms such as chain-terminating reaction steps, energy loss by radiation, and preferential diffusion eventuallydominate the energy-releasing chemical reactions and cause extinction at the flammabilitylimit. The idea of heat losses creating a limiting condition was first advanced by Spalding[11] but testing this notion quantitatively had to wait for the development of detailedreaction mechanisms and flame structure computation methods. Law and Egofopolous[12] showed that turning points in one-dimensional steady laminar flame computationswith a simplified radiative loss model correlated reasonably well with known experimentallimits for lean methane-air and rich hydrogen-air mixtures. More recent studies [13] showthat the situation is substantially more complex when the combined effects of strain andradiation are considered, particularly for mixtures with Lewis numbers less then unity.The “doubly-infinite” and “twin-flame” configurations considered in these studies is idealfor numerical simulation but quite far from the unsteady, multi-dimensional flame kernelsin confined vessels that are utilized in most flammability tests.
Bui-Pham et al. [14] have made a detailed comparison of limits determined exper-imentally with spark and chemical igniters to predictions based on adiabatic, steady,laminar flame computations for the rich flammability limit of CH3OH/CO/diluent mix-tures in O2. Two simple ideas were examined: 1) a limit flame speed of 5 cm/s; and,2) equality of primary chain termination rates and radical production rates. Althoughthe predicted trends for critical oxygen concentration with pressure and diluent typewere qualitatively correct, the quantitative values were not. Unsteady computations ofspherically-symmetric ignition were quantitatively more accurate but very computation-ally expensive. Furthermore, as Bui-Pham et al. point out, intrinsic flammability limitsand ignitability appear to be two distinct phenomena. The most striking results was the
1 Introduction 3
existence of mixtures that could be ignited and burned completely although they wereapparently outside the theoretically determined flammability limit. Clearly, such resultsindicate that the prediction of flammability is an active research area and substantialgaps remain between present theoretical understanding and industrial practice.
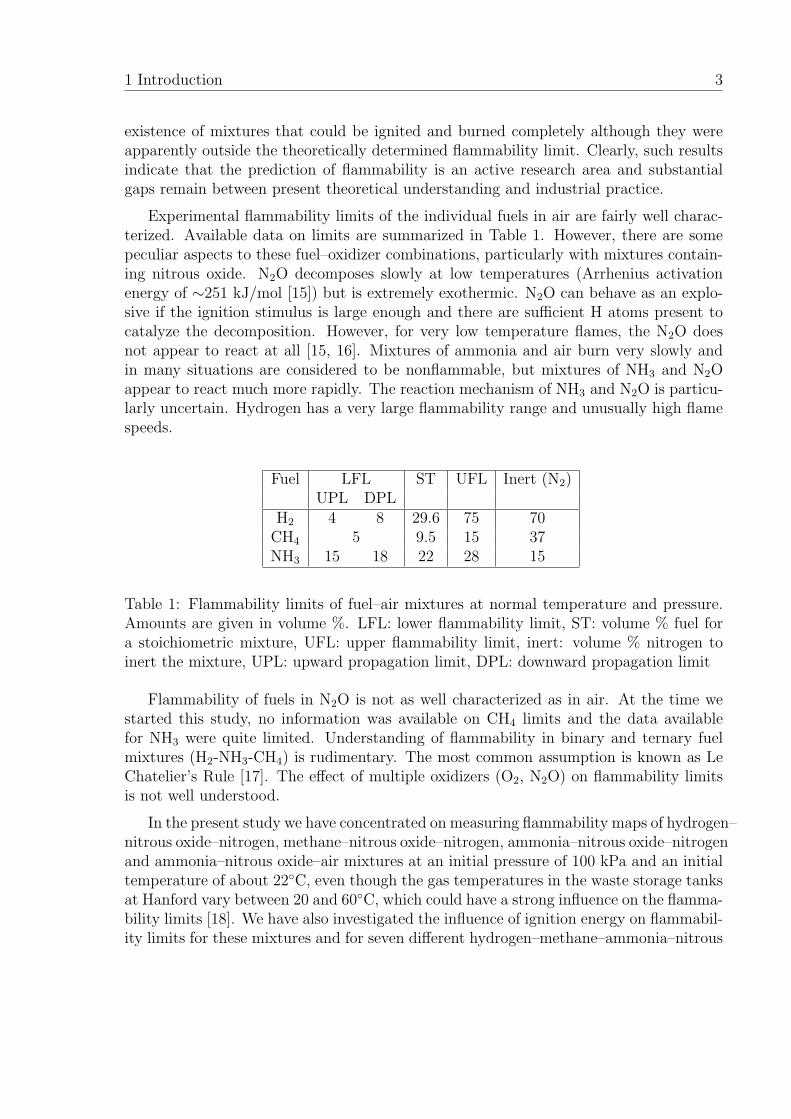
Experimental flammability limits of the individual fuels in air are fairly well charac-terized. Available data on limits are summarized in Table 1. However, there are somepeculiar aspects to these fuel–oxidizer combinations, particularly with mixtures contain-ing nitrous oxide. N2O decomposes slowly at low temperatures (Arrhenius activationenergy of ∼251 kJ/mol [15]) but is extremely exothermic. N2O can behave as an explo-sive if the ignition stimulus is large enough and there are sufficient H atoms present tocatalyze the decomposition. However, for very low temperature flames, the N2O doesnot appear to react at all [15, 16]. Mixtures of ammonia and air burn very slowly andin many situations are considered to be nonflammable, but mixtures of NH3 and N2Oappear to react much more rapidly. The reaction mechanism of NH3 and N2O is particu-larly uncertain. Hydrogen has a very large flammability range and unusually high flamespeeds.
Fuel LFL ST UFL Inert (N2)UPL DPL
H2 4 8 29.6 75 70CH4 5 9.5 15 37NH3 15 18 22 28 15
Table 1: Flammability limits of fuel–air mixtures at normal temperature and pressure.Amounts are given in volume %. LFL: lower flammability limit, ST: volume % fuel fora stoichiometric mixture, UFL: upper flammability limit, inert: volume % nitrogen toinert the mixture, UPL: upward propagation limit, DPL: downward propagation limit
Flammability of fuels in N2O is not as well characterized as in air. At the time westarted this study, no information was available on CH4 limits and the data availablefor NH3 were quite limited. Understanding of flammability in binary and ternary fuelmixtures (H2-NH3-CH4) is rudimentary. The most common assumption is known as LeChatelier’s Rule [17]. The effect of multiple oxidizers (O2, N2O) on flammability limitsis not well understood.
In the present study we have concentrated on measuring flammability maps of hydrogen–nitrous oxide–nitrogen, methane–nitrous oxide–nitrogen, ammonia–nitrous oxide–nitrogenand ammonia–nitrous oxide–air mixtures at an initial pressure of 100 kPa and an initialtemperature of about 22C, even though the gas temperatures in the waste storage tanksat Hanford vary between 20 and 60C, which could have a strong influence on the flamma-bility limits [18]. We have also investigated the influence of ignition energy on flammabil-ity limits for these mixtures and for seven different hydrogen–methane–ammonia–nitrous
2 Apparatus 4
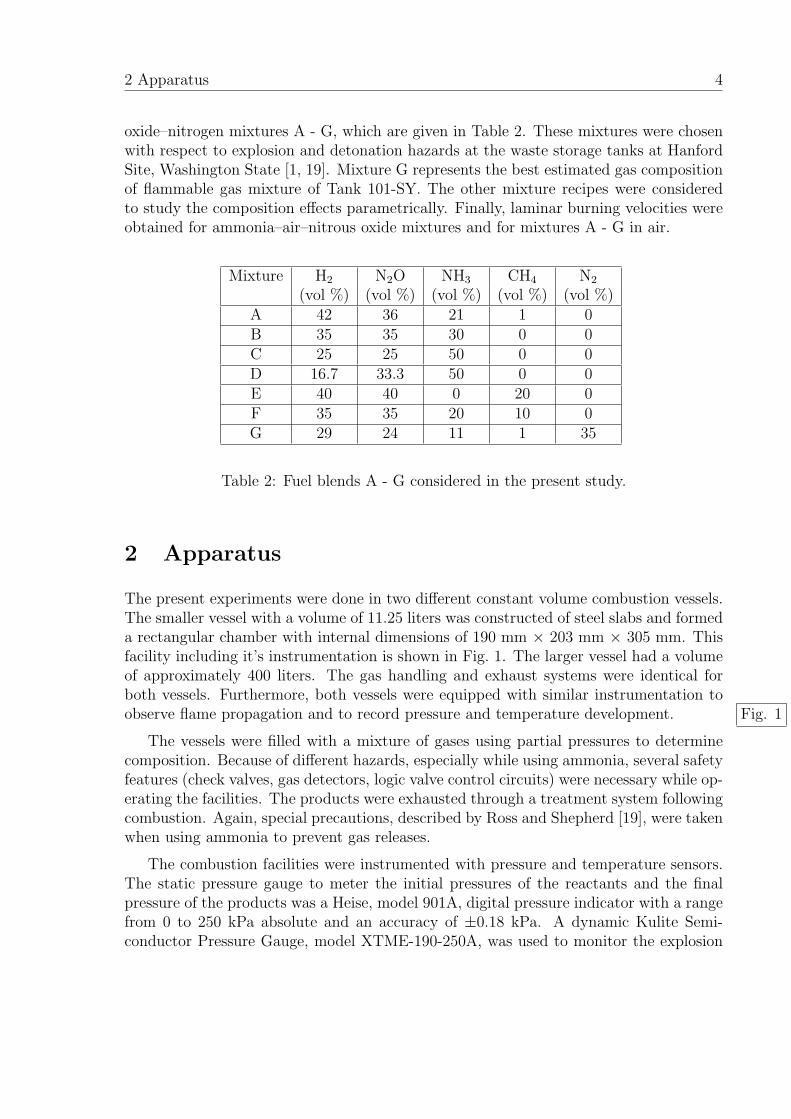
oxide–nitrogen mixtures A - G, which are given in Table 2. These mixtures were chosenwith respect to explosion and detonation hazards at the waste storage tanks at HanfordSite, Washington State [1, 19]. Mixture G represents the best estimated gas compositionof flammable gas mixture of Tank 101-SY. The other mixture recipes were consideredto study the composition effects parametrically. Finally, laminar burning velocities wereobtained for ammonia–air–nitrous oxide mixtures and for mixtures A - G in air.
Mixture H2 N2O NH3 CH4 N2
(vol %) (vol %) (vol %) (vol %) (vol %)A 42 36 21 1 0B 35 35 30 0 0C 25 25 50 0 0D 16.7 33.3 50 0 0E 40 40 0 20 0F 35 35 20 10 0G 29 24 11 1 35
Table 2: Fuel blends A - G considered in the present study.
2 Apparatus
The present experiments were done in two different constant volume combustion vessels.The smaller vessel with a volume of 11.25 liters was constructed of steel slabs and formeda rectangular chamber with internal dimensions of 190 mm × 203 mm × 305 mm. Thisfacility including it’s instrumentation is shown in Fig. 1. The larger vessel had a volumeof approximately 400 liters. The gas handling and exhaust systems were identical forboth vessels. Furthermore, both vessels were equipped with similar instrumentation toobserve flame propagation and to record pressure and temperature development. Fig. 1
The vessels were filled with a mixture of gases using partial pressures to determinecomposition. Because of different hazards, especially while using ammonia, several safetyfeatures (check valves, gas detectors, logic valve control circuits) were necessary while op-erating the facilities. The products were exhausted through a treatment system followingcombustion. Again, special precautions, described by Ross and Shepherd [19], were takenwhen using ammonia to prevent gas releases.
The combustion facilities were instrumented with pressure and temperature sensors.The static pressure gauge to meter the initial pressures of the reactants and the finalpressure of the products was a Heise, model 901A, digital pressure indicator with a rangefrom 0 to 250 kPa absolute and an accuracy of ±0.18 kPa. A dynamic Kulite Semi-conductor Pressure Gauge, model XTME-190-250A, was used to monitor the explosion
2 Apparatus 5
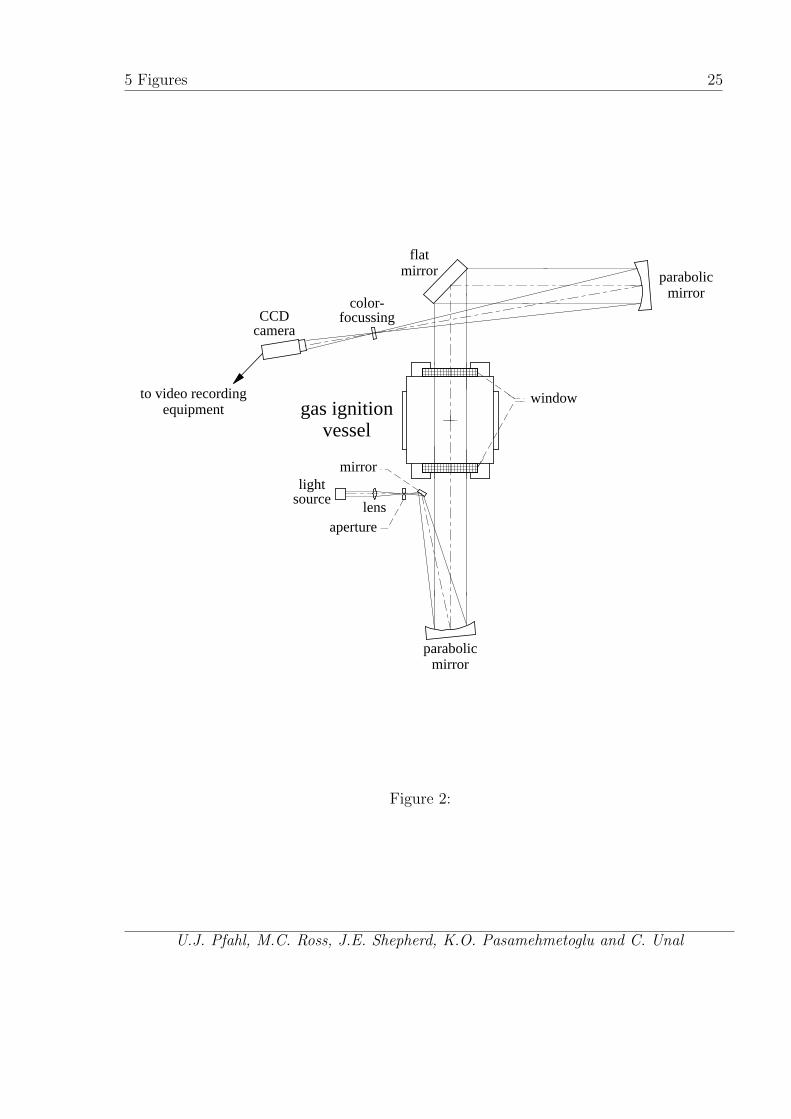
pressure. This is a piezoresistive type transducer which has a combined nonlinearity,hysteresis and repeatability of 2.5 kPa. This transducer was protected by two porousmetal frits, which are sufficient to shield the transducer from temperature but do notaffect the pressure reading. A thermocouple Omega K type with a 3.2 mm metal sheatwas installed above the center of the spark source (see Fig. 1). Each wire was 24 AWG,and the weld bead size was approximately 1.5 mm. An Omega model DP462 electroniccold-junction and temperature readout was used to convert the thermocouple outputto temperature. The pressure and temperature signals were recorded by Labview DataAcquisition Software running on a personal computer. Furthermore, both vessels wereequipped with 25 mm thick glass windows with a clear aperature of 117 mm in diameter(see Figs. 1 and 2). Through these windows, a color-schlieren video-system was used toobserve the flame initiation and propagation (see Figs. 4 - 6). Figure 2 shows a schematicdiagram of the optical set-up of the color-schlieren video-system. Fig. 2
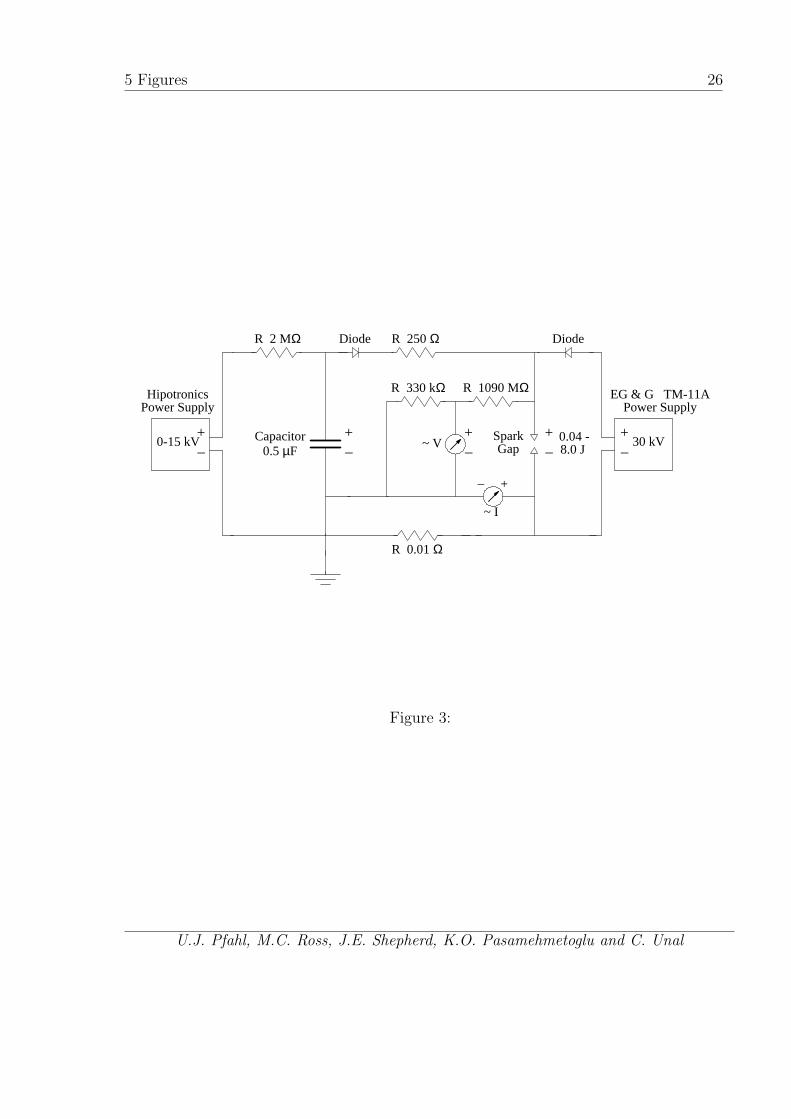
An electric spark was used to initiate the flame. In both vessels the spark gap (seeFig. 1: 2-6 mm depending on the gas composition) was positioned in the center of thevessel and the electrodes passed through Teflon insulators on the sides of the vessel. Thepower for the spark was provided by a 0.5 µF capacitor charged by a Hipotronics 15kV (maximum) power supply. The discharge across the gap was triggered by a 30 kVpulse (low current) from an EG&G TM-11A power supply. Figure 3 shows a schematicdiagram of the electrical circuit of the spark ignition system. The circuit was motivatedby the design described by Ronney [20].
The duration of the main pulse is controlled by the time constant (RC product) andthe discharge characteristics. For a low-impedance discharge, the time constant is mostimportant. For the circuit of Fig. 3, the characteristic discharge time is about 100 µs.The discharge time of the trigger pulse itself is on the order of 1 µs. In the presentstudy, the ignition energy reported is actually the energy stored in the capacitor usedto create the electrical discharge. In our arrangement, the residual energy remainingin the capacitor after the discharge was less than 1% [10]. However, due to the finiteimpedance of the circuit and the complex nature of electrical arcs, it is not possible todraw any conclusions about the amount of energy deposited into the arc. In order todo that, it would be necessary to determine the actual energy dissipated within the arcwhich requires measuring the voltage v(t) across the arc and current i(t) through the arcas a function of time. Various arrangements have been proposed to do that; a review isgiven by [21]. However, unless the discharge parameters are chosen carefully to minimizephase errors in current and voltage, the energy measurement will be highly inaccurate. Fig. 3
Investigations were carried out under quiescent or turbulent gas conditions. The datain Fig. 8, 9, 10, 11, 12, 14, 15, 16, 17, were all obtained in the the smaller vessel (11.25liters) with the fan on the top runnning. The turbulence intensity was characterized inthis vessel near the ignition location. The data in Fig. 13, 19 and some data of 20 (A-D)were obtained in the larger vessel (400 l) but without the fan running. The data sets E-Fof Fig. 20 were obtained in the smaller vessel but with the fan not running.
3 Results and Discussion 6
The turbulence was produced by a single mixing fan with two blades, about 150 mm indiameter. The mixing fan was driven by a pulley drive (6.7:1 reduction) from a universalmotor controlled by a speed control (light-dimmer switch). The shaft for the fan wasconnected to a magnetic torque transmitter which was located at the top of the 11.25 litervessel (see Fig. 1) and at the side of the 400 liter vessel, respectively. Flow measurementswith a single-component laser doppler anemometer (LDA) near the ignition locationshowed that mean flow u and fluctuations urms increased with fan rotational speed.However, the turbulence intensity u′ = urms/u was found to be relatively independent ofthe rotational speed between u′ = 0.24 and u′ = 0.26. Measurements at various locationsalso indicated that the turbulence intensity was relatively independent of position.
3 Results and Discussion
Flammability Limits
The flammability limits of a combustible mixture are those limiting compositions thatwill just support flame propagation when stimulated by an external ignition source.Identifying these limits is of great interest to the chemical industry and safety engineers,and compilations of flammability limits have been published by the Bureau of Mines [22,18]. Although there is no widely accepted theoretical method of predicting flammabilitylimits, there are a number of empirical rules and simple models [11], the classical resultsare summarized in Lewis and Von Elbe [23] and updated in the series of reports byHertzberg [24]. The fuel type, mixture properties and mass diffusion of the deficientreactant are all factors [25] in defining the limiting composition.
Mixtures that are either too rich or too lean are not flammable. In the present study,we are concerned with fuel-lean as well as fuel-rich mixtures. Lower or lean flammabilitylimits are known in the literature as LFL, upper or rich flammability limits are knownas UFL. Flammability limits are determined by a variety of techniques, each of whichyields a slightly different value of the limiting composition.
Further complications are the effect of ignition energy (see Section Ignition Energiesbelow) and the buoyancy of the hot combustion products. The effect of buoyancy isto cause the initially spherical flame kernel, created by the spark, to rise and becomedistorted as it propagates outward. As a consequence, if the burning velocity is toolow (less than about 5 cm/s), the flame is observed only to propagate upward. Thegradients in the gas velocity induced by the rising flame also affect the flammabilitylimit. The gradients and spherical expansion of the flame surface result in flame stretchwhich increases the burning rate if the Lewis number Le (ratio of thermal diffusivity tomass diffusivity of the deficient reactant) is less than one and decreases the burning rateif Le > 1.
Figures 4, 5, and 6 show different cases of flame propagation, which illustrate the
3 Results and Discussion 7
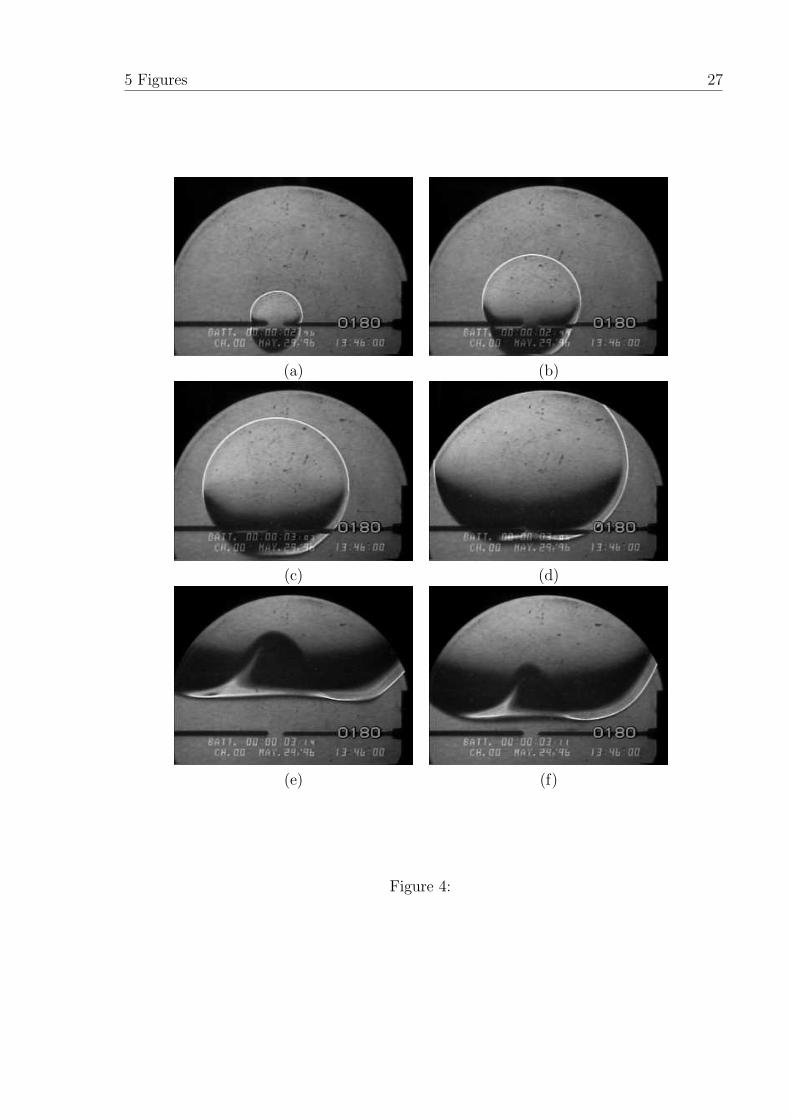
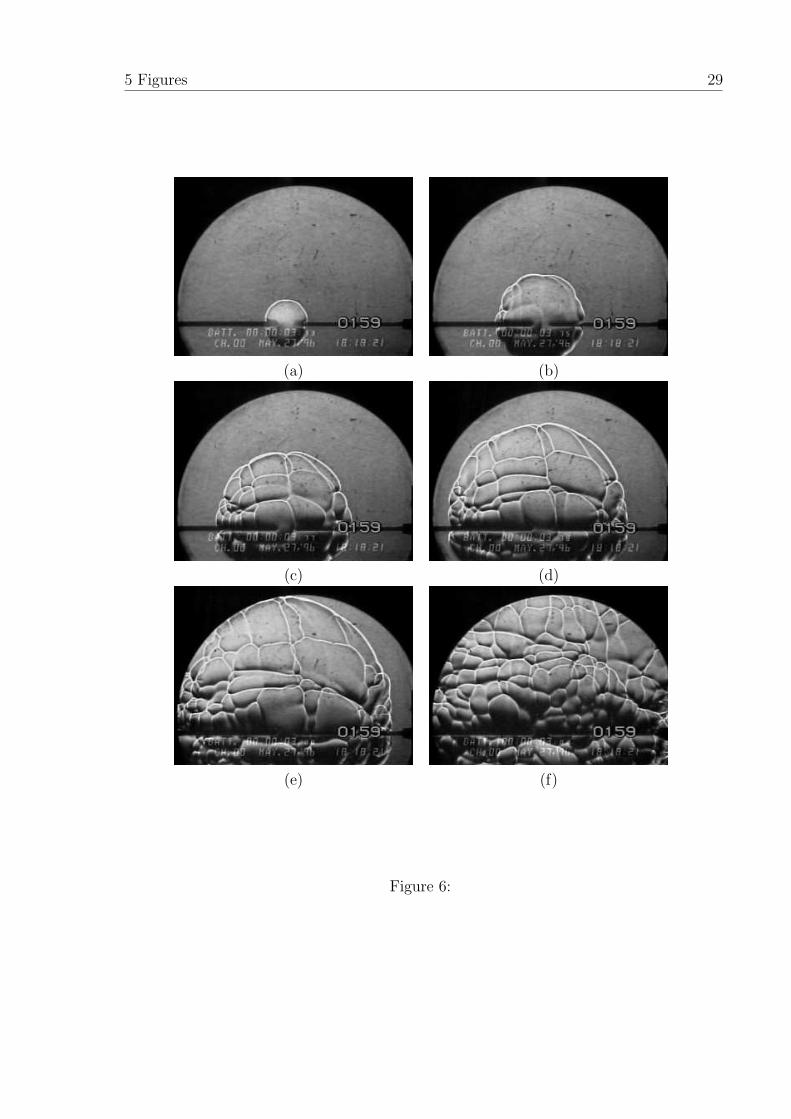
range of combustion phenomena observed in these experiments at the lean flammabilitylimit: a typical laminar flame is shown in Fig. 4. This case is 20% NH3 in air, the mixingfan is turned off (quiescent conditions). The flame front is smooth and spherical. Adimple produced by buoyancy is observed at the bottom of the flame in the last twoframes. Figure 5 shows a frame sequence of a slightly leaner mixture, 18% NH3 in air,but the mixing fan is turned on in this case (turbulent conditions). A highly wrinkledflame front is seen in all frames. Turbulent motion induced by the mixing fan has theeffect of distorting and rapidly convecting the flame away from the ignition point. Incontrast to an upward propagation flame at quiescent conditions, a mixing fan can resultin combustion within the total volume of the vessel as long as the turbulence intensity isnot so large that the flame is quenched. For richer mixtures, the instability of the flameresults in a cellular structure visible as bright lines on the flame surface. This is observedin Fig. 6 for a quiescent burn of 20% of Mixture B (see Table 2) in air. Fig. 4
Fig. 5
Fig. 6
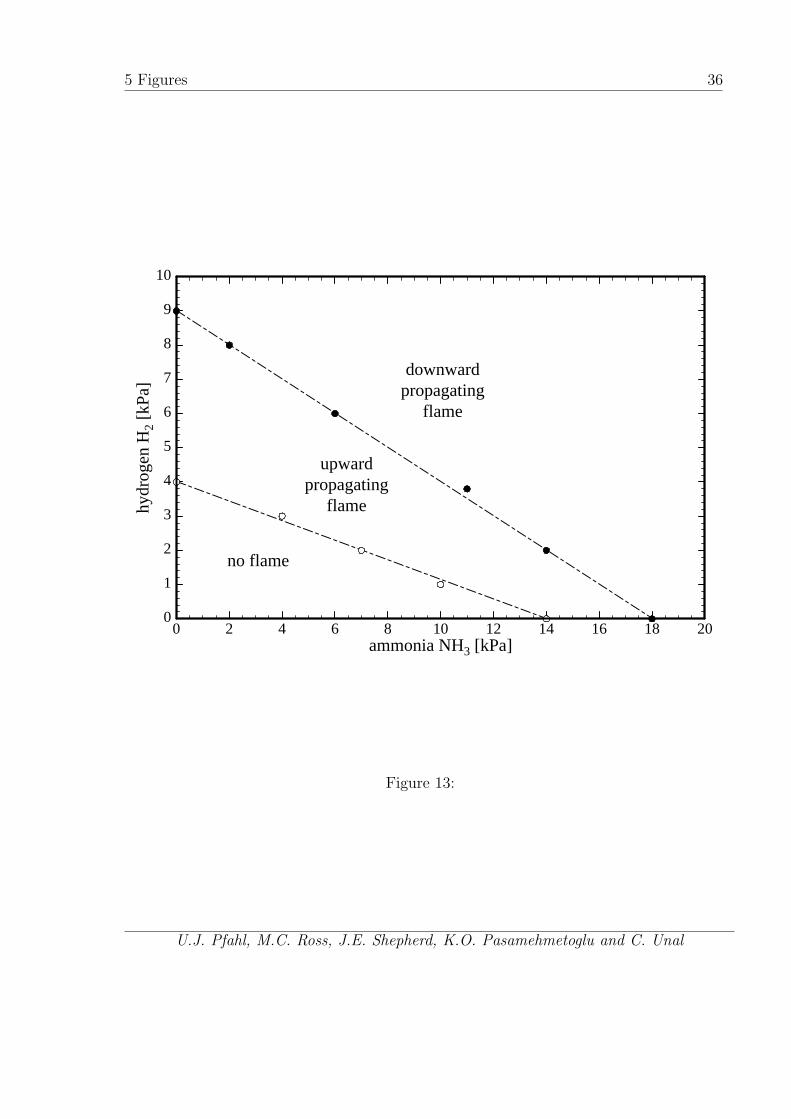
The limiting composition at which upward propagation of the flame begins is referredto as the upward propagation limit (UPL) in the literature. The composition at whichthe transition from upward to downward propagation takes place is known as the down-ward propagation limit (DPL). In this study, we have determined propagation limits ofvarious mixtures: hydrogen–nitrous oxide with nitrogen dilution, methane–nitrous oxidewith nitrogen dilution and small amounts of oxygen (3 and 5%), ammonia–nitrous oxidewith nitrogen and air dilution, hydrogen–ammonia–air, and seven different hydrogen–methane–ammonia–nitrous oxide–nitrogen–oxygen mixtures (see Table 2). All experi-ments were carried out at a total initial pressure of 100 kPa and an initial temperatureof 295 K.
The mixing fan was running (turbulent conditions) during flame initiation and prop-agation for all flammability tests except those shown in Figs. 13, 19, and 20. The fanis expected to generate a mean flow but it is difficult to distinguish this effect fromthe buoyancy. The main effect of the fan is in providing sufficient convection so thatrelatively complete combustion occurs, enabling clear determination of the flammabilitylimit. Otherwise, in many cases buoyancy causes an extended regime between upwardand downward propagation limits, as shown in Fig. 13. The flammability limits measuredwith the fan running correspond to the upward propagation limit, which is a conservativeestimate from the point of view of safety. The ignition source was the capacitor dischargeunit described in Sections Apparatus and Ignition Energies. The spark ignition energywas 8 J.
The most common assumption regarding flammability in binary and ternary fuelmixtures is that the limiting mole fractions Xi of each fuel species i obey Le Chatelier’sRule [17]:
∑
fuels
Xi
Xi,LFL
= 1 at mixture LFL (1)
where Xi,LFL is the limit concentration for a single fuel species i in the oxidizer-diluentmixture of interest. For many compounds mixed in oxygen or air, this rule is a reason-
3 Results and Discussion 8
able approximation. The physical reasoning behind this model is that the reactants arecompatible in kinetic and transport properties, and independently compete for oxidizerwithin the flame front. It is not clear how to extend Le Chatelier’s Rule to include theeffect of multiple oxidizers such as O2 and N2O.
The major products for lean combustion of H2-CH4-NH3-N2O-air mixtures are CO2,H2O, and N2. If complete reaction of H2, CH4, and NH3 occurs and all the N2O decom-poses, the overall reaction is:
α H2 + β CH4 + γ NH3 + δ N2O + ε air → β CO2 + (α + 2β + 32γ) H2O +
(γ2
+ δ + 0.79ε) N2 + ( δ2
+ 0.21ε− α2− 2β − 3
4γ) O2 , (R1)
where one mole of air has been approximated as 0.21 O2 + 0.79 N2. If the N2O does notreact or decompose in the combustion process, which is expected for some of the leanmixtures (low temperatures) [16], the overall reaction will be
α H2 + β CH4 + γ NH3 + δ N2O + ε air → β CO2 + (α + 2β + 32γ) H2O +
(γ2
+ 0.79ε) N2 + (0.21ε− α2− 2β − 3
4γ) O2 + δ N2O . (R2)
Finally, if the oxidation of the fuel occurs preferentially by N2O rather than O2, thisreaction is modified to
α H2 + β CH4 + γ NH3 + δ N2O + ε air → β CO2 + (α + 2β + 32γ) H2O +
(α + 4β + 2γ) N2 + (δ − α− 4β − 32γ) N2O + ε air . (R3)
The first overall reaction R1 (full dissociation of N2O) corresponds to complete equi-librium and would be predicted by usual thermodynamic equilibrium estimates [26].However, equilibrium models, though useful for estimating thermodynamic properties ofcombustion systems, can not predict which oxidizer is preferred by the fuels in a multi-component system. Experimental measurements of the intermediate and product speciesare needed. Modeling based on detailed chemical kinetics and known elementary reactionrates is a valuable alternative and supplement to experiments, but not task of the presentstudy.
Hydrogen–Nitrous Oxide–Nitrogen Mixtures
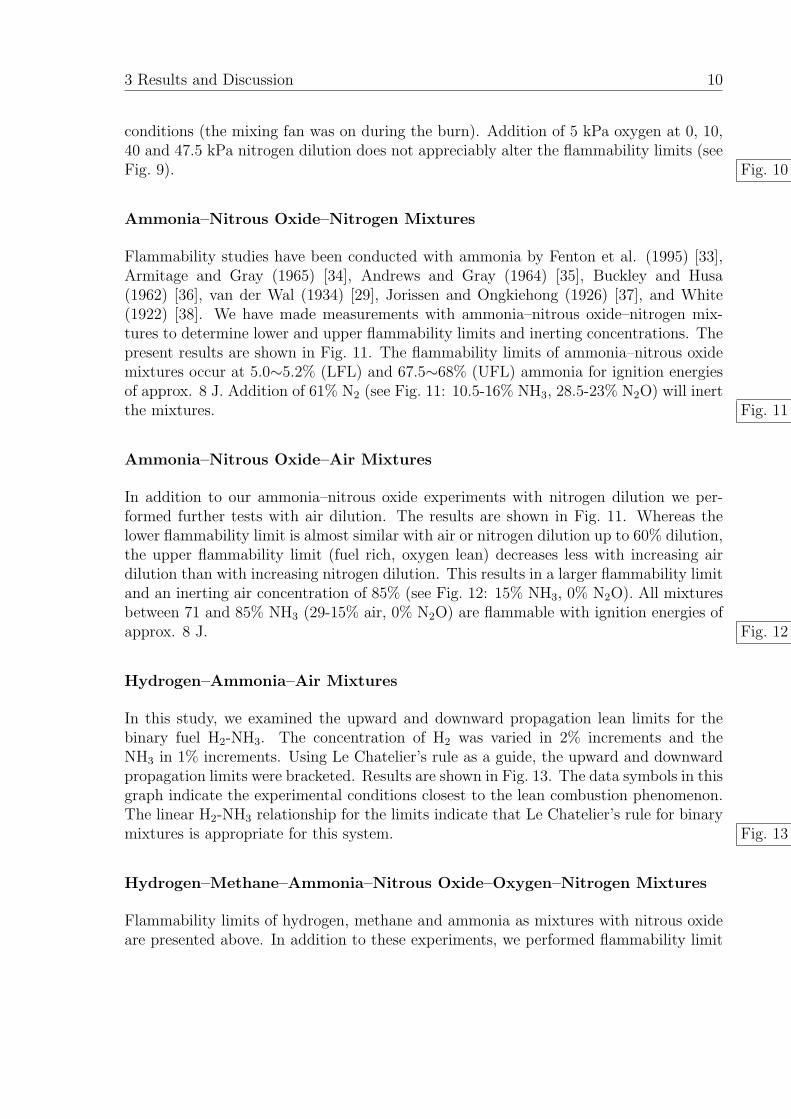
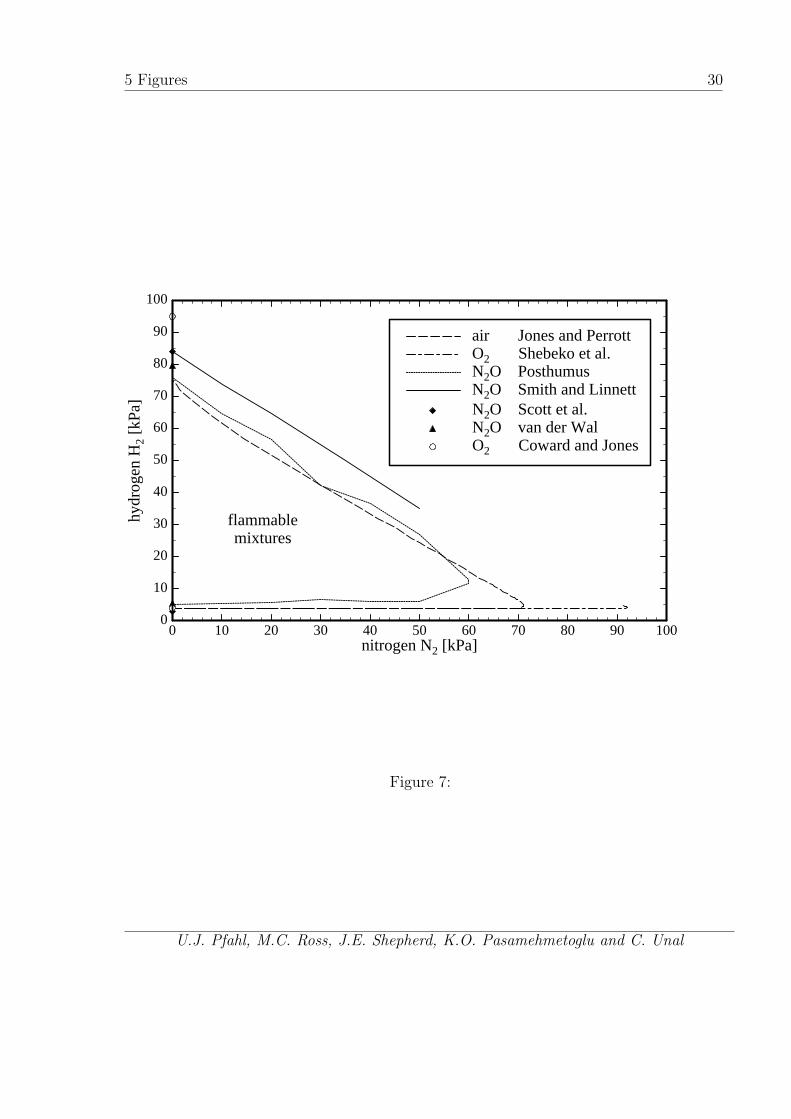
Numerous flammability studies have been conducted with hydrogen. Some of these stud-ies, Smith and Linnett (1953) [27], Posthumus (1930) [28], van der Wal (1934) [29], andScott et al. (1957) [30] have been carried out with N2O as the oxidizer. The availabledata are shown in Fig. 7 together with the flammability limits of hydrogen–oxygen [22]and hydrogen–air–nitrogen mixtures [18, 31]. These data are all nominally obtained at atemperature of 25C and a pressure of 1 atm. Not shown in that plot are the H2-N2O-air
3 Results and Discussion 9
mixture data of Cashdollar et al. (1992) [32] and Ross and Shepherd (1996) [19]. Notethat the rich limit data of Posthumus are substantially below those of Smith and Linnett.This is apparently due to the low temperature/energy ignition source of Posthumus incomparison to the 20 J spark discharge used by Smith and Linnett. In general, ignitionenergy has a strong effect on flammablility limits in mixtures containing large amountsof N2O. The particular problem of ignition of very lean H2-N2O mixtures is discussedsubsequently in Section Ignition Energies. Fig. 7
Flammability limits were determined for H2–N2O–N2 mixtures at 100 kPa and 295 K,the mixing fan was running during the tests. The results are shown in Fig. 8. Theflammability limits of hydrogen–nitrous oxide mixtures occur at 4.5∼5.0% (LFL) and76∼80% (UFL) hydrogen for ignition energies of approx. 8 J. Addition of 76% nitrogen(see Fig. 8) will inert the mixtures. Our results are in very good agreement to what wasobtained by Smith and Linnett (1953) [27] for nitrogen dilution below 50%, but above50% nitrogen dilution we observed a wider range of flammability than Posthumus [28]and a higher inerting nitrogen concentration. Posthumus had only very limited data inthis region and his inerting concentration is not well defined. Fig. 8
Methane–Nitrous Oxide–Nitrogen Mixtures
Flammability limits were determined for CH4–N2O–N2 mixtures at 100 kPa and 295 K,the mixing fan was running during the test. The results are shown in Fig. 9. The flamma-bility limits of methane–nitrous oxide mixtures occur at 2.5∼3.0% (LFL) and 43∼50%(UFL) methane for ignition energies of approx. 8 J. Addition of 70.5% nitrogen (seeFig. 9) will inert the mixtures. The corresponding methane partial pressure is 6.3 kPa.The present results are compared in Fig. 9 to previous results from the literature [18]for CH4–O2–N2 mixtures. Previous results for CH4–N2O or CH4–N2O–N2 mixtures werenot available from the literature. The lower flammability limit shows a very smoothdependence (increase) on the amount of nitrogen dilution and a good correspondence toZabetakis’ results for CH4–O2–N2, whereas the upper limit shifts to a smaller flammabil-ity region compared to CH4–O2–N2 and shows a strong decrease with increasing nitrogendilution. Fig. 9
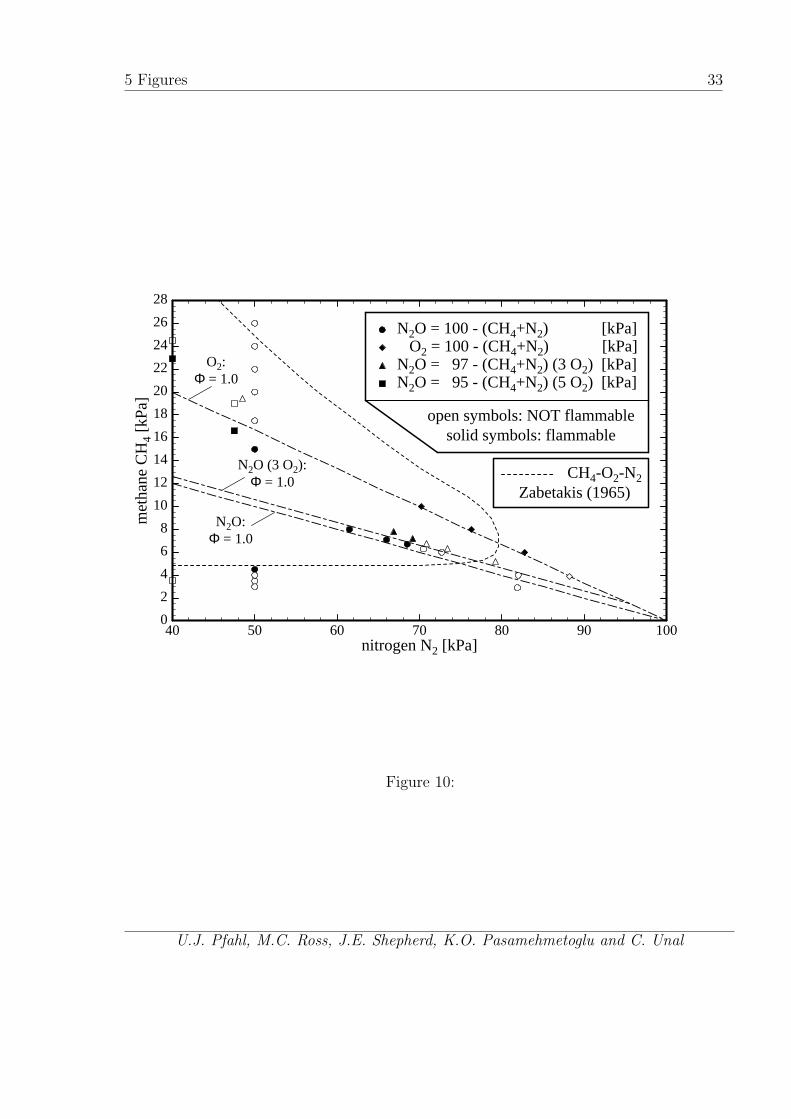
Influence of Small Amounts of Oxygen (3 - 5%) on the Flammability Limitsof Methane–Nitrous Oxide–Nitrogen Mixtures
Figures 9 and 10 show no pronounced dependence of the flammability limits of methane–nitrous oxide–nitrogen mixtures on small amounts of oxygen. At 3 kPa oxygen addition,the maximum flammable nitrogen dilution does not shift (see Fig. 10). Substitutingoxygen for nitrous oxide shifts the maximum flammable nitrogen dilution (inerting con-centration) from 70.5 to about 85 kPa (5 kPa CH4 and 10 kPa O2). Zabetakis obtained80 kPa nitrogen dilution as the inerting concentration for CH4–O2–N2 mixtures at at-mospheric pressure and 26C [18]. The present results exceed this value due to turbulent
3 Results and Discussion 10
conditions (the mixing fan was on during the burn). Addition of 5 kPa oxygen at 0, 10,40 and 47.5 kPa nitrogen dilution does not appreciably alter the flammability limits (seeFig. 9). Fig. 10
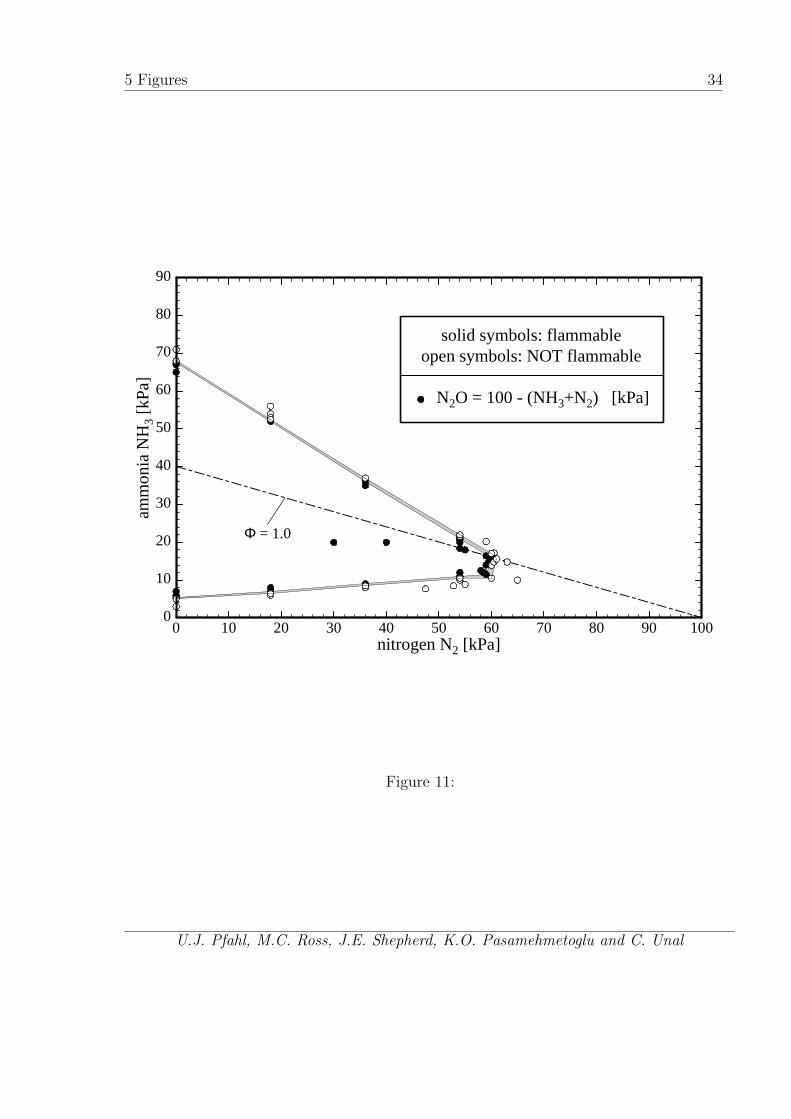
Ammonia–Nitrous Oxide–Nitrogen Mixtures
Flammability studies have been conducted with ammonia by Fenton et al. (1995) [33],Armitage and Gray (1965) [34], Andrews and Gray (1964) [35], Buckley and Husa(1962) [36], van der Wal (1934) [29], Jorissen and Ongkiehong (1926) [37], and White(1922) [38]. We have made measurements with ammonia–nitrous oxide–nitrogen mix-tures to determine lower and upper flammability limits and inerting concentrations. Thepresent results are shown in Fig. 11. The flammability limits of ammonia–nitrous oxidemixtures occur at 5.0∼5.2% (LFL) and 67.5∼68% (UFL) ammonia for ignition energiesof approx. 8 J. Addition of 61% N2 (see Fig. 11: 10.5-16% NH3, 28.5-23% N2O) will inertthe mixtures. Fig. 11
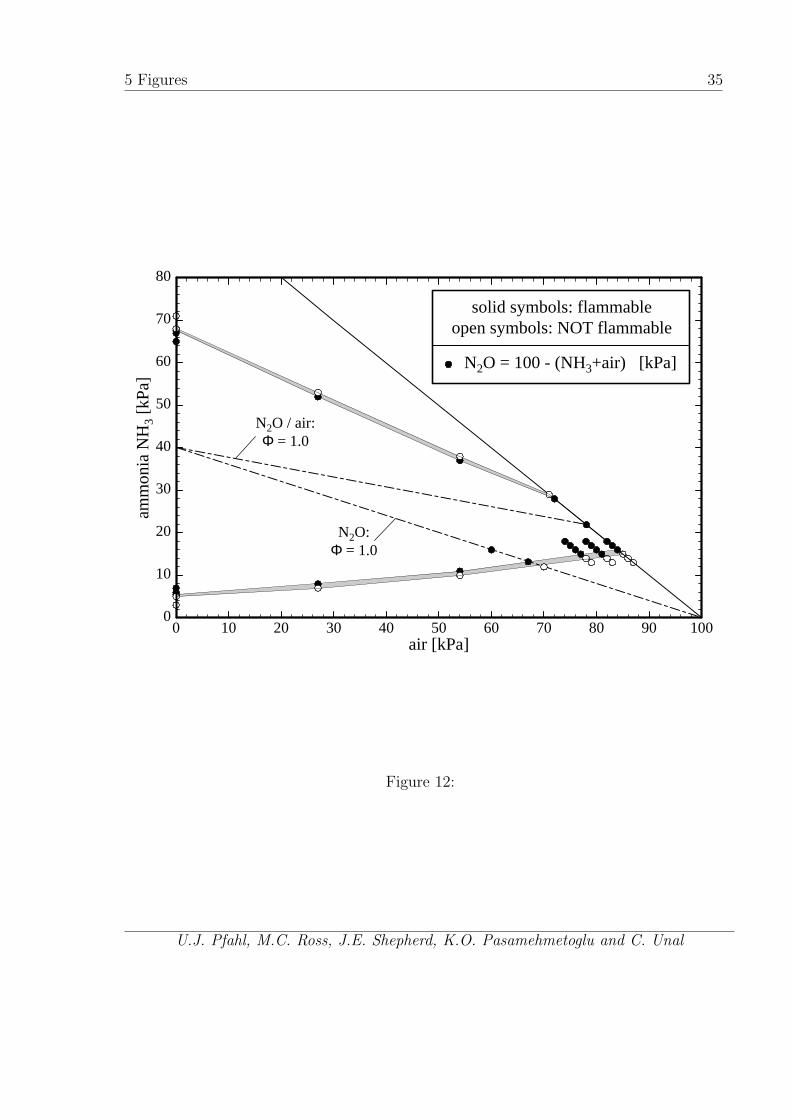
Ammonia–Nitrous Oxide–Air Mixtures
In addition to our ammonia–nitrous oxide experiments with nitrogen dilution we per-formed further tests with air dilution. The results are shown in Fig. 11. Whereas thelower flammability limit is almost similar with air or nitrogen dilution up to 60% dilution,the upper flammability limit (fuel rich, oxygen lean) decreases less with increasing airdilution than with increasing nitrogen dilution. This results in a larger flammability limitand an inerting air concentration of 85% (see Fig. 12: 15% NH3, 0% N2O). All mixturesbetween 71 and 85% NH3 (29-15% air, 0% N2O) are flammable with ignition energies ofapprox. 8 J. Fig. 12
Hydrogen–Ammonia–Air Mixtures
In this study, we examined the upward and downward propagation lean limits for thebinary fuel H2-NH3. The concentration of H2 was varied in 2% increments and theNH3 in 1% increments. Using Le Chatelier’s rule as a guide, the upward and downwardpropagation limits were bracketed. Results are shown in Fig. 13. The data symbols in thisgraph indicate the experimental conditions closest to the lean combustion phenomenon.The linear H2-NH3 relationship for the limits indicate that Le Chatelier’s rule for binarymixtures is appropriate for this system. Fig. 13
Hydrogen–Methane–Ammonia–Nitrous Oxide–Oxygen–Nitrogen Mixtures
Flammability limits of hydrogen, methane and ammonia as mixtures with nitrous oxideare presented above. In addition to these experiments, we performed flammability limit
3 Results and Discussion 11
tests with seven different hydrogen–methane–ammonia–nitrous oxide–nitrogen mixtures(see Table 2) in air. Mixture G represents the best estimated gas composition of flam-mable gas mixture of Tank 101-SY at Hanford site. The other mixture recipes wereconsidered to study the composition effects parametrically. The initial conditions were:p0 = 100 kPa, T0 = 295 K, and ignition energy ≈ 8 J.
The fuel composition of mixture A is 42% H2, 36% N2O, 21% NH3, and 1% CH4. Forthis mixture, we observed downward propagation flames (fan off: quiescent conditions)above 15%, whereas with a mixing fan (turbulent conditions) the lean flammability limitwas obtained between 8 and 10% mixture A.
The fuel composition of mixture B is 35% H2, 35% N2O, and 30% NH3, it has a higherNH3 to H2 ratio than mixture A. For this mixture, we observed downward propagationflames (fan off: quiescent conditions) above 14%. The lean upward propagation limit,determined by the video color schlieren system, was about 9% mixture B.
The fuel composition of mixture C is 25% H2, 25% N2O, and 50% NH3. The leanupward propagation limit is 10%, 9% and lower concentrations of mixture C resultedin no flame detection by the schlieren system. The downward propagation limit wasobserved around 16%.
The fuel composition of mixture D is 16.7% H2, 33.3% N2O, and 50% NH3. Thismixture contains a NH3/H2 ratio of 3:1. Combustion peak pressure results indicatea lean downward propagation limit of 20%. Inspections of the schlieren photographsindicate a lean upward propagation limit of 12% mixture D.
For mixture E, F, and G, we performed tests only with the mixing fan on (turbulentconditions). Combustion peak pressure results of these tests indicate lean flammabilitylimits, at which, without a mixing fan, only upward propagation flames could be observed.For mixture E, 40% H2, 40% N2O, and 20% CH4, this limit occured between 7 and 8%.The lean limit of mixture F, 35% H2, 35% N2O, 20% NH3, and 10% CH4, was observedbetween 8.5 and 9%. Mixture G, 29% H2, 24% N2O, 11% NH3, 1% CH4, and 35% N2,the only mixture with nitrogen dilution, showed a lean flammability limit between 13and 14%. 100% of mixture E or F were also flammable without air, which means, nitrousoxide was the only oxygen source. This could not be observed for mixture G, whereas90% mixture G and 10% air was flammable.
Ignition Energies
It is known that the minimum ignition energy is a strong function of composition near theflammability limit [39]. The minimum value of ignition energy for hydrocarbon fuels inair occurs for slightly rich mixtures and is typically on the order of 0.2-0.25 mJ [39]. Nearthe limits, a steep rise in minimum ignition energy is observed, with mixtures outsidethe flammability limit exhibiting inert behavior even for very large amounts of energy.Note, that our experiments were carried out at an initial temperature of about 22oC.
3 Results and Discussion 12
Initial temperature as well as ignition energy can also show a strong influence on theflammability limits [18].
In our study, we varied the ignition energy between 40 mJ and 8 J. 40 mJ ignitionenergy were provided by a 30 kV pulse (low current) from an EG&G TM-11A power sup-ply (see section Apparatus). By using a 0.5 µF capacitor charged by a Hipotronics powersupply (0 - 15 kV), the spark ignition energy was increased by increasing the chargingvoltage (see Fig. 3). The spark was triggered (by the 30 kV, low current pulse) whenthe desired charging voltage was reached and stabilized. The spark ignition energy wasassumed to be equal to the stored energy in the capacitor, and was therefore estimatedusing the relation:
E =1
2C V 2 , (2)
where E is the spark energy, C the capacitance, and V the charging voltage. The residualenergy remaining in the capacitor after the discharge is less than 1% and is neglected.The actual energy deposited by spark in the gas is smaller than the stored energy [40]due to various loss mechanisms. However, due to the difficulty of directly measuringthe energy, it is standard procedure to report the value given in Equ. 2 as the ignitionenergy [23, 41].
Methane–Nitrous Oxide Mixtures
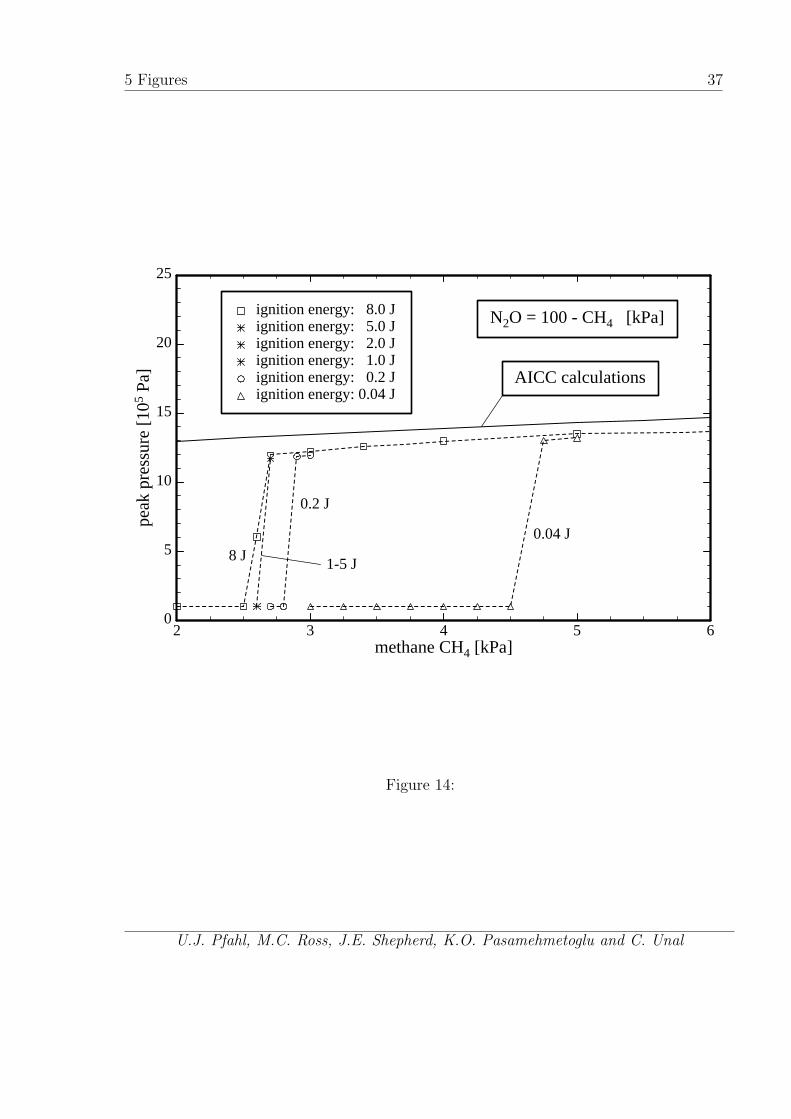
We determined bounds on the ignition energy by carrying out a series of tests with ignitionenergies of 0.04, 0.2, 1.0, 2.0, 5.0 and 8.0 J. For each ignition energy, the minimumamount of methane for flammability of a methane–nitrous oxide mixture at 100 kPainitial pressure and 295 K initial temperature (no nitrogen dilution, fan on: turbulentconditions) was determined.
The measured combustion peak pressures of these runs are plotted in Fig. 14. Alsoshown in this plot are calculated peak pressures. A standard approach for such calcula-tions is to use constant volume explosion estimates (AICC - adiabatic, isochoric, completecombustion) based on chemical equilibrium computations [26]. At the leanest flammableconcentration (2.7% CH4), the peak pressure is about 12 bar, close to the value obtainedfrom N2O decomposition alone (11.8 bar). This behavior is similar to that observed forH2-N2O mixtures by Cashdollar et al. [32], who found that with sufficient ignitor energy(5000 J), hydrogen-nitrous oxide mixtures with as little as 1% H2 could be ignited. Theirlimiting fuel concentration with a 58 J spark was about 6% H2 for downward propaga-tion. Hertzberg and Zlochower [42] propose that H-atoms catalyze N2O decompositionand compounds such as H2, CH4 and NH3 will, in small amounts (1-2%), accelerate thedecomposition reaction sufficiently to stabilize the propagation of a decomposition flame.Substantial N2O decomposition and associated high pressures have been observed for H2,CH4 and NH3, the last being discussed by Jones and Kerr [43]. Note that pressures arereally not “high” but simply close to the 12 bar value that results from N2O decom-position. These values seemed high to previous investigators who were used to modest
3 Results and Discussion 13
pressures for near-limit combustion of hydrocarbon-air mixtures. It was common practice(and still is) to investigate flammability limits in hydrocarbon-air mixtures with a glassapparatus. The destruction of these experiments when investigating N2O alarmed theseinvestigators but in hindsight it is a natural consequence of working with large amountsof N2O. Figure 14 shows that for ignition energies above 1.0 J, the flammability limit isalmost independent of the ignition energy. Increasing the ignition energy from 40 mJ to8 J reduces the lean flammability limit from 4.8 to 2.7% CH4. Similar reductions in theLFL of H2 have been obtained in H2-N2O-air mixtures by Cashdollar et al. [32]. However,experiments using pyrotechnic ignitors [32] and H2-N2O mixtures have shown that if theignitor energy content is increased by several orders of magnitude (up to 5,000-10,000 J),then decomposition flames can be produced [42] even in the absence of any fuel! Fig. 14
Ammonia–Nitrous Oxide(–Nitrogen) Mixtures
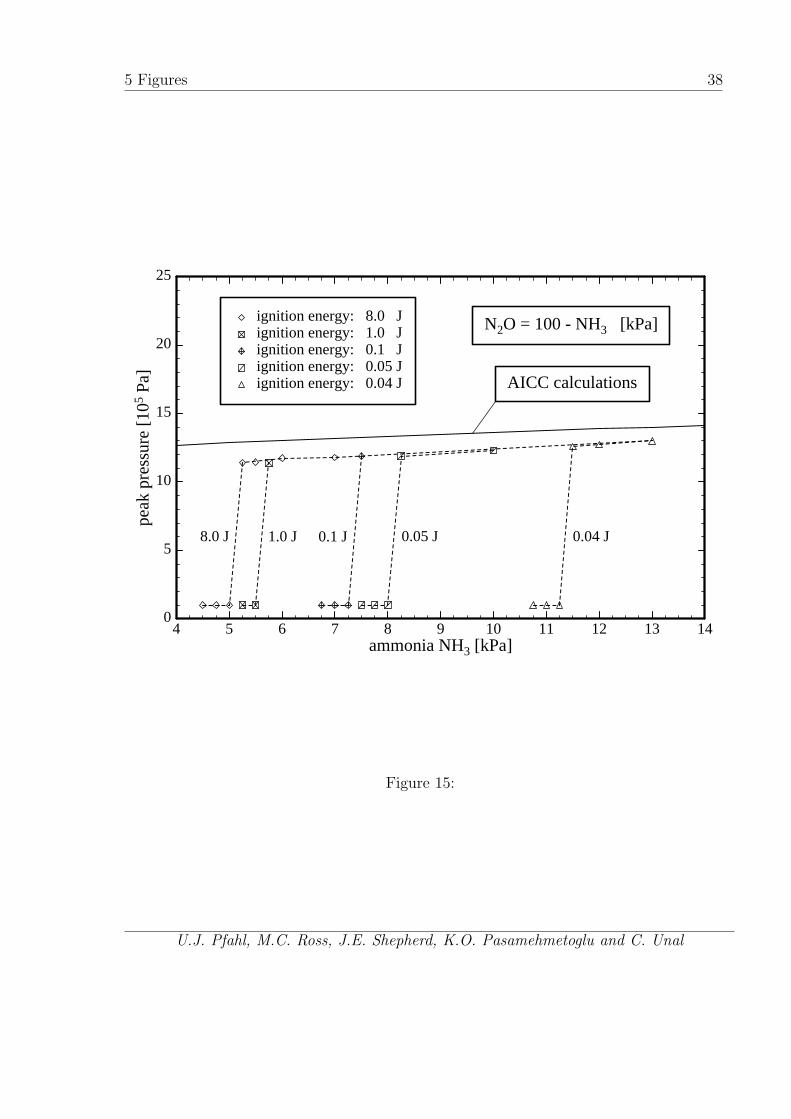
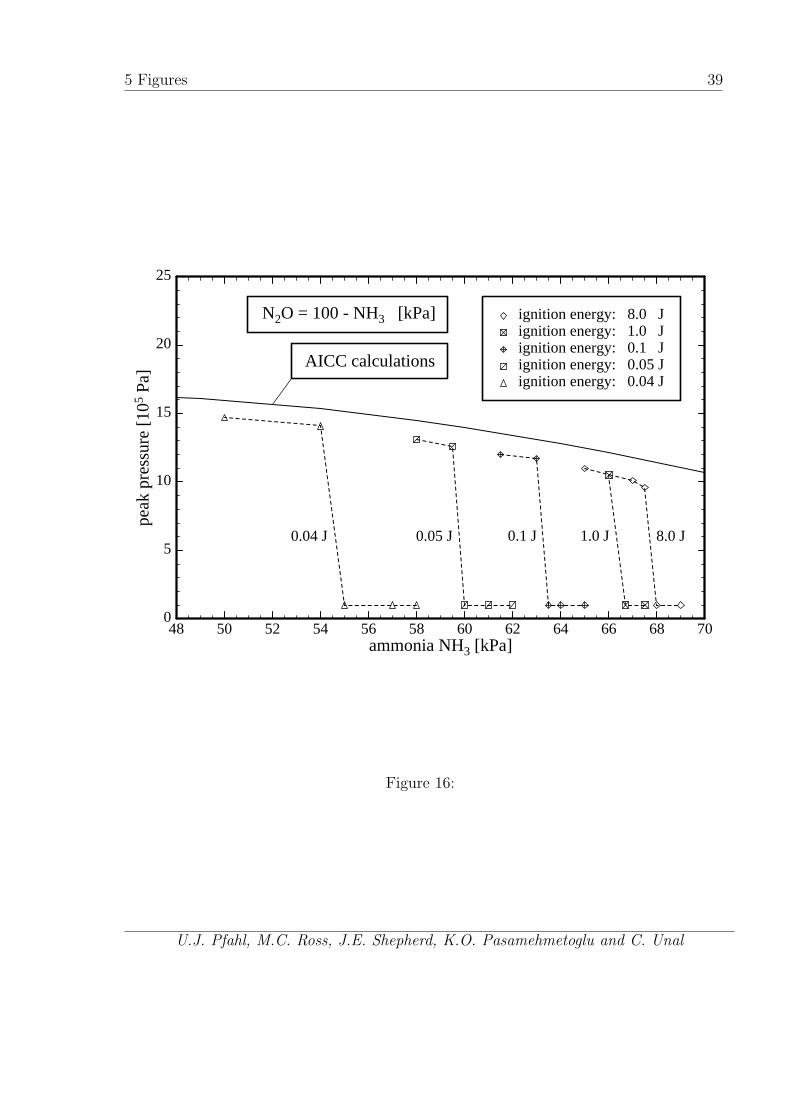
The dependence of the flammability limits on ignition energy were determined for NH3–N2O and NH3–N2O–N2 mixtures for energies between 0.04 and 8 J at 100 kPa initialpressure and 295 K initial temperature (fan on: turbulent conditions). The measuredcombustion peak pressures of lean and rich ammonia-nitrous oxide mixtures are shown inFig. 15 and in Fig. 16, respectively. The dependence of the flammability limits on ignitionenergy is much more pronounced for NH3–N2O mixtures than for CH4–N2O mixtures.Using 8 J ignition energy, mixtures with an initial amount of ammonia between 5.3 and67.5% are flammable. Decreasing the ignition energy from 8.0 to 0.1 J narrows the flam-mable region to 7.5 - 63.0% NH3. With 0.04 J ignition energy, 11.5 - 54.0% NH3 arerequired for flammability. Calcote et al. [41] measured a minimum spark ignition energyof 0.07 mJ for a stoichiometric NH3–N2O mixture (40% NH3, 60% N2O) at atmosphericpressure. Our measured ignition energy bounds at 54% nitrogen dilution are shown inFig. 17. In addition, we performed some tests with ammonia–air mixtures. A stochio-metric ammonia–air mixture at 100 kPa initial pressure (21.9% ammonia, 78.1% air)could not be ignited with energies less than 50 mJ, whereas the mixture was flammablefor spark ignition energies above 100 mJ. Buckley and Husa [36] obtained a minimumignition energy of 680 mJ for ammonia–air mixtures. Fig. 15
Fig. 16
Fig. 17Hydrogen–Methane–Ammonia–Nitrous Oxide–Oxygen–Nitrogen Mixtures
We performed further ignition energy tests with three different hydrogen–methane–ammonia–nitrous oxide–nitrogen mixtures (see mixtures E, F, and G in Table 2) inair. The initial conditions were: p0 = 100 kPa, T0 = 295 K, and fan on (turbulentconditions). The ignition energy was again varied between 40 mJ and 8 J.
For mixtures E and G we observed almost no variation of the lean flammability limitin air by decreasing the ignition energy from 8 to 0.04 J, whereas for mixture F the leanlimit increased about 0.5%, from 8.5 - 9% to 9 - 9.5%.
3 Results and Discussion 14
Flame Speeds
When predicting the combustion behavior of multiple component mixtures, the flamespeed of the pure mixtures in oxidizer can give some insight into deviation from idealbehavior. For example, when H2 is mixed with CH4 and burned in air, the differencein flame speeds causes CH4 to act as a diluent for some stoichiometries. Flame speedsnear the lean limit for these fuels are not very well known. Flame speed measurementsprovide a method of comparing very lean mixtures. Ronney [44] performed flame speedmeasurements for lean NH3-air mixtures in microgravity. The method used by Ronneyto calculate burning velocities in closed vessel experiments is described in Andrews andBradley [45].
In the idealized flame propagation experiment (such as the “soap bubble” tech-nique [45]), the pressure initially remains constant during combustion and the flamefront is spherical. The flame front expands radially, and it is assumed that the burnedgas inside the flame ball remains stationary. Therefore, the laminar burning velocity isthe difference between the expansion rate of the flame front, Vf , and the velocity of theunburned reactants. The laminar burning velocity S0
L is therefore
S0L = Vf − u. (3)
The continuity equation may be applied to obtain a relation between the burning velocityand the expansion rate of the bubble.
ρuS0L = ρbVf , (4)
where Vf is dRb/dt. The final expression for the laminar burning velocity is
S0L =
dRb
dt
ρb
ρu
. (5)
The ratio ρb/ρu is the density of the burned material, evaluated by chemical equilibriumcomputations at constant pressure, over the density of the reactants at initial state.Normally this ratio is on the order of 0.2 for the mixtures studied in this report.
The uncertainty associated with measuring the laminar burning velocity using thismethod is almost entirely due to the effect of buoyancy. The flame ball does not remainspherical, and initially the electrodes interfere with the flame front motion. As shown inFig. 18 and video frames discussed previously (see Figs. 4-6), the flame moves upwardas well as outward. By measuring the horizontal component of the flame motion (R(t)in Fig. 18), the effect of buoyancy was minimized. The laminar burning velocity wasdetermined by measuring the horizontal growth of the flame in successive frames of theschlieren system video recording. The maximum radius measured in this fashion was 58mm, limited by the field of view of the schlieren system. Despite the effect of buoyancy,a very linear dependence of Rb(t) was observed. Fig. 18
The two lines shown in Fig. 18 were obtained by drawing lines through the (x,y)coordinates of largest horizontal extent of each flame. In practice, the coordinates were
3 Results and Discussion 15
not perfectly aligned and so a fit to the data points was required. The growth data wasfit to a linear function Rb(t) = at+b and the slope was interpreted as the flame speed Vf .The slope can be determined quite accurately (the standard error is typically less than5%) and the uncertainty in the flame speed is almost entirely due to unquantified effectsof buoyancy. Comparisons with microgravity, two-kernel and LDV [46] measurementsare quite favorable.
Subsequent work by O. Kunz ([47]) has shown that this technique is in reasonableagreement with other more accepted methods such as the t3 analysis of the pressuretraces for slow flames. Other work by K.S. Raman [46] on LDV measurement of veryslow flames indicate that the simple maximum width approach is reasonable for very leanH2flames even though the flames are highly distorted by buoyancy.
In Fig. 4 the apparent drift to the left is an optical illusion caused by the fact thatthe ignition point is not in the center of the chamber. In all cases, such offsets wereeliminated by finding the largest width of the flame and then dividing by 2 to obtaineffective radius.
Ammonia–Air–Nitrous Oxide Mixtures
NH3-air-N2O tests were conducted over the range of 12-24% NH3. Three N2O concentra-tions were used, 0, 4, and 8%. All of these tests were carried out at initial conditions of100 kPa and 295 K with the mixing fan off (quiescent conditions). The results indicatethat the downward propagation limit of NH3-air mixtures is decreased as N2O is addedto the mixture. Addition of N2O resulted in a significant increase in the peak pressuresfor a given NH3 concentration. The downward propagation limit decreased from 18 to15% NH3 with the addition of 8% N2O.
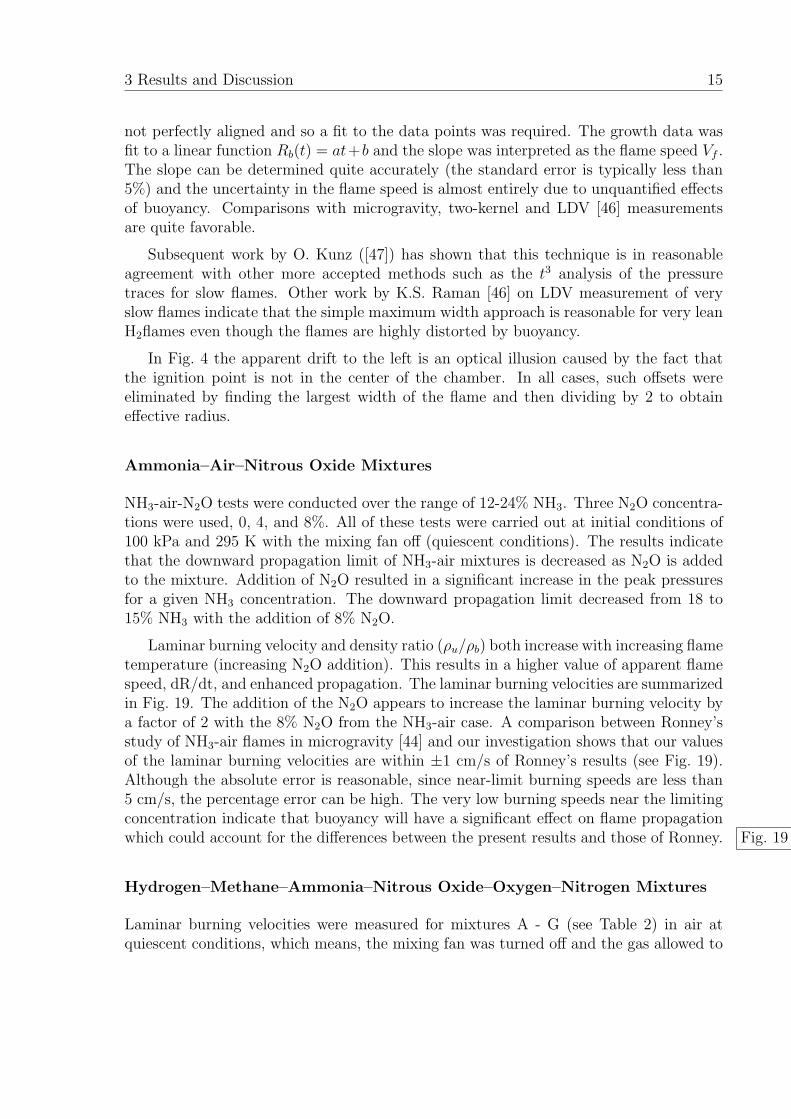
Laminar burning velocity and density ratio (ρu/ρb) both increase with increasing flametemperature (increasing N2O addition). This results in a higher value of apparent flamespeed, dR/dt, and enhanced propagation. The laminar burning velocities are summarizedin Fig. 19. The addition of the N2O appears to increase the laminar burning velocity bya factor of 2 with the 8% N2O from the NH3-air case. A comparison between Ronney’sstudy of NH3-air flames in microgravity [44] and our investigation shows that our valuesof the laminar burning velocities are within ±1 cm/s of Ronney’s results (see Fig. 19).Although the absolute error is reasonable, since near-limit burning speeds are less than5 cm/s, the percentage error can be high. The very low burning speeds near the limitingconcentration indicate that buoyancy will have a significant effect on flame propagationwhich could account for the differences between the present results and those of Ronney. Fig. 19
Hydrogen–Methane–Ammonia–Nitrous Oxide–Oxygen–Nitrogen Mixtures
Laminar burning velocities were measured for mixtures A - G (see Table 2) in air atquiescent conditions, which means, the mixing fan was turned off and the gas allowed to
4 Conclusions 16
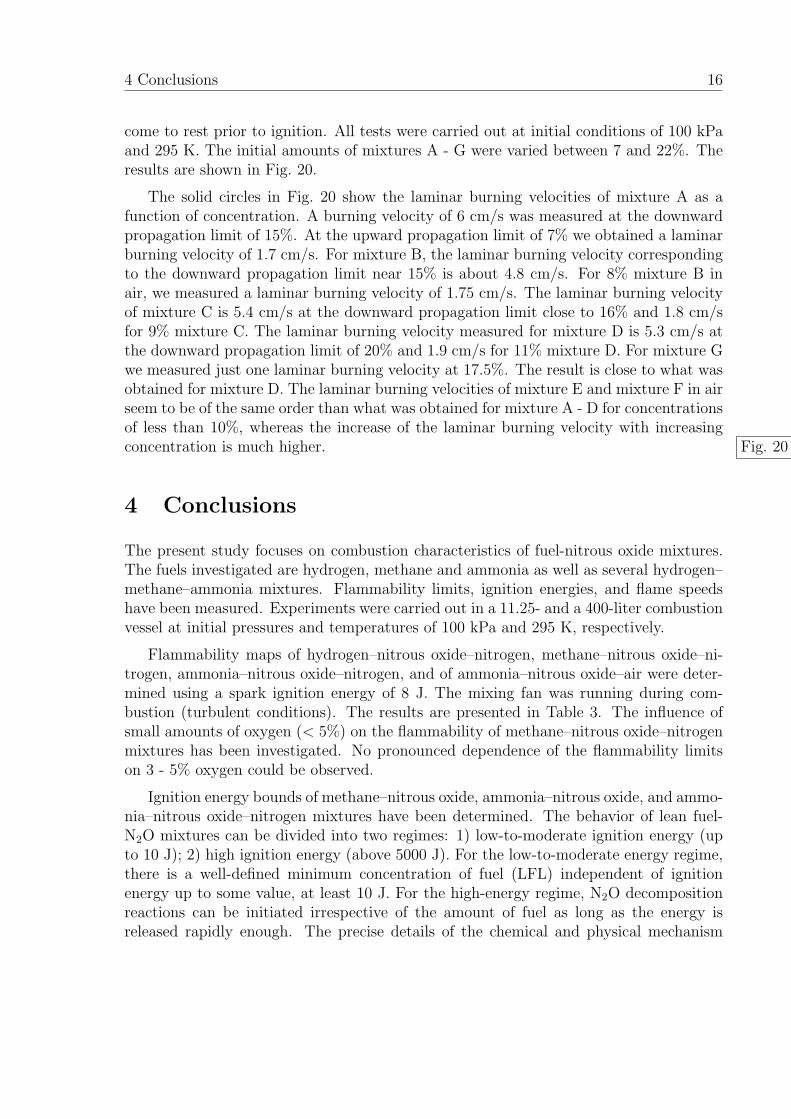
come to rest prior to ignition. All tests were carried out at initial conditions of 100 kPaand 295 K. The initial amounts of mixtures A - G were varied between 7 and 22%. Theresults are shown in Fig. 20.
The solid circles in Fig. 20 show the laminar burning velocities of mixture A as afunction of concentration. A burning velocity of 6 cm/s was measured at the downwardpropagation limit of 15%. At the upward propagation limit of 7% we obtained a laminarburning velocity of 1.7 cm/s. For mixture B, the laminar burning velocity correspondingto the downward propagation limit near 15% is about 4.8 cm/s. For 8% mixture B inair, we measured a laminar burning velocity of 1.75 cm/s. The laminar burning velocityof mixture C is 5.4 cm/s at the downward propagation limit close to 16% and 1.8 cm/sfor 9% mixture C. The laminar burning velocity measured for mixture D is 5.3 cm/s atthe downward propagation limit of 20% and 1.9 cm/s for 11% mixture D. For mixture Gwe measured just one laminar burning velocity at 17.5%. The result is close to what wasobtained for mixture D. The laminar burning velocities of mixture E and mixture F in airseem to be of the same order than what was obtained for mixture A - D for concentrationsof less than 10%, whereas the increase of the laminar burning velocity with increasingconcentration is much higher. Fig. 20
4 Conclusions
The present study focuses on combustion characteristics of fuel-nitrous oxide mixtures.The fuels investigated are hydrogen, methane and ammonia as well as several hydrogen–methane–ammonia mixtures. Flammability limits, ignition energies, and flame speedshave been measured. Experiments were carried out in a 11.25- and a 400-liter combustionvessel at initial pressures and temperatures of 100 kPa and 295 K, respectively.
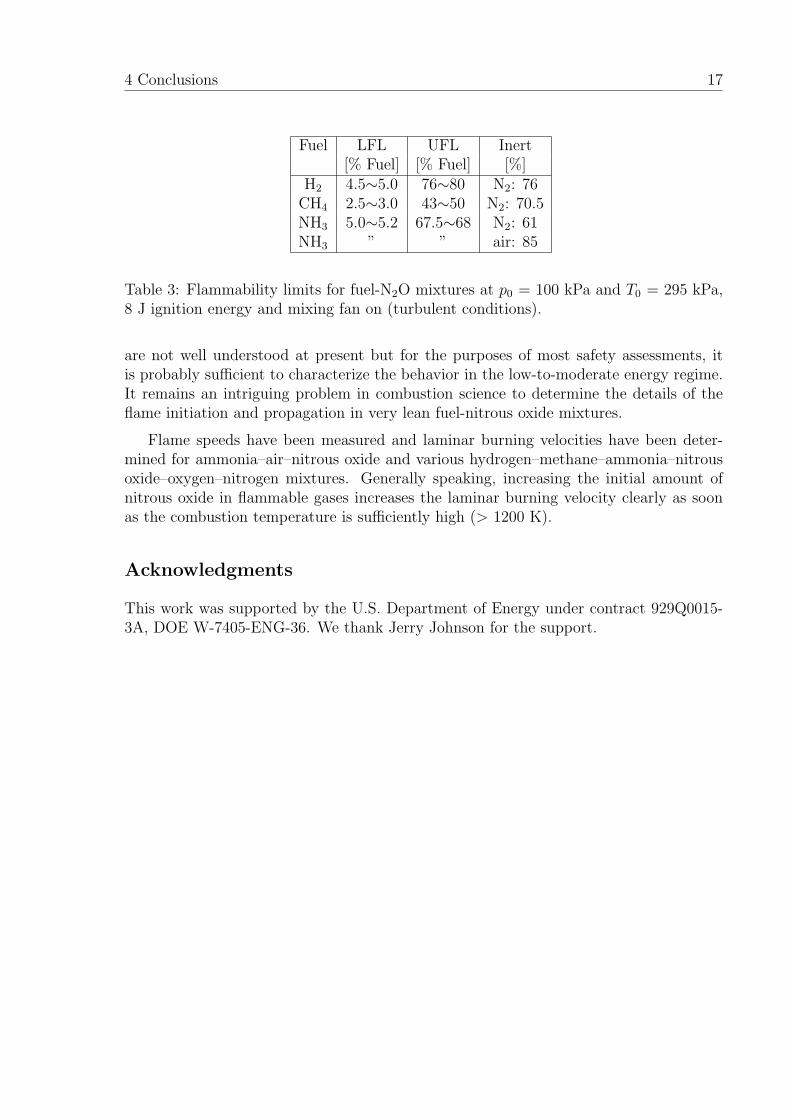
Flammability maps of hydrogen–nitrous oxide–nitrogen, methane–nitrous oxide–ni-trogen, ammonia–nitrous oxide–nitrogen, and of ammonia–nitrous oxide–air were deter-mined using a spark ignition energy of 8 J. The mixing fan was running during com-bustion (turbulent conditions). The results are presented in Table 3. The influence ofsmall amounts of oxygen (< 5%) on the flammability of methane–nitrous oxide–nitrogenmixtures has been investigated. No pronounced dependence of the flammability limitson 3 - 5% oxygen could be observed.
Ignition energy bounds of methane–nitrous oxide, ammonia–nitrous oxide, and ammo-nia–nitrous oxide–nitrogen mixtures have been determined. The behavior of lean fuel-N2O mixtures can be divided into two regimes: 1) low-to-moderate ignition energy (upto 10 J); 2) high ignition energy (above 5000 J). For the low-to-moderate energy regime,there is a well-defined minimum concentration of fuel (LFL) independent of ignitionenergy up to some value, at least 10 J. For the high-energy regime, N2O decompositionreactions can be initiated irrespective of the amount of fuel as long as the energy isreleased rapidly enough. The precise details of the chemical and physical mechanism
4 Conclusions 17
Fuel LFL UFL Inert[% Fuel] [% Fuel] [%]
H2 4.5∼5.0 76∼80 N2: 76CH4 2.5∼3.0 43∼50 N2: 70.5NH3 5.0∼5.2 67.5∼68 N2: 61NH3 ” ” air: 85
Table 3: Flammability limits for fuel-N2O mixtures at p0 = 100 kPa and T0 = 295 kPa,8 J ignition energy and mixing fan on (turbulent conditions).
are not well understood at present but for the purposes of most safety assessments, itis probably sufficient to characterize the behavior in the low-to-moderate energy regime.It remains an intriguing problem in combustion science to determine the details of theflame initiation and propagation in very lean fuel-nitrous oxide mixtures.
Flame speeds have been measured and laminar burning velocities have been deter-mined for ammonia–air–nitrous oxide and various hydrogen–methane–ammonia–nitrousoxide–oxygen–nitrogen mixtures. Generally speaking, increasing the initial amount ofnitrous oxide in flammable gases increases the laminar burning velocity clearly as soonas the combustion temperature is sufficiently high (> 1200 K).
Acknowledgments
This work was supported by the U.S. Department of Energy under contract 929Q0015-3A, DOE W-7405-ENG-36. We thank Jerry Johnson for the support.

REFERENCES 18
References
[1] Sullivan L. H. et al. A safety assessment for proposed pump mixing operations tomitigate episodic gas releases in tank 241-SY-101: Hanford Site, Richland, Washing-ton, Revision 14. Los Alamos National Laboratory Report LA-UR-92-3196, April1995.
[2] ASTM D56. Standard Test Method for Flash Point by Tag Closed Tester. AmericanSociety for Testing and Materials, 1988.
[3] ASTM E582. Standard Test Method for Minimum Ignition Energy and QuenchingDistance in Gaseous Mixtures. American Society for Testing and Materials, 1988.
[4] ASTM E1232. Standard Test Method for Temperature Limit of Flammability ofChemicals. American Society for Testing and Materials, 1991.
[5] ASTM E681. Standard Test Method for Concentration Limits of Flammability ofChemicals. American Society for Testing and Materials, 1985.
[6] H. F. Coward and G. W. Jones. Limits of flammability of gases and vapors. Bulletin503, Bureau of Mines, 1952.
[7] M. G. Zabetakis. Flammability characteristics of combustible gases and vapors.Bulletin 627, Bureau of Mines, 1965.
[8] M.G. Zabetakis, G. S. Scott, and G. W. Jones. Limits of flammability of paraffinhydrocarbons in air. Ind. Eng. Chem., 43(9):2120–2124, 1951.
[9] J. E. Shepherd, J. J. Lee, and J. C. Krok. Spark ignition measurements in Jet A.Explosion Dynamics Laboratory Report FM97-9, California Institute of Technology,June 1998.
[10] J. J. Lee and J. E. Shepherd. Spark Ignition Measurements in Jet A: part II.Explosion Dynamics Laboratory Report FM99-7, California Institute of Technology,December 1999.
[11] D. B. Spalding. A theory of inflammability limits and flame quenching. Proc. Roy.Soc. (London), Series A, 240:83, 1957.
[12] C. K. Law and F. N. Egolfopoulos. A unified chain-thermal theory of fundamentalflammability limits. In Twenty-Fourth Symp. (Intl) Combustion, pages 137–144,Pittsburgh, PA, 1992. The Combustion Institute.
[13] C. J. Sung and C. K. Law. Extinction mechanisms of near-limit premixed flames andextended limits of flammability. In Twenty-Sixth Symp. (Intl) Combustion, pages865–873, Pittsburgh, PA, 1992. The Combustion Institute.
REFERENCES 19
[14] M. N. Bui-Pham, A. E. Lutz, J. A. Miller, M. Desjardin, D. M. O’Shaughnessaey,and R. J. Zondlak. Rich flammability limits in ch3oh/co/diluent mixtures. Combust.Sci. Tech., 109:71–91, 1995.
[15] W. D. Breshears. Falloff behavior in the thermal dissociation rate of N2O. Journalof Physical Chemistry, 99:12529 – 12535, 1995.
[16] U. J. Pfahl, J. E. Shepherd, and W. D. Breshears. Nitrous oxide consumption duringcombustion of hydrogen–methane–ammonia–nitrous oxide–air mixtures. Combus-tion and Flame, in press, 1998.
[17] H. Le Chatelier and O. Boudouard. Limits of flammability of combustible vapors.Compt. Rend., 126:1510, 1898.
[18] M. G. Zabetakis. Flammability characteristics of combustible gases and vapors.Bulletin 627, Bureau of Mines, 1965.
[19] M. C. Ross and J. E. Shepherd. Lean combustion characteristics of hydrogen-nitrousoxide-ammonia mixtures in air. Part I. Explosion Dynamics Laboratory ReportFM96-4, California Institute of Technology, Pasadena, CA, July 1996.
[20] P. D. Ronney. Effect of gravity on laminar premixed gas combustion II: ignition andextinction phenomena. Combustion and Flame, 62:121–133, 1985.
[21] K.-G. Strid. Experimental techniques for the determination of ignition energy. InOxidation and Combustion Reviews, pages 1–46, 1973.
[22] H. F. Coward and G. W. Jones. Limits of flammability of gases and vapors. Bulletin503, Bureau of Mines, 1952.
[23] B. Lewis and G. Von Elbe. Combustion, flames, and explosions of gases. AcademicPress, Inc., New York, 1961.
[24] M. Hertzberg. The theory of flammability limits, natural convection. Bulletin 8127,Bureau of Mines, 1976.
[25] A. Abbud-Madrid and P. D. Ronney. Effects of radiative and diffusive transportprocesses on premixed flames near flammability limits. In Twenty-Third Symp. (Intl)Combustion, pages 423–431, Pittsburgh, PA, 1990. The Combustion Institute.
[26] W. C. Reynolds. The Element Potential Method for Chemical Equilibrium Analysis:Implementation in the Interactive Program STANJAN. Stanford University, Dept.of Mechanical Engineering, Stanford, CA, 3rd edition, January 1986.
[27] S. Smith and J. W. Linnett. The upper limits of inflammability of hydrogen–air andhydrogen–nitrous oxide mixtures. J. Chem. Soc. (London), Part I:37–43, 1953.
REFERENCES 20
[28] K. Posthumus. On explosion regions of gas mixtures, in which one or two of thegases are endothermic. Rec. trav. chim., 49:309–347, 1930.
[29] M. J. van der Wal. Explosive and nonexplosive reactions between nitrogen oxidesand flammable gases. Rec. trav. chim., 53:97–117, 1934.
[30] F. E. Scott, R. W. Van Dolah, and M. G. Zabetakis. The flammability characteristicsof the system H2–NO–N2O–air. In Sixth Symp. (Intl) Combustion, pages 540–545,Pittsburgh, PA, 1957. The Combustion Institute.
[31] Yu. N. Shebeko, S. G. Tsarichenko, A. Ya. Korolchenko, A. V. Trunev, V. Yu.Navzenya, S. N. Papkov, and A. A. Zaitzev. Burning velocities and flammabilitylimits of gaseous mixtures at elevated temperatures and pressures. Combustion andFlame, 102:427–437, 1995.
[32] K.L. Cashdollar, M. Hertzberg, I.A. Zlochower, C.E. Lucci, G. M. Green, and R. A.Thomas. Laboratory flammability studies of mixtures of hydrogen, nitrous oxide,and air. Final Report WHC-SD-WM-ES-219, Bureau of Mines, June 1992.
[33] D. L. Fenton, A. S. Khan, R. D. Kelley, and K. S. Chapman. Combustion charac-teristics review of ammonia–air mixtures. ASHRAE Transactions, 3922:1–10, 1995.
[34] J. W. Armitage and P. Gray. Flame speeds and flammability limits in the combustionof ammonia: ternary mixtures with hydrogen, nitric oxide, nitrous oxide or oxygen.Combustion and Flame, 9:173–184, 1965.
[35] D. G. R. Andrews and P. Gray. Combustion of ammonia supported by oxygen,nitrous oxide or nitric oxide: laminar flame propagation at low pressures in binarymixtures. Combustion and Flame, 8:113–126, 1964.
[36] W. L. Buckley and H. W. Husa. Combustion properties of ammonia. ChemicalEngineering Progress, 58, 2:81–84, 1962.
[37] W. P. Jorissen and B. L. Ongkiehong. The explosion regions of hydrogen–ammonia–air and hydrogen–ammonia–oxygen mixtures. Rec. trav. chim., 45:224–231, 1926.
[38] A. G. White. Limits for the propagation of flame at various temperatures in mixturesof ammonia with air and oxygen. J. Chem. Soc., 121:1688–1695, 1922.
[39] J.M. Kuchta. Investigation of fire and explosion accidents in the chemical, mining,and fuel-related industries—a manual. Bulletin 680, U.S. Bureau of Mines, 1985.
[40] K.-G. Strid. Experimental techniques for the determination of ignition energy. Ox-idation and Combustion Reviews, pages 1–46, 1973.
[41] H. F. Calcote, Jr. C. A. Gregory, C. M. Barnett, and Ruth B. Gilmer. Spark ignition.Industrial and Engineering Chemistry, 44, 11:2656–2662, 1952.
REFERENCES 21
[42] M. Hertzberg and I.A. Zlochower. Explosibility of nitrous oxide gas: The effect ofH-atom-bearing impurities. Abstract, Joint Meeting of British and German Sectionsof the Combustion Institute, March 29-April 3, Cambridge, England, 1993.
[43] E. Jones and J.C. Kerr. Inflammability limits of ammonia, nitrous oxide, and air.J.S.C.I., 68:31–34, 1949.
[44] P. D. Ronney. Effect of chemistry and transport properties on near–limit flames atmicrogravity. Combustion Science and Technology, 59:123–141, 1987.
[45] G. E. Andrews and D. Bradley. Combustion and Flame, 18:133, 1972.
[46] K. S. Raman. Laminar burning velocities of lean hydrogen-air mixtures. Explo-sion Dynamics Laboratory Report FM97-15, California Institute of Technology,Pasadena, CA, January 1998.
[47] Oliver Kunz. Combustion characteristics of hydrogen- and hydrocarbon-air mix-tures in closed vessels. Technical Report FM98-4, GALCIT, California Institute ofTechnology, March 1998.
[48] G. W. Jones and G. St. J. Perrott. Oxygen required for the propagation of hydrogen,carbon monoxide, and methane flames. Ind. and Eng. Chem., 19:985–989, 1927.
5 Figures 22
5 Figures
Figure captions:
Fig. 1: Schematic diagram of the 11.25 liter constant volume combustion vessel.
Fig. 2: Schematic diagram of the color-schlieren video-system.
Fig. 3: Schematic diagram of the spark ignition system.
Fig. 4: Sequence of video frames from experiment 180: 20 kPa NH3, 80 kPa air; initialpressure p0 = 100 kPa, initial temperature T0 = 22C; fan off (quiescent conditions);combustion peak pressure = 5.1 bar.
Fig. 5: Sequence of video frames from experiment 183: 18 kPa NH3, 82 kPa air; initialpressure p0 = 100 kPa, initial temperature T0 = 22C; fan on (turbulent conditions);combustion peak pressure = 6.7 bar.
Fig. 6: Sequence of video frames from experiment 159: 7 kPa H2, 7 kPa N2O, 6 kPaNH3, 80 kPa air; initial pressure p0 = 100 kPa, initial temperature T0 = 22C; fan off(quiescent conditions); combustion peak pressure = 5.4 bar.
Fig. 7: Literature data of flammability limits of hydrogen–air–nitrogen [48], hydrogen–oxygen–nitrogen [31, 22], and hydrogen–nitrous oxide–nitrogen mixtures [28, 27, 30, 29];initial pressure p0 = 1 atm, initial temperature T0 = 25C.
Fig. 8: Flammability limits of hydrogen–nitrous oxide–nitrogen mixtures; initial pres-sure p0 = 100 kPa, initial temperature T0 = 22C.
Fig. 9: Flammability limits of methane–nitrous oxide–nitrogen, methane–nitrous oxide–oxygen–nitrogen, and methane–oxygen–nitrogen mixtures (Zabetakis [18] data is only forCH4-O2-N2); initial pressure p0 = 100 kPa, initial temperature T0 = 22C.
Fig. 10: Influence of small amounts of oxygen on the flammability limits of methane–nitrous oxide–nitrogen mixtures; initial pressure p0 = 100 kPa, initial temperature T0 =22C.
Fig. 11: Flammability limits of ammonia–nitrous oxide–nitrogen mixtures; initial pres-sure p0 = 100 kPa, initial temperature T0 = 22C.
Fig. 12: Flammability limits of ammonia–nitrous oxide–air mixtures; initial pressure p0
= 100 kPa, initial temperature T0 = 22C.
5 Figures 23
Fig. 13: Upward and downward propagation flammability limits of hydrogen–ammonia–air mixtures; initial pressure p0 = 100 kPa, initial temperature T0 = 22C.
Fig. 14: Peak pressure vs. initial methane concentration for fuel–lean methane–nitrousoxide mixtures at various ignition energies.
Fig. 15: Peak pressure vs. initial ammonia concentration for fuel–lean ammonia–nitrous oxide mixtures at various ignition energies.
Fig. 16: Peak pressure vs. initial ammonia concentration for fuel–rich ammonia–nitrousoxide mixtures at various ignition energies.
Fig. 17: Peak pressure vs. initial ammonia concentration for ammonia–nitrous oxide–nitrogen mixtures at various ignition energies.
Fig. 18: Experimentally observed flame development showing a typical buoyant flamenear the lean flammability limit; R(t): flame radius as a function of time.
Fig. 19: Laminar burning velocity vs. initial ammonia concentration of ammonia–nitrous oxide–air mixtures; data from Ronney’s [44] microgravity experiments are alsoplotted.
Fig. 20: Laminar burning velocity vs. initial mixture concentration of various hydrogen–methane–ammonia–nitrous oxide–nitrogen mixtures in air.

5 Figures 24
spark gap
window
thermo-couple
electrodeterminal
electrodeterminal
pressuretransducerconnector
thermocoupleconnector
gas line
mixingfan
Figure 1:
U.J. Pfahl, M.C. Ross, J.E. Shepherd, K.O. Pasamehmetoglu and C. Unal
5 Figures 25
lightsource
CCDcamera
lensaperture
mirror
color-focussing
windowgas ignition
vessel
parabolicmirror
parabolicmirror
flatmirror
to video recordingequipment
Figure 2:
U.J. Pfahl, M.C. Ross, J.E. Shepherd, K.O. Pasamehmetoglu and C. Unal
5 Figures 26
Capacitor0.5 µF
HipotronicsPower Supply
+_0-15 kV 30 kV
EG & G TM-11APower Supply
SparkGap
R 250 ΩR 2 MΩ DiodeDiode
R 0.01 Ω
+_
~ I
R 330 kΩ R 1090 MΩ
~ V+_
+_
+_
+_
0.04 -8.0 J
Figure 3:
U.J. Pfahl, M.C. Ross, J.E. Shepherd, K.O. Pasamehmetoglu and C. Unal
5 Figures 27
(a) (b)
(c) (d)
(e) (f)
Figure 4:

5 Figures 28
(a) (b)
(c) (d)
(e) (f)
Figure 5:
5 Figures 29
(a) (b)
(c) (d)
(e) (f)
Figure 6:
5 Figures 30
0 10 20 30 40 50 60 70 80 90 100nitrogen N2 [kPa]
0
10
20
30
40
50
60
70
80
90
100
hydr
ogen
H2
[kPa
]
air Jones and PerrottO2 Shebeko et al.N2O PosthumusN2O Smith and Linnett
N2O Scott et al. N2O van der Wal O2 Coward and Jones
flammablemixtures
Figure 7:
U.J. Pfahl, M.C. Ross, J.E. Shepherd, K.O. Pasamehmetoglu and C. Unal

5 Figures 31
0 10 20 30 40 50 60 70 80 90 100nitrogen N2 [kPa]
0
10
20
30
40
50
60
70
80
90
hydr
ogen
H2
[kPa
] N2O = 100 - (H2+N2) [kPa]
PosthumusSmith and Linnett
flammablemixtures
solid symbols: flammableopen symbols: NOT flammable
Figure 8:
U.J. Pfahl, M.C. Ross, J.E. Shepherd, K.O. Pasamehmetoglu and C. Unal

5 Figures 32
0 10 20 30 40 50 60 70 80 90 100nitrogen N2 [kPa]
0
10
20
30
40
50
60
70
met
hane
CH
4 [k
Pa]
N2O = 100 - (CH4+N2) [kPa] O2 = 100 - (CH4+N2) [kPa]N2O = 97 - (CH4+N2) (3 O2) [kPa]
CH4-O2-N2
N2O = 95 - (CH4+N2) (5 O2) [kPa]
solid symbols: flammableopen symbols: NOT flammable
flammablemixtures
Zabetakis (1965)
Figure 9:
U.J. Pfahl, M.C. Ross, J.E. Shepherd, K.O. Pasamehmetoglu and C. Unal
5 Figures 33
40 50 60 70 80 90 100nitrogen N2 [kPa]
0
2
4
6
8
10
12
14
16
18
20
22
24
26
28
met
hane
CH
4 [k
Pa]
N2O = 100 - (CH4+N2) [kPa] O2 = 100 - (CH4+N2) [kPa]N2O = 97 - (CH4+N2) (3 O2) [kPa]
CH4-O2-N2
N2O = 95 - (CH4+N2) (5 O2) [kPa]
open symbols: NOT flammablesolid symbols: flammable
N2O (3 O2):Φ = 1.0
O2:Φ = 1.0
N2O:Φ = 1.0
Zabetakis (1965)
Figure 10:
U.J. Pfahl, M.C. Ross, J.E. Shepherd, K.O. Pasamehmetoglu and C. Unal
5 Figures 34
0 10 20 30 40 50 60 70 80 90 100nitrogen N2 [kPa]
0
10
20
30
40
50
60
70
80
90
amm
onia
NH
3 [k
Pa]
N2O = 100 - (NH3+N2) [kPa]
solid symbols: flammableopen symbols: NOT flammable
Φ = 1.0
Figure 11:
U.J. Pfahl, M.C. Ross, J.E. Shepherd, K.O. Pasamehmetoglu and C. Unal
5 Figures 35
0 10 20 30 40 50 60 70 80 90 100air [kPa]
0
10
20
30
40
50
60
70
80
amm
onia
NH
3 [k
Pa]
N2O = 100 - (NH3+air) [kPa]
solid symbols: flammableopen symbols: NOT flammable
N2O / air:Φ = 1.0
N2O:Φ = 1.0
Figure 12:
U.J. Pfahl, M.C. Ross, J.E. Shepherd, K.O. Pasamehmetoglu and C. Unal
5 Figures 36
0 2 4 6 8 10 12 14 16 18 20ammonia NH3 [kPa]
0
1
2
3
4
5
6
7
8
9
10
hydr
ogen
H2
[kPa
]
no flame
upwardpropagating
flame
downwardpropagating
flame
Figure 13:
U.J. Pfahl, M.C. Ross, J.E. Shepherd, K.O. Pasamehmetoglu and C. Unal
5 Figures 37
2 3 4 5 6methane CH4 [kPa]
0
5
10
15
20
25
peak
pre
ssur
e [1
05 Pa
]
ignition energy: 8.0 Jignition energy: 5.0 Jignition energy: 2.0 Jignition energy: 1.0 Jignition energy: 0.2 Jignition energy: 0.04 J
8 J
0.2 J
1-5 J
AICC calculations
N2O = 100 - CH4 [kPa]
0.04 J
Figure 14:
U.J. Pfahl, M.C. Ross, J.E. Shepherd, K.O. Pasamehmetoglu and C. Unal
5 Figures 38
4 5 6 7 8 9 10 11 12 13 14ammonia NH3 [kPa]
0
5
10
15
20
25
peak
pre
ssur
e [1
05 Pa
]
ignition energy: 8.0 Jignition energy: 1.0 Jignition energy: 0.1 Jignition energy: 0.05 Jignition energy: 0.04 J
8.0 J 1.0 J 0.1 J 0.05 J 0.04 J
AICC calculations
N2O = 100 - NH3 [kPa]
Figure 15:
U.J. Pfahl, M.C. Ross, J.E. Shepherd, K.O. Pasamehmetoglu and C. Unal
5 Figures 39
48 50 52 54 56 58 60 62 64 66 68 70ammonia NH3 [kPa]
0
5
10
15
20
25
peak
pre
ssur
e [1
05 Pa
]
ignition energy: 8.0 Jignition energy: 1.0 Jignition energy: 0.1 Jignition energy: 0.05 Jignition energy: 0.04 J
8.0 J1.0 J0.1 J0.05 J0.04 J
N2O = 100 - NH3 [kPa]
AICC calculations
Figure 16:
U.J. Pfahl, M.C. Ross, J.E. Shepherd, K.O. Pasamehmetoglu and C. Unal
5 Figures 40
9 11 13 15 17 19 21 23ammonia NH3 [kPa]
0
5
10
15
peak
pre
ssur
e [1
05 Pa
]
ignition energy: 8.0 Jignition energy: 1.0 Jignition energy: 0.15 Jignition energy: 0.1 Jignition energy: 0.05 Jignition energy: 0.04 J
8.0 J1.0 J
0.1 J
0.05 J
0.04 J
N2O = 46 - NH3 / 54 N2 [kPa]
AICC calculations
8.0 J 1.0 J
0.1 J
0.05 J0.15 J
Figure 17:
U.J. Pfahl, M.C. Ross, J.E. Shepherd, K.O. Pasamehmetoglu and C. Unal
5 Figures 41
Figure 18:
U.J. Pfahl, M.C. Ross, J.E. Shepherd, K.O. Pasamehmetoglu and C. Unal
5 Figures 42
11 13 15 17 19 21 23 25 27ammonia NH3 [%]
0
1
2
3
4
5
6
7
8
9
10
lam
inar
bur
ning
vel
ocity
[cm
/s] 0% N2O
4% N2O8% N2O
Ronney: NH3-air
Figure 19:
U.J. Pfahl, M.C. Ross, J.E. Shepherd, K.O. Pasamehmetoglu and C. Unal
5 Figures 43
6 8 10 12 14 16 18 20 22 24mixture A - G [kPa]
0
5
10
15
20
25
30
35
lam
inar
bur
ning
vel
ocity
[cm
/s]
mixture Amixture Bmixture Cmixture D
mixture Emixture Fmixture G
Figure 20:
U.J. Pfahl, M.C. Ross, J.E. Shepherd, K.O. Pasamehmetoglu and C. Unal