Embed Size (px)
Citation preview
Flash Eurobarometer 361
CHEMICALS
REPORT
Fieldwork: October 2012
Publication: February 2013
This survey has been requested by the European Commission, Directorate-General Enterprise and
industry and co-ordinated by Directorate-General for Communication.
This document does not represent the point of view of the European Commission.
The interpretations and opinions contained in it are solely those of the authors.
Flash Eurobarometer 361 - TNS Political & Social

FLASH EUROBAROMETER XXX “Title”
1
Flash Eurobarometer 361
Chemicals
Conducted by TNS Political & Social at the request of
the European Commission, Directorate-General Enterprise and industry
Survey co-ordinated by the European Commission, Directorate-General for Communication
(DG COMM “Research and Speechwriting” Unit)

FLASH EUROBAROMETER 361 “Chemicals”
2
TABLE OF CONTENTS
INTRODUCTION ................................................................................................. 4
MAIN FINDINGS ................................................................................................ 8
I. AWARENESS OF CHEMICAL SUBSTANCES IN EVERYDAY ITEMS .................. 10
1.1 Views on the presence of chemical substances in the air and everyday products (Q1) .............................................................................................. 10
1.1.1 Presence of chemical substances in cleaning products ............................ 11
1.1.2 Presence of chemical substances in paint ..................................................... 12
1.1.3 Presence of chemical substances in cosmetics or beauty products .... 14
1.1.4 Presence of chemical substances in the air .................................................. 15
1.1.5 Presence of chemical substances in clothes and shoes ........................... 17
1.1.6 Presence of chemical substances in food and drinks ................................ 18
1.1.7 Presence of chemical substances in electronic appliances ..................... 20
1.1.8 Presence of chemical substances in children’s toys .................................. 22
1.1.9 Presence of chemical substances in furniture ............................................. 24
1.2 Types of products which people check the ingredients or composition of before purchasing (Q2) ................................................................................ 29
II. ATTITUDES TOWARDS CHEMICAL SUBSTANCES ......................................... 34
2.1 The possibility of completely eliminating chemical substances from daily life (Q6.1) .................................................................................................... 34
2.2 New chemical substances cAN help in reducing the use of natural resources (Q6.2) .......................................................................................... 37
2.3 New chemical substances can help in contributing to a better environment (Q6.3) .......................................................................................................... 40
2.4 New chemical substances are involved in Industrial innovations (Q6.4) . 43
2.5 Attitudes towards buying a newly launched product containing new chemical substances (Q3) ............................................................................ 46
FLASH EUROBAROMETER 361 “Chemicals”
3
III. CONSUMER VIEW ON THE SAFETY OF CHEMICAL SUBSTANCES IN THE EU ..... ................................................................................................................. 51
3.1 The safety of chemical substances on the EU market today compared to 10 years ago (Q5) ............................................................................................. 51
3.2 The safety of products that contain chemical substances imported from outside the EU compared to those manufactured in the EU (Q4) ................... 54
3.3 Proper testing of products containing new chemical s ubstances in the EU (Q6.5) .......................................................................................................... 59
IV. CONSUMER VIEW ON RESPONSIBLILITY FOR ENSURING THE SAFETY OF CHEMICAL SUBSTANCES IN THE EU ................................................................. 63
4.1 Consumer view on the governance of chemical safety in the EU (Q7) ..... 63
4.2 Consumer view on who should be responsible for ensuring the safety of chemical substances in the EU (Q8) .............................................................. 69
ANNEXES
Technical specifications Questionnaire Tables
FLASH EUROBAROMETER 361 “Chemicals”
4
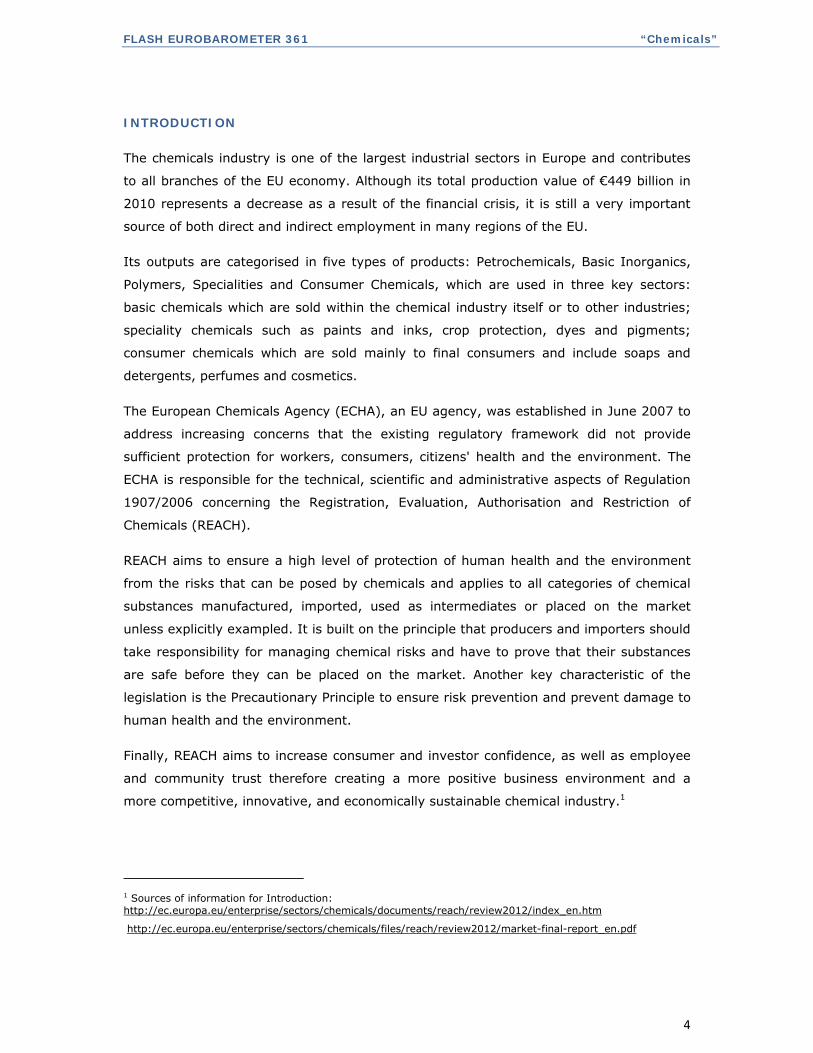
INTRODUCTION
The chemicals industry is one of the largest industrial sectors in Europe and contributes
to all branches of the EU economy. Although its total production value of €449 billion in
2010 represents a decrease as a result of the financial crisis, it is still a very important
source of both direct and indirect employment in many regions of the EU.
Its outputs are categorised in five types of products: Petrochemicals, Basic Inorganics,
Polymers, Specialities and Consumer Chemicals, which are used in three key sectors:
basic chemicals which are sold within the chemical industry itself or to other industries;
speciality chemicals such as paints and inks, crop protection, dyes and pigments;
consumer chemicals which are sold mainly to final consumers and include soaps and
detergents, perfumes and cosmetics.
The European Chemicals Agency (ECHA), an EU agency, was established in June 2007 to
address increasing concerns that the existing regulatory framework did not provide
sufficient protection for workers, consumers, citizens' health and the environment. The
ECHA is responsible for the technical, scientific and administrative aspects of Regulation
1907/2006 concerning the Registration, Evaluation, Authorisation and Restriction of
Chemicals (REACH).
REACH aims to ensure a high level of protection of human health and the environment
from the risks that can be posed by chemicals and applies to all categories of chemical
substances manufactured, imported, used as intermediates or placed on the market
unless explicitly exampled. It is built on the principle that producers and importers should
take responsibility for managing chemical risks and have to prove that their substances
are safe before they can be placed on the market. Another key characteristic of the
legislation is the Precautionary Principle to ensure risk prevention and prevent damage to
human health and the environment.
Finally, REACH aims to increase consumer and investor confidence, as well as employee
and community trust therefore creating a more positive business environment and a
more competitive, innovative, and economically sustainable chemical industry.1
1 Sources of information for Introduction: http://ec.europa.eu/enterprise/sectors/chemicals/documents/reach/review2012/index_en.htm
http://ec.europa.eu/enterprise/sectors/chemicals/files/reach/review2012/market-final-report_en.pdf
FLASH EUROBAROMETER 361 “Chemicals”
5
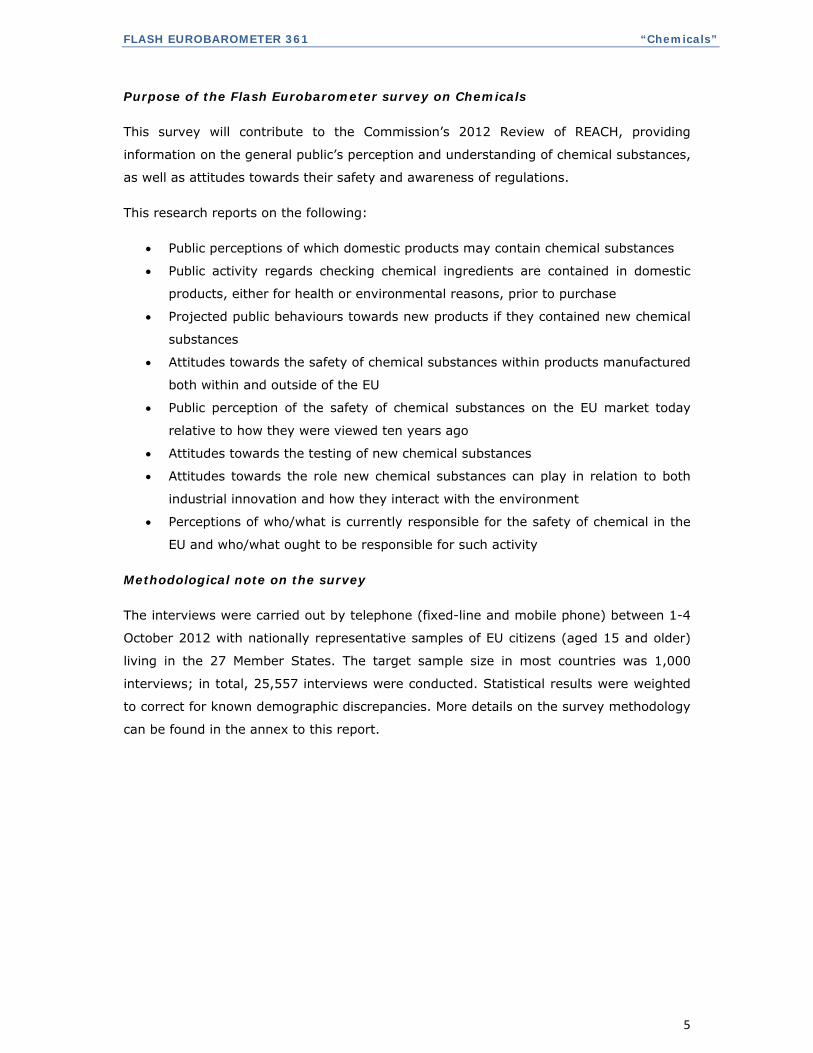
Purpose of the Flash Eurobarometer survey on Chemicals
This survey will contribute to the Commission’s 2012 Review of REACH, providing
information on the general public’s perception and understanding of chemical substances,
as well as attitudes towards their safety and awareness of regulations.
This research reports on the following:
Public perceptions of which domestic products may contain chemical substances
Public activity regards checking chemical ingredients are contained in domestic
products, either for health or environmental reasons, prior to purchase
Projected public behaviours towards new products if they contained new chemical
substances
Attitudes towards the safety of chemical substances within products manufactured
both within and outside of the EU
Public perception of the safety of chemical substances on the EU market today
relative to how they were viewed ten years ago
Attitudes towards the testing of new chemical substances
Attitudes towards the role new chemical substances can play in relation to both
industrial innovation and how they interact with the environment
Perceptions of who/what is currently responsible for the safety of chemical in the
EU and who/what ought to be responsible for such activity
Methodological note on the survey
The interviews were carried out by telephone (fixed-line and mobile phone) between 1-4
October 2012 with nationally representative samples of EU citizens (aged 15 and older)
living in the 27 Member States. The target sample size in most countries was 1,000
interviews; in total, 25,557 interviews were conducted. Statistical results were weighted
to correct for known demographic discrepancies. More details on the survey methodology
can be found in the annex to this report.
FLASH EUROBAROMETER 361 “Chemicals”
6
In this report, the countries are represented by their official abbreviations. The
abbreviations used in this report correspond to:
ABBREVIATIONS
EU27 European Union – 27 Member States
EU15 BE, IT, FR, DE, LU, NL, DK, UK, IE, PT, ES, EL, AT, SE, FI*
NMS12
BG, CZ, EE, CY, LT, LV, MT, HU, PL, RO, SL, SK**
BE Belgium BG Bulgaria CZ Czech Republic DK Denmark DE Germany EE Estonia EL Greece ES Spain FR France IE Ireland IT Italy CY Republic of Cyprus LT Lithuania LV Latvia LU Luxembourg HU Hungary MT Malta NL The Netherlands AT Austria PL Poland PT Portugal RO Romania SI Slovenia SK Slovakia FI Finland SE Sweden UK The United Kingdom
* EU15 refers to the 15 countries forming the European Union before the enlargements of 2004 and 2007:
Belgium, Denmark, Germany, Greece, Spain, France, Ireland, Italy, Luxembourg, The Netherlands, Austria,
Portugal, Finland, Sweden and the United Kingdom.
** The NMS12 are the 12 ‘new Member States’ which joined the European Union during the 2004 and 2007
enlargements. These are Bulgaria, the Czech Republic, Estonia, the Republic of Cyprus, Lithuania, Latvia,
Hungary, Malta, Poland, Romania, Slovenia and Slovakia.
FLASH EUROBAROMETER 361 “Chemicals”
7
**************
The Eurobarometer web site can be consulted at the following address: http://ec.europa.eu/public_opinion/index_en.htm
We would like to take the opportunity to thank all the respondents across the continent who gave their time to take part in this survey.
Without their active participation, this study would simply not have been possible.
FLASH EUROBAROMETER 361 “Chemicals”
8
MAIN FINDINGS
Awareness of chemical substances in everyday items
More than nine in ten respondents say that, in their opinion, cleaning products
and paint contain chemical substances (96% and 95% respectively) with three-
quarters or more saying that they definitely believe this (77% and 75%
respectively). Nine in ten also say that cosmetics or beauty products and the air
contain chemicals, with more than half (57% and 56% respectively) expressing
certainty on this issue. Slightly fewer think that chemicals are present in clothes
and shoes (85%), as well as in food and drinks (83%), while fewer than four in
five mention electronic appliances (79%), children’s toys (75%) and furniture
(74%).
Food is the product that respondents are most likely to check, with a large
majority (81%) saying that they look at the ingredients before buying. This is
followed by cosmetics/beauty products, toys and cleaning products which were all
mentioned by more than half of respondents (59%, 56% and 53% respectively).
Fewer say that they check paint, clothes, furniture and electronics (44%, 38%,
25% and 23% respectively).
Attitudes towards chemical substances
Seven in ten (69%) respondents say that it is not possible to completely eliminate
chemical substances from our daily life while 29% say that it is possible to do so.
Approximately three in five (58%) of respondents agree that new chemical
substances can help in reducing the use of natural resources, but a third (34%)
disagree with this statement.
Opinion was divided regarding how new chemical substances can help in
contributing to a better environment as although 43% of respondents agree that
new chemical substances can help in this way, 52% of respondents disagree that
they can help.
When asked to what extent respondents agree that new chemical substances are
involved in most industrial innovations, three quarters (75%) of Europeans agree
that they are involved.
FLASH EUROBAROMETER 361 “Chemicals”
9
Europeans would react to a newly launched product containing new chemical
substances in a range of ways: 10% would never buy it, 46% would wait until it
had been proven to be working and safe over a long period of time before they
would buy it, 30% say they would buy it only after searching and finding sufficient
information on its functionality and safety, 10% say they would buy it shortly
after release as long as they had heard nothing about possible adverse effects,
and 2% say they would buy such a product immediately.
Consumer view on the safety of chemical substances in the EU
Three in five (61%) of Europeans say that the chemical substances on the EU
market today are safer than they were 10 years ago. One in five (19%) say that
they are less safe and 15% say that there has been no change in the level of
safety over the last decade.
Half (49%) of Europeans think that EU manufactured products containing
chemical substances are safer compared to those imported from outside the EU
but a third (33%) say none of them are safe.
Two thirds (65%) of Europeans agree that in the EU, products containing new
chemical substances have been properly tested although three in ten (31%) of
Europeans disagree that this is the case.
Consumer view on the governance of chemical safety in the EU
Views are divided on who currently has responsibility for ensuring the safety of
chemical substances: 48% think that the authorities of the European Union hold
that power, 42% think it is currently carried out by the manufacturers themselves
and a third (35%) think it is carried out by the national authorities.
When asked to state who Europeans think should ensure the safety of chemical
substances on the EU market, aggregate results for the 27 Member States show
that three fifths (60%) think that the manufacturers themselves should have that
role. Slightly fewer (57%) say that it should be done by the authorities of the
European Union whilst around a half (49%) say that the national authorities
should ensure the safety of chemical substances in the EU.
FLASH EUROBAROMETER 361 “Chemicals”
10
I. AWARENESS OF CHEMICAL SUBSTANCES IN EVERYDAY ITEMS
In order to assess to what extent people think that everyday items contain chemicals,
the survey started by asking respondents whether or not they think that chemical
substances can be found in a range of products from food and drink, clothes and shoes,
electronic appliances and children’s toys to cosmetics and beauty products, cleaning
products, paint and furniture. Respondents were also asked about their views on whether
or not chemical substances can be found in the air. This was followed up by a question
aimed at establishing how proactive people are in terms of checking the ingredients or
composition of items before purchasing them, for example, for health reasons or to
protect the environment.
1.1 VIEWS ON THE PRESENCE OF CHEMICAL SUBSTANCES IN THE AIR AND
EVERYDAY PRODUCTS (Q1)
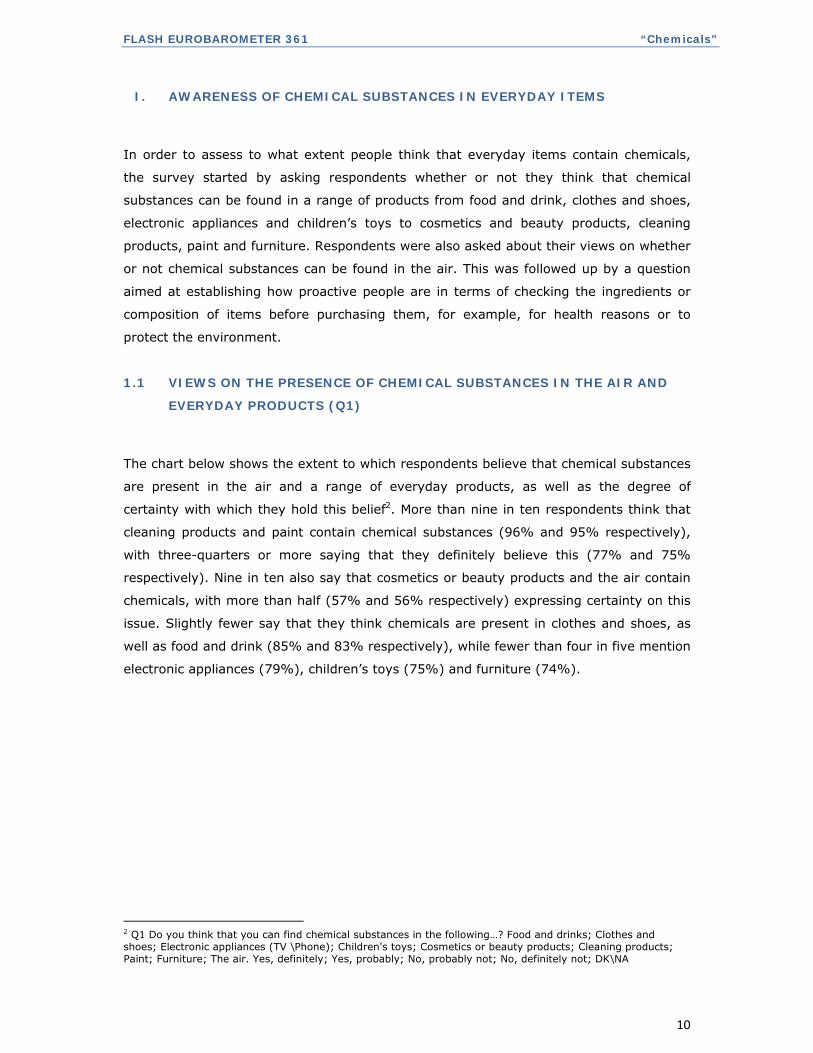
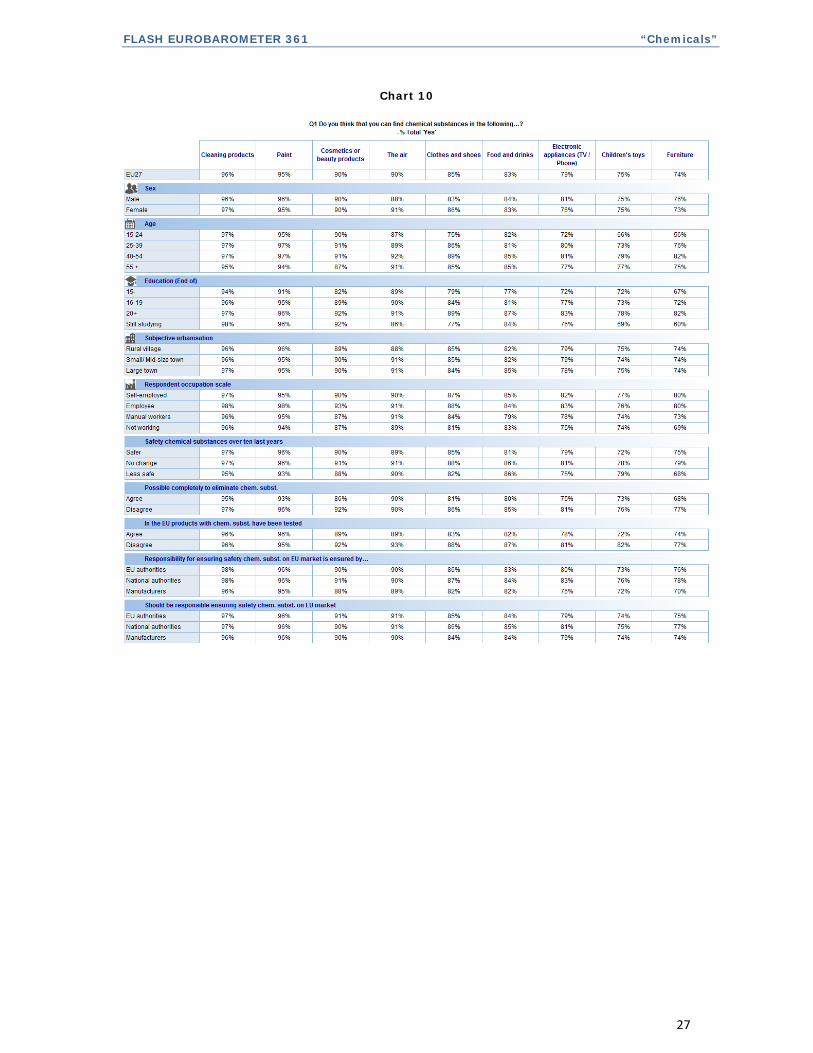
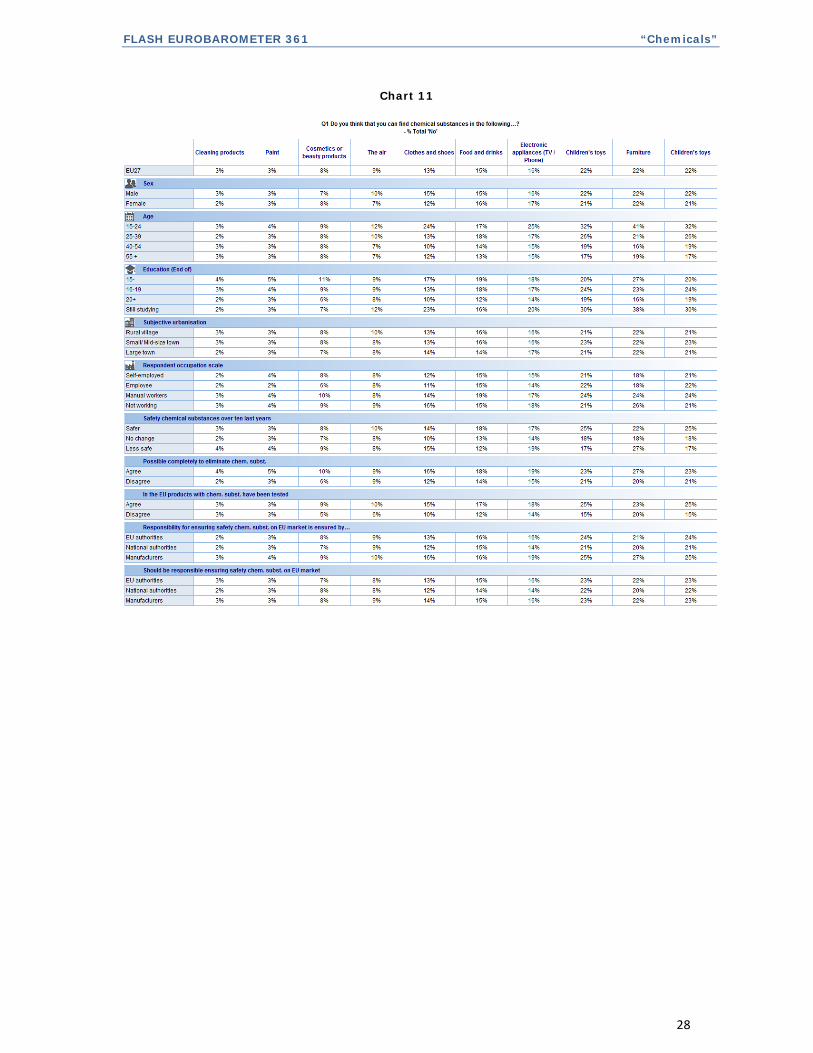
The chart below shows the extent to which respondents believe that chemical substances
are present in the air and a range of everyday products, as well as the degree of
certainty with which they hold this belief2. More than nine in ten respondents think that
cleaning products and paint contain chemical substances (96% and 95% respectively),
with three-quarters or more saying that they definitely believe this (77% and 75%
respectively). Nine in ten also say that cosmetics or beauty products and the air contain
chemicals, with more than half (57% and 56% respectively) expressing certainty on this
issue. Slightly fewer say that they think chemicals are present in clothes and shoes, as
well as food and drink (85% and 83% respectively), while fewer than four in five mention
electronic appliances (79%), children’s toys (75%) and furniture (74%).
2 Q1 Do you think that you can find chemical substances in the following…? Food and drinks; Clothes and shoes; Electronic appliances (TV \Phone); Children's toys; Cosmetics or beauty products; Cleaning products; Paint; Furniture; The air. Yes, definitely; Yes, probably; No, probably not; No, definitely not; DK\NA
FLASH EUROBAROMETER 361 “Chemicals”
11
Chart 1
1.1.1 Presence of chemical substances in cleaning products
--Almost all Europeans believe that cleaning products contain chemical
substances--
Among all of the everyday products that respondents were asked about, cleaning
products was regarded by the highest proportion as containing chemical substances
(96%). There is also a high degree of certainty among respondents with 77% saying that
they definitely contain chemicals and just 19% saying ‘probably’. Just 3% of respondents
believe that chemical substances are not found in cleaning products.
For this question there are no major noticeable differences between the findings for
different categories of respondents or Member States.
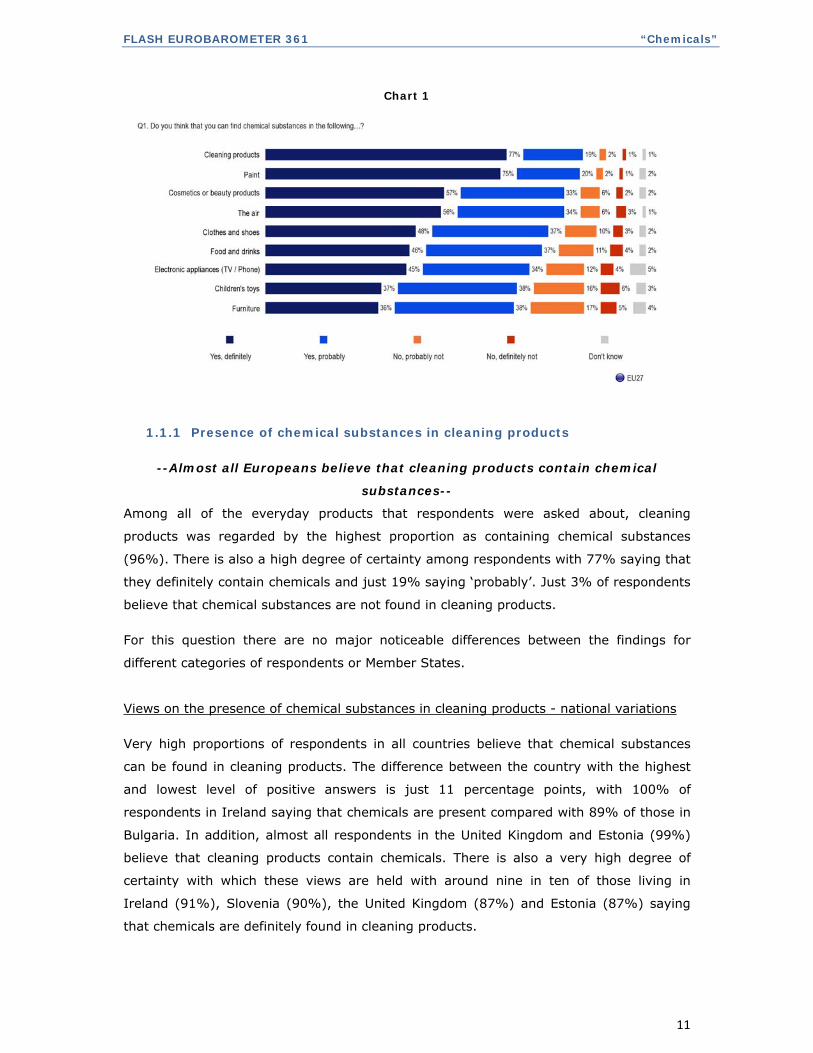
Views on the presence of chemical substances in cleaning products - national variations
Very high proportions of respondents in all countries believe that chemical substances
can be found in cleaning products. The difference between the country with the highest
and lowest level of positive answers is just 11 percentage points, with 100% of
respondents in Ireland saying that chemicals are present compared with 89% of those in
Bulgaria. In addition, almost all respondents in the United Kingdom and Estonia (99%)
believe that cleaning products contain chemicals. There is also a very high degree of
certainty with which these views are held with around nine in ten of those living in
Ireland (91%), Slovenia (90%), the United Kingdom (87%) and Estonia (87%) saying
that chemicals are definitely found in cleaning products.
FLASH EUROBAROMETER 361 “Chemicals”
12
At the other end of the scale, other than Bulgaria, mentioned above, the countries where
respondents are least likely to believe that cleaning products contain chemicals are
Belgium (92%), Portugal (94%) and Romania (94%).
Chart 2
Views on the presence of chemical substances in cleaning products – attitudinal
variations
Respondents who say that they think responsibility for the safety of chemical substances
is ensured by National Authorities are more likely to say chemical substances are
definitely present in cleaning products than those who think manufacturers are
responsible for ensuring safety (81% compared to 76%).
1.1.2 Presence of chemical substances in paint
--Almost all Europeans believe that paint contains chemical substances--
Along with cleaning products, paint is the everyday item most likely to be regarded as
containing chemical substances (95%). Once again, respondents appear to be quite sure
that their opinion is correct, with three quarters (75%) saying that it is definitely the
case and one in five (20%) saying ‘probably’. Just 3% of respondents believe that
chemical substances are not found in paint.
There are no major differences for this finding between different Member States,
however there are some differences by the age at which respondents left education.
FLASH EUROBAROMETER 361 “Chemicals”
13
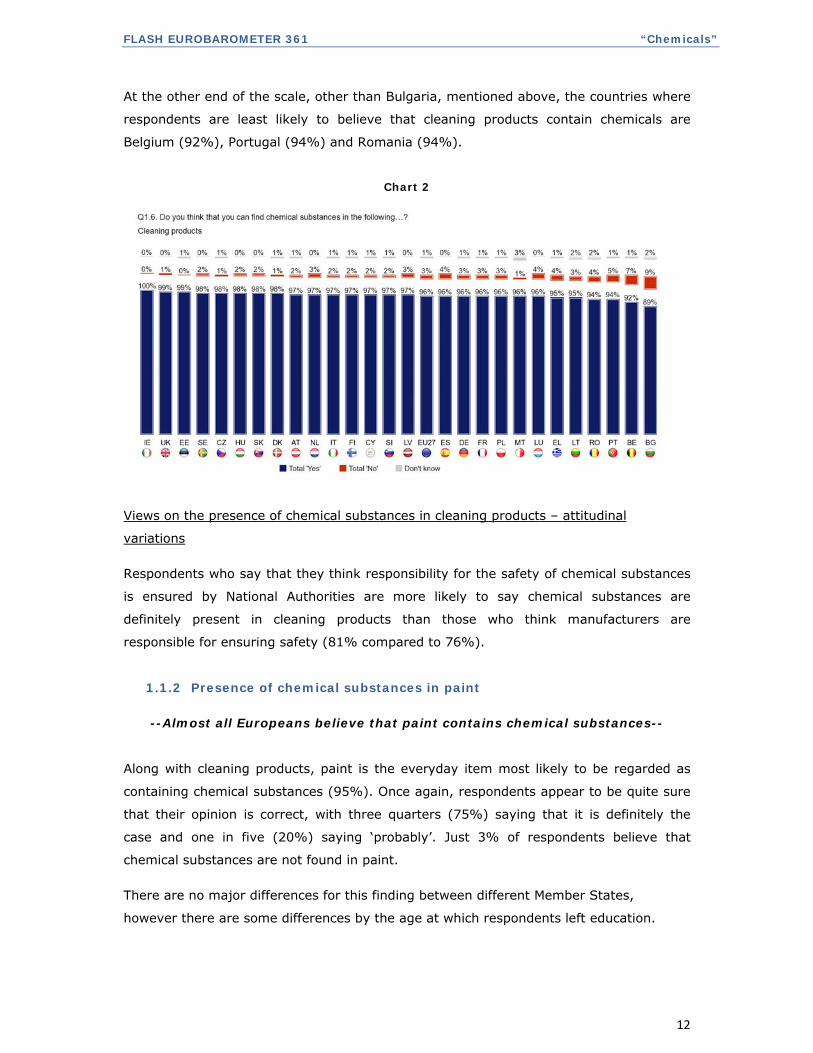
Views on the presence of chemical substances in paint - national variations
Very large majorities of respondents across all countries believe that paint contains
chemical substances. There is a difference of just twelve percentage points between
Estonia (98%), the country with the highest proportion of respondents with this belief,
and Bulgaria (86%), the country with the lowest. However it is important to point out
that Bulgaria comparatively is the only country with such a low proportion of respondents
who believe paint contains chemicals. Every other country has 92% or more respondents
with this view.
Chart 3
Views on the presence of chemical substances in paint - socio-demographic and
attitudinal variations
Those who left education at 15 or under (91%) are also least likely to believe that paint
contains chemicals. This is compared with 95% of those who left at 16-19 and 96% of
those who left at 20 or over or are still studying.
Employees are slightly more likely than the self-employed, manual workers and those
who are not working to believe that chemicals are present in paint (98%, 95%, 95% and
94% respectively).
Respondents who say that they think responsibility for the safety of chemical substances
is ensured by National Authorities are more likely to say that chemical substances are
definitely present in paint than are those who think manufacturers are responsible for
ensuring safety (78% compared to 73%).
FLASH EUROBAROMETER 361 “Chemicals”
14
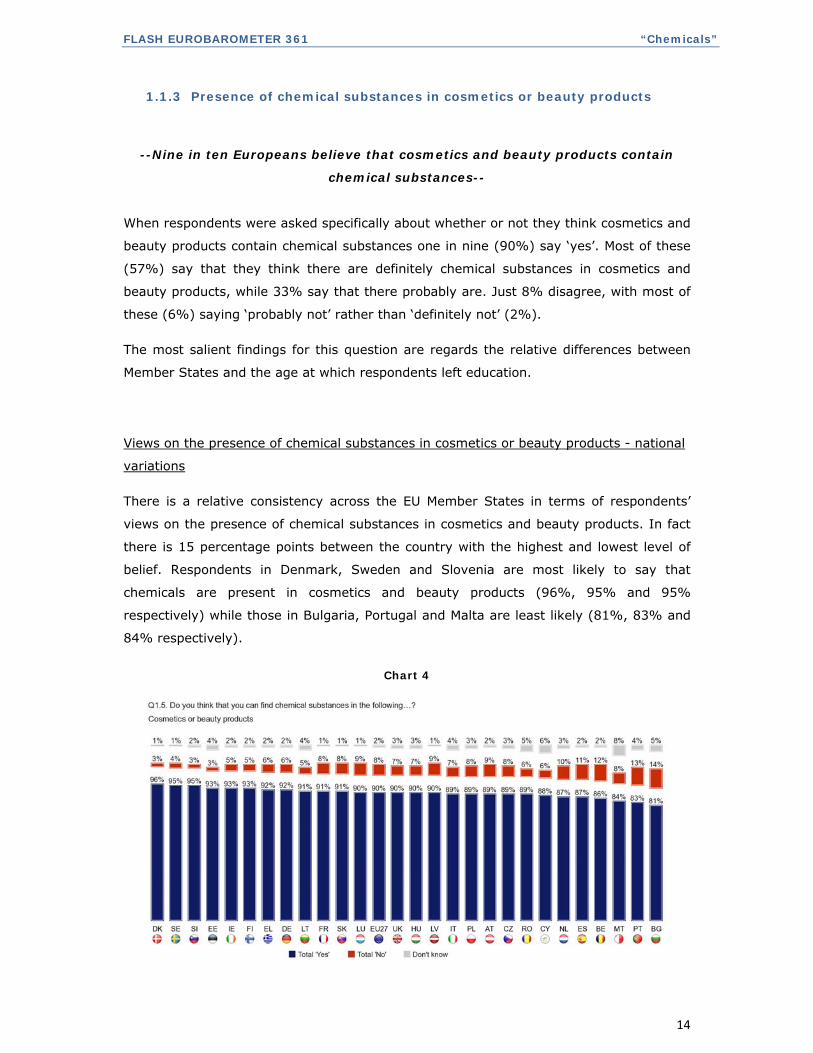
1.1.3 Presence of chemical substances in cosmetics or beauty products
--Nine in ten Europeans believe that cosmetics and beauty products contain
chemical substances--
When respondents were asked specifically about whether or not they think cosmetics and
beauty products contain chemical substances one in nine (90%) say ‘yes’. Most of these
(57%) say that they think there are definitely chemical substances in cosmetics and
beauty products, while 33% say that there probably are. Just 8% disagree, with most of
these (6%) saying ‘probably not’ rather than ‘definitely not’ (2%).
The most salient findings for this question are regards the relative differences between
Member States and the age at which respondents left education.
Views on the presence of chemical substances in cosmetics or beauty products - national
variations
There is a relative consistency across the EU Member States in terms of respondents’
views on the presence of chemical substances in cosmetics and beauty products. In fact
there is 15 percentage points between the country with the highest and lowest level of
belief. Respondents in Denmark, Sweden and Slovenia are most likely to say that
chemicals are present in cosmetics and beauty products (96%, 95% and 95%
respectively) while those in Bulgaria, Portugal and Malta are least likely (81%, 83% and
84% respectively).
Chart 4
FLASH EUROBAROMETER 361 “Chemicals”
15
Views on the presence of chemical substances in cosmetics or beauty products - socio-
demographic and attitudinal variations
Older respondents aged 55 and over are the least likely to say that they think cosmetics
or beauty products contain chemicals (87% compared with 90% of 15-24 year olds and
91% of 25-54 year olds).
There are variations in the findings by the age respondents left education. Those who left
education at 15 or under are the least likely to hold the view that cosmetics or beauty
products contain chemicals (82%) and concern on this issue increases among those who
left education at 16-19 (89%), 20 or over (92%) or are still studying (92%).
The employees and the self-employed are most likely to believe that cosmetics or beauty
products contain chemicals (93% and 90% respectively) compared with 87% of manual
workers and those who are not in work.
In addition, respondents who disagree that it is possible to completely eliminate chemical
substances from our daily lives are also most likely to believe that there are chemicals in
cosmetics or beauty products (92% compared with 86% of those who agree). Similarly,
those who disagree that any products in the EU containing new chemical substances
have been properly tested are more likely than those who agree with this statement to
believe that there are chemicals in cosmetics or beauty products (92% versus 89%).
Respondents who say that they think responsibility for the safety of chemical substances
is ensured by National Authorities are more likely to say chemical substances are
definitely present in cosmetics or beauty products than are those who think
manufacturers are responsible for ensuring safety (61% and 55% respectively).
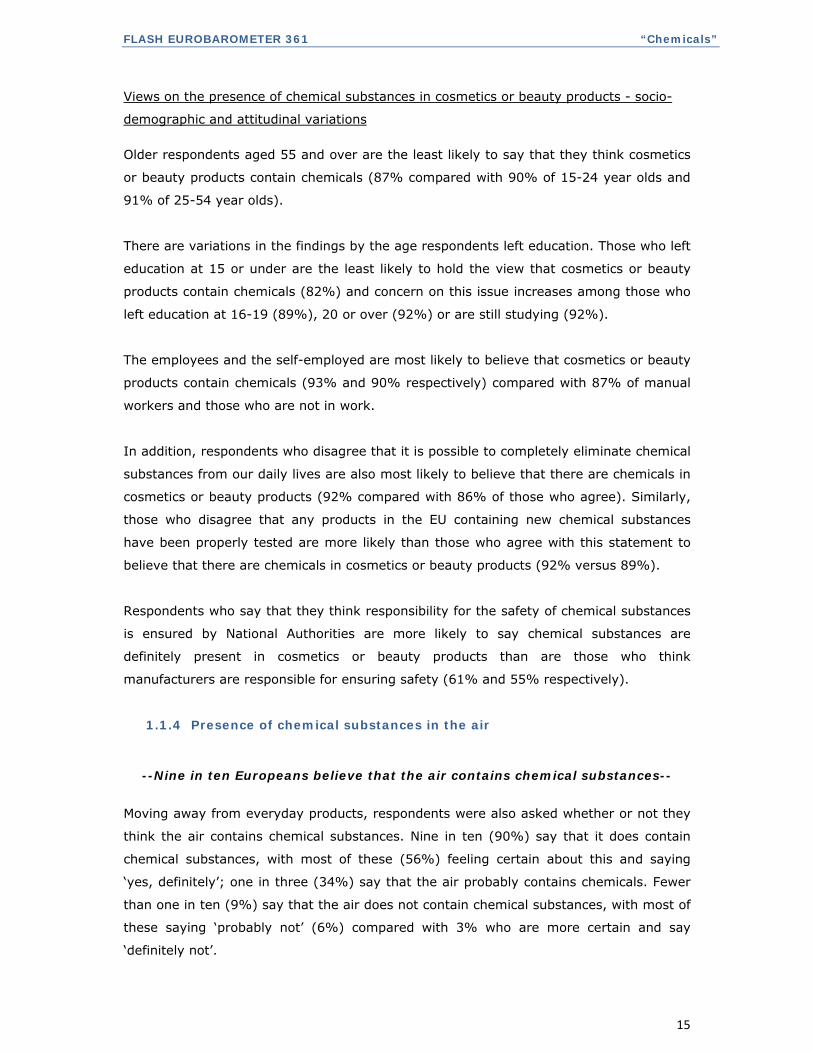
1.1.4 Presence of chemical substances in the air
--Nine in ten Europeans believe that the air contains chemical substances--
Moving away from everyday products, respondents were also asked whether or not they
think the air contains chemical substances. Nine in ten (90%) say that it does contain
chemical substances, with most of these (56%) feeling certain about this and saying
‘yes, definitely’; one in three (34%) say that the air probably contains chemicals. Fewer
than one in ten (9%) say that the air does not contain chemical substances, with most of
these saying ‘probably not’ (6%) compared with 3% who are more certain and say
‘definitely not’.
FLASH EUROBAROMETER 361 “Chemicals”
16
For this finding the most pronounced differences in response relate to differences
between Member States.
Views on the presence of chemical substances in the air - national variations
Opinion on the presence of chemicals in the air is consistently high across all countries
although there is a difference of 14 percentage points between the country with the
highest proportion of respondents holding this view (Slovakia 96%) and the lowest (the
Netherlands 82%). Other countries with a particularly high proportion of respondents
having the view that there are chemicals in the air are Italy (94%) and France (94%).
Chart 5
Views on the presence of chemical substances in the air - socio-demographic and
attitudinal variations
Women are more likely than men to say that chemicals can be found in the air (91% and
88% respectively), while older respondents aged 40 or over are particularly likely to hold
this view (92% of 40-54 year olds and 91% of those aged 55 and over compared with
87% of 15-24 year olds and 89% of 25-39 year olds).
There are also differences based on the age the respondent left education. Those who
are still studying are the least likely to have the view that there are chemicals in the air
(86%) while those who left education at 20 or over are the most likely (91%).
FLASH EUROBAROMETER 361 “Chemicals”
17
People living in rural villages are less likely than those living in small/mid size and large
towns to believe that air contain chemicals (88%, 91% and 91% respectively).
The most significant attitudinal variation in the findings on the question of chemicals in
the air is in terms of respondents’ views on the testing of new chemical substances and
new chemicals. Those who disagree that products in the EU containing new chemical
substances have been properly tested are more likely than those who agree with the
statement to believe that there are chemicals in the air (93% versus 89%).
1.1.5 Presence of chemical substances in clothes and shoes
--85% of Europeans believe that clothes and shoes contain chemical
substances--
Looking now at people’s views on whether or not clothes and shoes contain chemical
substances, once again a very large majority of respondents (85%) say that they believe
they do. Almost half of respondents (48%) hold the opinion that clothes and shoes
definitely contain chemical substances, while 37% are less certain and say ‘probably’. A
small minority of respondents (13%) say that clothes and shoes do not contain chemicals
but most of these say ‘probably not’ (10%) rather than ‘definitely not’ (3%).
The most significant differences in the finding relate to the age of the respondent and, in
addition, there are key differences between Member States.
Views on the presence of chemical substances in clothes and shoes - national variations
There are some national differences in the findings which are worth noting. In particular
there is a difference of 32 percentage points between the country most and least likely to
believe that chemicals can be found in clothes and shoes. There are seven countries
where nine in ten or more respondents say that clothes and shoes contain chemicals:
Germany (95%), Denmark, Austria, Slovenia, Sweden (all 93%), Slovakia and Finland
(both 90%). At the other end of the scale, there are four countries where just three in
four or fewer think that chemicals are present in clothes and shoes: Malta (63%), the
Republic of Cyprus (71%), Ireland (73%) and Bulgaria (75%).
FLASH EUROBAROMETER 361 “Chemicals”
18
Views on the presence of chemical substances in clothes and shoes - socio-demographic
and attitudinal variations
Women are more likely than men to believe that there are chemicals in clothes and shoes
(86% compared with 83%) while respondents aged 15-24 are least likely to agree with
this claim (75% compared with 86% of 25-39, 89% of 40-54 and 85% of those aged 55
and over).
Findings also vary by level of education, with respondents who left education at 15 or
under or who are still studying less likely to have the view that there are chemicals in
clothes and shoes (79% and 77% respectively) than those who left at an older age (left
at 16-19 84%, 20 or over 89%). Opinion also differs by occupation, with manual workers
and those who are not working least likely to believe that clothes and shoes contain
chemicals (84% and 81% respectively) compared with the self-employed and employees
(87% and 88% respectively).
Respondents who disagree with the assertion that it is possible to completely eliminate
chemical substances from our daily lives are also more likely to believe that there are
chemicals in clothes and shoes (86% compared with 81% of those who agree). Similarly,
those who disagree that ‘in the EU, any products containing new chemical substances
have been properly tested’ are more likely than those agreeing with the statement to
believe that there are chemicals in clothes and shoes (88% versus 83%).
Respondents who say that they think responsibility for the safety of chemical substances
is ensured by National Authorities are more likely to say chemical substances are
definitely present in clothes and shoes than are those who think manufacturers are
responsible (50% and 43% respectively).
1.1.6 Presence of chemical substances in food and drinks
--83% of Europeans believe that food and drinks contain chemical substances--
When respondents were asked specifically about whether or not they think food and
drinks contain chemical substances more than four in five (83%) say ‘yes’ . However, it
is interesting to break this down further and see that not everyone is certain that their
view is correct: 46% say that they think there are definitely chemical substances in food
and drinks, while 37% say that there probably are. On the other hand, 15% of
respondents disagree that there are chemical substances in food and drinks, although
only 4% say ‘definitely not’ (11% say ‘probably not’).
FLASH EUROBAROMETER 361 “Chemicals”
19
There are key differences on this issue between the findings for Member States and by
the age at which respondents left education.
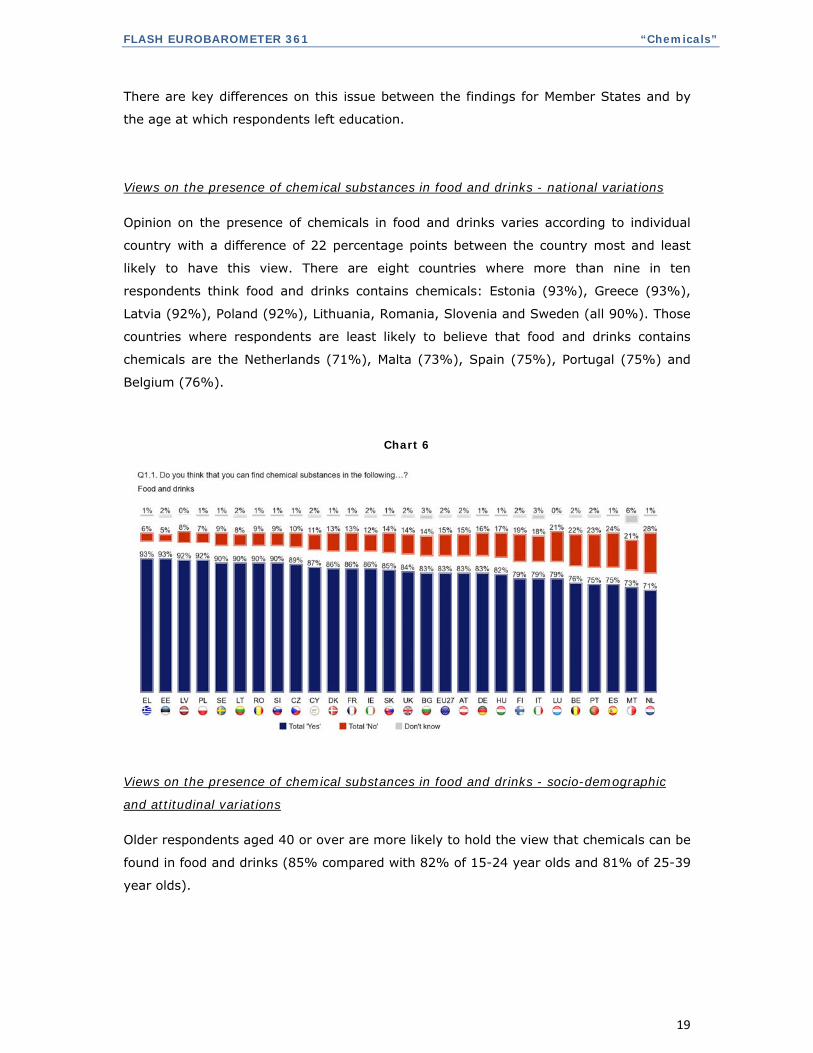
Views on the presence of chemical substances in food and drinks - national variations
Opinion on the presence of chemicals in food and drinks varies according to individual
country with a difference of 22 percentage points between the country most and least
likely to have this view. There are eight countries where more than nine in ten
respondents think food and drinks contains chemicals: Estonia (93%), Greece (93%),
Latvia (92%), Poland (92%), Lithuania, Romania, Slovenia and Sweden (all 90%). Those
countries where respondents are least likely to believe that food and drinks contains
chemicals are the Netherlands (71%), Malta (73%), Spain (75%), Portugal (75%) and
Belgium (76%).
Chart 6
Views on the presence of chemical substances in food and drinks - socio-demographic
and attitudinal variations
Older respondents aged 40 or over are more likely to hold the view that chemicals can be
found in food and drinks (85% compared with 82% of 15-24 year olds and 81% of 25-39
year olds).
FLASH EUROBAROMETER 361 “Chemicals”
20
There are also differences based on the age the respondent left education. Those who
left education at 15 or under are the least likely to say that there are chemicals in food
and drinks (77%) while those who left at an older age or are still studying are more likely
to hold this view (left at 20 or over 87%, still studying 84% and left at 16-19 81%).
There is also some variation in the findings for this question by occupation, with manual
workers least likely to think that chemicals are present in food and drinks (79%)
compared with 85% of the self-employed, 84% of employees and 83% of respondents
who are not working.
Finally, views on the question of chemicals in food and drinks differ according to the type
of location where respondents live. Those living in large towns are the most likely to
believe that chemicals can be found in food (85%) compared with those who live in rural
villages or small/mid-size towns (82%).
There are also differences on the issue of whether or not there are chemicals in food and
drinks when the findings are analysed by respondents’ views on how the safety of
chemical substances has improved over the last ten years. Those who believe that
chemical substances are less safe or that there has been no change are most likely to
say that there are chemicals in food and drinks (both 86%) compared with those who
say they are safer (81%).
In addition, respondents who disagree that it is possible to completely eliminate chemical
substances from our daily lives are most likely to believe that there are chemicals in food
and drinks (85% compared with 80% of those who agree). Similarly, respondents who
disagree that ‘in the EU, any products containing new chemical substances have been
properly tested’ are more likely than those who agree with the statement to believe that
there are chemicals in food and drinks (87% versus 82%).
1.1.7 Presence of chemical substances in electronic appliances
--Four in five Europeans believe that electronic appliances contain chemical
substances--
Respondents were also asked whether or not they think chemical substances can be
found in electronic appliances. Slightly fewer than for the other everyday items discussed
above, but still 79%, say that in their opinion electronic appliances contain chemical
substances.

FLASH EUROBAROMETER 361 “Chemicals”
21
45% say that chemical substances can definitely be found in electronic appliances and
34% say ’probably’. One in six respondents say they do not think that electronic
appliances contain chemicals, although most of these say ‘probably not’ (12%) rather
than ‘definitely not’ (4%).
The key differences in the findings for this issue are by Member State.
Views on the presence of chemical substances in electronic appliances - national
variations
There is a particularly high difference of 35 percentage points between the country most
and least likely to believe that chemicals can be found in electronic appliances.
Respondents living in Sweden (90%), Denmark (88%) and the Netherlands (88%) are
most likely to say that electronic appliances contain chemical substances, while those in
Bulgaria (55%), the Republic of Cyprus (60%), Malta (61%) and Romania (64%) are
least likely.
Citizens of EU15 countries are more likely than those living in NMS12 countries to say
that electronic appliances contain chemical substances (80% and 71% respectively).
Chart 7
FLASH EUROBAROMETER 361 “Chemicals”
22
Views on the presence of chemical substances in electronic appliances - socio-
demographic and attitudinal variations
Men are most likely to have the view that electronic appliances contain chemicals (81%
compared with 76% of women). Looking at the findings by age however shows that the
youngest and oldest age groups (15-24 and 55 and over) are least likely to agree with
this statement (72% and 77% respectively) compared with the middle age groups (25-
39 80% and 40-54 81%).
In addition, respondents who disagree that it is possible to completely eliminate chemical
substances from our daily lives are also most likely to believe that there are chemicals in
electronic appliances (81% compared with 75% of those who agree).
Respondents who say that responsibility for the safety of chemical substances is ensured
by National Authorities are more likely to say chemical substances are present (combined
definitely and probably) in electronic appliances than are those who think manufacturers
are responsible for ensuring safety (83% compared to 76%).
1.1.8 Presence of chemical substances in children’s toys
--Three-quarters of Europeans believe that children’s toys contain chemical
substances--
Children’s toys are one of the everyday products least likely to be regarded as containing
chemical substances, although still three in four respondents (75%) say that in their
opinion they do. However, the level of certainty is split between 37% saying ‘definitely’
and 38% saying ‘probably’. On the other hand, more than one in five respondents (22%)
believe that chemical substances are not found in children’s toys, although most of these
say ‘probably not’ (16%) rather than ‘definitely not’ (6%).
On the issue of chemicals in children’s toys, the most pronounced differences in the
findings are between Member States, by the age of respondent and the age at which
they left education.
Views on the presence of chemical substances in children’s toys - national variations
Opinion on the presence of chemicals in children’s toys varies according to individual
country with a difference of 30 percentage points between the country most and least
likely to believe that chemicals can be found.
FLASH EUROBAROMETER 361 “Chemicals”
23
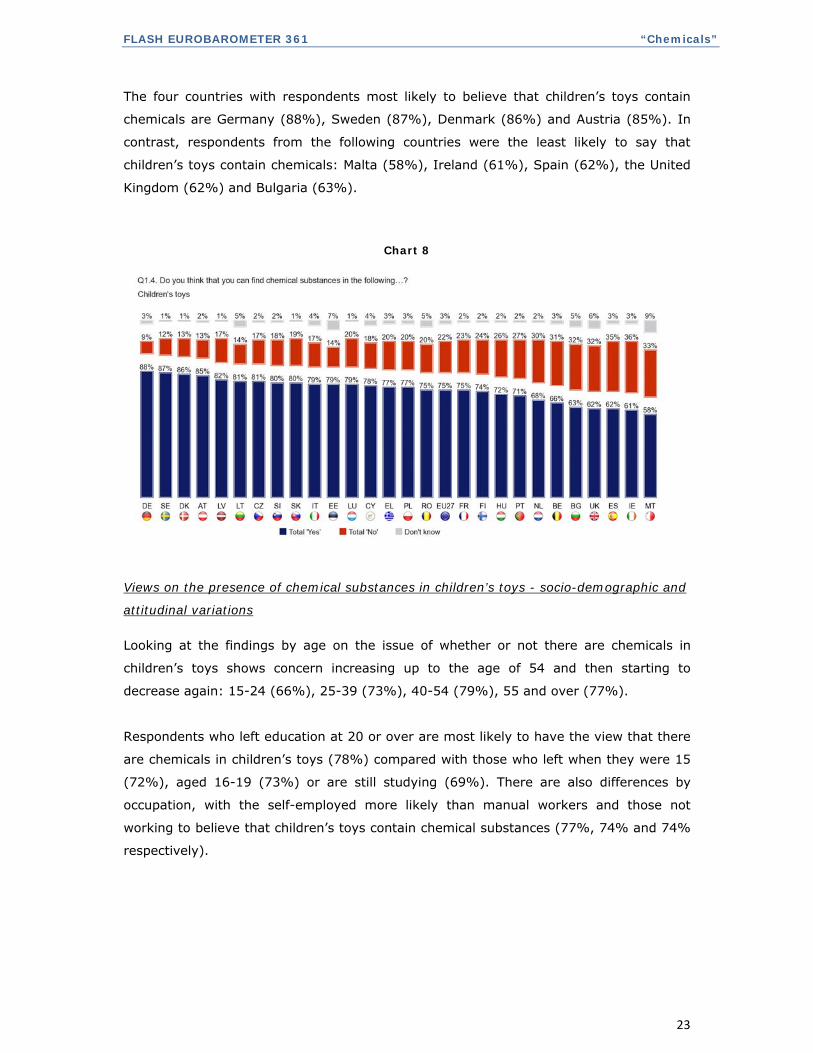
The four countries with respondents most likely to believe that children’s toys contain
chemicals are Germany (88%), Sweden (87%), Denmark (86%) and Austria (85%). In
contrast, respondents from the following countries were the least likely to say that
children’s toys contain chemicals: Malta (58%), Ireland (61%), Spain (62%), the United
Kingdom (62%) and Bulgaria (63%).
Chart 8
Views on the presence of chemical substances in children’s toys - socio-demographic and
attitudinal variations
Looking at the findings by age on the issue of whether or not there are chemicals in
children’s toys shows concern increasing up to the age of 54 and then starting to
decrease again: 15-24 (66%), 25-39 (73%), 40-54 (79%), 55 and over (77%).
Respondents who left education at 20 or over are most likely to have the view that there
are chemicals in children’s toys (78%) compared with those who left when they were 15
(72%), aged 16-19 (73%) or are still studying (69%). There are also differences by
occupation, with the self-employed more likely than manual workers and those not
working to believe that children’s toys contain chemical substances (77%, 74% and 74%
respectively).
FLASH EUROBAROMETER 361 “Chemicals”
24
Respondents who believe that chemical substances on the EU market are less safe than
they were ten years ago and those who think there has been no change are most likely
to say that there are chemicals in children’s toys (79% and 78% respectively) compared
with those who say it is safer (72%). In addition, respondents who disagree that it is
possible to completely eliminate chemical substances from our daily lives are also more
likely to believe that there are chemicals in children’s toys (76% compared with 73% of
those who agree).
Respondents who disagree with the statement that any products in the EU containing
new chemical substances have been properly tested are more likely than those who
agree to say that children’s toys contain chemicals (82% versus 72%, representing a
difference of ten percentage points).
Respondents who say that they think responsibility for the safety of chemical substances
is ensured by National Authorities are more likely to say chemical substances are
definitely present in children’s toys than are those who think manufacturers are
responsible for ensuring safety (39% and 33% respectively).
1.1.9 Presence of chemical substances in furniture
--Three-quarters of Europeans believe that furniture contains chemical
substances--
Furniture, along with children’s toys, is one of the everyday products least likely to be
regarded as containing chemical substances, although still three in four respondents
(74%) say that in their opinion they do. However, the level of certainty is split between
36% saying ‘definitely’ and 38% saying ‘probably’. More than one in five respondents
(22%) believe that chemical substances are not found in furniture, although most of
these say ‘probably not’ (17%) rather than ‘definitely not’ (5%).
On the question of chemicals being present in furniture, the most distinct differences in
response are by Member State, respondent age and the age at which they left education.
Views on the presence of chemical substances in furniture - national variations
Opinion on the presence of chemicals in furniture varies according to individual country
with a difference of 32 percentage points between the country where respondents are
most and least likely to hold this view.
FLASH EUROBAROMETER 361 “Chemicals”
25
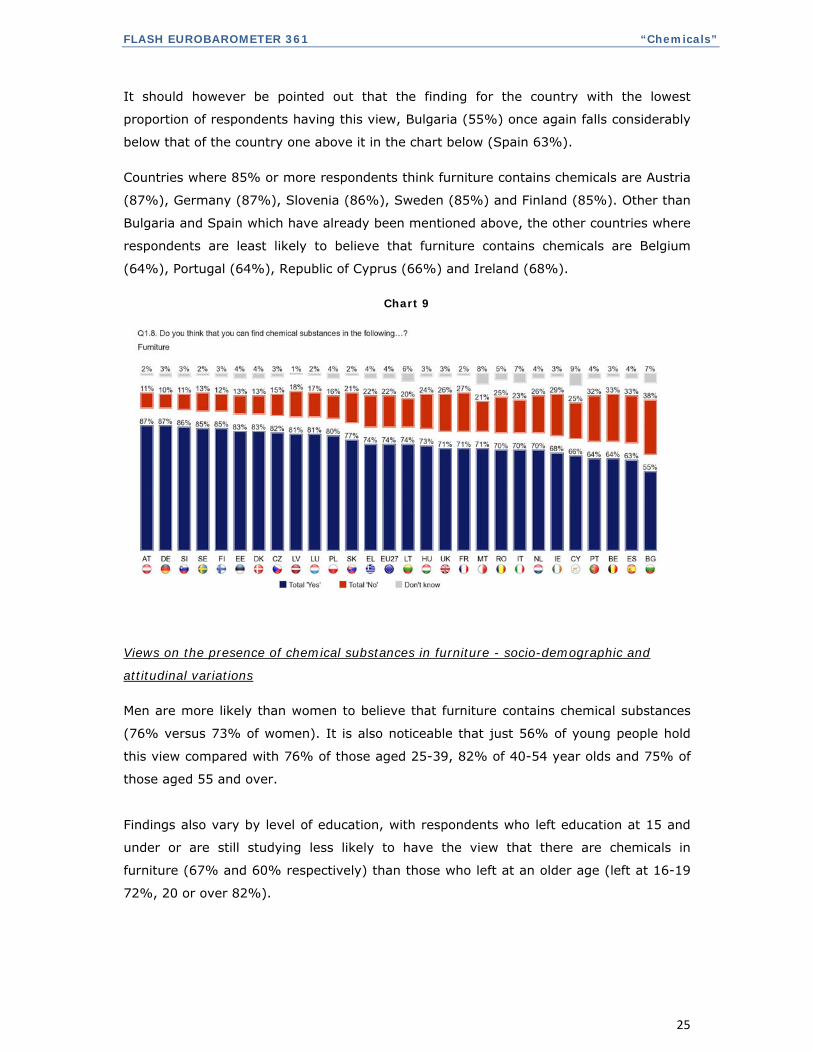
It should however be pointed out that the finding for the country with the lowest
proportion of respondents having this view, Bulgaria (55%) once again falls considerably
below that of the country one above it in the chart below (Spain 63%).
Countries where 85% or more respondents think furniture contains chemicals are Austria
(87%), Germany (87%), Slovenia (86%), Sweden (85%) and Finland (85%). Other than
Bulgaria and Spain which have already been mentioned above, the other countries where
respondents are least likely to believe that furniture contains chemicals are Belgium
(64%), Portugal (64%), Republic of Cyprus (66%) and Ireland (68%).
Chart 9
Views on the presence of chemical substances in furniture - socio-demographic and
attitudinal variations
Men are more likely than women to believe that furniture contains chemical substances
(76% versus 73% of women). It is also noticeable that just 56% of young people hold
this view compared with 76% of those aged 25-39, 82% of 40-54 year olds and 75% of
those aged 55 and over.
Findings also vary by level of education, with respondents who left education at 15 and
under or are still studying less likely to have the view that there are chemicals in
furniture (67% and 60% respectively) than those who left at an older age (left at 16-19
72%, 20 or over 82%).
FLASH EUROBAROMETER 361 “Chemicals”
26
Opinion also differs by occupation, with manual workers and those who are not working
least likely to believe that furniture contains chemicals (73% and 69% respectively)
compared with 80% of the self-employed and employees.
There are some significant differences on the question of chemicals in furniture
depending on respondents’ general views of safety in the chemical industry. It is those
who believe that the safety of chemical substances has not changed over the last ten
years who are most likely to say that there are chemicals in furniture (79%) compared
with those who say it is safer (75%). Those who believe that chemical substances on the
EU market are less safe than ten years ago are least likely to say there are chemicals in
furniture (68%).
In addition, respondents who disagree that it is possible to completely eliminate chemical
substances from our daily lives are also most likely to believe that there are chemicals in
furniture (77% compared with 68% of those who agree).
Respondents who think that responsibility for the safety of chemical substances is
ensured by National Authorities are more likely to say chemical substances are present
(combined definitely and probably) in furniture than are those who think manufacturers
are responsible for ensuring safety (78% compared to 70%).
FLASH EUROBAROMETER 361 “Chemicals”
27
Chart 10
FLASH EUROBAROMETER 361 “Chemicals”
28
Chart 11
FLASH EUROBAROMETER 361 “Chemicals”
29
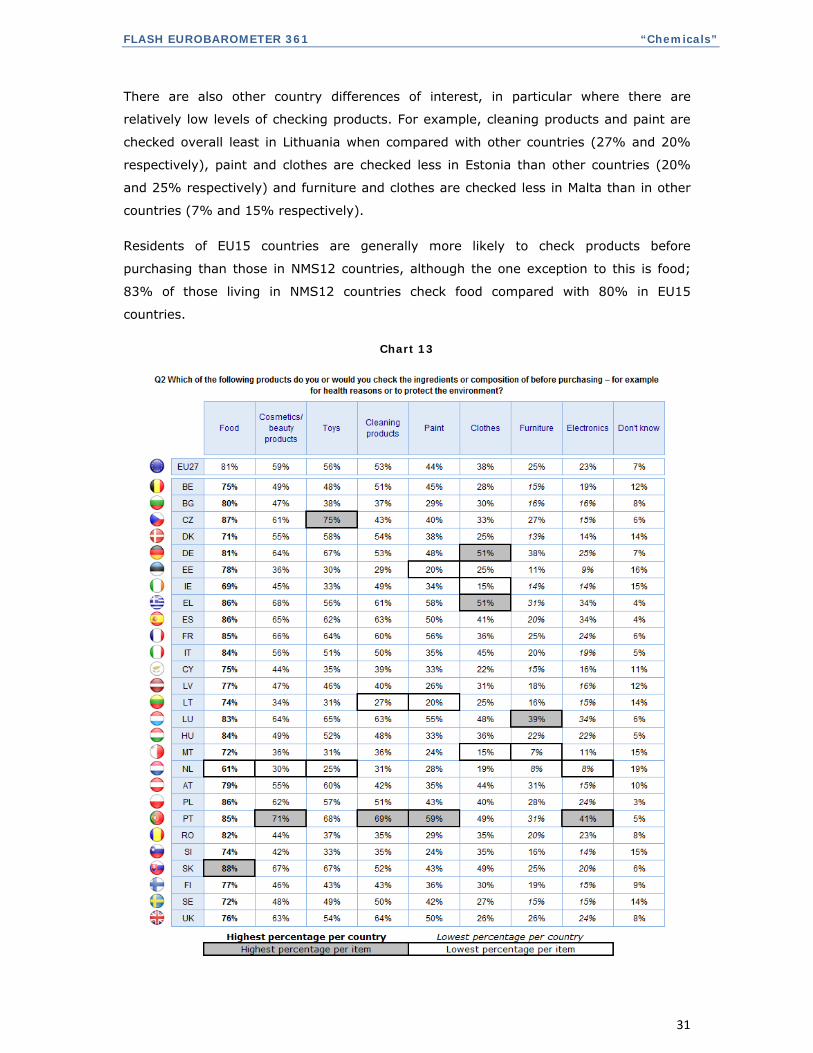
1.2 TYPES OF PRODUCTS WHICH PEOPLE CHECK THE INGREDIENTS OR
COMPOSITION OF BEFORE PURCHASING (Q2)
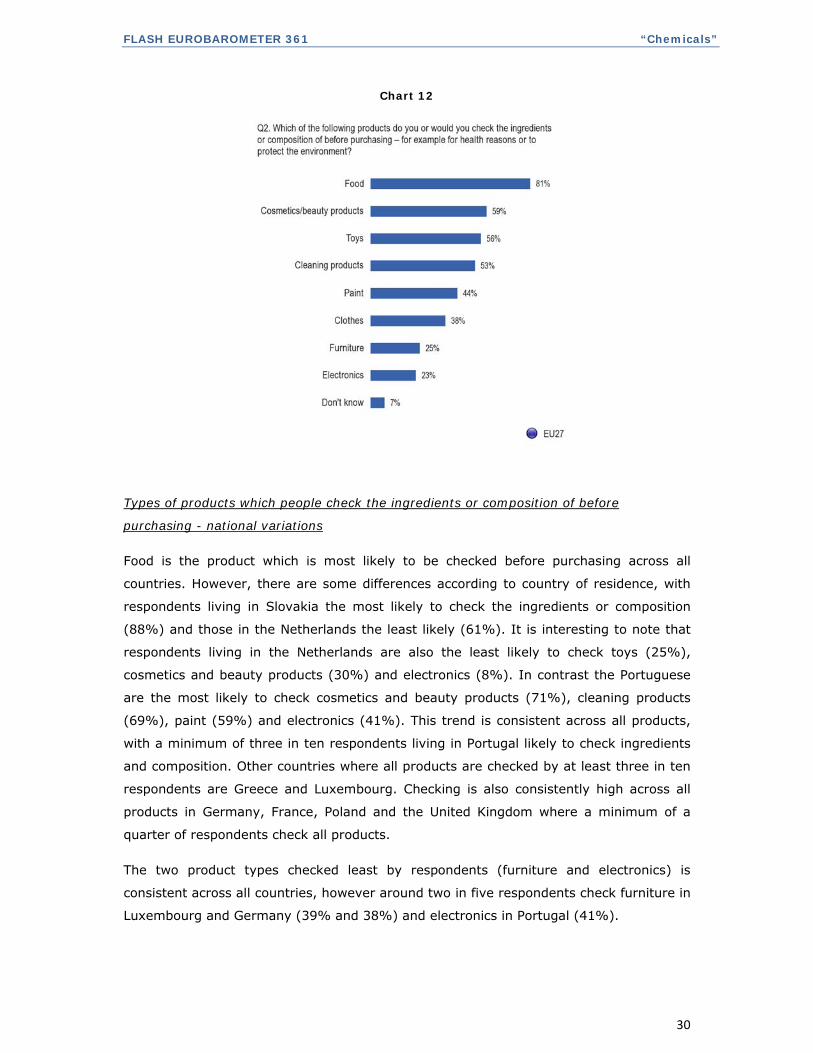
--The ingredients of food are checked by 81% of Europeans – considerably
more than for other product types--
Having established respondents’ views on the presence of chemical substances in a range
of everyday products, they were then asked about their purchasing behaviour in terms of
which products they check the ingredients or composition of before purchasing, for
example for health reasons or to protect the environment3.
Food is the product that respondents are most likely to check, with a large majority
(81%) saying that they look at the ingredients before buying. This is followed by
cosmetics/beauty products, toys and cleaning products which were all mentioned by
more than half of respondents (59%, 56% and 53% respectively). Fewer say that they
check paint, clothes, furniture and electronics (44%, 38%, 25% and 23% respectively).
It is interesting to compare the findings at the previous question about which products
respondents believe contain chemical substances against those from this question. From
this comparison it is possible to start to get a better idea of respondents’ main areas of
concern. For example, 79% of respondents believe chemical substances can be found in
electronic appliances but less than one in four (23%) check their composition. In
addition, 95% of respondents say that they believe paint contains chemical substances
but just 44% claim to check its composition before purchasing. On the other hand, the
gap between belief that a product contains chemicals and actually checking it’s
ingredients/composition is smallest for food (83% think it contains chemicals and 81%
check the ingredients) and children’s toys (75% believe they contain chemicals and 56%
check their composition).
The key differences in the findings on this question are found among Member States and
also by the age of respondents.
3 Q2 Which of the following products do you or would you check the ingredients or composition of before purchasing – for example for health reasons or to protect the environment? Food; Clothes; Electronics; Toys; Cosmetics\beauty products; Cleaning products; Paint; Furniture; DK\NA.
FLASH EUROBAROMETER 361 “Chemicals”
30
Chart 12
Types of products which people check the ingredients or composition of before
purchasing - national variations
Food is the product which is most likely to be checked before purchasing across all
countries. However, there are some differences according to country of residence, with
respondents living in Slovakia the most likely to check the ingredients or composition
(88%) and those in the Netherlands the least likely (61%). It is interesting to note that
respondents living in the Netherlands are also the least likely to check toys (25%),
cosmetics and beauty products (30%) and electronics (8%). In contrast the Portuguese
are the most likely to check cosmetics and beauty products (71%), cleaning products
(69%), paint (59%) and electronics (41%). This trend is consistent across all products,
with a minimum of three in ten respondents living in Portugal likely to check ingredients
and composition. Other countries where all products are checked by at least three in ten
respondents are Greece and Luxembourg. Checking is also consistently high across all
products in Germany, France, Poland and the United Kingdom where a minimum of a
quarter of respondents check all products.
The two product types checked least by respondents (furniture and electronics) is
consistent across all countries, however around two in five respondents check furniture in
Luxembourg and Germany (39% and 38%) and electronics in Portugal (41%).
FLASH EUROBAROMETER 361 “Chemicals”
31
There are also other country differences of interest, in particular where there are
relatively low levels of checking products. For example, cleaning products and paint are
checked overall least in Lithuania when compared with other countries (27% and 20%
respectively), paint and clothes are checked less in Estonia than other countries (20%
and 25% respectively) and furniture and clothes are checked less in Malta than in other
countries (7% and 15% respectively).
Residents of EU15 countries are generally more likely to check products before
purchasing than those in NMS12 countries, although the one exception to this is food;
83% of those living in NMS12 countries check food compared with 80% in EU15
countries.
Chart 13
FLASH EUROBAROMETER 361 “Chemicals”
32
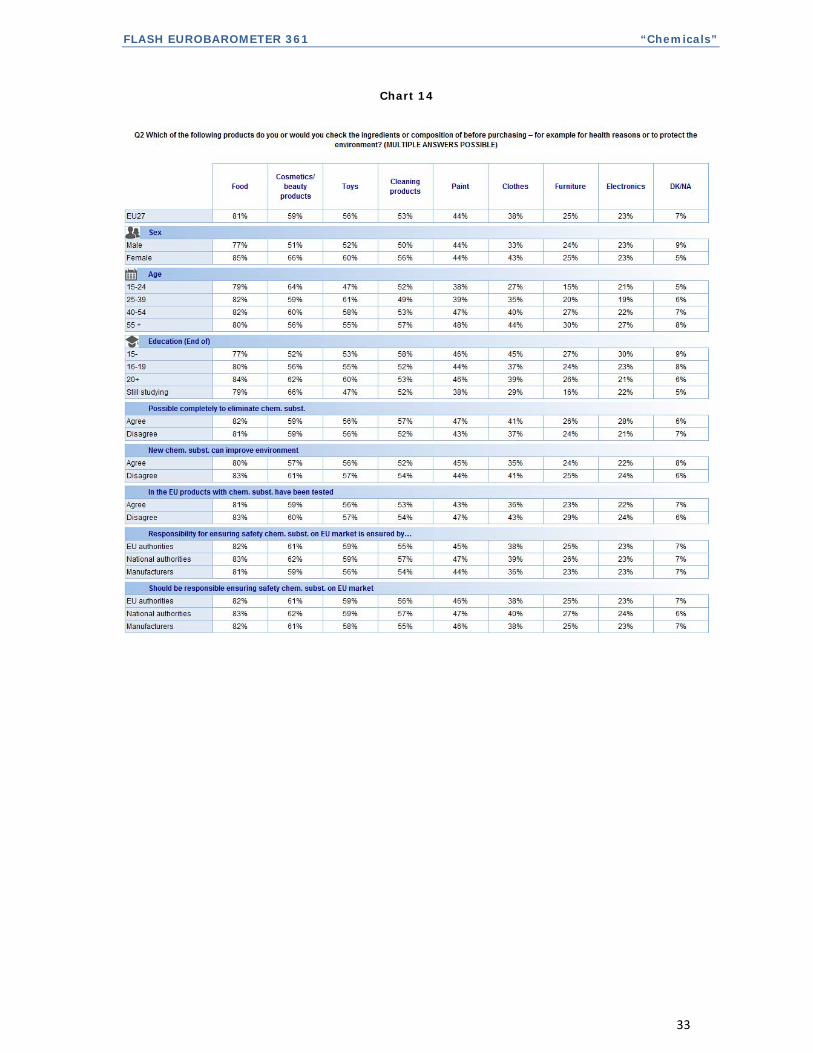
Types of products which people check the ingredients or composition of before
purchasing - socio-demographic variations
There are some differences by socio-demographic sub-groups, in particular there is a
very clear trend for women to check the ingredients or composition of products before
buying them more than men. Women are particularly likely to check the following
products more than men: cosmetics and beauty products, clothes, food, toys, cleaning
products and furniture.
Perhaps not surprisingly, the group that is overall least likely to believe that products
contain chemicals – 15-24 year olds - are mostly least likely to check them before
buying. The one notable exception to this is cosmetics or beauty products which are
checked by 64% of 15-24 year olds. Another notable trend is that although the two
middle age groups (25-39 and 40-54) are generally the most likely to say that there are
chemicals in products, they are not always the most likely to check the ingredients and
composition before purchasing. Those aged 55 and over are particularly likely to check
clothes, electronics, cleaning products and furniture.
Another interesting finding is that despite being generally less likely to hold the view that
products contain chemicals, those who finished their education when they were 15 are, in
some cases, most likely to check the ingredients and composition before buying. In
particular, they are most likely to check clothes, electronics and cleaning products.
Types of products which people check the ingredients or composition of before
purchasing – attitudinal variations
The section below analyses whether or not respondents’ views of the chemical industry,
in particular safety and testing issues, changes their behaviour in terms of checking
ingredients and the composition of products before purchasing.
For many of the everyday products that respondents were asked about a higher
proportion of those who disagree with the statements ‘in the EU, any products containing
new chemical substances have been properly tested’ and ‘new chemical substances can
help in contributing to a better environment’ say that they check the ingredients or
composition before purchasing. In addition, respondents who agree with the statement ‘it
is possible to completely eliminate chemical substances from our daily lives’ are more
likely that those who disagree with the statement to say that they check the ingredients
or composition before purchasing. However, there is one product type which is checked
equally by respondents who agree and disagree with each of the different statements –
children’s toys.
FLASH EUROBAROMETER 361 “Chemicals”
33
Chart 14
FLASH EUROBAROMETER 361 “Chemicals”
34
II. ATTITUDES TOWARDS CHEMICAL SUBSTANCES
The following section of the report details the findings of a range of questions relating
to respondents attitudes to chemical substances. These questions reflect opinion on
whether people believe it is possible to live daily life free of chemical substances, the
relationship between new chemical substances and the environment, and how new
chemical substances are involved in innovations in industry. It also reports on how
purchasing behaviour of a newly launched product would be affected if consumers
were aware that it contained new chemical substances.
2.1 THE POSSIBILITY OF COMPLETELY ELIMINATING CHEMICAL SUBSTANCES
FROM DAILY LIFE (Q6.1)
--69% of Europeans disagree that it is possible to completely eliminate
chemical substances from daily life--
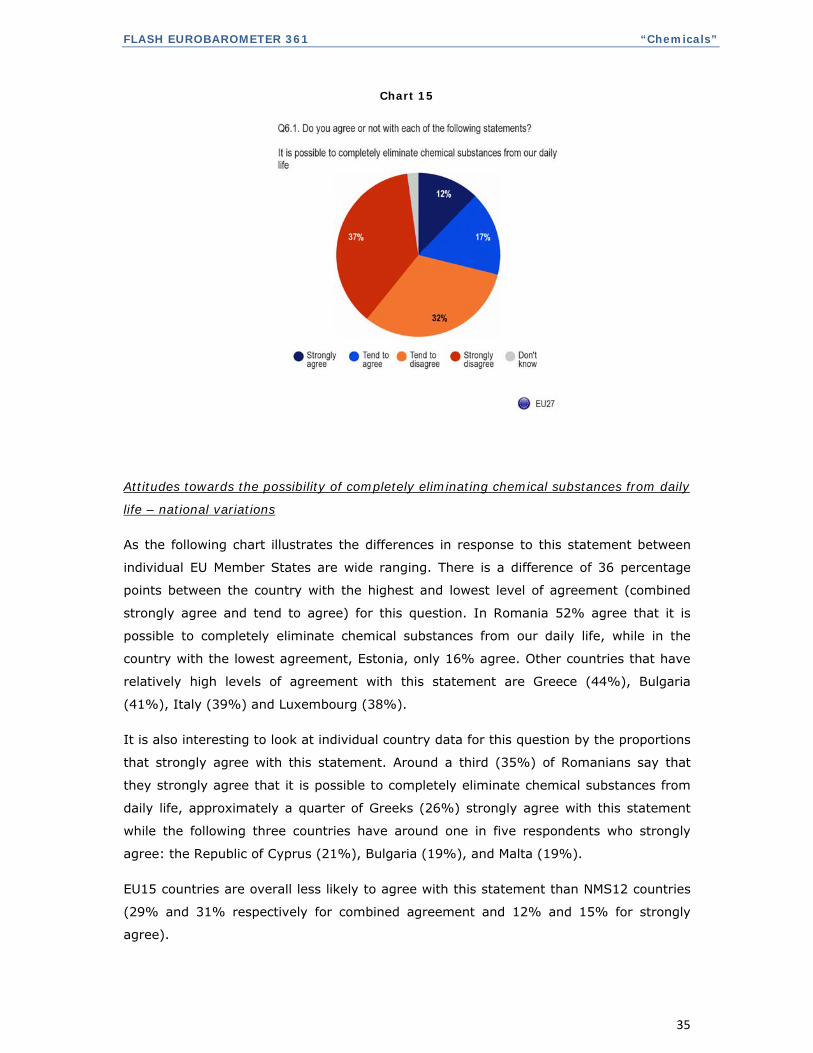
Respondents were asked how much they agree or disagree that it is possible to
completely eliminate chemical substances from daily life4. Approximately seven in ten
(69%) respondents say that it is not possible to completely eliminate chemical
substances from our daily life, with 37% disagreeing strongly with this statement. On the
other hand 29% agree that it is possible to completely eliminate chemical substances
from daily life.
The most significant differences on this issue relate to the age of respondents, the age at
which they left education, and, in addition, there are key differences between Member
States.
4 Q6.1 Do you agree or not with each of the following statements? It is possible to completely eliminate chemical substances from our daily life. Strongly agree; tend to agree; tend to disagree; strongly disagree; DK\NA.
FLASH EUROBAROMETER 361 “Chemicals”
35
Chart 15
Attitudes towards the possibility of completely eliminating chemical substances from daily
life – national variations
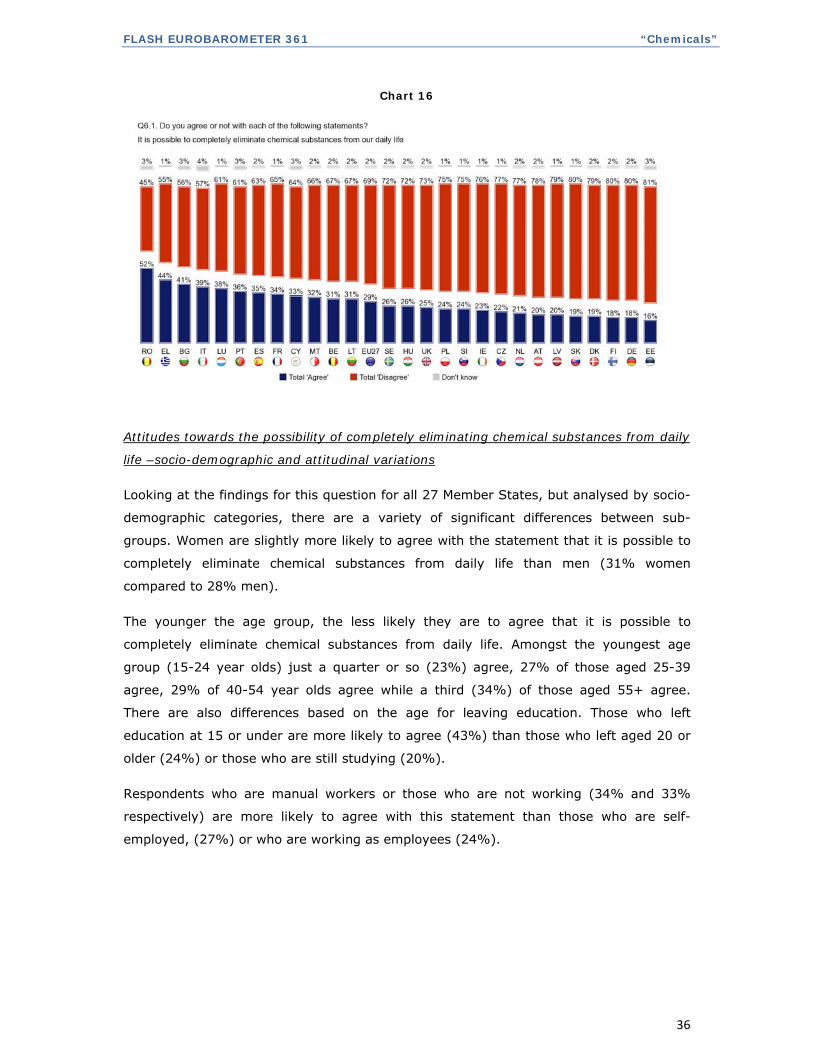
As the following chart illustrates the differences in response to this statement between
individual EU Member States are wide ranging. There is a difference of 36 percentage
points between the country with the highest and lowest level of agreement (combined
strongly agree and tend to agree) for this question. In Romania 52% agree that it is
possible to completely eliminate chemical substances from our daily life, while in the
country with the lowest agreement, Estonia, only 16% agree. Other countries that have
relatively high levels of agreement with this statement are Greece (44%), Bulgaria
(41%), Italy (39%) and Luxembourg (38%).
It is also interesting to look at individual country data for this question by the proportions
that strongly agree with this statement. Around a third (35%) of Romanians say that
they strongly agree that it is possible to completely eliminate chemical substances from
daily life, approximately a quarter of Greeks (26%) strongly agree with this statement
while the following three countries have around one in five respondents who strongly
agree: the Republic of Cyprus (21%), Bulgaria (19%), and Malta (19%).
EU15 countries are overall less likely to agree with this statement than NMS12 countries
(29% and 31% respectively for combined agreement and 12% and 15% for strongly
agree).
FLASH EUROBAROMETER 361 “Chemicals”
36
Chart 16
Attitudes towards the possibility of completely eliminating chemical substances from daily
life –socio-demographic and attitudinal variations
Looking at the findings for this question for all 27 Member States, but analysed by socio-
demographic categories, there are a variety of significant differences between sub-
groups. Women are slightly more likely to agree with the statement that it is possible to
completely eliminate chemical substances from daily life than men (31% women
compared to 28% men).
The younger the age group, the less likely they are to agree that it is possible to
completely eliminate chemical substances from daily life. Amongst the youngest age
group (15-24 year olds) just a quarter or so (23%) agree, 27% of those aged 25-39
agree, 29% of 40-54 year olds agree while a third (34%) of those aged 55+ agree.
There are also differences based on the age for leaving education. Those who left
education at 15 or under are more likely to agree (43%) than those who left aged 20 or
older (24%) or those who are still studying (20%).
Respondents who are manual workers or those who are not working (34% and 33%
respectively) are more likely to agree with this statement than those who are self-
employed, (27%) or who are working as employees (24%).
FLASH EUROBAROMETER 361 “Chemicals”
37
Those respondents who have the view that chemical substances on the EU market today
are less safe than they were 10 years ago are more likely to agree (38%) that it is
possible to completely eliminate chemical substances from daily life than are those who
think chemical substances have got safer or stayed at the same level of safety in the last
10 years (27% and 29% respectively). Those that agree that in the EU any new products
with new chemical substances are tested properly are also more likely to agree with this
statement (30%).
Respondents who do not believe that new chemical substances can contribute to making
the environment better (32%) are more likely to agree that it is possible to completely
eliminate chemical substances from daily life.
In contrast with previous findings, respondents who think that responsibility for the
safety of chemical substances is ensured by manufacturers are more likely to agree that
it is possible to completely eliminate chemical substances from our daily life than are
those who think National Authorities are responsible for ensuring safety (30% compared
with 24%).
2.2 NEW CHEMICAL SUBSTANCES CAN HELP IN REDUCING THE USE OF
NATURAL RESOURCES (Q6.2)
--58% of Europeans agree that new chemical substances can help in reducing
the use of natural resources—
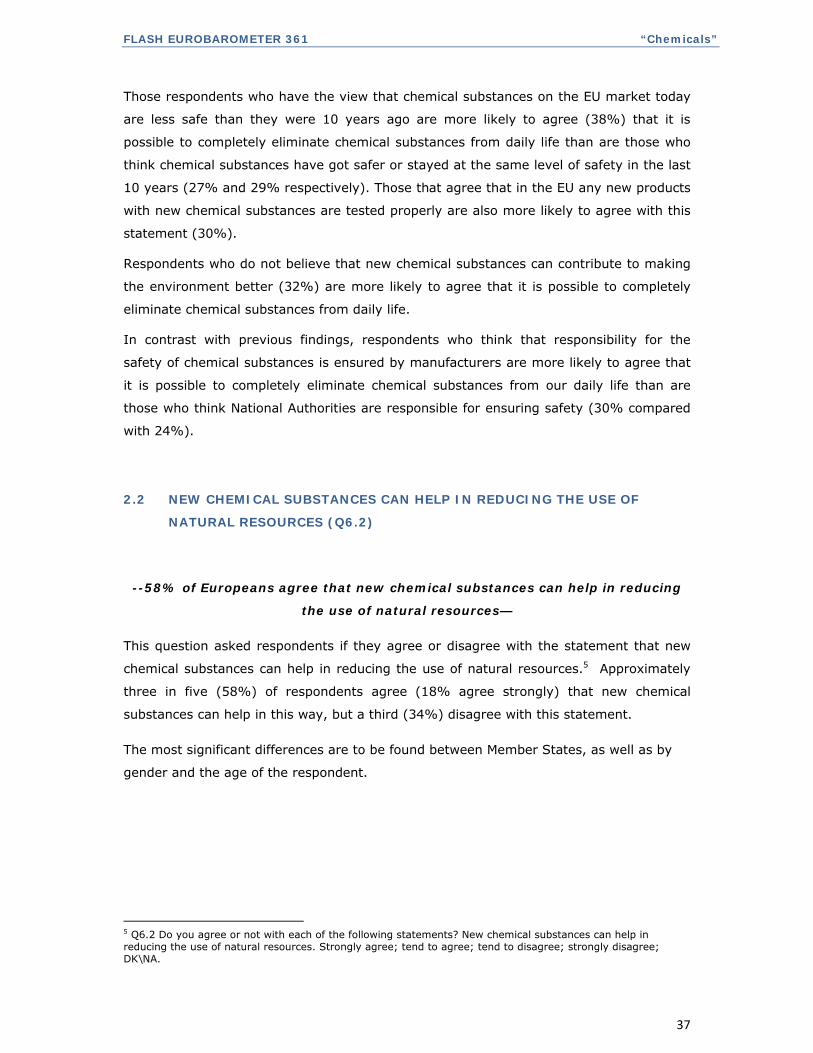
This question asked respondents if they agree or disagree with the statement that new
chemical substances can help in reducing the use of natural resources.5 Approximately
three in five (58%) of respondents agree (18% agree strongly) that new chemical
substances can help in this way, but a third (34%) disagree with this statement.
The most significant differences are to be found between Member States, as well as by
gender and the age of the respondent.
5 Q6.2 Do you agree or not with each of the following statements? New chemical substances can help in reducing the use of natural resources. Strongly agree; tend to agree; tend to disagree; strongly disagree; DK\NA.
FLASH EUROBAROMETER 361 “Chemicals”
38
Chart 17
Attitudes towards how new chemical substances can help in reducing the use of natural
resources – national variations
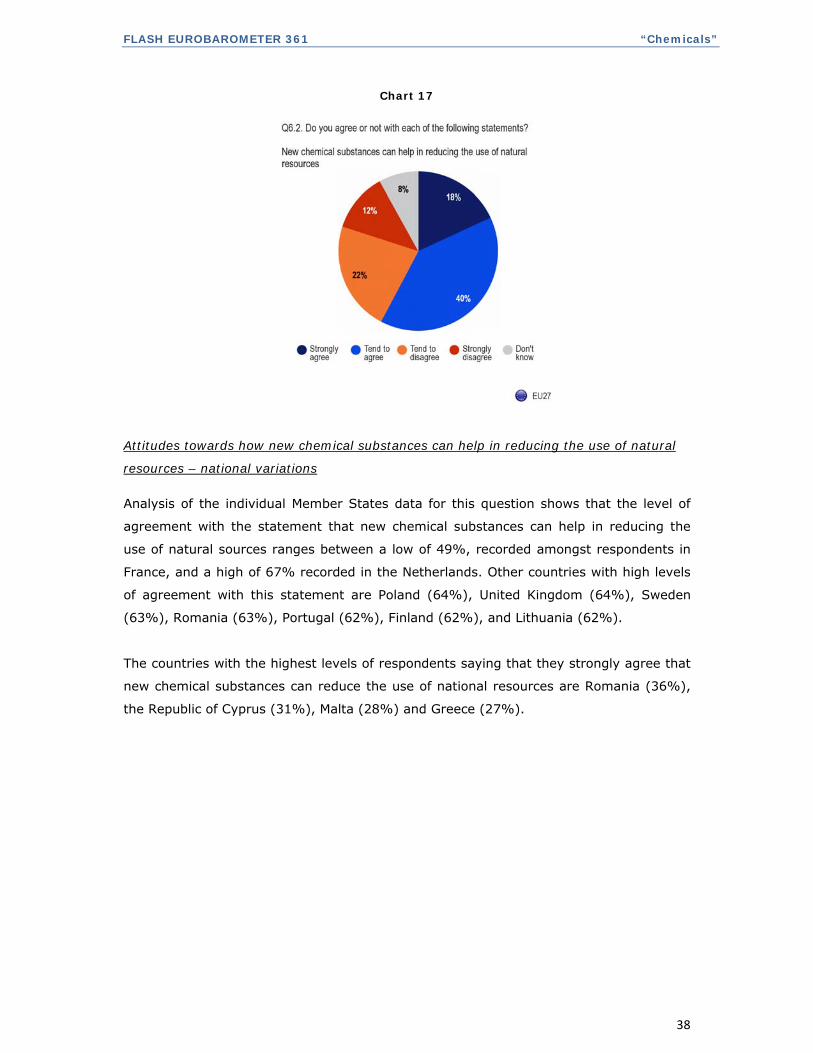
Analysis of the individual Member States data for this question shows that the level of
agreement with the statement that new chemical substances can help in reducing the
use of natural sources ranges between a low of 49%, recorded amongst respondents in
France, and a high of 67% recorded in the Netherlands. Other countries with high levels
of agreement with this statement are Poland (64%), United Kingdom (64%), Sweden
(63%), Romania (63%), Portugal (62%), Finland (62%), and Lithuania (62%).
The countries with the highest levels of respondents saying that they strongly agree that
new chemical substances can reduce the use of national resources are Romania (36%),
the Republic of Cyprus (31%), Malta (28%) and Greece (27%).
FLASH EUROBAROMETER 361 “Chemicals”
39
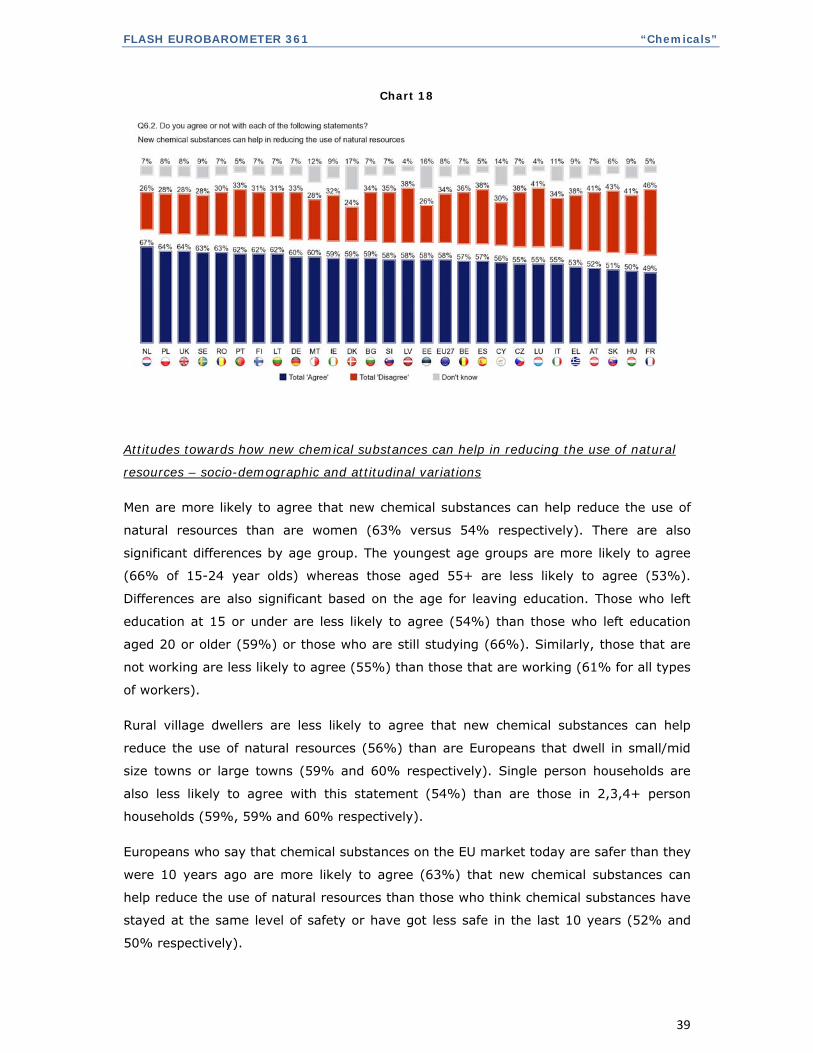
Chart 18
Attitudes towards how new chemical substances can help in reducing the use of natural
resources – socio-demographic and attitudinal variations
Men are more likely to agree that new chemical substances can help reduce the use of
natural resources than are women (63% versus 54% respectively). There are also
significant differences by age group. The youngest age groups are more likely to agree
(66% of 15-24 year olds) whereas those aged 55+ are less likely to agree (53%).
Differences are also significant based on the age for leaving education. Those who left
education at 15 or under are less likely to agree (54%) than those who left education
aged 20 or older (59%) or those who are still studying (66%). Similarly, those that are
not working are less likely to agree (55%) than those that are working (61% for all types
of workers).
Rural village dwellers are less likely to agree that new chemical substances can help
reduce the use of natural resources (56%) than are Europeans that dwell in small/mid
size towns or large towns (59% and 60% respectively). Single person households are
also less likely to agree with this statement (54%) than are those in 2,3,4+ person
households (59%, 59% and 60% respectively).
Europeans who say that chemical substances on the EU market today are safer than they
were 10 years ago are more likely to agree (63%) that new chemical substances can
help reduce the use of natural resources than those who think chemical substances have
stayed at the same level of safety or have got less safe in the last 10 years (52% and
50% respectively).
FLASH EUROBAROMETER 361 “Chemicals”
40
As might be expected, respondents who agree that new chemical substances can
contribute to making the environment better are also more likely to agree that new
chemical substances could help reduce the use of natural resources (75%). Those that
agree that in the EU any new products containing new chemical substances are tested
properly are also more likely to agree with this statement (64%).
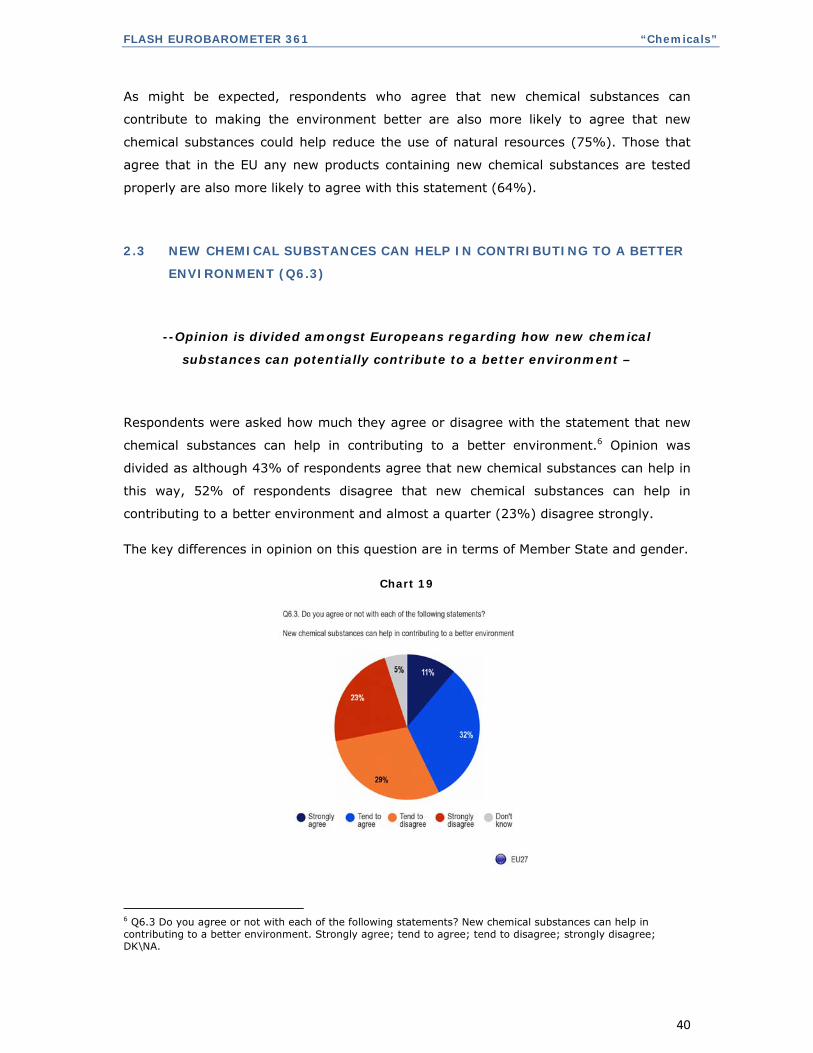
2.3 NEW CHEMICAL SUBSTANCES CAN HELP IN CONTRIBUTING TO A BETTER
ENVIRONMENT (Q6.3)
--Opinion is divided amongst Europeans regarding how new chemical
substances can potentially contribute to a better environment –
Respondents were asked how much they agree or disagree with the statement that new
chemical substances can help in contributing to a better environment.6 Opinion was
divided as although 43% of respondents agree that new chemical substances can help in
this way, 52% of respondents disagree that new chemical substances can help in
contributing to a better environment and almost a quarter (23%) disagree strongly.
The key differences in opinion on this question are in terms of Member State and gender.
Chart 19
6 Q6.3 Do you agree or not with each of the following statements? New chemical substances can help in contributing to a better environment. Strongly agree; tend to agree; tend to disagree; strongly disagree; DK\NA.
FLASH EUROBAROMETER 361 “Chemicals”
41
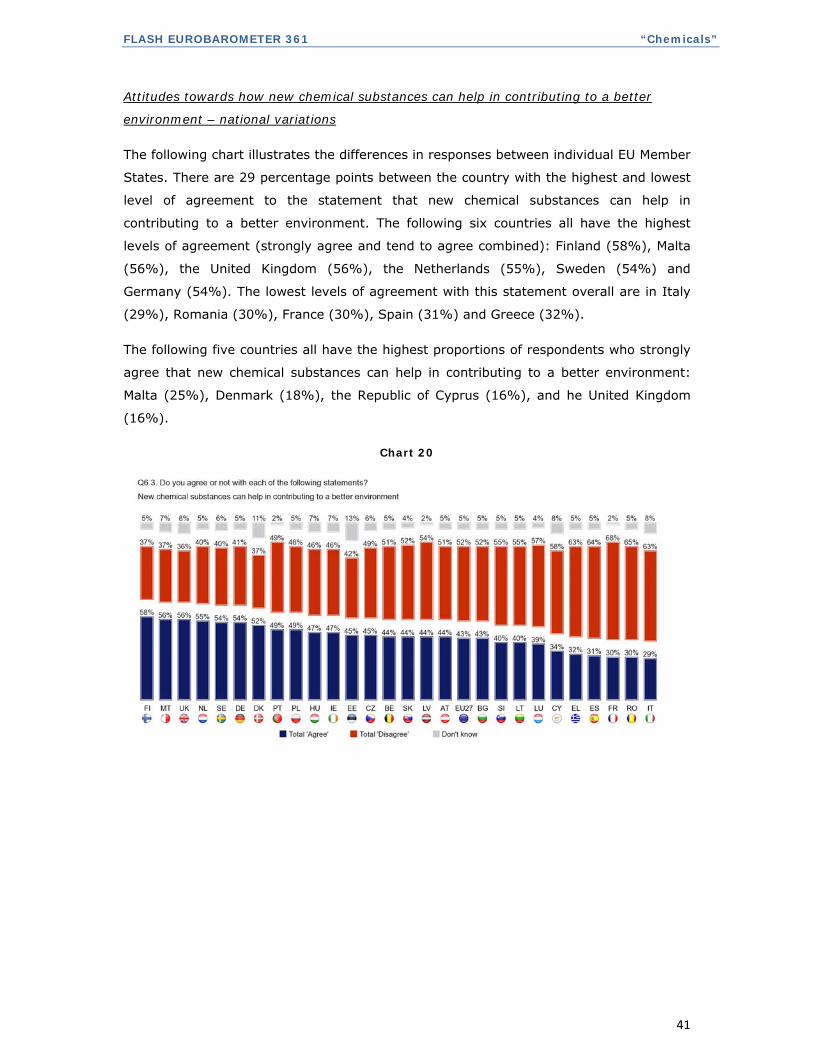
Attitudes towards how new chemical substances can help in contributing to a better
environment – national variations
The following chart illustrates the differences in responses between individual EU Member
States. There are 29 percentage points between the country with the highest and lowest
level of agreement to the statement that new chemical substances can help in
contributing to a better environment. The following six countries all have the highest
levels of agreement (strongly agree and tend to agree combined): Finland (58%), Malta
(56%), the United Kingdom (56%), the Netherlands (55%), Sweden (54%) and
Germany (54%). The lowest levels of agreement with this statement overall are in Italy
(29%), Romania (30%), France (30%), Spain (31%) and Greece (32%).
The following five countries all have the highest proportions of respondents who strongly
agree that new chemical substances can help in contributing to a better environment:
Malta (25%), Denmark (18%), the Republic of Cyprus (16%), and he United Kingdom
(16%).
Chart 20
FLASH EUROBAROMETER 361 “Chemicals”
42
Attitudes towards how new chemical substances can help in contributing to a better
environment – socio-demographic and attitudinal variations
Looking at the findings for all 27 Member States, but analysed by socio-demographic
categories there are a variety of significant differences regards agreement with this
statement between sub-groups. Men are more likely to agree with the statement that
new chemical substances can help in contributing to a better environment than women
(48% men compared to 38% women).
Respondents under the age of 54 are more likely to agree that new chemical substances
can help in contributing to a better environment than are those aged 55 or older.
Amongst the youngest age group (15-24 year olds) 44% agree, 45% of those aged 25-
39 agree, 43% of 40-54 year olds agree but this decreases to two in five (40%) of those
aged 55+ agreeing. There are also differences based on the age for leaving education.
Those who left education at 15 or under are less likely to agree (39%) than those who
left education aged 16-19 (43%), those aged 20 or older (44%), or those that are still
studying (43%).
Respondents who are not working (40%) are less likely to agree with this statement than
those who are working as self-employed (45%), employees (46%) or manual workers
(43%).
When the findings for the EU27 states for this question are analysed by other reported
attitudes towards new chemical substances there are some significant differences. Those
who say that chemical substances on the EU market today are safer than they were 10
years ago are more likely to agree (49%) that new chemical substances can help in
contributing to a better environment than those who think chemical substances have
stayed at the same level of safety or have got less safe in the last 10 years (37% and
30% respectively). Those who agree that in the EU any new products with new chemical
substances are tested properly are also more likely to agree with this statement (49%).
FLASH EUROBAROMETER 361 “Chemicals”
43
2.4 NEW CHEMICAL SUBSTANCES ARE INVOLVED IN INDUSTRIAL
INNOVATIONS (Q6.4)
--Three quarters of Europeans agree that new chemical substances are involved
in most industrial innovations—
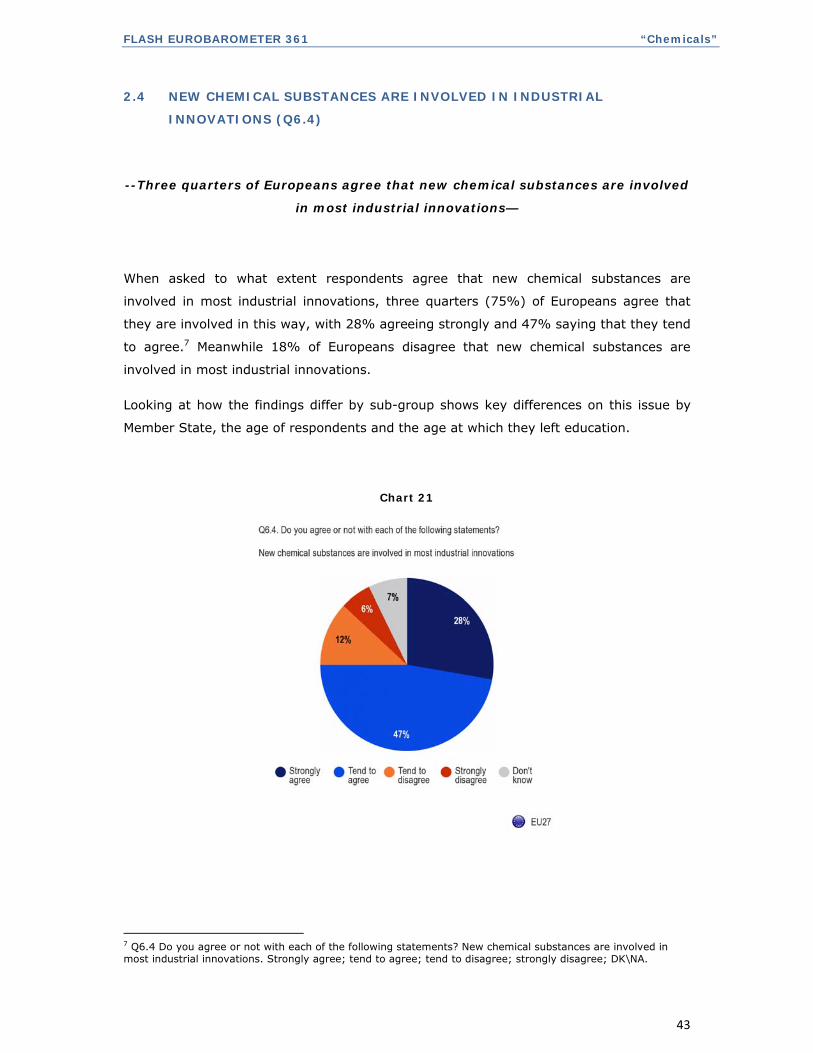
When asked to what extent respondents agree that new chemical substances are
involved in most industrial innovations, three quarters (75%) of Europeans agree that
they are involved in this way, with 28% agreeing strongly and 47% saying that they tend
to agree.7 Meanwhile 18% of Europeans disagree that new chemical substances are
involved in most industrial innovations.
Looking at how the findings differ by sub-group shows key differences on this issue by
Member State, the age of respondents and the age at which they left education.
Chart 21
7 Q6.4 Do you agree or not with each of the following statements? New chemical substances are involved in most industrial innovations. Strongly agree; tend to agree; tend to disagree; strongly disagree; DK\NA.
FLASH EUROBAROMETER 361 “Chemicals”
44
Attitudes towards how new chemical substances are involved in industrial innovations –
national variations
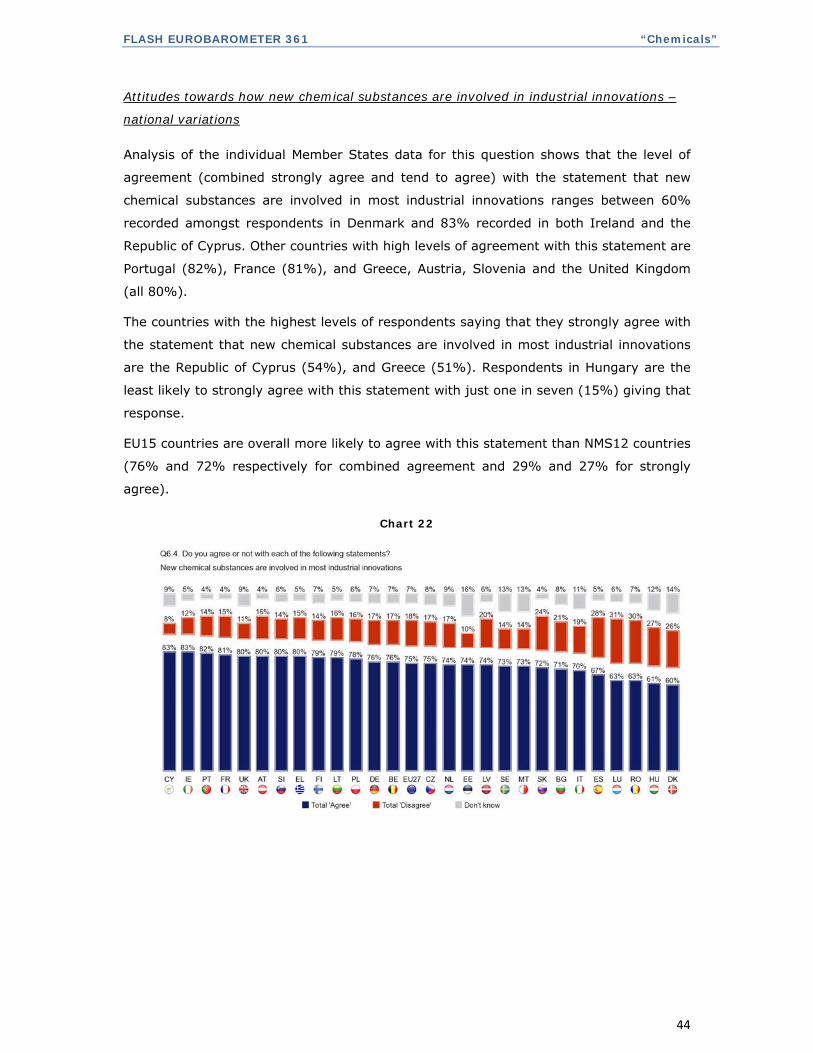
Analysis of the individual Member States data for this question shows that the level of
agreement (combined strongly agree and tend to agree) with the statement that new
chemical substances are involved in most industrial innovations ranges between 60%
recorded amongst respondents in Denmark and 83% recorded in both Ireland and the
Republic of Cyprus. Other countries with high levels of agreement with this statement are
Portugal (82%), France (81%), and Greece, Austria, Slovenia and the United Kingdom
(all 80%).
The countries with the highest levels of respondents saying that they strongly agree with
the statement that new chemical substances are involved in most industrial innovations
are the Republic of Cyprus (54%), and Greece (51%). Respondents in Hungary are the
least likely to strongly agree with this statement with just one in seven (15%) giving that
response.
EU15 countries are overall more likely to agree with this statement than NMS12 countries
(76% and 72% respectively for combined agreement and 29% and 27% for strongly
agree).
Chart 22
FLASH EUROBAROMETER 361 “Chemicals”
45
Attitudes towards how new chemical substances are involved in industrial innovations –
socio-demographic and attitudinal variations
Looking at the findings for this statement analysed by socio-demographic categories,
there are a variety of significant differences regards agreement between sub-groups.
Men are slightly more likely to agree with the statement that new chemical substances
are involved in most industrial innovations than women (77% men compared to 73%
women).
The younger the age category of the respondent, the more likely they are to agree with
this statement. Amongst the youngest age group (15-24 year olds) 82% agree, 79% of
those aged 25-39 agree, 77% of 40-54 year olds agree whereas only two thirds (67%) of
those aged 55+ agree. There are also differences based on the age for leaving education.
Those who left education at 15 or under are less likely to agree (61%) than those who
left education aged 16-19 (75%), those aged 20 or older (78%) or those that are still
studying (83%).
Respondents who are not working (70%) are less likely to agree with this statement than
those who are working: self-employed (77%), employees (81%) and manual workers
(74%).
Europeans who say that chemical substances on the EU market today are safer than they
were 10 years ago are more likely to agree (78%) that new chemical substances are
involved in most industrial innovations than those who think chemical substances have
got less safe in the last 10 years (67%).
Respondents who agree that new chemical substances can contribute to making the
environment better are also more likely to agree that new chemical substances are
involved in most industrial innovations (82%). Those that agree that in the EU any new
products with new chemical substances are tested properly are also more likely to agree
about their role in industrial innovations (79%).
Respondents who think that responsibility for the safety of chemical substances is
ensured by National and EU authorities are more likely to agree that new chemical
substances are involved in most industrial innovations (81% and 80% respectively) than
those who think manufacturers are responsible for ensuring safety (74%).
FLASH EUROBAROMETER 361 “Chemicals”
46
2.5 ATTITUDES TOWARDS BUYING A NEWLY LAUNCHED PRODUCT
CONTAINING NEW CHEMICAL SUBSTANCES (Q3)
--46% of Europeans would wait until a newly launched product containing new
chemical substances had been proven to be working and safe over a long period
of time before buying it–
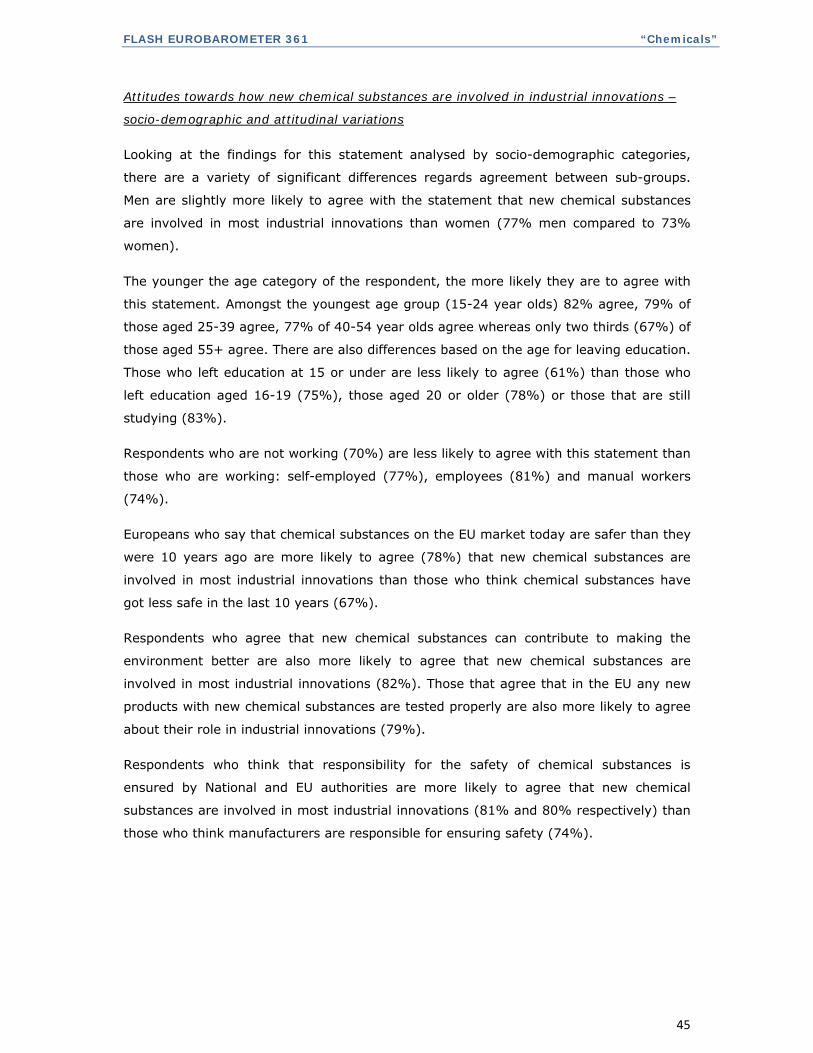
This question asked respondents to say how they would react to buying a newly launched
product containing new chemical substances.8 A tiny minority (2%) of Europeans say
they would buy such a product immediately, and one in ten (10%) say they would buy it
shortly after release, as long as they had heard nothing about possible adverse effects.
Three in ten respondents (30%) say they would buy it only after searching and finding
sufficient information on its functionality and safety, whilst the statement that reflects
the actions of 46% of Europeans is a more cautious position; that they would wait until
the product had been proven to be working and safe over a long period of time. One in
ten respondents (10%) say that they would never buy such a product.
Chart 23
8 Q3 Imagine that you are interested in a newly launched product containing new chemical substances. Which of the following statements best describes what you would do? You would buy it immediately; You would buy it shortly after release, as long as you had heard nothing about possible adverse effects; You would buy it only after searching and finding sufficient information on its functionality and safety; You would wait until the product had been proven to be working and safe over a long period of time; You would never buy it; DK\NA.
FLASH EUROBAROMETER 361 “Chemicals”
47
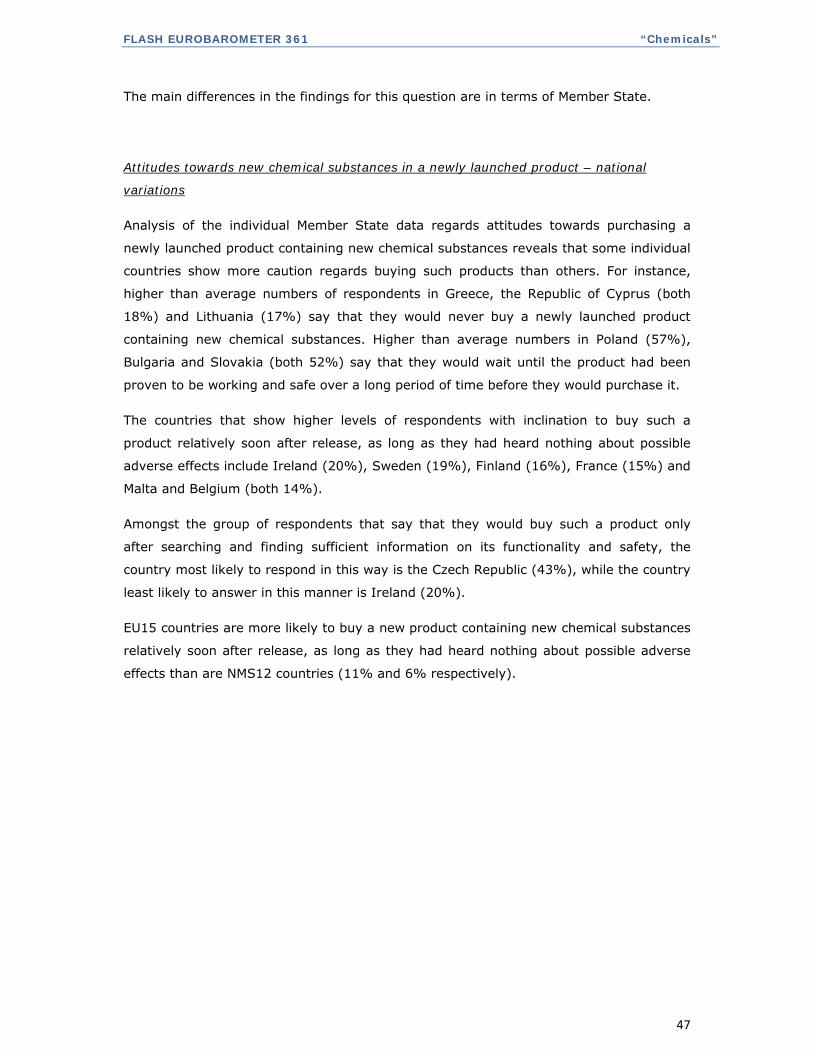
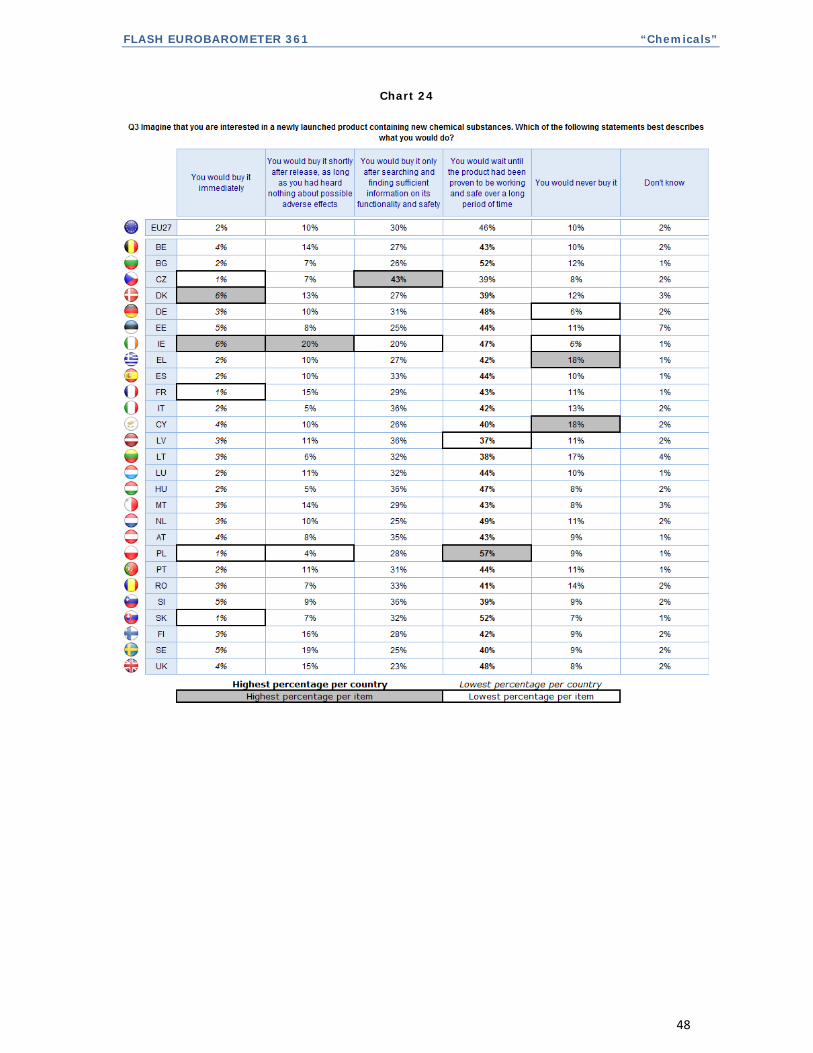
The main differences in the findings for this question are in terms of Member State.
Attitudes towards new chemical substances in a newly launched product – national
variations
Analysis of the individual Member State data regards attitudes towards purchasing a
newly launched product containing new chemical substances reveals that some individual
countries show more caution regards buying such products than others. For instance,
higher than average numbers of respondents in Greece, the Republic of Cyprus (both
18%) and Lithuania (17%) say that they would never buy a newly launched product
containing new chemical substances. Higher than average numbers in Poland (57%),
Bulgaria and Slovakia (both 52%) say that they would wait until the product had been
proven to be working and safe over a long period of time before they would purchase it.
The countries that show higher levels of respondents with inclination to buy such a
product relatively soon after release, as long as they had heard nothing about possible
adverse effects include Ireland (20%), Sweden (19%), Finland (16%), France (15%) and
Malta and Belgium (both 14%).
Amongst the group of respondents that say that they would buy such a product only
after searching and finding sufficient information on its functionality and safety, the
country most likely to respond in this way is the Czech Republic (43%), while the country
least likely to answer in this manner is Ireland (20%).
EU15 countries are more likely to buy a new product containing new chemical substances
relatively soon after release, as long as they had heard nothing about possible adverse
effects than are NMS12 countries (11% and 6% respectively).
FLASH EUROBAROMETER 361 “Chemicals”
48
Chart 24
FLASH EUROBAROMETER 361 “Chemicals”
49
Attitudes towards new chemical substances in a newly launched product – socio-
demographic and attitudinal variations
Analysis of the EU27 states findings by socio-demographic groups shows that there are
significant differences in how different demographic sectors would treat a newly launched
product if it contained new chemical substances.
Those respondents who demonstrate the most cautious attitudes towards such a product
and say that they would never buy it are found in greater numbers amongst women than
men (11% versus 8% respectively), amongst those aged 55+ (16%) and amongst those
who left education aged 15 or lower (20%). Those living on their own are also more
likely to say that they would never buy such a product (14%), as are those that are not
working (13%).
On the other hand, respondents who say that they would buy it shortly after release, as
long as they had heard nothing about possible adverse effects, are more likely to be
found amongst those aged 15-24 (16%), and those that are still studying (17%).
Those respondents who demonstrate the most cautious attitudes towards such a product
and say that they would never buy it are also more likely to think that safety of chemical
substances has lessened compared to how it was 10 years ago (17% of those saying less
safe compared to 7% of those saying safer). Higher levels of respondents displaying this
degree of caution towards buying newly launched products containing new chemical
substances are present amongst those who agree that it is possible to eliminate chemical
substances from daily life (15%), those who disagree that new chemical substances can
help improve the environment (13%) and those who disagree that in the EU new
chemical substances have been properly tested (14%).
Conversely, greater numbers of respondents that say they would buy such a product
shortly after release, as long as they had heard nothing about possible adverse effects,
are to be found amongst those that also think the safety of new chemical substances has
improved over the last decade (11% of those who think it has got safer compared to 7%
of those who think it has got less safe). There are also higher numbers of respondents
who say they would buy such a product soon after release amongst those disagreeing
that it is possible to eliminate chemical substances from daily life (11%), those that
agree that new chemical substances can improve the environment (13%) and those that
think that in the EU products with new chemical substances have been properly tested
(11%).
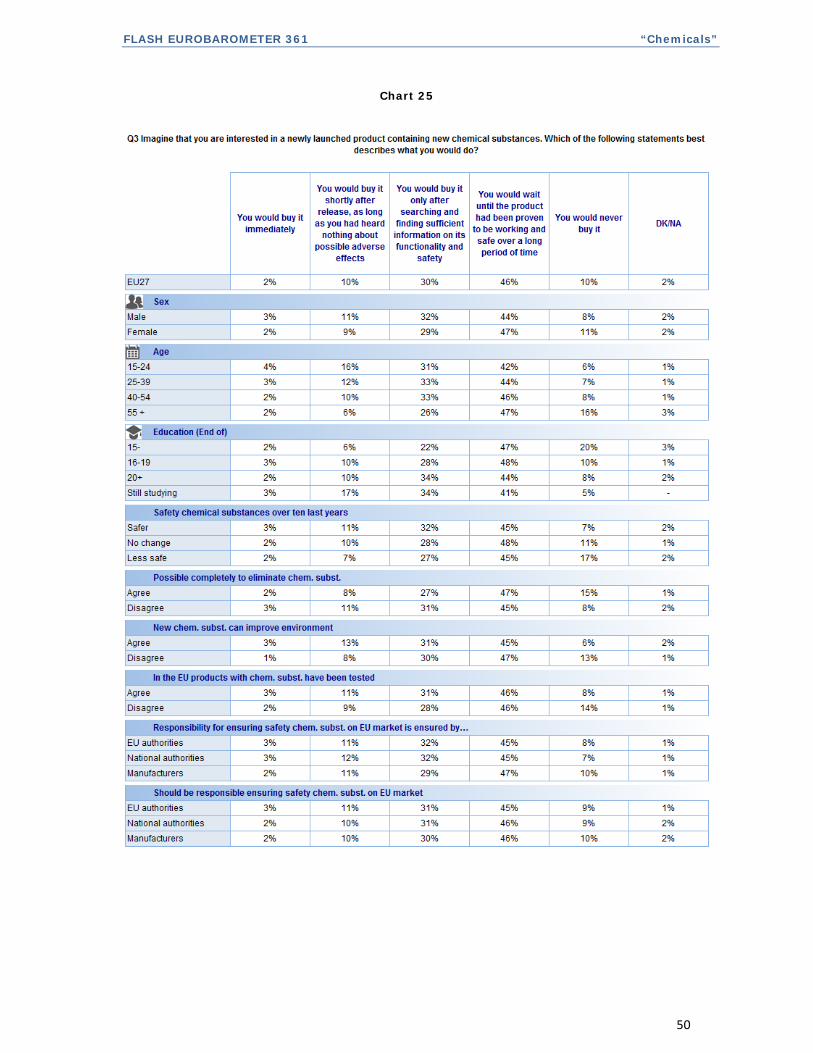
FLASH EUROBAROMETER 361 “Chemicals”
50
Chart 25
FLASH EUROBAROMETER 361 “Chemicals”
51
III. CONSUMER VIEW ON THE SAFETY OF CHEMICAL SUBSTANCES IN THE EU
The following section of the report details the findings of questions that asked
respondents about their views on the safety of chemical substances in the EU.
Respondents were asked to compare their perception of the safety of chemical
substances on the EU market today compared to 10 years ago, as well as their relative
view on the safety of products that contain chemical substances that are manufactured in
the EU compared to those that are imported from elsewhere. Their views on the testing
of new chemical substances in the EU were also recorded.
3.1 THE SAFETY OF CHEMICAL SUBSTANCES ON THE EU MARKET TODAY
COMPARED TO 10 YEARS AGO (Q5)
--A majority of Europeans think chemical substances on the EU market today
are safer than they were 10 years ago—
Three in five (61%) of Europeans say that the chemical substances on the EU market
today are safer than they were 10 years ago9. One in five (19%) say that they are less
safe now and 15% say that there has been no change in the level of safety over the last
decade.
There are four variables where there are striking differences in the findings: Member
State, age of leaving education, gender and age.
9 Q5 Would you say that the chemical substances on the EU market today are safer or less safe than they were 10 years ago? Much safer; safer; there is not change; less safe, much less safe; DK\NA.
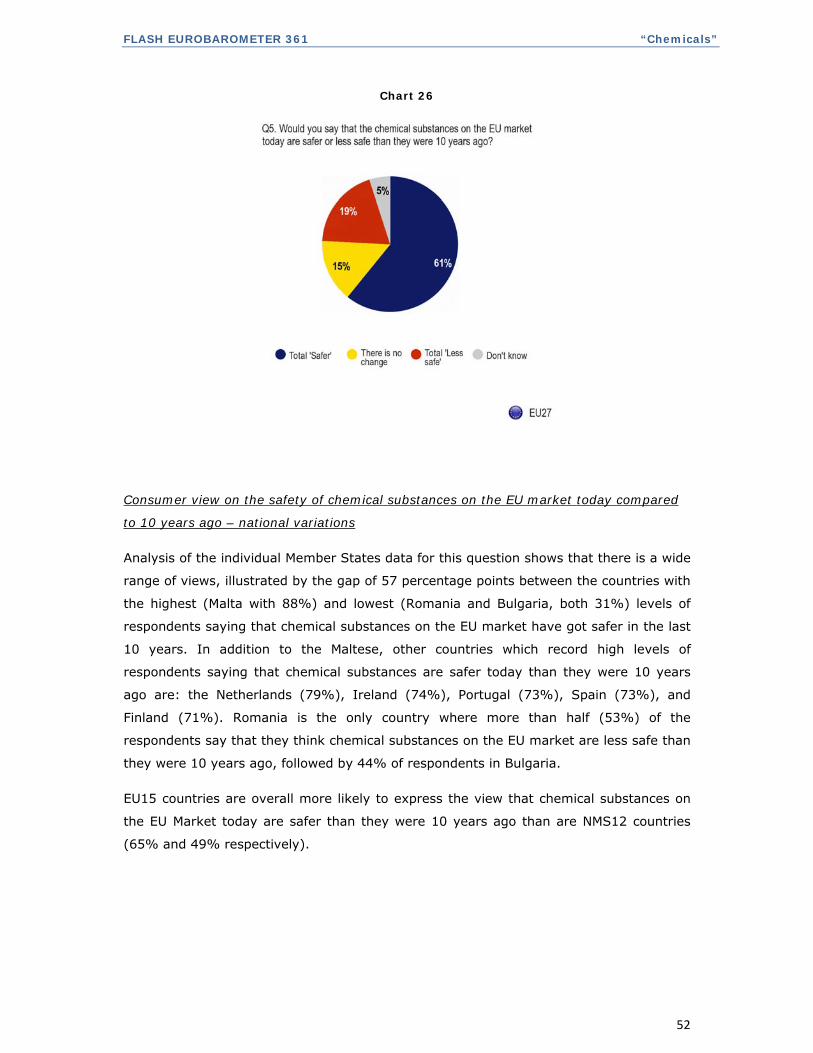
FLASH EUROBAROMETER 361 “Chemicals”
52
Chart 26
Consumer view on the safety of chemical substances on the EU market today compared
to 10 years ago – national variations
Analysis of the individual Member States data for this question shows that there is a wide
range of views, illustrated by the gap of 57 percentage points between the countries with
the highest (Malta with 88%) and lowest (Romania and Bulgaria, both 31%) levels of
respondents saying that chemical substances on the EU market have got safer in the last
10 years. In addition to the Maltese, other countries which record high levels of
respondents saying that chemical substances are safer today than they were 10 years
ago are: the Netherlands (79%), Ireland (74%), Portugal (73%), Spain (73%), and
Finland (71%). Romania is the only country where more than half (53%) of the
respondents say that they think chemical substances on the EU market are less safe than
they were 10 years ago, followed by 44% of respondents in Bulgaria.
EU15 countries are overall more likely to express the view that chemical substances on
the EU Market today are safer than they were 10 years ago than are NMS12 countries
(65% and 49% respectively).
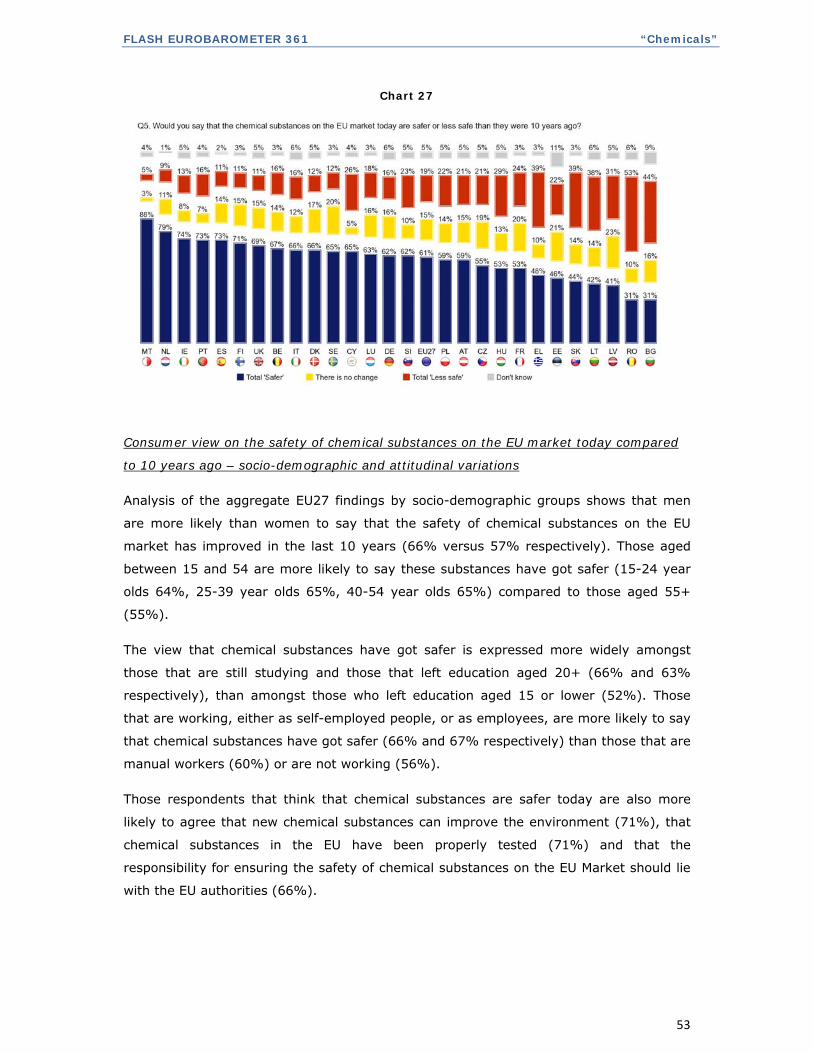
FLASH EUROBAROMETER 361 “Chemicals”
53
Chart 27
Consumer view on the safety of chemical substances on the EU market today compared
to 10 years ago – socio-demographic and attitudinal variations
Analysis of the aggregate EU27 findings by socio-demographic groups shows that men
are more likely than women to say that the safety of chemical substances on the EU
market has improved in the last 10 years (66% versus 57% respectively). Those aged
between 15 and 54 are more likely to say these substances have got safer (15-24 year
olds 64%, 25-39 year olds 65%, 40-54 year olds 65%) compared to those aged 55+
(55%).
The view that chemical substances have got safer is expressed more widely amongst
those that are still studying and those that left education aged 20+ (66% and 63%
respectively), than amongst those who left education aged 15 or lower (52%). Those
that are working, either as self-employed people, or as employees, are more likely to say
that chemical substances have got safer (66% and 67% respectively) than those that are
manual workers (60%) or are not working (56%).
Those respondents that think that chemical substances are safer today are also more
likely to agree that new chemical substances can improve the environment (71%), that
chemical substances in the EU have been properly tested (71%) and that the
responsibility for ensuring the safety of chemical substances on the EU Market should lie
with the EU authorities (66%).
FLASH EUROBAROMETER 361 “Chemicals”
54
Respondents who think that safety of chemicals has improved are also more likely to
disagree with the statement that it is possible to completely eliminate chemical
substances from daily life (64%) than are those who agree with that statement (55%).
Respondents who think that responsibility for the safety of chemical substances is
ensured by EU and National authorities are more likely to agree that chemical substances
on the EU market today are safer than they were 10 years ago (71% and 67%
respectively) than are those who think manufacturers are responsible for ensuring safety
(60%).
3.2 THE SAFETY OF PRODUCTS THAT CONTAIN CHEMICAL SUBSTANCES
IMPORTED FROM OUTSIDE THE EU COMPARED TO THOSE
MANUFACTURED IN THE EU (Q4)
--Half of Europeans think that EU manufactured products containing chemical
substances are safer but a third say none of them are safe --
Half (49%) of Europeans have the view that products manufactured in the EU contain
safer chemical substances than products imported from countries outside the EU10. Just
4% think that products imported from countries outside the EU contain safer chemical
substances than products made in the EU. However, a third (33%) have the opinion that
none of them are safe whilst one in ten (10%) think that both are equally safe.
There are four variables showing salient differences on this issue: Member State, age of
respondent, gender, and age of leaving education.
10 Q4 Which of the following statements best reflects your opinion…? Products imported from countries outside the EU contain safer chemical substances than products manufactured in the EU; Products manufactured in the EU contain safer chemical substances than products imported from countries outside the EU; Both are equally safe; None of them are safe; DK\NA.
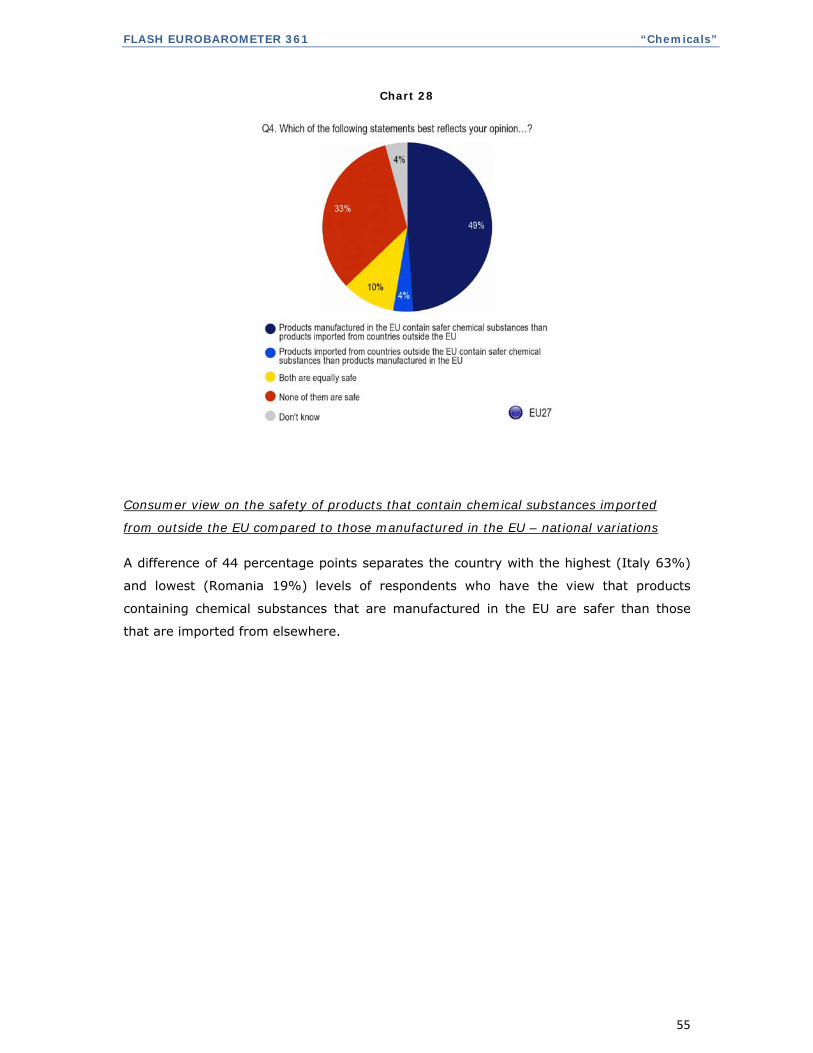
FLASH EUROBAROMETER 361 “Chemicals”
55
Chart 28
Consumer view on the safety of products that contain chemical substances imported
from outside the EU compared to those manufactured in the EU – national variations
A difference of 44 percentage points separates the country with the highest (Italy 63%)
and lowest (Romania 19%) levels of respondents who have the view that products
containing chemical substances that are manufactured in the EU are safer than those
that are imported from elsewhere.
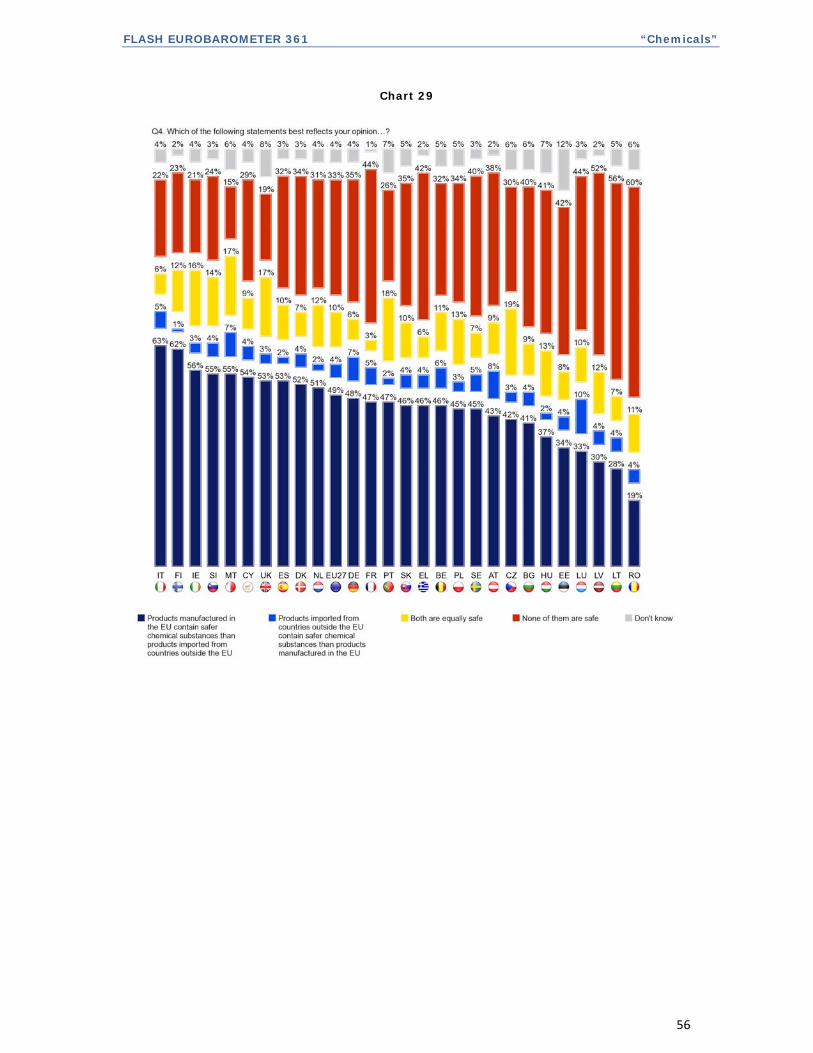
FLASH EUROBAROMETER 361 “Chemicals”
56
Chart 29
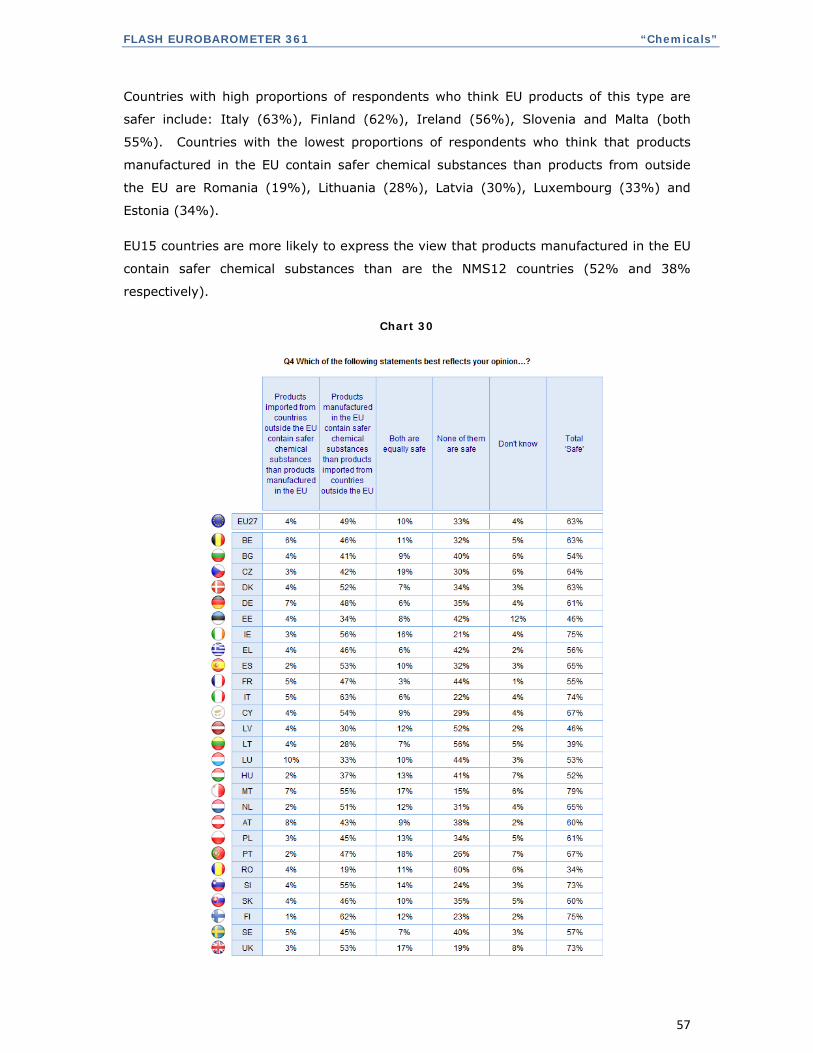
FLASH EUROBAROMETER 361 “Chemicals”
57
Countries with high proportions of respondents who think EU products of this type are
safer include: Italy (63%), Finland (62%), Ireland (56%), Slovenia and Malta (both
55%). Countries with the lowest proportions of respondents who think that products
manufactured in the EU contain safer chemical substances than products from outside
the EU are Romania (19%), Lithuania (28%), Latvia (30%), Luxembourg (33%) and
Estonia (34%).
EU15 countries are more likely to express the view that products manufactured in the EU
contain safer chemical substances than are the NMS12 countries (52% and 38%
respectively).
Chart 30
FLASH EUROBAROMETER 361 “Chemicals”
58
Analysis of the individual EU27 countries by those who say that none of these types of
products are safe, regardless of whether they are manufactured in the EU or imported
from elsewhere, indicates that the countries that are most likely to say this are Romania
(60%), Lithuania (56%), Latvia (52%) and Luxembourg and France (both 44%).
EU15 countries are less likely to say that none of these types of products are safe than
are the NMS12 countries (31% and 41% respectively).
Consumer view on the safety of products that contain chemical substances imported
from outside the EU compared to those manufactured in the EU – socio-demographic and
attitudinal variations
Analysis of the findings by socio-demographic groups shows that men are more likely
than women to hold the view that products manufactured in the EU contain safer
chemical substances than products imported from countries outside the EU (55% versus
43% respectively). Women are more likely than men to say that none of these types of
products are safe (38% women, 27% men).
Those aged between 15-24 years old are more likely to say that both EU derived
products and those imported from elsewhere are equally safe (21%) than their older
counterparts (12% of 25-39 year olds, 8% of 40-54 year olds and 5% of those aged
55+).
Respondents that are self-employed or employees (54% and 53% respectively) are more
likely than manual workers and those that are not working (44% and 45% respectively)
to hold the view that products manufactured in the EU contain safer chemical substances
than products imported from countries outside the EU.
Those respondents that think that products that contain chemical substances that are
manufactured in the EU are safer, are also more likely to agree that new chemical
substances can improve the environment (54%), that chemical substances in the EU
have been properly tested (56%) and that the safety of chemical substances has
improved over the last 10 years (57%). Respondents who think that EU manufactured
products containing chemical substances are safer are also more likely to disagree that
with the statement that it is possible to completely eliminate chemical substances from
daily life (51%).
FLASH EUROBAROMETER 361 “Chemicals”
59
As might be expected, proportions of respondents who have the view that none of these
types of products are safe are higher amongst those who also think that chemical
substances have got less safe over the last 10 years (53%), also disagree that new
chemical substances can improve the environment (39%) and disagree that in the EU
chemical substances have been properly tested (50%).
Respondents who say that responsibility for the safety of chemical substances is ensured
by EU authorities or National Authorities are more likely to say that products
manufactured in the EU contain safer chemical substances than products imported from
countries outside the EU (57% and 54% respectively) than are those who think
manufacturers are responsible for ensuring safety (44%). People who think
manufacturers are responsible for ensuring safety are more likely to say none of them
are safe (35%) than those who think that EU authorities are responsible (26%).
3.3 PROPER TESTING OF PRODUCTS CONTAINING NEW CHEMICAL S
UBSTANCES IN THE EU (Q6.5)
--Two-thirds of Europeans agree that in the EU, products containing new
chemical substances have been properly tested--
When asked to what extent respondents agree that in the EU, any products containing
new chemical substances have been properly tested, two thirds (65%) agree with 16%
saying that they agree strongly11. Meanwhile, three in ten (31%) of Europeans disagree
that products containing new chemical substances are properly tested in the EU.
The key variables where there are significant differences in the findings are Member
State, age of respondent and age of leaving education.
11 Q6.5 Do you agree or not with each of the following statements? In the EU, any products containing new chemical substance have been properly tested. Strongly agree; tend to agree; tend to disagree; strongly disagree; DK\NA.
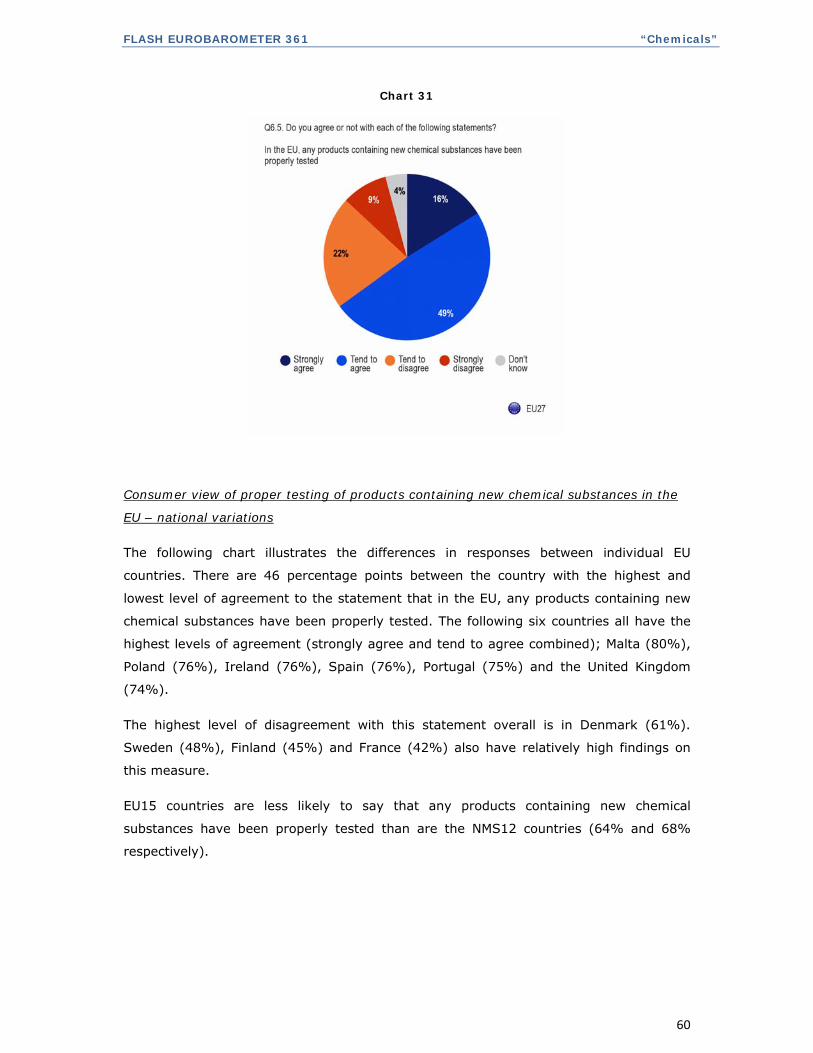
FLASH EUROBAROMETER 361 “Chemicals”
60
Chart 31
Consumer view of proper testing of products containing new chemical substances in the
EU – national variations
The following chart illustrates the differences in responses between individual EU
countries. There are 46 percentage points between the country with the highest and
lowest level of agreement to the statement that in the EU, any products containing new
chemical substances have been properly tested. The following six countries all have the
highest levels of agreement (strongly agree and tend to agree combined); Malta (80%),
Poland (76%), Ireland (76%), Spain (76%), Portugal (75%) and the United Kingdom
(74%).
The highest level of disagreement with this statement overall is in Denmark (61%).
Sweden (48%), Finland (45%) and France (42%) also have relatively high findings on
this measure.
EU15 countries are less likely to say that any products containing new chemical
substances have been properly tested than are the NMS12 countries (64% and 68%
respectively).
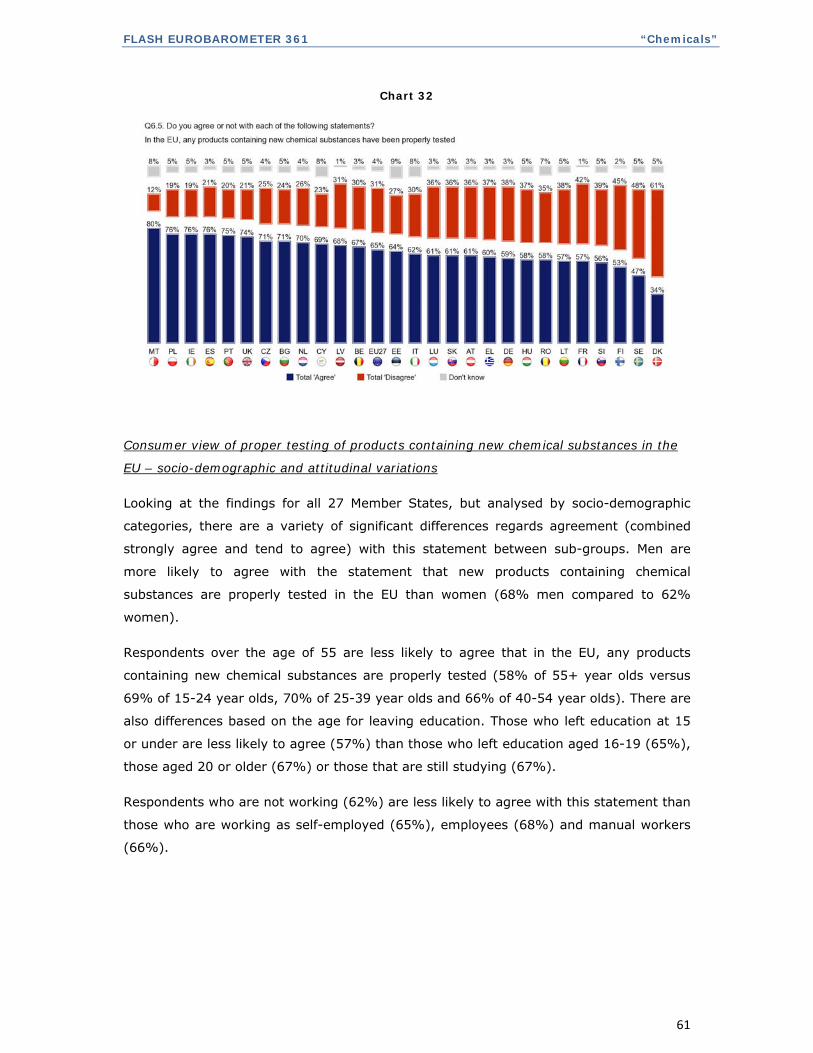
FLASH EUROBAROMETER 361 “Chemicals”
61
Chart 32
Consumer view of proper testing of products containing new chemical substances in the
EU – socio-demographic and attitudinal variations
Looking at the findings for all 27 Member States, but analysed by socio-demographic
categories, there are a variety of significant differences regards agreement (combined
strongly agree and tend to agree) with this statement between sub-groups. Men are
more likely to agree with the statement that new products containing chemical
substances are properly tested in the EU than women (68% men compared to 62%
women).
Respondents over the age of 55 are less likely to agree that in the EU, any products
containing new chemical substances are properly tested (58% of 55+ year olds versus
69% of 15-24 year olds, 70% of 25-39 year olds and 66% of 40-54 year olds). There are
also differences based on the age for leaving education. Those who left education at 15
or under are less likely to agree (57%) than those who left education aged 16-19 (65%),
those aged 20 or older (67%) or those that are still studying (67%).
Respondents who are not working (62%) are less likely to agree with this statement than
those who are working as self-employed (65%), employees (68%) and manual workers
(66%).
FLASH EUROBAROMETER 361 “Chemicals”
62
When the findings for the EU27 States for this question are analysed by other reported
attitudes towards new chemical substances, those who agree that chemical substances
on the EU market today are properly tested are also more likely to agree (74%) that new
chemical substances can help in contributing to a better environment, and that chemical
substances have got safer over the last 10 years (75%).
Respondents who say that responsibility for the safety of chemical substances is ensured
by EU authorities are more likely to agree that in the EU any products containing new
chemical substances have been properly tested (75%) than are those who think
manufacturers are responsible for ensuring safety (67%).
FLASH EUROBAROMETER 361 “Chemicals”
63
IV. CONSUMER VIEW ON RESPONSIBILITY FOR ENSURING THE SAFETY OF
CHEMICAL SUBSTANCES IN THE EU
This section of the report details the findings of questions asking about respondents’
views on the governance of chemical substances safety in the EU. Initially, respondents
were asked to state which organisation they currently thought had the role of ensuring
chemical safety in the EU. This was then followed with a question asking them, who, in
their opinion should be responsible for ensuring the safety of chemical substances on the
EU market.
4.1 CONSUMER VIEW ON THE GOVERNANCE OF CHEMICAL SAFETY IN THE EU
(Q7)
--Views are divided on who has responsibility for ensuring the safety of
chemical substances –
Respondents were asked to state what organisations ensure the safety of chemical
substances in the EU at the current time12. The question was designed to allow for
multiple answers. Aggregate results for the EU27 countries show that almost a majority
(48%) think that the authorities of the European Union currently hold that power.
Approximately two in five (42%) say that it is the role of manufacturers themselves,
whilst around a third (35%) say that the national authorities ensure the safety of
chemical substances in the EU. A small proportion (6%) say that nobody has this
responsibility and 1% think it is the role of others in addition to those prompted at this
question.
There are four variables where there are particularly pronounced differences in the
findings: Member State, age, age of leaving education and also occupation.
12 Q7 Today, in the EU, do you think that the safety of chemical substances is ensured by…? Authorities of the European Union; National authorities; Manufacturers themselves; Other (DO NOT READ OUT); Nobody (DO NOT READ OUT); DK\NA.
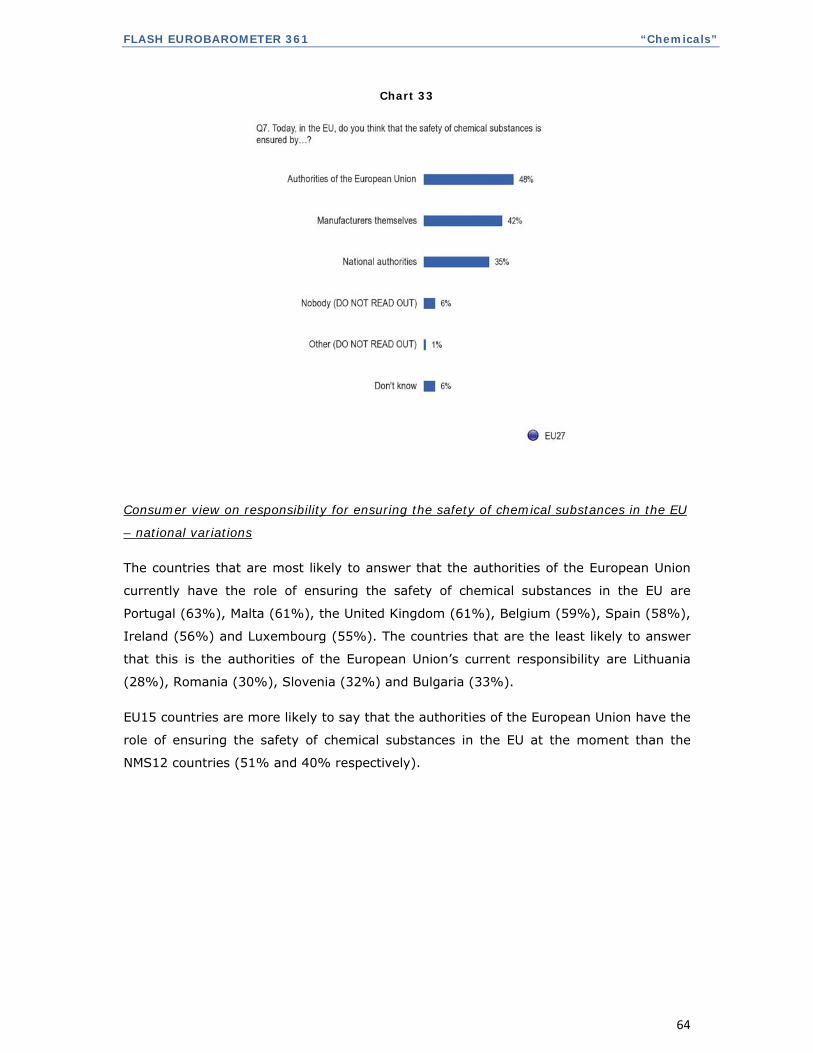
FLASH EUROBAROMETER 361 “Chemicals”
64
Chart 33
Consumer view on responsibility for ensuring the safety of chemical substances in the EU
– national variations
The countries that are most likely to answer that the authorities of the European Union
currently have the role of ensuring the safety of chemical substances in the EU are
Portugal (63%), Malta (61%), the United Kingdom (61%), Belgium (59%), Spain (58%),
Ireland (56%) and Luxembourg (55%). The countries that are the least likely to answer
that this is the authorities of the European Union’s current responsibility are Lithuania
(28%), Romania (30%), Slovenia (32%) and Bulgaria (33%).
EU15 countries are more likely to say that the authorities of the European Union have the
role of ensuring the safety of chemical substances in the EU at the moment than the
NMS12 countries (51% and 40% respectively).
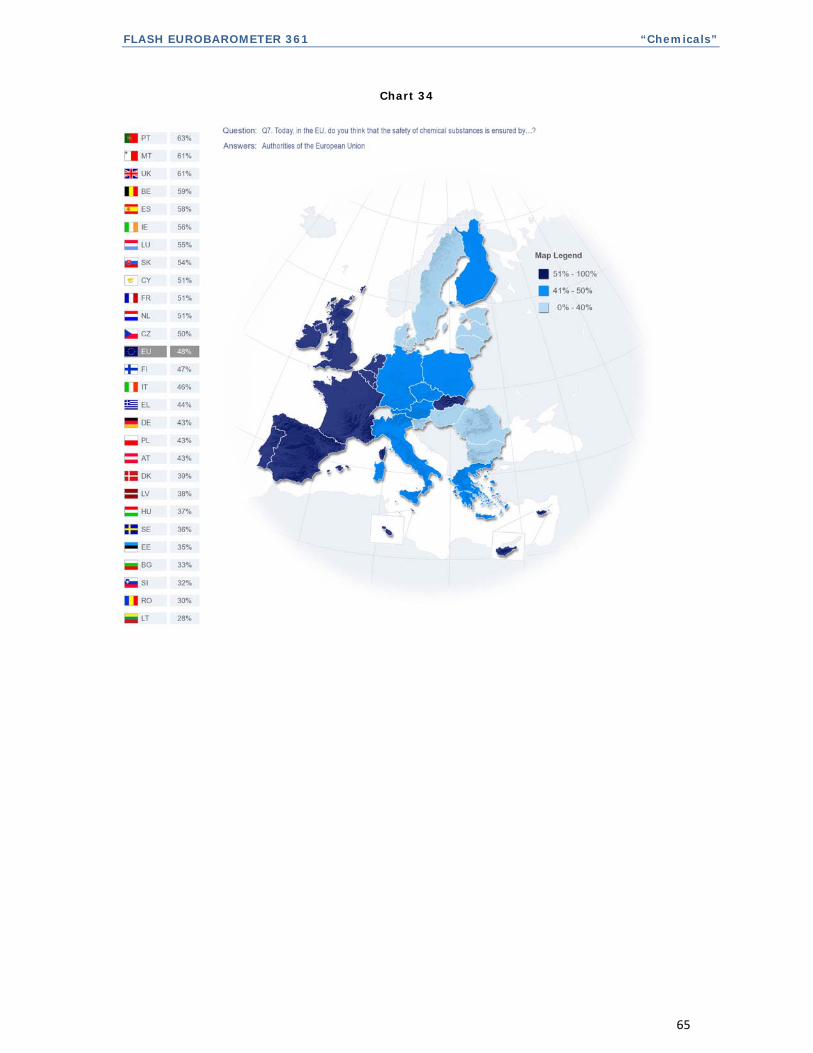
FLASH EUROBAROMETER 361 “Chemicals”
65
Chart 34
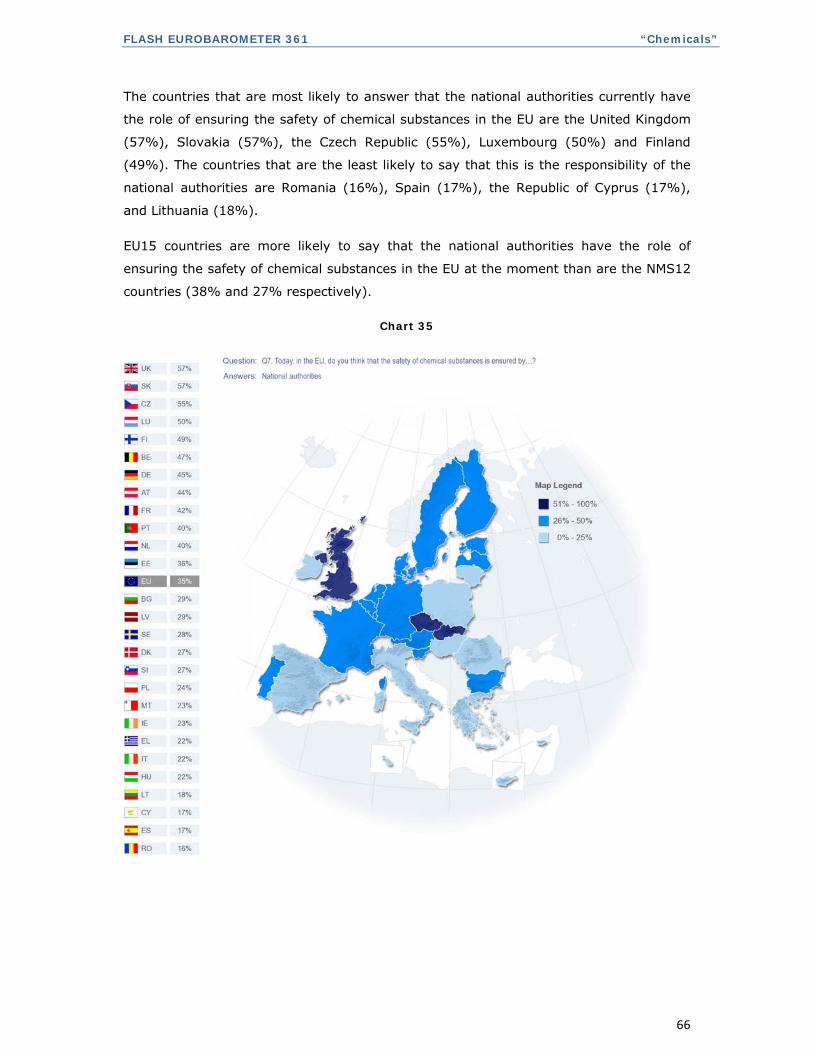
FLASH EUROBAROMETER 361 “Chemicals”
66
The countries that are most likely to answer that the national authorities currently have
the role of ensuring the safety of chemical substances in the EU are the United Kingdom
(57%), Slovakia (57%), the Czech Republic (55%), Luxembourg (50%) and Finland
(49%). The countries that are the least likely to say that this is the responsibility of the
national authorities are Romania (16%), Spain (17%), the Republic of Cyprus (17%),
and Lithuania (18%).
EU15 countries are more likely to say that the national authorities have the role of
ensuring the safety of chemical substances in the EU at the moment than are the NMS12
countries (38% and 27% respectively).
Chart 35
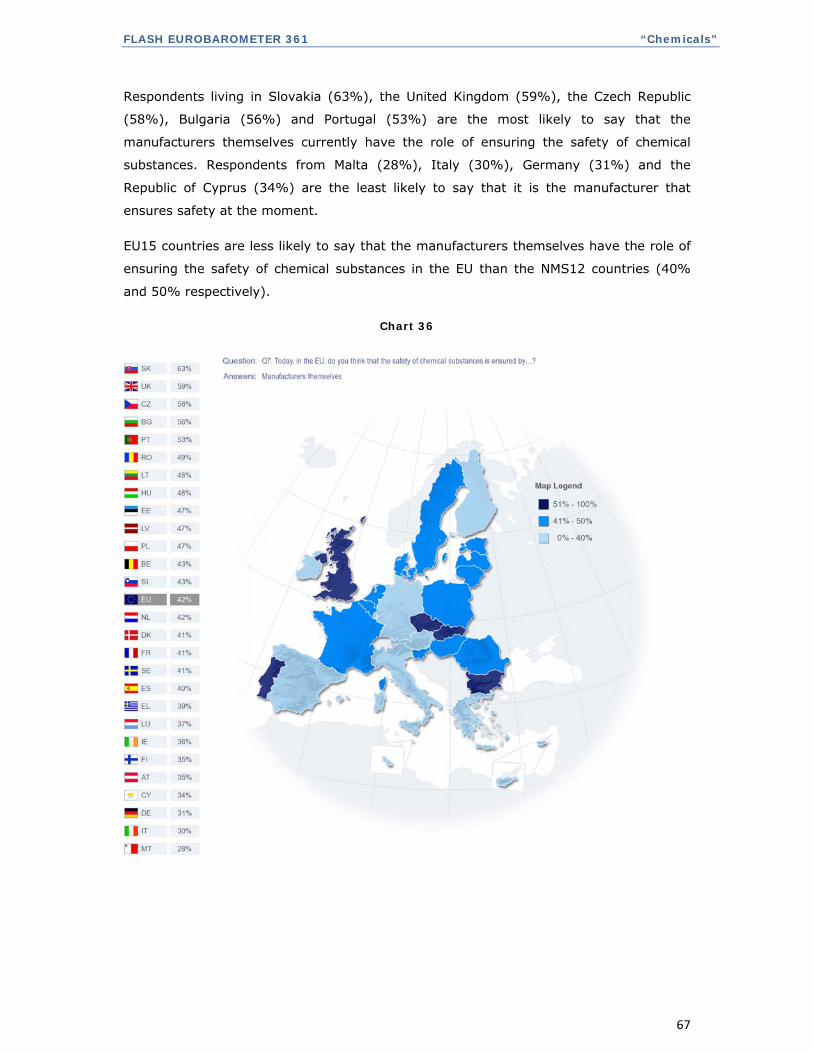
FLASH EUROBAROMETER 361 “Chemicals”
67
Respondents living in Slovakia (63%), the United Kingdom (59%), the Czech Republic
(58%), Bulgaria (56%) and Portugal (53%) are the most likely to say that the
manufacturers themselves currently have the role of ensuring the safety of chemical
substances. Respondents from Malta (28%), Italy (30%), Germany (31%) and the
Republic of Cyprus (34%) are the least likely to say that it is the manufacturer that
ensures safety at the moment.
EU15 countries are less likely to say that the manufacturers themselves have the role of
ensuring the safety of chemical substances in the EU than the NMS12 countries (40%
and 50% respectively).
Chart 36
FLASH EUROBAROMETER 361 “Chemicals”
68
Consumer view on responsibility for ensuring the safety of chemical substances in the EU
– socio-demographic and attitudinal variations
Analysis of the findings by socio-demographic groups shows that men are more likely
than women to say that either the authorities of the European Union ensure the safety of
chemical substances currently (50% men versus 47% women) or that the national
authorities are responsible (40% men versus 32% women). However, women are more
likely than men to say that the manufacturers themselves ensure safety (44% women,
40% men).
Those aged between 15-24 years old are more likely to hold the view that the
manufacturers themselves ensure safety of chemical substances (53%) than their older
counterparts (46% of 25-39 year olds, 40% of 40-54 year olds and 37% of those aged
55+). Those that are still studying are more likely to say that it is the manufacturers role
to ensure safety (50%) than, for example, those who left education aged 15 or under
(42%).
Respondents that are self-employed or employees (37% and 41% respectively) are more
likely than manual workers and those that are not working (31% and 32% respectively)
to say that national authorities are currently responsible for chemical safety. Employees
(56%) are more likely to say that chemical safety is, currently, ensured by authorities of
the European Union, than are manual workers or those not working (both 44%).
Those respondents that think that the authorities of the European Union are responsible
for ensuring chemical safety at the present time are also more likely to agree that new
chemical substances can improve the environment (53%), that chemical substances in
the EU have been properly tested (56%) and that the safety of chemical substances has
improved over the last 10 years (56%). They are also more likely to disagree with the
statement that it is possible to completely eliminate chemical substances from daily life
(50%). Three in five (60%) of those who say they currently think the authorities of the
European Union are responsible go on to state that in their opinion it should be the
authorities of the EU that carry out this work.
Respondents that say that they currently understand that the national authorities are
responsible for ensuring chemical safety are also more likely to agree that new chemical
substances can improve the environment (41%), that chemical substances in the EU
have been properly tested (38%) and that the safety of chemical substances has
improved over the last 10 years (39%).
FLASH EUROBAROMETER 361 “Chemicals”
69
They are also more likely to disagree with the statement that it is possible to completely
eliminate chemical substances from daily life (38%). Approximately half (52%) of those
who say they currently think the national authorities are currently responsible, go on to
state that in their opinion it should be the national authorities that ensure safety.
Those respondents that think that the manufacturers themselves are responsible for
ensuring chemical safety are also more likely to agree that new chemical substances can
improve the environment (45%), that chemical substances in the EU have been properly
tested (44%) but think that chemical substances have got less safe over the last 10
years (47%). Half (49%) of those who say they currently think the manufacturers
themselves are responsible, go on to state that in their opinion it should be the
manufacturers that carry out this work.
4.2 CONSUMER VIEW ON WHO SHOULD BE RESPONSIBLE FOR ENSURING THE
SAFETY OF CHEMICAL SUBSTANCES IN THE EU (Q8)
--Three fifths of Europeans think the manufacturers themselves should be
responsible for chemical safety—
When asked to state who they think should ensure the safety of chemical substances on
the EU market, aggregate results for the EU27 countries show that three fifths (60%)
think that the manufacturers themselves should have that role13. Slightly fewer (57%)
say that it should be done by the authorities of the European Union whilst around a half
(49%) say that the national authorities should ensure the safety of chemical substances
in the EU.
The most marked differences in the findings on this issue are by Member State.
13 Q8 And who do you think should be responsible for ensuring the safety of chemical substances on the EU market? Authorities of the European Union; National authorities; Manufacturers themselves; Other (DO NOT READ OUT); Nobody (DO NOT READ OUT); DK\NA.
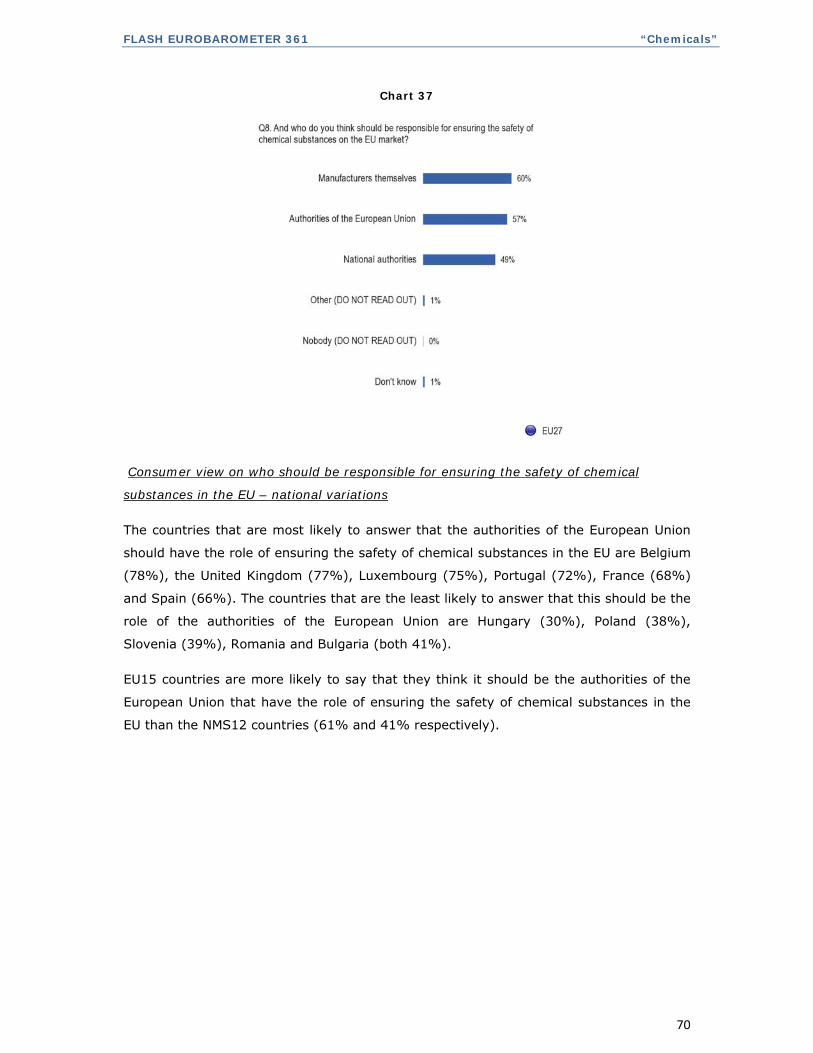
FLASH EUROBAROMETER 361 “Chemicals”
70
Chart 37
Consumer view on who should be responsible for ensuring the safety of chemical
substances in the EU – national variations
The countries that are most likely to answer that the authorities of the European Union
should have the role of ensuring the safety of chemical substances in the EU are Belgium
(78%), the United Kingdom (77%), Luxembourg (75%), Portugal (72%), France (68%)
and Spain (66%). The countries that are the least likely to answer that this should be the
role of the authorities of the European Union are Hungary (30%), Poland (38%),
Slovenia (39%), Romania and Bulgaria (both 41%).
EU15 countries are more likely to say that they think it should be the authorities of the
European Union that have the role of ensuring the safety of chemical substances in the
EU than the NMS12 countries (61% and 41% respectively).
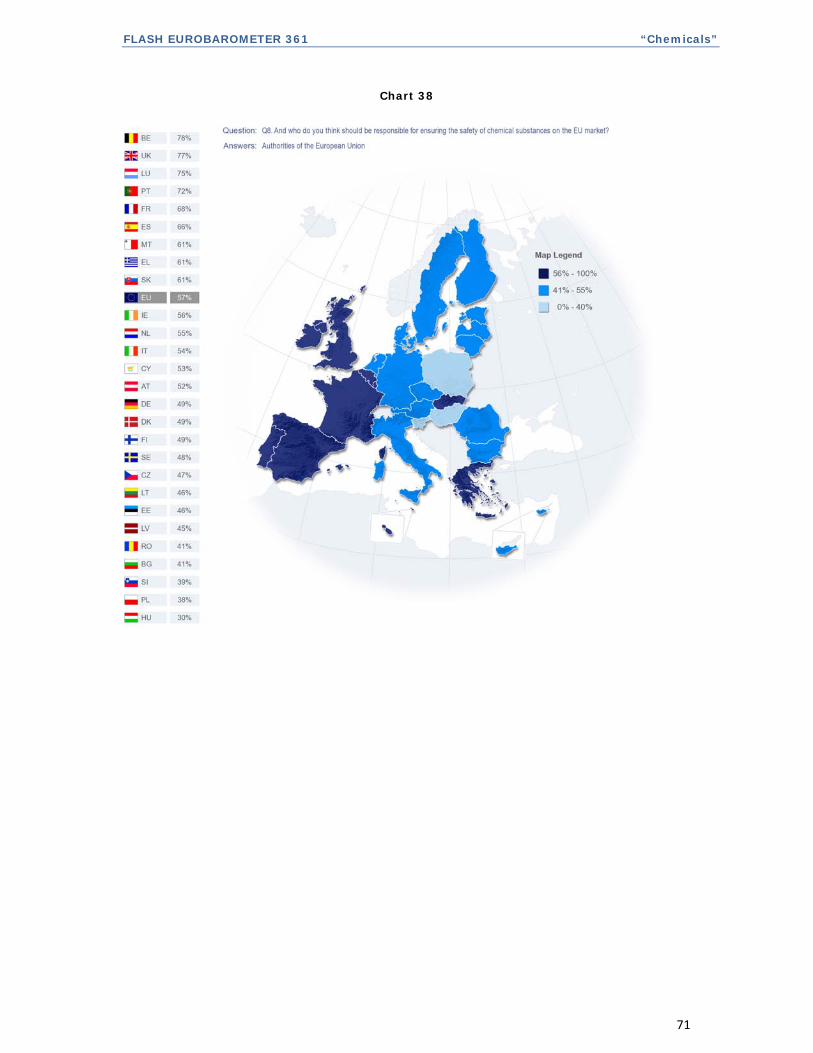
FLASH EUROBAROMETER 361 “Chemicals”
71
Chart 38
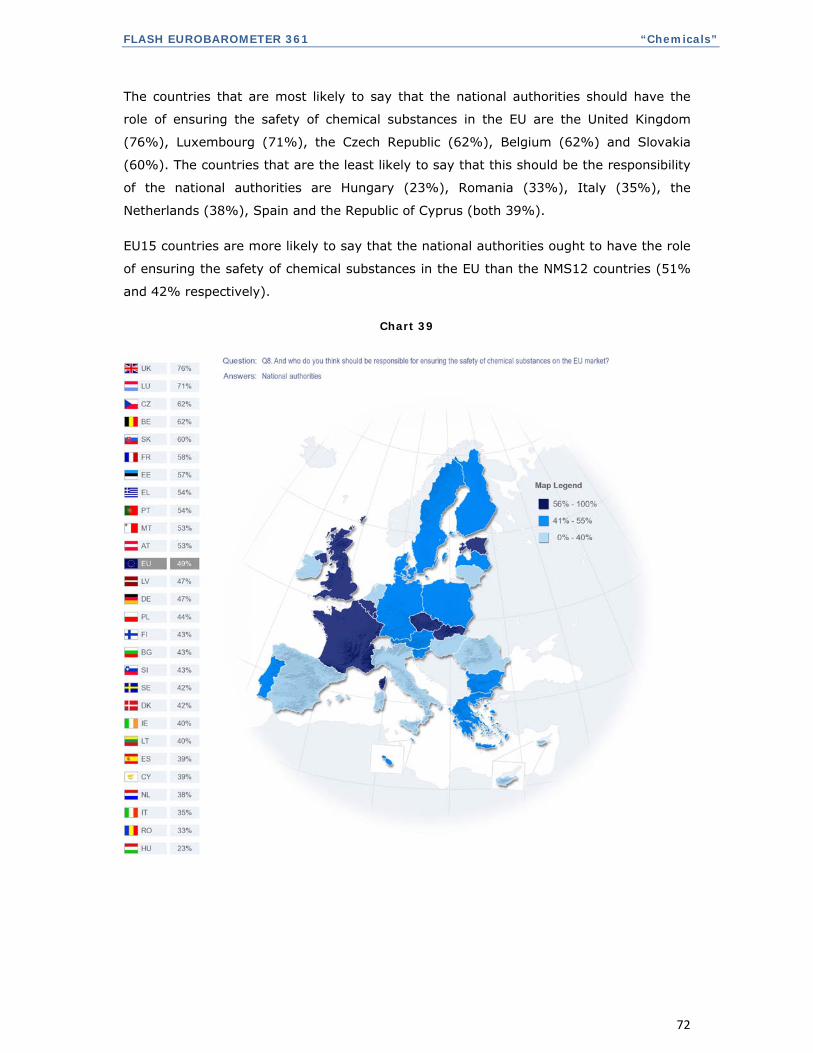
FLASH EUROBAROMETER 361 “Chemicals”
72
The countries that are most likely to say that the national authorities should have the
role of ensuring the safety of chemical substances in the EU are the United Kingdom
(76%), Luxembourg (71%), the Czech Republic (62%), Belgium (62%) and Slovakia
(60%). The countries that are the least likely to say that this should be the responsibility
of the national authorities are Hungary (23%), Romania (33%), Italy (35%), the
Netherlands (38%), Spain and the Republic of Cyprus (both 39%).
EU15 countries are more likely to say that the national authorities ought to have the role
of ensuring the safety of chemical substances in the EU than the NMS12 countries (51%
and 42% respectively).
Chart 39
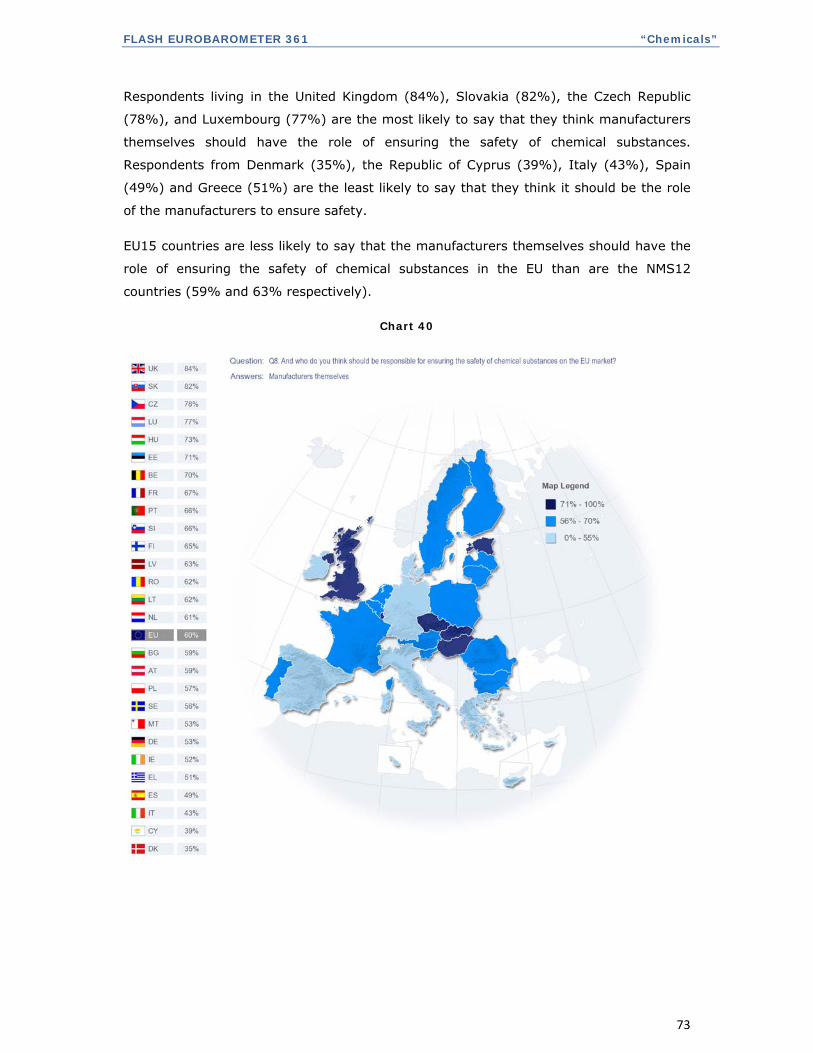
FLASH EUROBAROMETER 361 “Chemicals”
73
Respondents living in the United Kingdom (84%), Slovakia (82%), the Czech Republic
(78%), and Luxembourg (77%) are the most likely to say that they think manufacturers
themselves should have the role of ensuring the safety of chemical substances.
Respondents from Denmark (35%), the Republic of Cyprus (39%), Italy (43%), Spain
(49%) and Greece (51%) are the least likely to say that they think it should be the role
of the manufacturers to ensure safety.
EU15 countries are less likely to say that the manufacturers themselves should have the
role of ensuring the safety of chemical substances in the EU than are the NMS12
countries (59% and 63% respectively).
Chart 40
FLASH EUROBAROMETER 361 “Chemicals”
74
Consumer view on who should be responsible for ensuring the safety of chemical
substances in the EU – socio-demographic and attitudinal variations
Analysis of the findings for this question by socio-demographic groups indicates that
women are more likely than men to say that the manufacturers themselves should be
responsible (64% women versus 56% men). However men are slightly more likely than
women to say that the national authorities should ensure safety (51% men, 48%
women).
Those aged under the age of 39 years old are more likely to hold the view that the
manufacturers themselves should ensure the safety of chemical substances (64% of 15-
24 year olds and 63% of 25-39 year olds) than their older counterparts (61% of 40-54
year olds and 56% of those aged 55+).
Those that live in a rural village are more likely to say it should be the manufacturers
themselves who ensure safety (63%) compared to those that live in small or mid-size
towns (59%) and those that live in large towns (58%).
Respondents who believe that the European authorities ought to be responsible for
ensuring chemical safety are also more likely to agree that new chemical substances can
improve the environment (58%), that chemical substances in the EU have been properly
tested (59%) and that the safety of chemical substances has improved over the last 10
years (61%). Two thirds (65%) of those who say they think the authorities of the
European Union should be responsible also say that the national authorities should have
a role too, whilst 54% of those that say it should be the role of the European authorities
also say that the manufacturers should play a part too.
Respondents that say that they think that the national authorities should be responsible
for ensuring chemical safety are also more likely to agree that new chemical substances
can improve the environment (50%). They are also more likely to disagree with the
statement that it is possible to completely eliminate chemical substances from daily life
(51%). Approximately half (52%) of those who say they think the national authorities
should be responsible also say that the manufacturers should have a role and slightly
greater numbers (56%) also say that the European authorities should help to ensure
chemical safety.
FLASH EUROBAROMETER 361 “Chemicals”
75
Those respondents who think that the manufacturers themselves should be responsible
for ensuring chemical safety are also more likely to agree that new chemical substances
can improve the environment (61%), and that chemical substances in the EU have been
properly tested (61%). Two thirds (63%) of those who say they think the manufacturers
should be responsible, go on to state that in their opinion, the national authorities also
should have a role, whilst 56% of this group say that the European authorities should be
involved as well.
Respondents who say that responsibility for the safety of chemical substances currently
lies with the EU authorities are more likely to believe that the authorities of the European
Union should be responsible for ensuring chemical safety (70%) than are those who think
National authorities and manufacturers are currently responsible for ensuring safety
(65% and 58% respectively).

ANNEXES

TECHNICAL SPECIFICATIONS

TS1
FLASH EUROBAROMETER 361
“Chemicals”
TECHNICAL SPECIFICATIONS
Between the 1 and the 4 of October 2012, TNS Political & Social, a consortium created between TNS
political & social, TNS UK and TNS opinion, carried out the survey FLASH EUROBAROMETER 361 about
“Chemicals”.
This survey has been requested by the EUROPEAN COMMISSION, Directorate -General Enterprise and
industry. It is a general public survey co-ordinated by the Directorate-General for Communication
(“Research and Speechwriting” Unit). The FLASH EUROBAROMETER 361 covers the population of the
respective nationalities of the European Union Member States, resident in each of the 27 Member States
and aged 15 years and over. All interviews were carried using the TNS e-Call center (our centralized
CATI system). In every country respondents were called both on fixed lines and mobile phones. The
basic sample design applied in all states is multi-stage random (probability). In each household, the
respondent was drawn at random following the "last birthday rule".
TNS has developed its own RDD sample generation capabilities based on using contact telephone
numbers from responders to random probability or random location face to face surveys, such as
Eurobarometer, as seed numbers. The approach works because the seed number identifies a working
block of telephone numbers and reduces the volume of numbers generated that will be ineffective. The
seed numbers are stratified by NUTS2 region and urbanisation to approximate a geographically
representative sample. From each seed number the required sample of numbers are generated by
randomly replacing the last two digits. The sample is then screened against business databases in order
to exclude as many of these numbers as possible before going into field. This approach is consistent
across all countries.
A comparison between the sample and the universe was carried out. The Universe description was
derived from the national statistics office. The weighting procedure, using marginal and intercellular
weighting, was carried out based on this Universe description. Gender, age, region, social class and the
vote in the referendum on the Stability Treaty were introduced in the iteration procedure.
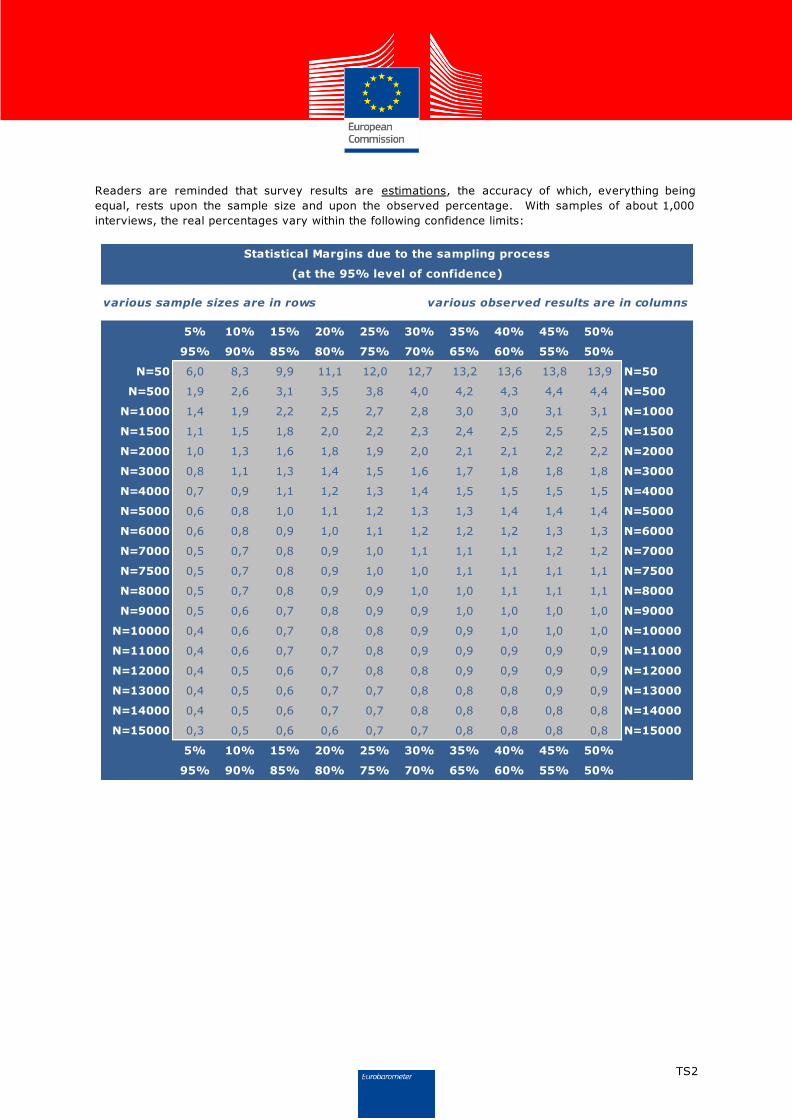
TS2
Readers are reminded that survey results are estimations, the accuracy of which, everything being
equal, rests upon the sample size and upon the observed percentage. With samples of about 1,000
interviews, the real percentages vary within the following confidence limits:
various sample sizes are in rows various observed results are in columns
5% 10% 15% 20% 25% 30% 35% 40% 45% 50%
95% 90% 85% 80% 75% 70% 65% 60% 55% 50%
N=50 6,0 8,3 9,9 11,1 12,0 12,7 13,2 13,6 13,8 13,9 N=50
N=500 1,9 2,6 3,1 3,5 3,8 4,0 4,2 4,3 4,4 4,4 N=500
N=1000 1,4 1,9 2,2 2,5 2,7 2,8 3,0 3,0 3,1 3,1 N=1000
N=1500 1,1 1,5 1,8 2,0 2,2 2,3 2,4 2,5 2,5 2,5 N=1500
N=2000 1,0 1,3 1,6 1,8 1,9 2,0 2,1 2,1 2,2 2,2 N=2000
N=3000 0,8 1,1 1,3 1,4 1,5 1,6 1,7 1,8 1,8 1,8 N=3000
N=4000 0,7 0,9 1,1 1,2 1,3 1,4 1,5 1,5 1,5 1,5 N=4000
N=5000 0,6 0,8 1,0 1,1 1,2 1,3 1,3 1,4 1,4 1,4 N=5000
N=6000 0,6 0,8 0,9 1,0 1,1 1,2 1,2 1,2 1,3 1,3 N=6000
N=7000 0,5 0,7 0,8 0,9 1,0 1,1 1,1 1,1 1,2 1,2 N=7000
N=7500 0,5 0,7 0,8 0,9 1,0 1,0 1,1 1,1 1,1 1,1 N=7500
N=8000 0,5 0,7 0,8 0,9 0,9 1,0 1,0 1,1 1,1 1,1 N=8000
N=9000 0,5 0,6 0,7 0,8 0,9 0,9 1,0 1,0 1,0 1,0 N=9000
N=10000 0,4 0,6 0,7 0,8 0,8 0,9 0,9 1,0 1,0 1,0 N=10000
N=11000 0,4 0,6 0,7 0,7 0,8 0,9 0,9 0,9 0,9 0,9 N=11000
N=12000 0,4 0,5 0,6 0,7 0,8 0,8 0,9 0,9 0,9 0,9 N=12000
N=13000 0,4 0,5 0,6 0,7 0,7 0,8 0,8 0,8 0,9 0,9 N=13000
N=14000 0,4 0,5 0,6 0,7 0,7 0,8 0,8 0,8 0,8 0,8 N=14000
N=15000 0,3 0,5 0,6 0,6 0,7 0,7 0,8 0,8 0,8 0,8 N=15000
5% 10% 15% 20% 25% 30% 35% 40% 45% 50%
95% 90% 85% 80% 75% 70% 65% 60% 55% 50%
Statistical Margins due to the sampling process
(at the 95% level of confidence)
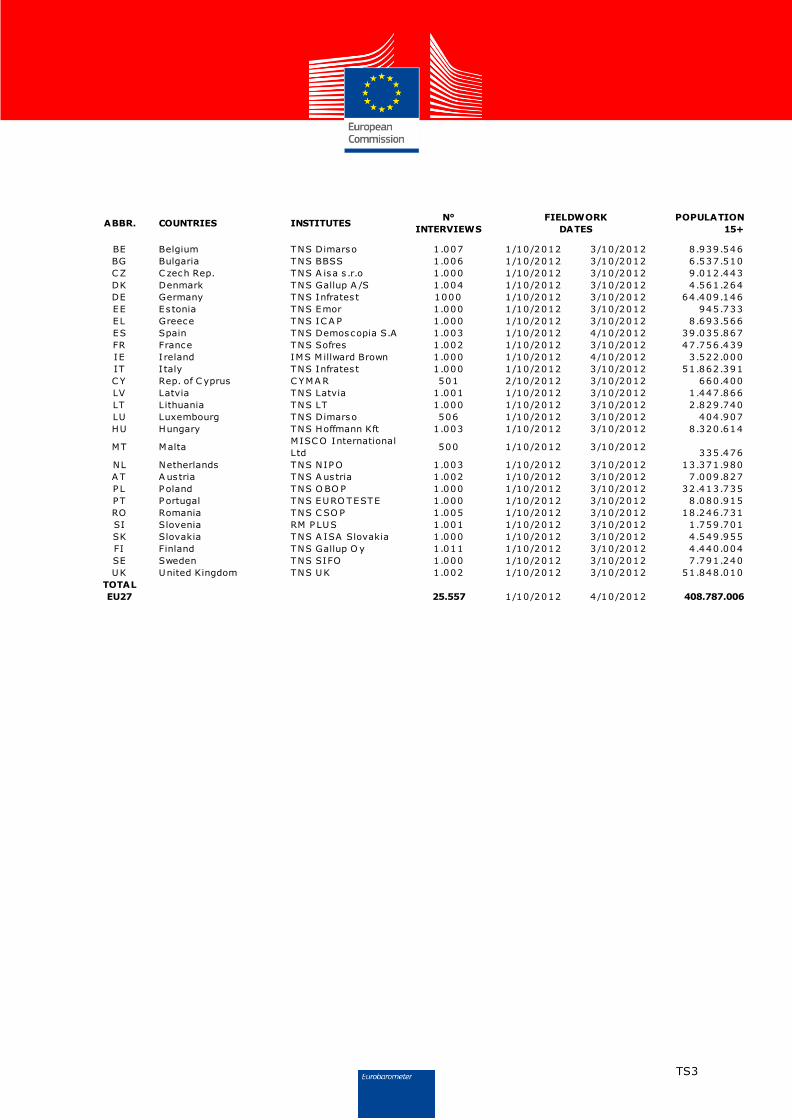
TS3
ABBR. COUNTRIES INSTITUTES N°
INTERVIEWS
FIELDWORK
DATES
POPULATION
15+
BE Belgium TNS Dimarso 1 .007 1/10/2012 3/10/2012 8 .939.546
BG Bulgaria TNS BBSS 1 .006 1/10/2012 3/10/2012 6 .537.510
C Z C zech Rep. TNS A isa s .r.o 1 .000 1/10/2012 3/10/2012 9 .012.443
DK Denmark TNS Gallup A /S 1 .004 1/10/2012 3/10/2012 4 .561.264
DE Germany TNS Infrates t 1000 1/10/2012 3/10/2012 64.409.146
EE Es tonia TNS Emor 1 .000 1/10/2012 3/10/2012 945.733
EL Greece TNS IC A P 1 .000 1/10/2012 3/10/2012 8 .693.566
ES Spain TNS Demoscopia S.A 1 .003 1/10/2012 4/10/2012 39.035.867
FR France TNS Sofres 1 .002 1/10/2012 3/10/2012 47.756.439
IE I reland IMS M illward Brown 1 .000 1/10/2012 4/10/2012 3 .522.000
IT I taly TNS Infrates t 1 .000 1/10/2012 3/10/2012 51.862.391
C Y Rep. of C yprus C YMA R 501 2/10/2012 3/10/2012 660.400
LV Latvia TNS Latvia 1 .001 1/10/2012 3/10/2012 1 .447.866
LT Lithuania TNS LT 1 .000 1/10/2012 3/10/2012 2 .829.740
LU Luxembourg TNS Dimarso 506 1/10/2012 3/10/2012 404.907
HU Hungary TNS Hoffmann Kft 1 .003 1/10/2012 3/10/2012 8 .320.614
MT Malta MISC O International
Ltd 500 1/10/2012 3/10/2012
335.476
NL Netherlands TNS NIPO 1 .003 1/10/2012 3/10/2012 13.371.980
A T A us tria TNS A us tria 1 .002 1/10/2012 3/10/2012 7 .009.827
P L P oland TNS O BO P 1 .000 1/10/2012 3/10/2012 32.413.735
P T P ortugal TNS EURO TESTE 1 .000 1/10/2012 3/10/2012 8 .080.915
RO Romania TNS C SO P 1 .005 1/10/2012 3/10/2012 18.246.731
SI Slovenia RM P LUS 1 .001 1/10/2012 3/10/2012 1 .759.701
SK Slovakia TNS A ISA Slovakia 1 .000 1/10/2012 3/10/2012 4 .549.955
FI Finland TNS Gallup O y 1 .011 1/10/2012 3/10/2012 4 .440.004
SE Sweden TNS SIFO 1 .000 1/10/2012 3/10/2012 7 .791.240
UK United Kingdom TNS UK 1 .002 1/10/2012 3/10/2012 51.848.010
TOTAL
EU27
25.557 1/10/2012 4/10/2012 408.787.006

QUESTIONNAIRE

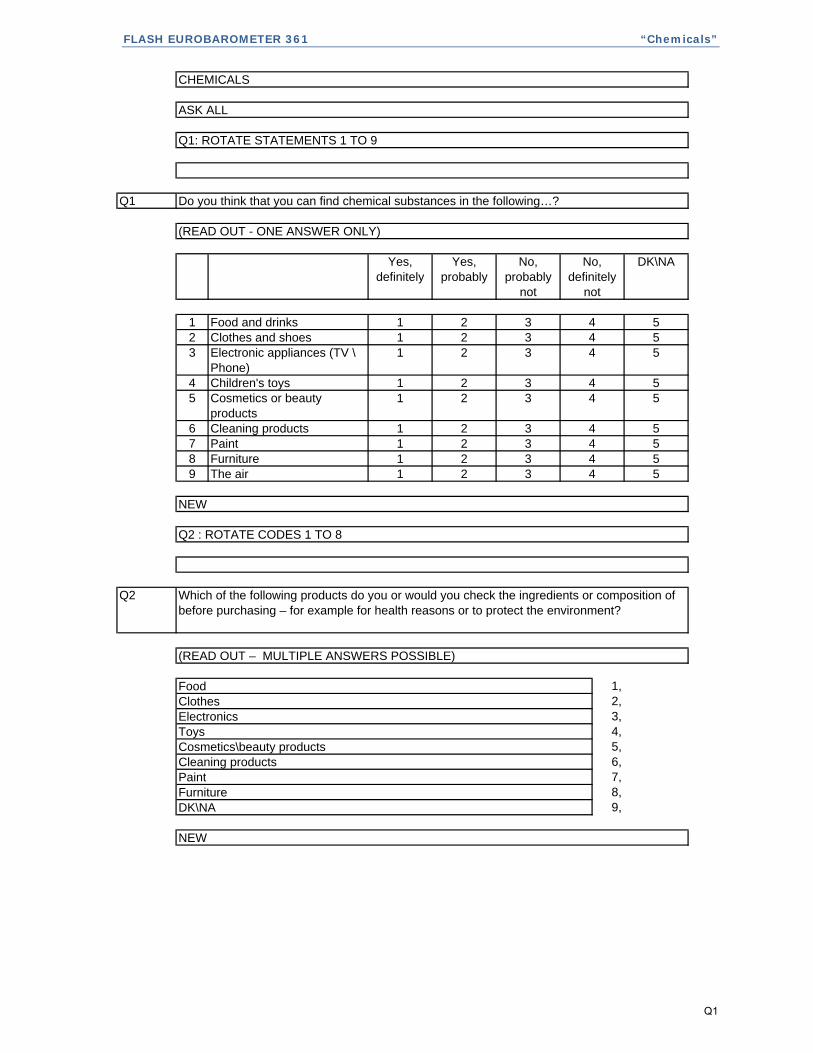
FLASH EUROBAROMETER 361 “Chemicals”
Q1
123
45
6789
Q2
1,2,3,4,5,6,7,8,9,
CHEMICALS
ASK ALL
Q1: ROTATE STATEMENTS 1 TO 9
Do you think that you can find chemical substances in the following…?
(READ OUT - ONE ANSWER ONLY)
Yes, definitely
Yes, probably
No, probably
not
No, definitely
not
DK\NA
Food and drinks 1 2 3 4 5Clothes and shoes 1 2 3 4 5Electronic appliances (TV \ Phone)
1 2 3 4 5
Children's toys 1 2 3 4 5Cosmetics or beauty products
1 2 3 4 5
Cleaning products 1 2 3 4 5Paint 1 2 3 4 5Furniture 1 2 3 4 5The air 1 2 3 4 5
NEW
Q2 : ROTATE CODES 1 TO 8
Which of the following products do you or would you check the ingredients or composition of before purchasing – for example for health reasons or to protect the environment?
(READ OUT – MULTIPLE ANSWERS POSSIBLE)
FoodClothesElectronicsToys Cosmetics\beauty products Cleaning productsPaintFurnitureDK\NA
NEW
Q1
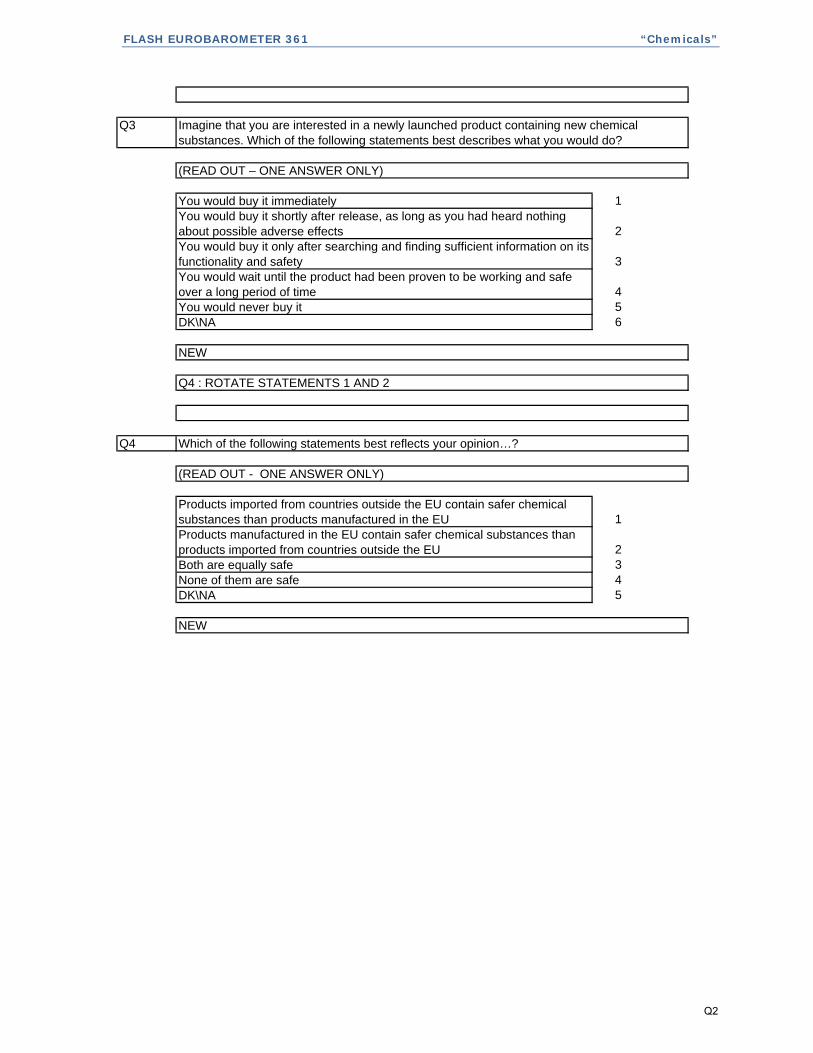
FLASH EUROBAROMETER 361 “Chemicals”
Q3
1
2
3
456
Q4
1
2345
Imagine that you are interested in a newly launched product containing new chemical substances. Which of the following statements best describes what you would do?
(READ OUT – ONE ANSWER ONLY)
You would buy it immediatelyYou would buy it shortly after release, as long as you had heard nothing about possible adverse effectsYou would buy it only after searching and finding sufficient information on its functionality and safety You would wait until the product had been proven to be working and safe over a long period of timeYou would never buy itDK\NA
NEW
Q4 : ROTATE STATEMENTS 1 AND 2
Which of the following statements best reflects your opinion…?
(READ OUT - ONE ANSWER ONLY)
Products imported from countries outside the EU contain safer chemical substances than products manufactured in the EUProducts manufactured in the EU contain safer chemical substances than products imported from countries outside the EUBoth are equally safeNone of them are safeDK\NA
NEW
Q2
FLASH EUROBAROMETER 361 “Chemicals”
Q5
123456
Q6
1
2
3
4
5
Would you say that the chemical substances on the EU market today are safer or less safe than they were 10 years ago?
(READ OUT – ONE ANSWER ONLY)
Much saferSaferThere is no changeLess safeMuch less safeDK\NA
NEW
Q6 : ROTATE STATEMENTS 1 TO 5
ITEMS 2 TO 5 ARE SPECIFICALLY ABOUT NEW CHEMICAL SUBSTANCES
Do you agree or not with each of the following statements?
(READ OUT - ONE ANSWER ONLY)
Strongly agree
Tend to agree
Tend to disagree
Strongly disagree
DK\NA
It is possible to completely eliminate chemical substances from our daily life
1 2 3 4 5
New chemical substances can help in reducing the use of natural resources
1 2 3 4 5
New chemical substances can help in contributing to a better environment
1 2 3 4 5
New chemical substances are involved in most industrial innovations
1 2 3 4 5
In the EU, any products containing new chemical substances have been properly tested
1 2 3 4 5
NEW
Q3

FLASH EUROBAROMETER 361 “Chemicals”
Q7
1,2,3,4,5,6,
Q8
1,2,3,4,5,6,
CODE 5 'Nobody (DO NOT READ OUT)' IS A SINGLE CODE
Today, in the EU, do you think that the safety of chemical substances is ensured by…?
(READ OUT – MULTIPLE ANSWERS POSSIBLE)
Authorities of the European Union
National authorities
National authoritiesManufacturers themselvesOther (DO NOT READ OUT)Nobody (DO NOT READ OUT)DK\NA
NEW
Manufacturers themselvesOther (DO NOT READ OUT)Nobody (DO NOT READ OUT)DK\NA
NEW
CODE 5 'Nobody (DO NOT READ OUT)' IS A SINGLE CODE
And who do you think should be responsible for ensuring the safety of chemical substances on the EU market?
(READ OUT – MULTIPLE ANSWERS POSSIBLE)
Authorities of the European Union
Q4

TABLES


FLASH EUROBAROMETER 361 “Chemicals”
%
EU 27
BE
BG
CZ
DK
DE
EE
IE
EL
ES
FR
IT
CY
LV
LT
LU
HU
MT
NL
AT
PL
PT
RO
SI
SK
FI
SE
UK
9
2 84 1446 38 11 3
59 31 7 2 1 90
905 4
2 79 19
24
45 34 15 4
1
9
9
55 30 10 4 1 85 14
66
62 28 5 4 1 90
8311 4
2 75 23
34
31 44 17 6
2
28
15
55 37 6 1 1 92 7
49
36 35 22 6 1 71
7914 7
6 73 21
41
40 33 14 7
0
8
21
46 36 12 5 1 82 17
38
63 27 6 2 2 90
7913 5
0 92 8
39
53 39 5 3
3
13
18
49 38 9 2 2 87 11
40
39 47 9 4 1 86
868 4
1 75 24
34
36 39 18 6
2
5
12
64 29 4 2 1 93 6
52
58 35 4 1 2 93
899 1
1 83 16
26
50 33 12 4
1
14
10
54 32 9 4 1 86 13
63
44 39 6 8 3 83
Gesamt 'Nein'
Flash EB
334
46 37 11
2 76 22
15
DK/NA
WN/KA
Flash EB
334
Flash EB
334
38 38 15 7
Total 'No'
Non,
absolument
pas
No, definitely
not
Nein, sicher
nicht
4 2 83
Total 'Yes'
Gesamt 'Ja'
Flash EB
334
No, probably
not
Nein,
wahrscheinlich
nicht
Flash EB
334
Yes, definitely
Ja, sicher
Flash EB
334
Oui,
probablement
Yes, probably
Ja,
wahrscheinlich
Flash EB
334
Q1.1 Denken Sie, dass sich chemische Stoffe in … finden lassen?
Lebensmitteln und Getränken
Oui,
absolument
Non,
probablement
pas
NSP/SR Total 'Non'Total 'Oui'
Q1.1 Selon vous, peut-on trouver des substances chimiques dans les choses suivantes... ?
Les aliments et boissons
Q1.1 Do you think that you can find chemical substances in the following…?
Food and drinks
T1
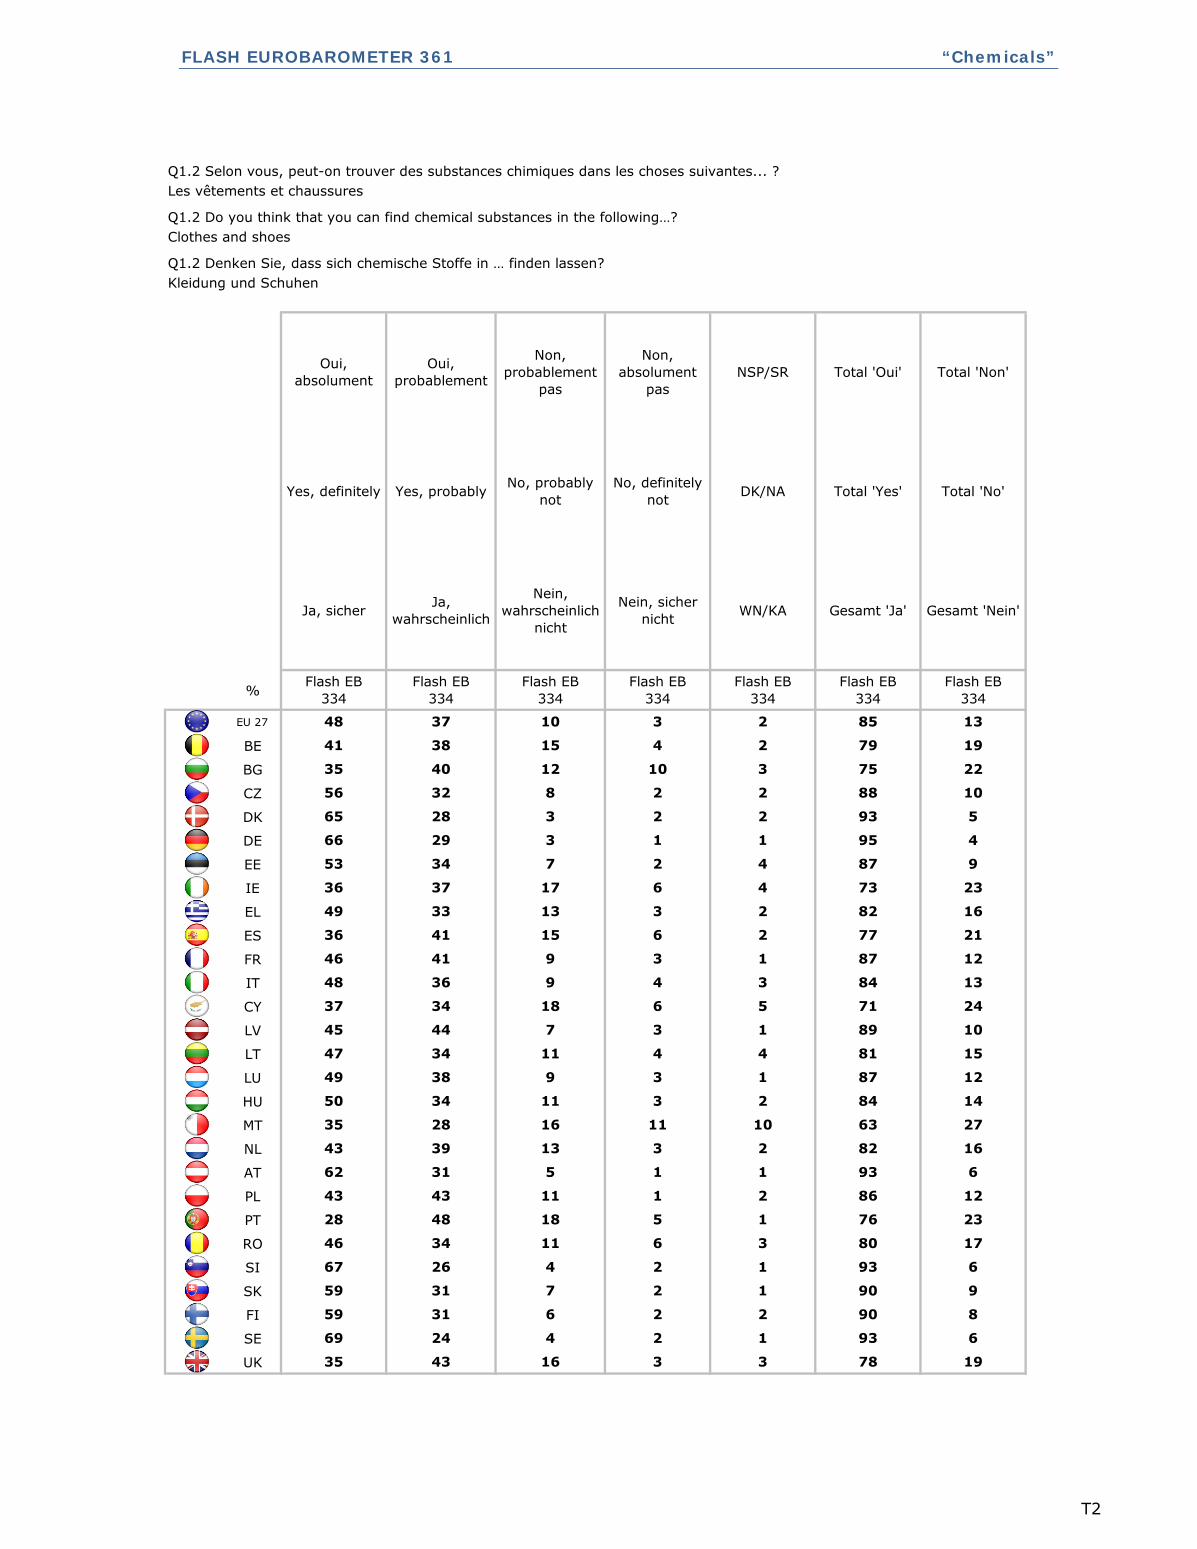
FLASH EUROBAROMETER 361 “Chemicals”
%
EU 27
BE
BG
CZ
DK
DE
EE
IE
EL
ES
FR
IT
CY
LV
LT
LU
HU
MT
NL
AT
PL
PT
RO
SI
SK
FI
SE
UK
6
3 78 1935 43 16 3
69 24 4 2 1 93
934 2
2 90 8
26
59 31 6 2
1
17
6
59 31 7 2 1 90 9
67
46 34 11 6 3 80
935 1
1 76 23
31
28 48 18 5
1
16
6
43 43 11 1 2 86 12
62
43 39 13 3 2 82
879 3
10 63 27
38
35 28 16 11
1
15
12
50 34 11 3 2 84 14
49
47 34 11 4 4 81
849 4
1 89 10
36
45 44 7 3
3
12
13
37 34 18 6 5 71 24
48
46 41 9 3 1 87
7317 6
2 77 21
37
36 41 15 6
4
9
23
49 33 13 3 2 82 16
36
53 34 7 2 4 87
888 2
1 95 4
32
66 29 3 1
2
22
10
65 28 3 2 2 93 5
56
35 40 12 10 3 75
Gesamt 'Nein'
Flash EB
334
48 37 10
2 79 19
13
DK/NA
WN/KA
Flash EB
334
Flash EB
334
41 38 15 4
Total 'No'
Non,
absolument
pas
No, definitely
not
Nein, sicher
nicht
3 2 85
Total 'Yes'
Gesamt 'Ja'
Flash EB
334
No, probably
not
Nein,
wahrscheinlich
nicht
Flash EB
334
Yes, definitely
Ja, sicher
Flash EB
334
Oui,
probablement
Yes, probably
Ja,
wahrscheinlich
Flash EB
334
Q1.2 Denken Sie, dass sich chemische Stoffe in … finden lassen?
Kleidung und Schuhen
Oui,
absolument
Non,
probablement
pas
NSP/SR Total 'Non'Total 'Oui'
Q1.2 Selon vous, peut-on trouver des substances chimiques dans les choses suivantes... ?
Les vêtements et chaussures
Q1.2 Do you think that you can find chemical substances in the following…?
Clothes and shoes
T2
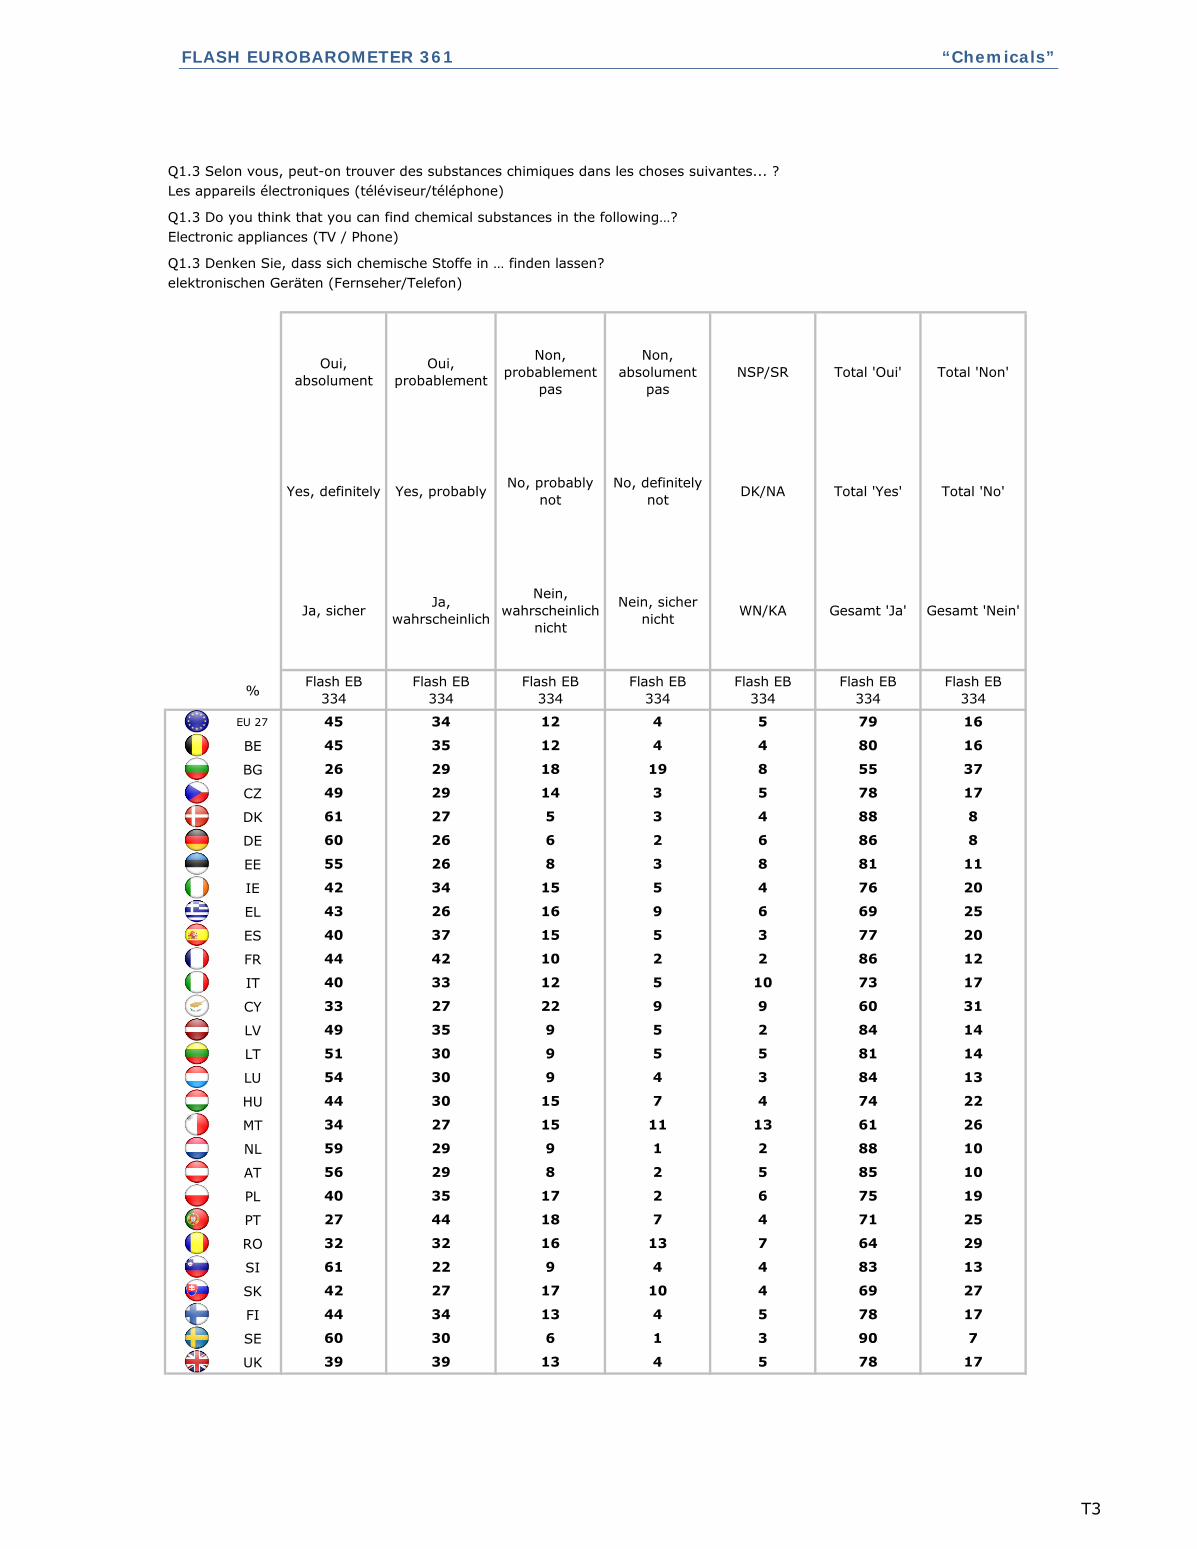
FLASH EUROBAROMETER 361 “Chemicals”
%
EU 27
BE
BG
CZ
DK
DE
EE
IE
EL
ES
FR
IT
CY
LV
LT
LU
HU
MT
NL
AT
PL
PT
RO
SI
SK
FI
SE
UK
7
5 78 1739 39 13 4
60 30 6 1 3 90
839 4
5 78 17
22
44 34 13 4
4
29
13
42 27 17 10 4 69 27
61
32 32 16 13 7 64
858 2
4 71 25
29
27 44 18 7
5
10
10
40 35 17 2 6 75 19
56
59 29 9 1 2 88
849 4
13 61 26
30
34 27 15 11
3
14
13
44 30 15 7 4 74 22
54
51 30 9 5 5 81
7312 5
2 84 14
33
49 35 9 5
10
12
17
33 27 22 9 9 60 31
40
44 42 10 2 2 86
7615 5
3 77 20
34
40 37 15 5
4
11
20
43 26 16 9 6 69 25
42
55 26 8 3 8 81
7814 3
6 86 8
29
60 26 6 2
5
37
17
61 27 5 3 4 88 8
49
26 29 18 19 8 55
Gesamt 'Nein'
Flash EB
334
45 34 12
4 80 16
16
DK/NA
WN/KA
Flash EB
334
Flash EB
334
45 35 12 4
Total 'No'
Non,
absolument
pas
No, definitely
not
Nein, sicher
nicht
4 5 79
Total 'Yes'
Gesamt 'Ja'
Flash EB
334
No, probably
not
Nein,
wahrscheinlich
nicht
Flash EB
334
Yes, definitely
Ja, sicher
Flash EB
334
Oui,
probablement
Yes, probably
Ja,
wahrscheinlich
Flash EB
334
Q1.3 Denken Sie, dass sich chemische Stoffe in … finden lassen?
elektronischen Geräten (Fernseher/Telefon)
Oui,
absolument
Non,
probablement
pas
NSP/SR Total 'Non'Total 'Oui'
Q1.3 Selon vous, peut-on trouver des substances chimiques dans les choses suivantes... ?
Les appareils électroniques (téléviseur/téléphone)
Q1.3 Do you think that you can find chemical substances in the following…?
Electronic appliances (TV / Phone)
T3
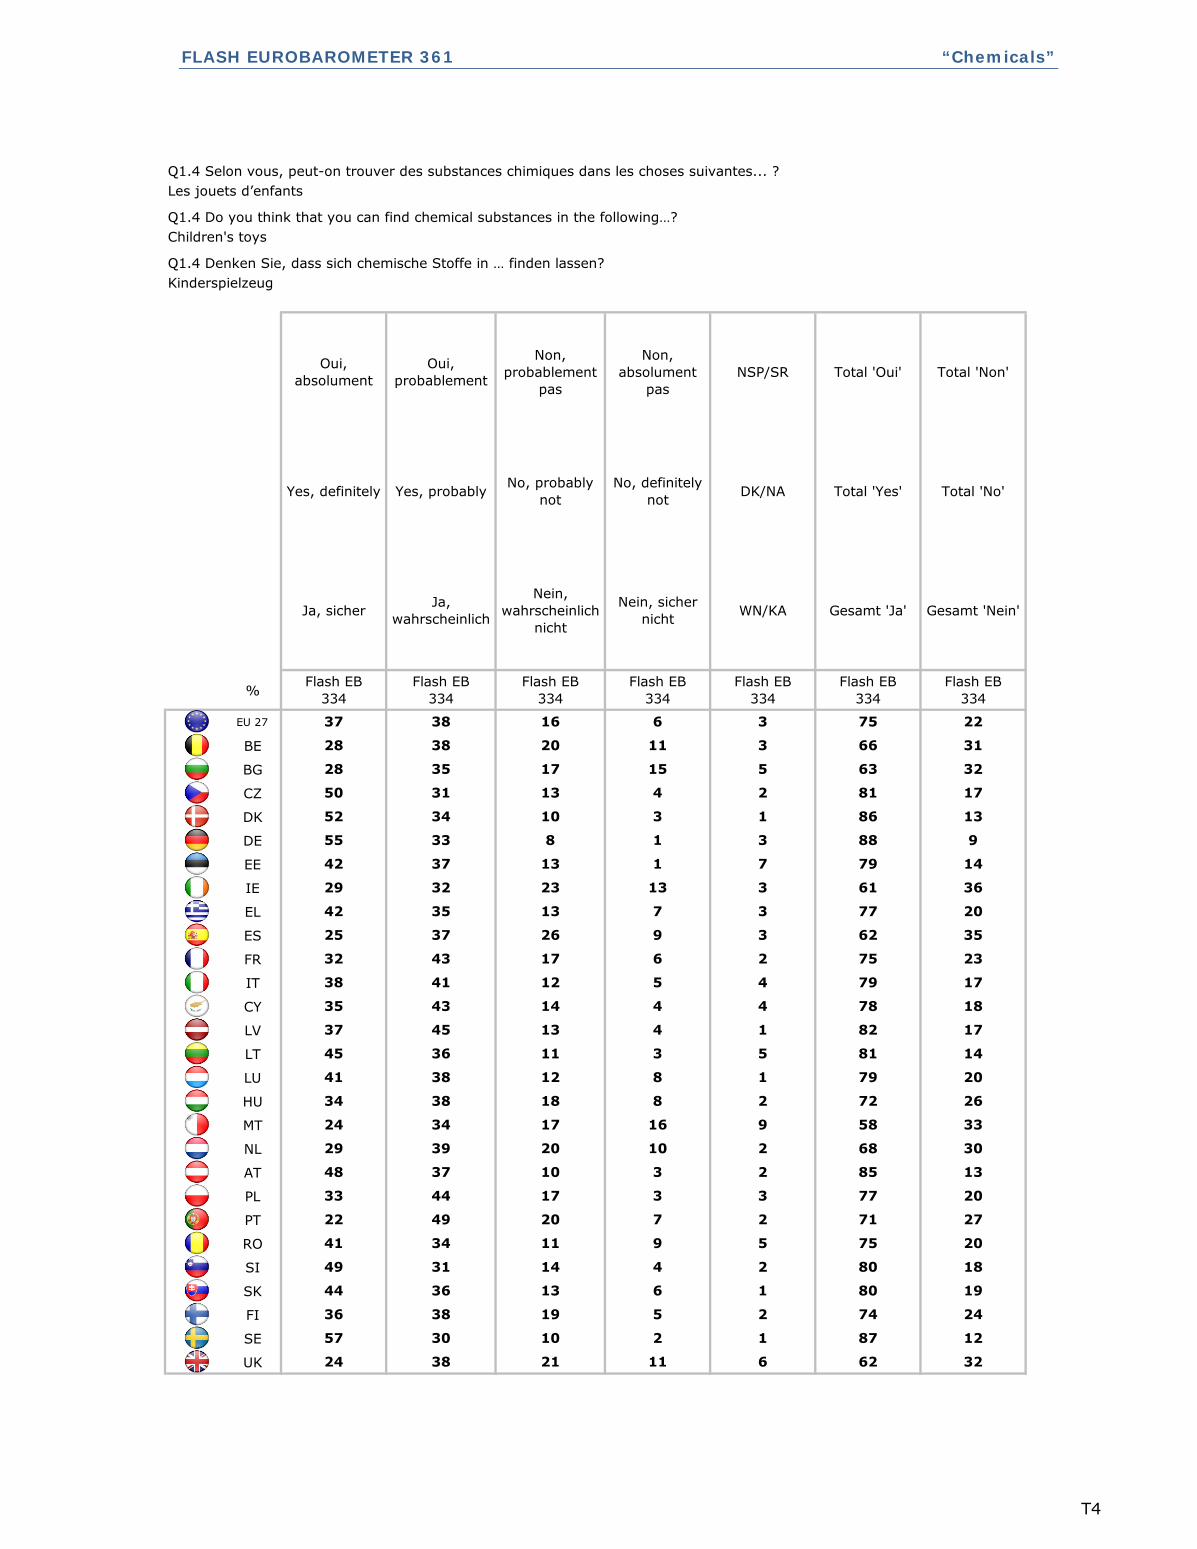
FLASH EUROBAROMETER 361 “Chemicals”
%
EU 27
BE
BG
CZ
DK
DE
EE
IE
EL
ES
FR
IT
CY
LV
LT
LU
HU
MT
NL
AT
PL
PT
RO
SI
SK
FI
SE
UK
12
6 62 3224 38 21 11
57 30 10 2 1 87
8014 4
2 74 24
31
36 38 19 5
2
20
18
44 36 13 6 1 80 19
49
41 34 11 9 5 75
8510 3
2 71 27
37
22 49 20 7
2
30
13
33 44 17 3 3 77 20
48
29 39 20 10 2 68
7912 8
9 58 33
38
24 34 17 16
1
14
20
34 38 18 8 2 72 26
41
45 36 11 3 5 81
7912 5
1 82 17
41
37 45 13 4
4
23
17
35 43 14 4 4 78 18
38
32 43 17 6 2 75
6123 13
3 62 35
32
25 37 26 9
3
14
36
42 35 13 7 3 77 20
29
42 37 13 1 7 79
8113 4
3 88 9
31
55 33 8 1
2
32
17
52 34 10 3 1 86 13
50
28 35 17 15 5 63
Gesamt 'Nein'
Flash EB
334
37 38 16
3 66 31
22
DK/NA
WN/KA
Flash EB
334
Flash EB
334
28 38 20 11
Total 'No'
Non,
absolument
pas
No, definitely
not
Nein, sicher
nicht
6 3 75
Total 'Yes'
Gesamt 'Ja'
Flash EB
334
No, probably
not
Nein,
wahrscheinlich
nicht
Flash EB
334
Yes, definitely
Ja, sicher
Flash EB
334
Oui,
probablement
Yes, probably
Ja,
wahrscheinlich
Flash EB
334
Q1.4 Denken Sie, dass sich chemische Stoffe in … finden lassen?
Kinderspielzeug
Oui,
absolument
Non,
probablement
pas
NSP/SR Total 'Non'Total 'Oui'
Q1.4 Selon vous, peut-on trouver des substances chimiques dans les choses suivantes... ?
Les jouets d’enfants
Q1.4 Do you think that you can find chemical substances in the following…?
Children's toys
T4
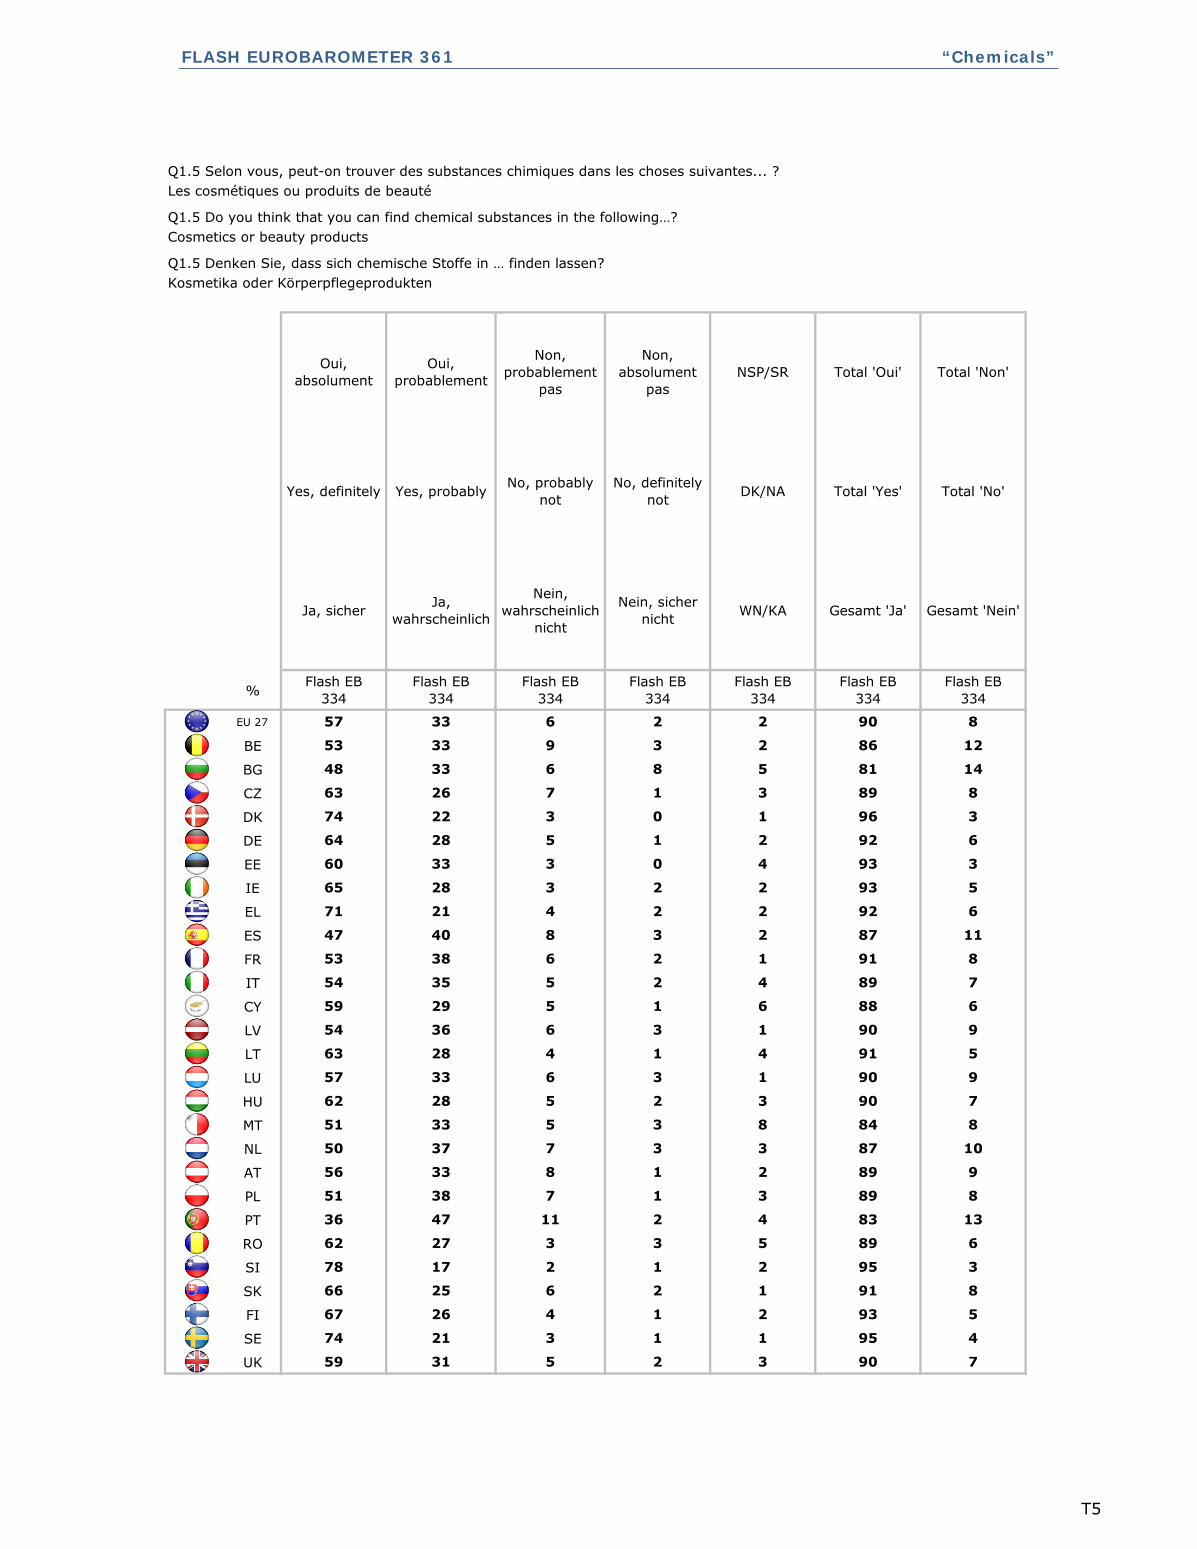
FLASH EUROBAROMETER 361 “Chemicals”
%
EU 27
BE
BG
CZ
DK
DE
EE
IE
EL
ES
FR
IT
CY
LV
LT
LU
HU
MT
NL
AT
PL
PT
RO
SI
SK
FI
SE
UK
4
3 90 759 31 5 2
74 21 3 1 1 95
952 1
2 93 5
17
67 26 4 1
2
6
3
66 25 6 2 1 91 8
78
62 27 3 3 5 89
898 1
4 83 13
33
36 47 11 2
2
10
9
51 38 7 1 3 89 8
56
50 37 7 3 3 87
906 3
8 84 8
33
51 33 5 3
1
5
9
62 28 5 2 3 90 7
57
63 28 4 1 4 91
895 2
1 90 9
35
54 36 6 3
4
8
7
59 29 5 1 6 88 6
54
53 38 6 2 1 91
933 2
2 87 11
28
47 40 8 3
2
3
5
71 21 4 2 2 92 6
65
60 33 3 0 4 93
897 1
2 92 6
26
64 28 5 1
3
14
8
74 22 3 0 1 96 3
63
48 33 6 8 5 81
Gesamt 'Nein'
Flash EB
334
57 33 6
2 86 12
8
DK/NA
WN/KA
Flash EB
334
Flash EB
334
53 33 9 3
Total 'No'
Non,
absolument
pas
No, definitely
not
Nein, sicher
nicht
2 2 90
Total 'Yes'
Gesamt 'Ja'
Flash EB
334
No, probably
not
Nein,
wahrscheinlich
nicht
Flash EB
334
Yes, definitely
Ja, sicher
Flash EB
334
Oui,
probablement
Yes, probably
Ja,
wahrscheinlich
Flash EB
334
Q1.5 Denken Sie, dass sich chemische Stoffe in … finden lassen?
Kosmetika oder Körperpflegeprodukten
Oui,
absolument
Non,
probablement
pas
NSP/SR Total 'Non'Total 'Oui'
Q1.5 Selon vous, peut-on trouver des substances chimiques dans les choses suivantes... ?
Les cosmétiques ou produits de beauté
Q1.5 Do you think that you can find chemical substances in the following…?
Cosmetics or beauty products
T5
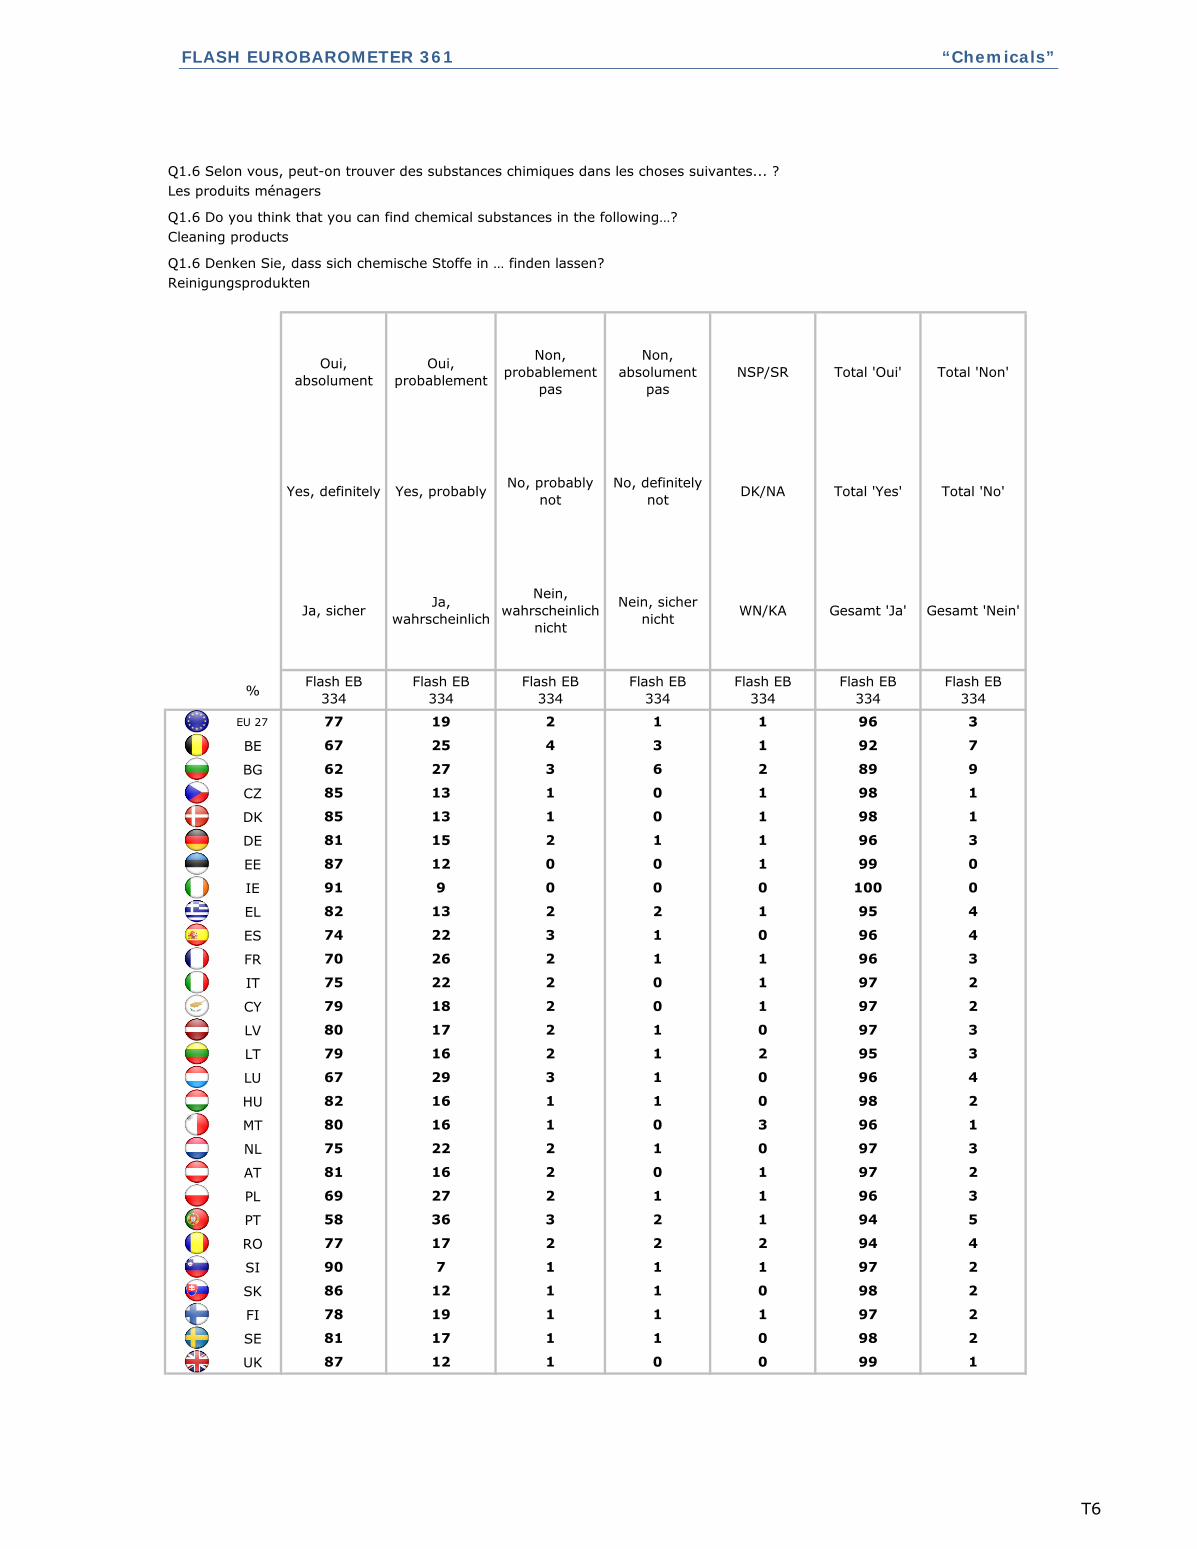
FLASH EUROBAROMETER 361 “Chemicals”
%
EU 27
BE
BG
CZ
DK
DE
EE
IE
EL
ES
FR
IT
CY
LV
LT
LU
HU
MT
NL
AT
PL
PT
RO
SI
SK
FI
SE
UK
2
0 99 187 12 1 0
81 17 1 1 0 98
971 1
1 97 2
7
78 19 1 1
1
4
2
86 12 1 1 0 98 2
90
77 17 2 2 2 94
972 0
1 94 5
16
58 36 3 2
1
3
2
69 27 2 1 1 96 3
81
75 22 2 1 0 97
963 1
3 96 1
29
80 16 1 0
0
3
4
82 16 1 1 0 98 2
67
79 16 2 1 2 95
972 0
0 97 3
22
80 17 2 1
1
3
2
79 18 2 0 1 97 2
75
70 26 2 1 1 96
1000 0
0 96 4
9
74 22 3 1
0
0
0
82 13 2 2 1 95 4
91
87 12 0 0 1 99
981 0
1 96 3
13
81 15 2 1
1
9
1
85 13 1 0 1 98 1
85
62 27 3 6 2 89
Gesamt 'Nein'
Flash EB
334
77 19 2
1 92 7
3
DK/NA
WN/KA
Flash EB
334
Flash EB
334
67 25 4 3
Total 'No'
Non,
absolument
pas
No, definitely
not
Nein, sicher
nicht
1 1 96
Total 'Yes'
Gesamt 'Ja'
Flash EB
334
No, probably
not
Nein,
wahrscheinlich
nicht
Flash EB
334
Yes, definitely
Ja, sicher
Flash EB
334
Oui,
probablement
Yes, probably
Ja,
wahrscheinlich
Flash EB
334
Q1.6 Denken Sie, dass sich chemische Stoffe in … finden lassen?
Reinigungsprodukten
Oui,
absolument
Non,
probablement
pas
NSP/SR Total 'Non'Total 'Oui'
Q1.6 Selon vous, peut-on trouver des substances chimiques dans les choses suivantes... ?
Les produits ménagers
Q1.6 Do you think that you can find chemical substances in the following…?
Cleaning products
T6
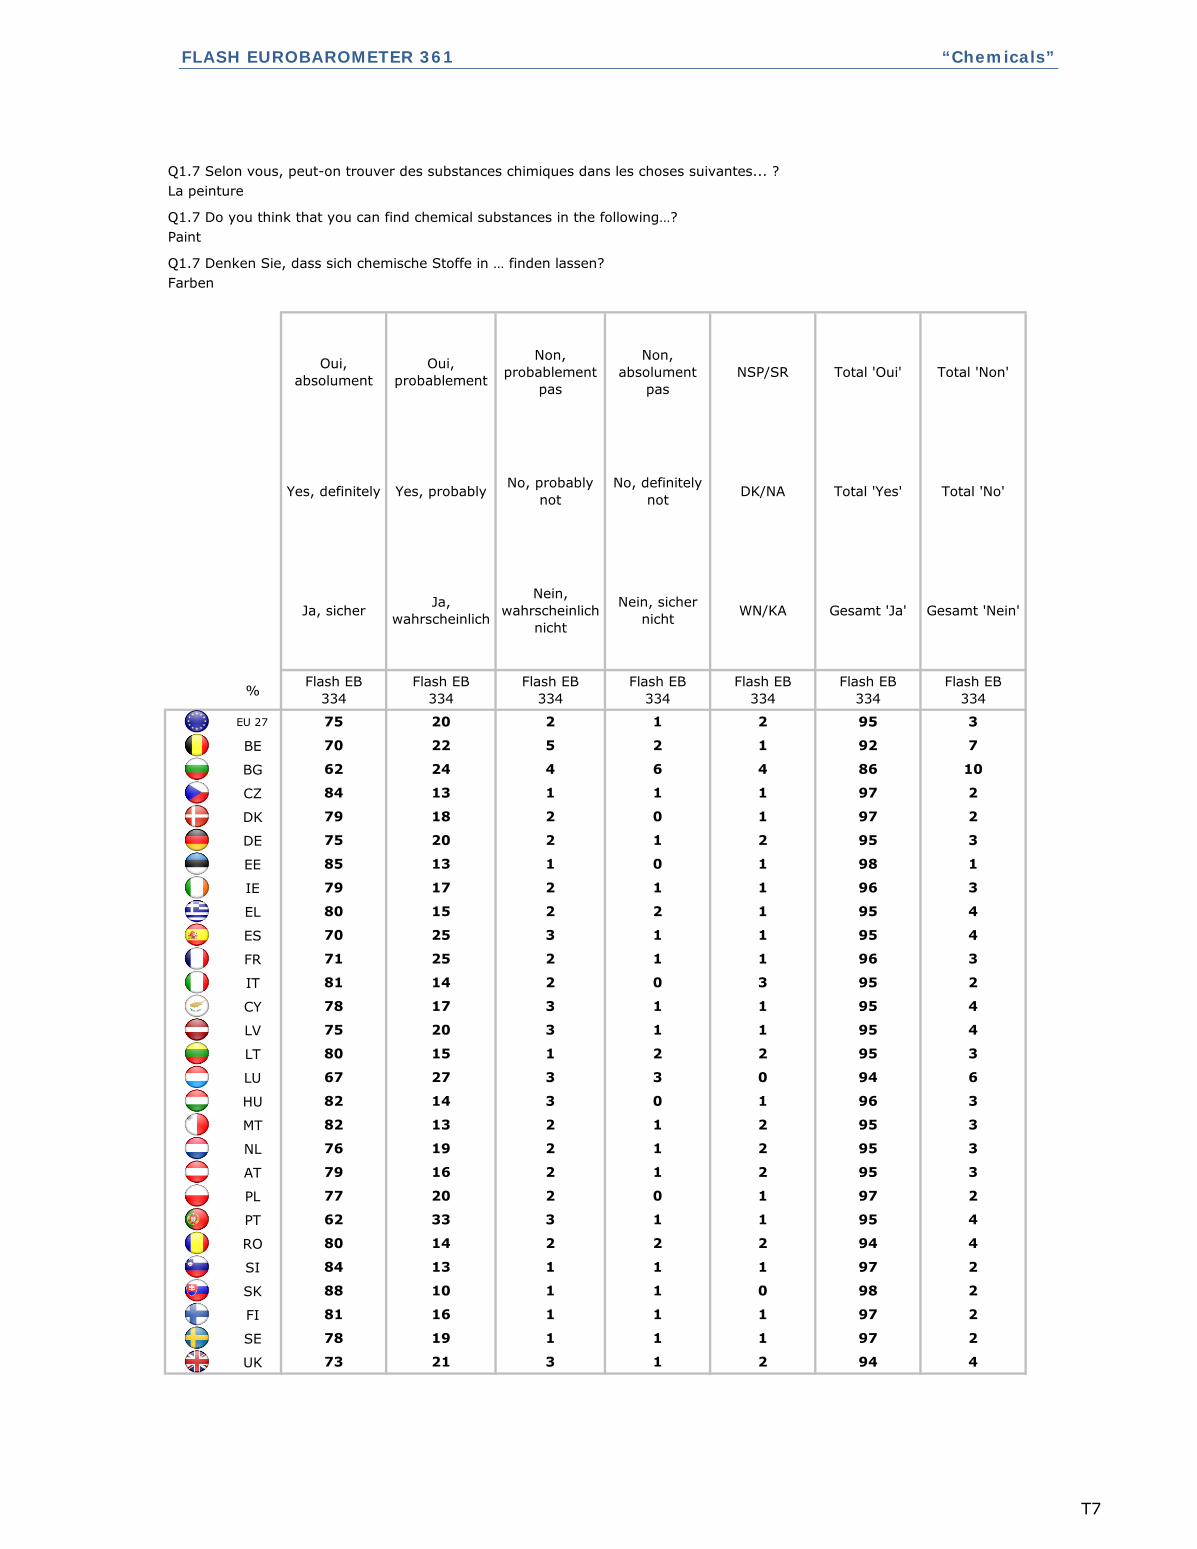
FLASH EUROBAROMETER 361 “Chemicals”
%
EU 27
BE
BG
CZ
DK
DE
EE
IE
EL
ES
FR
IT
CY
LV
LT
LU
HU
MT
NL
AT
PL
PT
RO
SI
SK
FI
SE
UK
2
2 94 473 21 3 1
78 19 1 1 1 97
971 1
1 97 2
13
81 16 1 1
1
4
2
88 10 1 1 0 98 2
84
80 14 2 2 2 94
952 1
1 95 4
16
62 33 3 1
2
3
3
77 20 2 0 1 97 2
79
76 19 2 1 2 95
943 3
2 95 3
27
82 13 2 1
0
3
6
82 14 3 0 1 96 3
67
80 15 1 2 2 95
952 0
1 95 4
14
75 20 3 1
3
3
2
78 17 3 1 1 95 4
81
71 25 2 1 1 96
962 1
1 95 4
17
70 25 3 1
1
1
3
80 15 2 2 1 95 4
79
85 13 1 0 1 98
971 1
2 95 3
13
75 20 2 1
1
10
2
79 18 2 0 1 97 2
84
62 24 4 6 4 86
Gesamt 'Nein'
Flash EB
334
75 20 2
1 92 7
3
DK/NA
WN/KA
Flash EB
334
Flash EB
334
70 22 5 2
Total 'No'
Non,
absolument
pas
No, definitely
not
Nein, sicher
nicht
1 2 95
Total 'Yes'
Gesamt 'Ja'
Flash EB
334
No, probably
not
Nein,
wahrscheinlich
nicht
Flash EB
334
Yes, definitely
Ja, sicher
Flash EB
334
Oui,
probablement
Yes, probably
Ja,
wahrscheinlich
Flash EB
334
Q1.7 Denken Sie, dass sich chemische Stoffe in … finden lassen?
Farben
Oui,
absolument
Non,
probablement
pas
NSP/SR Total 'Non'Total 'Oui'
Q1.7 Selon vous, peut-on trouver des substances chimiques dans les choses suivantes... ?
La peinture
Q1.7 Do you think that you can find chemical substances in the following…?
Paint
T7

FLASH EUROBAROMETER 361 “Chemicals”
%
EU 27
BE
BG
CZ
DK
DE
EE
IE
EL
ES
FR
IT
CY
LV
LT
LU
HU
MT
NL
AT
PL
PT
RO
SI
SK
FI
SE
UK
13
3 71 2630 41 21 5
54 31 10 3 2 85
868 3
3 85 12
29
45 40 10 2
3
25
11
42 35 17 4 2 77 21
57
36 34 13 12 5 70
879 2
4 64 32
42
20 44 26 6
2
26
11
39 41 14 2 4 80 16
45
30 40 21 5 4 70
8111 6
8 71 21
47
41 30 12 9
2
20
17
37 36 16 8 3 73 24
34
42 32 14 6 6 74
7016 7
1 81 18
35
37 44 15 3
7
27
23
33 33 19 6 9 66 25
35
29 42 21 6 2 71
6821 8
4 63 33
38
27 36 25 8
3
13
29
42 32 16 6 4 74 22
30
46 37 11 2 4 83
8213 2
3 87 10
35
52 35 8 2
3
38
15
49 34 10 3 4 83 13
47
25 30 20 18 7 55
Gesamt 'Nein'
Flash EB
334
36 38 17
3 64 33
22
DK/NA
WN/KA
Flash EB
334
Flash EB
334
24 40 23 10
Total 'No'
Non,
absolument
pas
No, definitely
not
Nein, sicher
nicht
5 4 74
Total 'Yes'
Gesamt 'Ja'
Flash EB
334
No, probably
not
Nein,
wahrscheinlich
nicht
Flash EB
334
Yes, definitely
Ja, sicher
Flash EB
334
Oui,
probablement
Yes, probably
Ja,
wahrscheinlich
Flash EB
334
Q1.8 Denken Sie, dass sich chemische Stoffe in … finden lassen?
Möbeln
Oui,
absolument
Non,
probablement
pas
NSP/SR Total 'Non'Total 'Oui'
Q1.8 Selon vous, peut-on trouver des substances chimiques dans les choses suivantes... ?
Les meubles
Q1.8 Do you think that you can find chemical substances in the following…?
Furniture
T8

FLASH EUROBAROMETER 361 “Chemicals”
%
EU 27
BE
BG
CZ
DK
DE
EE
IE
EL
ES
FR
IT
CY
LV
LT
LU
HU
MT
NL
AT
PL
PT
RO
SI
SK
FI
SE
UK
6
2 87 1151 36 7 4
65 28 4 2 1 93
915 3
3 84 13
23
50 34 10 3
1
8
8
73 23 3 1 0 96 4
68
60 31 4 4 1 91
887 3
1 88 11
34
42 46 9 2
2
16
10
51 40 6 2 1 91 8
54
44 38 12 4 2 82
887 4
3 90 7
44
65 25 3 4
1
8
11
62 29 6 2 1 91 8
44
58 32 6 2 2 90
943 1
1 90 9
23
51 39 6 3
2
6
4
63 27 6 3 1 90 9
71
51 43 4 2 0 94
879 3
2 86 12
35
49 37 9 3
1
9
12
70 20 5 3 2 90 8
52
56 33 8 1 2 89
916 2
2 90 8
25
58 32 6 2
1
13
8
55 31 8 3 3 86 11
66
52 33 6 7 2 85
Gesamt 'Nein'
Flash EB
334
56 34 6
1 88 11
9
DK/NA
WN/KA
Flash EB
334
Flash EB
334
52 36 8 3
Total 'No'
Non,
absolument
pas
No, definitely
not
Nein, sicher
nicht
3 1 90
Total 'Yes'
Gesamt 'Ja'
Flash EB
334
No, probably
not
Nein,
wahrscheinlich
nicht
Flash EB
334
Yes, definitely
Ja, sicher
Flash EB
334
Oui,
probablement
Yes, probably
Ja,
wahrscheinlich
Flash EB
334
Q1.9 Denken Sie, dass sich chemische Stoffe in … finden lassen?
der Luft
Oui,
absolument
Non,
probablement
pas
NSP/SR Total 'Non'Total 'Oui'
Q1.9 Selon vous, peut-on trouver des substances chimiques dans les choses suivantes... ?
L’air
Q1.9 Do you think that you can find chemical substances in the following…?
The air
T9
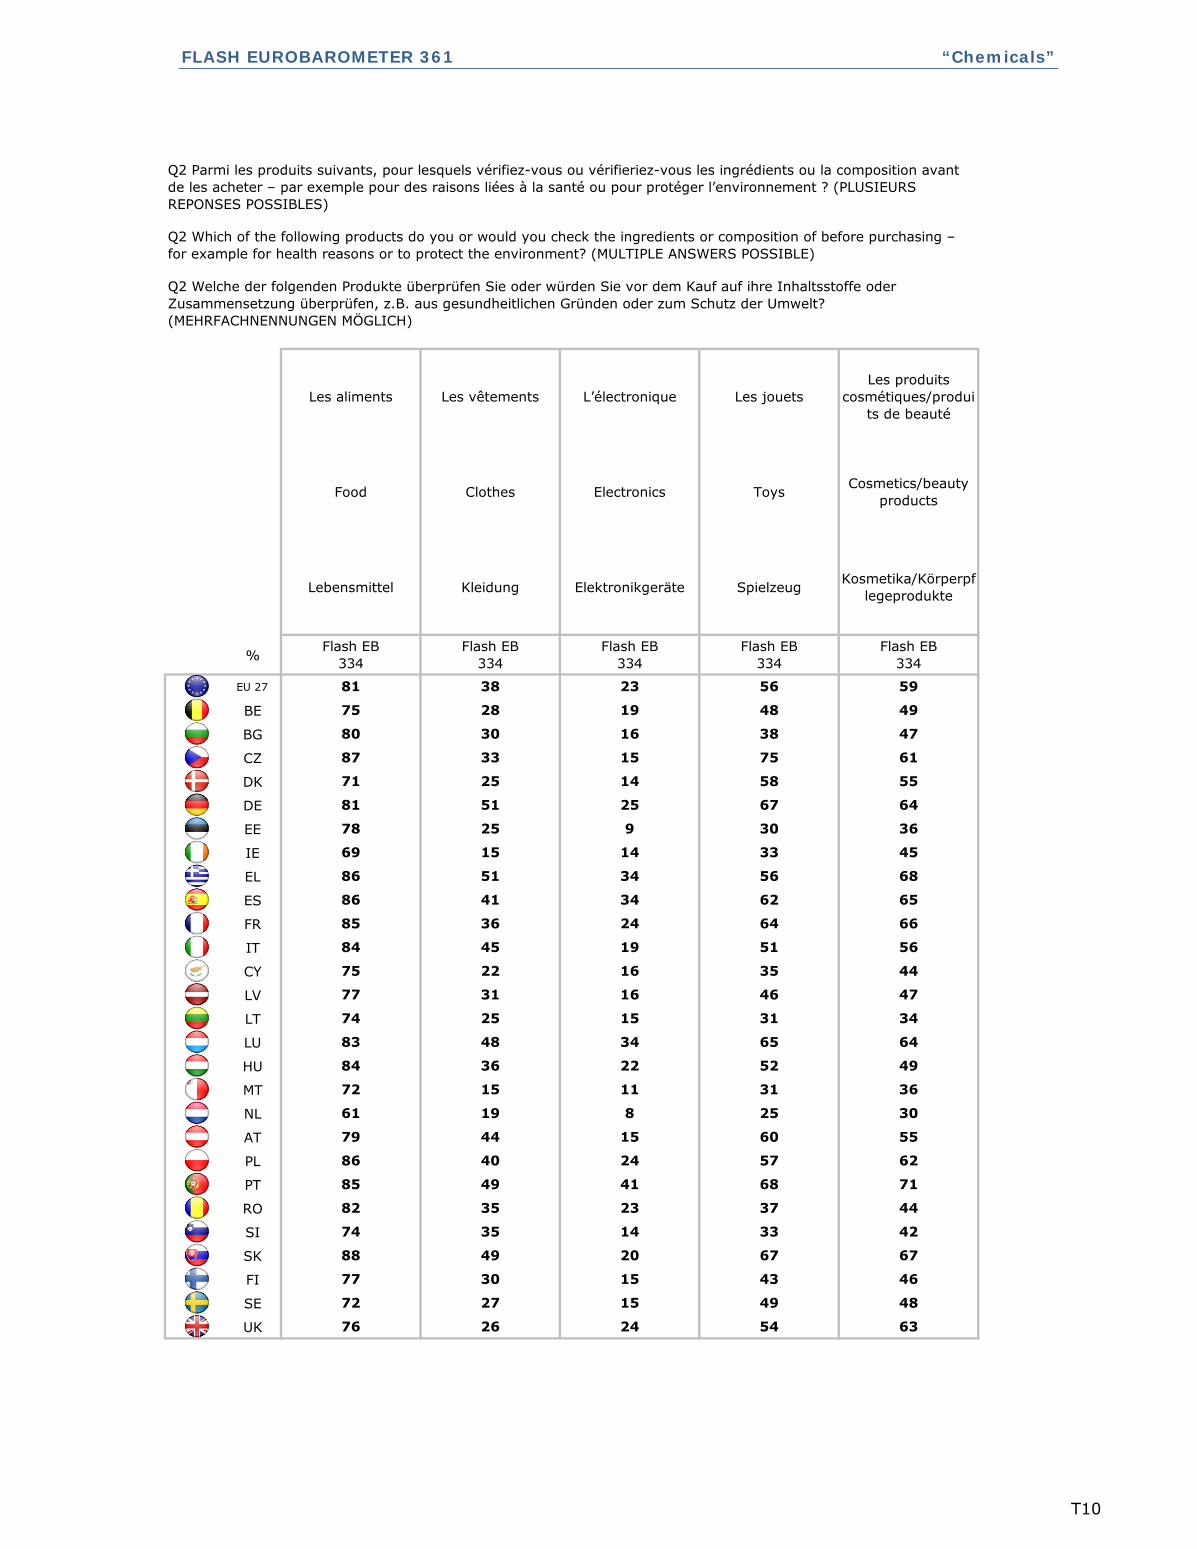
FLASH EUROBAROMETER 361 “Chemicals”
%
EU 27
BE
BG
CZ
DK
DE
EE
IE
EL
ES
FR
IT
CY
LV
LT
LU
HU
MT
NL
AT
PL
PT
RO
SI
SK
FI
SE
UK 76 26 24 54 63
77 30 15 43 46
4872 27 15 49
74 35 14 33 42
6788 49 20 67
85 49 41 68 71
4482 35 23 37
79 44 15 60 55
6286 40 24 57
72 15 11 31 36
3061 19 8 25
83 48 34 65 64
4984 36 22 52
77 31 16 46 47
3474 25 15 31
84 45 19 51 56
4475 22 16 35
86 41 34 62 65
6685 36 24 64
69 15 14 33 45
6886 51 34 56
81 51 25 67 64
3678 25 9 30
87 33 15 75 61
5571 25 14 58
75 28 19 48 49
4780 30 16 38
Spielzeug
Flash EB
334
5981 38 23 56
Les vêtements
Clothes
Kleidung
Flash EB
334
Les produits
cosmétiques/produi
ts de beauté
Cosmetics/beauty
products
Kosmetika/Körperpf
legeprodukte
Flash EB
334
Les jouets
Toys
Les aliments
Food
Lebensmittel
Flash EB
334
L’électronique
Electronics
Elektronikgeräte
Flash EB
334
Q2 Parmi les produits suivants, pour lesquels vérifiez-vous ou vérifieriez-vous les ingrédients ou la composition avant
de les acheter – par exemple pour des raisons liées à la santé ou pour protéger l’environnement ? (PLUSIEURS
REPONSES POSSIBLES)
Q2 Which of the following products do you or would you check the ingredients or composition of before purchasing –
for example for health reasons or to protect the environment? (MULTIPLE ANSWERS POSSIBLE)
Q2 Welche der folgenden Produkte überprüfen Sie oder würden Sie vor dem Kauf auf ihre Inhaltsstoffe oder
Zusammensetzung überprüfen, z.B. aus gesundheitlichen Gründen oder zum Schutz der Umwelt?
(MEHRFACHNENNUNGEN MÖGLICH)
T10
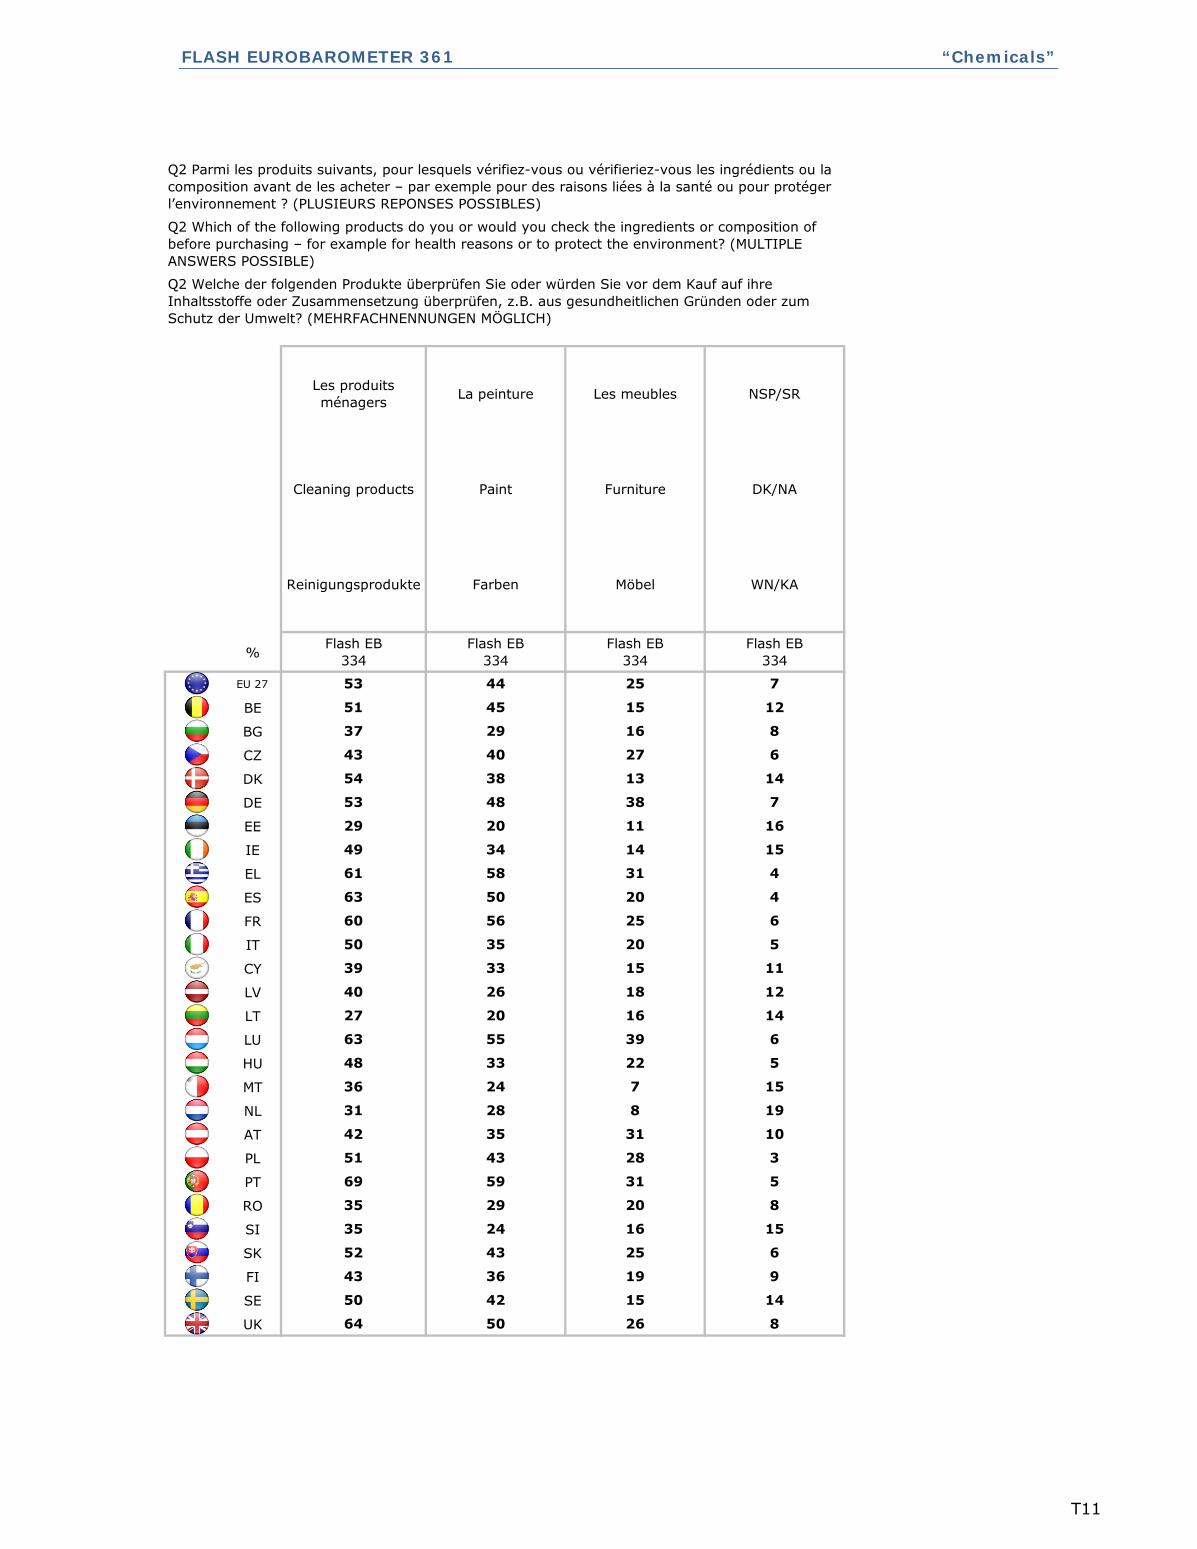
FLASH EUROBAROMETER 361 “Chemicals”
%
EU 27
BE
BG
CZ
DK
DE
EE
IE
EL
ES
FR
IT
CY
LV
LT
LU
HU
MT
NL
AT
PL
PT
RO
SI
SK
FI
SE
UK
Q2 Parmi les produits suivants, pour lesquels vérifiez-vous ou vérifieriez-vous les ingrédients ou la
composition avant de les acheter – par exemple pour des raisons liées à la santé ou pour protéger
l’environnement ? (PLUSIEURS REPONSES POSSIBLES)
Q2 Which of the following products do you or would you check the ingredients or composition of
before purchasing – for example for health reasons or to protect the environment? (MULTIPLE
ANSWERS POSSIBLE)
Q2 Welche der folgenden Produkte überprüfen Sie oder würden Sie vor dem Kauf auf ihre
Inhaltsstoffe oder Zusammensetzung überprüfen, z.B. aus gesundheitlichen Gründen oder zum
Schutz der Umwelt? (MEHRFACHNENNUNGEN MÖGLICH)
NSP/SR
Cleaning products Paint Furniture DK/NA
Les produits
ménagersLa peinture Les meubles
Farben Möbel WN/KA
Flash EB
334
Flash EB
334
Reinigungsprodukte
7
51 45 15 12
Flash EB
334
Flash EB
334
53 44 25
29 16 8
43 40
37
14
53 48 38 7
27 6
54 38 13
20 11 16
49 34
29
4
63 50 20 4
14 15
61 58 31
56 25 6
50 35
60
11
40 26 18 12
20 5
39 33 15
20 16 14
63 55
27
5
36 24 7 15
39 6
48 33 22
28 8 19
42 35
31
3
69 59 31 5
31 10
51 43 28
29 20 8
35 24
35
6
43 36 19 9
16 15
52 43 25
26 8
42 15 14
64 50
50
T11
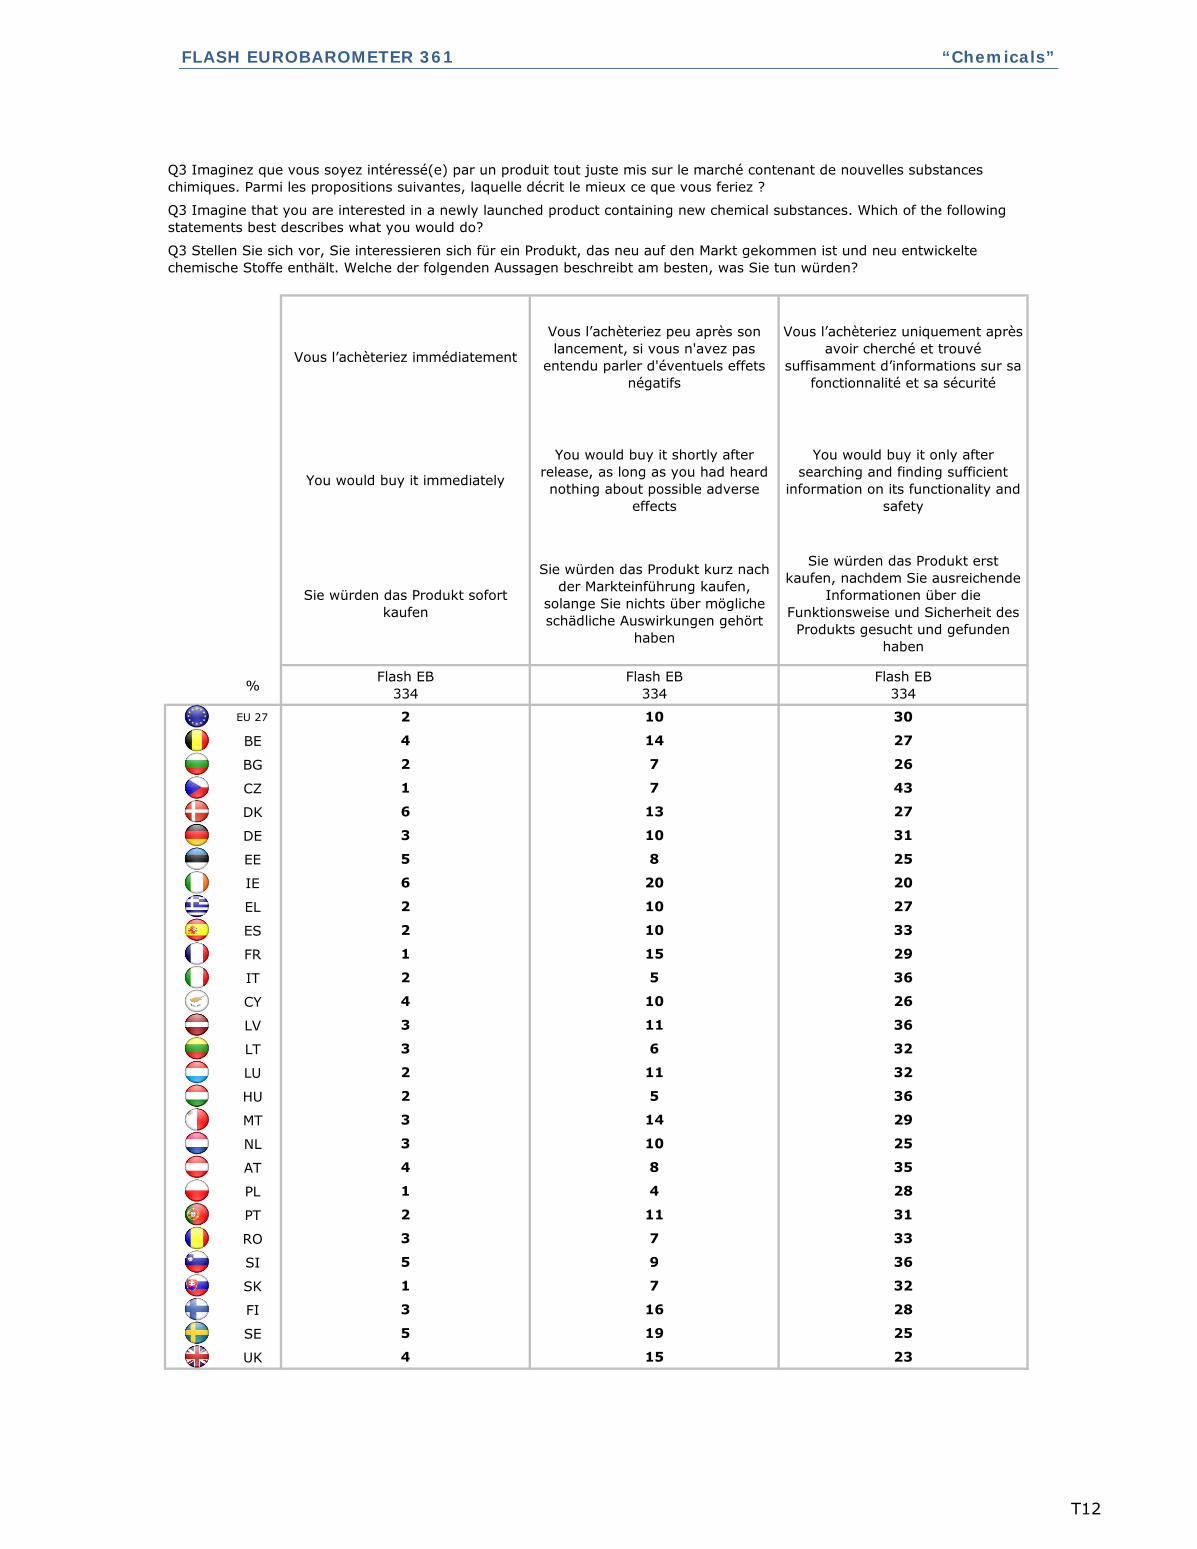
FLASH EUROBAROMETER 361 “Chemicals”
%
EU 27
BE
BG
CZ
DK
DE
EE
IE
EL
ES
FR
IT
CY
LV
LT
LU
HU
MT
NL
AT
PL
PT
RO
SI
SK
FI
SE
UK
25
3 16 28
4 15 23
5 19
3 7 33
1 7 32
5 9 36
28
4 8 35
2 11 31
1 4
2 5 36
3 10 25
3 14 29
32
3 11 36
2 11 32
3 6
1 15 29
4 10 26
2 5 36
27
6 20 20
2 10 33
2 10
6 13 27
5 8 25
3 10 31
30
26
4 14 27
1 7 43
2 7
Vous l’achèteriez peu après son
lancement, si vous n'avez pas
entendu parler d'éventuels effets
négatifs
You would buy it shortly after
release, as long as you had heard
nothing about possible adverse
effects
Sie würden das Produkt kurz nach
der Markteinführung kaufen,
solange Sie nichts über mögliche
schädliche Auswirkungen gehört
haben
Flash EB
334
2 10
Vous l’achèteriez immédiatement
You would buy it immediately
Sie würden das Produkt sofort
kaufen
Flash EB
334
Vous l’achèteriez uniquement après
avoir cherché et trouvé
suffisamment d’informations sur sa
fonctionnalité et sa sécurité
You would buy it only after
searching and finding sufficient
information on its functionality and
safety
Sie würden das Produkt erst
kaufen, nachdem Sie ausreichende
Informationen über die
Funktionsweise und Sicherheit des
Produkts gesucht und gefunden
haben
Flash EB
334
Q3 Imaginez que vous soyez intéressé(e) par un produit tout juste mis sur le marché contenant de nouvelles substances
chimiques. Parmi les propositions suivantes, laquelle décrit le mieux ce que vous feriez ?
Q3 Imagine that you are interested in a newly launched product containing new chemical substances. Which of the following
statements best describes what you would do?
Q3 Stellen Sie sich vor, Sie interessieren sich für ein Produkt, das neu auf den Markt gekommen ist und neu entwickelte
chemische Stoffe enthält. Welche der folgenden Aussagen beschreibt am besten, was Sie tun würden?
T12
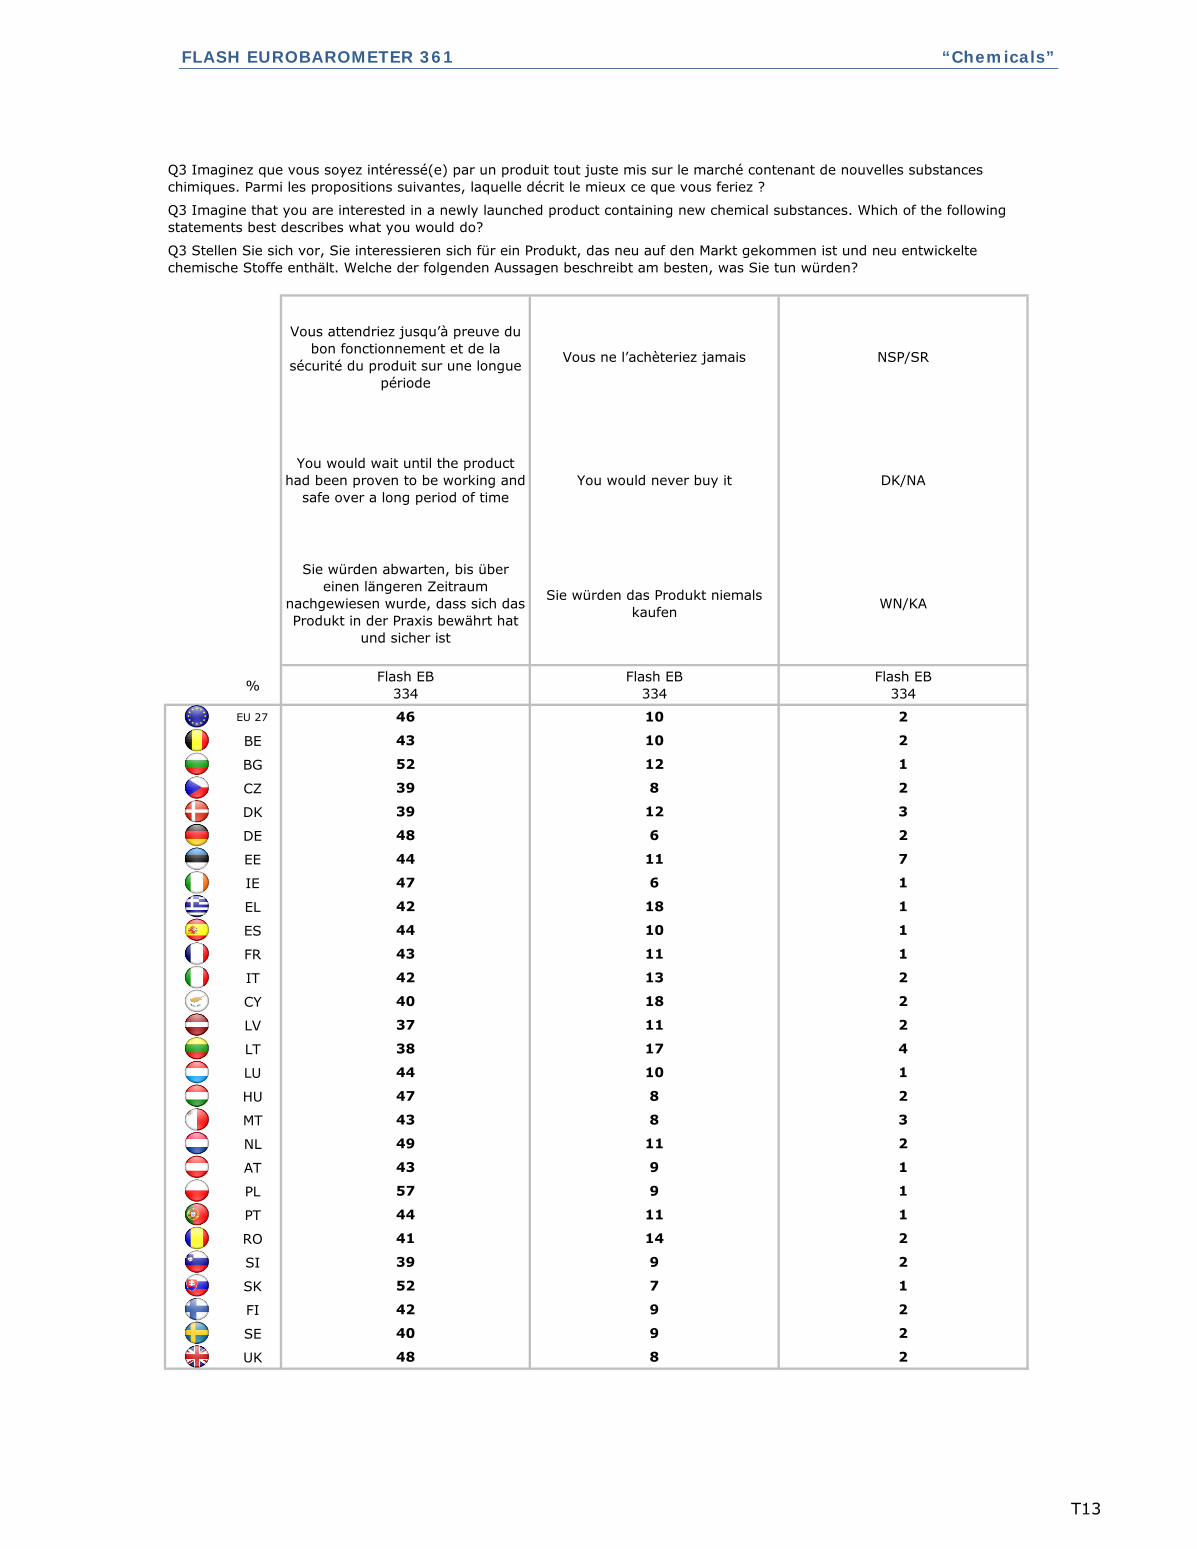
FLASH EUROBAROMETER 361 “Chemicals”
%
EU 27
BE
BG
CZ
DK
DE
EE
IE
EL
ES
FR
IT
CY
LV
LT
LU
HU
MT
NL
AT
PL
PT
RO
SI
SK
FI
SE
UK
Q3 Imaginez que vous soyez intéressé(e) par un produit tout juste mis sur le marché contenant de nouvelles substances
chimiques. Parmi les propositions suivantes, laquelle décrit le mieux ce que vous feriez ?
Q3 Imagine that you are interested in a newly launched product containing new chemical substances. Which of the following
statements best describes what you would do?
Q3 Stellen Sie sich vor, Sie interessieren sich für ein Produkt, das neu auf den Markt gekommen ist und neu entwickelte
chemische Stoffe enthält. Welche der folgenden Aussagen beschreibt am besten, was Sie tun würden?
You would wait until the product
had been proven to be working and
safe over a long period of time
You would never buy it DK/NA
Vous attendriez jusqu’à preuve du
bon fonctionnement et de la
sécurité du produit sur une longue
période
Vous ne l’achèteriez jamais NSP/SR
Flash EB
334
Flash EB
334
Flash EB
334
Sie würden abwarten, bis über
einen längeren Zeitraum
nachgewiesen wurde, dass sich das
Produkt in der Praxis bewährt hat
und sicher ist
Sie würden das Produkt niemals
kaufenWN/KA
43 10 2
46 10 2
39 8 2
52 12 1
48 6 2
39 12 3
47 6 1
44 11 7
44 10 1
42 18 1
42 13 2
43 11 1
37 11 2
40 18 2
44 10 1
38 17 4
43 8 3
47 8 2
43 9 1
49 11 2
44 11 1
57 9 1
39 9 2
41 14 2
42 9 2
52 7 1
48 8 2
40 9 2
T13
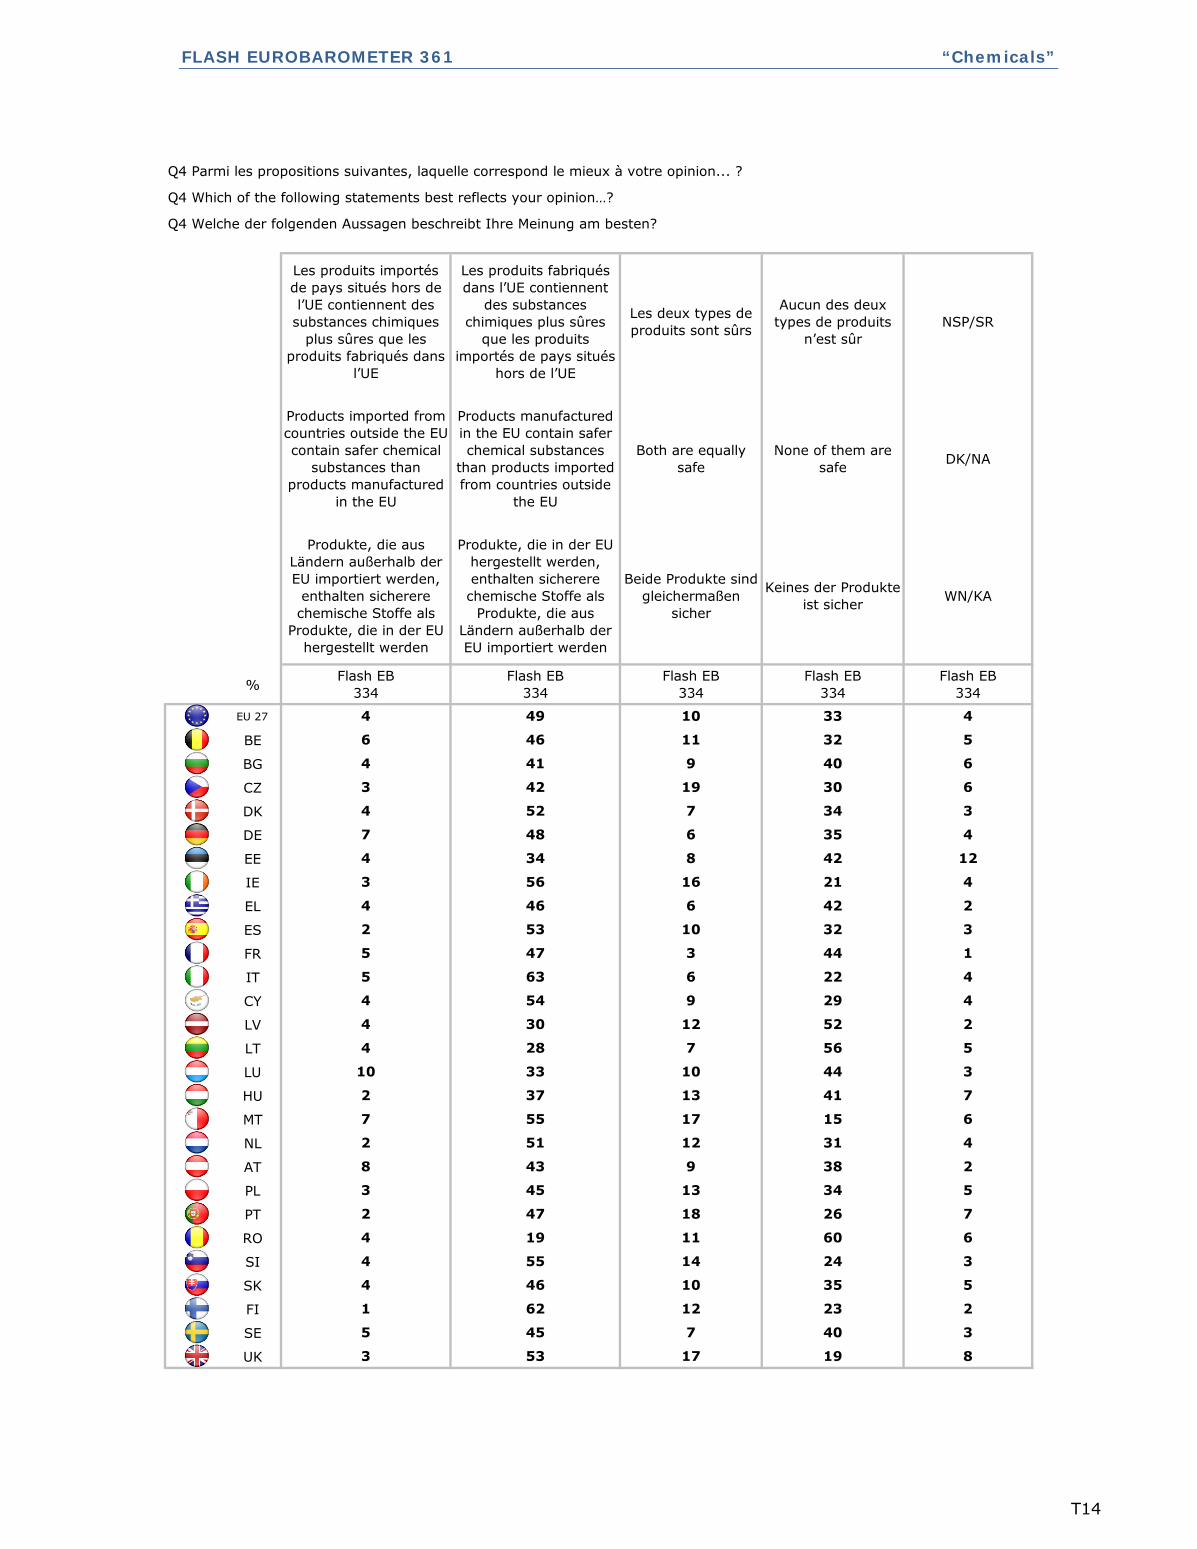
FLASH EUROBAROMETER 361 “Chemicals”
%
EU 27
BE
BG
CZ
DK
DE
EE
IE
EL
ES
FR
IT
CY
LV
LT
LU
HU
MT
NL
AT
PL
PT
RO
SI
SK
FI
SE
UK
7 40
10 35
3
3 53 17 19 8
5 45
11 60
5
1 62 12 23 2
4 46
13 34
6
4 55 14 24 3
4 19
12 31
5
2 47 18 26 7
3 45
13 41
4
8 43 9 38 2
2 51
7 56
7
7 55 17 15 6
2 37
9 29
5
10 33 10 44 3
4 28
3 44
4
4 30 12 52 2
4 54
6 42
1
5 63 6 22 4
5 47
8 42
2
2 53 10 32 3
4 46
7 34
12
3 56 16 21 4
4 34
9 40
3
7 48 6 35 4
4 52
10 33
6
3 42 19 30 6
4 41
Keines der Produkte
ist sicher
Flash EB
334
4
6 46 11 32 5
4 49
Les produits fabriqués
dans l’UE contiennent
des substances
chimiques plus sûres
que les produits
importés de pays situés
hors de l’UE
Products manufactured
in the EU contain safer
chemical substances
than products imported
from countries outside
the EU
Produkte, die in der EU
hergestellt werden,
enthalten sicherere
chemische Stoffe als
Produkte, die aus
Ländern außerhalb der
EU importiert werden
Flash EB
334
NSP/SR
DK/NA
WN/KA
Flash EB
334
Aucun des deux
types de produits
n’est sûr
None of them are
safe
Les produits importés
de pays situés hors de
l’UE contiennent des
substances chimiques
plus sûres que les
produits fabriqués dans
l’UE
Products imported from
countries outside the EU
contain safer chemical
substances than
products manufactured
in the EU
Produkte, die aus
Ländern außerhalb der
EU importiert werden,
enthalten sicherere
chemische Stoffe als
Produkte, die in der EU
hergestellt werden
Flash EB
334
Les deux types de
produits sont sûrs
Both are equally
safe
Beide Produkte sind
gleichermaßen
sicher
Flash EB
334
Q4 Parmi les propositions suivantes, laquelle correspond le mieux à votre opinion... ?
Q4 Which of the following statements best reflects your opinion…?
Q4 Welche der folgenden Aussagen beschreibt Ihre Meinung am besten?
T14
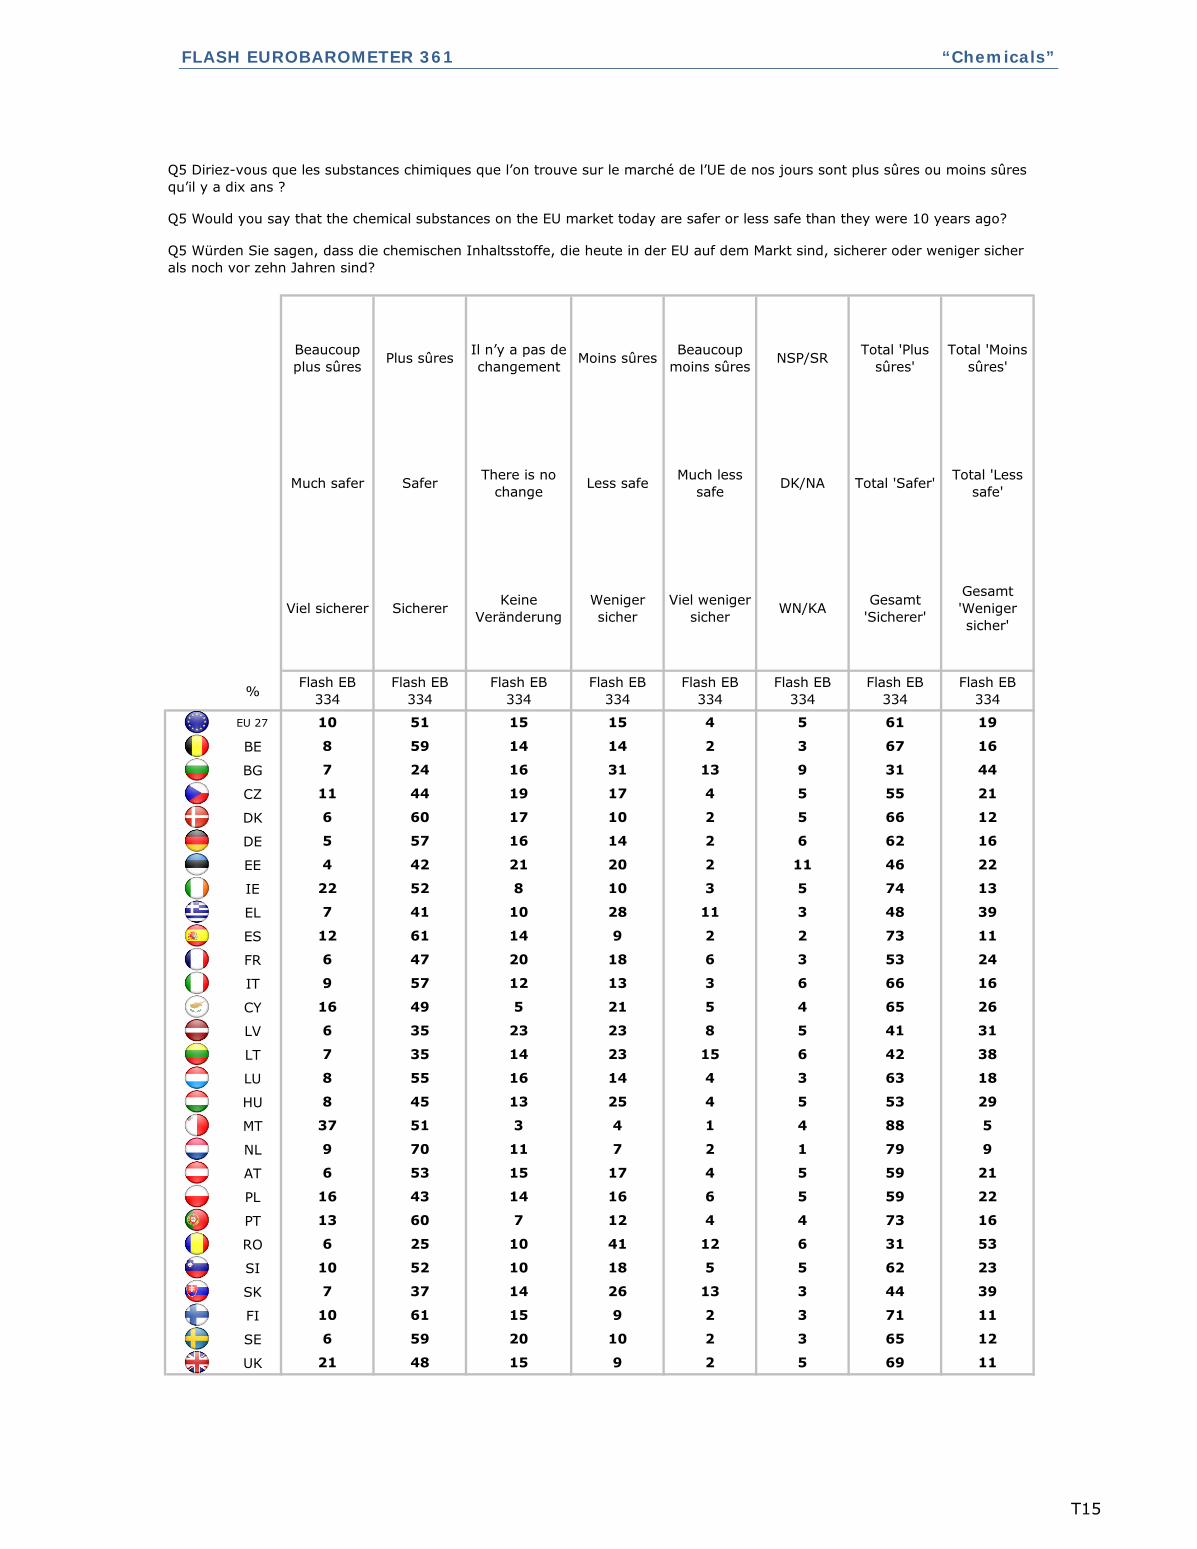
FLASH EUROBAROMETER 361 “Chemicals”
%
EU 27
BE
BG
CZ
DK
DE
EE
IE
EL
ES
FR
IT
CY
LV
LT
LU
HU
MT
NL
AT
PL
PT
RO
SI
SK
FI
SE
UK 2 5 69 1121 48 15 9
2 3 65 126 59 20 10
2 3 71 1110 61 15 9
13 3 44 397 37 14 26
5 5 62 2310 52 10 18
12 6 31 536 25 10 41
4 4 73 1613 60 7 12
6 5 59 2216 43 14 16
4 5 59 216 53 15 17
2 1 79 99 70 11 7
1 4 88 537 51 3 4
4 5 53 298 45 13 25
4 3 63 188 55 16 14
15 6 42 387 35 14 23
8 5 41 316 35 23 23
5 4 65 2616 49 5 21
3 6 66 169 57 12 13
6 3 53 246 47 20 18
2 2 73 1112 61 14 9
11 3 48 397 41 10 28
3 5 74 1322 52 8 10
2 11 46 224 42 21 20
2 6 62 165 57 16 14
2 5 66 126 60 17 10
4 5 55 2111 44 19 17
13 9 31 447 24 16 31
2 3 67 168 59 14 14
4 5 61 1910 51 15 15
Total 'Moins
sûres'
Total 'Less
safe'
Gesamt
'Weniger
sicher'
Flash EB
334
Total 'Plus
sûres'
Total 'Safer'
Gesamt
'Sicherer'
Flash EB
334
NSP/SR
DK/NA
WN/KA
Flash EB
334
Beaucoup
moins sûres
Much less
safe
Viel weniger
sicher
Flash EB
334
Moins sûres
Less safe
Weniger
sicher
Flash EB
334
Il n’y a pas de
changement
There is no
change
Keine
Veränderung
Flash EB
334
Plus sûres
Safer
Sicherer
Flash EB
334
Beaucoup
plus sûres
Much safer
Viel sicherer
Flash EB
334
Q5 Diriez-vous que les substances chimiques que l’on trouve sur le marché de l’UE de nos jours sont plus sûres ou moins sûres
qu’il y a dix ans ?
Q5 Would you say that the chemical substances on the EU market today are safer or less safe than they were 10 years ago?
Q5 Würden Sie sagen, dass die chemischen Inhaltsstoffe, die heute in der EU auf dem Markt sind, sicherer oder weniger sicher
als noch vor zehn Jahren sind?
T15
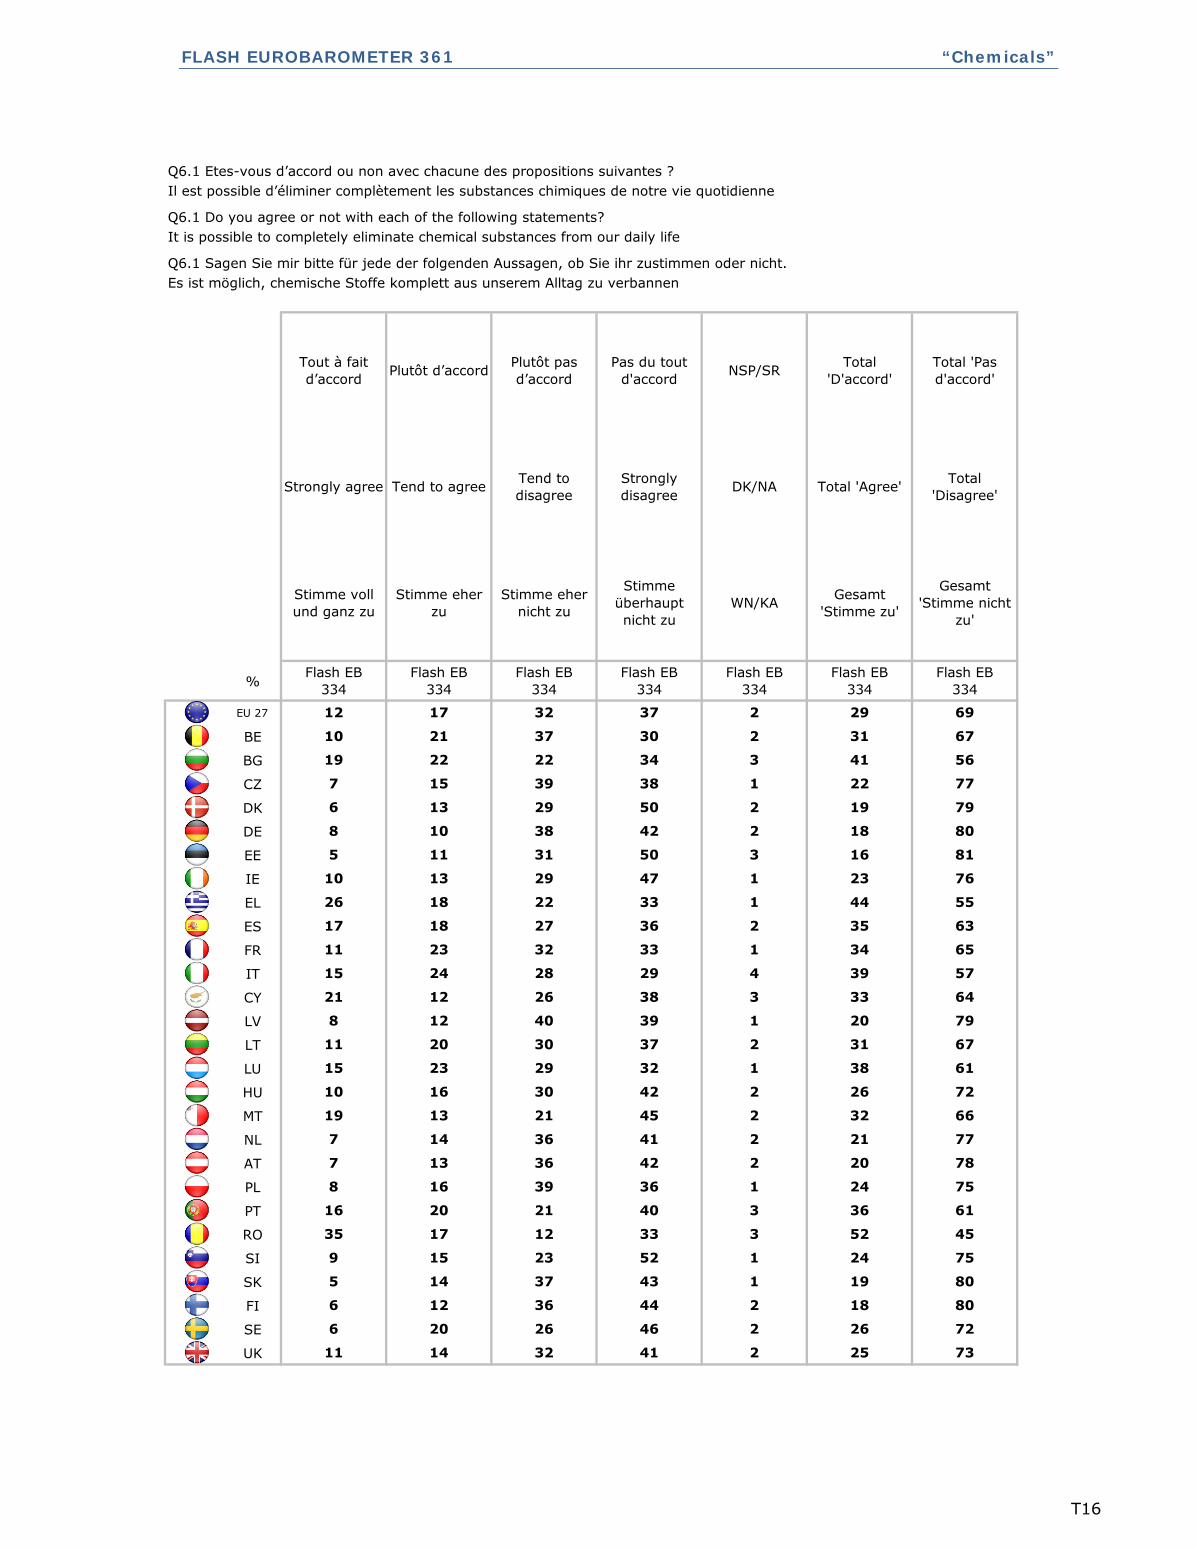
FLASH EUROBAROMETER 361 “Chemicals”
%
EU 27
BE
BG
CZ
DK
DE
EE
IE
EL
ES
FR
IT
CY
LV
LT
LU
HU
MT
NL
AT
PL
PT
RO
SI
SK
FI
SE
UK
72
2 25 7311 14 32 41
6 20 26 46 2 26
2423 52
2 18 80
15
6 12 36 44
1
45
75
5 14 37 43 1 19 80
9
35 17 12 33 3 52
2036 42
3 36 61
13
16 20 21 40
2
77
78
8 16 39 36 1 24 75
7
7 14 36 41 2 21
3829 32
2 32 66
23
19 13 21 45
1
67
61
10 16 30 42 2 26 72
15
11 20 30 37 2 31
3928 29
1 20 79
24
8 12 40 39
4
65
57
21 12 26 38 3 33 64
15
11 23 32 33 1 34
2329 47
2 35 63
13
17 18 27 36
1
81
76
26 18 22 33 1 44 55
10
5 11 31 50 3 16
2239 38
2 18 80
15
8 10 38 42
1
56
77
6 13 29 50 2 19 79
7
19 22 22 34 3 41
Gesamt
'Stimme nicht
zu'
Flash EB
334
12 17 32
2 31 67
69
DK/NA
WN/KA
Flash EB
334
Flash EB
334
10 21 37 30
Total
'Disagree'
Pas du tout
d'accord
Strongly
disagree
Stimme
überhaupt
nicht zu
37 2 29
Total 'Agree'
Gesamt
'Stimme zu'
Flash EB
334
Tend to
disagree
Stimme eher
nicht zu
Flash EB
334
Strongly agree
Stimme voll
und ganz zu
Flash EB
334
Plutôt d’accord
Tend to agree
Stimme eher
zu
Flash EB
334
Q6.1 Sagen Sie mir bitte für jede der folgenden Aussagen, ob Sie ihr zustimmen oder nicht.
Es ist möglich, chemische Stoffe komplett aus unserem Alltag zu verbannen
Tout à fait
d’accord
Plutôt pas
d’accordNSP/SR
Total 'Pas
d'accord'
Total
'D'accord'
Q6.1 Etes-vous d’accord ou non avec chacune des propositions suivantes ?
Il est possible d’éliminer complètement les substances chimiques de notre vie quotidienne
Q6.1 Do you agree or not with each of the following statements?
It is possible to completely eliminate chemical substances from our daily life
T16

FLASH EUROBAROMETER 361 “Chemicals”
%
EU 27
BE
BG
CZ
DK
DE
EE
IE
EL
ES
FR
IT
CY
LV
LT
LU
HU
MT
NL
AT
PL
PT
RO
SI
SK
FI
SE
UK
28
8 64 2816 48 20 8
18 45 16 12 9 63
5817 18
7 62 31
36
16 46 20 11
7
30
35
17 34 28 15 6 51 43
22
36 27 9 21 7 63
5229 12
5 62 33
38
26 36 16 17
7
26
41
16 48 22 6 8 64 28
14
18 49 18 8 7 67
5524 17
12 60 28
39
28 32 13 15
4
31
41
14 36 26 15 9 50 41
16
19 43 16 15 7 62
5524 10
4 58 38
38
13 45 25 13
11
46
34
31 25 14 16 14 56 30
17
11 38 26 20 5 49
5920 12
5 57 38
45
23 34 23 15
9
26
32
27 26 16 22 9 53 38
14
16 42 18 8 16 58
5529 9
7 60 33
42
17 43 25 8
7
34
38
19 40 14 10 17 59 24
13
17 42 14 20 7 59
Gesamt
'Stimme nicht
zu'
Flash EB
334
18 40 22
7 57 36
34
DK/NA
WN/KA
Flash EB
334
Flash EB
334
15 42 21 15
Total
'Disagree'
Pas du tout
d'accord
Strongly
disagree
Stimme
überhaupt
nicht zu
12 8 58
Total 'Agree'
Gesamt
'Stimme zu'
Flash EB
334
Tend to
disagree
Stimme eher
nicht zu
Flash EB
334
Strongly agree
Stimme voll
und ganz zu
Flash EB
334
Plutôt d’accord
Tend to agree
Stimme eher
zu
Flash EB
334
Q6.2 Sagen Sie mir bitte für jede der folgenden Aussagen, ob Sie ihr zustimmen oder nicht.
Neu entwickelte chemische Stoffe können dazu beitragen, den Verbrauch von natürlichen Ressourcen zu verringern
Tout à fait
d’accord
Plutôt pas
d’accordNSP/SR
Total 'Pas
d'accord'
Total
'D'accord'
Q6.2 Etes-vous d’accord ou non avec chacune des propositions suivantes ?
Les nouvelles substances chimiques peuvent permettre de réduire l’utilisation des ressources naturelles
Q6.2 Do you agree or not with each of the following statements?
New chemical substances can help in reducing the use of natural resources
T17
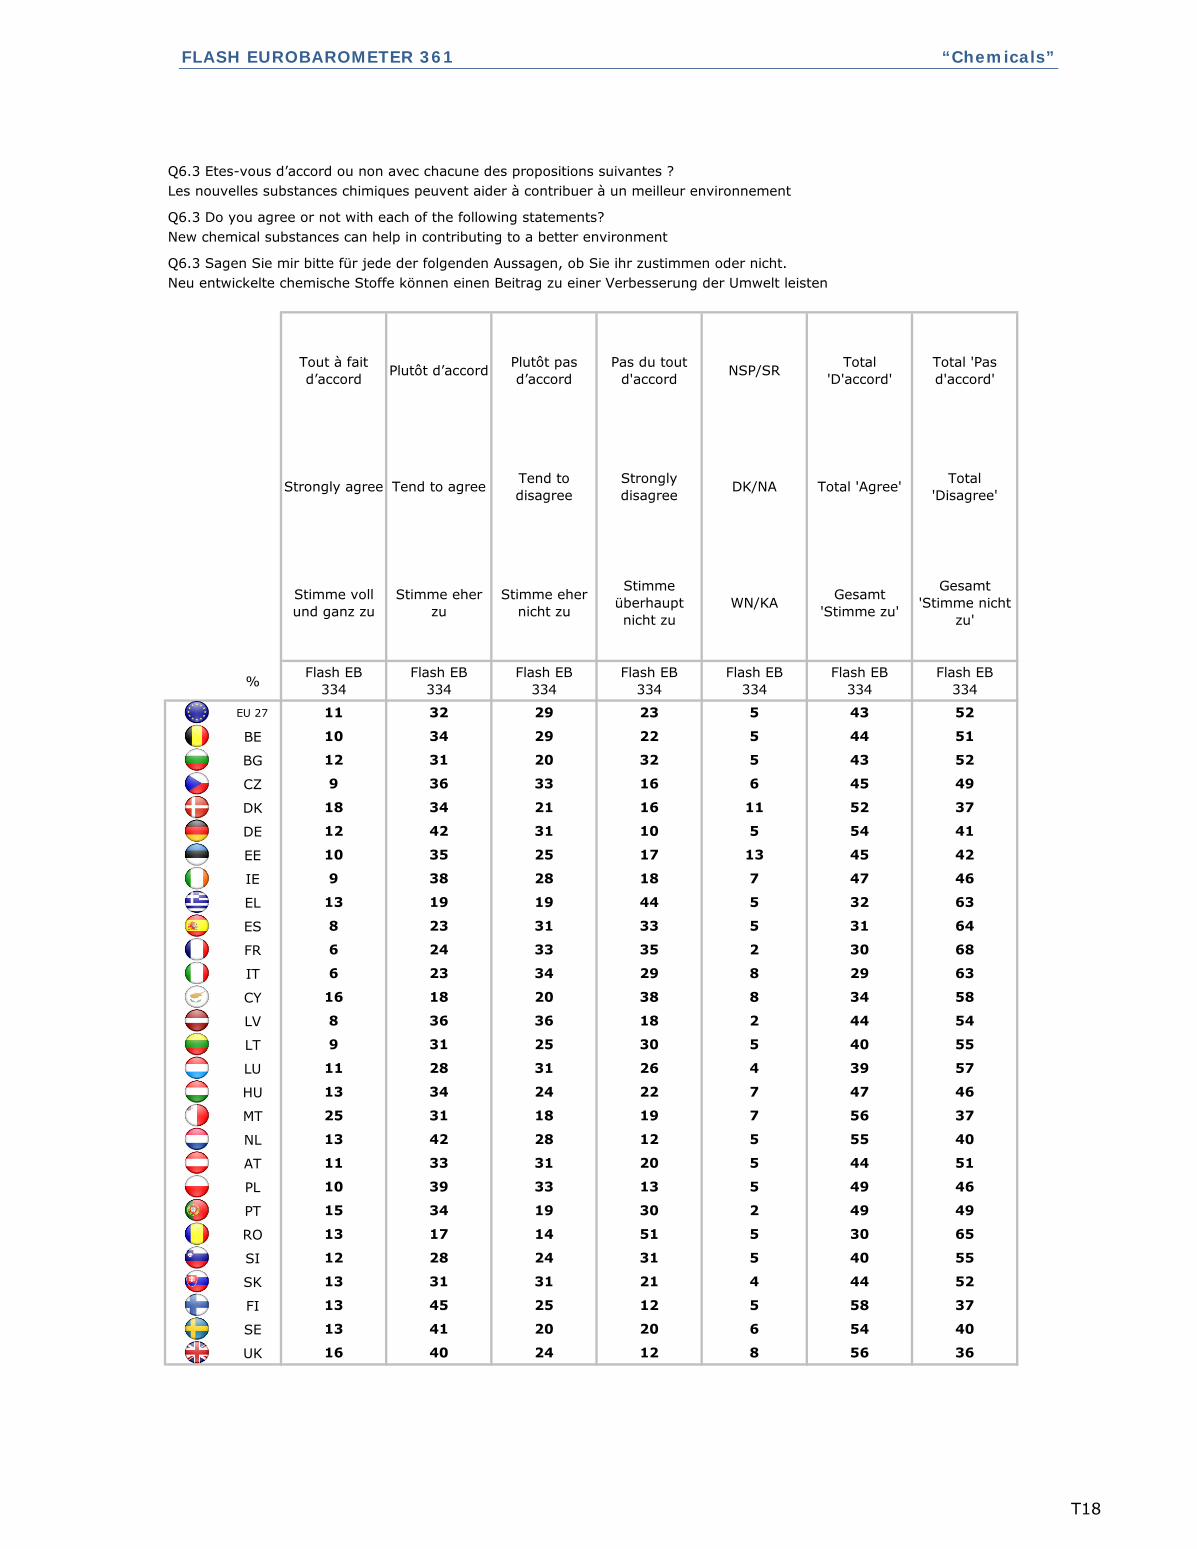
FLASH EUROBAROMETER 361 “Chemicals”
%
EU 27
BE
BG
CZ
DK
DE
EE
IE
EL
ES
FR
IT
CY
LV
LT
LU
HU
MT
NL
AT
PL
PT
RO
SI
SK
FI
SE
UK
40
8 56 3616 40 24 12
13 41 20 20 6 54
4024 31
5 58 37
28
13 45 25 12
5
65
55
13 31 31 21 4 44 52
12
13 17 14 51 5 30
4431 20
2 49 49
33
15 34 19 30
5
40
51
10 39 33 13 5 49 46
11
13 42 28 12 5 55
3931 26
7 56 37
28
25 31 18 19
4
55
57
13 34 24 22 7 47 46
11
9 31 25 30 5 40
2934 29
2 44 54
23
8 36 36 18
8
68
63
16 18 20 38 8 34 58
6
6 24 33 35 2 30
4728 18
5 31 64
38
8 23 31 33
7
42
46
13 19 19 44 5 32 63
9
10 35 25 17 13 45
4533 16
5 54 41
36
12 42 31 10
6
52
49
18 34 21 16 11 52 37
9
12 31 20 32 5 43
Gesamt
'Stimme nicht
zu'
Flash EB
334
11 32 29
5 44 51
52
DK/NA
WN/KA
Flash EB
334
Flash EB
334
10 34 29 22
Total
'Disagree'
Pas du tout
d'accord
Strongly
disagree
Stimme
überhaupt
nicht zu
23 5 43
Total 'Agree'
Gesamt
'Stimme zu'
Flash EB
334
Tend to
disagree
Stimme eher
nicht zu
Flash EB
334
Strongly agree
Stimme voll
und ganz zu
Flash EB
334
Plutôt d’accord
Tend to agree
Stimme eher
zu
Flash EB
334
Q6.3 Sagen Sie mir bitte für jede der folgenden Aussagen, ob Sie ihr zustimmen oder nicht.
Neu entwickelte chemische Stoffe können einen Beitrag zu einer Verbesserung der Umwelt leisten
Tout à fait
d’accord
Plutôt pas
d’accordNSP/SR
Total 'Pas
d'accord'
Total
'D'accord'
Q6.3 Etes-vous d’accord ou non avec chacune des propositions suivantes ?
Les nouvelles substances chimiques peuvent aider à contribuer à un meilleur environnement
Q6.3 Do you agree or not with each of the following statements?
New chemical substances can help in contributing to a better environment
T18
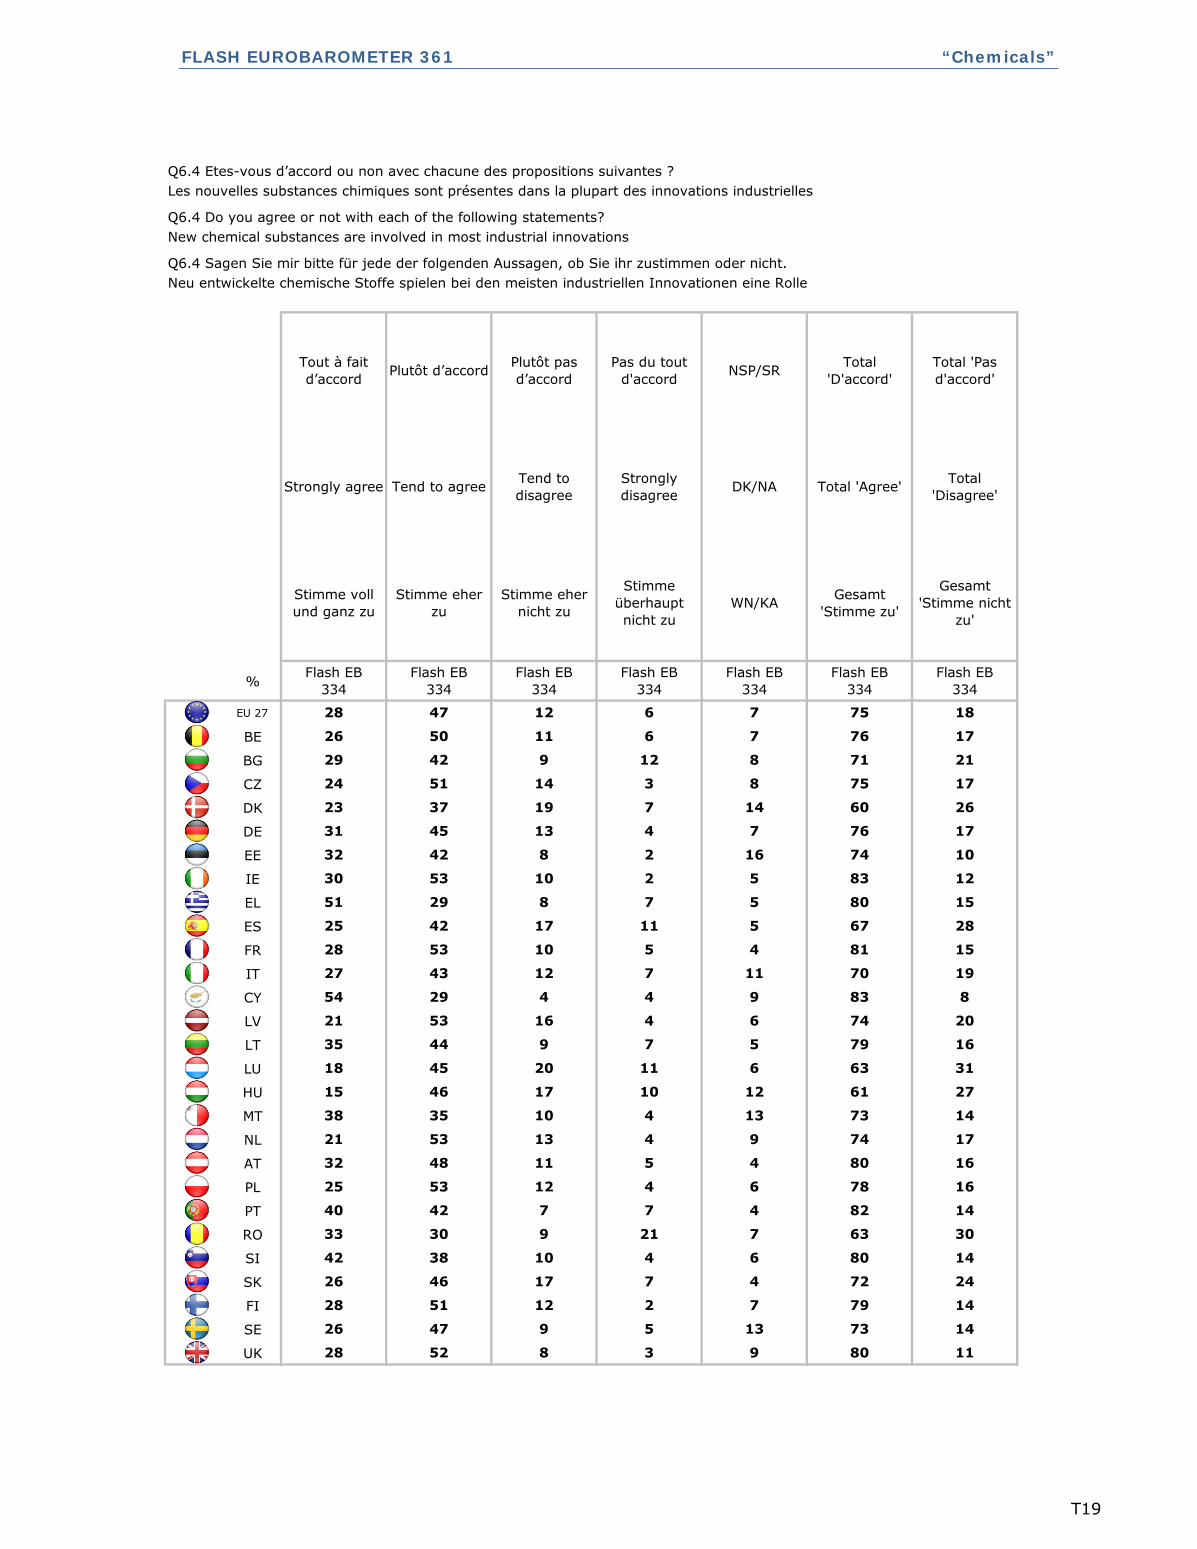
FLASH EUROBAROMETER 361 “Chemicals”
%
EU 27
BE
BG
CZ
DK
DE
EE
IE
EL
ES
FR
IT
CY
LV
LT
LU
HU
MT
NL
AT
PL
PT
RO
SI
SK
FI
SE
UK
14
9 80 1128 52 8 3
26 47 9 5 13 73
8010 4
7 79 14
38
28 51 12 2
6
30
14
26 46 17 7 4 72 24
42
33 30 9 21 7 63
8011 5
4 82 14
48
40 42 7 7
4
17
16
25 53 12 4 6 78 16
32
21 53 13 4 9 74
6320 11
13 73 14
45
38 35 10 4
6
16
31
15 46 17 10 12 61 27
18
35 44 9 7 5 79
7012 7
6 74 20
43
21 53 16 4
11
15
19
54 29 4 4 9 83 8
27
28 53 10 5 4 81
8310 2
5 67 28
53
25 42 17 11
5
10
12
51 29 8 7 5 80 15
30
32 42 8 2 16 74
7514 3
7 76 17
51
31 45 13 4
8
21
17
23 37 19 7 14 60 26
24
29 42 9 12 8 71
Gesamt
'Stimme nicht
zu'
Flash EB
334
28 47 12
7 76 17
18
DK/NA
WN/KA
Flash EB
334
Flash EB
334
26 50 11 6
Total
'Disagree'
Pas du tout
d'accord
Strongly
disagree
Stimme
überhaupt
nicht zu
6 7 75
Total 'Agree'
Gesamt
'Stimme zu'
Flash EB
334
Tend to
disagree
Stimme eher
nicht zu
Flash EB
334
Strongly agree
Stimme voll
und ganz zu
Flash EB
334
Plutôt d’accord
Tend to agree
Stimme eher
zu
Flash EB
334
Q6.4 Sagen Sie mir bitte für jede der folgenden Aussagen, ob Sie ihr zustimmen oder nicht.
Neu entwickelte chemische Stoffe spielen bei den meisten industriellen Innovationen eine Rolle
Tout à fait
d’accord
Plutôt pas
d’accordNSP/SR
Total 'Pas
d'accord'
Total
'D'accord'
Q6.4 Etes-vous d’accord ou non avec chacune des propositions suivantes ?
Les nouvelles substances chimiques sont présentes dans la plupart des innovations industrielles
Q6.4 Do you agree or not with each of the following statements?
New chemical substances are involved in most industrial innovations
T19

FLASH EUROBAROMETER 361 “Chemicals”
%
EU 27
BE
BG
CZ
DK
DE
EE
IE
EL
ES
FR
IT
CY
LV
LT
LU
HU
MT
NL
AT
PL
PT
RO
SI
SK
FI
SE
UK
48
5 74 2122 52 15 6
8 39 29 19 5 47
5623 16
2 53 45
38
10 43 33 12
5
35
39
17 44 27 9 3 61 36
18
22 36 14 21 7 58
6127 9
5 75 20
49
23 52 12 8
3
26
36
18 58 15 4 5 76 19
12
14 56 21 5 4 70
6128 8
8 80 12
50
40 40 9 3
3
38
36
17 41 24 13 5 58 37
11
10 47 25 13 5 57
6223 7
1 68 31
47
13 55 24 7
8
42
30
33 36 13 10 8 69 23
15
9 48 29 13 1 57
7614 5
3 76 21
52
20 56 15 6
5
27
19
17 43 19 18 3 60 37
24
14 50 18 9 9 64
7120 5
3 59 38
48
12 47 31 7
4
24
25
8 26 37 24 5 34 61
23
21 50 15 9 5 71
Gesamt
'Stimme nicht
zu'
Flash EB
334
16 49 22
3 67 30
31
DK/NA
WN/KA
Flash EB
334
Flash EB
334
14 53 21 9
Total
'Disagree'
Pas du tout
d'accord
Strongly
disagree
Stimme
überhaupt
nicht zu
9 4 65
Total 'Agree'
Gesamt
'Stimme zu'
Flash EB
334
Tend to
disagree
Stimme eher
nicht zu
Flash EB
334
Strongly agree
Stimme voll
und ganz zu
Flash EB
334
Plutôt d’accord
Tend to agree
Stimme eher
zu
Flash EB
334
Q6.5 Sagen Sie mir bitte für jede der folgenden Aussagen, ob Sie ihr zustimmen oder nicht.
In der EU wurden alle Produkte, die neu entwickelte chemische Stoffe enthalten, sorgfältig geprüft
Tout à fait
d’accord
Plutôt pas
d’accordNSP/SR
Total 'Pas
d'accord'
Total
'D'accord'
Q6.5 Etes-vous d’accord ou non avec chacune des propositions suivantes ?
Dans l’UE, tous les produits contenant de nouvelles substances chimiques ont été correctement testés
Q6.5 Do you agree or not with each of the following statements?
In the EU, any products containing new chemical substances have been properly tested
T20
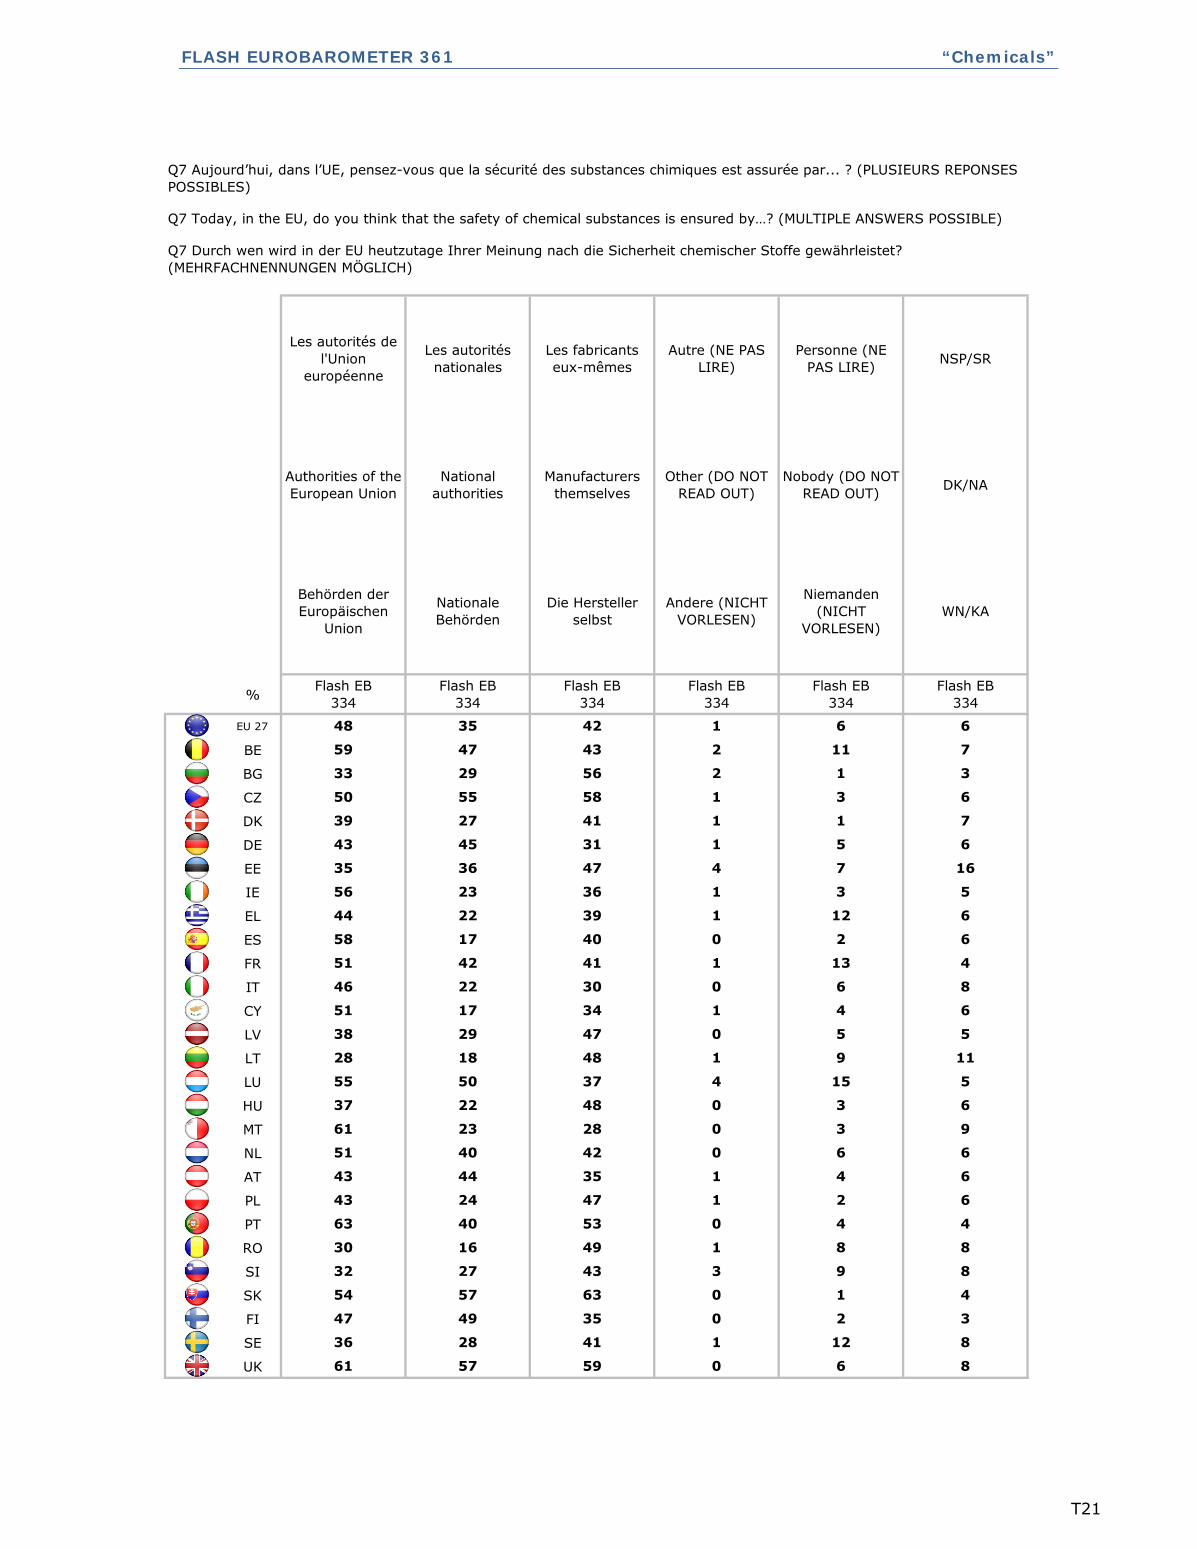
FLASH EUROBAROMETER 361 “Chemicals”
%
EU 27
BE
BG
CZ
DK
DE
EE
IE
EL
ES
FR
IT
CY
LV
LT
LU
HU
MT
NL
AT
PL
PT
RO
SI
SK
FI
SE
UK
12 8
61 57 59 0 6 8
36 28 41 1
1 4
47 49 35 0 2 3
54 57 63 0
8 8
32 27 43 3 9 8
30 16 49 1
2 6
63 40 53 0 4 4
43 24 47 1
6 6
43 44 35 1 4 6
51 40 42 0
3 6
61 23 28 0 3 9
37 22 48 0
9 11
55 50 37 4 15 5
28 18 48 1
4 6
38 29 47 0 5 5
51 17 34 1
13 4
46 22 30 0 6 8
51 42 41 1
12 6
58 17 40 0 2 6
44 22 39 1
7 16
56 23 36 1 3 5
35 36 47 4
1 7
43 45 31 1 5 6
39 27 41 1
1 3
50 55 58 1 3 6
33 29 56 2
6 6
59 47 43 2 11 7
48 35 42 1
NSP/SR
DK/NA
WN/KA
Flash EB
334
Personne (NE
PAS LIRE)
Nobody (DO NOT
READ OUT)
Les autorités
nationales
National
authorities
Nationale
Behörden
Flash EB
334
Niemanden
(NICHT
VORLESEN)
Flash EB
334
Autre (NE PAS
LIRE)
Other (DO NOT
READ OUT)
Andere (NICHT
VORLESEN)
Flash EB
334
Les autorités de
l'Union
européenne
Authorities of the
European Union
Behörden der
Europäischen
Union
Flash EB
334
Les fabricants
eux-mêmes
Manufacturers
themselves
Die Hersteller
selbst
Flash EB
334
Q7 Aujourd’hui, dans l’UE, pensez-vous que la sécurité des substances chimiques est assurée par... ? (PLUSIEURS REPONSES
POSSIBLES)
Q7 Today, in the EU, do you think that the safety of chemical substances is ensured by…? (MULTIPLE ANSWERS POSSIBLE)
Q7 Durch wen wird in der EU heutzutage Ihrer Meinung nach die Sicherheit chemischer Stoffe gewährleistet?
(MEHRFACHNENNUNGEN MÖGLICH)
T21
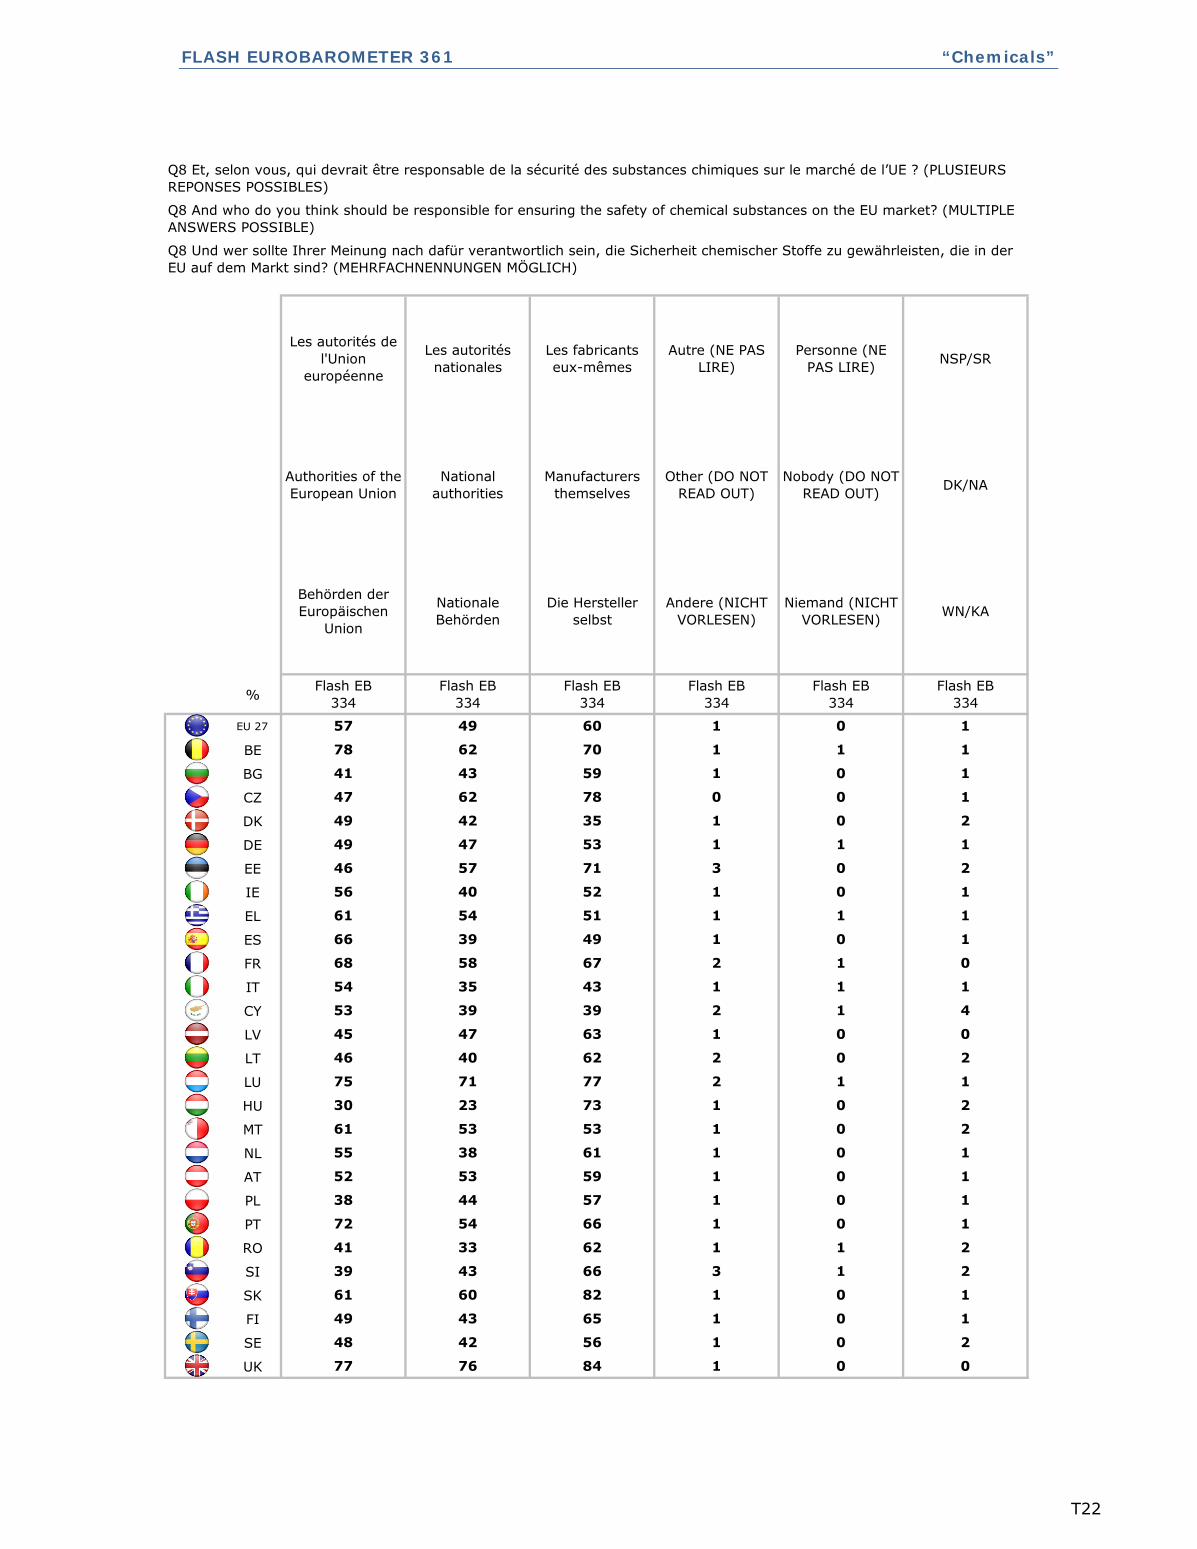
FLASH EUROBAROMETER 361 “Chemicals”
%
EU 27
BE
BG
CZ
DK
DE
EE
IE
EL
ES
FR
IT
CY
LV
LT
LU
HU
MT
NL
AT
PL
PT
RO
SI
SK
FI
SE
UK
0 2
77 76 84 1 0 0
48 42 56 1
0 1
49 43 65 1 0 1
61 60 82 1
1 2
39 43 66 3 1 2
41 33 62 1
0 1
72 54 66 1 0 1
38 44 57 1
0 1
52 53 59 1 0 1
55 38 61 1
0 2
61 53 53 1 0 2
30 23 73 1
0 2
75 71 77 2 1 1
46 40 62 2
1 4
45 47 63 1 0 0
53 39 39 2
1 0
54 35 43 1 1 1
68 58 67 2
1 1
66 39 49 1 0 1
61 54 51 1
0 2
56 40 52 1 0 1
46 57 71 3
0 2
49 47 53 1 1 1
49 42 35 1
0 1
47 62 78 0 0 1
41 43 59 1
0 1
78 62 70 1 1 1
57 49 60 1
NSP/SR
DK/NA
WN/KA
Flash EB
334
Personne (NE
PAS LIRE)
Nobody (DO NOT
READ OUT)
Les autorités
nationales
National
authorities
Nationale
Behörden
Flash EB
334
Niemand (NICHT
VORLESEN)
Flash EB
334
Autre (NE PAS
LIRE)
Other (DO NOT
READ OUT)
Andere (NICHT
VORLESEN)
Flash EB
334
Les autorités de
l'Union
européenne
Authorities of the
European Union
Behörden der
Europäischen
Union
Flash EB
334
Les fabricants
eux-mêmes
Manufacturers
themselves
Die Hersteller
selbst
Flash EB
334
Q8 Et, selon vous, qui devrait être responsable de la sécurité des substances chimiques sur le marché de l’UE ? (PLUSIEURS
REPONSES POSSIBLES)
Q8 And who do you think should be responsible for ensuring the safety of chemical substances on the EU market? (MULTIPLE
ANSWERS POSSIBLE)
Q8 Und wer sollte Ihrer Meinung nach dafür verantwortlich sein, die Sicherheit chemischer Stoffe zu gewährleisten, die in der
EU auf dem Markt sind? (MEHRFACHNENNUNGEN MÖGLICH)
T22