Embed Size (px)
Citation preview
NASA TECHNICAL NASA TM X-71602MEMORANDUM
I-
N74-32471(NASA-T-1X-71
6 0 2 ) FLAT PLATE COLLECTOR
pEORANCE DETERiINED EXPERIMENTALLY WITH
A SOLAR SIMULATOR (NASA)10A nclasG3/03 18764
FLAT-PLATE COLLECTOR PERFORMANCE DETERMINED
EXPERIMENTALLY WITH A SOLAR SIMULATOR
by Richard W. Vernon and Frederick F. Simon
Lewis Research Center
Cleveland, Ohio 44135
,TECHNICAL PAPER proposed for presentation at International
Solar Energy Society Meeting
Fort Collins, Colorado, August 19-23, 1974
REPRODUCED BY
NATIONAL TECHNICALINFORMATION SERVICE
U. S. DEPARTMENT OF COMMERCESPRINGFIELD. VA. 22161
https://ntrs.nasa.gov/search.jsp?R=19740024358 2018-06-06T07:13:15+00:00Z
FLAT-PLATE COLLECTOR PERFORMANCE DETERMINED
EXPERIMENTALLY WITH A SOLAR SIMULATOR
by Richard W. Vernon and Frederick F. Simon
Lewis Research Center
SUMMARY
The NASA is constructing a new office building at Langley Research
Center that will utilize solar energy for heating and cooling. The project
is a joint effort between Langley and Lewis Research Center. A collector
technology program being conducted at Lewis will provide the basis for
selecting collectors for use at Langley. The technology program includes
testing collectors in an indoor facility under simulated solar radiation. Tests
have been conducted on five collectors to date and performance data are pre-
sented herein. The collector performance obtained with the solar simulator
will be correlated with data obtained by conducting tests outdoors at Lewis.
INTRODUCTION
About 25 percent of the energy consumed in the United States is used to
heat and cool buildings (ref. 1). Presently that energy is almost entirely
obtained from depletable fossil fuels. If solar energy were economical,
efficient, and reliable, a significant portion of the fossil fuels used for
heating and cooling could be conserved for other purposes.
NASA is constructing a new office building at its Langley Research
Center at Hampton, Virginia, that will use solar energy for heating and
cooling (ref. 2). A conventional hot water space heating system and an
adsorption refrigeration (cooling) system will be used.
One of the most important components in any solar system is the col-
2
lector. The function of the collector is to absorb solar energy and transfer
it to a working fluid. The thermal energy thus obtained is used directly in
the heating and cooling equipment or is stored for later use. NASA Lewis is
conducting a program to find the most practical and practicable collector
systems. The results will provide the basis for selecting the collectors
for the Langley building. A test facility incorporating a solar simulator
has been built to evaluate solar collectors under controlled conditions.
Reference 3 discusses the merits of using a solar simulator to evaluate
collectors among them: (The key performance parameters can be determined
with the simulator using standard test procedures. Modifications can be
made to collector components, and the effect of the modification readily
determined.)
This paper presents a detailed description of the NASA-Lewis collector
test facility, and some performance data for the five collectors tested in
the facility to date.
EXPERIMENTAL FACILITY
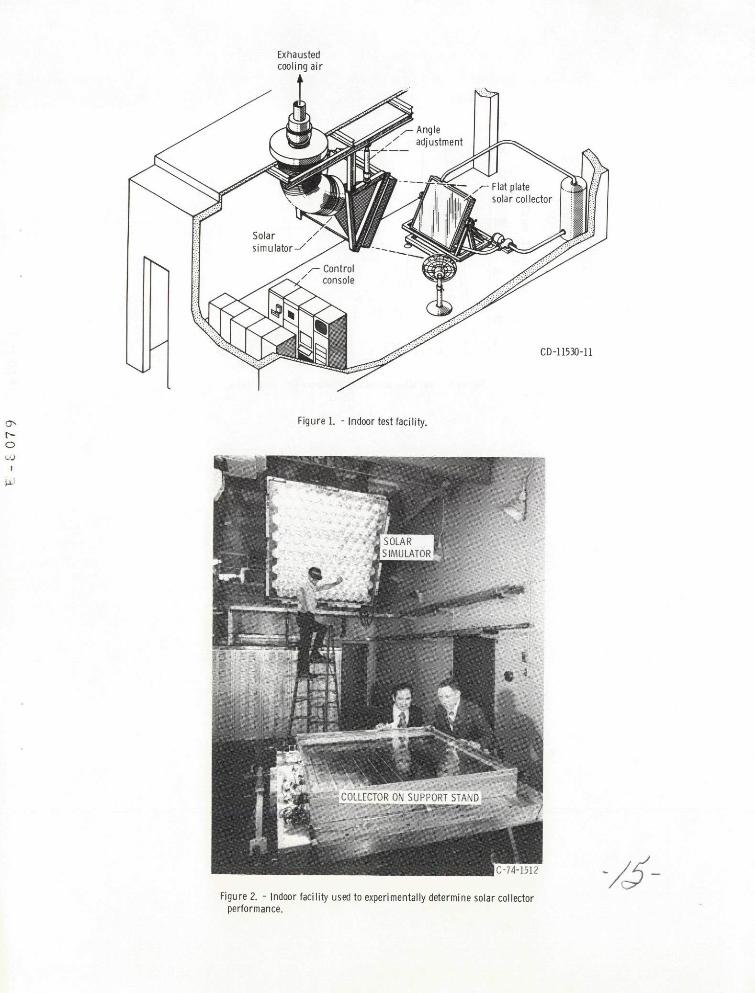
A drawing and a photograph of the facility are presented in figures 1
and 2. The primary components of the facility are the light source (solar
simulator), the liquid flow loop, and the instrumentation and data acqui-
sition equipment. A summary of information describing the facility is pre-
sented in table I.
Solar Simulator
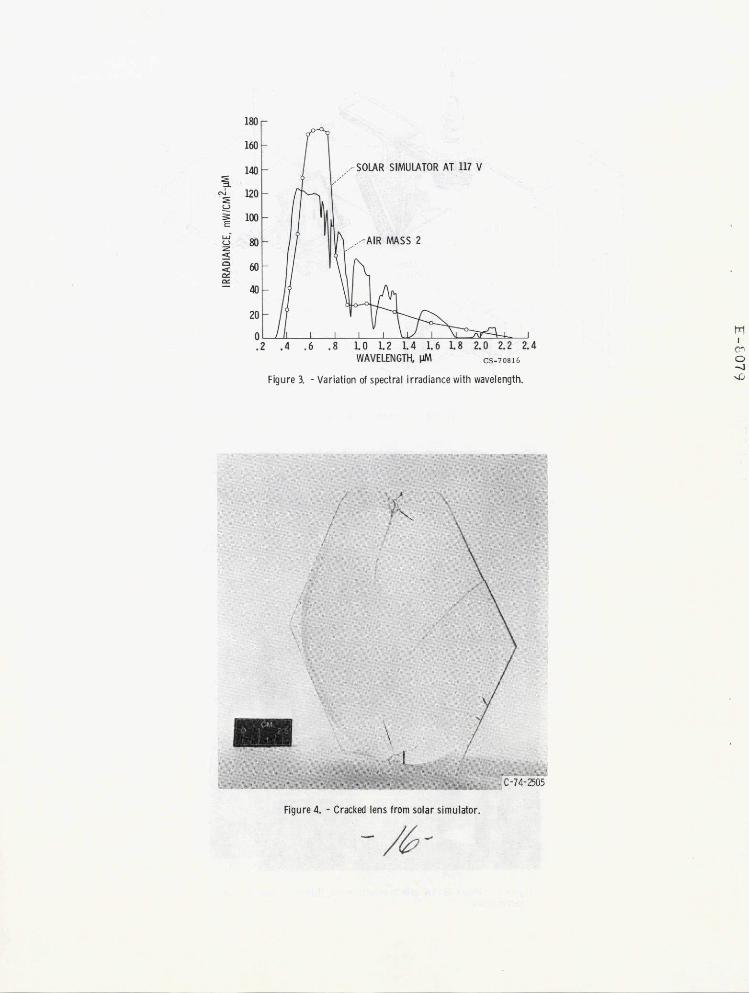
The solar simulator provides a good approximation of an air-mass 2
spectrum (ref. 4). The variation of spectral irradiance as a function of
wavelength is shown in figure 3 for both the simulator and for air-mass 2.
3
A useful method of determining how well a solar simulator's spectral
distribution matches the sun is to compare how various materials respond
when irradiated by the simulator and by the sun (refs. 5 and 6). Table II
provides a comparison of properties, including absorptivity of a selective
coating (ref. 7) the transmittance of ordinary window glass, the reflectance
of a silicon oxide coated aluminum mirror (ref. 8), and the calculated effi-
ciency of a silicon solar cell (ref. 6), under radiant flux with the spectral
distribution of air mass 2 and of the solar simulator. The spectral irra-
diance from the simulator was shown to be essentially constant over the
range of lamp voltages used during testing (90 to 120 V) (ref. 4).
The simulator is composed of lamps, lenses, and cooling equipment.
The lamps are commercially available units (General Electric model ELH)
consisting of an integral tungsten-halogen lamp and reflector assembly.
The reflector has a dichroic coating that absorbs infra-red radiation,
thereby reducing the infra-red content of the reflected radiation. During
operation the lamp voltage is adjusted with two autotransformers, each
transformer supplying power to half the lamps.
The lenses are commercially available fresnel type (Cryton Optics, Inc.).
The acrylic plastic is specified as optical grade. During initial operation of
the simulator several lenses cracked and had to be replaced. The cracking
occurred in two ways; around the screw holes, and also along the outside
edges (see fig. 4).
Cracking around the screw hole was eliminated by fabric-reinforced
neoprene washers placed between the screws and the lenses. Cracks also
were found to originate at small nicks along the straight edges of the orig-
4
inal set of lenses. The nicks occurred during cutting of the lens to a hex-
agonal shape from the square lens blank. The replacement lenses were cut
slightly oversize, approximately 1/32 inch, and then sanded to final size.
No cracking has occurred with the replacement lenses.
One simulator design question that occurs repeatedly concerns the op-
erating life of the tungsten-halogen lamps used in the simulator. To date,
two sets of lamps have been used. The original set was operated for 35 hours
before the rate of lamp failure dictated replacing the entire array. An in-
vestigation disclosed that the quartz envelope of the bulb was operating at
too low a temperature. The flow rate of the cooling air was reduced and
the second set of lamps was recently replaced after about 65 hours of op-
eration. Provision is now being made to monitor the lamp temperature on
several lamps during operation, and to regulate the air flow rate to main-
tain the temperatures within the limits of 4500 F to 5500 F to increase lamp
life.
Coolant Flow Loop
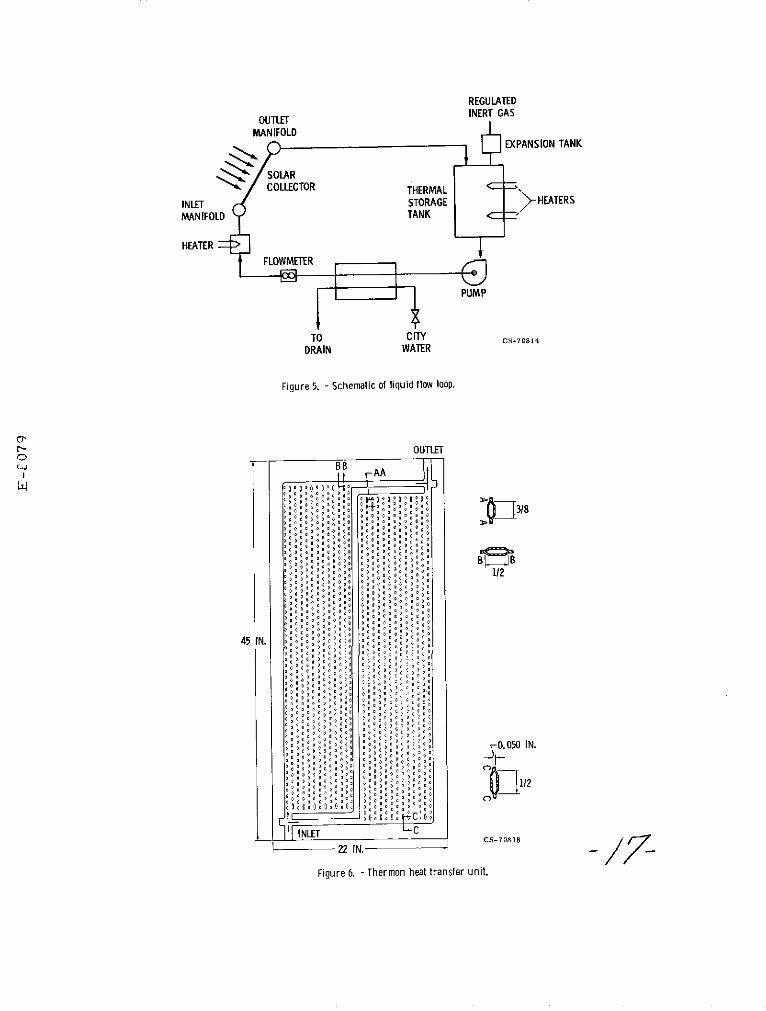
The flow loop consists of storage and expansion tanks, pump, filter,
test collector, and the required piping shown schematically in figure 5.
The hot fluid storage tank is a commercially available water heater for home
use. The tank has two electrical immersion heaters, 5 kilowatts each, and
has a capacity of 80 gallons. The pump is a gear type unit driven by a 1/4
horsepower electric motor through a variable speed drive.
A heat-exchanger using city water as a coolant is used to control the
temperature of the collector coolant fluid at the collector inlet. A one kil-
owatt immersion heater was added near the collector inlet to compensate
5
for heat loss from the piping between the storage tank and the collector.
Collector inlet temperatures were limited to about 1750 F without the ad-
ditional heater.
A mixture of ethylene-glycol and water was used in the liquid loop.
The specific gravity of the mixture was checked with a precision grade
hydrometer at the start and finish of testing for each collector. The entire
flow loop was pressurized to approximately 15 psig by applying a regulated
inert gas pressure to the top of the expansion tank.
The collector to be tested was mounted on a support stand that allows
rotation about either the horizontal axis or the vertical axis. This permits
variation of the incident angle of the radiant energy to simulate both sea-
sonal and daily variations.
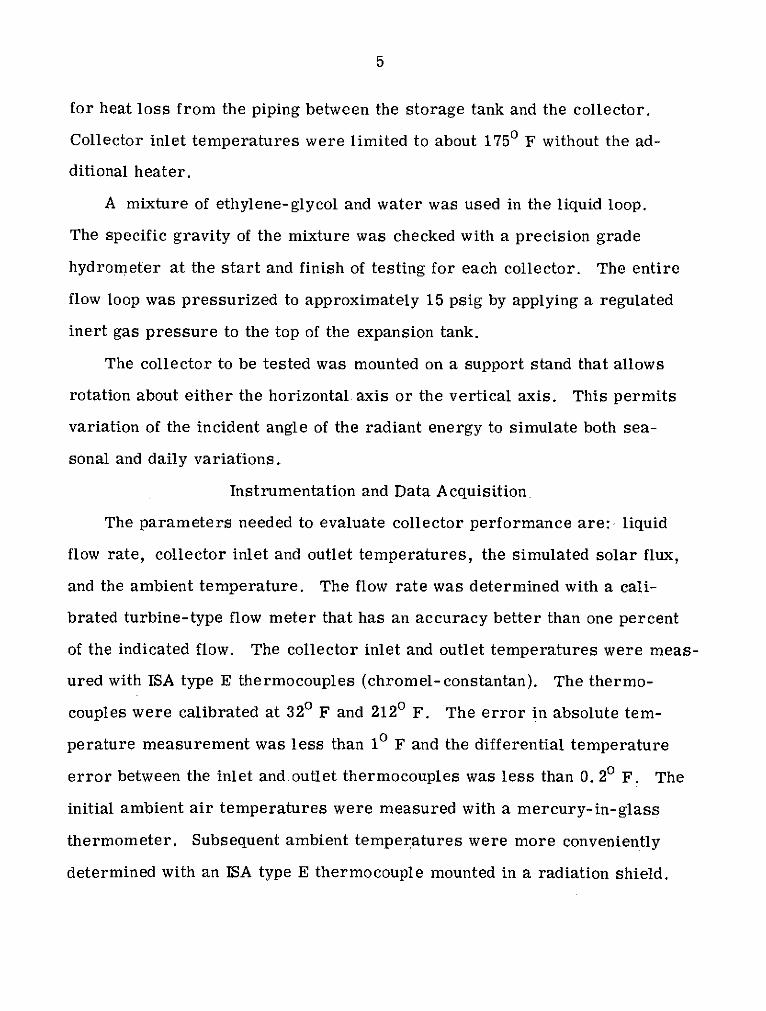
Instrumentation and Data Acquisition
The parameters needed to evaluate collector performance are: liquid
flow rate, collector inlet and outlet temperatures, the simulated solar flux,
and the ambient temperature. The flow rate was determined with a cali-
brated turbine-type flow meter that has an accuracy better than one percent
of the indicated flow. The collector inlet and outlet temperatures were meas-
ured with ISA type E thermocouples (chromel-constantan). The thermo-
couples were calibrated at 320 F and 2120 F. The error in absolute tem-
perature measurement was less than 10 F and the differential temperature
error between the inlet and.outlet thermocouples was less than 0. 20 F. The
initial ambient air temperatures were measured with a mercury-in-glass
thermometer. Subsequent ambient temperatures were more conveniently
determined with an ISA type E thermocouple mounted in a radiation shield.
6
The simulated solar flux was measured with a water-cooled Gardon type
radiometer having a sapphire window. The radiometer was calibrated
with a National Bureau of Standards irradiance standard.
The millivolt-level electrical outputs of the instruments were measured
with a digital voltmeter and recorded manually. Recently the data acqui-
sition has been automated. Digitized data is now recorded on magnetic tape,
reduced in a digital computer, and printed out in the test facility within
minutes after being recorded. This allows a more rapid evaluation of test
results as they are obtained.
TEST PROCEDURE
The collectors were mounted on the test stand, and positioned so that
the radiant flux was normal to the collector, which was tilted 600 from the
horizontal. The flow rate was adjusted to a value corresponding to 10 pounds
per hour per square foot of collector absorber area. When the collector
inlet temperature was obtained, the desired radiant flux was obtained by
adjusting the lamp voltage. After steady-state conditions occurred, usually
in 10-15 minutes, data were recorded. The radiant flux was then readjusted
to a second value at the same collector inlet temperature, steady-state
conditions obtained, and data again recorded. The collector inlet temper-
ature was then varied and the procedure repeated.
DESCRIPTION OF COLLECTORS
This report presents data obtained for five solar collectors including:
a unit fabricated at Lewis for the primary purpose of checking out the
facility, two types purchased from Professor E. Barber of Yale University,
and two identical commercial "Solapak" units purchased from Beasley
7
Industries of South Australia. A general description of each collector
follows.
Collector Fabricated at Lewis
Two commercially available copper heat transfer panels (Thermon
Manufacturing Company) were connected in a parallel flow arrangement and
mounted in a common frame. Each panel was nominally 22 by 45 inches,
and the outside dimensions of the frame were 48 by 49 inches. The waffle-
like panel construction, figure 6, results in a large percentage of the ab-
sorbing area being wetted by the working fluid. A non-selective black
paint, Nextel Velvet Coating (3M Company) was sprayed on the absorbing
side of the panels. Two glass covers, one inch apart, were placed over the
panels and 4 inches of fiberglass insulation were installed in back of the
panels. The inlet temperature and mixed outlet temperature were used to
determine performance of the collector, along with the measured radiant
flux.
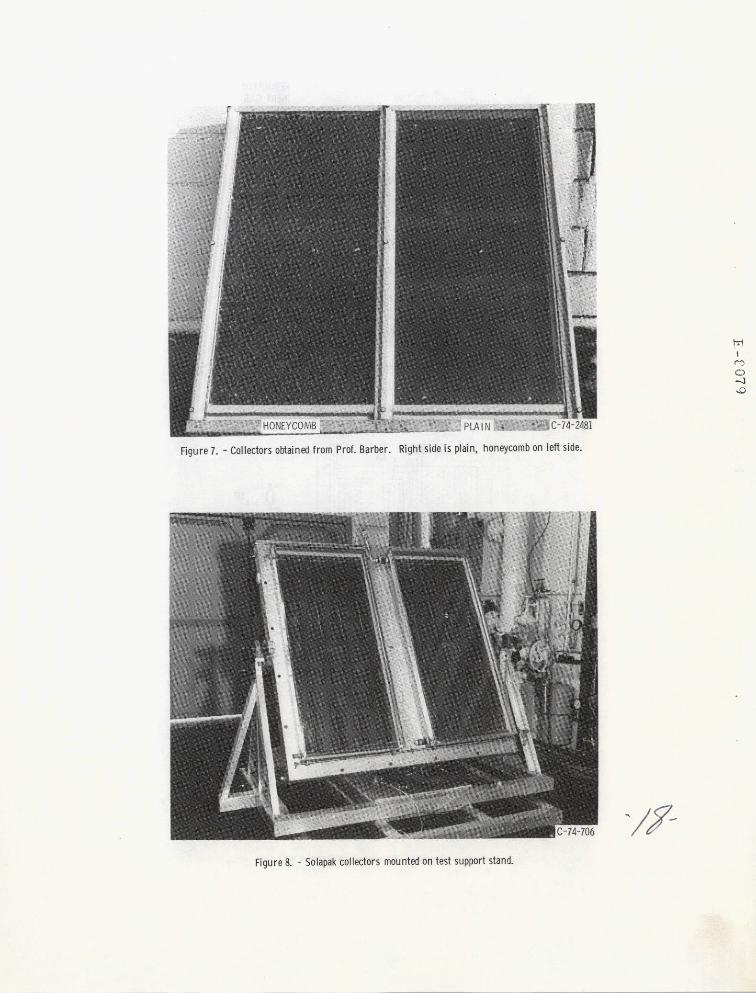
Collectors Obtained From Professor Barber
Two separate collectors were supplied in a common frame as shown in
figure 7. Each collector incorporated a copper sheet absorber with a single-
pass, "serpentine" shaped copper tube bonded to the sheet. The surface of
each sheet had a selective coating. One collector incorporated a honeycomb
consisting of individual tubes rolled from thin aluminum foil. The foil tubes
rested on the absorbing sheet. Each absorber sheet was nominally 20. 75
by 48 inches and the frame size was 48. 25 by 51. 5 inches. A single glass
cover was installed over each absorber, and 4. 5 inches of fiberglass in-
sulation was placed behind the absorbers. Each collector was tested indi-
8
vidually. The two collectors obtained from Prof. Barber were prototype
models. Modified collectors are now reported to be available.
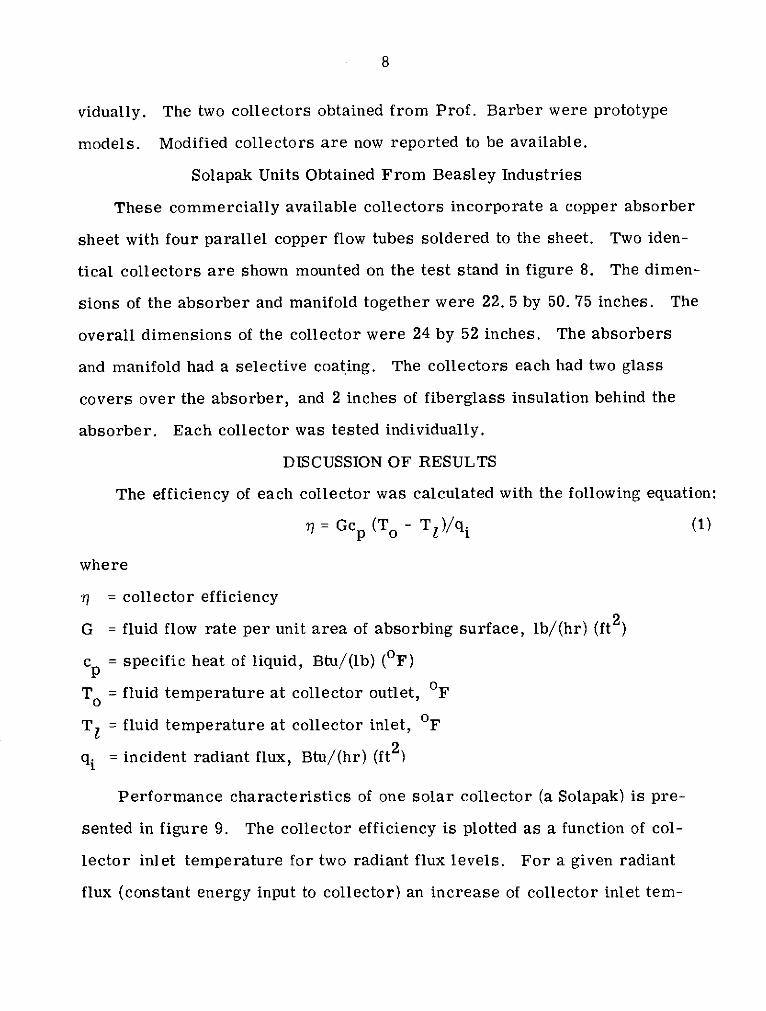
Solapak Units Obtained From Beasley Industries
These commercially available collectors incorporate a copper absorber
sheet with four parallel copper flow tubes soldered to the sheet. Two iden-
tical collectors are shown mounted on the test stand in figure 8. The dimen-
sions of the absorber and manifold together were 22. 5 by 50. 75 inches. The
overall dimensions of the collector were 24 by 52 inches. The absorbers
and manifold had a selective coating. The collectors each had two glass
covers over the absorber, and 2 inches of fiberglass insulation behind the
absorber. Each collector was tested individually.
DISCUSSION OF RESULTS
The efficiency of each collector was calculated with the following equation:
7 = Gcp (T - T )/q i (1)
where
77 = collector efficiency
G = fluid flow rate per unit area of absorbing surface, lb/(hr) (ft 2 )
cp = specific heat of liquid, Btu/(lb) (OF)
T o = fluid temperature at collector outlet, OF
TI = fluid temperature at collector inlet, OF
qi = incident radiant flux, Btu/(hr) (ft 2 )
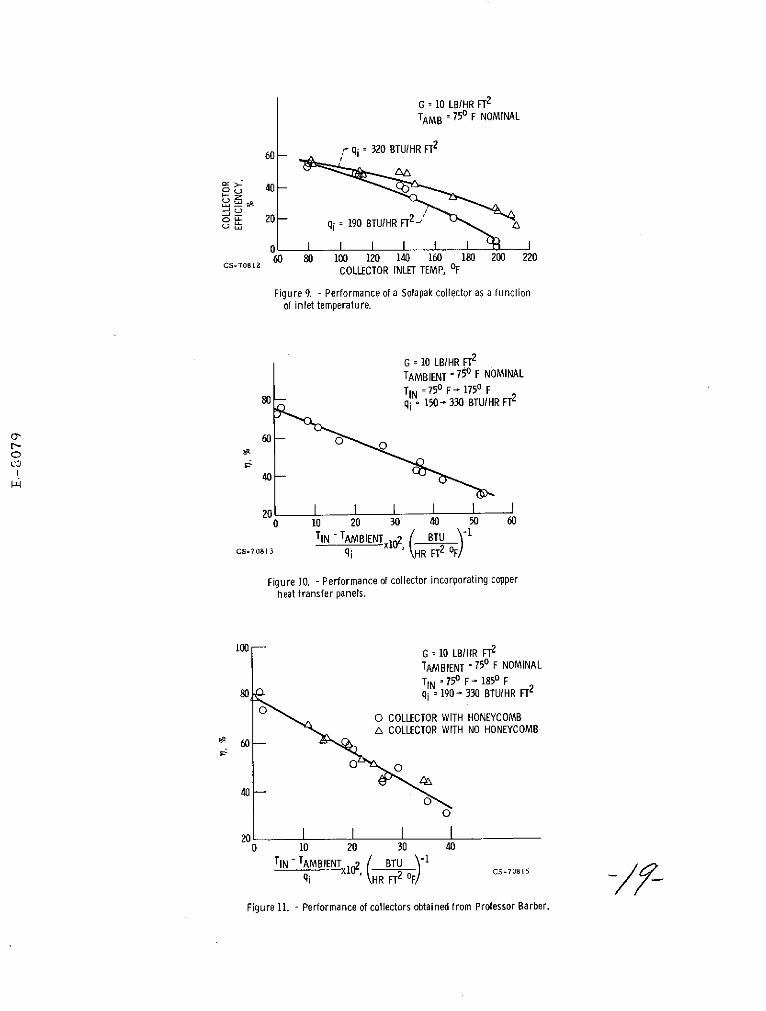
Performance characteristics of one solar collector (a Solapak) is pre-
sented in figure 9. The collector efficiency is plotted as a function of col-
lector inlet temperature for two radiant flux levels. For a given radiant
flux (constant energy input to collector) an increase of collector inlet tem-
9
perature increased the heat loss from the collector and consequently the
collector efficiency decreased. When the radiant flux was increased (in-
creased energy input to collector) at a given fluid inlet temperature, the heat
loss from the collector remained about constant, and the collector efficiency
therefore increased.
Reference 9 presents several factors useful in the design of solar col-
lectors. One factor, FR, the collector plate flow efficiency factor is defined
as the ratio of actual useful heat collected to the useful heat that would have
been collected if the entire absorber surface had been at the temperature
of the fluid at the collector inlet. This factor, FR, is related to the col-
lector efficiency by:
FR UL (T1 - Ta) (2)7 = F R a- (2)
where
a = absorptivity of absorbing surface, dimensionless
T = transmittance of the glass cover assembly, dimensionless
UL = collector overall heat 1 oss coefficient, Btu/(hr) (ft 2 ) (OF)
T l = fluid temperature at collector inlet, OF
Ta = ambient temperature, OF
qi = incident radiant flux, Btu/(hr) (ft 2)
As shown in references 3 and 10, when collector efficiency is plotted
as a function of (TI - Ta)/q i , the parameters FR and UL can be readily
determined. The data for all five collectors tested are presented in this
form in figures 10, 11, and 12. The data for the two collectors obtained
10
from Prof. Barber figure 11 indicate that the performance of the collector
with the honeycombs was not significantly different than the one without the
honeycombs. A single performance line is therefore shown on the figure.
No significant difference in collector performance was evident for the two
identical Solapak collectors, so a single line is also presented in figure 12
for that collector type.
When T = Ta, the corresponding value of collector efficiency is equal
to the product of FR, a, and 7. The absorptivity of the absorber surface,
a, and the transmittance of the glass, 7, were determined experimentally
for each collector, enabling determination of FR for each collector. The
slope of the line through the data is equal to the product of FR and UL.
Having determined FR, the overall heat loss coefficient, UL, was then
determined. The values for these performance parameters, calculated by
the method of Whiller (ref. 11), are presented in table III for the collectors
tested.
Table III displays the key parameters which determine collector per-
formance and also cites the relative strengths and weaknesses of the col-
lectors tested. The rather high values of FR are typical of copper collectors.
The slightly lower value for the Solapak collector is possibly due to incom-
plete bonding of the tubes to the absorber plate. The very low emissivity
value of the Solapak collector compared to the Lewis collector suggests that
the overall heat loss coefficient, UL, should be 1 ower for the Solapak col-
lector than shown. When conduction losses are subtracted out from these
UL values, heat loss coefficients of 0. 80 and 0. 66 are obtained for the
Lewis and Solapak collectors respectively. This represents an 18 percent
11
difference as compared to only a percent difference in UL. This can be
attributed to the greater thickness of insulation present in the Lewis collector.
Table III also indicates that the collector obtained from Prof. Barber did
not exhibit the low heat loss normally expected from a selective surface.
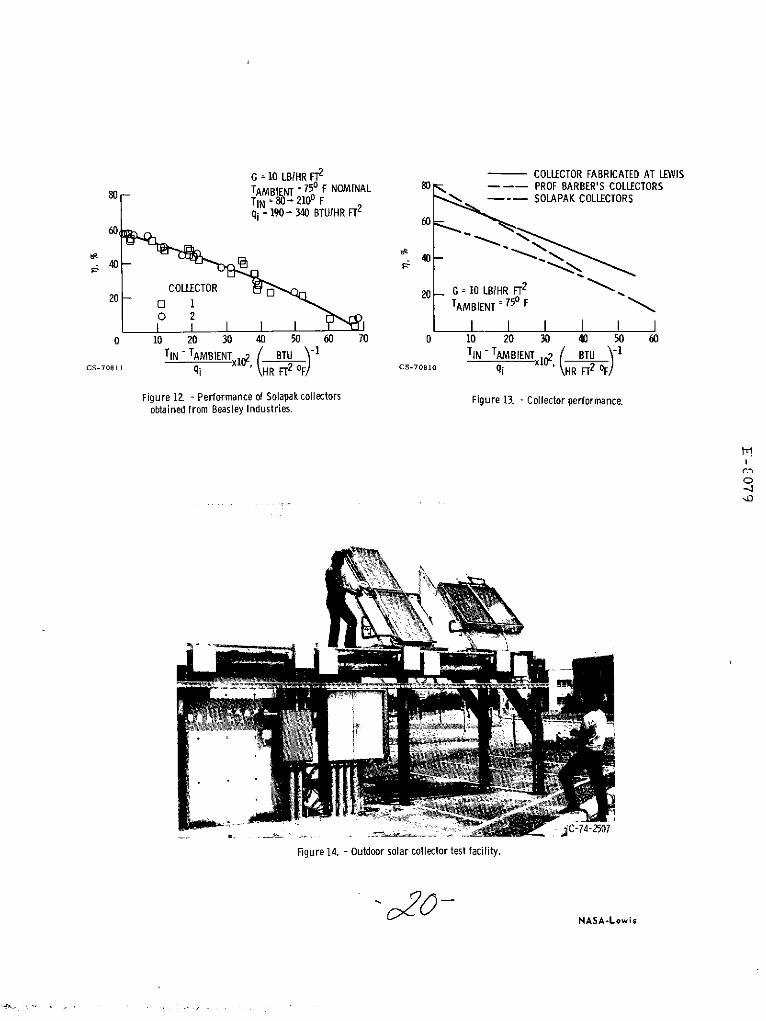
The effect of these collector characteristics on collector performance
becomes apparent from figure 13, where the performance of all collectors
is presented. The transmittance of each glass cover was about the same
(see table III). Therefore, the single cover and relatively high value of
absorptivity for the collectors supplied by Prof. Barber explains why they
had the highest efficiency at low values of (T1 - Ta)/q. As the inlet tem-
perature was increased, the heat loss through the single cover was larger
than that through the two glass covers. Therefore the performance of the
collectors with a single cover decreases more rapidly than the performance
of the collectors with two covers.
The Solapak collectors had the lowest efficiency as a result of the two
glass covers and a relatively low absorptivity of 0. 86. The collector fab-
ricated from the copper heat transfer panels benefitted from the high per-
centage of absorber area wetted by the fluid, and a relatively high value of
absorptivity, 0. 97. The heat loss for the collectors with two covers was
about the same, as indicated by almost parallel performance shown on
figure 13. The Solapak collectors had a lower emissivity, 0. 10 at 8 microns,
than the nonselective paint applied to the copper panels, E = 0. 97 at 8 microns.
This effect tended to be offset by the difference in insulation thickness for
the two types of collectors. The Solapak collectors had two inches of in-
sulation behind the absorber, while there was four inches of insulation in
12
back of the copper panels.
In addition to the continuing indoor tests, outdoor testing of collectors
will begin soon at Lewis Research Center. A facility has been con-
structed, figure 14, with the capability of obtaining data for ten col-
lectors operating simultaneously. The outdoor facility is presently
in the final check-out phase. This facility can accommodate collector
sizes up to 4- by 8 -foot.
REFERENCES
1. Solar Energy as a National Energy Resource NSF/NASA Solar Energy
Panel (1972).
2. R. G. Ragsdale and D. Namkoong, Jr., The NASA Langley Building
Solar Project and the Supporting Lewis Solar Technology Program NASA
TM X- 71600, National Aeronautics and Space Administration, Wash-
ington, D.C. (1974).
3. F. F. Simon and P. Harlemert, Flat-Plate Collector Performance Eval-
uation, The Case for a Solar Simulation Approach. NASA TM X-71427,
National Aeronautics and Space Administration, Washington, D.C. (1973).
4. K. Yass and H. B. Curtis, Low-cost Air Mass 2 Solar Simulator NASA
TM X-3059, National Aeronautics and Space Administration,
Washington, D. C. (1973).
5. R. E. Gaumer, E. R. Streed, and T. F. Vajta, Methods for Experimental
Determination of the Extra-Terrestial Solar Absorptance of Spacecraft
Materials. Measurement of Thermal Radiation Properties of Solids,
NASA SP-31, pp. 135-146 (1963). (National Aeronautics and Space
Administration, Washington, D.C.).
13
6. A. B. Curtis, Effect of Error in Spectral Measurements of Solar Sim-
ulators on Surface Response. NASA TN D-5904, National Aeronautics
and Space Administration, Washington, D.C. (1970).
7. D. K. Edwards and R. D. Roddick, Basic Studies on the Use and Control
of Solar Energy. Rept. 62-27, University of California, Los Angeles,
Calif. (1962).
8. G. Hass and N. W. Scott, Silicon Monoxide Protected Front-Surface
Mirrors. J. Opt. Soc. Am., 39 (2), 179-184 (1949).
9. A. Whillier, Solar Energy Collection and Its Utilization for House Heating
D. So. Thesis, Dept. Mech. Engr. Massachusetts Institute of Tech-
nology (1953).
10. G. L. Gupta and H. P. Garg, Performance Studies on Solar Air Heaters.
Solar Energy, 11 (1), 25-31 (1967).
11. A. Whillier, Design Factors Influencing Solar Collector Performance.
American Society Heating, Refrigeration and Air Conditioning En-
gineers, Technical Committee on Solar Energy Utilization, pp. 27-40
(1967).
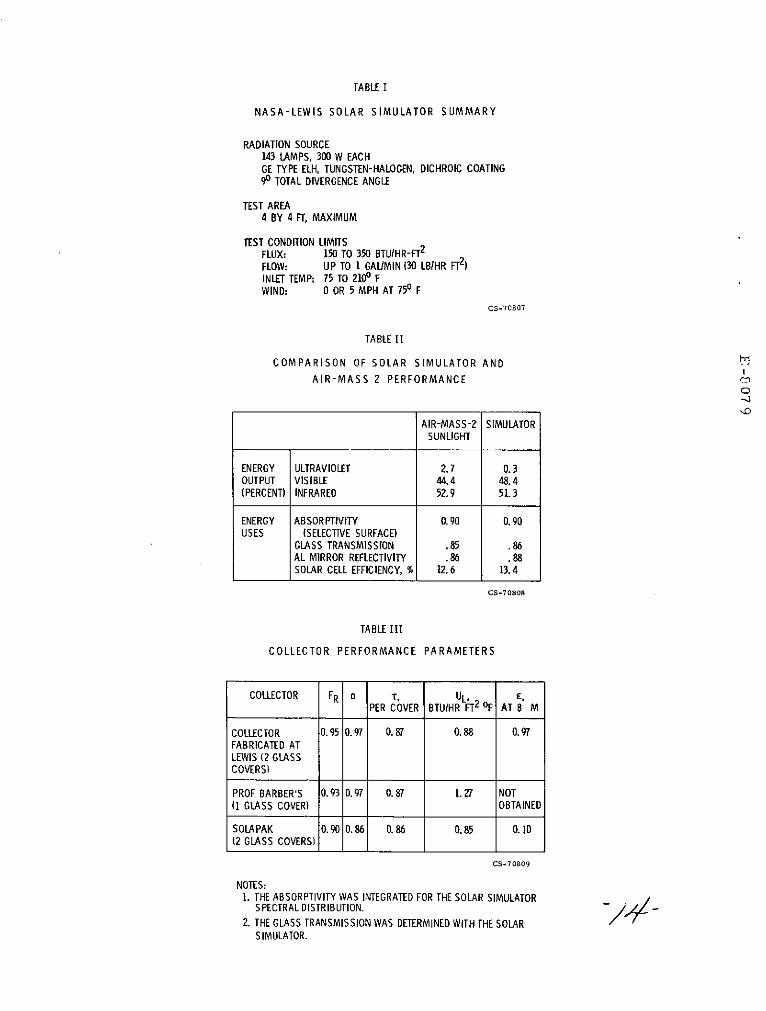
TABLE I
NASA-LEWIS SOLAR SIMULATOR SUMMARY
RADIATION SOURCE143 LAMPS, 300 W EACHGE TYPE ELH, TUNGSTEN-HALOGEN, DICHROIC COATING90 TOTAL DIVERGENCE ANGLE
TEST AREA4 BY 4 FT, MAXIMUM
TEST CONDITION LIMITSFLUX: 150 TO 350 BTUIHR-FT 2
FLOW: UP TO 1 GALIMIN (30 LBIHR FT2)INLET TEMP: 75 TO 2100 FWIND: 0 OR 5 MPH AT 750 F
CS-70807
TABLE II
COMPARISON OF SOLAR SIMULATOR AND
AIR-MASS 2 PERFORMANCE r:
C)
AIR-MASS-2 SIMULATORSUNLIGHT
ENERGY ULTRAVIOLET 2.7 0.3OUTPUT VISIBLE 44.4 48.4(PERCENT) INFRARED 52.9 51.3
ENERGY ABSORPTIVITY 0.90 0.90USES (SELECTIVE SURFACE)
GLASS TRANSMISSION .85 .86AL MIRROR REFLECTIVITY .86 .88SOLAR CELL EFFICIENCY, % 12.6 13.4
CS-70808
TABLE III
COLLECTOR PERFORMANCE PARAMETERS
COLLECTOR FR a r, UL, E,PER COVER BTUIHR FT2 OF AT 8 M
COLLECTOR 0.95 0.97 0.87 0.88 0.97FABRICATED ATLEWIS (2 GLASSCOVERS)
PROF BARBER'S 0.93 0.97 0.87 1.27 NOT(1 GLASS COVER) OBTAINED
SOLAPAK 0.90 0.86 0.86 0.85 0.10(2 GLASS COVERS)
CS-70809
NOTES:1. THE ABSORPTIVITY WAS INTEGRATED FOR THE SOLAR SIMULATOR
SPECTRAL DISTRIBUTION.2. THE GLASS TRANSMISSION WAS DETERMINED WITH THE SOLAR
SIMULATOR.
Exhaustedcooling air
- Angleadjustment
-Flat platesolar collector
Solar ,
- Controlconsole
CD-1150-11
Figure 1. - Indoor test facility.
S ; SIMULATOR
C-74-1512
Figure 2. - Indoor facility used to experimentally determine solar collectorperformance.
180
160
140 - -SOLAR SIMULATOR AT 117 V
120 -
S100 -
80 ...- ,-AIR MASS 2
220
.2 .4 .6 .8 1.0 L2 1.4 1.6 1.8 2.0 2.2 2.4CWAVELENGTH, PM CS-70816 o.-.3
Figure 3. - Variation of spectral irradiance with wavelength.
C-74-250
Figure 4. - Cracked lens from solar simulator.
--~ -6-c~~i~
tsz
0 -
Z
C'
gs B
6LO
3-3
a& .
A
AY
T
C
u oC
- -
.--------
""" E
04
"C.
...........-............
0o
O
C
'
"---I-- ^------
~ ~
~o~
~"""~
lI Y
.... ....
o-
o~OO
D00rD
O
C
--------------------------------
~.,,,,,,..,,,
,,,,, .............
oo
&..............
.............---
-0
00
Lu
z
6 L 0.3-
HONEYCOMB PLAIN C-74-2481
Figure 7. - Collectors obtained from Prof. Barber. Right side is plain, honeycomb on left side.
C-74-706
Figure 8. - Solapak collectors mounted on test support stand.
G = 10 LBHR FT2
TAMB 750 F NOMINAL
60- q i = 320 BTU/HR FT2
0L 40
E 20 - i = 190 BTUIHR FT2
60 80 100 120 140 160 180 200 220cs-70812 COLLECTOR INLET TEMP, OF
Figure 9. - Performance of a Solapak collector as a functionof inlet temperature.
G = 10 LB/HR FT2
TAMBIENT = 750 F NOMINAL
TIN =750 F - 1750 F
80 -- q = 150- 330 BTU/HR FT2
60 O
40
0
0 10 20 30 40 50 60
TIN TAMBIENTX, BTU .1CS-7081 3i \HR FT2 OF
Figure 10. - Performance of collector incorporating copperheat transfer panels.
100 G = 10 LBHR FT2
TAMBIENT = 750 F NOMINAL
TIN = 750 F- 1850 F80 qi = 190- 330 BTUIHR FT2
O COLLECTOR WITH HONEYCOMBZ COLLECTOR WITH NO HONEYCOMB
60 -
40 -0
2000 10 20 30 40
TIN - TAMBIENT BTU CS708qi x , \HR FT2 oF cs-os
Figure 11. - Performance of collectors obtained from Professor Barber.
G = 10 LB/HR FT2 COLLECTOR FABRICATED AT LEWIS
80 TAMBIENT = 750 F NOMINAL 80 --- PROF BARBER'S COLLECTORSTIN = 80- 2100 F - -- SOLAPAK COLLECTORS
qi = 190- 340 BTUIHR FT2
60
-40 40
20COLLECTOR 20 - G = 10 LBIHR FT2
20 1 TAMBIENT = 750 F0 2
0 10 20 30 40 50 60 70 0 10 20 30 40 50 60
TIN - TAMBIENT 1 / BTU -1 TIN - TAMBIENT (R BT U 'S-7081i HR FT2 OF S-70810 gi HR FT2 oF
Figure 12. - Performance of Solapak collectors Figure 13. - Collector performance.obtained from Beasley Industries.
- C-74-2507
Figure 14. - Outdoor solar collector test facility.
NASA-Lewis