Embed Size (px)
Citation preview

A BOBIT PUBLICATION
FLEET
TOP 100 SCHOOL DISTRICT FLEETSInside the nation’s biggest district bus systems
Clark County Rolls Into No. 2 Spot Atlanta Overhauls Fleet Department St. Lucie Adds Buses With 3-Point Belts
Sponsored by

New to the listOver the past year, we identified several school districts that have fleets large enough to be ranked in the Top 100 but weren’t previously. New to the list this year: • Hemet (Calif.) Unified School District.• Jefferson Parish Public School System in Marrero, Louisiana.• Lake County Schools in Tavares, Florida. • Beaverton (Ore.) School District. • Comal Independent School District in New Braunfels, Texas. • Davis School District in Farmington, Utah.• San Antonio Independent School District.• Suffolk (Va.) Public Schools.• Wilson County Schools in Lebanon, Tennessee.
Should your district be on the list? If you have about 130 or more school buses in route service (including any that are operated by contractors), you should be in the running for the
Top 100.Send an email to
[email protected] with your district’s name, number of route buses, and contact info, and we’ll send you the survey when we’re com-piling the Top 100 list next year.
WWW.SCHOOLBUSFLEET.COM
TO P 1 0 0 SC H O O L D I ST R I CT F L E E TS
Nevada’s Clark County School District has again moved closer to the top of the Top 100 School Dis-trict Fleets, this time landing at No. 2.
Last year, the Las Vegas-based district rose to No. 3 on the list and claimed the distinction of running the biggest publicly owned and operated school bus
fleet in the U.S. None of the district’s route buses are operated by contractors.
This year, Clark County moved into the second spot on the Top 100 with 1,698 route buses (which is the number that de-termines position on the list).
Still, the New York City Department of Education’s school transportation system, which is composed entirely of contrac-tor buses, remains by far the largest district fleet in the nation, with 9,000 route buses.
Los Angeles Unified School District, now No. 3 on the list, has a combined district and contractor opera-tion, with a total of 1,689 route buses.
Like Clark County, Georgia’s Gwinnett County Public Schools runs an entirely in-house transportation sys-tem. Gwinnett County is ranked No. 4 on this year’s Top 100, with 1,636 route buses.
By Thomas McMahon, Executive Editor
O F 2 01 7
New York City’s 9,000 route buses, all operated by contractors, transport the biggest ridership of any school district in the nation.
Clark County Rolls Into No. 2 SpotFor the second year in a row, the Las Vegas district’s fleet moves up in the
Top 100, this time landing between New York City and Los Angeles.
1. New York City Department of Education. . . . . . . . . . . . . . 147,1602. Fairfax County (Va.) Public Schools . . . . . . . . . . . . . . . . . . 142,6503. Gwinnett County (Ga.) Public Schools. . . . . . . . . . . . . . . . 129,9384. Clark County (Nev.) School District . . . . . . . . . . . . . . . . . . 127,9525. Charlotte-Mecklenburg (N.C.) Schools . . . . . . . . . . . . . . . 127,000
TOP 5 IN RIDERSHIPSCHOOL DISTRICT . . . . . . . . . . . . . . . . . . . . . . . . . . STUDENTS TRANSPORTED DAILY
Sponsored by
24 SCHOOL BUS FLEET OCTOBER 2017
Phot
o co
urte
sy C
lark
Cou
nty
Scho
ol D
istri
ct

1 New York City Department of Education 9,000 8,000 +1,000 10,350 6,500 3,850 10,350 147,160 24,300,000
New York City
2 Clark County School District 1,698 1,752 -54 1,957 947 1,010 0 127,952 23,000,000
Las Vegas
3 Los Angeles Unified School District 1,689 1,760 -71 2,006 1,170 519 706 44,677 12,386,098
Los Angeles
4 Gwinnett County Public Schools 1,636 1,626 +10 1,980 534 1,102 0 129,938 24,000,000
Lawrenceville, Georgia
5 School District of Philadelphia* 1,283 1,283 0 1,411 283 1,128 900 38,000 14,700,000
Philadelphia
6 Chicago Public Schools* 1,271 1,271 0 1,483 400 1,083 1,483 22,182 7,459,768
Chicago
7 Fairfax County Public Schools 1,183 1,178 +5 1,630 496 1,134 0 142,650 17,000,000
Fairfax, Virginia
8 Montgomery County Public Schools 1,156 1,150 +6 1,322 1 1,321 0 102,000 20,000,000
Rockville, Maryland
9 Prince George’s County Public Schools* 1,084 1,084 0 1,251 23 1,228 4 85,000 19,605,431
Upper Marlboro, Maryland
10 Charlotte-Mecklenburg Schools 1,078 1,052 +26 1,300 0 1,300 0 127,000 20,000,000
Charlotte, North Carolina
11 Houston Independent School District 1,026 862 +164 1,106 36 1,070 0 36,000 n/a
Houston
12 Broward County Public Schools* 998 998 0 1,248 46 1,202 0 73,000 16,000,000
Fort Lauderdale, Florida
13 Miami-Dade County Public Schools 941 n/a n/a 1,152 23 1,129 60 54,000 16,000,000
Miami
14 Cobb County School District 935 975 -40 1,171 2 1,169 0 78,000 12,425,000
Marietta, Georgia
15 Milwaukee Public Schools* 903 903 0 940 480 460 940 54,000 14,000,000
Milwaukee
16 Orange County Public Schools 901 907 -6 1,070 0 1,070 0 69,514 18,300,000
Orlando, Florida
17 Jefferson County Public Schools 900 n/a n/a 1,213 213 1,000 0 70,000 17,500,000
Louisville, Kentucky
ROUTE ROUTE CHANGE TOTAL SMALL LARGE CONTRACTOR STUDENTS ANNUAL RANK SCHOOL DISTRICT BUSES BUSES 2017 VS. BUSES BUSES BUSES BUSES TRANSPORTED ROUTE 2017 2016 2016 DAILY MILEAGE
*Most recent data available
TO P 1 0 0 SC H O O L D I ST R I CT F L E E TS O F 2 01 7Sponsored by
25OCTOBER 2017 SCHOOL BUS FLEET

TO P 1 0 0 SC H O O L D I ST R I CT F L E E TS O F 2 01 7Sponsored by
18 Hillsborough County Public Schools 883 953 -70 1,330 0 1,330 0 85,000 17,000,000
Tampa, Florida
19 Duval County Public Schools* 870 870 0 960 0 960 960 48,000 9,900,000
Jacksonville, Florida
20 DeKalb County School District* 853 853 0 952 256 696 0 65,000 11,000,000
Tucker, Georgia
21 Baltimore County Public Schools* 810 810 0 1,034 0 1,034 135 71,916 14,500,000
Baltimore, Maryland
22 School District of Palm Beach County 792 647 +145 853 0 853 0 63,800 12,000,000
West Palm Beach, Florida
23 Prince William County Schools 780 770 +10 915 260 655 0 61,000 10,500,000
Bristow, Virginia
24 School District of Lee County 778 765 +13 910 203 575 0 50,000 13,000,600
Fort Myers, Florida
25 Fulton County Schools 768 n/a n/a 965 45 920 0 79,000 12,000,000
Atlanta
26 Cypress-Fairbanks Ind. School District 742 764 -22 1,041 65 976 0 78,166 8,253,388
Houston
27 Northside Independent School District 705 720 -15 928 25 903 0 62,000 6,600,000
San Antonio
28 Buffalo City School District* 674 674 0 741 261 413 741 29,200 7,645,000
Buffalo, New York
29 Columbus City Schools 648 800 -152 871 98 773 25 44,000 12,380,000
Columbus, Ohio
30 Virginia Beach City Public Schools 630 743 -113 762 57 705 0 37,962 9,221,543
Virginia Beach, Virginia
31 Guilford County Schools 625 663 -38 690 68 622 68 37,904 9,800,000
Greensboro, North Carolina
32 Union County Educ. Svcs. Commission* 615 615 0 625 580 45 600 4,000 n/a
Westfield, New Jersey
33 Boston Public Schools 610 668 -58 747 485 262 ** 30,000 8,500,000
Boston
34 Pittsburgh Public Schools 592 n/a n/a 818 314 278 592 35,000 n/a
Pittsburgh
ROUTE ROUTE CHANGE TOTAL SMALL LARGE CONTRACTOR STUDENTS ANNUAL RANK SCHOOL DISTRICT BUSES BUSES 2017 VS. BUSES BUSES BUSES BUSES TRANSPORTED ROUTE 2017 2016 2016 DAILY MILEAGE
*Most recent data available **Buses owned by district, operated by contractor
WWW.SCHOOLBUSFLEET.COM26 SCHOOL BUS FLEET OCTOBER 2017

TO P 1 0 0 SC H O O L D I ST R I CT F L E E TS O F 2 01 7Sponsored by
35 Metropolitan Nashville Public Schools 561 n/a n/a 750 79 671 67 45,058 4,118,839
Nashville, Tennessee
36 Chesterfield County Public Schools 524 520 +4 645 0 524 0 45,000 4,500,000
Chesterfield, Virginia
37 Polk County Public Schools 511 n/a n/a 639 0 511 0 50,000 6,700,000
Bartow, Florida
38 Henrico County Public Schools 474 477 -3 622 6 616 0 30,080 8,686,505
Richmond, Virginia
39 Howard County Public School System 453 453 0 570 126 327 453 40,000 5,500,000
Ellicott City, Maryland
40 Cumberland County Schools 436 n/a n/a 481 0 436 0 25,946 4,667,940
Fayetteville, North Carolina
41 Harford County Public Schools 432 432 0 495 115 380 380 31,558 7,767,074
Bel Air, Maryland
42 Katy Independent School District 414 383 +31 661 0 661 0 26,500 4,300,000
Katy, Texas
43 Jefferson County Schools 412 420 -8 516 0 516 0 20,890 4,000,000
Birmingham, Alabama
44 San Diego Unified School District 400 n/a n/a 520 120 280 0 10,100 6,000,000
San Diego
44 Austin Independent School District 400 390 +10 513 232 281 0 22,000 5,200,000
Austin, Texas
44 Mesa Public Schools 400 419 -19 541 n/a n/a 0 40,000 n/a
Mesa, Arizona
47 St. Paul Public Schools 385 330 +55 491 107 278 355 28,000 7,260,000
St. Paul, Minnesota
48 Conroe Independent School District 384 369 +15 545 110 435 0 39,090 7,374,563
Conroe, Texas
49 Anoka-Hennepin School District 370 360 +10 400 160 210 400 36,000 6,500,000
Anoka, Minnesota
50 Greenville County Schools 361 361 0 389 n/a n/a 0 26,000 5,000,000
Greenville, South Carolina
51 Brevard Public Schools 360 360 0 535 0 535 0 23,000 6,500,000
Cocoa, Florida
ROUTE ROUTE CHANGE TOTAL SMALL LARGE CONTRACTOR STUDENTS ANNUAL RANK SCHOOL DISTRICT BUSES BUSES 2017 VS. BUSES BUSES BUSES BUSES TRANSPORTED ROUTE 2017 2016 2016 DAILY MILEAGE
27OCTOBER 2017 SCHOOL BUS FLEET
TO P 1 0 0 SC H O O L D I ST R I CT F L E E TS O F 2 01 7Sponsored by
WWW.SCHOOLBUSFLEET.COM
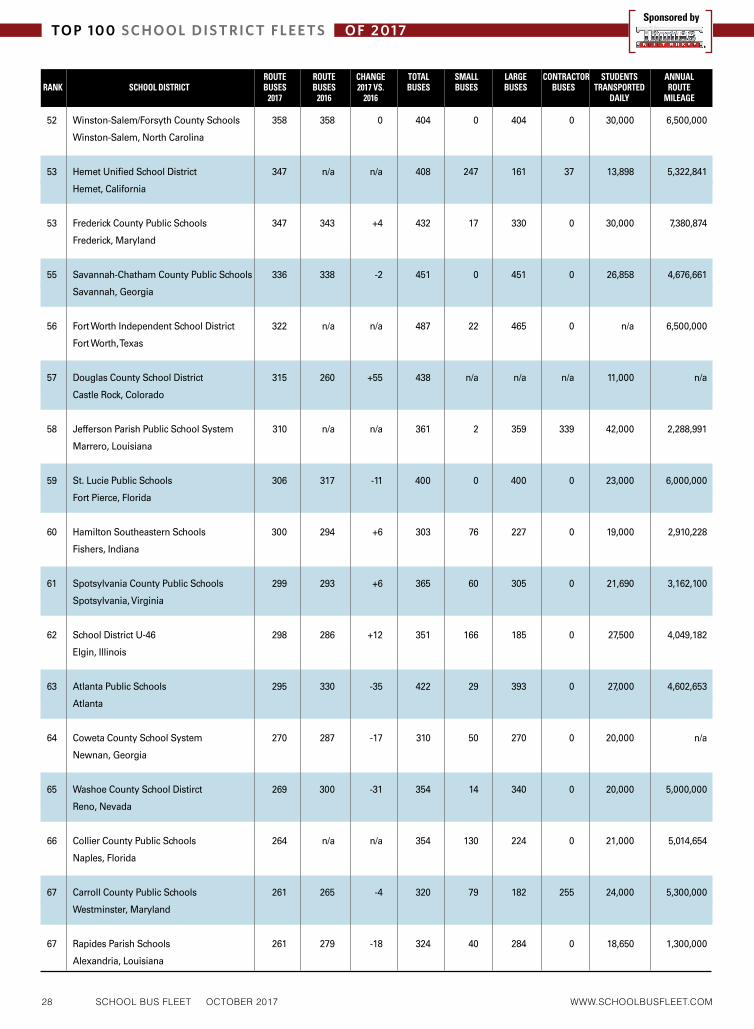
52 Winston-Salem/Forsyth County Schools 358 358 0 404 0 404 0 30,000 6,500,000
Winston-Salem, North Carolina
53 Hemet Unified School District 347 n/a n/a 408 247 161 37 13,898 5,322,841
Hemet, California
53 Frederick County Public Schools 347 343 +4 432 17 330 0 30,000 7,380,874
Frederick, Maryland
55 Savannah-Chatham County Public Schools 336 338 -2 451 0 451 0 26,858 4,676,661
Savannah, Georgia
56 Fort Worth Independent School District 322 n/a n/a 487 22 465 0 n/a 6,500,000
Fort Worth, Texas
57 Douglas County School District 315 260 +55 438 n/a n/a n/a 11,000 n/a
Castle Rock, Colorado
58 Jefferson Parish Public School System 310 n/a n/a 361 2 359 339 42,000 2,288,991
Marrero, Louisiana
59 St. Lucie Public Schools 306 317 -11 400 0 400 0 23,000 6,000,000
Fort Pierce, Florida
60 Hamilton Southeastern Schools 300 294 +6 303 76 227 0 19,000 2,910,228
Fishers, Indiana
61 Spotsylvania County Public Schools 299 293 +6 365 60 305 0 21,690 3,162,100
Spotsylvania, Virginia
62 School District U-46 298 286 +12 351 166 185 0 27,500 4,049,182
Elgin, Illinois
63 Atlanta Public Schools 295 330 -35 422 29 393 0 27,000 4,602,653
Atlanta
64 Coweta County School System 270 287 -17 310 50 270 0 20,000 n/a
Newnan, Georgia
65 Washoe County School Distirct 269 300 -31 354 14 340 0 20,000 5,000,000
Reno, Nevada
66 Collier County Public Schools 264 n/a n/a 354 130 224 0 21,000 5,014,654
Naples, Florida
67 Carroll County Public Schools 261 265 -4 320 79 182 255 24,000 5,300,000
Westminster, Maryland
67 Rapides Parish Schools 261 279 -18 324 40 284 0 18,650 1,300,000
Alexandria, Louisiana
ROUTE ROUTE CHANGE TOTAL SMALL LARGE CONTRACTOR STUDENTS ANNUAL RANK SCHOOL DISTRICT BUSES BUSES 2017 VS. BUSES BUSES BUSES BUSES TRANSPORTED ROUTE 2017 2016 2016 DAILY MILEAGE
28 SCHOOL BUS FLEET OCTOBER 2017

TO P 1 0 0 SC H O O L D I ST R I CT F L E E TS O F 2 01 7Sponsored by
69 Portland Public Schools 260 245 +15 297 178 119 208 8,501 4,240,000
Portland, Oregon
69 Plano Independent School District 260 210 +50 285 95 190 0 15,000 3,500,000
McKinney, Texas
71 Central Bucks School District 257 250 +7 357 60 197 200 19,000 4,000,000
Doylestown, Pennsylvania
72 Hanover County Public Schools 256 241 +15 317 5 312 0 15,300 2,200,000
Mechanicsville, Virginia
73 Sarasota County Schools 250 300 -50 325 0 325 0 16,500 5,600,000
Sarasota, Florida
73 Evergreen Public Schools 250 220 +30 275 9 266 0 11,000 2,280,000
Vancouver, Washington
73 Norfolk Public Schools 250 238 +12 332 11 321 0 11,682 2,240,044
Norfolk, Virginia
76 North East Independent School District 249 295 -46 452 58 380 0 19,000 3,000,000
San Antonio
77 Lake County Schools 248 n/a n/a 337 3 334 0 20,200 5,225,000
Tavares, Florida
78 Beaverton School District 246 n/a n/a 309 79 230 n/a 26,792 2,996,000
Beaverton, Oregon
79 Fayette County Public Schools 241 226 +15 285 45 240 0 20,000 3,328,926
Lexington, Kentucky
80 Evansville Vanderburgh School Corp. 237 235 +2 289 21 268 57 15,898 1,500,000
Evansville, Indiana
81 Anchorage School District 236 235 +1 292 3 289 177 24,000 3,483,000
Anchorage, Alaska
82 Salem-Keizer Public Schools 223 226 -3 270 23 247 0 20,000 3,000,000
Salem, Oregon
83 Sumner County Schools 206 205 +1 237 0 237 0 18,750 2,400,000
Gallatin, Tennessee
84 Greece Central School District 205 n/a n/a 225 74 139 12 10,400 2,500,000
Rochester, New York
85 San Francisco Unified School District 200 n/a n/a 240 165 35 240 4,000 n/a
San Francisco
ROUTE ROUTE CHANGE TOTAL SMALL LARGE CONTRACTOR STUDENTS ANNUAL RANK SCHOOL DISTRICT BUSES BUSES 2017 VS. BUSES BUSES BUSES BUSES TRANSPORTED ROUTE 2017 2016 2016 DAILY MILEAGE
29OCTOBER 2017 SCHOOL BUS FLEET

WWW.SCHOOLBUSFLEET.COM
85 Fort Wayne Community Schools 200 251 -51 300 67 130 0 15,000 3,018,000
Fort Wayne, Indiana
85 Comal Independent School District 200 n/a n/a 260 10 250 0 9,500 3,330,000
New Braunfels, Texas
88 Davis School District 195 n/a n/a 260 5 190 0 20,000 2,449,178
Farmington, Utah
88 Arlington Independent School District 195 n/a n/a 245 110 135 n/a 12,406 2,650,000
Arlington, Texas
90 Rockingham County Public Schools 194 208 -14 267 4 263 0 7,376 1,751,519
Fulks Run, Virginia
91 Warren County Public Schools 190 192 -2 230 1 229 0 10,000 2,600,000
Bowling Green, Kentucky
92 Elk Grove Unified School District 185 157 +28 200 115 70 0 6,980 4,637,000
Elk Grove, California
92 Jordan School District 185 172 +13 260 10 250 0 7,500 2,000,000
West Jordan, Utah
94 Osseo Area Schools 183 186 -3 201 99 84 201 14,500 3,500,000
Maple Grove, Minnesota
95 San Antonio Independent School District 180 n/a n/a 265 0 265 0 7,970 2,147,066
San Antonio
96 Shenendehowa Central School District 179 176 +3 213 43 170 0 10,350 2,150,000
Clifton Park, New York
97 Newton County Schools 170 178 -8 210 42 128 0 11,970 2,995,708
Covington, Georgia
98 Kanawha County Schools 158 158 0 194 0 120 0 24,761 3,375,213
Charleston, West Virginia
99 Suffolk Public Schools 150 n/a n/a 180 10 170 0 11,000 2,614,515
Suffolk, Virginia
100 Wilson County Schools 137 n/a n/a 183 5 132 0 12,200 1,372,320
Lebanon, Tennessee
ROUTE ROUTE CHANGE TOTAL SMALL LARGE CONTRACTOR STUDENTS ANNUAL RANK SCHOOL DISTRICT BUSES BUSES 2017 VS. BUSES BUSES BUSES BUSES TRANSPORTED ROUTE 2017 2016 2016 DAILY MILEAGE
TO P 1 0 0 SC H O O L D I ST R I CT F L E E TS O F 2 01 7Sponsored by
30 SCHOOL BUS FLEET OCTOBER 2017
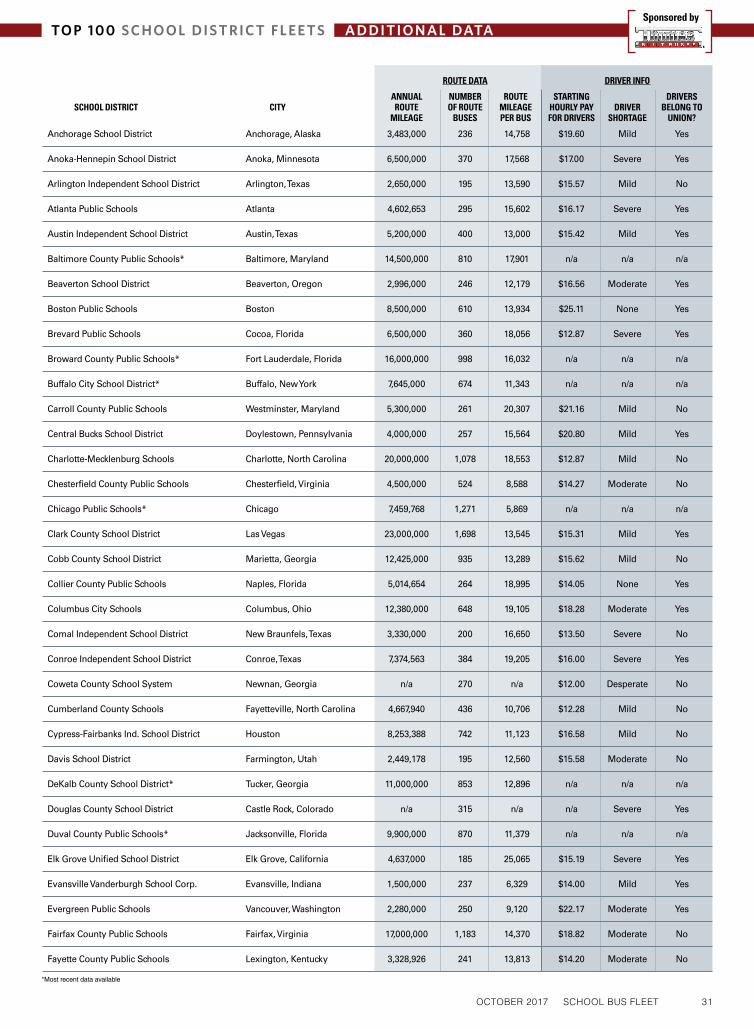
Anchorage School District Anchorage, Alaska 3,483,000 236 14,758 $19.60 Mild Yes
Anoka-Hennepin School District Anoka, Minnesota 6,500,000 370 17,568 $17.00 Severe Yes
Arlington Independent School District Arlington, Texas 2,650,000 195 13,590 $15.57 Mild No
Atlanta Public Schools Atlanta 4,602,653 295 15,602 $16.17 Severe Yes
Austin Independent School District Austin, Texas 5,200,000 400 13,000 $15.42 Mild Yes
Baltimore County Public Schools* Baltimore, Maryland 14,500,000 810 17,901 n/a n/a n/a
Beaverton School District Beaverton, Oregon 2,996,000 246 12,179 $16.56 Moderate Yes
Boston Public Schools Boston 8,500,000 610 13,934 $25.11 None Yes
Brevard Public Schools Cocoa, Florida 6,500,000 360 18,056 $12.87 Severe Yes
Broward County Public Schools* Fort Lauderdale, Florida 16,000,000 998 16,032 n/a n/a n/a
Buffalo City School District* Buffalo, New York 7,645,000 674 11,343 n/a n/a n/a
Carroll County Public Schools Westminster, Maryland 5,300,000 261 20,307 $21.16 Mild No
Central Bucks School District Doylestown, Pennsylvania 4,000,000 257 15,564 $20.80 Mild Yes
Charlotte-Mecklenburg Schools Charlotte, North Carolina 20,000,000 1,078 18,553 $12.87 Mild No
Chesterfield County Public Schools Chesterfield, Virginia 4,500,000 524 8,588 $14.27 Moderate No
Chicago Public Schools* Chicago 7,459,768 1,271 5,869 n/a n/a n/a
Clark County School District Las Vegas 23,000,000 1,698 13,545 $15.31 Mild Yes
Cobb County School District Marietta, Georgia 12,425,000 935 13,289 $15.62 Mild No
Collier County Public Schools Naples, Florida 5,014,654 264 18,995 $14.05 None Yes
Columbus City Schools Columbus, Ohio 12,380,000 648 19,105 $18.28 Moderate Yes
Comal Independent School District New Braunfels, Texas 3,330,000 200 16,650 $13.50 Severe No
Conroe Independent School District Conroe, Texas 7,374,563 384 19,205 $16.00 Severe Yes
Coweta County School System Newnan, Georgia n/a 270 n/a $12.00 Desperate No
Cumberland County Schools Fayetteville, North Carolina 4,667,940 436 10,706 $12.28 Mild No
Cypress-Fairbanks Ind. School District Houston 8,253,388 742 11,123 $16.58 Mild No
Davis School District Farmington, Utah 2,449,178 195 12,560 $15.58 Moderate No
DeKalb County School District* Tucker, Georgia 11,000,000 853 12,896 n/a n/a n/a
Douglas County School District Castle Rock, Colorado n/a 315 n/a n/a Severe Yes
Duval County Public Schools* Jacksonville, Florida 9,900,000 870 11,379 n/a n/a n/a
Elk Grove Unified School District Elk Grove, California 4,637,000 185 25,065 $15.19 Severe Yes
Evansville Vanderburgh School Corp. Evansville, Indiana 1,500,000 237 6,329 $14.00 Mild Yes
Evergreen Public Schools Vancouver, Washington 2,280,000 250 9,120 $22.17 Moderate Yes
Fairfax County Public Schools Fairfax, Virginia 17,000,000 1,183 14,370 $18.82 Moderate No
Fayette County Public Schools Lexington, Kentucky 3,328,926 241 13,813 $14.20 Moderate No
*Most recent data available
TO P 1 0 0 SC H O O L D I ST R I CT F L E E TS A D D I T I O N A L DATA
ROUTE DATA DRIVER INFO
ANNUAL NUMBER ROUTE STARTING DRIVERS SCHOOL DISTRICT CITY ROUTE OF ROUTE MILEAGE HOURLY PAY DRIVER BELONG TO MILEAGE BUSES PER BUS FOR DRIVERS SHORTAGE UNION?
Sponsored by
31OCTOBER 2017 SCHOOL BUS FLEET

Fort Wayne Community Schools Fort Wayne, Indiana 3,018,000 200 15,090 $17.03 Moderate Yes
Fort Worth Independent School District Fort Worth, Texas 6,500,000 322 20,186 n/a n/a n/a
Frederick County Public Schools Frederick, Maryland 7,380,874 347 21,271 $17.72 None Yes
Fulton County Schools Atlanta 12,000,000 768 15,625 $16.48 Moderate No
Greece Central School District Rochester, New York 2,500,000 205 12,195 $14.75 Moderate Yes
Greenville County Schools Greenville, South Carolina 5,000,000 361 13,850 $14.33 Severe No
Guilford County Schools Greensboro, North Carolina 9,800,000 625 15,680 $12.75 Mild Yes
Gwinnett County Public Schools Lawrenceville, Georgia 24,000,000 1,636 14,670 $15.03 Severe No
Hamilton Southeastern Schools Fishers, Indiana 2,910,228 300 9,701 n/a n/a n/a
Hanover County Public Schools Mechanicsville, Virginia 2,200,000 256 8,594 $14.36 None No
Harford County Public Schools Bel Air, Maryland 7,767,074 432 17,979 $14.58 Moderate Yes
Hemet Unified School District Hemet, California 5,322,841 347 15,340 $19.17 Mild Yes
Henrico County Public Schools Richmond, Virginia 8,686,505 474 18,326 $13.53 Mild No
Hillsborough County Public Schools Tampa, Florida 17,000,000 883 19,253 $13.48 Mild Yes
Houston Independent School District Houston n/a 1,026 n/a $16.95 Severe Yes
Howard County Public School System Ellicott City, Maryland 5,500,000 453 12,141 $16.00 Severe No
Jefferson County Public Schools Louisville, Kentucky 17,500,000 900 19,444 $16.78 Severe Yes
Jefferson County Schools Birmingham, Alabama 4,000,000 412 9,709 $18.28 Mild Yes
Jefferson Parish Public School System Marrero, Louisiana 2,288,9912 310 73,838 n/a n/a n/a
Jordan School District West Jordan, Utah 2,000,000 185 10,811 $18.06 Severe No
Kanawha County Schools Charleston, West Virginia 3,375,213 158 21,362 $13.97 Moderate No
Katy Independent School District Katy, Texas 4,300,000 414 10,386 $16.66 Moderate No
Lake County Schools Tavares, Florida 5,225,000 248 21,069 $10.70 Mild Yes
Los Angeles Unified School District Los Angeles 12,386,098 1,689 7,333 $17.08** Moderate Yes
Mesa Public Schools Mesa, Arizona n/a 400 n/a $13.15 Severe No
Metropolitan Nashville Public Schools Nashville, Tennessee 4,118,839 561 7,342 $14.53 Moderate Yes
Miami-Dade County Public Schools Miami 16,000,000 941 17,003 $14.00 Moderate Yes
Milwaukee Public Schools* Milwaukee 14,000,000 903 15,504 n/a n/a n/a
Montgomery County Public Schools Rockville, Maryland 20,000,000 1,156 17,301 $17.28 None Yes
New York City Department of Education New York City 24,300,000 9,000 2,700 n/a n/a n/a
Newton County Schools Covington, Georgia 2,995,708 170 17,622 $16.96 Moderate No
Norfolk Public Schools Norfolk, Virginia 2,240,044 250 8,960 $11.87 Severe No
North East Independent School District San Antonio 3,000,000 249 12,048 $13.00 Moderate No
*Most recent data available **$17.08 for large buses, $16.16 for small buses
TO P 1 0 0 SC H O O L D I ST R I CT F L E E TS A D D I T I O N A L DATA
ROUTE DATA DRIVER INFO
ANNUAL NUMBER ROUTE STARTING DRIVERS SCHOOL DISTRICT CITY ROUTE OF ROUTE MILEAGE HOURLY PAY DRIVER BELONG TO MILEAGE BUSES PER BUS FOR DRIVERS SHORTAGE UNION?
Sponsored by
WWW.SCHOOLBUSFLEET.COM32 SCHOOL BUS FLEET OCTOBER 2017

Northside Independent School District San Antonio 6,600,000 705 9,362 $13.75 Desperate No
Orange County Public Schools Orlando, Florida 18,300,000 901 20,311 $12.32 Moderate Yes
Osseo Area Schools Maple Grove, Minnesota 3,500,000 183 19,126 n/a n/a n/a
Pittsburgh Public Schools Pittsburgh n/a 592 n/a n/a n/a n/a
Plano Independent School District McKinney, Texas 3,500,000 260 13,462 $15.60 Mild No
Polk County Public Schools Bartow, Florida 6,700,000 511 13,112 $12.00 Moderate Yes
Portland Public Schools Portland, Oregon 4,240,000 260 16,308 $16.25 Severe Yes
Prince George’s County Public Schools* Upper Marlboro, Maryland 19,605,431 1,084 18,086 n/a n/a n/a
Prince William County Schools Bristow, Virginia 10,500,000 780 13,462 n/a n/a n/a
Rapides Parish Schools Alexandria, Louisiana 1,300,000 261 4,981 $25.92 Desperate No
Rockingham County Public Schools Fulks Run, Virginia 1,751,519 194 9,028 n/a Severe No
Salem-Keizer Public Schools Salem, Oregon 3,000,000 223 13,453 n/a n/a n/a
San Antonio Independent School District San Antonio 2,147,066 180 11,928 $13.75 Mild Yes
San Diego Unified School District San Diego 6,000,000 400 15,000 $20.79 Mild Yes
San Francisco Unified School District San Francisco n/a 200 n/a $32.00 None Yes
Sarasota County Schools Sarasota, Florida 5,600,000 250 22,400 $13.40 Moderate Yes
Savannah-Chatham County Public Schools Savannah, Georgia 4,676,661 336 13,919 $15.17 Severe Yes
School District of Lee County Fort Myers, Florida 13,000,600 778 16,710 $14.01 None Yes
School District of Palm Beach County West Palm Beach, Florida 12,000,000 792 15,152 $14.28 Mild Yes
School District of Philadelphia* Philadelphia 14,700,000 1,283 11,458 n/a n/a n/a
School District U-46 Elgin, Illinois 4,049,182 298 13,588 $18.48 Moderate Yes
Shenendehowa Central School District Clifton Park, New York 2,150,000 179 12,011 n/a Moderate Yes
Spotsylvania County Public Schools Spotsylvania, Virginia 3,162,100 299 10,576 $15.60 Moderate No
St. Lucie Public Schools Fort Pierce, Florida 6,000,000 306 19,608 $15.31 Moderate Yes
St. Paul Public Schools St. Paul, Minnesota 7,260,000 385 18,857 $16.50 Severe Yes
Suffolk Public Schools Suffolk, Virginia 2,614,515 150 17,430 $12.00 Moderate No
Sumner County Schools Gallatin, Tennessee 2,400,000 206 11,650 $12.00 Moderate No
Union County Educ. Svcs. Commission* Westfield, New Jersey n/a 615 n/a n/a n/a n/a
Virginia Beach City Public Schools Virginia Beach, Virginia 9,221,543 630 14,637 $13.91 Moderate No
Warren County Public Schools Bowling Green, Kentucky 2,600,000 190 13,684 $15.15 Moderate No
Washoe County School Distirct Reno, Nevada 5,000,000 269 18,587 $15.76 Moderate Yes
Wilson County Schools Lebanon, Tennessee 1,372,320 137 10,017 $13.82 Desperate No
Winston-Salem/Forsyth County Schools Winston-Salem, North Carolina 6,500,000 358 18,156 $13.63 Severe Yes
*Most recent data available
TO P 1 0 0 SC H O O L D I ST R I CT F L E E TS A D D I T I O N A L DATA
ROUTE DATA DRIVER INFO
ANNUAL NUMBER ROUTE STARTING DRIVERS SCHOOL DISTRICT CITY ROUTE OF ROUTE MILEAGE HOURLY PAY DRIVER BELONG TO MILEAGE BUSES PER BUS FOR DRIVERS SHORTAGE UNION?
Sponsored by
33OCTOBER 2017 SCHOOL BUS FLEET