Embed Size (px)
Citation preview

Teaching & LearningBenchmark DataFleming County Schools
December 10, 2014

First Grade Math
EES WES FES HES District0
10
20
30
40
50
60
70
80
90
81.3
71.5
65.7 67.270.5
65.9
40.7
31.734.8
41.6 Percent CorrectProjected P/D

Second Grade Math
EES WES FES HES District0
10
20
30
40
50
60
70
58
62.2
46.9
52.9 52.751
55.6
22.2
37.1 36.3Percent CorrectProjected P/D

Third Grade Math
EES WES FES HES District0
10
20
30
40
50
60
70
51.9
59.662.5
52.9
58
27
36.8
45.9
34.6
38.535.3
32.3
36.4
43.8
36.1 Percent CorrectProjected P/D2014 P/D

Fourth Grade Math
EES WES FES HES District0
10
20
30
40
50
60
47.4
43.3
55.1
52.250.7
37.1
25
53.6
41.243
39.5
27.6
55.2
33.3
43.6
Percent CorrectProjected P/D2014 P/D

Fifth Grade Math
EES WES FES HES District0
10
20
30
40
50
60
70
80
42 41.7
50.652.6
47.3
42.5
32
59.5
72.2
52.5
25
61
35
72
43.2Percent CorrectProjected P/D2014 P/D

Sixth Grade Math
EES WES FES HES District0
10
20
30
40
50
60
70
80
39.2
45.3 44.9 45.843.842.9
65.662.4
59.3 58.1
36.6
74.1
58.7
72.7
57.5
Percent CorrectProjected P/D2014 P/D

Grade 7 Grade 8 Algebra II0
10
20
30
40
50
60
70
58.1
24
56
30.425 24.2
Projected P/D2014 P/D
MS/HS Math

First Grade Reading
EES WES FES HES District0
10
20
30
40
50
60
70
80
90
76.178.1
71.3
76.774.2
46.3
51.9
37.8
60.9
45.1Percent CorrectProjected P/D

Second Grade Reading
EES WES FES HES District0
10
20
30
40
50
60
70
80
49.1
60.3
41.4
50.647.5
51
74.1
31.5
42.9
52.5
Percent CorrectProjected P/D

Third Grade Reading
EES WES FES HES District0
10
20
30
40
50
60
70
38.6
47.5
42.4 42.3 42.1
35.1
57.9
47.3 46.2 45.5
52.9
38.7
4750
46.9
Percent CorrectProjected P/D2014 P/D

Fourth Grade Reading
EES WES FES HES District0
10
20
30
40
50
60
49.8
45.2
49.3
43.9
48.1
57.1
39.3
56.5
41.2
51.7
39.5
20.7
56.7 57.1
46.2
Percent CorrectProjected P/D2014 P/D

Fifth Grade Reading
EES WES FES HES District0
10
20
30
40
50
60
70
80
90
51.5
42.4
54 55.651.7
53.8
30.8
54.4
77.8
53.1
43.2
51.247.5
72
50.5
Percent CorrectProjected P/D2014 P/D
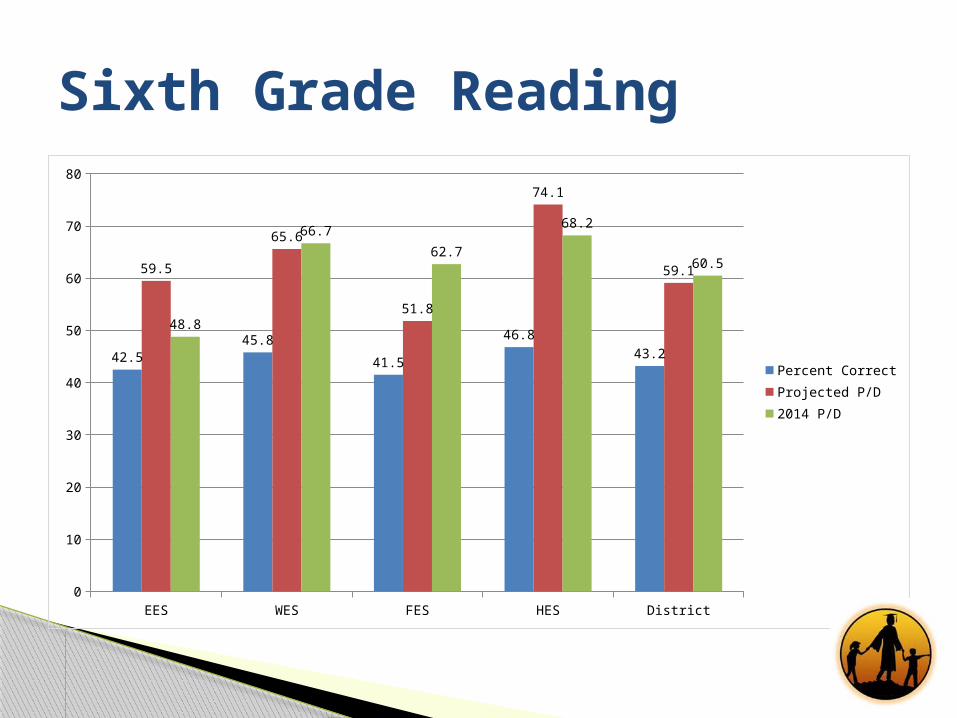
Sixth Grade Reading
EES WES FES HES District0
10
20
30
40
50
60
70
80
42.545.8
41.5
46.843.2
59.5
65.6
51.8
74.1
59.1
48.8
66.7
62.7
68.2
60.5
Percent CorrectProjected P/D2014 P/D
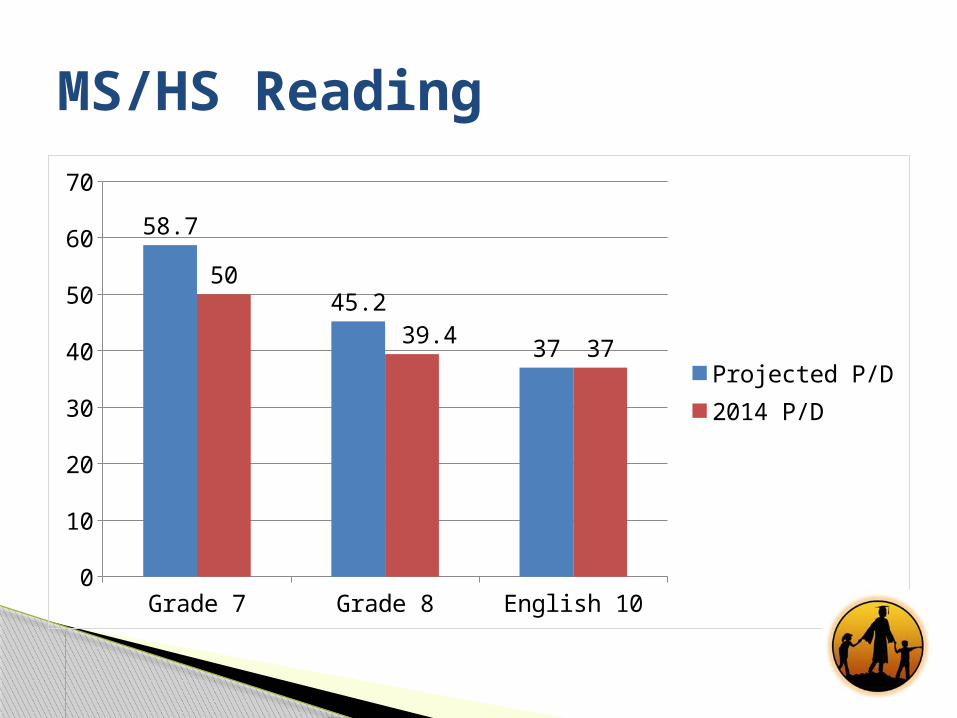
Grade 7 Grade 8 English 100
10
20
30
40
50
60
70
58.7
45.2
37
50
39.4 37Projected P/D2014 P/D
MS/HS Reading

Continue improvements in curriculum and instruction (Rigor)
Continue to implement and use Engage NY as a model
Second Benchmark – Week of Jan 19 (tentative)
Next Steps
Teaching & Learning Internal Review – Standard
3Fleming County Schools
December 10, 2014

Internal Review SummaryPLUS
Positive atmosphere Parent/community
support Students well-
behaved and polite Staff cares about
students Buildings clean, well-
maintained
DELTA Systems, processes,
procedures (incl. grading/reporting)
High expectations, rigorous instruction
Differentiation, especially high achieving
Student use of technology
Use of exemplars, rubrics

Teaching & Learning Science Curriculum
PlanningFleming County Schools
December 10, 2014

The FCS vision for science instruction is to provide a world-class, STEM-focused
curriculum that will move Fleming County students to the forefront of 21st Century
learners (students of distinction).
*STEM – Science, Technology, Engineering, Mathematics
FCS Vision for Science Instruction

FC Vision for Science Instruction
Foster inquisitiveness (students ask questions and design solutions to problems)
Make real-world connections
Make cross-curricular connections
Foster teacher leadership
Apply system to measure effectiveness
Foster student accountability and responsibility for learning
Foster student independence
K-12 curriculum aligned to NGSS, 3-D
Coherent instruction, building unit to unit, grade to grade, course to course.
Successful Implementation: