Embed Size (px)
Citation preview

ACI STRUCTURAL JOURNAL TECHNICAL PAPER Title no. 84-536
Flexure-Shear Interaction of Reinforced High-Strength Concrete Beams
by Shuaib H. Ahmad and D. M. Lue
Fifty-four reinforced concrete beams using high-strength concrete (f: > 6000 psi [42 MPa}) were tested under monotonically increasing loads to determine the effect of shear on the flexural resistance capacity and failure mode. The beams were singly reinforced without shear (web) reinforcement. The concrete strength was not a prime variable and varied from 9000 to 10,000 psi (63 to 70 MPa). The beams were tested for six shear-to-depth a/d ratios and six percentages of tensile steel content p.
Test results indicate that shear reduces the flexural resistance of the beams. A "valley of diagonal failure" is clearly observed when the relative flexural strength M, !Mn is plotted against the shear span-todepth ratio a/d. Test results suggest that the relative flexural strength of high-strength concrete beams is inversely proportional to steel ratio and directly proportional to the concrete strength [/ for tensilesteel ratios less than 1.88 percent. On the basis of experimental results of this investigation, an analytical flexure-shear interaction model for reinforced concrete beams using concretes of higher compressive strength is proposed. The proposed model compares favorably with the results of reinforced concrete beams of normal concrete strength beams (f: = 4000 psi {20 MPaj) reported in the literature.
Keywords: beams (supports); nexural strength; high-strength concretes; reinforced concrete; shear strength; span-depth ratio; tests.
In practice, reinforced and prestressed concrete beams are subjected to loads causing shear as well as bending and, therefore, it is desirable to determine their flexure-shear strength. The current design philosophy imposes a fictitious separation between the shear resistance and the moment resistance of the reinforced concrete members. In the design one evaluates the amount of shear reinforcement necessary to minimize the influence of shear on the flexural performance of a reinforced concrete member. The design methods of ACI and CEB1•2 do not relate a certain level of moment capacity with a certain amount of shear reinforcement. This fictitious separation between the shear resistance and the moment capacity of a member could result in a design that prevents the development of full moment capacity. Therefore, it is reasonable to expect that if methods could be developed for predicting the moment capacity as a function of shear influence, one could compute the optimum amount of shear reinforcement
330
that will insure attainment of full moment capacity of the member. Furthermore, the incorporation of such methods into a numerical procedure3•4 will result in improved methods for evaluating the performance of such members.
BACKGROUND Interaction between shear and flexure has been stud
ied by Leonhardt and Walther5 and by Kani6 for reinforced concrete beams of relatively lower strengths (f' ~ 6000 psi [42 MPa]). In the last two decades, significant contributions to the understanding of the modes of failures of reinforced concrete beams without web reinforcement have been made. 6• 10 Diagonal failure has been found experimentally to be primarily dependent upon the shear span-to-depth ratio a/d,6- 10 whereas the amount of flexural reinforcement has a quantitative rather than a qualitative effect; i.e., it affects the load level at which a particular mode of failure occurs, rather than the mode of failure itself.6 The presence of shear reinforcement also affects the mode of diagonal failure. 11 •12 It has been reported that the effect of concrete strength is insignificant; however, the study6 dealt with concrete strength ranging from 2500 to 5000 psi (17 to 34 MPa). Currently, concretes of higher strengths are being produced and increasingly used in both reinforced and prestressed concrete construction. With the increasing use of higher strength concretes U: > 6000 psi [42 MPa]) in modern construction, additional information on the behavior of structural elements of this type of concrete is urgently needed.
This paper summarizes the results of an experimental program that examined the effect of shear on the flexural strength of high strength concrete beams. Fifty-
Received July 9, 1986, and reviewed under Institute publication policies. Copyright© 1987, American Concrete Institute. All rights reserved, including the making of copies unless permission is obtained from the copyright proprietors. Pertinent discussion will be published in the May-June I988 ACI Structural Journal if received by Jan. I, 1988.
ACI Structural Journal I July-August 1987

ACI member Shuaib H. Ahmad is an associate professor of civil engineering at North Carolina State University, Raleigh, North Carolina. He has published several papers in the areas of nonlinear design, high-strength concrete, and multiaxial behavior of concrete. He is a member of PC! and ASTM; and a member of ACI Commillees 544, Fiber Reinforced Concrete; 549, Ferrocement; and 503, Adhesives for Concrete.
D.M. Lue is Structural Engineer with En tech Inc. His research interests include high-strength concrete and nonlinear design.
four singly reinforced beams without shear (web) reinforcement were tested to failure. The testing variables included the flexural tensile steel ratio p and the shear span-to-depth ratio aid . A semi-rational approach is presented in this paper to quantify the effect of shear on the flexural strength of reinforced concrete beams. The flexural failure is considered to be the limiting case of flexure-shear failure when shear at the critical section has negligible effect on the flexural strength.
RESEARCH SIGNIFICANCE The use of high-strength concrete in structural appli
cations is developing faster than the development of appropriate design recommendations. The research described in this paper provides experimental information on the effect of shear on the flexural strength of reinforced high strength concrete beams. Empirical equations are also developed that reflect the reduction in flexural strength of reinforced low and high strength concrete beams due to the influence of shear.
EXPERIMENTAL PROGRAM Specimen details
Three series, with a total of 54 reinforced concrete beams, were tested. The test beams were singly reinforced and without shear (web) reinforcement. In each series, the concrete compressive strength was approximately maintained constant, while the shear span-todepth ratio aid and the percentage of flexural tensile steel ratio p varied.
Tables 1 and 2 and Fig. 1 summarize the testing program and the specimen details. The test beams were 5 in. (127 mm) wide and had a total depth of 10 in. (254 mm). The effective depth varied from 7.25 to 8.38 in. (184.2 to 212.8 mm). The beams were simply supported at ends and loaded by two point loads. For the entire test program, the distance between the two point loads was kept constant at 16 in. (406.4 mm). There were nine different longitudinal steel ratios, and for each steel ratio beams with six different shear span-to-depth ratios were tested.
Materials Reinforcement consisted of deformed bars of Grade
60 steel. The stress-strain curve of steel is shown in Fig. 2. The concrete mix details are given in Table 3. In mixing the materials, an electrically driven tilting drum mixer of 3 ftl capacity was used. Due to the capacity limitation of the mixing drum, it was necessary to make one batch of concrete for each beam. Two 3 x 6 in. (76
ACI Structural Journal I July-August 1987
Stirrups --+--1--- EO in ~d (effective depth)
l ') . --- _j_ ••
~ I I 5 'n. I L 1.5 in. + ~ ~ l/21j>bar
a) Arrangement for No. 2 1 3, 5, and 6 bars
b) Arrangement for No. 8 and 9 bars
Stirrups R\ _L~ ---.±:J/; 10 in. 0 0 0.75 in. + --- ] • ./ 0 0 1/2 4> bar
~ 1.5 in.+ 1/2 4> bar
c) Arrangement for two layers of steel of No. 7 bars
Fig. ]-Reinforcing steel details
Table 1 - Testing program: Material and geometric variables
Beam Group number
A 1-6 7-12
13-18
B 1-6 7-12
13-18
c 1-6 7-12
13-18
f, b h c
Average concrete
strength, ksi
9.59 9.59 9.59
10.56 10.56 10.56
10.14 10.14 10.14
60 ksi P/2 P/2
5 in. 10 in.
1 16 in. I a l
Tension reinforcement
2 no. 8 2 no. 5, 1 no. 3
3 no. 2
2 no. 9 3 no. 5 4 no. 2
4 no. 7 3 no. 6 2 no. 3
l
p,
percent
3.93 1.77 0.352
5.04 2.25 0.469
6.64 3.26 0.531
d, in.
8.00 8.19 8.38
7.94 8.19 8.38
7.25 8.13 8.31
Table 2 - Testing program: Shear span-to-depth ratio aid*
aid 4 3 2.7 2.3 2 1
Beam No. 1 2 3 4 5 6 Beam No. 7 8 9 10 11 12 Beam No. 13 14 15 16 17 18
*Table 2 applies for all three groups.
x 152 mm) cylindrical specimens referred to as control specimens were also cast along with each beam.
Since there were beams of six different spans, six forms with the same cross section but with different lengths were used to cast the beams. The forms were made of o/4 in. (19 mm) thick plywood, and were reused nine times for casting of 54 beams. The concrete was placed in three layers in the beam and was internally
331

so .------·-------70
60
50
30
20
10
2 L. 6 8 10 12 14 16 18 20 22 24 26 28 30 32
Strain, thousandth of in/in.
Fig. 2-Experimental stress-strain curve of the reinforcing steel
Table 3 - Concrete mix design
Material
Type I cement Fine aggregate Water Fly ash Psi-super Coarse aggregate (maximum size = V2 in.)
Water-cement ratio Slump
Quantity
33.33 lb/ft' 41.11 lb/ft'
9.31 lb/ft' 3.88 lb/ft'
122.22 ml/ft' 68.33 lb/ft'
0.28 2.6 in.
vibrated. The control cylinders were cast in cardboard, wax-dipped molds and were externally vibrated. Immediately after casting, the beams and the control cylinders were covered with a polyethylene sheet to avoid escape of moisture. Twenty-four hours after casting, the beams were stripped, and then were kept continually wet and covered with polyethylene sheets until 24 hours before testing. All the beams and control cylinders were cast and cured in the same room under the same conditions. Before testing, a coat of white wash with a mixture of water and commercial sealer was applied to the beams to facilitate the observations of cracking patterns during the tests.
The measured concrete strengths were based on the average of two control cylinders. The results of the compression tests on these cylinders were very close to each other. To obtain the equivalent standard cylinder strengths of 6 x 12 in. (152 x 304 mm), the nominal concrete strengths of 3 x 6 in. (76 x 152 mm) were multiplied by a correction factor of 0.92, which has been reported in literature13 for normal strength concretes. Unpublished work 14 indicates that the correction factor of 0.92 seems to be applicable for high-strength concrete. All the figures and the tables of the experimental test results use the equivalent standard cylinder strengths. For some of the beams, samples of 4-in (100-mm) cubes were obtained (from the undamaged zone) after the beam test. These samples were tested in compression. After the conversion of cube strength to cylinder strength 15 , the compressive strengths were close to those obtained for equivalent standard cylinder strength of 6 x 12 in. (152 x 304 mm).
332
Test procedure The beams were tested in a 120 kip (532 kN) hy
dra\lliC testing machine and loaded with two symmetrical point loads, as shown in Table 1. At each load increment the vertical deflection and the strains at the top and bottom of the beam were measured. These measurements were taken at the midspan of the beam. The deflection was measured with a compressometer placed under the beam. The strains were measured with the help of special transducers, which were designed and constructed to monitor any relative displacement between the gage length. Thin strips of beryllium copper (0.012 in. thick and x6 in. wide [0.3 mm thick and 8 mm wide]) were glued to a plexiglass block at each end. Two foil strain gages were then installed (one on each side) to double the response of the transducer. The transducers were calibrated in a calibrating jig before the recording of the experimental data. These transducers were installed on the beams by gluing the plexiglass block to the concrete surface at the level of the steel reinforcement and at I in. (25 mm) from the compressive fiber in the constant moment region of the beam. The strain data obtained were quite consistent, although in the tensile zone once the concrete is cracked the strain recorded at the level of tension steel is an approximate measure of crack opening.
The visual observations of the cracks were made during the tests. The interface of the cracks were noticeably smooth. The failure of the beams was brittle and accompanied by a loud noise. The loads that produced the first cracks and the load that produced the failure of the specimen were accurately recorded.
EXPERIMENTAL RESULTS The test results from all the three test series are listed
in Tables 4 through 6. The flexural capacity and mode of failure of the test specimens are primarily dependent on the shear span-to-depth ratio ald. The amount of flexural tensile steel As has a quantitative rather than a qualitative effect; i.e., it effects the load level at which a particular mode of failure occurs rather than the mode of failure itself. Fig. 3 shows the schematic crack patterns observed for different shear span aid ratios tested with varying amounts of flexural steel content p.
The behavior of singly reinforced concrete beams can be divided into three types, as follows. Type I failure (aid > 6) is characterized by flexural failure, which allows the beam to develop its full flexural capacity. Type II failure (2.5 :so;; aid :so;; 6.0) is a combination of flexure and diagonal tension cracking. Some of the beams tested in this investigation failed in Type II failure mode. The failure of the beams was always by diagonal tension. The diagonal crack that caused failure initiated near the tip of the flexural crack closer to the support and propagated (branched nearly horizontally) simultaneously toward the load point and toward the support along the tensile reinforcement. Adequate anchoring of the tensile steel prevented anchorage failure. The flexural capacity reduces with decreasing value of aid, to a critical value dependent on the amount of
ACI Structural Journal I July-August 1987

Table 4 - Summary of test results (Group A): f~ * = 9590 psi; f~t = 8823 psi
Steel PI P. d, content 2 2 Ml, M,, M,,., MJ M ..
Specimen in. old p, percent kips kips kip-in. kip-in. kip-in. M,, M,,
AI 8.0 4.0 3.93 7.9 13.0 252.8 416.0 657.8 0.38 0.63
A2 8.0 3.0 3.93 10.0 15.5 240.0 372.0 657.8 0.36 0.57
A3 8.0 2.7 3.93 10.0 15.5 216.0 334.8 657.8 0.33 0.51
A4 8.0 2.3 3.93 10.0 21.0 257.6 386.4 657.8 0.39 0.59
A5 8.0 2.0 3.93 - 37.5 - 600.0 657.8 - 0.91
A6 8.0 1.0 3.93 37.0 90.00 296.0 720.0 657.8 0.45 1.09
A7 8.19 4.0 1.77 9.5 10.5 311.1 343.9 316.0 0.98 1.09
AS 8.19 3.0 1.77 10.5 11.0 257.9 270.3 316.0 0.82 0.86
A9 8.19 2.7 1.77 11.0 18.0 243.2 398.0 316.0 0.77 1.26
AIO 8.19 2.3 1.77 17.0 18.5 320.1 348.5 316.0 1.01 1.10
All 8.19 2.0 . 1.77 - 12.5 - 204.8 316.0 - 0.65
Al2 8.19 1.0 1.77 50.0 50.0 409.4 409.5 316.0 1.30 1.30
A13 8.38 4.0 0.352 3.0 3.0 100.5 100.5 66.55 1.51 1.51
A14 8.38 3.0 0.352 3.5 4.1 87.9 103.1 66.55 1.32 1.55
A15 8.38 2.7 0.352 3.5 4.6 79.1 104.1 66.55 1.19 1.56
A16 8.38 2.3 0.352 4.8 5.5 91.5 106.0 66.55 1.37 1.59
A17 8.38 2.0 0.352 6.1 6.1 102.2 102.2 66.55 1.54 1.54
AlB 8.38 1.0 0.352 13.5 14.0 113.1 117.3 66.55 1.7 1.76
*F.rom 3 x 6-in. (76 x 152-mm) cylinders. 'Using equivalent 6 x 12 in. (152 x 305 mm) cylinder strength, assumed to be 92 percent of 3 x 6 in. cylinder strength. 1000 psi = 6.895 MPa. Note: Beams AI through Al2 failed due to inclined cracking; Beams Al3 through At8 failed in flexure.
flexural tensile steel As. The Type III failure (1.0 ~ aid ~ 2.5) failure is by shear compression of the web or by crushing of the arch rib of the beam. For the test beams with 1.5 ~ aid ~ 2.5, the failure was by shear compression of the web. For test beams with aid < 1.5, the failure was by crushing of the arch rib of the beams. The flexural capacity increases from a critical value in Type II failure to approximately the full flexural capacity of the beam.
At failure, beams with lower flexural steel content {p < 2.25 percent) and with aid > 2.5 exhibited longitudinal splitting along the main reinforcement. Careful observations indicated that this phenomenon of longitudinal splitting along the main reinforcement occurred immediately after the maximum load was reached and did not initiate the final collapse of the beam. For beams with aid < 2.5, it was observed that the diagonal crack started in the vicinity of the midheight of the beam and progressed to top and bottom face of the beam.
Load-deflection behavior The load deflection behaviors of the beams of Group
B are shown in Fig. 4(a), (b), and (c). These figures indicate that, while the beams with aid < 2.5 exhibit brittle behavior, these beams exhibit some reserve strength after the formation of the diagonal crack. It
ACI Structural Journal I July-August 1987
p
r-a/~d-=--:-4 ,-~-=-;5-:. 0::-;-4-::%-.1.---i
~secondary . 1 pr~mary
crack
p
~
Fig. 3-Schematic cracking patterns for beams with different reinforcement percentage p and shear span-todepth aid ratios
appears that beams with aid greater than a value between 2 and 2.5 may provide some, but by no means sufficient, warning of impending collapse; whereas for
333

100
80
60 0
~
"" .;
40
20
Table 5 - Summary of test results (Group B): f~* = 10560 psi; f~t = 9715 psi
Steel ~ P., d, content 2 2 M"
Specimen in. aid p, percent kips kips kip-in.
81 7.94 4.0 5.04 8.4 11.2 266.2
82 7.94 3.0 5.04 11.5 15.5 273.8
83 7.94 2.7 5.04 10.0 22.5 214.3
84 7.94 2.3 5.04 13.0 32.2 237.3
85 7.94 2.0 5.04 15.0 24.0 238.1
86 7.94 1.0 5.04 45.0 46.2 357.2
87 8.19 4.0 2.25 8.0 10.0 262.0
88 8.19 3.0 2.25 10.5 10.5 257.9
89 8.19 2.7 2.25 10.8 18.0 237.6
810 8.19 2.3 2.25 14.0 14.4 263.6
811 8.19 2.0 2.25 16.5 27.5 270.2
812 8.19 1.0 2.25 35.0 48.0 286.6
813 8.38 4.0 0.469 2.9 3.75 95.5
814 8.38 3.0 0.469 3.8 5.50 94.2
815 8.38 2.7 0.469 3.5 6.0 79.1
816 8.38 2.3 0.469 4.8 7.0 9(.5
817 8.38 2.0 0.469 7.3 8.1 121.4
818 8.38 1.0 0.469 13.5 18.5 I 13.1
*From 3 x 6-m. (76 x 152-mm) cylinders.
M., Mft, M, M,.
kip-in. kip-in. M,, M,,.
355.7 826.5 0.32 0.43
369.2 826.5 0.33 0.45
482.4 826.5 0.26 0.58
588.0 826.5 0.29 0.71
381.1 826.5 0.29 0.46
366.8 826.5 0.43 0.44
327.6 400.8 0.65 0.82
257.9 400.8 0.64 0.64
398.0 400.8 0.59 0.99
271.25 400.8 0.66 0.68
450.4 400.8 0.67 1.12
393.12 400.8 0.72 0.98
125.7 88.6 1.08 1.42
138.3 88.6 1.06 1.56
135.7 88.6 0.89 1.53
135.0 88.6 1.03 1.52
135.7 88.6 1.37 1.53
155.03 88.6 1.28 1.75
'Using equivalent 6 x 12 in. (152 x 305 mm) cylinder strength, assumed to be 92 percent of 3 x 6 in. cylinder strength. 1000 psi = 6.895 MPa. Note: Beams BI through B12 failed due to inclined cracking; Beams Bl3 through BIB failed in flexure .
• Load producing the first shear crack (P cr)
V Per cr = T
100
. fc = 10.56 Ksi
avg p = 5.04%
P/2 P/2
* 1 ;;a..
t P/2
,A;.
t P/2 = shear
200 300
100
80
. -~ 60 "" .;
40
20
e Load producing the first shear crack (P cr>
V Per cr = 2
100 200
fc avg = 10.56 Ksi
p = 2.25%
A P/2 = shear P/2
300
Midspan deflection, thousandth of in/in. M~dspan deflection, thousandth of in/in.
Fig. 4(a)-Load-def/ection curves: Group B, Beams 1 to 6, shear failures
Fig. 4(b)-Load-def/ection curves: Group B, Beams 7 to 12, shear failures
334 ACI Structural Journal I July-August 1987
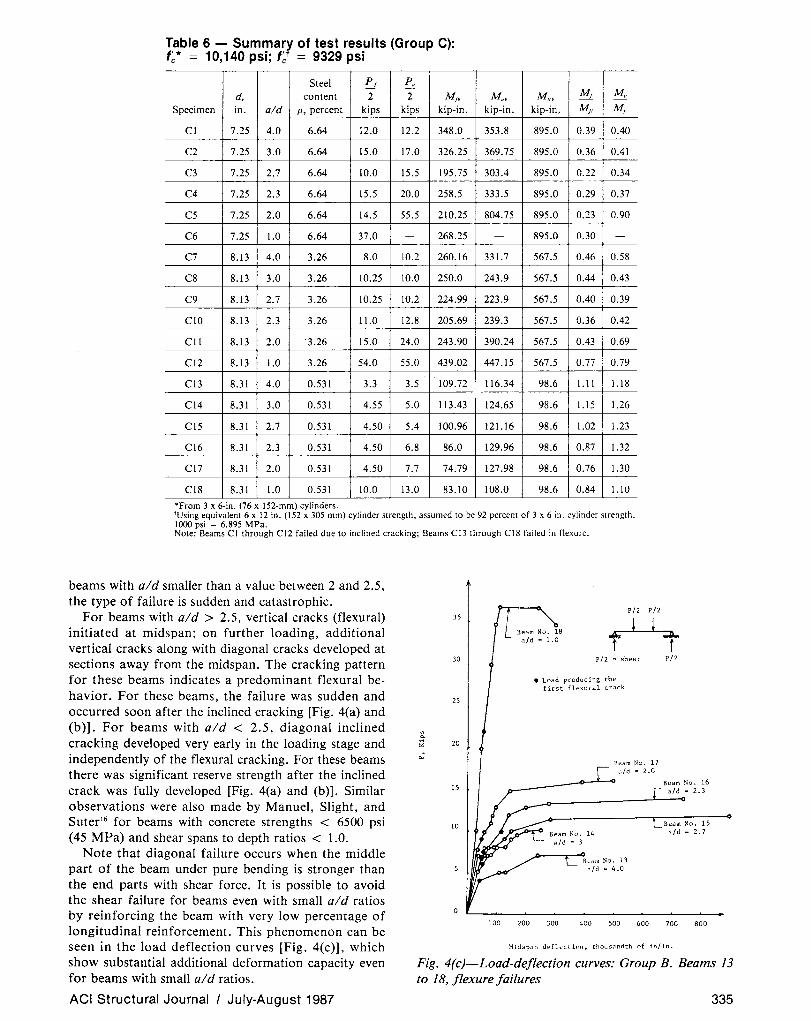
~~ble 6 - Sum'!'a~r of test res.ults (Group C): fc = 10,140 ps1; fc = 9329 pSI
Steel P, P., -
d, content 2 2 M" Specimen in. aid p, percent kips kips kip-in.
C1 7.25 4.0 6.64 12.0 12.2 348.0
C2 7.25 3.0 6.64 15.0 17.0 326.25
C3 7.25 2.7 6.64 10.0 15.5 195.75
C4 7.25 2.3 6.64 15.5 20.0 258.5
C5 7.25 2.0 6.64 14.5 55.5 210.25
C6 7.25 1.0 6.64 37.0 - 268.25
C7 8.13 4.0 3.26 8.0 10.2 260.16
C8 8.13 3.0 3.26 10.25 10.0 250.0
C9 8.13 2.7 3.26 10.25 10.2 224.99
C10 8.13 2.3 3.26 11.0 12.8 205.69
Cll 8.13 2.0 '3.26 15.0 24.0 243.90
C12 8.13 1.0 3.26 54.0 55.0 439.02
C13 8.31 4.0 0.531 3.3 3.5 109.72
Cl4 8.31 3.0 0.531 4.55 5.0 113.43
C15 8.31 2.7 0.531 4.50 5.4 100.96
Cl6 8.31 2.3 0.531 4.50 6.8 86.0
Cl7 8.31 2.0 0.531 4.50 7.7 74.79
CIS 8.31 1.0 0.531 10.0 13.0 83.10
•From 3 x 6-in. (76 x 152-mm) cylinders.
M., Mfr' M, M.,
kip-in. kip-in, Mp M"
353.8 895.0 0.39 0.40
369.75 895.0 0.36 0.41
303.4 895.0 0.22 0.34
333.5 895.0 0.29 0.37
804.75 895.0 0.23 0.90
- 895.0 0.30 -
331.7 567.5 0.46 0.58
243.9 567.5 0.44 0.43
223.9 567.5 0.40 0.39
239.3 567.5 0.36 0.42
390.24 567.5 0.43 0.69
447.15 567.5 0.77 0.79
116.34 98.6 1.11 1.18
124.65 98.6 1.15 1.26
121.16 98.6 1.02 1.23
129.96 98.6 0.87 1.32
127.98 98.6 0.76 1.30
108.0 98.6 0.84 1.10
'Using equivalent 6 x 12 in. (152 x 305 mm) cylinder strength, assumed to be 92 percent of 3 x 6 in. cylinder strength. 1000 psi = 6.895 MPa. Note: Beams Cl through Ci2 failed due to inclined cracking; Beams C13 through CIS failed in flexure.
beams with aid smaller than a value between 2 and 2.5, the type of failure is sudden and catastrophic.
For beams with aid > 2.5, vertical cracks (flexural) initiated at midspan; on further loading, additional vertical cracks along with diagonal cracks developed at sections away from the midspan. The cracking pattern for these beams indicates a predominant flexural behavior. For these beams, the failure was sudden and occurred soon after the inclined cracking [Fig. 4(a) and (b)]. For beams with aid < 2.5, diagonal inclined cracking developed very early in the loading stage and independently of the flexural cracking. For these beams there was significant reserve strength after the inclined crack was fully developed [Fig. 4(a) and (b)]. Similar observations were also made by Manuel, Slight, and Suter16 for beams with concrete strengths < 6500 psi (45 MPa) and shear spans to depth ratios < LO.
35
30
25
20
IS
10
p /2 p /2
t P/2 = shear
e Load producing the first flexural crack
Beam No. 17 a/d • 2.0
Beam No. 13 a/d • 4.0
t P/2
Beam No. 16 a/d • 2.3
Beam No. 15 a/d • 2.7
100 200 300 400 500 &00 700 800
!'1.idspan deflection, thousandth of in/in.
Note that diagonal failure occurs when the middle part of the beam under pure bending is stronger than the end parts with shear force. It is possible to avoid the shear failure for beams even with small aid ratios by reinforcing the beam with very low percentage of longitudinal reinforcement. This phenomenon can be seen in the load deflection curves [Fig. 4(c)], which show substantial additional deformation capacity even for beams with small aid ratios.
Fig. 4(c)-Load-deflection curves: Group B. Beams 13 to 18, flexure failures
ACI Structural Journal I July-August 1987 335
1.8
1.6
. p = 0.352% 1.4
.-<
"" ~ "" e 1.2
£ "" ~ 1.0 ~ " "'
p = 1. 77%
.-<
2 0.8 " X Group A ~
.-< ' ... fc = 9.59 Ksi
~ 0.6 avg
~ ·~
" ~ .-< ~
"' 0.4 p = 3.93%
0.2
0
4
Shear span-depth ratio (a/d)
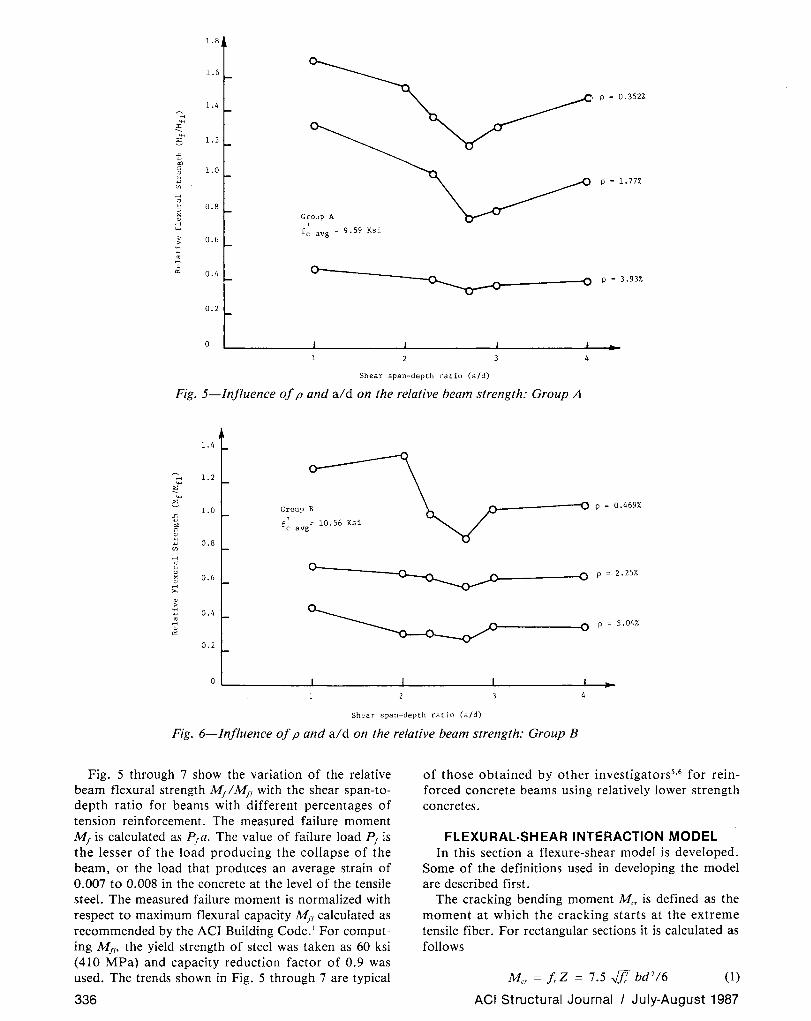
Fig. 5-/nfluence of p and aid on the relative beam strength: Group A
1.4
:;:: 1.2
~ e 1.0 Group B n------o P = o.469%
£ ' 10.56 Ksi "" fc = ~ avg ~
0.8 " "' .-<
2 " X 0.6 0
p = 2.25%
.-< ... . ~
~ 0.4 .!: . p = 5.04%
"' 0.2
0
Shear span-depth ratio (a/d)
Fig. 6-/nfluence of p and aid on the relative beam strength: Group B
Fig. 5 through 7 show the variation of the relative beam flexural strength M11M11 with the shear span-todepth ratio for beams with different percentages of tension reinforcement. The measured failure moment M1 is calculated as P1 a. The value of failure load P1 is the lesser of the load producing the collapse of the beam, or the load that produces an average strain of 0.007 to 0.008 in the concrete at the level of the tensile steel. The measured failure moment is normalized with respect to maximum flexural capacity Mfl calculated as recommended by the ACI Building Code. 1 For computing M11, the yield strength of steel was taken as 60 ksi (410 MPa) and capacity reduction factor of 0.9 was used. The trends shown in Fig. 5 through 7 are typical
336
of those obtained by other investigators5•6 for reinforced concrete beams using relatively lower strength concretes.
FLEXURAL-SHEAR INTERACTION MODEL In this section a flexure-shear model is developed.
Some of the definitions used in developing the model are described first.
The cracking bending moment Mer is defined as the moment at which the cracking starts at the extreme tensile fiber. For rectangular sections it is calculated as follows
Mer = /,Z = 7.5 ../J: bd 216 (1)
ACI Structural Journal I July-August 1987
l.o
1.4
1.2
-::. ~
~
:? 1.0
-5 "" c 0.8 ~ ~ ~
Ul
'"" "' 0.6 ~ ~ X ~
'"" "' ~ 0.4 .~ ~
"' '"" 8
"' 0.2
0
Group c ' f c avg
l.O 2.0 3.0 4.0
p = 0.531%
p = 3. 26%
p = 6.64%
Shear span-depth ratio (a/d)
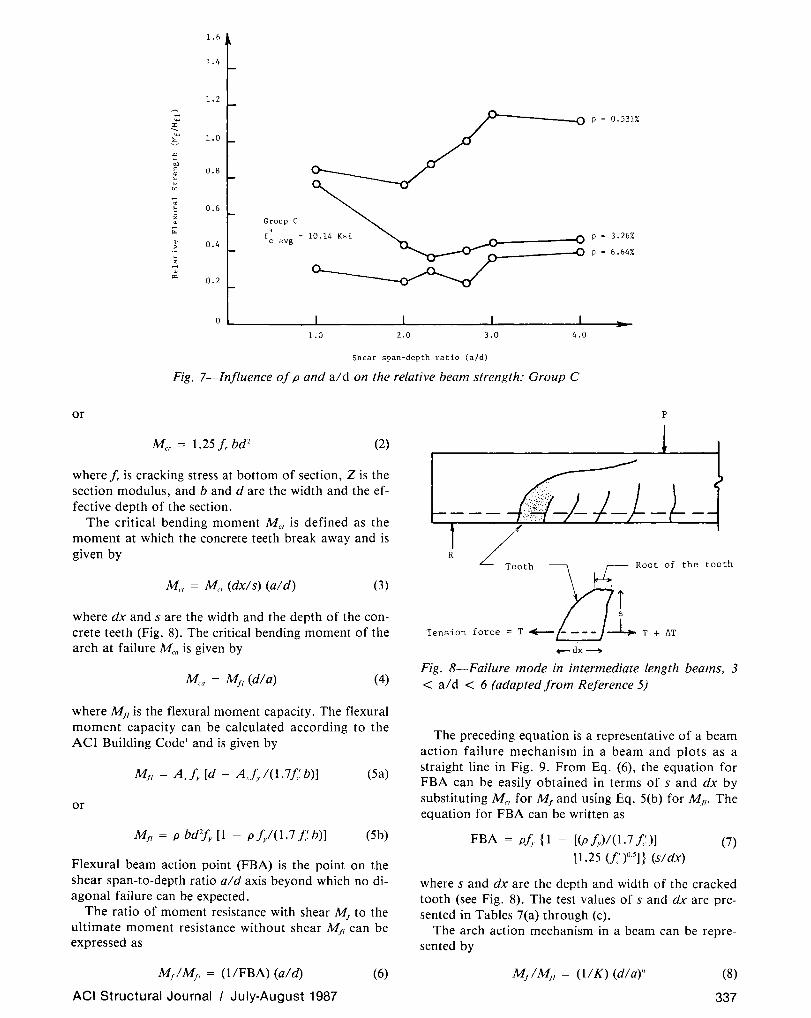
Fig. 7-Jnfluence of p and aid on the relative beam strength: Group C
or
(2)
where f. is cracking stress at bottom of section, Z is the section modulus, and b and dare the width and the effective depth of the section.
The critical bending moment Mu is defined as the moment at which the concrete teeth break away and is given by
M" = M" (dx!s) (a/d) (3)
where dx and s are the width and the depth of the concrete teeth (Fig. 8). The critical bending moment of the arch at failure Mea is given by
(4)
where Mfl is the flexural moment capacity. The flexural moment capacity can be calculated according to the ACI Building Code 1 and is given by
M11 = As /y [d - AJ, /(1. 7/i b)] (Sa)
or
Mfl = p bd2J;, [I - pf/(1.7 .t:'b)] (Sb)
Flexural beam action point (FBA) is the point on the shear span-to-depth ratio aid axis beyond which no diagonal failure can be expected.
The ratio of moment resistance with shear M1 to the ultimate moment resistance without shear Mfl can be expressed as
M1 1M11 = (1/FBA) (a/d) (6)
ACI Structural Journal I July-August 1987
p
R Root of the tooth
'"""''' ''"'" ~' ..__~ '+ ,, -dx-
Fig. 8-Failure mode in intermediate length beams, 3 < a/d < 6 (adapted from Reference 5)
The preceding equation is a representative of a beam action failure mechanism in a beam and plots as a straight line in Fig. 9. From Eq. (6), the equation for FBA can be easily obtained in terms of s and dx by substituting M,, for M 1 and using Eq. 5(b) for Mfl. The equation for FBA can be written as
FBA = Ph {1 - [(Pfy)/(1.7 /i)] (7) [ 1.25 u~ )05]} (s/ dx)
where s and dx are the depth and width of the cracked tooth (see Fig. 8). The test values of s and dx are presented in Tables 7(a) through (c).
The arch action mechanism in a beam can be represented by
{8)
337

~B. C. 1 (Equation 9)
\ 1.111-----lt-ir.
FBA (Equation 7)
I "Arch Action 11 , Resistance of Remaining ~ Arch. (Equation 8) ....
:0: .... .... e. -B "" c w ... ... "' E
" w
"' 0
~ '"' ~ 0
"'
I I I I I
. 'TRP
I ', .......
"Beam Action", Resistance of Concrete Teeth. (Equation 6).
I / /r
I ...... __ 0.1
/ -I -- J - - B. C. 2 (Equation 10)
1.0 FBA
Shear Span to Depth Ratio (a/d)
Fig. 9-Description of flexure-shear interaction model
The previous equation plots as an hyperbola in Fig. 9. The coefficient Kin Eq. (8) accounts for the influence of biaxial stress conditions on behavior of concrete in arch zone. The value of K is taken as 0.9 as recommended by Kani.6 The factor n is a calibrating factor and can be adjusted from the experimental results or from specified boundary conditions. In this paper the value of n was calculated from the following boundary conditions on the arch action behavior
Table 7(a) - Maximum experimental value of width dx and depth Smax of the concrete teeth for Group A beams*
Beam number dx, in. s .. m." in.
13 8.35 9.00 14 10.50 7.50 15 9.75 8.25 16 9.75 9.50 17 10.30 9.50 18 NA 9.75
Average 9.73 8.92
s S = (Smu).,.,/2.0 = 4.46 in.; (dx)"' = 0.46
•Group A: f/ ; 9.56 ksi (66 MPa), p ; 0.352 percent. NA ; data are not reliable.
Table 7(b) - Maximum experimental value of width dx and depth Smax of the concrete teeth for Group B beams*
Beam number dx, in. s/11(1).'' in.
13 7.25 9.00 14 NA NA 15 9.50 7.50 16 6.50 9.30 17 NA NA 18 NA NA
Average 7.75 8.60
s S = (Sm.,),.,/2.0 = 4.30 in.; -(d) = 0.55
XarR
*Group B: J: ; 10.56 ksi (73 MPa), p ; 0.469 percent. N/ A ; data are not reliable.
338
B.C. 1. At aid = 1.0 M1 1M11 = 1.11 (9)
B.C. 2. At aid = FBA M1 1M11 = 0.1 (10)
These two boundary conditions were selected since the calculated value of n gave a lower-bound solution for the experimental results. Using the two boundary conditions of Eq. (9) and (10), different values of n are obtained for different values of steel ratio p and concrete compressive strength f:. These values of n are presented in Table 8. The point of intersection of the beam mechanism line and the arch mechanism line can be obtained by equating Eq. (8) and (6). Thus
(1/K) (dla)" = (1/FBA) (aid) (11)
Eq. (11) can be solved for (ald),,P and expressed as
(ald)"P = 10 [log (FBAIK)I(n + 1)] (12)
The (ald),,P refers to the shear span-to-depth ratio at which the ratio M/ M 11 is minimum. This is also the point at which transfer takes place between beam action and arch action (see Fig. 9).
The proposed flexure-shear interaction model can now be presented in the following two equations
M1 1M1, = (IlK) (dla)"
< (ald)"P
for aid (13)
where K = 0.9 and recommended values of n are in Table 8, and
M1 1M1, = (1/FBA) (aid)
> (ald),,p
ACI Structural Journal
for aid (14)
1 July-August 1987
1.0
0.9
~ ..... 0.8 :.: ...... ..... e 0.7
-B "" 0.6 ~
" "' '"' "' 0.5 M
" "' ~ 0.4 " !! "' ~ 0.3 > .... '"' " 0.2 .-< .. "' 0.1
0
TRP
2 3
Analytical Model
FBA
4 6
f~ = 5 Ksi (34.5 Mpa)
p = 1.88%
8 9
Shear Span to Depth Ratio (a/d)
10
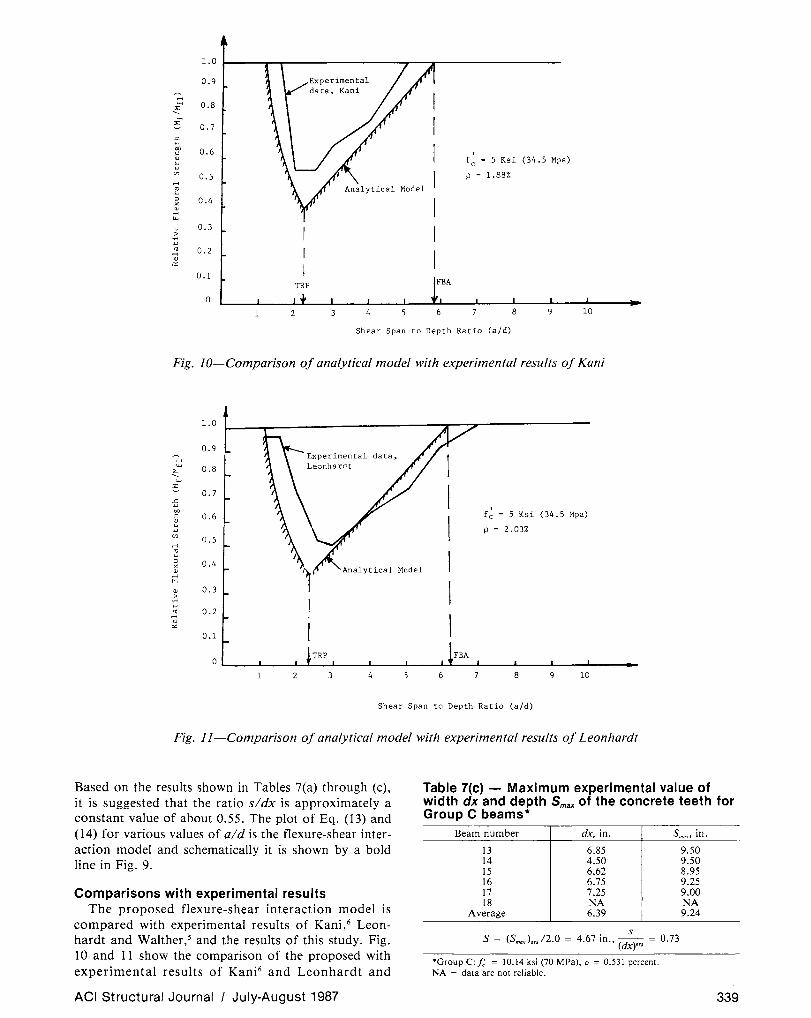
Fig. 10-Comparison of analytical model with experimental results of Kani
~ .., .....
:.: ...... ..... e
-B "" c .. "' '"' "' .-<
" "' ~ " " .-< ... .. > .... '"' ~ " "'
1.0
0.9
0.8
0.7
0.6
0.5
0.4
0.3
0.2
0.1
0
2 4 6
f~ = 5 Ksi (34.5 Mpa)
p = 2.03%
8 9 10
Shear Span to Depth Ratio (a/d)
Fig. 11-Comparison of analytical model with experimental results of Leonhardt
Based on the results shown in Tables 7(a) through (c), it is suggested that the ratio sldx is approximately a constant value of about 0.55. The plot of Eq. (13) and (I4) for various values of aid is the flexure-shear interaction model and schematically it is shown by a bold line in Fig. 9.
Table 7(c) - Maximum experimental value of width dx and depth Smax of the concrete teeth for Group C beams*
Comparisons with experimental results The proposed flexure-shear interaction model is
compared with experimental results of Kani, 6 Leonhardt and Walther,S and the results of this study. Fig. IO and II show the comparison of the proposed with experimental results of Kani6 and Leonhardt and
ACI Structural Journal I July-August 1987
Beam number dx, in. s/110.\"' in.
13 6.85 14 4.50 15 6.62 16 6.75 17 7.25 18 NA
Average 6.39
. s 3 S = (Sm.xl.,/2.0 = 4.67 m., (dx)"'' = 0.7
*Group C:J: = 10.14 ksi (70 MPa), p = 0.531 percent. NA = data are not reliable.
9.50 9.50 8.95 9.25 9.00 NA 9.24
339

..-< ..... :.: .....
..... e .c .., bO
" , !:: Ul
.-<
"' ... ~ ~ QJ
..;
"" QJ
> .... .., "' ..; QJ
"'
1.0
0.9
0.8
0.7
0.6
0.5
0.4
0.3
0.2
0.1
0
1 2
TRP
3 4 5 6 8
f~ = 10.56 Ksi (72.9 Mpa)
p = 2.25%
9 10
Shear Span to Depth Ratio (a/d)
Fig. 12-Comparison of analytical model with experimental results of this study
1.0
0.9
~ ..... 0.8 :.: ..... ..... e 0.7 .c .., bO 0.6 " QJ
!:: Cll
..;
"' ... ~ 0.4 " QJ
..-< ... 0.3 QJ
> .... .., 0.2 "' ..;
QJ
"' 0.1
0
1 2
I I TRP
3 4 5
' fc = 10.14 Ksi (71.8 Mpa) p = 3.26%
FBA
6 8 9 10
Shear Span to Depth Ratio (a/d)
Fig. 13-Comparison of analytical model with experimental results of this study
Walther/ respectively. The results are for beams without web reinforcement using normal strength concrete U: = 5 ksi [34.5 MPa]). Fig. 12 and 13 present the comparison of the experimental results of present study with the proposed interaction model. From all these comparison figures (Fig. 10 and 13) it can be seen that the proposed interaction model gives a reasonably good
Table 8 - Values of n for different steel ratios and concrete strengths
n p, percent f/, ksi
2.68 1.88 5.0
14.00 0.53 10.14
2.29 3.26 10.14
1.79 6.64 10.14
340
correlation with experimental results. It should be pointed out that the proposed interaction model does not compare well with the experimental results for very low (p = 0.53 percent) and very high (p = 6.4 percent) values of steel ratios.
SUMMARY AND CONCLUSIONS The experimental results demonstrating the effect of
shear on the flexural strength of reinforced concrete beams using concrete of higher compressive strengths are summarized. The variables considered were shear span-to-depth ratio aid and the percentage of flexural tensile steel content p. On the basis of results obtained in this study, the following conclusions are drawn:
1. When the relative beam strength M/M11 is plotted against their shear span-to-depth aid ratio, a "valley of
ACI Structural Journal I July-August 1987

diagonal shear failure" with its lowest point in the vicinity of aid = 2.7 can be observed.
2. The "valley of diagonal shear failure" is deeper for high strength concrete beams with low steel ratio p,
whereas for higher steel ratios it tends to disappear. 3. For very low steel ratios, the beams fail in flexural
mode independent of the shear span-to-depth aid ratio, indicating that the flexural strength capacity is smaller than shear strength capacity.
4. For a constant value of shear span-to-depth aid ratio, the relative flexural strength increases as the steel ratio p decreases.
5. The proposed empirical flexure-shear interaction model gives reasonable comparisons with reinforced concrete beams without shear reinforcement and with concretes of normal and high strengths.
ACKNOWLEDGMENT The authors wish to express their appreciation to the University
Research Committee of North Carolina State University, Raleigh, for their partial financial support for this investigation.
NOTATION A, area of flexural steel in tension a shear span b beam width d effective depth of the beam fi conj:rete compressive strength M bending moment Mf = ultimate moment of resistance with shear Mfl = moment of resistance without shear V shear force v" shear stress at inclined cracking v. shear stress at ultimate p ratio of flexural tensile reinforcement
REFERENCES I. ACI Committee 318, "Building Code Requirements for Rein
forced Concrete (ACI 318-83)," American Concrete Institute, Detroit, 1983, Ill pp.
ACI Structural Journal I July-August 1987
2. CEB-FIP Model Code for Concrete Structures, 3rd Edition, Comite Euro-International du Seton/Federation lnternationale de Ia Precontrainte, Paris, 1978, 348 pp.
3. Krauthammer, Theodor, and Hall, William 1., "Modified Analysis of Reinforced Concrete Beams," Proceedings, ASCE, V. 108, ST2, Feb. 1982, pp. 457-474.
4. Yamashiro, R., and Siess, C. P., "Moment Rotation Characteristics of Reinforced Concrete Members Subjected to Bending, Shear, and Axial Load," Research Report Series No. 260, Department of Civil Engineering, University of Illinois, Urbana, Dec. 1962, 221 pp.
5. Leonhardt, F., and Walther, R., "Contribution to the Treatment of Shear Problems in Reinforced Concrete," Beton- und Stahlbetonbau (Berlin), V. 56, No. 12, Dec. 1961; V. 57, No.2, Feb. 1962, No. 3, Mar. 1962, No. 6, June 1962, No.7, July 1962, and No. 8, Aug. 1962. (in German)
6. Kani, G. N. J., "Basic Facts Concerning Shear Failure," ACI JOURNAL, Proceedings V. 63, No.6, June 1966, pp. 675-692.
7. Kani, G. N.J., "The Riddle of Shear Failure and Its Solution," ACI JouRNAL, Proceedings V. 61, No.4, Apr. 1964, pp. 441-467.
8. Fenwick, R. C., and Paulay, Thomas, "Mechanisms of Shear Resistance of Concrete Beams," Proceedings, ASCE, V. 94, STIO, Oct. 1968, pp. 2325-2350.
9. Mphonde, Andrew G., and Frantz, Gregory C., "Shear Tests of High- and Low-Strength Concrete Beams Without Stirrups," ACI JoURNAL, Proceedings V. 91, No.4, July-Aug. 1984, pp. 350-357.
10. Ahmad, Shuaib H.; Khaloo, A. R.; and Poveda, A., "Shear Capacity of Reinforced High-Strength Concrete Beams," ACI JOURNAL, Proceedings V. 83, No.2, Mar.-Apr. 1986, pp. 297-305.
II. Elzanaty, Ashraf H.; Nilson, Arthur H.; and Slate, Floyd 0., "Shear Capacity of Reinforced Concrete Beams Using High-Strength Concrete," ACI JOURNAL, Proceedings V. 83, No. 2, Mar.-Apr. 1986, pp. 290-296.
12. ACI-ASCE Committee 426, "The Shear Strength of Reinforced Concrete Members," Proceedings, ASCE, V. 100, ST8, Aug. 1974, pp. 1543-1591.
13. Price, Walter H., "Factors Influencing Concrete Strength," ACI JoURNAL, Proceedings V. 47, No.6, Feb. 1951, pp. 417-432.
14. Khaloo, Ali R., "Behavior of Concrete Under Triaxial Compression and Shear Loading," PhD thesis, Department of Civil Engineering, North Carolina State University, Raleigh, Dec. 1986.
15. Neville, Adam M., "A General Relation for Strengths of Concrete Specimens of Different Shapes and Sizes," ACI JouRNAL, Proceedings V. 63, No. 10, Oct. 1966, pp. 1095-1109.
16. Manuel, Robert F.; Slight, Bruce W.; and Suter, Gerhard T., "Deep Beam Behavior Affected by Length and Shear Span Variations," ACI JoURNAL, Proceedings V. 68, No. 12, Dec. 1971, pp. 954-958.
341