Embed Size (px)
Citation preview
Page 1 of 35
Flexible recruitment of memory-based choice
representations by human medial-frontal cortex
Juri Minxha1, 3, 6, Ralph Adolphs1, 2, Stefano Fusi6, Adam N. Mamelak3, Ueli Rutishauser1,3,4,5
1 Computation and Neural Systems Program, Division of Biology and Biological Engineering,
California Institute of Technology, Pasadena CA 2 Division of Humanities and Social Sciences, California Institute of Technology, Pasadena CA 3 Department of Neurosurgery, Cedars-Sinai Medical Center, Los Angeles, CA 4 Department of Neurology, Cedars-Sinai Medical Center, Los Angeles, CA 5 Center for Neural Science and Medicine, Department of Biomedical Sciences, Cedars-Sinai
Medical Center, Los Angeles, CA 6 Center for Theoretical Neuroscience, College of Physicians and Surgeons, Columbia University
Summary
Decisions in complex environments rely on flexibly utilizing past experience as required
by context and instructions1. This process depends on the medial frontal cortex (MFC) and the
medial temporal lobe (MTL)2-5, but it remains unknown how these structures jointly implement
flexible memory retrieval6,7. We recorded single neurons in MFC and MTL while human subjects
switched8 between making memory- and categorization-based decisions9,10. Here we show that
MFC rapidly implements changing task demands by utilizing different subspaces of neural activity
during different types of decisions. In contrast, no effect of task demands was seen in the MTL.
Choices requiring memory retrieval selectively engaged phase-locking of MFC neurons to field
potentials in the theta-frequency band in the MTL. Choice-selective neurons in MFC signaled
abstract yes-no decisions independent of behavioral response modality (button press or saccade).
These findings reveal a novel mechanism for flexibly and selectively engaging memory retrieval11-
14 and show that unlike perceptual decision-making15, memory-related information is only
represented in frontal cortex when choices require it.
Introduction
Behavior in complex environments requires decisions that flexibly combine stimulus
representations with context, goals, and memory. Two key aspects of such cognitive flexibility
are the ability to selectively utilize relevant information depending on task demands, and to retrieve
information from memory when needed. The neural mechanisms that underlie flexible decisions
are beginning to be understood in the case of perceptual decision-making 10,15,16, with evidence for
both early gating, mediated by top-down attention 17, and late selection of relevant features in
prefrontal cortex 15. In contrast, little is known about the mechanisms of decisions that depend in
addition also on associated category knowledge and memory, an ability that humans exhibit
ubiquitously. In particular, it remains unknown how memory retrieval is selectively engaged when
decision-relevant information needs to be actively searched for in memory 13,18,19.
The medial frontal cortex (MFC) is critical for complex behavior, and registers cognitive
conflict, errors, and choice outcomes 20-22. It supports flexible decision-making in two ways: i) by
All rights reserved. No reuse allowed without permission. (which was not peer-reviewed) is the author/funder, who has granted bioRxiv a license to display the preprint in perpetuity.
The copyright holder for this preprint. http://dx.doi.org/10.1101/809673doi: bioRxiv preprint first posted online Oct. 18, 2019;
Page 2 of 35
representing task sets 5,23 and context 24, and ii) by selectively engaging memory retrieval through
functional interactions with the amygdala and hippocampus 3,7,25-28 (henceforth referred to jointly
as the medial temporal lobe, MTL). A mechanism that facilitates such MFC-MTL interactions is
phase-locking of MFC activity to oscillations in the MTL, a mode of interaction that has been
extensively investigated in rodents during spatial behavior 6,29,30 and fear conditioning 31,32, but
whose broader function remains poorly understood 33, particularly in humans. Similarly, findings
from human neuroimaging indicate that the MFC is involved in memory search 2,3,11,12,19,34 , but it
remains unknown what features of decisions and context are represented in human MFC, whether
MTL-dependent memory retrieval selectively engages synchrony between the two structures, and
whether synchrony can be engaged dynamically when required. Our lack of knowledge about the
nature of representations in human MFC stands in stark contrast to the patent behavioral ability of
humans to flexibly recruit memory processes in everyday life 8,14 and to our detailed knowledge
of memory representations in the human MTL, where cells are known to represent aspects of
declarative memories such as the familiarity and the identity of a stimulus 9,35,36. This gap in
knowledge motivated our study: how are MTL-based representations recruited depending on task
demands through interactions with the MFC?
To address these open questions, we utilized simultaneous recordings of single neurons
and local field potentials in the human MFC and MTL. We showed images to subjects and asked
them to provide a "yes" or "no" answer, with either a button press or eye movement, for one of
two possible tasks: a visual categorization task 10 or a new/old recognition memory task 9 (Fig.
1a,b). Subjects received no training and were informed explicitly of the type of task and response
modality to use before the start of every block. This approach allowed us to isolate the effects of
explicit task demands from sensory stimuli and motor response type. Based on a combination of
single-neuron, population, and spike-field coherence analysis, we found that task demands reshape
the representational geometry formed by MFC but not MTL neurons, that persistently active MFC
context cells encode the currently active task, and that memory retrieval is accompanied by phase-
locking between local field potentials in the MTL and spikes of memory-choice cells in MFC.
All rights reserved. No reuse allowed without permission. (which was not peer-reviewed) is the author/funder, who has granted bioRxiv a license to display the preprint in perpetuity.
The copyright holder for this preprint. http://dx.doi.org/10.1101/809673doi: bioRxiv preprint first posted online Oct. 18, 2019;
Page 3 of 35
Results
Task and behavior
We recorded from 1430 single neurons across four brain areas (Fig. 1C-D; see Table S1;
33 sessions in 13 subjects): n=203, 460, 329, and 438 neurons from anterior hippocampus,
amygdala, dorsal anterior cingulate cortex (dACC) and pre-supplementary motor area (pre-SMA),
respectively. We refer to hippocampus and amygdala combined as MTL (n=663 cells), and to
dACC and pre-SMA combined as MFC (n=767 cells).
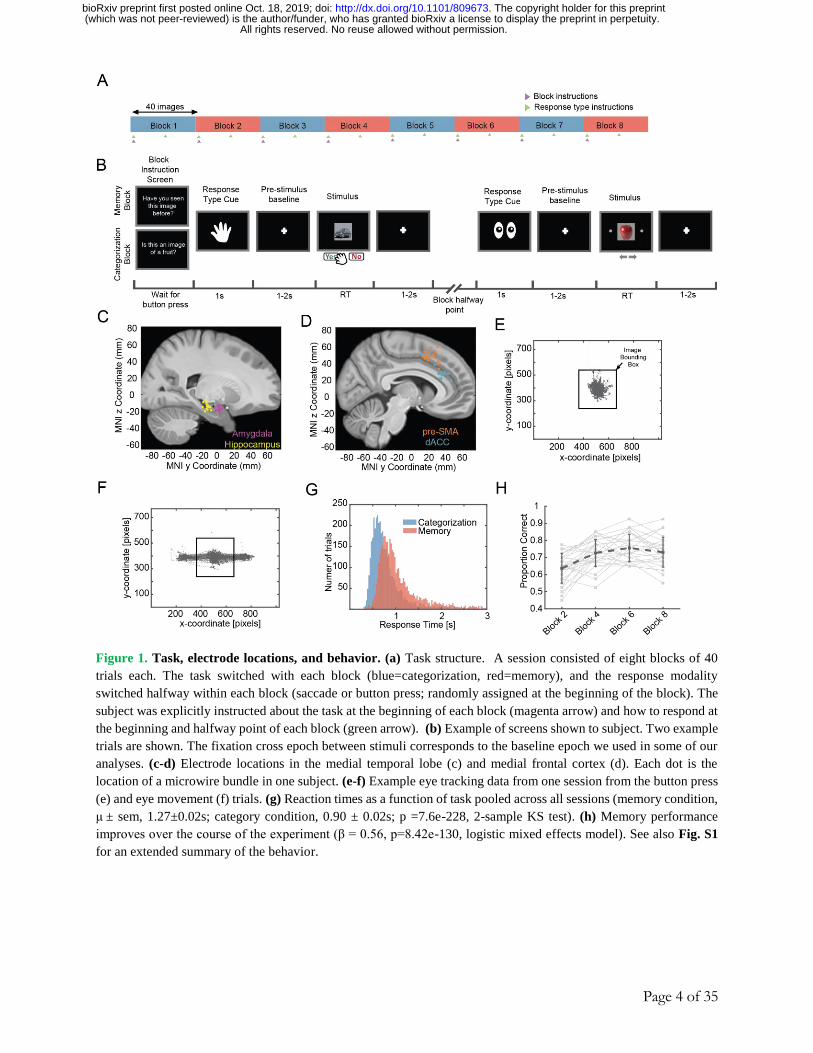
Subjects viewed a sequence of 320 images, grouped into 8 blocks of 40 images each, in
each session (Fig. 1A-B). Subjects were instructed at the beginning of each block which decision
to make and which response modality to use to communicate their decision. Subjects made a “yes”
or “no” decision for each trial to either indicate whether an image belonged to a given visual
category (“Categorization Task”) or whether an image had been seen before in the task or not
(“Memory task”); no feedback was provided (see Fig. 1A legend and Methods for details on the
task). Each image shown belonged to one of four visual categories: human faces, monkey faces,
fruits, or cars. In each block, half of the images shown were repeated and half were novel (except
in the first block, in which all images were novel). For the categorization task, the target category
(“yes” response) was chosen randomly to be either human faces, monkey faces, fruits, or cars.
Choices were indicated either using saccades (leftward or rightward saccade) or button
press with central fixation (Fig. 1E-F; mean ± s.d., 94 ± 15% of all gaze positions fell within the
image shown). As expected, reaction times (RT) were significantly longer in the memory compared
to the categorization task (Fig. 1G, mean RT of 1.48s ± 1.1 vs. 1.19s ± 1.2 respectively, p<1e-20,
2-sample KS test, mean ± s.d. across all trials in a given task). Subjects performed with an average
accuracy of 97 ± 6% vs. 71 ± 6% in the categorization and memory task, respectively (mean ± s.d.
across n = 33 sessions). This difference in accuracy remained after we matched for RT between
the two tasks (96 ± 6% vs. 72 ± 8% with matched RT of 1.23s±0.60 vs. 1.24s±0.60 for the
categorization and memory task, respectively; see methods for matching procedure; also, even
without RT matching, the initial response in terms of arousal was not different between tasks as
assessed by pupillometry, see Fig. S1J-L). In the memory task, accuracy increased as a function
of how many times an image had been shown (Fig. 1H, βappearances = 0.56, p <1e-20, mixed effects
logistic regression; also see Fig. S1C-D for effect of target vs. non-target on memory
performance). Lastly, subjects had shorter RTs on “yes” (seen before) decisions than on “no”
(novel stimulus) decisions in the memory task (Fig. S1A, see legend for statistics). Together, the
behavior of our subjects is as expected from an MTL-dependent recognition memory task 9 .
All rights reserved. No reuse allowed without permission. (which was not peer-reviewed) is the author/funder, who has granted bioRxiv a license to display the preprint in perpetuity.
The copyright holder for this preprint. http://dx.doi.org/10.1101/809673doi: bioRxiv preprint first posted online Oct. 18, 2019;
Page 4 of 35
Figure 1. Task, electrode locations, and behavior. (a) Task structure. A session consisted of eight blocks of 40
trials each. The task switched with each block (blue=categorization, red=memory), and the response modality
switched halfway within each block (saccade or button press; randomly assigned at the beginning of the block). The
subject was explicitly instructed about the task at the beginning of each block (magenta arrow) and how to respond at
the beginning and halfway point of each block (green arrow). (b) Example of screens shown to subject. Two example
trials are shown. The fixation cross epoch between stimuli corresponds to the baseline epoch we used in some of our
analyses. (c-d) Electrode locations in the medial temporal lobe (c) and medial frontal cortex (d). Each dot is the
location of a microwire bundle in one subject. (e-f) Example eye tracking data from one session from the button press
(e) and eye movement (f) trials. (g) Reaction times as a function of task pooled across all sessions (memory condition,
μ ± sem, 1.27±0.02s; category condition, 0.90 ± 0.02s; p =7.6e-228, 2-sample KS test). (h) Memory performance
improves over the course of the experiment (β = 0.56, p=8.42e-130, logistic mixed effects model). See also Fig. S1
for an extended summary of the behavior.
All rights reserved. No reuse allowed without permission. (which was not peer-reviewed) is the author/funder, who has granted bioRxiv a license to display the preprint in perpetuity.
The copyright holder for this preprint. http://dx.doi.org/10.1101/809673doi: bioRxiv preprint first posted online Oct. 18, 2019;
Page 5 of 35
Effects of task type and response modality in the medial frontal cortex
Instructions about the type of task (memory or categorization) and response modality
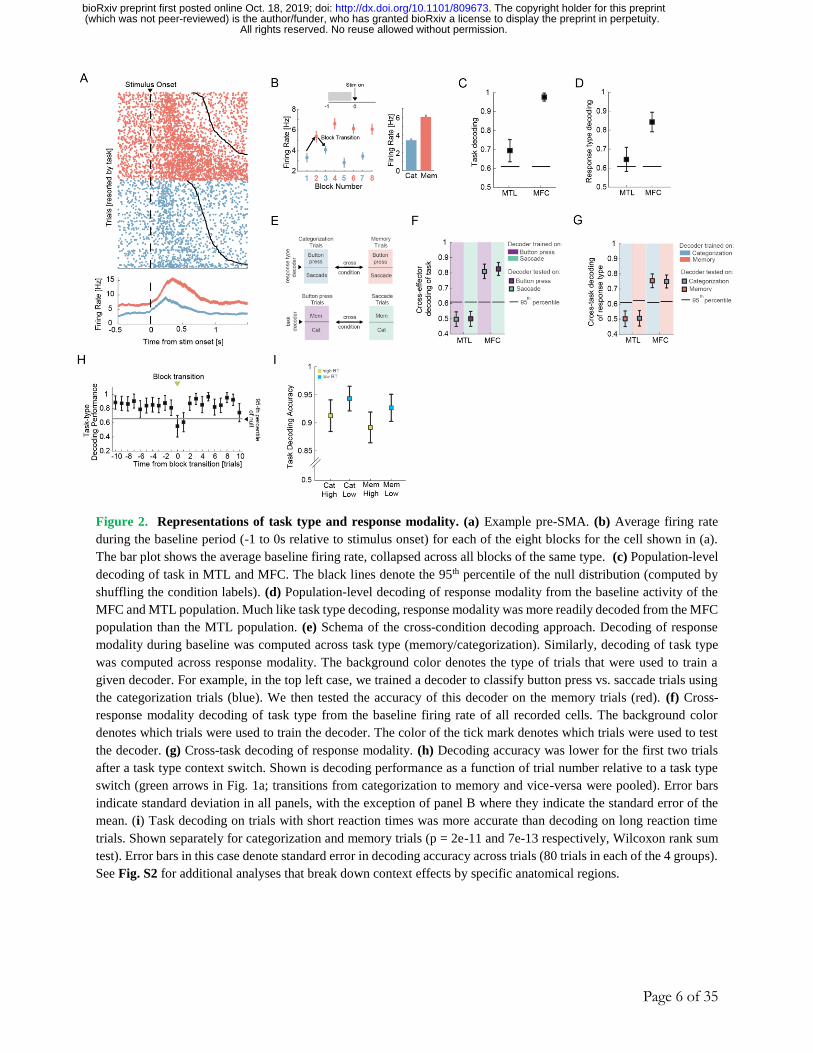
(button press or saccade) were shown at the beginning of each block (Fig. 1A, B). Cells showed
significant modulation of their firing rate during the baseline period as a function of task type (Fig.
2A-B shows an example in pre-SMA). At both the single-neuron and population level, significantly
more task-type information was available in the MFC compared to MTL (25% of MFC cells vs.
12% of MTL cells, 165/767 vs. 79/663, χ2-test of proportions, p = 1.5e-6; Fig. 2C, population
decoding accuracy of 98% vs. 69% in MFC and MTL, respectively, p<1e-5, Δtrue = 29% vs.
empirical null distribution, see Methods). Similarly, more information about response modality
was encoded by MFC vs. MTL cells (Fig. S2E shows an example; 14% vs 10% of cells; 84/593
vs. 59/586 in MFC and MTL respectively; χ2-test of proportions, p = 0.03; see; population
decoding performance 84% vs. 65%, Fig. 2D; p<1e-5, Δtrue = 19% vs. empirical null distribution).
Together, these results show that contextual set information (about task or response modality) is
represented in the MFC during the inter-trial baseline periods.
After a task switch, contextual signals emerged rapidly within 1-2 trials in the new context
(Fig. 2H). Task switching costs are also reflected in the subjects’ longer reaction times shortly
after a change in task or effector type (Fig. S2A). Furthermore, task type representations during
the baseline period were stronger on trials where the subject produced a fast response versus those
where the response time was slow (Fig. 1I), indicating behavioral relevance. Lastly, we tested
whether the two types of contextual signals were sufficiently robust to avoid interference with one
another, using a cross-condition generalization decoding analysis 37 (Fig. 2E). We first trained a
decoder to discriminate task type on trials where the subject was instructed to reply with a button
press, and then tested the performance of this decoder on trials where the subject was instructed to
use saccades (and vice-versa). This analysis revealed that the two neural representations generalize
in the MFC but not in the MTL (Fig. 2F-G). Together, this shows that the contextual signals in
MFC were robust and behaviorally relevant.
All rights reserved. No reuse allowed without permission. (which was not peer-reviewed) is the author/funder, who has granted bioRxiv a license to display the preprint in perpetuity.
The copyright holder for this preprint. http://dx.doi.org/10.1101/809673doi: bioRxiv preprint first posted online Oct. 18, 2019;
Page 6 of 35
Figure 2. Representations of task type and response modality. (a) Example pre-SMA. (b) Average firing rate
during the baseline period (-1 to 0s relative to stimulus onset) for each of the eight blocks for the cell shown in (a).
The bar plot shows the average baseline firing rate, collapsed across all blocks of the same type. (c) Population-level
decoding of task in MTL and MFC. The black lines denote the 95th percentile of the null distribution (computed by
shuffling the condition labels). (d) Population-level decoding of response modality from the baseline activity of the
MFC and MTL population. Much like task type decoding, response modality was more readily decoded from the MFC
population than the MTL population. (e) Schema of the cross-condition decoding approach. Decoding of response
modality during baseline was computed across task type (memory/categorization). Similarly, decoding of task type
was computed across response modality. The background color denotes the type of trials that were used to train a
given decoder. For example, in the top left case, we trained a decoder to classify button press vs. saccade trials using
the categorization trials (blue). We then tested the accuracy of this decoder on the memory trials (red). (f) Cross-
response modality decoding of task type from the baseline firing rate of all recorded cells. The background color
denotes which trials were used to train the decoder. The color of the tick mark denotes which trials were used to test
the decoder. (g) Cross-task decoding of response modality. (h) Decoding accuracy was lower for the first two trials
after a task type context switch. Shown is decoding performance as a function of trial number relative to a task type
switch (green arrows in Fig. 1a; transitions from categorization to memory and vice-versa were pooled). Error bars
indicate standard deviation in all panels, with the exception of panel B where they indicate the standard error of the
mean. (i) Task decoding on trials with short reaction times was more accurate than decoding on long reaction time
trials. Shown separately for categorization and memory trials (p = 2e-11 and 7e-13 respectively, Wilcoxon rank sum
test). Error bars in this case denote standard error in decoding accuracy across trials (80 trials in each of the 4 groups).
See Fig. S2 for additional analyses that break down context effects by specific anatomical regions.
All rights reserved. No reuse allowed without permission. (which was not peer-reviewed) is the author/funder, who has granted bioRxiv a license to display the preprint in perpetuity.
The copyright holder for this preprint. http://dx.doi.org/10.1101/809673doi: bioRxiv preprint first posted online Oct. 18, 2019;
Page 7 of 35
Cross-condition generalization of memory and image category
We next asked whether the neural representations of image category and familiarity
are sensitive to task demands. At the single-unit level, we examined visually-selective (VS) cells 35, whose responses are thought to reflect input from high level visual cortex, and memory-
selective (MS) cells 9, whose response signals stimulus familiarity (Fig. 3A-B shows examples).
Of the MTL cells, 40% were visually selective (264/663) and 11% (73/663) were memory selective
(see Methods for selection models). By comparison, in the MFC, 13% (103/767) of the cells were
visually selective and 11% (84/767) were memory selective. We first performed single-neuron
analysis of the selected MTL cells and found that both visual and memory selectivity was present
in both the memory and categorization blocks (Fig. S3D, E and S3G-I). We next took a population-
level approach (over all single units, without selection) to answer the question whether the same
or different groups of cells represent visual- and memory information across tasks (Fig. 3C-H).
We used decoding accuracy based on condition averages to quantify the extent to which a particular
type of information was represented (see Methods; single-trial decoding reveals quantitatively
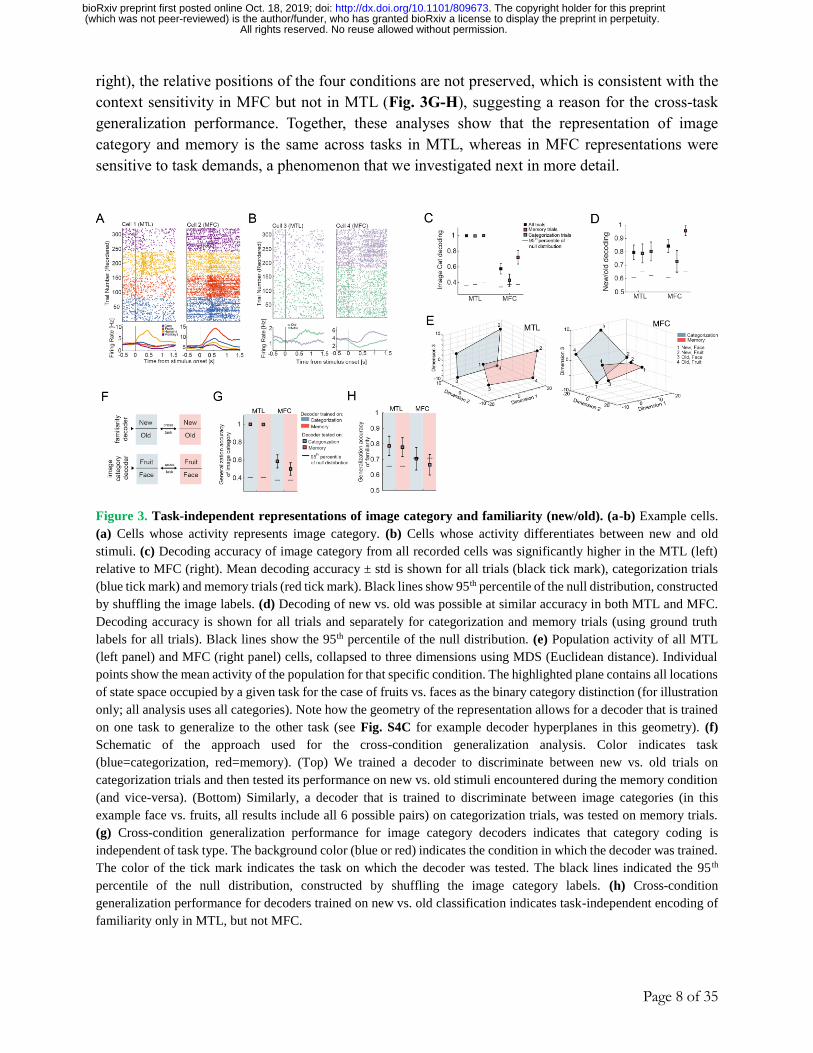
similar results, see Fig. S4D-E). In both MTL and MFC, image category could be decoded well
above chance (Fig. 3C, 100% and 58% in MTL and MFC respectively, chance level = 25%). In
the MTL, the ability to decode category was not affected by the task (Fig. 3C, 100% for both
tasks). In contrast, in the MFC, decoding accuracy for image category was significantly higher in
the memory task (Fig. 3C, 72% vs. 43%). Similarly, memory (i.e. new vs. old) was decodable in
both the MTL and MFC (Fig. 3D, 80% vs. 84% respectively, chance level = 50%), with no
significant difference in decoding accuracy between the two tasks in MTL (Fig. 3D, 79% vs. 80%
in categorization and memory trials respectively) and significantly better decoding ability in MFC
in the memory task (Fig. 3D, 96% vs. 73%).
These results indicate that information about familiarity and stimulus category in the MTL
is independent of task demands, whereas it is sensitive to task demands in the MFC. To gain insight
into the geometry of the population-level representations, we next assessed whether the decoders
trained to report familiarity and the category of the stimuli in one task would generalize to the
other task. This would indicate that familiarity and category are represented in an abstract format 37 (Fig. 3F). First, cross-task generalization performance was greater in the MTL than MFC for
both image category (Fig. 3G; 100% vs. 54%, averaged across the two cross-condition decoding
performances) and familiarity (Fig. 3H; 79% vs. 67%). This suggests that the degree of
generalization of these two variables is higher in the MTL than in the MFC. Note that in the MTL,
familiarity decoding was supported by amygdala neurons (Fig. S4A-B). Second, to help
understand the geometry of these neural representations, we projected the average MTL and MFC
population activity for all possible pairings of familiarity, image category, and task (8 different
conditions) into a 3D state-space using multi-dimensional scaling. For illustration purposes, we
show this for the two image categories (fruits, faces) for which memory performance was the best
(for all other analyses, we used all image categories). This revealed that in the MTL (Fig. 3E, left),
the relative positions of a “new face” with respect to an “old face” is preserved across tasks (shown
as different colored planes). The relatively parallel location of the subspace of neural activity
occupied by the two tasks permits across-task generalization. This geometry is similar to the one
observed in monkeys in a different task and discussed in 37. In contrast, in the MFC (Fig. 3E,
All rights reserved. No reuse allowed without permission. (which was not peer-reviewed) is the author/funder, who has granted bioRxiv a license to display the preprint in perpetuity.
The copyright holder for this preprint. http://dx.doi.org/10.1101/809673doi: bioRxiv preprint first posted online Oct. 18, 2019;
Page 8 of 35
right), the relative positions of the four conditions are not preserved, which is consistent with the
context sensitivity in MFC but not in MTL (Fig. 3G-H), suggesting a reason for the cross-task
generalization performance. Together, these analyses show that the representation of image
category and memory is the same across tasks in MTL, whereas in MFC representations were
sensitive to task demands, a phenomenon that we investigated next in more detail.
Figure 3. Task-independent representations of image category and familiarity (new/old). (a-b) Example cells.
(a) Cells whose activity represents image category. (b) Cells whose activity differentiates between new and old
stimuli. (c) Decoding accuracy of image category from all recorded cells was significantly higher in the MTL (left)
relative to MFC (right). Mean decoding accuracy ± std is shown for all trials (black tick mark), categorization trials
(blue tick mark) and memory trials (red tick mark). Black lines show 95th percentile of the null distribution, constructed
by shuffling the image labels. (d) Decoding of new vs. old was possible at similar accuracy in both MTL and MFC.
Decoding accuracy is shown for all trials and separately for categorization and memory trials (using ground truth
labels for all trials). Black lines show the 95th percentile of the null distribution. (e) Population activity of all MTL
(left panel) and MFC (right panel) cells, collapsed to three dimensions using MDS (Euclidean distance). Individual
points show the mean activity of the population for that specific condition. The highlighted plane contains all locations
of state space occupied by a given task for the case of fruits vs. faces as the binary category distinction (for illustration
only; all analysis uses all categories). Note how the geometry of the representation allows for a decoder that is trained
on one task to generalize to the other task (see Fig. S4C for example decoder hyperplanes in this geometry). (f)
Schematic of the approach used for the cross-condition generalization analysis. Color indicates task
(blue=categorization, red=memory). (Top) We trained a decoder to discriminate between new vs. old trials on
categorization trials and then tested its performance on new vs. old stimuli encountered during the memory condition
(and vice-versa). (Bottom) Similarly, a decoder that is trained to discriminate between image categories (in this
example face vs. fruits, all results include all 6 possible pairs) on categorization trials, was tested on memory trials.
(g) Cross-condition generalization performance for image category decoders indicates that category coding is
independent of task type. The background color (blue or red) indicates the condition in which the decoder was trained.
The color of the tick mark indicates the task on which the decoder was tested. The black lines indicated the 95 th
percentile of the null distribution, constructed by shuffling the image category labels. (h) Cross-condition
generalization performance for decoders trained on new vs. old classification indicates task-independent encoding of
familiarity only in MTL, but not MFC.
All rights reserved. No reuse allowed without permission. (which was not peer-reviewed) is the author/funder, who has granted bioRxiv a license to display the preprint in perpetuity.
The copyright holder for this preprint. http://dx.doi.org/10.1101/809673doi: bioRxiv preprint first posted online Oct. 18, 2019;
Page 9 of 35
Representation of choice in the MFC
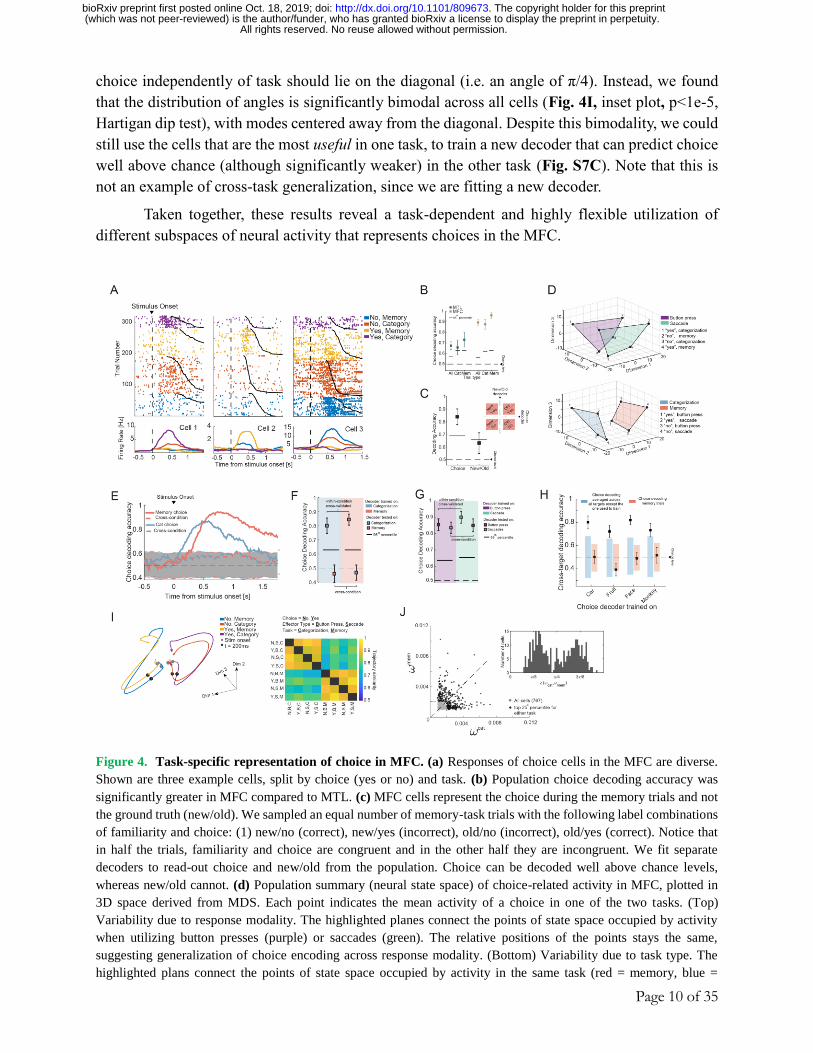
We next investigated how the subject’s choice (yes or no) is represented. Cells in the MFC
show modulation of activity with the subject’s choice (Fig. 4A shows examples). This signal was
strongest in the MFC, with average population decoding performance of 89%, compared to 68%
in the MTL (Fig. 4B, “yes” vs. “no” decoding). Choice decoding was strongest shortly after
stimulus onset well before the response was made (Fig. S7A). To disassociate representation of
choice (yes vs. no) from the representation of ground truth (old vs. new) during the memory
recognition task, we fit a choice decoder to a set of trials that were half-correct and half-incorrect.
We found that the activity of MFC cells predicted choice, but not the ground truth (Fig. 4C). A
similar analysis revealed that choice can be decoded separately from both correct and incorrect
trials (Fig. S5I). As a control for potential confounds due to RT differences between tasks (see Fig.
S1A), we acquired data from a separate control task in which we eliminated RT differences
behaviorally by adding a waiting period (6 sessions in 5 subjects; n=180 and 162 neurons in MTL
and MFC, respectively; see Methods and Fig. S6). Like in the original task, MFC cells represented
the subject’s choice (Fig. S6C-G), thereby confirming that this separation is not due to RT
differences.
We used multi-dimensional scaling to visualize the population activity for the eight
combinations of choices, task types, and response modality (Fig. 4D, see Methods). The resulting
geometrical configuration indicates that choice decoding generalizes across response modality
(Fig. 4D, top) but not across task types (Fig. 4D, bottom). To test this hypothesis, we computed
the cross-task generalization performance of a decoder trained on choices during one task and
tested on the other. We performed this analysis across time (Fig. 4E), as well as in a single post-
stimulus time bin (Fig. 4F). To avoid confounds due to response time differences, we performed
the fixed window analysis (Fig. 4F) only for the control task, where the timing between tasks was
identical (Fig. S6B). Importantly, while the choice signal does not generalize across task types, it
does generalize across response modality within the same task type (Fig. 4G). To test the
possibility that any task might yield a unique choice axis that does not generalize to any other task,
we considered the four subtasks that make up the categorization trials in a given session (the target
category can be any one of the four possible image categories). We tested whether the choice signal
generalizes across these subtasks by training and testing across blocks requiring different
categorizations. We found that choice decoding generalized across all sub-tasks in the
categorization task, but not the memory task (Fig. 4H). Next we compared the dynamics of the
population activity between the eight conditions arising from the combination of choice, effector
type, and task in a state-space model recovered using Gaussian Process Factor Analysis (GPFA 38,
see Methods). A comparison of the pairwise similarity between the trajectories in state space (Fig.
4I, left) in the first 500ms after the stimulus onset reveals that the patterns of dynamics in state
space cluster first by task type (Fig. 4I, right; also see Supplementary Video 1).
We next examined whether the population-level analysis relied on different sets of neurons
to decode choice in each of the two tasks. We did this by determining how individual cells are
recruited by a linear decoder 37,39. For each cell, we quantified its importance 39 (see methods) for
both the memory and categorization choice decoder (Fig. 4J). We then plotted the degree of
specialization for each cell based on its importance in each task (see Methods). Cells that report
All rights reserved. No reuse allowed without permission. (which was not peer-reviewed) is the author/funder, who has granted bioRxiv a license to display the preprint in perpetuity.
The copyright holder for this preprint. http://dx.doi.org/10.1101/809673doi: bioRxiv preprint first posted online Oct. 18, 2019;
Page 10 of 35
choice independently of task should lie on the diagonal (i.e. an angle of π/4). Instead, we found
that the distribution of angles is significantly bimodal across all cells (Fig. 4I, inset plot, p<1e-5,
Hartigan dip test), with modes centered away from the diagonal. Despite this bimodality, we could
still use the cells that are the most useful in one task, to train a new decoder that can predict choice
well above chance (although significantly weaker) in the other task (Fig. S7C). Note that this is
not an example of cross-task generalization, since we are fitting a new decoder.
Taken together, these results reveal a task-dependent and highly flexible utilization of
different subspaces of neural activity that represents choices in the MFC.
Figure 4. Task-specific representation of choice in MFC. (a) Responses of choice cells in the MFC are diverse.
Shown are three example cells, split by choice (yes or no) and task. (b) Population choice decoding accuracy was
significantly greater in MFC compared to MTL. (c) MFC cells represent the choice during the memory trials and not
the ground truth (new/old). We sampled an equal number of memory-task trials with the following label combinations
of familiarity and choice: (1) new/no (correct), new/yes (incorrect), old/no (incorrect), old/yes (correct). Notice that
in half the trials, familiarity and choice are congruent and in the other half they are incongruent. We fit separate
decoders to read-out choice and new/old from the population. Choice can be decoded well above chance levels,
whereas new/old cannot. (d) Population summary (neural state space) of choice-related activity in MFC, plotted in
3D space derived from MDS. Each point indicates the mean activity of a choice in one of the two tasks. (Top)
Variability due to response modality. The highlighted planes connect the points of state space occupied by activity
when utilizing button presses (purple) or saccades (green). The relative positions of the points stays the same,
suggesting generalization of choice encoding across response modality. (Bottom) Variability due to task type. The
highlighted plans connect the points of state space occupied by activity in the same task (red = memory, blue =
All rights reserved. No reuse allowed without permission. (which was not peer-reviewed) is the author/funder, who has granted bioRxiv a license to display the preprint in perpetuity.
The copyright holder for this preprint. http://dx.doi.org/10.1101/809673doi: bioRxiv preprint first posted online Oct. 18, 2019;
Page 11 of 35
categorization). The relative position of the 4 points is not preserved across the task planes, suggesting lack of
generalization across task. (e) Choice-decoders trained in one task do not generalize to the other task. Shown here as
a function of time (500ms bin, 16ms step size). See Fig. S7 for results individually for dACC and pre-SMA. (f) Same
as (e) but shown for a fixed time window [0.2 1.2] seconds relative to stimulus onset. As suggested by panel d (bottom),
decoding does not generalize across tasks. To avoid reaction time confounds, this analysis is shown only for cells
recorded in the control task, in which RT was equated due to a go cue (see methods and Fig. S6). (g) Decoding
generalizes across effectors as suggested by panel d (top). Here, performance is shown averaged across categorization
and memory choices (chance level = 50%). As in (f), decoders are fit using cells recorded during the control task. (h)
Generalization between different sub-tasks of the categorization task but not between task types. Average yes vs. no
decoding performance for decoders trained in subsets of categorization trials (x-axis). The blue and red shading shows
the range of the null distribution estimated by shuffling the labels. (i) (Left) State-space trajectories for the four
conditions arising from the combination of response (yes, no) and task (categorization, memory). (Right) Trajectory
similarity, computed in a 8D latent space (recovered using GPFA, see Methods) across the eight conditions arising
from the combinations of choice, effector type, and task. The similarity is averaged in the time window [0 500ms]
after stimulus onset. Latent factors were recovered from the condition averages, across all MFC cells. (j) Scatter plot
of the decoder weight assigned to each cell in decoding choice during the categorization task (x-axis) and memory
choice (y-axis). The cells in the top 25-th percentile are shown in black. The inset shows the angle created by the
vector [𝜔𝑖𝑐𝑎𝑡 , 𝜔𝑖
𝑚𝑒𝑚] with respect to the x-axis of the cells marked in black.
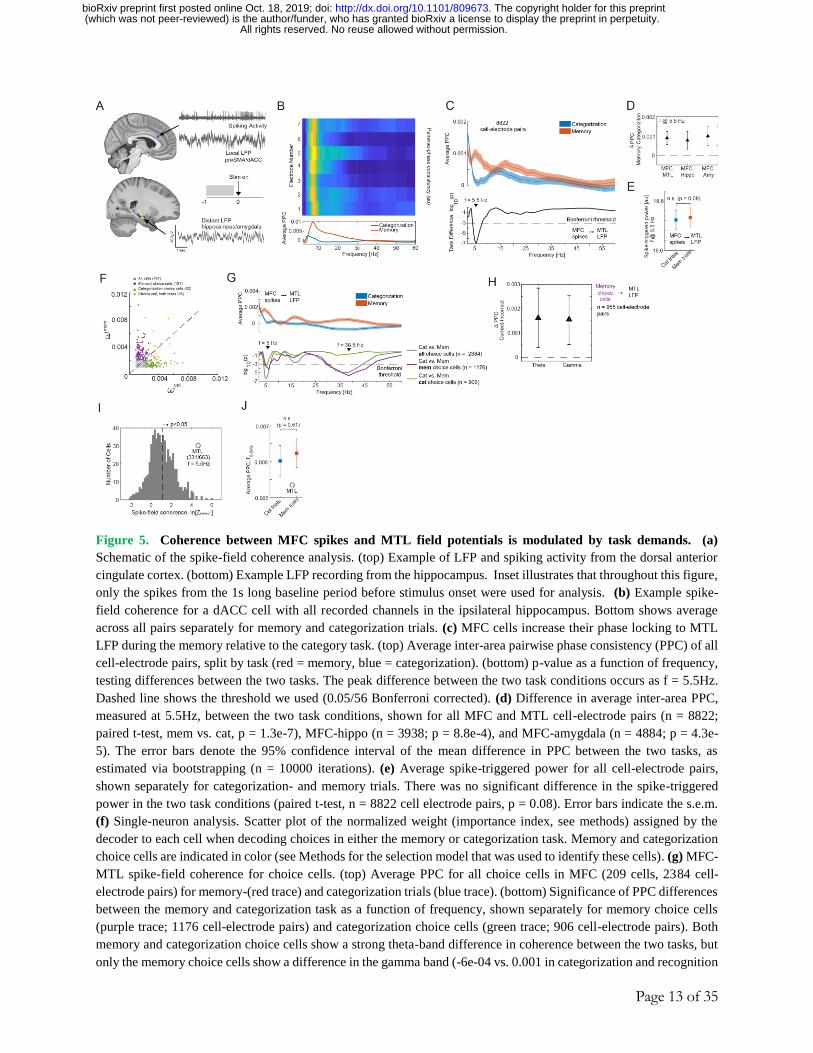
Task-dependent spike-field coherence between MFC cells and MTL LFP
It is thought that the selective routing of decision-related information between MTL and
MFC is coordinated by inter-areal spike-field coherence 6. We therefore next asked whether MFC
neurons phase-lock to ongoing oscillations in the LFP in the MTL and, if so, whether the strength
of such interactions is modulated by task demands. We performed this analysis for the 13 subjects
and 33 sessions for which we simultaneously recorded from both areas (Fig. 5A summarizes our
approach; see methods for details on preprocessing of the data). In the following, we only utilized
neural activity from the 1s baseline period that precedes stimulus-onset to avoid confounds related
to stimulus-onset evoked activity. Individual cells in the MFC showed strong task modulation of
MFC to MTL spike-field coherence (Fig. 5B shows a single-cell example in the dACC). At the
population level, MFC cells showed significantly stronger theta-band coherence with MTL
oscillations during the memory compared to the categorization task (Fig. 5C, 8822 cell electrode
pairs; p = 1.3e-7, paired t-test, measured at 5.5Hz). This was the case for both MFC-hippocampus,
and MFC-amygdala interactions (Fig. 5D, n = 3939, p = 8.8e-4; n = 4884, p = 4.3e-5 respectively,
paired t-test). This effect was due to changes in phase preference as there was no significant
difference in MTL LFP power between the tasks (Fig. 5E, p = 0.08, paired t-test of signal power
at 5.5Hz, estimate across all 8822 cell-electrode pairs). Out of the 767 MFC cells, a significant
subset of ~100 cells were phase-locked to the theta-band MTL LFP (Fig. S9A), with the largest
proportion preferring 3-8Hz.
To determine if there is a relationship between the tuning of cells in MFC and their inter-
area coherence with MTL, we selected for choice cells independently in the categorization and
memory task (see Methods for selection model; note selection controls for RT differences). This
revealed that 101/767 and 82/767 cells are significantly modulated by choice during the memory
and categorization task, respectively (p<0.001 vs. chance for both; see Fig. 4A Cell 2 and 1 for an
example, respectively). Single-unit decoding showed that choice cells selected in the memory task
All rights reserved. No reuse allowed without permission. (which was not peer-reviewed) is the author/funder, who has granted bioRxiv a license to display the preprint in perpetuity.
The copyright holder for this preprint. http://dx.doi.org/10.1101/809673doi: bioRxiv preprint first posted online Oct. 18, 2019;
Page 12 of 35
do not carry information about the subject’s choice in the categorization task and vice-versa (Fig.
S5A-D). In addition, the removal of the selected choice cells from a population decoding analysis
with access to all recorded neurons significantly diminishes decoding performance (Fig. S5F, G).
Importantly, each of the selected cells has a high importance index, as determined from the
population decoding (Fig. 5F). Considering only the MFC choice cells revealed that this subset of
cells were similarly increasing their phase-locking during the memory task (Fig. 5G, top), with
the strongest effect again in the theta range (fpeak = 5 Hz, p = 1e-6, paired t-test). Both categorization
and memory choice cells showed this pattern of modulation (Fig. 5G, bottom). In addition, the
memory choice cells exhibited an increase in gamma band coherence (Fig. 5G, fpeak = 38.5Hz; p
= 2e-6, paired t-test). The baseline theta and gamma synchrony of memory choice cells were
predictive of the accuracy of the choice made for the picture shown in that trial (Fig. 5H, see
legend for statistics). Lastly, to exclude the possibility that this inter-area effect was due to task-
dependent changes within the MTL, we examined the phase-locking properties of MTL cells to
their own locally recorded LFP (LFP and spiking activity is recorded on separate electrodes, see
Methods). The spiking activity of 331/663 MTL cells was significantly related to the theta-
frequency band LFP (Fig. 5I, shown for f = 5.5 Hz). The strength of this local spike-field coherence
was, however, not significantly different between the two tasks (Fig. 5J; p = 0.61, paired t-test, n
= 2321 cell-electrode pairs). Together, this shows that MFC to MTL spike-field coherence is
selectively increased during the memory relative to the categorization task, thereby showing that
this mechanism of information routing can be selectively up-regulated by task demands.
All rights reserved. No reuse allowed without permission. (which was not peer-reviewed) is the author/funder, who has granted bioRxiv a license to display the preprint in perpetuity.
The copyright holder for this preprint. http://dx.doi.org/10.1101/809673doi: bioRxiv preprint first posted online Oct. 18, 2019;
Page 13 of 35
Figure 5. Coherence between MFC spikes and MTL field potentials is modulated by task demands. (a)
Schematic of the spike-field coherence analysis. (top) Example of LFP and spiking activity from the dorsal anterior
cingulate cortex. (bottom) Example LFP recording from the hippocampus. Inset illustrates that throughout this figure,
only the spikes from the 1s long baseline period before stimulus onset were used for analysis. (b) Example spike-
field coherence for a dACC cell with all recorded channels in the ipsilateral hippocampus. Bottom shows average
across all pairs separately for memory and categorization trials. (c) MFC cells increase their phase locking to MTL
LFP during the memory relative to the category task. (top) Average inter-area pairwise phase consistency (PPC) of all
cell-electrode pairs, split by task (red = memory, blue = categorization). (bottom) p-value as a function of frequency,
testing differences between the two tasks. The peak difference between the two task conditions occurs as f = 5.5Hz.
Dashed line shows the threshold we used (0.05/56 Bonferroni corrected). (d) Difference in average inter-area PPC,
measured at 5.5Hz, between the two task conditions, shown for all MFC and MTL cell-electrode pairs (n = 8822;
paired t-test, mem vs. cat, p = 1.3e-7), MFC-hippo (n = 3938; p = 8.8e-4), and MFC-amygdala (n = 4884; p = 4.3e-
5). The error bars denote the 95% confidence interval of the mean difference in PPC between the two tasks, as
estimated via bootstrapping (n = 10000 iterations). (e) Average spike-triggered power for all cell-electrode pairs,
shown separately for categorization- and memory trials. There was no significant difference in the spike-triggered
power in the two task conditions (paired t-test, n = 8822 cell electrode pairs, p = 0.08). Error bars indicate the s.e.m.
(f) Single-neuron analysis. Scatter plot of the normalized weight (importance index, see methods) assigned by the
decoder to each cell when decoding choices in either the memory or categorization task. Memory and categorization
choice cells are indicated in color (see Methods for the selection model that was used to identify these cells). (g) MFC-
MTL spike-field coherence for choice cells. (top) Average PPC for all choice cells in MFC (209 cells, 2384 cell-
electrode pairs) for memory-(red trace) and categorization trials (blue trace). (bottom) Significance of PPC differences
between the memory and categorization task as a function of frequency, shown separately for memory choice cells
(purple trace; 1176 cell-electrode pairs) and categorization choice cells (green trace; 906 cell-electrode pairs). Both
memory and categorization choice cells show a strong theta-band difference in coherence between the two tasks, but
only the memory choice cells show a difference in the gamma band (-6e-04 vs. 0.001 in categorization and recognition
All rights reserved. No reuse allowed without permission. (which was not peer-reviewed) is the author/funder, who has granted bioRxiv a license to display the preprint in perpetuity.
The copyright holder for this preprint. http://dx.doi.org/10.1101/809673doi: bioRxiv preprint first posted online Oct. 18, 2019;
Page 14 of 35
trials respectively, p = 2e-6, t-test). (h) Baseline PPC difference between correct and incorrect trials during the memory
task shown for the theta (f = 5Hz; p = 0.009, paired t-test) and gamma band (f = 38.5Hz; p = 0.002, paired t-test). The
difference is computed for memory choice cells only (purple cluster from Fig. 5F). The error bars denote the 95%
confidence interval of the mean difference in PPC as estimated via bootstrapping (n = 10000 iterations). (i) Spike
times of MTL cells are coherent with local theta-band (3-8 Hz, centered at 5.5 Hz) LFP recorded in the same area in
which a cell was recorded from. Shown is a histogram of the log of the Rayleigh z-value for all recorded MTL cells.
We computed the spike-field coherence in the theta range (3-8Hz, center at 5.5 Hz; phase determined from extracted
spike snippets) using all spikes of a cell during the entire experiment (see methods). (j) Average local PPC in the MTL
did not differ as a function of the task in the MTL (f = 5.5Hz; p = 0.51, paired t-test, n = 2321 cell-electrode pairs).
Discussion
We investigated the nature of flexible decision-making in the human brain by probing how
the geometry 37 of neural representations of stimulus memory, stimulus category, and choice is
modified when subjects switch between tasks. We found a striking difference between brain areas:
In the MTL, representations of stimulus memory and stimulus category were task-demand
independent, whereas in the MFC, representations of stimulus memory, stimulus category, and
choices were all highly sensitive to task demands. A group of task demand-dependent cells in the
MFC that we reveal here are choice cells, which signal behavioral decisions preferentially for
either memory- or categorization decisions irrespective of response modality and regardless of the
ground truth of the decision. At the population level, choices in both the memory and
categorization task were decodable with high reliability, but these decoders did not generalize
across the two tasks. Thus, from the point of view of downstream areas, neurons within MFC
formed two separate decision axes: one for memory-based decisions and one for categorization-
based decisions. Moreover, these two decision axes were instantiated selectively so that they were
only present when the current task required them.
These findings contrast with prior work on task switching between different tasks that
required purely perceptual decisions, which found a single decision axis in monkey pre-frontal
cortex, with task-irrelevant attributes also represented 40. Here we show that memory-based
choices add a second decision axis, which is present only when decisions engage memory retrieval
processes. While task-sensitive representations of choice have been shown in recordings from
nonhuman primates during perceptual decision-making 10,40,41, our data for the first time find
choice representations that specifically signal declarative memory-based choices. It has long been
appreciated that the frontal lobes are critical for initiating and controlling memory retrieval 34,42,43,
and it is thought that the memory retrieval network implements a set of specialized processes
separate from those utilized for other kinds of decisions 13,44,45. The memory-choice axis we reveal
here is direct evidence for this hypothesis and reveals a potential cellular substrate for this critical
but poorly understood aspect of human cognitive flexibility.
A second group of cells we characterized in MFC signal the currently relevant goal (task
type and response modality) throughout the task. These cells switched their activity pattern when
instructions indicated a change in task demands. While these switches were rapid, they were not
instantaneous, likely reflecting the cost of switching between memory retrieval and categorization
modes 46-48. We hypothesize that these cells facilitate holding in working memory 49,50 the active
All rights reserved. No reuse allowed without permission. (which was not peer-reviewed) is the author/funder, who has granted bioRxiv a license to display the preprint in perpetuity.
The copyright holder for this preprint. http://dx.doi.org/10.1101/809673doi: bioRxiv preprint first posted online Oct. 18, 2019;
Page 15 of 35
task set and configure brain networks in preparation for appropriate execution of the instructed
task 23,51,52. Task switching costs are a much investigated aspect of cognitive flexibility 8,46-48, but
it remains little understood how they arise, and why some task switches are more difficult than
others. The MFC cells we describe here offer an avenue to directly investigate these critical
questions.
Finally, we uncovered a possible mechanism by which memory-based information can be
routed dynamically between MFC and MTL when a task requires memory retrieval. Changing
long-range synchronization of neural activity is thought to be a way by which functional
connectivity between brain areas can be changed flexibly 4,53-55. Here, we reveal a specific instance
of this phenomenon at the cellular level in humans in the form of changes in the strength of cortico-
MTL functional connectivity. While hippocampal-mPFC functional connectivity in rodents
supports spatial working memory 6 and is prominent during both spatial navigation and rest 56-58,
it remains unknown whether this pathway serves a role in long-term memory retrieval and, if so,
whether it can be engaged selectively. Here, we show that MFC-MTL theta-frequency connectivity
is selectively enhanced during memory retrieval. In addition, memory choice cells in MFC
exhibited enhanced gamma-frequency band coordination of their spiking activity with the MTL
LFP. This reveals a specific cellular-level instance of a role for gamma oscillation-mediated
coordination of activity between distant brain regions 6,59 in human memory retrieval. Disrupted
MFC-MTL functional connectivity is a key feature of impaired executive control in psychiatric
disease 60 and is a pertinent phenotype of genetic mouse models of human schizophrenia 29. Our
findings suggest the hypothesis that a specific impairment that might result from this impaired
connectivity is an ability to selectively initiate memory retrieval when demanded by a task.
Acknowledgments
We would like to thank the members of the Adolphs and Rutishauser labs for discussion on the
task and results. Additionally, we would like to thank Columbia Theory Center members Fabio
Stefanini, Mattia Rigotti, and Marcus Benna for their population decoding analysis expertise. We
thank all subjects and their families for their participation. This work was supported by NIMH
(R01MH110831 to U.R.), the Caltech NIMH Conte Center (P50MH094258 to R.A.), the National
Science Foundation (CAREER Award BCS-1554105 to U.R.), and a Memory and Cognitive
Disorders Award from the McKnight Foundation for Neuroscience (to U.R.).
Author Contributions
J.M., U.R., and R.A. designed the study. J.M. performed the experiments. J.M., S.F, and U.R.
analyzed the data. J.M., U.R., R.A., S.F. wrote the paper. A.M. performed surgery and supervised
clinical work.
All rights reserved. No reuse allowed without permission. (which was not peer-reviewed) is the author/funder, who has granted bioRxiv a license to display the preprint in perpetuity.
The copyright holder for this preprint. http://dx.doi.org/10.1101/809673doi: bioRxiv preprint first posted online Oct. 18, 2019;
Page 16 of 35
Methods
1. Subjects
Subjects were 13 adult patients being evaluated for surgical treatment of drug-resistant epilepsy that
provided informed consent and volunteered for this study (see Table S1). The institutional review boards
of Cedars-Sinai Medical Center and the California Institute of Technology approved all protocols. We
excluded potential subjects who did not have at least one depth electrode in medial frontal cortex.
2. Electrophysiology
We recorded bilaterally from the amygdala, hippocampus, dACC, and preSMA using microwires embedded
in hybrid depth electrodes61. From each micro-wire, we recorded the broadband 0.1-9000Hz continuous
extracellular signals with a sampling rate of 32 kHz (ATLAS system, Neuralynx Inc.). Subjects from which
not at least one well identified single-neuron could be recorded were excluded.
3. Spike sorting and single-neuron analysis
The raw signal was filtered with a zero-phase lag filter in the 300-3000Hz band and spikes were detected
and sorted using a semi-automated template-matching algorithm 62,63. All PSTH diagrams were computed
using a 500ms window with a step-size of 7.8ms. No smoothing was applied.
4. Electrode localization (relevant for Figure 1)
Electrode localization was performed based on post-operative MRI scans. These scans were registered to
pre-operative MRI scans using Freesurfer’s mri_robust_register 64 to allow accurate and subject-specific
localization. To summarize electrode positions and to provide across-study comparability we in addition
also aligned the pre-operative scan to the MNI152-aligned CIT168 template brain 65 using a concatenation
of an affine transformation followed by a symmetric image normalization (SyN) diffeomorphic transform 66. This procedure provided the MNI coordinates that are reported here for every recording location.
5. Eye tracking (relevant for Figure S1)
Gaze position was monitored using an infrared-based eye tracker with a 500Hz-sampling rate (EyeLink
1000, SR Research)67. Calibration was performed using the built-in 9-point calibration grid and was only
used if validation resulted in a measurement error of <1 dva (average validation error was 0.7 dva). We
used the default values for the thresholds in the Eyelink system that determine fixation and saccade onsets.
6. Task
Each session consisted of 8 blocks of 40 trials shown in randomized order. At the beginning of each block,
an instruction screen told subjects verbally the task to be performed for the following 40 trials
(categorization or recognition memory), the response modality to use (button presses or eye movements),
and which visual category is the target (for categorization task only; either human faces, monkey faces,
fruits, or cars; order was pseudo-random so that each image type was selected as the target at least once)
(see Figure 1). The task to solve was either “Have you seen this image before, yes or no?” or “Does this
image belong to the target category, yes or no”. Odd-numbered blocks (1,3,5,7) were categorization blocks;
even numbered blocks were memory blocks (2,4,6,8). Button presses (yes or no) were recorded using a
response box (RB-844, Cedrus Inc.). Eye movements to the left or right of the image served as responses
in the eye movement modality (left=yes, right=no). The mapping between button and screen side and yes/no
responses was fixed and did not change; “yes” was on the left and “no” was on the right. Subjects were
reminded that left = yes, and right = no, at the beginning of each of the 8 blocks. In the first block, all
images were novel (40 unique images). In all subsequent blocks, 20 new novel images were shown
randomly intermixed with 20 repeated images (the “old set”). The 20 repeated images remained the same
throughout a session. We used entirely non-overlapping image sets for patients that completed multiple
sessions. The response modality (button presses or eye movements) was selected randomly initially and
switched in the middle of each block (an instruction screen in the middle of each block showed the response
modality to be used for the remainder of the block). In sessions where eye tracking was not possible due to
problems with calibration (5 sessions in 3 patients; see Table S1), all trials used the button presses as the
response modality. No trial-by-trial feedback was given. In between image presentations, subjects were
All rights reserved. No reuse allowed without permission. (which was not peer-reviewed) is the author/funder, who has granted bioRxiv a license to display the preprint in perpetuity.
The copyright holder for this preprint. http://dx.doi.org/10.1101/809673doi: bioRxiv preprint first posted online Oct. 18, 2019;
Page 17 of 35
instructed to look at the fixation cross in the center of the screen.
7. Control Task (relevant for Figure S6)
In 5 of the 13 subjects in this dataset (6/33 sessions), we ran an additional control task in order to help
determine if neural responses reflected processing of stimuli, of decision variables, or of motor response
plans. Unlike the standard task where the subjects could respond at any time after the stimulus onset (thus
making it difficult to distinguish decision from choice), in this control task the subjects were instructed to
wait until the response cue in order to register their answer, either with a button press or with a saccade.
The stimulus was presented for a fixed amount of time (1s duration) and after a 0.5 – 1.5s delay period, the
subjects were asked to respond to the question relevant for that block.
8. Mixed-effects modeling of behavior (relevant for Figures 1, S1)
For the group analysis of behavior, we used mixed-effects models of the form 𝑦 = 𝑋𝛽 + 𝑍𝑏 + 𝜀, where y
is the response, X is the fixed-effects design matrix, 𝛽 is the fixed-effects coefficients, Z is the random-
effects design matrix, b is the random-effects coefficients, and 𝜀 is the error vector. In all analysis, we used
a random intercept model with a fixed slope. The grouping variable for the random-effects was the session
ID. The reported p-values in the main text correspond to the fixed-intercept for the relevant variable. In the
case of measuring the effect of number of expositions (i.e. number of times an image was seen) on the
subject’s accuracy during the memory trials, we used a mixed-effects logistic regression with the
independent variable as an ordinal-valued whole number ranging from 1-7. The response was a logical
value indicating success or failure on each memory question. Prior to running any analysis of reaction time
data, we excluded outliers from the distribution using the following procedure: a sample was considered an
outlier if it was outside the 99th percentile of the empirical distribution.
9. Reaction time matching procedure
As a control, we matched for RTs between the two tasks (categorization and memory) to exclude for
potential differences due to difficulty. To achieve this, we first added noise to all reaction times (s.d. =
1ms), followed by locating pairs of trials with RTs that were equal to within a tolerance of 0.1s. Matching
pairs were then removed and this procedure was repeated iteratively until no further matches could be
found. Unmatched trials were excluded (resulting in reduced statistical power due to fewer trials available).
We only used the resulting match if the RTs between the two groups were not significantly different. If not,
the procedure above was repeated.
10. Selection of visually (VS) and memory-selective (MS) cells (relevant for Figure S3)
A cell was considered as a VS cell if it response co-varied significantly with visual category as assessed
using a 1x4 ANOVA test at p<0.05. For each selected cell, the preferred image category was set to be the
image category for which the mean firing rate of the cell was the greatest. All trials were used for this
analysis. MS cells were selected using the following linear model:
frcell ~ 1 + β1category + β2new/old + β3rt
where category is a categorical (1x4) variable, new/old is a binary variable, and rt is a continuously valued
variable. A cell was determined to be memory selective if the t-statistic for β2 was significant with p<0.05.
We excluded the first block of trials (40 images) from the analysis, in order to keep the number of new and
old stimuli the same. Spikes were counted for every trial in a 1s window starting at 200ms after stimulus
onset.
11. Selection of choice cells (relevant for Figure S5)
Choice cells were selected using a regression model applied to the firing rate in a 1s size window starting
200ms after stimulus onset. We fit the following regression model:
frcell ~ 1 + β1response + β2category + β3rt
where the response is binary (yes or no), category is a categorical variable with four levels, and RT is the
reaction time. We fit this model separately to trials in the memory-and categorization condition, assuring
All rights reserved. No reuse allowed without permission. (which was not peer-reviewed) is the author/funder, who has granted bioRxiv a license to display the preprint in perpetuity.
The copyright holder for this preprint. http://dx.doi.org/10.1101/809673doi: bioRxiv preprint first posted online Oct. 18, 2019;
Page 18 of 35
independent selection of cells. RT was included as a nuisance regressor to control for reaction time
differences between the two possible responses (see Fig. S1a). A cell qualified as a choice cell if the t-
statistic of the β1 term was significant at p<0.05 for at least one of the two task conditions. The response
preference of significant cells for either yes or no was determined based on the sign of β1 (positive = yes,
negative = no). Notice that the selection process uses separate trials for memory choice cells and
categorization choice cells. All trials regardless of whether the answer was correct or incorrect were used
for selection. To estimate the significance of the number of selected cells, we generate a null distribution
by repeating above selection process 1000 times after randomly re-shuffling the response label. We
estimated this null distribution separately for choice cells in for the memory-and categorization condition
and used each to estimate the significance of the number of selected cells of each type.
12. Chance levels for cell selection (relevant for Figure S2, S3, S5)
To estimate the chance levels for cell selection, we repeated above procedures for selection of visual
category, memory selective, and choice cells after randomly scrambling the order of the labels determining
the category membership being selected for (yes/no response, visual category, and new/old ground truth,
respectively). We repeated this procedure 1000 times.
13. Single-cell decoding (relevant for Figure S5)
Single-cell decoding was done using a Poisson naïve-bayes decoder. The features used were spike counts
in a 1-second window, in the interval [0.2 1.2s] relative to stimulus onset. The decoder returns the
probability of a class label, given the observed spike count. The class label was binary (“yes” or “no” ). The
model assumes that the spike count is generated by a univariate Poisson distribution, and a separate mean
rate parameter (λ) is fit to each feature-class pair. For a new observation, class membership is determined
on the likelihood value. Notice that we used a single spike-count as a feature, so the naïve assumption of
the decoded is no longer relevant in this case.
14. Population decoding (relevant for Figures 2, 3, 4, S2, S3, S4, S5, S7, S8)
Population decoding was performed on a pseudo-population assembled across sessions68. We present
decoding results for a variety of task variables: (1) image category, (2) new vs. old, (3) choice during memory
trials, (4) choice during categorization, (5) task, and (6) response type. In order to estimate the variance of the
decoding performance, on each iteration of the decoder (minimum of 250 iterations), we randomly selected
75% of the cell population that was being analyzed. For example, to measure choice decoding in MFC (as
shown in Fig. 4), we would randomly select 575/767 cells on each iteration of the decoder. The total number
of available cells depended on the variable that was being decoded. For example, for response type decoding,
the number of cells in MFC was 593, since 28/33 sessions included both response types. We measured
decoding performance in one of two ways: (1) on a trial-by-trial basis, or (2) using condition averages. For
trial-by-trial decoding, we matched the number of trials per condition contributed by each cell that was
selected to participate in the population decoding. For most task variables (image category, new/old, context,
effector-type) the number of samples from each cell was equal since the task structure remained the same
across all subjects and sessions. For choice decoding, however, the number of instances varied, since the
subjects were free to respond with a “yes” or a “no” for each stimulus. We therefore matched the numbers for
the smallest group across all subjects.
In the cases where we used condition averages, the “trials” that were used to train and test the decoder were
average firing rates computed on subsets of trials available for that cell. The trials that were averaged together
to create a pseudo-trial, were always unique (i.e. we never resampled trials). To illustrate this procedure,
consider the decoding results presented in Figure 3, which shows decoding and cross-task generalization of
new/old and image category. The combination of task type, image category, new/old, and effector type results
in a total of 2422 =32 possible combinations (which contain non-overlapping sets of trials). For each cell,
we computed the average firing rate for each of the 32 possible combinations. These 32 estimates then serve
as the “trials” on which we train and test the decoder. For example, for decoding new vs. old, there are 16
training samples for “new” and 16 for “old”. The advantage of using condition averages is two-fold: (1) the
firing rate of a cell for a given condition is more robustly estimated, (2) it eliminates biases related to
imbalances of varying number of trials available for each cell and condition. The disadvantage is that trial-
All rights reserved. No reuse allowed without permission. (which was not peer-reviewed) is the author/funder, who has granted bioRxiv a license to display the preprint in perpetuity.
The copyright holder for this preprint. http://dx.doi.org/10.1101/809673doi: bioRxiv preprint first posted online Oct. 18, 2019;
Page 19 of 35
by-trial variability is lost. Only the following decoding results were computed on condition averages: Fig.
3C-D, G-H, S4A-B. As a control, we re-produce these results also with single-trial decoding (shown in Fig.
S4D-E). All other decoding reported is for training and testing on individual trials.
A series of pre-processing steps were carried out before training the decoder. Firing rates for each cell were
first de-trended (to account for any drift in the baseline-firing rate) and then normalized (z-scored) using the
mean and standard deviation estimated from the training set. We then performed 10-fold cross validation
using a linear support vector machine (SVM) decoder to estimate performance, as implemented by the
‘fitcecoc’ function in MATLAB. We used an SVM with a linear kernel and a scale of 1. Decoding results are
reported either as a function of time or in a fixed time window. Time-resolved decoding was done on spike
counts measured in 500ms moving window, with a 16ms step size. For fixed-window decoding, we used spike
counts in a 1-second window. The location of the window depended on the analysis we wanted to do. In
Figure 2, for example, we used a [-1, 0] relative to stimulus onset for task type and response type decoding.
In Figure 3, we used spike counts in [0.2, 1.2] relative to stimulus onset, for decoding image category and
new/old.
15. Null models for testing significance of decoding performance
Throughout the manuscript, we compare the performance of our decoders against the 95th percentile of a null
distribution. The way that this null distribution is generated depends on the variable being decoded. For
variables such as image category, new vs. old, and response (i.e. yes vs. no), we used a simple shuffling
procedure for the labels. For variables such as task-type, which had structure over time (memory blocks were
always preceded by categorization block), small drifts in firing rate (that was not removed by the de-trending
procedure described above) might lead to inflated decoding accuracy. Therefore, for such variables, the
shuffling of the variables was done in such a way as to preserve their temporal relationship. Specifically, we
offset (i.e. circular shift) the labels by a random integer value (sampled from the range ±10 – 20 trials). In
the case of task decoding from the baseline firing rate, this is a very conservative measure of the null decoding
performance since many trials retain their original label, thereby inflating the accuracy. This also means that
the mean performance of the null distribution will not be the theoretical chancel level. In the case of task
decoding, the theoretical chance level is 50% (binary classification). Using the circular shift method for
scrambling labels, the mean of the null distribution was ~60%. To compare the performance between different
decoders, for example MTL vs. MFC, we constructed an empirical null distribution from the pairwise
differences in decoding accuracy estimated using the shuffled trial labels. To use the case of the task decoder
as an example, we estimate the null distribution of the MFC decoder by shuffling the labels at least 250 times
and estimate the performance for each shuffle. We do the same for the MTL decoder. We then compute the
pairwise differences between the 250 values from the MFC decoder and the MTL decoder, for a total of 62500
pairwise differences. We can then estimate the likelihood of occurrence of the true difference in performance
vs. this empirical null distribution. The number 250 is a representative value here and generally served as a
minimum number of iterations. For lower p-values, more iterations were used.
16. Multidimensional scaling (relevant for Figures 3, 4)
Multidimensional scaling (MDS) was used only for visualization. We computed MDS using Euclidean
distances (MATLAB function mdscale) on z-scored spike count data in the [0.2 1.2s] window relative to
image onset. In Figure 3E, for example, MDS was computed on the activity across the entire population of
MTL and MFC cells, averaged across the 8 conditions plotted (new/old ⨂ task ⨂ image category, where ⨂
denotes the Cartesian product). Here the image category was restricted to images of human faces and fruits,
for visualization purposes. For the cross-condition generalization performance, we use all four image
categories. In Figure 4D we compute MDS on the population of MFC cells, averaged across 8 conditions
(response ⨂ task ⨂ effector, where ⨂ denotes the Cartesian product). In all cases, we use MDS to map the
neural activity to a 3-dimensional space.
17. Normalized weight metric (relevant for Figures 4, 5, S7, S8)
All rights reserved. No reuse allowed without permission. (which was not peer-reviewed) is the author/funder, who has granted bioRxiv a license to display the preprint in perpetuity.
The copyright holder for this preprint. http://dx.doi.org/10.1101/809673doi: bioRxiv preprint first posted online Oct. 18, 2019;
Page 20 of 35
The normalized weight metric is computed from the weight that a decoder assigns to a particular cell for a
given classification. This weight is denoted as 𝑤𝑖𝑡, where the index i denotes the cell and the index t, denotes
the condition (for example, categorization or memory). The weight is converted into a normalized measure
called an importance index, defined as:
𝜔𝑖𝑡 =
|𝑤𝑖𝑡|
∑ |𝑤𝑖𝑡|𝑛
1
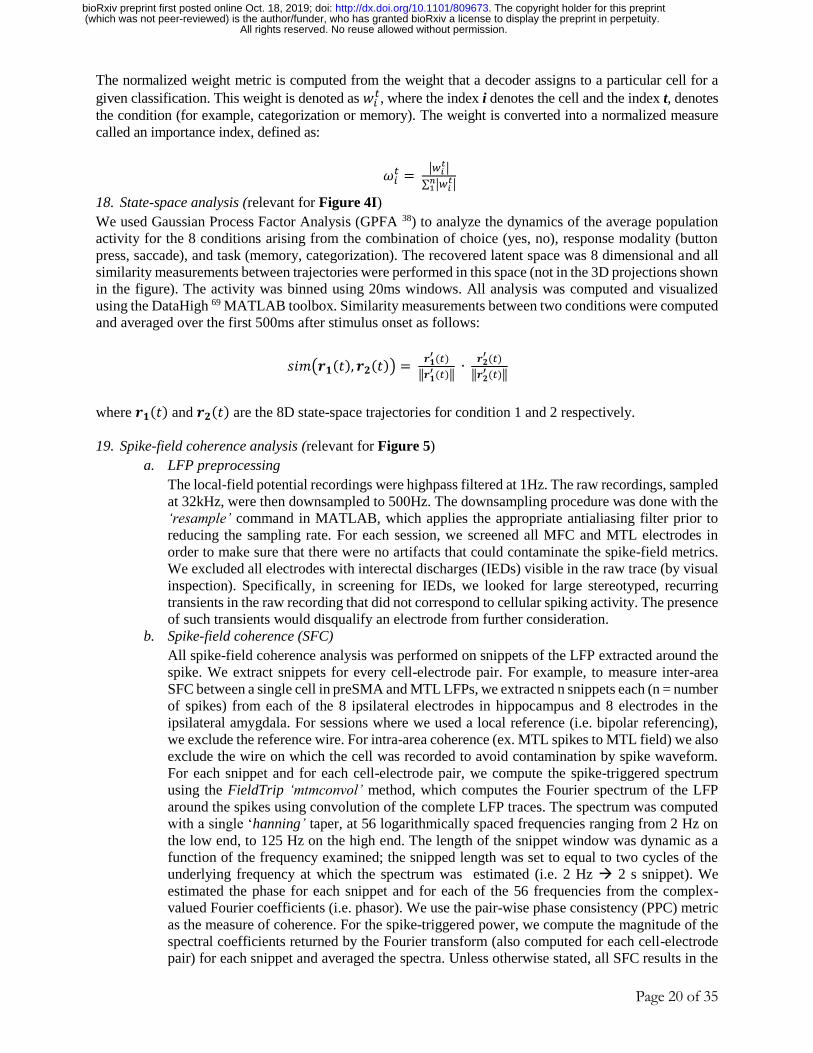
18. State-space analysis (relevant for Figure 4I)
We used Gaussian Process Factor Analysis (GPFA 38) to analyze the dynamics of the average population
activity for the 8 conditions arising from the combination of choice (yes, no), response modality (button
press, saccade), and task (memory, categorization). The recovered latent space was 8 dimensional and all
similarity measurements between trajectories were performed in this space (not in the 3D projections shown
in the figure). The activity was binned using 20ms windows. All analysis was computed and visualized
using the DataHigh 69 MATLAB toolbox. Similarity measurements between two conditions were computed
and averaged over the first 500ms after stimulus onset as follows:
𝑠𝑖𝑚(𝒓𝟏(𝑡), 𝒓𝟐(𝑡)) = 𝒓𝟏
′ (𝑡)
‖𝒓𝟏′ (𝑡)‖
∙ 𝒓𝟐
′ (𝑡)
‖𝒓𝟐′ (𝑡)‖
where 𝒓𝟏(𝑡) and 𝒓𝟐(𝑡) are the 8D state-space trajectories for condition 1 and 2 respectively.
19. Spike-field coherence analysis (relevant for Figure 5)
a. LFP preprocessing
The local-field potential recordings were highpass filtered at 1Hz. The raw recordings, sampled
at 32kHz, were then downsampled to 500Hz. The downsampling procedure was done with the
‘resample’ command in MATLAB, which applies the appropriate antialiasing filter prior to
reducing the sampling rate. For each session, we screened all MFC and MTL electrodes in
order to make sure that there were no artifacts that could contaminate the spike-field metrics.
We excluded all electrodes with interectal discharges (IEDs) visible in the raw trace (by visual
inspection). Specifically, in screening for IEDs, we looked for large stereotyped, recurring
transients in the raw recording that did not correspond to cellular spiking activity. The presence
of such transients would disqualify an electrode from further consideration.
b. Spike-field coherence (SFC)
All spike-field coherence analysis was performed on snippets of the LFP extracted around the
spike. We extract snippets for every cell-electrode pair. For example, to measure inter-area
SFC between a single cell in preSMA and MTL LFPs, we extracted n snippets each (n = number
of spikes) from each of the 8 ipsilateral electrodes in hippocampus and 8 electrodes in the
ipsilateral amygdala. For sessions where we used a local reference (i.e. bipolar referencing),
we exclude the reference wire. For intra-area coherence (ex. MTL spikes to MTL field) we also
exclude the wire on which the cell was recorded to avoid contamination by spike waveform.
For each snippet and for each cell-electrode pair, we compute the spike-triggered spectrum
using the FieldTrip ‘mtmconvol’ method, which computes the Fourier spectrum of the LFP
around the spikes using convolution of the complete LFP traces. The spectrum was computed
with a single ‘hanning’ taper, at 56 logarithmically spaced frequencies ranging from 2 Hz on
the low end, to 125 Hz on the high end. The length of the snippet window was dynamic as a
function of the frequency examined; the snipped length was set to equal to two cycles of the
underlying frequency at which the spectrum was estimated (i.e. 2 Hz 2 s snippet). We
estimated the phase for each snippet and for each of the 56 frequencies from the complex-
valued Fourier coefficients (i.e. phasor). We use the pair-wise phase consistency (PPC) metric
as the measure of coherence. For the spike-triggered power, we compute the magnitude of the
spectral coefficients returned by the Fourier transform (also computed for each cell-electrode
pair) for each snippet and averaged the spectra. Unless otherwise stated, all SFC results in the
All rights reserved. No reuse allowed without permission. (which was not peer-reviewed) is the author/funder, who has granted bioRxiv a license to display the preprint in perpetuity.
The copyright holder for this preprint. http://dx.doi.org/10.1101/809673doi: bioRxiv preprint first posted online Oct. 18, 2019;
Page 21 of 35
paper are based on spikes recorded during the baseline period between trials (1s window
preceding stimulus onset).
c. Group comparisons using the SFC metric
When comparing two or more groups using PPC (such as memory vs. categorization), we
balanced the number of spikes between the two groups. To reduce bias involved in subsampling
the larger group, we resampled the spikes from the two groups 200 times, and computed the
PPC metric on each iteration. The final coherence measure for a given cell-electrode pair was
an average across all 200 iterations.
20. Pupilometry (relevant for Figure S1)
To test whether levels of engagement and arousal varied between tasks, we used pupillometry (pupil size;
see Figure S1J for an example session). We compared two metrics, the baseline pupil size (0-100ms after
stimulus onset, Figure S1K) and the slope of the pupil as it responds to the stimulus on the screen (measured
from 350-600ms, Figure S1L). Neither metric showed a significant modulation as a function of task (p =
0.12 and p = 0.11 for size and slope respectively, sign test), thereby indicating that levels of arousal were
similar for the two tasks. This analysis is based on 25 of the 28 sessions where we measured eye movements.
The remaining 3 sessions were not used because the measurement of the pupil was determined to be too
noisy.
Data availability
The data that support the findings of this study are available on reasonable request from the corresponding
author.
Code availability
We used the following toolboxes, all of which are available as open source: OSort for pre-processing and
spike sorting, FieldTrip, DataHigh, CircStat, and Psychtoolbox. All other work was done using standard
built-in MATLAB functionality.
All rights reserved. No reuse allowed without permission. (which was not peer-reviewed) is the author/funder, who has granted bioRxiv a license to display the preprint in perpetuity.
The copyright holder for this preprint. http://dx.doi.org/10.1101/809673doi: bioRxiv preprint first posted online Oct. 18, 2019;
Page 22 of 35
References
1 Squire, L. R. & Wixted, J. T. The cognitive neuroscience of human memory since H.M. Annu Rev
Neurosci 34, 259-288, doi:10.1146/annurev-neuro-061010-113720 (2011).
2 Miyashita, Y. Cognitive memory: cellular and network machineries and their top-down control.
Science 306, 435-440, doi:10.1126/science.1101864 (2004).
3 Simons, J. S. & Spiers, H. J. Prefrontal and medial temporal lobe interactions in long-term
memory. Nat Rev Neurosci 4, 637-648, doi:10.1038/nrn1178 (2003).
4 Harris, A. Z. & Gordon, J. A. Long-range neural synchrony in behavior. Annu Rev Neurosci 38,
171-194, doi:10.1146/annurev-neuro-071714-034111 (2015).
5 Rushworth, M. F., Walton, M. E., Kennerley, S. W. & Bannerman, D. M. Action sets and
decisions in the medial frontal cortex. Trends Cogn Sci 8, 410-417,
doi:10.1016/j.tics.2004.07.009 (2004).
6 Spellman, T. et al. Hippocampal-prefrontal input supports spatial encoding in working memory.
Nature 522, 309-314, doi:10.1038/nature14445 (2015).
7 Yu, J. Y. & Frank, L. M. Hippocampal-cortical interaction in decision making. Neurobiol Learn
Mem 117, 34-41, doi:10.1016/j.nlm.2014.02.002 (2015).
8 Badre, D. & Wagner, A. D. Computational and neurobiological mechanisms underlying cognitive
flexibility. Proceedings of the National Academy of Sciences 103, 7186-7191 (2006).
9 Rutishauser, U. et al. Representation of retrieval confidence by single neurons in the human
medial temporal lobe. Nat Neurosci 18, 1041-1050, doi:10.1038/nn.4041 (2015).
10 Freedman, D. J. & Assad, J. A. Neuronal Mechanisms of Visual Categorization: An Abstract
View on Decision Making. Annu Rev Neurosci 39, 129-147, doi:10.1146/annurev-neuro-071714-
033919 (2016).
11 Dobbins, I. G., Foley, H., Schacter, D. L. & Wagner, A. D. Executive control during episodic
retrieval: multiple prefrontal processes subserve source memory. Neuron 35, 989-996 (2002).
12 Dosenbach, N. U. et al. Distinct brain networks for adaptive and stable task control in humans.
Proceedings of the National Academy of Sciences 104, 11073-11078 (2007).
13 Rugg, M. D. & Vilberg, K. L. Brain networks underlying episodic memory retrieval. Curr Opin
Neurobiol 23, 255-260, doi:10.1016/j.conb.2012.11.005 (2013).
14 Polyn, S. M. & Kahana, M. J. Memory search and the neural representation of context. Trends in
cognitive sciences 12, 24-30 (2008).
15 Mante, V., Sussillo, D., Shenoy, K. V. & Newsome, W. T. Context-dependent computation by
recurrent dynamics in prefrontal cortex. Nature 503, 78-84, doi:10.1038/nature12742 (2013).
16 Gold, J. I. & Shadlen, M. N. The neural basis of decision making. Annu Rev Neurosci 30, 535-
574, doi:10.1146/annurev.neuro.29.051605.113038 (2007).
17 Desimone, R. & Duncan, J. Neural mechanisms of selective visual attention. Annu Rev Neurosci
18, 193-222, doi:10.1146/annurev.ne.18.030195.001205 (1995).
18 Bornstein, A. M. & Norman, K. A. Reinstated episodic context guides sampling-based decisions
for reward. Nat Neurosci 20, 997-1003, doi:10.1038/nn.4573 (2017).
19 Shadlen, M. N. & Shohamy, D. Decision Making and Sequential Sampling from Memory.
Neuron 90, 927-939, doi:10.1016/j.neuron.2016.04.036 (2016).
20 Fu, Z. et al. Single-Neuron Correlates of Error Monitoring and Post-Error Adjustments in Human
Medial Frontal Cortex. Neuron 101, 165-177 e165, doi:10.1016/j.neuron.2018.11.016 (2019).
21 Shenhav, A., Botvinick, M. M. & Cohen, J. D. The expected value of control: an integrative
theory of anterior cingulate cortex function. Neuron 79, 217-240,
doi:10.1016/j.neuron.2013.07.007 (2013).
22 Holroyd, C. B. et al. Dorsal anterior cingulate cortex shows fMRI response to internal and
external error signals. Nat Neurosci 7, 497-498 (2004).
23 Dosenbach, N. U. et al. A core system for the implementation of task sets. Neuron 50, 799-812,
doi:10.1016/j.neuron.2006.04.031 (2006).
24 Hyman, J. M., Ma, L., Balaguer-Ballester, E., Durstewitz, D. & Seamans, J. K. Contextual
encoding by ensembles of medial prefrontal cortex neurons. Proceedings of the National
Academy of Sciences 109, 5086-5091 (2012).
All rights reserved. No reuse allowed without permission. (which was not peer-reviewed) is the author/funder, who has granted bioRxiv a license to display the preprint in perpetuity.
The copyright holder for this preprint. http://dx.doi.org/10.1101/809673doi: bioRxiv preprint first posted online Oct. 18, 2019;
Page 23 of 35
25 Anderson, K. L., Rajagovindan, R., Ghacibeh, G. A., Meador, K. J. & Ding, M. Z. Theta
Oscillations Mediate Interaction between Prefrontal Cortex and Medial Temporal Lobe in Human
Memory. Cereb Cortex 20, 1604-1612, doi:10.1093/cercor/bhp223 (2010).
26 Watrous, A. J., Tandon, N., Conner, C. R., Pieters, T. & Ekstrom, A. D. Frequency-specific
network connectivity increases underlie accurate spatiotemporal memory retrieval. Nat Neurosci
16, 349-356, doi:10.1038/nn.3315 (2013).
27 Gordon, J. A. Oscillations and hippocampal-prefrontal synchrony. Curr Opin Neurobiol 21, 486-
491, doi:10.1016/j.conb.2011.02.012 (2011).
28 Brincat, S. L. & Miller, E. K. Frequency-specific hippocampal-prefrontal interactions during
associative learning. Nat Neurosci 18, 576-581, doi:10.1038/nn.3954 (2015).
29 Sigurdsson, T. & Duvarci, S. Hippocampal-Prefrontal Interactions in Cognition, Behavior and
Psychiatric Disease. Front Syst Neurosci 9, 190, doi:10.3389/fnsys.2015.00190 (2015).
30 Remondes, M. & Wilson, M. A. Cingulate-Hippocampus Coherence and Trajectory Coding in a
Sequential Choice Task. Neuron, doi:10.1016/j.neuron.2013.08.037 (2013).
31 Karalis, N. et al. 4-Hz oscillations synchronize prefrontal–amygdala circuits during fear behavior.
Nature neuroscience 19, 605 (2016).
32 Likhtik, E., Stujenske, J. M., Topiwala, M. A., Harris, A. Z. & Gordon, J. A. Prefrontal
entrainment of amygdala activity signals safety in learned fear and innate anxiety. Nature
neuroscience 17, 106 (2014).
33 Hyman, J. M., Hasselmo, M. E. & Seamans, J. K. What is the Functional Relevance of Prefrontal
Cortex Entrainment to Hippocampal Theta Rhythms? Front Neurosci 5, 24,
doi:10.3389/fnins.2011.00024 (2011).
34 Lepage, M., Ghaffar, O., Nyberg, L. & Tulving, E. Prefrontal cortex and episodic memory
retrieval mode. Proceedings of the National Academy of Sciences 97, 506-511 (2000).
35 Kreiman, G., Koch, C. & Fried, I. Category-specific visual responses of single neurons in the
human medial temporal lobe. Nat Neurosci 3, 946-953, doi:10.1038/78868 (2000).
36 Quiroga, R. Q., Reddy, L., Kreiman, G., Koch, C. & Fried, I. Invariant visual representation by
single neurons in the human brain. Nature 435, 1102-1107 (2005).
37 Bernardi, S. et al. The geometry of abstraction in hippocampus and prefrontal cortex. bioRxiv,
408633 (2018).
38 Byron, M. Y. et al. in Advances in neural information processing systems. 1881-1888.
39 Stefanini, F. et al. A distributed neural code in the dentate gyrus and CA1. bioRxiv, 292953
(2019).
40 Pho, G. N., Goard, M. J., Woodson, J., Crawford, B. & Sur, M. Task-dependent representations
of stimulus and choice in mouse parietal cortex. Nature communications 9, 2596 (2018).
41 Hoshi, E., Shima, K. & Tanji, J. Neuronal activity in the primate prefrontal cortex in the process
of motor selection based on two behavioral rules. Journal of Neurophysiology 83, 2355-2373
(2000).
42 Badre, D., Poldrack, R. A., Paré-Blagoev, E. J., Insler, R. Z. & Wagner, A. D. Dissociable
controlled retrieval and generalized selection mechanisms in ventrolateral prefrontal cortex.
Neuron 47, 907-918 (2005).
43 Shimamura, A. P. in The cognitive neurosciences (ed M.S. Gazzaniga) 803-813 (MIT Press,
1995).
44 Wagner, A. D., Shannon, B. J., Kahn, I. & Buckner, R. L. Parietal lobe contributions to episodic
memory retrieval. Trends in cognitive sciences 9, 445-453 (2005).
45 Sestieri, C. et al. Memory accumulation mechanisms in human cortex are independent of motor
intentions. Journal of Neuroscience 34, 6993-7006 (2014).
46 Monsell, S. Task switching. Trends in cognitive sciences 7, 134-140 (2003).
47 Mayr, U. & Kliegl, R. Task-set switching and long-term memory retrieval. Journal of
Experimental Psychology: Learning, Memory, and Cognition 26, 1124-1140 (2000).
48 Dixon, M. L., Fox, K. C. & Christoff, K. A framework for understanding the relationship between
externally and internally directed cognition. Neuropsychologia 62, 321-330 (2014).
49 Kamiński, J. et al. Persistently active neurons in human medial frontal and medial temporal lobe
support working memory. Nature neuroscience 20, 590 (2017).
All rights reserved. No reuse allowed without permission. (which was not peer-reviewed) is the author/funder, who has granted bioRxiv a license to display the preprint in perpetuity.
The copyright holder for this preprint. http://dx.doi.org/10.1101/809673doi: bioRxiv preprint first posted online Oct. 18, 2019;
Page 24 of 35
50 Kornblith, S., Quiroga, R. Q., Koch, C., Fried, I. & Mormann, F. Persistent single-neuron activity
during working memory in the human medial temporal lobe. Current Biology 27, 1026-1032
(2017).
51 Miller, E. K. & Cohen, J. D. An integrative theory of prefrontal cortex function. Annual review of
neuroscience 24, 167-202 (2001).
52 Voytek, B. et al. Oscillatory dynamics coordinating human frontal networks in support of goal
maintenance. Nature neuroscience 18, 1318 (2015).
53 Hahn, G., Ponce-Alvarez, A., Deco, G., Aertsen, A. & Kumar, A. Portraits of communication in
neuronal networks. Nature Reviews Neuroscience, 1 (2018).
54 Siegel, M., Donner, T. H. & Engel, A. K. Spectral fingerprints of large-scale neuronal
interactions. Nature Reviews Neuroscience 13, 121 (2012).
55 Fries, P. A mechanism for cognitive dynamics: neuronal communication through neuronal
coherence. Trends Cogn Sci 9, 474-480, doi:10.1016/j.tics.2005.08.011 (2005).
56 Jones, M. W. & Wilson, M. A. Theta rhythms coordinate hippocampal–prefrontal interactions in
a spatial memory task. PLoS biology 3, e402 (2005).
57 Siapas, A. G., Lubenov, E. V. & Wilson, M. A. Prefrontal phase locking to hippocampal theta
oscillations. Neuron 46, 141-151 (2005).
58 Ito, H. T., Moser, E. I. & Moser, M.-B. Supramammillary nucleus modulates spike-time
coordination in the prefrontal-thalamo-hippocampal circuit during navigation. Neuron 99, 576-
587. e575 (2018).
59 Yamamoto, J., Suh, J., Takeuchi, D. & Tonegawa, S. Successful execution of working memory
linked to synchronized high-frequency gamma oscillations. Cell 157, 845-857 (2014).
60 Adhikari, A., Topiwala, M. A. & Gordon, J. A. Synchronized activity between the ventral
hippocampus and the medial prefrontal cortex during anxiety. Neuron 65, 257-269 (2010).
61 Minxha, J., Mamelak, A. N. & Rutishauser, U. in Extracellular recording approaches 267-293
(Springer, 2018).
62 Rutishauser, U., Schuman, E. M. & Mamelak, A. N. Online detection and sorting of
extracellularly recorded action potentials in human medial temporal lobe recordings, in vivo. J
Neurosci Methods 154, 204-224 (2006).
63 Rutishauser, U., Cerf, M. & Kreiman, G. in Single Neuron Studies of the Human Brain (eds I.
Fried, U. Rutishauser, M. Cerf, & G. Kreiman) 59-98 (MIT Press, 2014).
64 Reuter, M., Rosas, H. D. & Fischl, B. Highly accurate inverse consistent registration: a robust
approach. Neuroimage 53, 1181-1196 (2010).
65 Tyszka, J. M. & Pauli, W. M. In vivo delineation of subdivisions of the human amygdaloid
complex in a high‐resolution group template. Human brain mapping 37, 3979-3998 (2016).
66 Avants, B. et al. Multivariate analysis of structural and diffusion imaging in traumatic brain
injury. Academic radiology 15, 1360-1375 (2008).
67 Wang, S., Chandravadia, N., Mamelak, A. N. & Rutishauser, U. Simultaneous Eye Tracking and
Single-Neuron Recordings in Human Epilepsy Patients. J Vis Exp, doi:10.3791/59117 (2019).
68 Meyers, E. M., Freedman, D. J., Kreiman, G., Miller, E. K. & Poggio, T. Dynamic population
coding of category information in inferior temporal and prefrontal cortex. Journal of
neurophysiology 100, 1407-1419 (2008).
69 Cowley, B. R. et al. DataHigh: graphical user interface for visualizing and interacting with high-
dimensional neural activity. Journal of neural engineering 10, 066012 (2013).
All rights reserved. No reuse allowed without permission. (which was not peer-reviewed) is the author/funder, who has granted bioRxiv a license to display the preprint in perpetuity.
The copyright holder for this preprint. http://dx.doi.org/10.1101/809673doi: bioRxiv preprint first posted online Oct. 18, 2019;
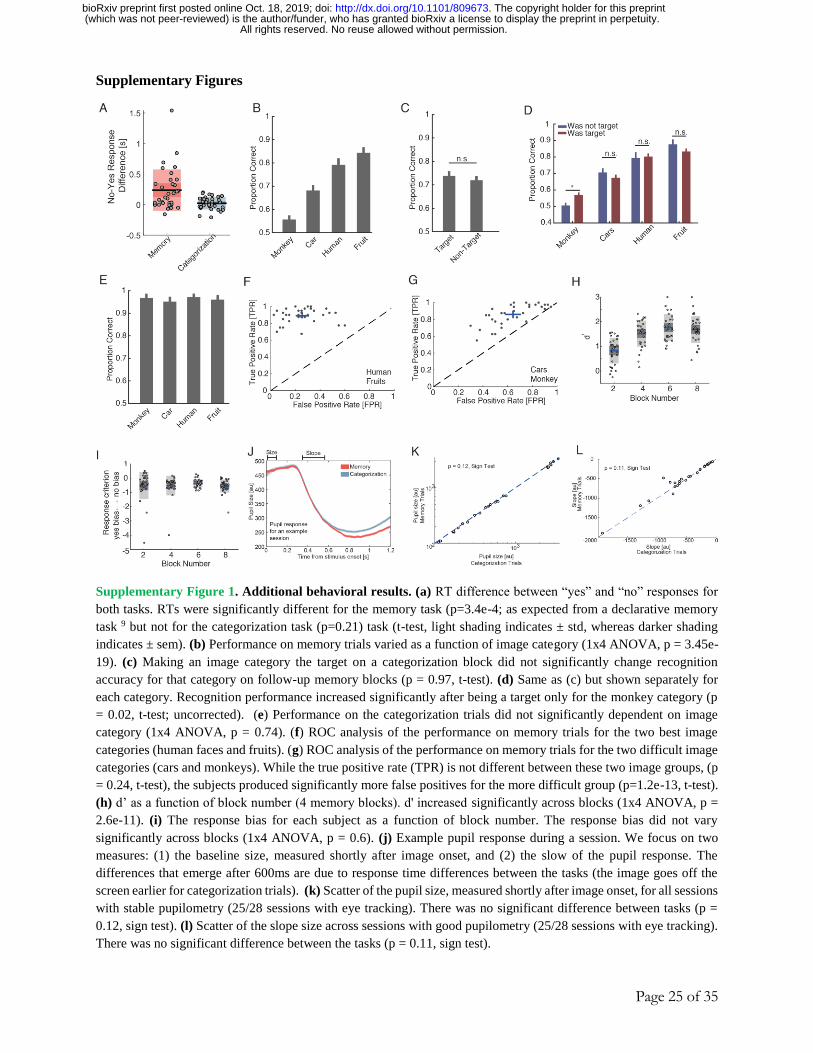
Page 25 of 35
Supplementary Figures
Supplementary Figure 1. Additional behavioral results. (a) RT difference between “yes” and “no” responses for
both tasks. RTs were significantly different for the memory task (p=3.4e-4; as expected from a declarative memory
task 9 but not for the categorization task (p=0.21) task (t-test, light shading indicates ± std, whereas darker shading
indicates ± sem). (b) Performance on memory trials varied as a function of image category (1x4 ANOVA, p = 3.45e-
19). (c) Making an image category the target on a categorization block did not significantly change recognition
accuracy for that category on follow-up memory blocks (p = 0.97, t-test). (d) Same as (c) but shown separately for
each category. Recognition performance increased significantly after being a target only for the monkey category (p
= 0.02, t-test; uncorrected). (e) Performance on the categorization trials did not significantly dependent on image
category (1x4 ANOVA, p = 0.74). (f) ROC analysis of the performance on memory trials for the two best image
categories (human faces and fruits). (g) ROC analysis of the performance on memory trials for the two difficult image
categories (cars and monkeys). While the true positive rate (TPR) is not different between these two image groups, (p
= 0.24, t-test), the subjects produced significantly more false positives for the more difficult group (p=1.2e-13, t-test).
(h) d’ as a function of block number (4 memory blocks). d' increased significantly across blocks (1x4 ANOVA, p =
2.6e-11). (i) The response bias for each subject as a function of block number. The response bias did not vary
significantly across blocks (1x4 ANOVA, p = 0.6). (j) Example pupil response during a session. We focus on two
measures: (1) the baseline size, measured shortly after image onset, and (2) the slow of the pupil response. The
differences that emerge after 600ms are due to response time differences between the tasks (the image goes off the
screen earlier for categorization trials). (k) Scatter of the pupil size, measured shortly after image onset, for all sessions
with stable pupilometry (25/28 sessions with eye tracking). There was no significant difference between tasks (p =
0.12, sign test). (l) Scatter of the slope size across sessions with good pupilometry (25/28 sessions with eye tracking).
There was no significant difference between the tasks (p = 0.11, sign test).
All rights reserved. No reuse allowed without permission. (which was not peer-reviewed) is the author/funder, who has granted bioRxiv a license to display the preprint in perpetuity.
The copyright holder for this preprint. http://dx.doi.org/10.1101/809673doi: bioRxiv preprint first posted online Oct. 18, 2019;
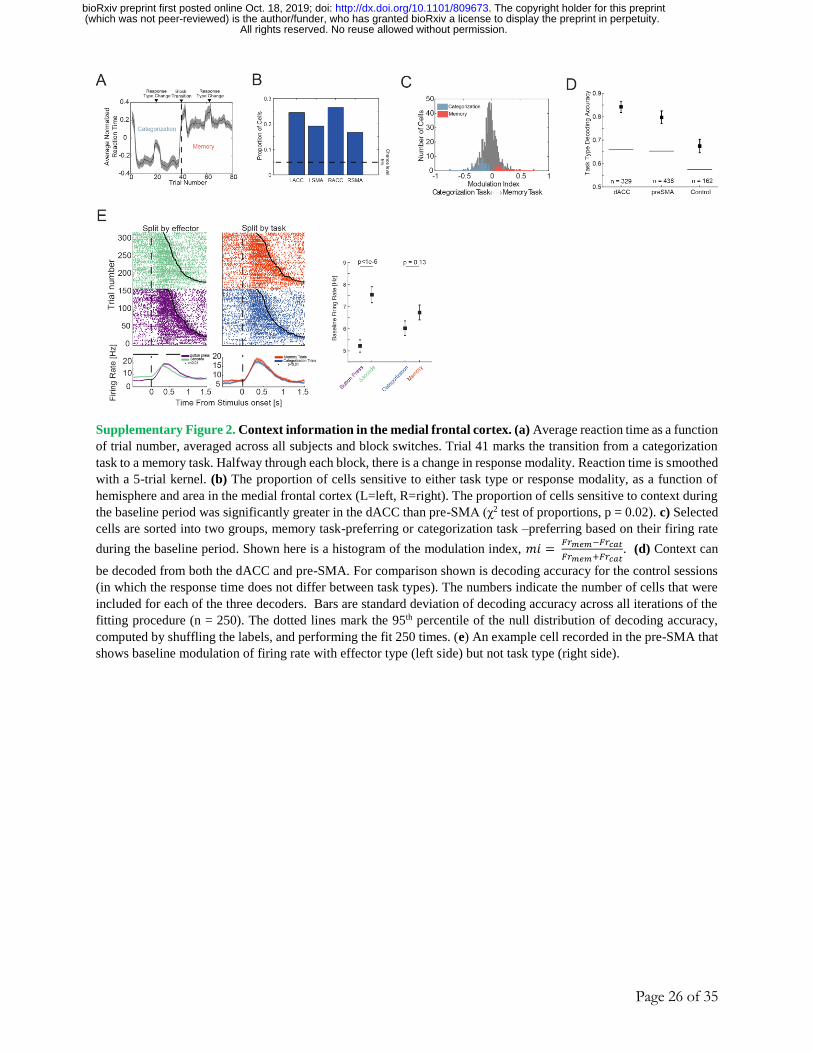
Page 26 of 35
Supplementary Figure 2. Context information in the medial frontal cortex. (a) Average reaction time as a function
of trial number, averaged across all subjects and block switches. Trial 41 marks the transition from a categorization
task to a memory task. Halfway through each block, there is a change in response modality. Reaction time is smoothed
with a 5-trial kernel. (b) The proportion of cells sensitive to either task type or response modality, as a function of
hemisphere and area in the medial frontal cortex (L=left, R=right). The proportion of cells sensitive to context during
the baseline period was significantly greater in the dACC than pre-SMA (χ2 test of proportions, p = 0.02). c) Selected
cells are sorted into two groups, memory task-preferring or categorization task –preferring based on their firing rate
during the baseline period. Shown here is a histogram of the modulation index, 𝑚𝑖 = 𝐹𝑟𝑚𝑒𝑚−𝐹𝑟𝑐𝑎𝑡
𝐹𝑟𝑚𝑒𝑚+𝐹𝑟𝑐𝑎𝑡. (d) Context can
be decoded from both the dACC and pre-SMA. For comparison shown is decoding accuracy for the control sessions
(in which the response time does not differ between task types). The numbers indicate the number of cells that were
included for each of the three decoders. Bars are standard deviation of decoding accuracy across all iterations of the
fitting procedure (n = 250). The dotted lines mark the 95th percentile of the null distribution of decoding accuracy,
computed by shuffling the labels, and performing the fit 250 times. (e) An example cell recorded in the pre-SMA that
shows baseline modulation of firing rate with effector type (left side) but not task type (right side).
All rights reserved. No reuse allowed without permission. (which was not peer-reviewed) is the author/funder, who has granted bioRxiv a license to display the preprint in perpetuity.
The copyright holder for this preprint. http://dx.doi.org/10.1101/809673doi: bioRxiv preprint first posted online Oct. 18, 2019;
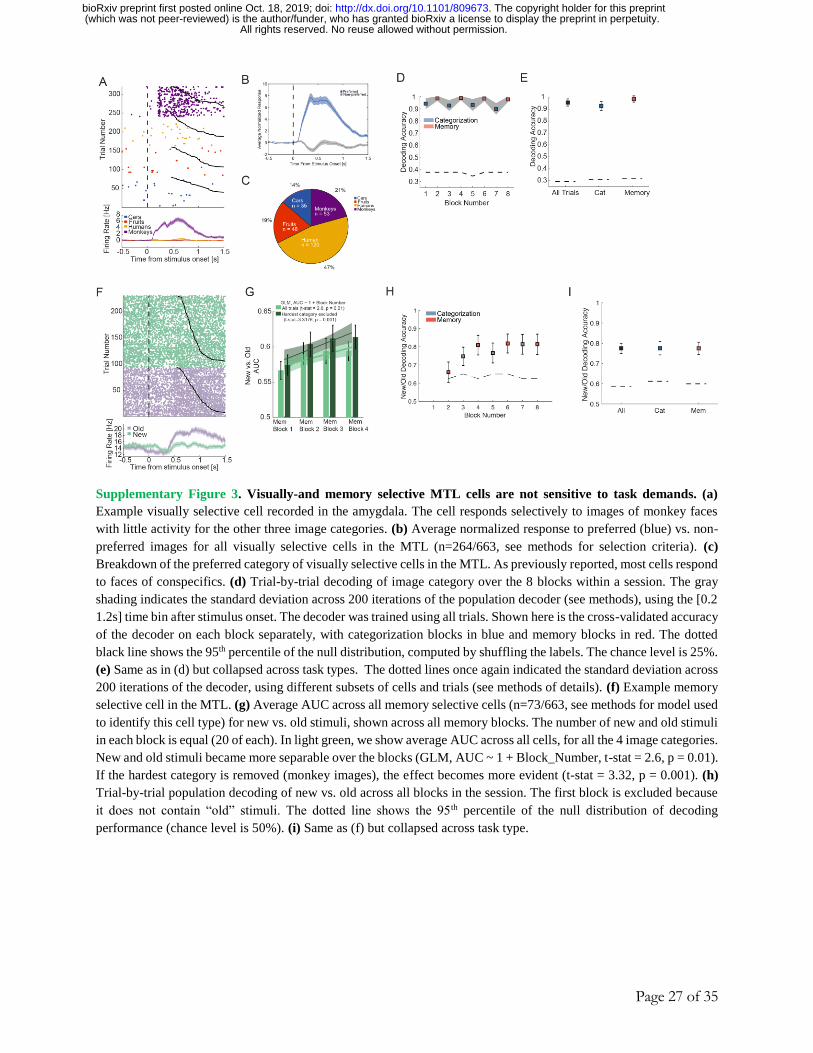
Page 27 of 35
Supplementary Figure 3. Visually-and memory selective MTL cells are not sensitive to task demands. (a)
Example visually selective cell recorded in the amygdala. The cell responds selectively to images of monkey faces
with little activity for the other three image categories. (b) Average normalized response to preferred (blue) vs. non-
preferred images for all visually selective cells in the MTL (n=264/663, see methods for selection criteria). (c)
Breakdown of the preferred category of visually selective cells in the MTL. As previously reported, most cells respond
to faces of conspecifics. (d) Trial-by-trial decoding of image category over the 8 blocks within a session. The gray
shading indicates the standard deviation across 200 iterations of the population decoder (see methods), using the [0.2
1.2s] time bin after stimulus onset. The decoder was trained using all trials. Shown here is the cross-validated accuracy
of the decoder on each block separately, with categorization blocks in blue and memory blocks in red. The dotted
black line shows the 95th percentile of the null distribution, computed by shuffling the labels. The chance level is 25%.
(e) Same as in (d) but collapsed across task types. The dotted lines once again indicated the standard deviation across
200 iterations of the decoder, using different subsets of cells and trials (see methods of details). (f) Example memory
selective cell in the MTL. (g) Average AUC across all memory selective cells (n=73/663, see methods for model used
to identify this cell type) for new vs. old stimuli, shown across all memory blocks. The number of new and old stimuli
in each block is equal (20 of each). In light green, we show average AUC across all cells, for all the 4 image categories.
New and old stimuli became more separable over the blocks (GLM, AUC ~ 1 + Block_Number, t-stat = 2.6, p = 0.01).
If the hardest category is removed (monkey images), the effect becomes more evident (t-stat = 3.32, p = 0.001). (h)
Trial-by-trial population decoding of new vs. old across all blocks in the session. The first block is excluded because
it does not contain “old” stimuli. The dotted line shows the 95th percentile of the null distribution of decoding
performance (chance level is 50%). (i) Same as (f) but collapsed across task type.
All rights reserved. No reuse allowed without permission. (which was not peer-reviewed) is the author/funder, who has granted bioRxiv a license to display the preprint in perpetuity.
The copyright holder for this preprint. http://dx.doi.org/10.1101/809673doi: bioRxiv preprint first posted online Oct. 18, 2019;
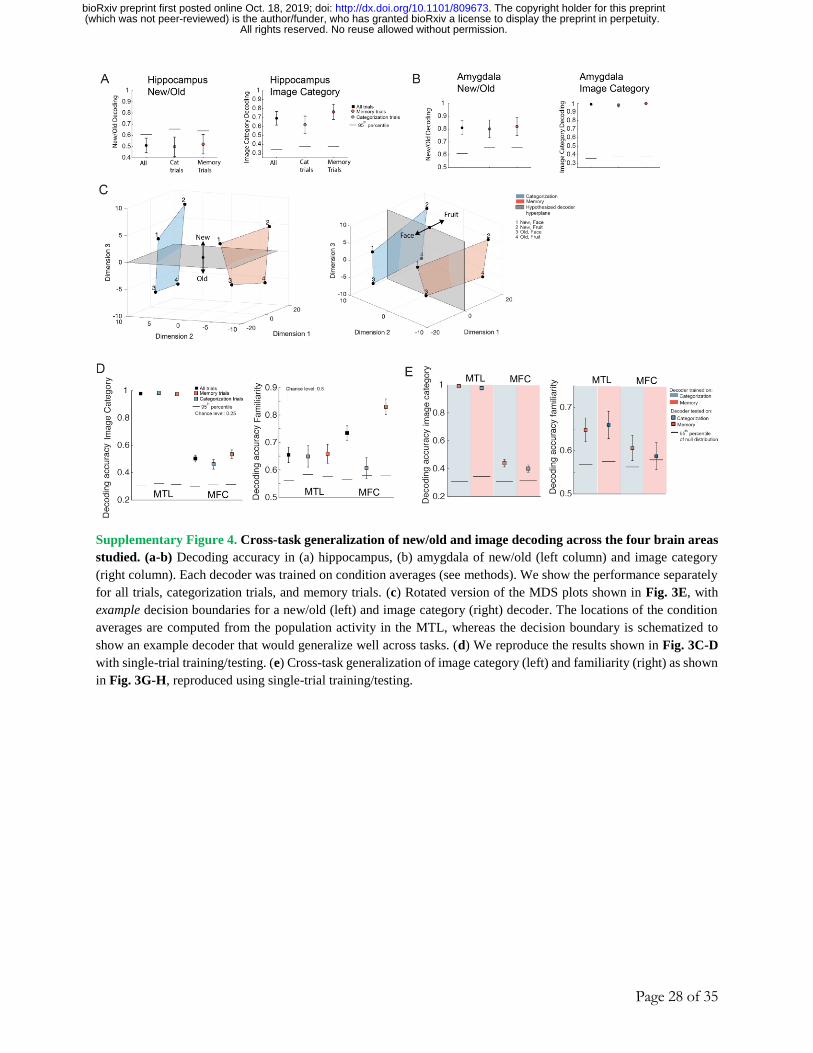
Page 28 of 35
Supplementary Figure 4. Cross-task generalization of new/old and image decoding across the four brain areas
studied. (a-b) Decoding accuracy in (a) hippocampus, (b) amygdala of new/old (left column) and image category
(right column). Each decoder was trained on condition averages (see methods). We show the performance separately
for all trials, categorization trials, and memory trials. (c) Rotated version of the MDS plots shown in Fig. 3E, with
example decision boundaries for a new/old (left) and image category (right) decoder. The locations of the condition
averages are computed from the population activity in the MTL, whereas the decision boundary is schematized to
show an example decoder that would generalize well across tasks. (d) We reproduce the results shown in Fig. 3C-D
with single-trial training/testing. (e) Cross-task generalization of image category (left) and familiarity (right) as shown
in Fig. 3G-H, reproduced using single-trial training/testing.
All rights reserved. No reuse allowed without permission. (which was not peer-reviewed) is the author/funder, who has granted bioRxiv a license to display the preprint in perpetuity.
The copyright holder for this preprint. http://dx.doi.org/10.1101/809673doi: bioRxiv preprint first posted online Oct. 18, 2019;
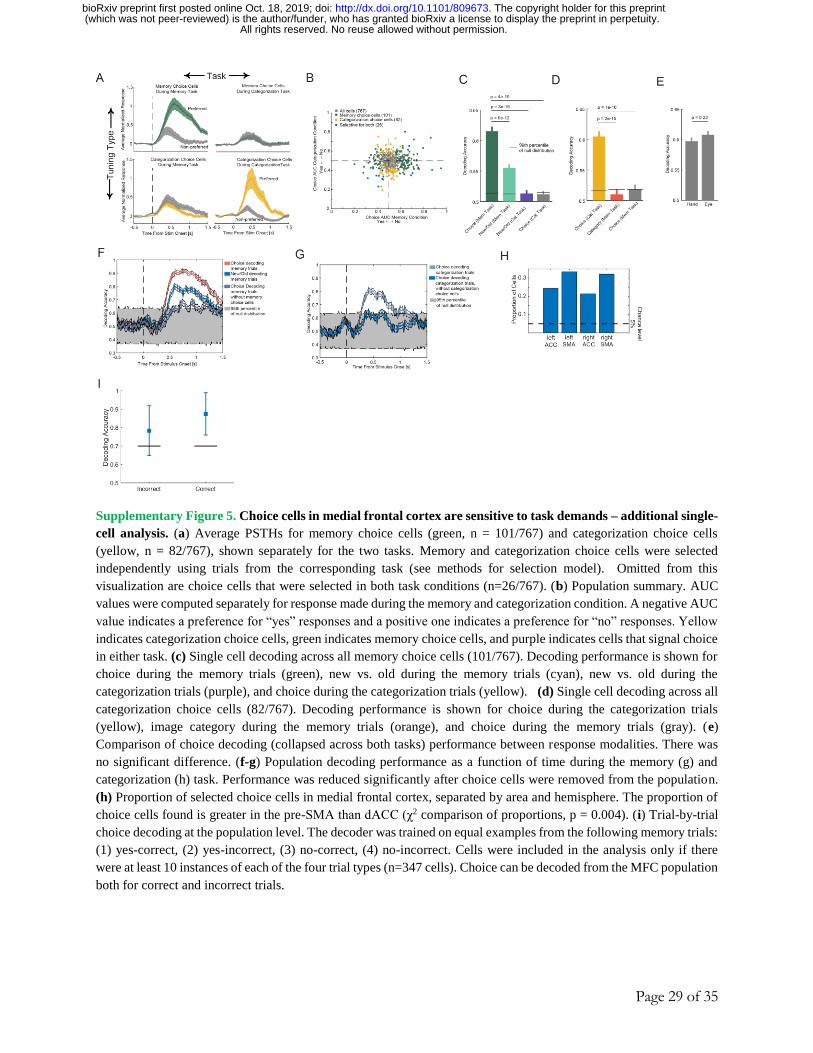
Page 29 of 35
Supplementary Figure 5. Choice cells in medial frontal cortex are sensitive to task demands – additional single-
cell analysis. (a) Average PSTHs for memory choice cells (green, n = 101/767) and categorization choice cells
(yellow, n = 82/767), shown separately for the two tasks. Memory and categorization choice cells were selected
independently using trials from the corresponding task (see methods for selection model). Omitted from this
visualization are choice cells that were selected in both task conditions (n=26/767). (b) Population summary. AUC
values were computed separately for response made during the memory and categorization condition. A negative AUC
value indicates a preference for “yes” responses and a positive one indicates a preference for “no” responses. Yellow
indicates categorization choice cells, green indicates memory choice cells, and purple indicates cells that signal choice
in either task. (c) Single cell decoding across all memory choice cells (101/767). Decoding performance is shown for
choice during the memory trials (green), new vs. old during the memory trials (cyan), new vs. old during the
categorization trials (purple), and choice during the categorization trials (yellow). (d) Single cell decoding across all
categorization choice cells (82/767). Decoding performance is shown for choice during the categorization trials
(yellow), image category during the memory trials (orange), and choice during the memory trials (gray). (e)
Comparison of choice decoding (collapsed across both tasks) performance between response modalities. There was
no significant difference. (f-g) Population decoding performance as a function of time during the memory (g) and
categorization (h) task. Performance was reduced significantly after choice cells were removed from the population.
(h) Proportion of selected choice cells in medial frontal cortex, separated by area and hemisphere. The proportion of
choice cells found is greater in the pre-SMA than dACC (χ2 comparison of proportions, p = 0.004). (i) Trial-by-trial
choice decoding at the population level. The decoder was trained on equal examples from the following memory trials:
(1) yes-correct, (2) yes-incorrect, (3) no-correct, (4) no-incorrect. Cells were included in the analysis only if there
were at least 10 instances of each of the four trial types (n=347 cells). Choice can be decoded from the MFC population
both for correct and incorrect trials.
All rights reserved. No reuse allowed without permission. (which was not peer-reviewed) is the author/funder, who has granted bioRxiv a license to display the preprint in perpetuity.
The copyright holder for this preprint. http://dx.doi.org/10.1101/809673doi: bioRxiv preprint first posted online Oct. 18, 2019;
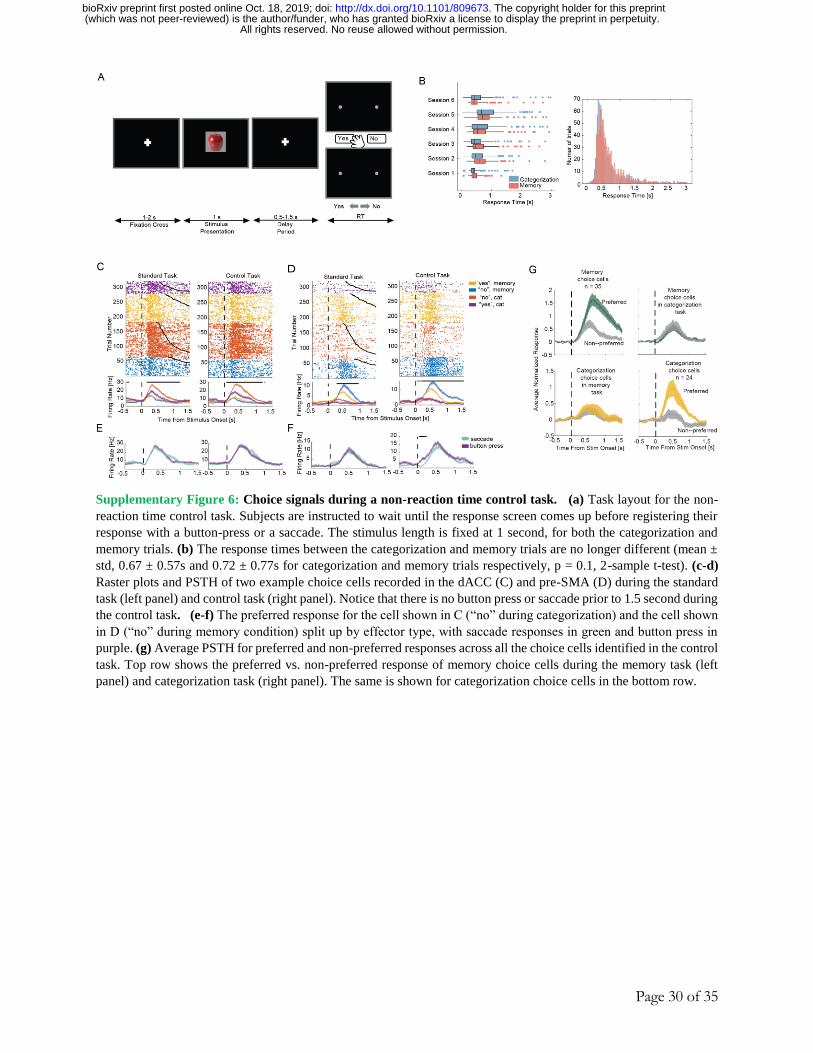
Page 30 of 35
Supplementary Figure 6: Choice signals during a non-reaction time control task. (a) Task layout for the non-
reaction time control task. Subjects are instructed to wait until the response screen comes up before registering their
response with a button-press or a saccade. The stimulus length is fixed at 1 second, for both the categorization and
memory trials. (b) The response times between the categorization and memory trials are no longer different (mean ±
std, 0.67 ± 0.57s and 0.72 ± 0.77s for categorization and memory trials respectively, p = 0.1, 2-sample t-test). (c-d)
Raster plots and PSTH of two example choice cells recorded in the dACC (C) and pre-SMA (D) during the standard
task (left panel) and control task (right panel). Notice that there is no button press or saccade prior to 1.5 second during
the control task. (e-f) The preferred response for the cell shown in C (“no” during categorization) and the cell shown
in D (“no” during memory condition) split up by effector type, with saccade responses in green and button press in
purple. (g) Average PSTH for preferred and non-preferred responses across all the choice cells identified in the control
task. Top row shows the preferred vs. non-preferred response of memory choice cells during the memory task (left
panel) and categorization task (right panel). The same is shown for categorization choice cells in the bottom row.
All rights reserved. No reuse allowed without permission. (which was not peer-reviewed) is the author/funder, who has granted bioRxiv a license to display the preprint in perpetuity.
The copyright holder for this preprint. http://dx.doi.org/10.1101/809673doi: bioRxiv preprint first posted online Oct. 18, 2019;
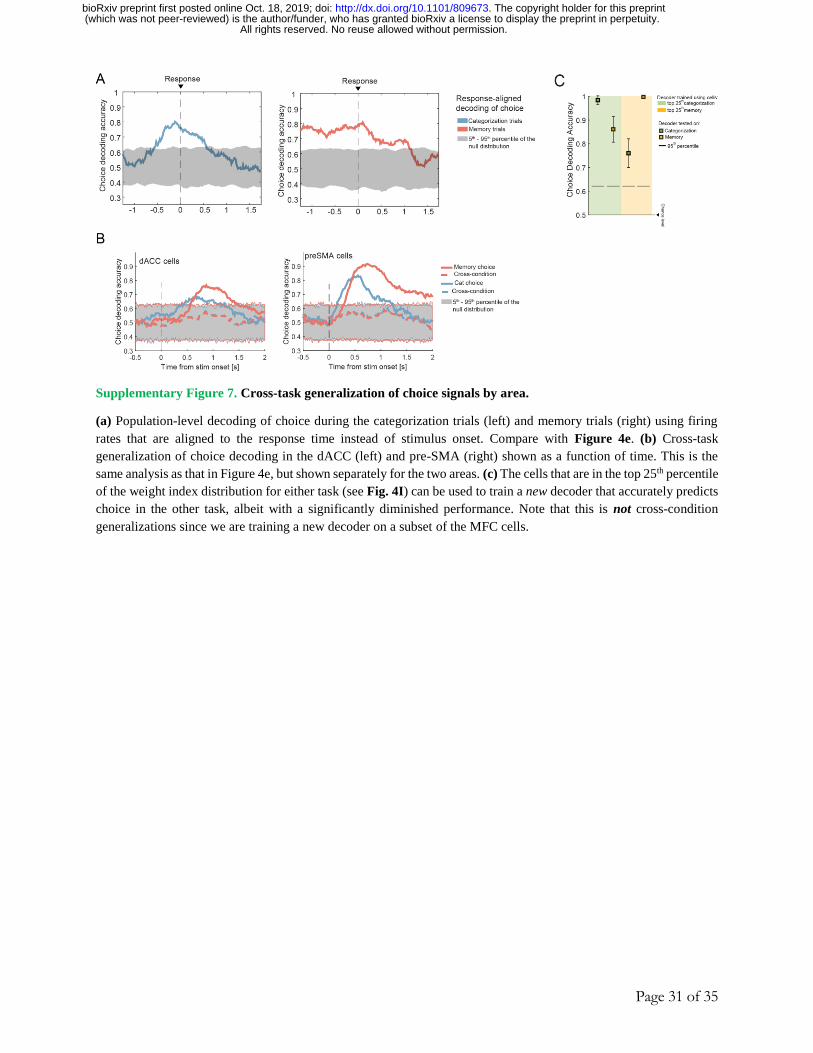
Page 31 of 35
Supplementary Figure 7. Cross-task generalization of choice signals by area.
(a) Population-level decoding of choice during the categorization trials (left) and memory trials (right) using firing
rates that are aligned to the response time instead of stimulus onset. Compare with Figure 4e. (b) Cross-task
generalization of choice decoding in the dACC (left) and pre-SMA (right) shown as a function of time. This is the
same analysis as that in Figure 4e, but shown separately for the two areas. (c) The cells that are in the top 25th percentile
of the weight index distribution for either task (see Fig. 4I) can be used to train a new decoder that accurately predicts
choice in the other task, albeit with a significantly diminished performance. Note that this is not cross-condition
generalizations since we are training a new decoder on a subset of the MFC cells.
All rights reserved. No reuse allowed without permission. (which was not peer-reviewed) is the author/funder, who has granted bioRxiv a license to display the preprint in perpetuity.
The copyright holder for this preprint. http://dx.doi.org/10.1101/809673doi: bioRxiv preprint first posted online Oct. 18, 2019;
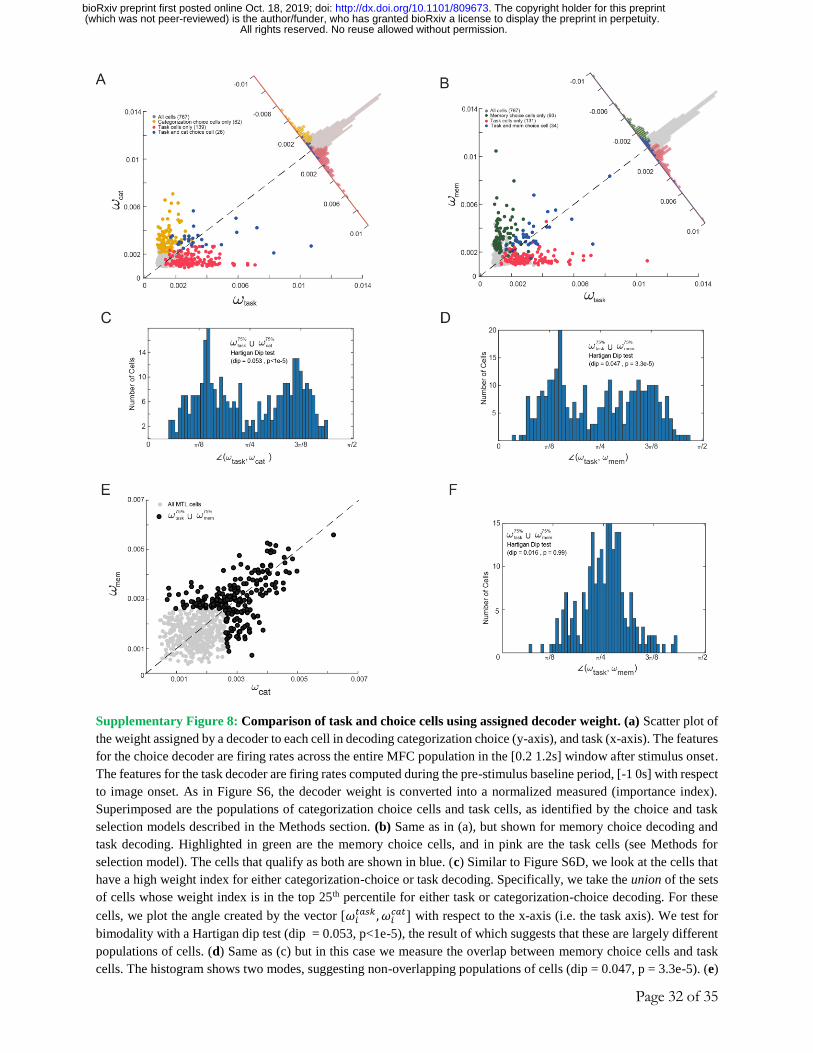
Page 32 of 35
Supplementary Figure 8: Comparison of task and choice cells using assigned decoder weight. (a) Scatter plot of
the weight assigned by a decoder to each cell in decoding categorization choice (y-axis), and task (x-axis). The features
for the choice decoder are firing rates across the entire MFC population in the [0.2 1.2s] window after stimulus onset.
The features for the task decoder are firing rates computed during the pre-stimulus baseline period, [-1 0s] with respect
to image onset. As in Figure S6, the decoder weight is converted into a normalized measured (importance index).
Superimposed are the populations of categorization choice cells and task cells, as identified by the choice and task
selection models described in the Methods section. (b) Same as in (a), but shown for memory choice decoding and
task decoding. Highlighted in green are the memory choice cells, and in pink are the task cells (see Methods for
selection model). The cells that qualify as both are shown in blue. (c) Similar to Figure S6D, we look at the cells that
have a high weight index for either categorization-choice or task decoding. Specifically, we take the union of the sets
of cells whose weight index is in the top 25th percentile for either task or categorization-choice decoding. For these
cells, we plot the angle created by the vector [𝜔𝑖𝑡𝑎𝑠𝑘 , 𝜔𝑖
𝑐𝑎𝑡] with respect to the x-axis (i.e. the task axis). We test for
bimodality with a Hartigan dip test (dip = 0.053, p<1e-5), the result of which suggests that these are largely different
populations of cells. (d) Same as (c) but in this case we measure the overlap between memory choice cells and task
cells. The histogram shows two modes, suggesting non-overlapping populations of cells (dip = 0.047, p = 3.3e-5). (e)
All rights reserved. No reuse allowed without permission. (which was not peer-reviewed) is the author/funder, who has granted bioRxiv a license to display the preprint in perpetuity.
The copyright holder for this preprint. http://dx.doi.org/10.1101/809673doi: bioRxiv preprint first posted online Oct. 18, 2019;

Page 33 of 35
Decoding of image category from the MTL population is a good example of a case where the same cells are recruited
for decoding in the memory and categorization task. Shown in light gray is the weight index for all MTL cells,
computed separately for the categorization and memory task. The dark dots indicate the union of the sets of cells that
have a weight index top 25th percentile for either task. (f) Hartigan dip test for the weight index pair assigned to each
cell in black from (e). The distribution is centered at π/4, which suggests that the same cells are recruited to decode
image category during the memory and categorization tasks (dip = 0.016, p = 0.99).
All rights reserved. No reuse allowed without permission. (which was not peer-reviewed) is the author/funder, who has granted bioRxiv a license to display the preprint in perpetuity.
The copyright holder for this preprint. http://dx.doi.org/10.1101/809673doi: bioRxiv preprint first posted online Oct. 18, 2019;
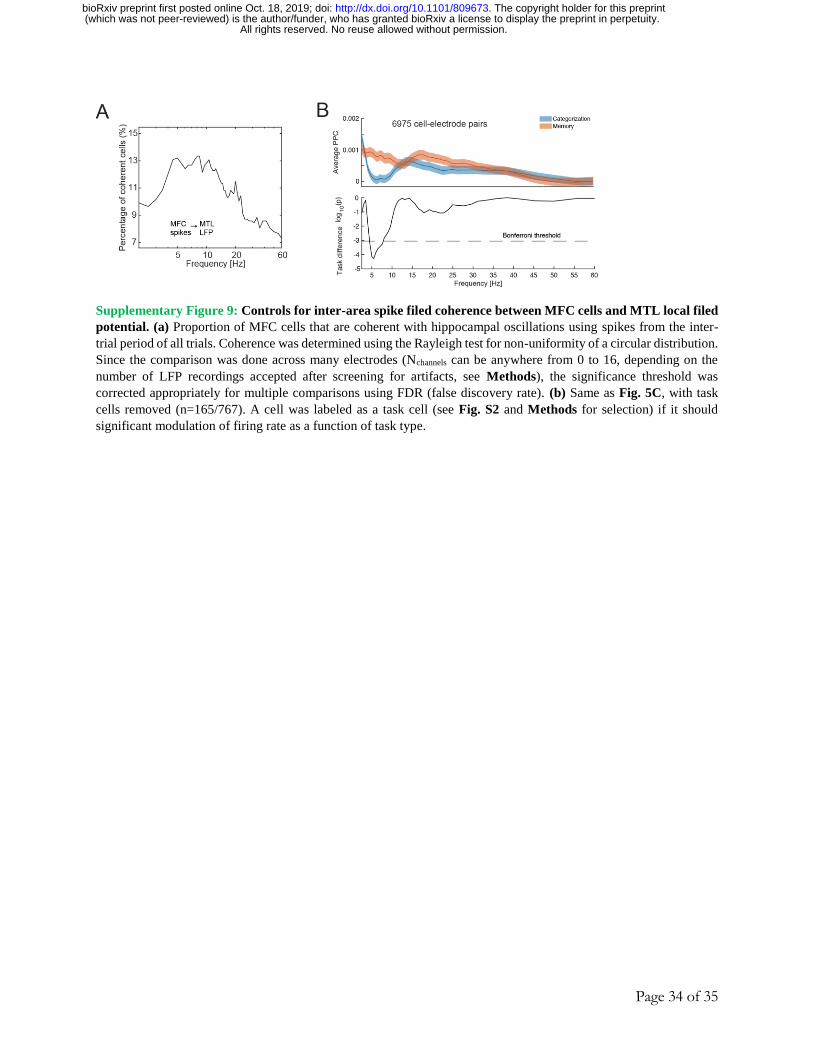
Page 34 of 35
Supplementary Figure 9: Controls for inter-area spike filed coherence between MFC cells and MTL local filed
potential. (a) Proportion of MFC cells that are coherent with hippocampal oscillations using spikes from the inter-
trial period of all trials. Coherence was determined using the Rayleigh test for non-uniformity of a circular distribution.
Since the comparison was done across many electrodes (Nchannels can be anywhere from 0 to 16, depending on the
number of LFP recordings accepted after screening for artifacts, see Methods), the significance threshold was
corrected appropriately for multiple comparisons using FDR (false discovery rate). (b) Same as Fig. 5C, with task
cells removed (n=165/767). A cell was labeled as a task cell (see Fig. S2 and Methods for selection) if it should
significant modulation of firing rate as a function of task type.
All rights reserved. No reuse allowed without permission. (which was not peer-reviewed) is the author/funder, who has granted bioRxiv a license to display the preprint in perpetuity.
The copyright holder for this preprint. http://dx.doi.org/10.1101/809673doi: bioRxiv preprint first posted online Oct. 18, 2019;
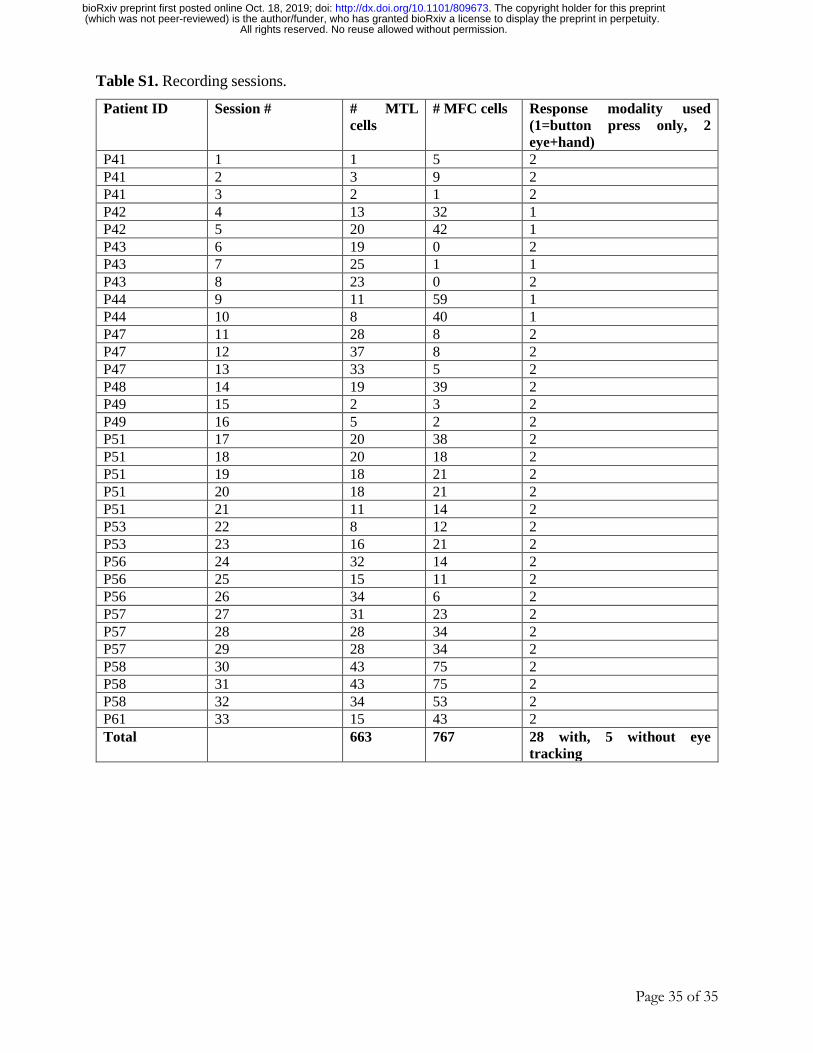
Page 35 of 35
Table S1. Recording sessions.
Patient ID Session # # MTL
cells
# MFC cells Response modality used
(1=button press only, 2
eye+hand)
P41 1 1 5 2
P41 2 3 9 2
P41 3 2 1 2
P42 4 13 32 1
P42 5 20 42 1
P43 6 19 0 2
P43 7 25 1 1
P43 8 23 0 2
P44 9 11 59 1
P44 10 8 40 1
P47 11 28 8 2
P47 12 37 8 2
P47 13 33 5 2
P48 14 19 39 2
P49 15 2 3 2
P49 16 5 2 2
P51 17 20 38 2
P51 18 20 18 2
P51 19 18 21 2
P51 20 18 21 2
P51 21 11 14 2
P53 22 8 12 2
P53 23 16 21 2
P56 24 32 14 2
P56 25 15 11 2
P56 26 34 6 2
P57 27 31 23 2
P57 28 28 34 2
P57 29 28 34 2
P58 30 43 75 2
P58 31 43 75 2
P58 32 34 53 2
P61 33 15 43 2
Total 663 767 28 with, 5 without eye
tracking
All rights reserved. No reuse allowed without permission. (which was not peer-reviewed) is the author/funder, who has granted bioRxiv a license to display the preprint in perpetuity.
The copyright holder for this preprint. http://dx.doi.org/10.1101/809673doi: bioRxiv preprint first posted online Oct. 18, 2019;