Embed Size (px)
Citation preview
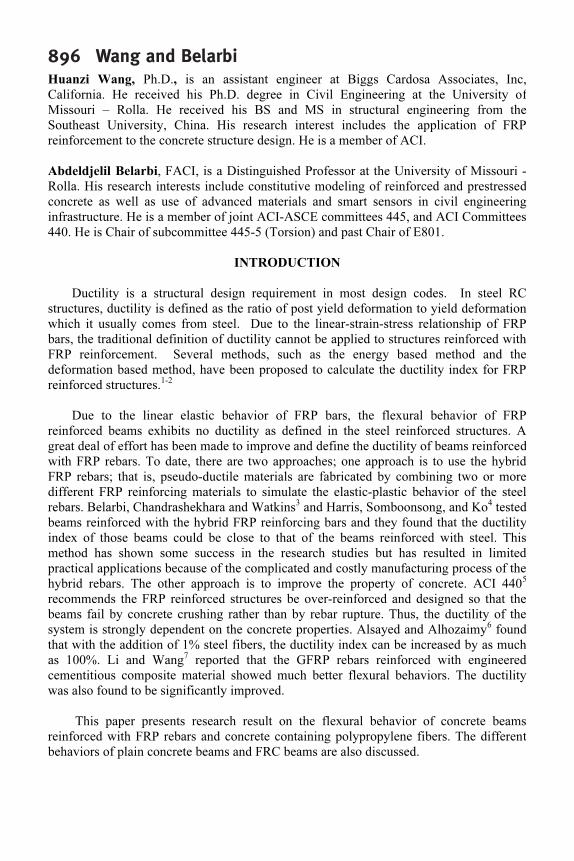
895
SP-230—51
Flexural Behavior ofFiber-Reinforced-Concrete Beams
Reinforced with FRP Rebars
by H. Wang and A. Belarbi
Synopsis:Synopsis:Synopsis:Synopsis:Synopsis: The main objective of this study was to develop a nonferrous hybridreinforcement system for concrete bridge decks by using continuous fiber-reinforced-polymer (FRP) rebars and discrete randomly distributed polypropylene fibers. Thishybrid system has the potential to eliminate problems related to corrosion of steelreinforcement while providing requisite strength, stiffness, and desired ductility, whichare shortcomings of the FRP reinforcement system in reinforced concrete structures.
The overall study plan includes (1) development of design procedures for an FRP/FRChybrid reinforced bridge deck system; (2) laboratory studies of static and fatigue bondperformances and ductility characteristics of the system; (3) accelerated durability testsof the hybrid system; and (4) static and fatigue tests on full-scale hybrid reinforcedcomposite bridge decks. This paper presents the results relating to the flexuralbehavior of the polypropylene-fiber-reinforced-concrete beams reinforced with FRPrebars.
Test results indicated that with the addition of fibers, the flexural behavior wasimproved with an increase of ductility index by approximately 40% as compared to theplain concrete beams. Crack widths of FRP/FRC were found to be smaller than those ofFRP/plain concrete system and the values predicted by the current ACI 440 equations.Furthermore, the compressive failure strains of concrete in FRP/FRC beams exceed thestrain of 0.0040 mm/mm.
Keywords: concrete bridge decks; crack width; ductility; fiber-reinforced concrete; fiber-reinforced polymers; flexure; polypropylenefiber
896 Wang and BelarbiHuanzi Wang, Ph.D., is an assistant engineer at Biggs Cardosa Associates, Inc,
California. He received his Ph.D. degree in Civil Engineering at the University of
Missouri – Rolla. He received his BS and MS in structural engineering from the
Southeast University, China. His research interest includes the application of FRP
reinforcement to the concrete structure design. He is a member of ACI.
Abdeldjelil Belarbi, FACI, is a Distinguished Professor at the University of Missouri -
Rolla. His research interests include constitutive modeling of reinforced and prestressed
concrete as well as use of advanced materials and smart sensors in civil engineering
infrastructure. He is a member of joint ACI-ASCE committees 445, and ACI Committees
440. He is Chair of subcommittee 445-5 (Torsion) and past Chair of E801.
INTRODUCTION
Ductility is a structural design requirement in most design codes. In steel RC
structures, ductility is defined as the ratio of post yield deformation to yield deformation
which it usually comes from steel. Due to the linear-strain-stress relationship of FRP
bars, the traditional definition of ductility cannot be applied to structures reinforced with
FRP reinforcement. Several methods, such as the energy based method and the
deformation based method, have been proposed to calculate the ductility index for FRP
reinforced structures.1-2
Due to the linear elastic behavior of FRP bars, the flexural behavior of FRP
reinforced beams exhibits no ductility as defined in the steel reinforced structures. A
great deal of effort has been made to improve and define the ductility of beams reinforced
with FRP rebars. To date, there are two approaches; one approach is to use the hybrid
FRP rebars; that is, pseudo-ductile materials are fabricated by combining two or more
different FRP reinforcing materials to simulate the elastic-plastic behavior of the steel
rebars. Belarbi, Chandrashekhara and Watkins3
and Harris, Somboonsong, and Ko4
tested
beams reinforced with the hybrid FRP reinforcing bars and they found that the ductility
index of those beams could be close to that of the beams reinforced with steel. This
method has shown some success in the research studies but has resulted in limited
practical applications because of the complicated and costly manufacturing process of the
hybrid rebars. The other approach is to improve the property of concrete. ACI 4405
recommends the FRP reinforced structures be over-reinforced and designed so that the
beams fail by concrete crushing rather than by rebar rupture. Thus, the ductility of the
system is strongly dependent on the concrete properties. Alsayed and Alhozaimy6
found
that with the addition of 1% steel fibers, the ductility index can be increased by as much
as 100%. Li and Wang7
reported that the GFRP rebars reinforced with engineered
cementitious composite material showed much better flexural behaviors. The ductility
was also found to be significantly improved.
This paper presents research result on the flexural behavior of concrete beams
reinforced with FRP rebars and concrete containing polypropylene fibers. The different
behaviors of plain concrete beams and FRC beams are also discussed.
FRPRCS-7 897EXPERIMENTAL PROGRAM
A total of 12 beams making 6 testing groups were investigated. Each testing group
was composed of two similar beams, one subjected to monotonic loading and the other
subjected to repeated loading/unloading. The experimental variables included FRP rebar
size (#4 vs. #8), rebar type (GFRP vs. CFRP), and plain concrete vs. FRC.
Materials
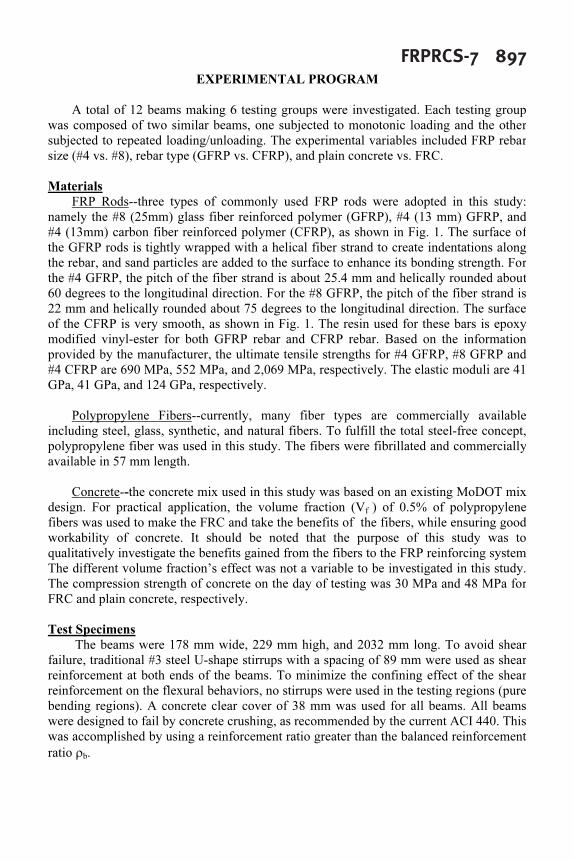
FRP Rods--three types of commonly used FRP rods were adopted in this study:
namely the #8 (25mm) glass fiber reinforced polymer (GFRP), #4 (13 mm) GFRP, and
#4 (13mm) carbon fiber reinforced polymer (CFRP), as shown in Fig. 1. The surface of
the GFRP rods is tightly wrapped with a helical fiber strand to create indentations along
the rebar, and sand particles are added to the surface to enhance its bonding strength. For
the #4 GFRP, the pitch of the fiber strand is about 25.4 mm and helically rounded about
60 degrees to the longitudinal direction. For the #8 GFRP, the pitch of the fiber strand is
22 mm and helically rounded about 75 degrees to the longitudinal direction. The surface
of the CFRP is very smooth, as shown in Fig. 1. The resin used for these bars is epoxy
modified vinyl-ester for both GFRP rebar and CFRP rebar. Based on the information
provided by the manufacturer, the ultimate tensile strengths for #4 GFRP, #8 GFRP and
#4 CFRP are 690 MPa, 552 MPa, and 2,069 MPa, respectively. The elastic moduli are 41
GPa, 41 GPa, and 124 GPa, respectively.
Polypropylene Fibers--currently, many fiber types are commercially available
including steel, glass, synthetic, and natural fibers. To fulfill the total steel-free concept,
polypropylene fiber was used in this study. The fibers were fibrillated and commercially
available in 57 mm length.
Concrete--the concrete mix used in this study was based on an existing MoDOT mix
design. For practical application, the volume fraction (Vf
) of 0.5% of polypropylene
fibers was used to make the FRC and take the benefits of the fibers, while ensuring good
workability of concrete. It should be noted that the purpose of this study was to
qualitatively investigate the benefits gained from the fibers to the FRP reinforcing system
The different volume fraction’s effect was not a variable to be investigated in this study.
The compression strength of concrete on the day of testing was 30 MPa and 48 MPa for
FRC and plain concrete, respectively.
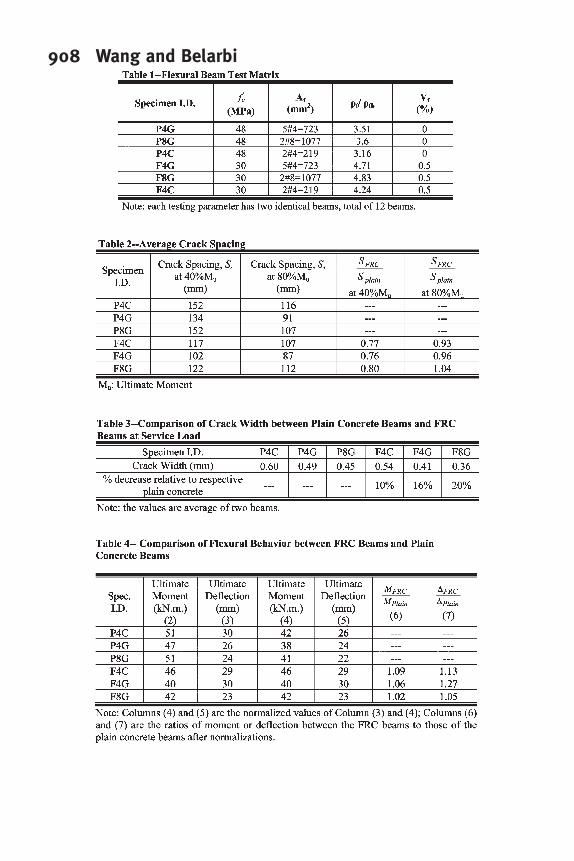
Test Specimens
The beams were 178 mm wide, 229 mm high, and 2032 mm long. To avoid shear
failure, traditional #3 steel U-shape stirrups with a spacing of 89 mm were used as shear
reinforcement at both ends of the beams. To minimize the confining effect of the shear
reinforcement on the flexural behaviors, no stirrups were used in the testing regions (pure
bending regions). A concrete clear cover of 38 mm was used for all beams. All beams
were designed to fail by concrete crushing, as recommended by the current ACI 440. This
was accomplished by using a reinforcement ratio greater than the balanced reinforcement
ratio ρb.
898 Wang and BelarbiThe notation for the specimen’s identification is as follows: the first character, “P” or
“F”, indicates plain concrete or FRC; the second character, “4” or “8”, indicate the rebar
size in English designation used as reinforcement; the last character, “C” or “G”,
indicates the rebar type, CFRP or GFRP. Details of the specimens are shown in Table 1.
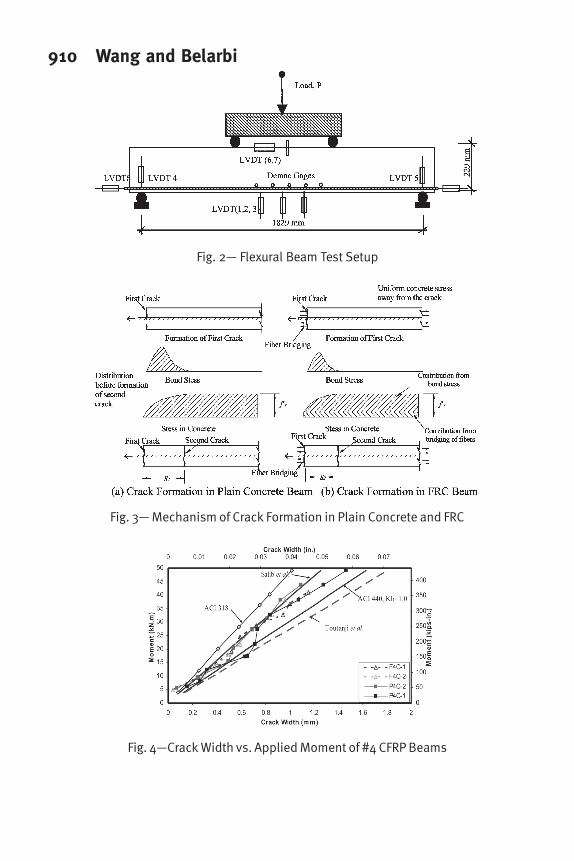
Test Setup and Procedures
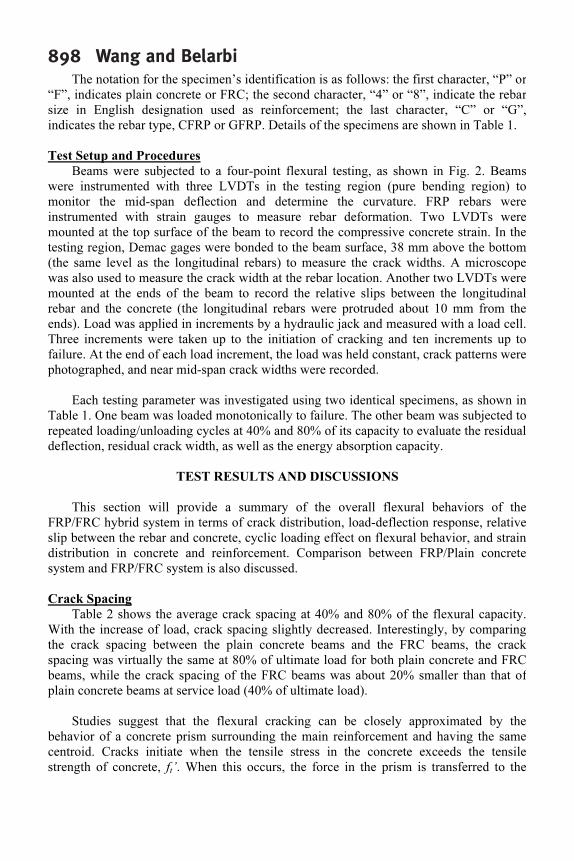
Beams were subjected to a four-point flexural testing, as shown in Fig. 2. Beams
were instrumented with three LVDTs in the testing region (pure bending region) to
monitor the mid-span deflection and determine the curvature. FRP rebars were
instrumented with strain gauges to measure rebar deformation. Two LVDTs were
mounted at the top surface of the beam to record the compressive concrete strain. In the
testing region, Demac gages were bonded to the beam surface, 38 mm above the bottom
(the same level as the longitudinal rebars) to measure the crack widths. A microscope
was also used to measure the crack width at the rebar location. Another two LVDTs were
mounted at the ends of the beam to record the relative slips between the longitudinal
rebar and the concrete (the longitudinal rebars were protruded about 10 mm from the
ends). Load was applied in increments by a hydraulic jack and measured with a load cell.
Three increments were taken up to the initiation of cracking and ten increments up to
failure. At the end of each load increment, the load was held constant, crack patterns were
photographed, and near mid-span crack widths were recorded.
Each testing parameter was investigated using two identical specimens, as shown in
Table 1. One beam was loaded monotonically to failure. The other beam was subjected to
repeated loading/unloading cycles at 40% and 80% of its capacity to evaluate the residual
deflection, residual crack width, as well as the energy absorption capacity.
TEST RESULTS AND DISCUSSIONS
This section will provide a summary of the overall flexural behaviors of the
FRP/FRC hybrid system in terms of crack distribution, load-deflection response, relative
slip between the rebar and concrete, cyclic loading effect on flexural behavior, and strain
distribution in concrete and reinforcement. Comparison between FRP/Plain concrete
system and FRP/FRC system is also discussed.
Crack Spacing
Table 2 shows the average crack spacing at 40% and 80% of the flexural capacity.
With the increase of load, crack spacing slightly decreased. Interestingly, by comparing
the crack spacing between the plain concrete beams and the FRC beams, the crack
spacing was virtually the same at 80% of ultimate load for both plain concrete and FRC
beams, while the crack spacing of the FRC beams was about 20% smaller than that of
plain concrete beams at service load (40% of ultimate load).
Studies suggest that the flexural cracking can be closely approximated by the
behavior of a concrete prism surrounding the main reinforcement and having the same
centroid. Cracks initiate when the tensile stress in the concrete exceeds the tensile
strength of concrete, ft’. When this occurs, the force in the prism is transferred to the
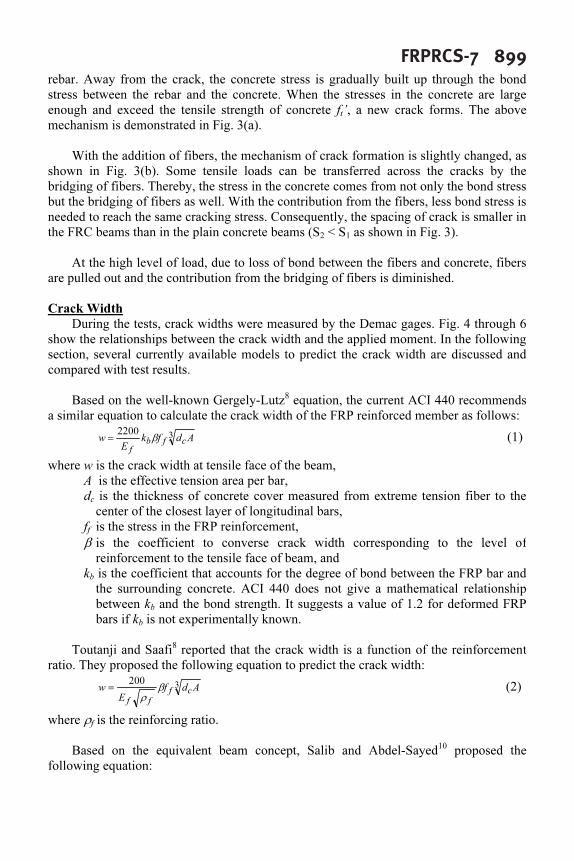
FRPRCS-7 899rebar. Away from the crack, the concrete stress is gradually built up through the bond
stress between the rebar and the concrete. When the stresses in the concrete are large
enough and exceed the tensile strength of concrete ft’, a new crack forms. The above
mechanism is demonstrated in Fig. 3(a).
With the addition of fibers, the mechanism of crack formation is slightly changed, as
shown in Fig. 3(b). Some tensile loads can be transferred across the cracks by the
bridging of fibers. Thereby, the stress in the concrete comes from not only the bond stress
but the bridging of fibers as well. With the contribution from the fibers, less bond stress is
needed to reach the same cracking stress. Consequently, the spacing of crack is smaller in
the FRC beams than in the plain concrete beams (S2 < S
1 as shown in Fig. 3).
At the high level of load, due to loss of bond between the fibers and concrete, fibers
are pulled out and the contribution from the bridging of fibers is diminished.
Crack Width
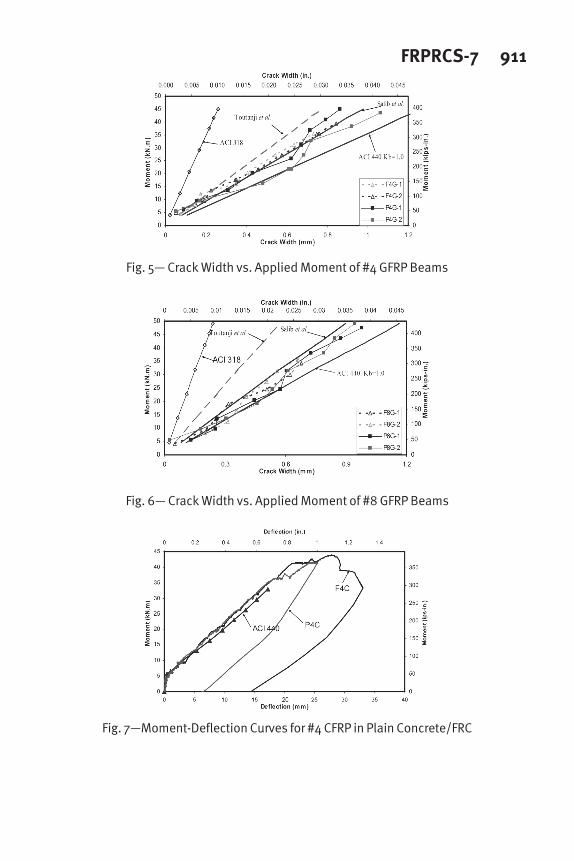
During the tests, crack widths were measured by the Demac gages. Fig. 4 through 6
show the relationships between the crack width and the applied moment. In the following
section, several currently available models to predict the crack width are discussed and
compared with test results.
Based on the well-known Gergely-Lutz8
equation, the current ACI 440 recommends
a similar equation to calculate the crack width of the FRP reinforced member as follows:
32200
Adfk
E
wcfb
f
β= (1)
where w is the crack width at tensile face of the beam,
A is the effective tension area per bar,
dc is the thickness of concrete cover measured from extreme tension fiber to the
center of the closest layer of longitudinal bars,
ff is the stress in the FRP reinforcement,
β is the coefficient to converse crack width corresponding to the level of
reinforcement to the tensile face of beam, and
kb is the coefficient that accounts for the degree of bond between the FRP bar and
the surrounding concrete. ACI 440 does not give a mathematical relationship
between kb and the bond strength. It suggests a value of 1.2 for deformed FRP
bars if kb is not experimentally known.
Toutanji and Saafi8
reported that the crack width is a function of the reinforcement
ratio. They proposed the following equation to predict the crack width:
3200
Adf
E
wcf
ff
β
ρ
= (2)
where ρf is the reinforcing ratio.
Based on the equivalent beam concept, Salib and Abdel-Sayed10
proposed the
following equation:
900 Wang and Belarbi3
323
100760 Adf})u/u)(E/E{(.wcf
/
f,bs,bfsβ×××=
−
(3)
By substituting Es=29000 ksi, Equation 3 becomes
332
2200
Adf
u
u
E
wcf
)/(
f,b
s,b
f
β×
×= (4)
where ub,f
and ub,f
are the bond strengths of steel rebar and FRP rebar, respectively.
In Equation 4, the values of ub,f
and ub,f
need to be evaluated and decided upon. For
traditional steel rebar, according to ACI 318-02,11
'
c
by
d
f
df
l
25
= (neglecting the adjusting
coefficients) and based on the definition of the development length,
2
,( ) / 4
b d b s y s y bd l u f A f dπ π= = (5)
one gets: '
cs,bf.u 256= .
For FRP rebar used in this study, based on the previous bond study (Belarbi and
Wang12
), '
cf,bf.u 259= . Based on this approximate values of u
b u
b,f and u
b,f , Equation 4
become
31700
Adf
E
wcf
f
β= (6)
All the above equations were developed based on the Gergely-Lutz model. However,
different researchers proposed different models to account for the bond strength effect
and/or reinforcement ratio effect on the crack width.
As shown in Figs. 4 through 6, the Salib et al. model gives reasonable predictions of
the crack width for both plain concrete beams and FRC beams. For the Toutanji et al.
model, the prediction values show poor correlation with the experimental results. When
for low reinforcing ratios, (for the CFRP beams, ρ=0.67%), the model overestimates the
crack width. Vice versa, for high reinforcing ratios (#4 GFRP beams, ρ=2.2%, and #8
GFRP beams, ρ=3.3%), the model underestimates the crack width. Therefore, it may be
concluded that it is the bond characteristics rather than the reinforcing ratio that affect the
crack width.
The predictions based on current ACI 440 equations were also compared with the
test results. The accuracy of the equation largely depends on the value of kb. Even when
selecting kb =1.0, one can see that the predictions are still conservative.
Fiber Effect on Crack Width-
With the addition of fibers, the crack widths were slightly decreased at the same load
level, especially at the service load, as shown in Fig. 4 through 6.
As shown in Table 3, the crack widths were smaller in the case of FRC beams as
compared to plain concrete beams at the service load. As discussed earlier, the crack
spacing was decreased at the service load due to the contribution from the fibers. Since
FRPRCS-7 901the crack width is proportionally related to the crack spacing, the crack width is expected
to be smaller in the FRC beams at service loads.
Load-Deflection Response
Figs. 7 through 9 show the typical experimental moment-deflection curves for plain
concrete beams and FRC beams reinforced with different types of FRP rebars. With the
increasing of moment, cracks occurred in the testing region when the moment exceeded
the cracking moment Mcr
. Consequently, the flexural stiffness of the beams was
significantly reduced and the curves were greatly softened. As expected, due to the
linear-elastic behavior of the FRP rebars, the FRP reinforced beams showed no yielding.
The curves went up almost linearly until the crushing of concrete.
Fiber Effect on Moment-Deflection Curves
In order to compare the flexural behaviors between plain concrete beams and FRC
beams, all the load-deflection curves of the plain concrete beams were normalized, based
on the following rules: 1) moment was divided by a coefficient CM
, defined as
FRCACI
plainACI
M
M
M
C
−
−
= , where MACI-plain
and MACI-FRC
are theoretical ultimate capacities
computed based on ACI 440 for beams with concrete strengths equal to the plain concrete
beams and the FRC beams, respectively; 2) deflection was divided by a coefficient CD,
defined as
FRCACI
plainACI
DC
−
−
∆
∆
= , where ∆ACI-plain
and ∆ACI-FRC
are theoretical deflection based
on ACI 440 for beam with concrete strengths equal to the plain concrete beams and FRC
beams at the service load (40% of the ultimate load), respectively.
As shown in Table 4 and Figs. 7 through 9, with the addition of fibers, the ultimate
moments and deflections were increased. The plain concrete beams failed in a more
brittle and explosive manner. Once it reached the capacity, the concrete was crushed and
the load dropped suddenly and violently. FRC beams failed in a more ductile way as the
load dropped more gently and smoothly.
Theoretical Correlation
Deflection at mid-span for a simply supported beam of total length L and subjected
to a four-point flexural test is given as
eec
mid
GI
aPh
)aL(
IE
Pa
10
43
24
2
22
+−=∆ (7)
The first term on the right is from the flexural component, and the second term is
from the shear component. In this study, testing beams had a span-depth ratio of 2.67.
Based on calculation, it was found that the shear component was about 3% of the flexural
component. It was, therefore, neglected for simplicity. Thus, Equation 7 becomes
)aL(
IE
Pa
ec
mid
22
43
24
−=∆ (8)
Current ACI 440 recommends the following expressions to calculate the effective
moment of inertia Ie:
geII = when
cra
MM ≤ ;
902 Wang and Belarbi
gcr
a
cr
gd
a
cr
eII
M
M
I
M
M
I ≤
−+
=
33
1β when cra
MM > (9)
where
+= 1
s
f
bd
E
E
αβ , and ACI 440 recommends taking the value of 50.b=α for all the
FRP bar type. (10)
As shown in Figs. 7 through 9, ACI 440 equations predict the moment-deflection
response fairly well, especially at the service stage. Thus, the equations recommended by
the current ACI 440 would be used for design purpose for both plain concrete beams and
FRC beams.
Relative Slip between Longitudinal Rebar and Concrete at Beam Ends
No relative slips were observed in any of the test beams. That means that the
development lengths as designed by the previous bond study (Belarbi and Wang12
) were
adequate for the FRP bars to develop the required forces.
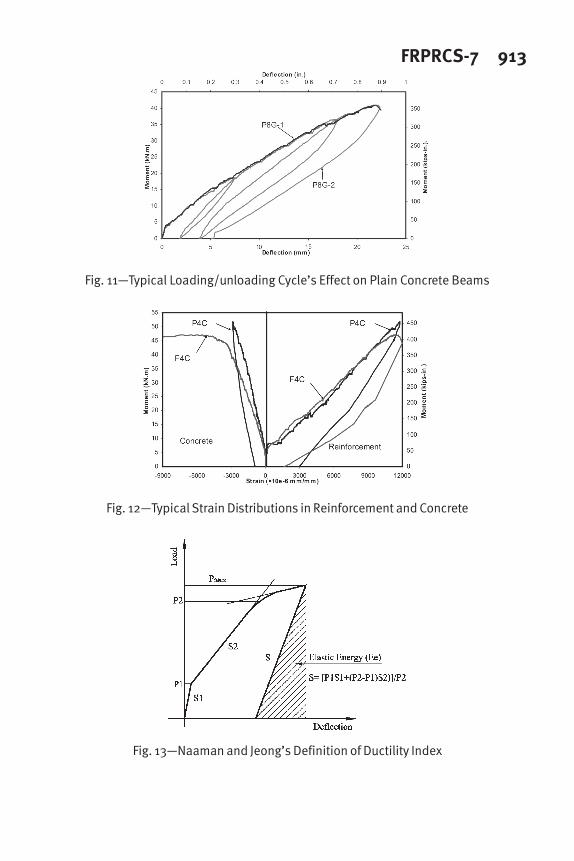
Loading/Unloading Effect on the Flexural Behaviors
No significant differences were observed before and after loading and unloading
cycles in the crack width, crack distribution, and deflection. Also, the flexural stiffness
did not change after cyclic loading, as shown in Figs. 10 and 11.
Strains in Reinforcement and Concrete
Fig. 12 presents the typical measured mid-span strains in reinforcement and in
concrete versus the applied moment. It can be seen that after cracking, the strains in the
reinforcement increased almost linearly up to failure. Because all test beams failed in
concrete crushing rather than FRP reinforcement rupture, all the maximum measured
strains in the reinforcement were less than the ultimate tensile strains. In beams
reinforced with #4 CFRP, #4 GFRP, and #8 GFRP, the maximum measured strains were
12,000, 12,000, and 8,000 microstrains, respectively; while the ultimate strains were
16,700, 16,900, and 13,500 microstrains, respectively.
The differences of the moment-strain curves between the plain concrete beams and
the FRC beams are significant. In plain concrete beams, once reaching the ultimate,
concrete failed by crushing, and strains in the reinforcement dropped suddenly. However,
in FRC beams, when beams reached the ultimate, concrete was held together and the
strains in concrete and strains in reinforcement kept increasing gradually. Furthermore,
with the addition of fibers, the ultimate strain for the concrete was increased. In plain
concrete beams, the measured ultimate concrete strains ranged from 2,700 microstrains to
3,300 microstrains with an average of 2,950 microstrains. In FRC beams, the measured
ultimate concrete strains ranged from 4,000 microstrains to 5,500 microstrains with an
average of 4,500 microstrains.
It should be noted that with the increase of ultimate concrete strain, the balanced
reinforcing ratio, ρbf
, will increase accordingly. Herein, ρbf
is defined as follows
FRPRCS-7 903
fucu
cu
fu
'
c
bf
f
f
.
εε
ε
βρ
+
=1
850 (11)
From this standpoint, in order to take advantage of FRC, more reinforcements are
required to achieve failure by crushing of concrete. This results in additional gain of
moment capacity.
PREDICTIONS OF THE ULTIMATE FLEXURAL CAPACITY
As shown in Table 1, the reinforcing ratio, ρf, for all the beams were taken greater
than the balanced ratio, ρbf
, where εcu
=0.003 as defined by ACI 318-02.11
As expected, all
beams failed in concrete crushing.
Predictions by the ACI 440 equations were based on the normal assumptions of the
flexural theory of concrete reinforced beams. The governing equations are as follows:
2
5901 bd
f
f
.fM'
c
ff
ffn
−=
ρ
ρ (12)
( )
fucufcuf
f
'
ccuf
ffE.E
f.E
f ≤
−+= εε
ρ
βε
50
850
4
1
2
(13)
There are two possible ways by which fibers can increase the flexural strength: one
is that the fibers function as auxiliary reinforcement to carry some tensile stresses; the
other way is that the fibers can improve the concrete properties. In this study,
contribution of fibers in tensile strength was neglected since
(1) Compared to the steel fibers, the tensile strength of polypropylene fibers is low:
less than 1/3 of the tensile strength of the steel fibers.
(2) Due to the low elastic modulus of polypropylene fiber (500 to 700 ksi), the
elongation at break is three orders of magnitude greater than the tensile strain at
failure of the concrete. Hence, the concrete will crack long before the fiber
strength is approached.
Thus, the most likely contribution from the fibers to increase the flexural strength is
to improve the concrete properties. In this study, as described earlier, the ultimate
concrete strain, εcu
, was found to be large than 0.003 in the presence of fibers in the order
of 0.0045 mm/mm.
As shown in Table 5, the theoretical predictions agreed well with the test results. As
discussed earlier, the concrete strains of the FRC beams at failure were greater than
0.0035 on average. For the design of the FRC beams, if we could assume εcu
to be equal
to 0.0035, with is slightly larger than the assumed value of 0.003 of plain concrete.
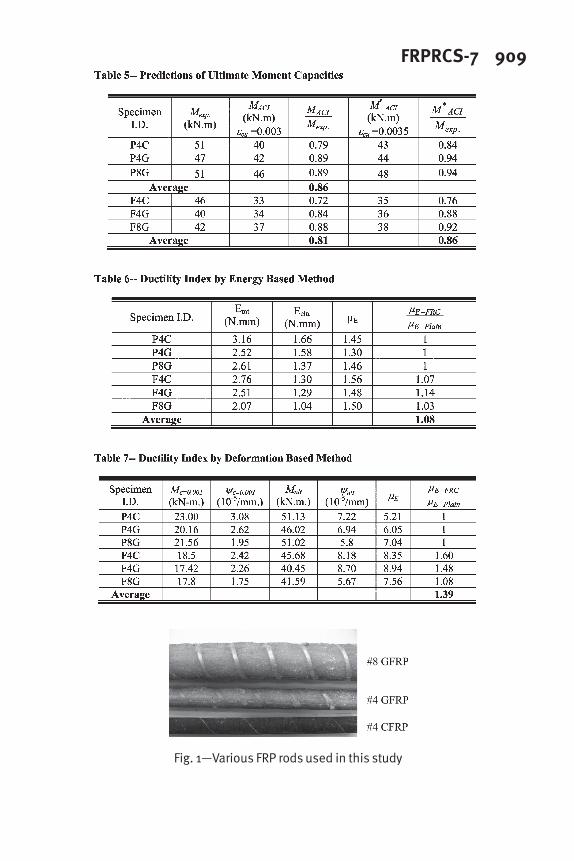
904 Wang and BelarbiDUCTILITY
As mentioned previously, since the traditional definition of ductility can not be
applied to the structures reinforced with FRP reinforcement, there was a need for
developing a new approach and a set of ductility indices to both quantitatively and
qualitatively evaluate the FRP reinforced members.
Ductility index calculations related to the FRP reinforced members have been widely
studied. Two approaches have been in the literature proposed to address this problem.
Energy Based Approach
Based on the definition of the energy based approach, ductility can be defined as the
ratio between the elastic energy and the total energy, as shown in Fig. 13.
Naaman and Jeong1
proposed the following equation to compute the ductility
index, µE:
+= 1
2
1
e
t
E
E
E
µ (14)
where Et is the total energy computed as the area under the load deflection curve; and E
e
is the elastic energy. The elastic energy can be computed as the area of the triangle
formed at failure load by the line having the weighted average slope of the two initial
straight lines of the load deflection curve, as shown in Fig. 13.
Deformation Based Approach
The deformation based approach was first introduced by Jaeger, Tadros, and Mufti.2
It takes into account the strength effect as well as the deflection (or curvature) effect on
the ductility. Both the strength factor and the deflection (or curvature) factor are defined
as the ratio of moment or deflection (or curvature) values at ultimate to the values
corresponding to the concrete compressive strain of 0.001. The strain of 0.001 is
considered the beginning of inelastic deformation of concrete.
factor curvature) or n(deflectio factority deformabil factor strengthfactority Deformabil ×=
0.001 of strainconcrete at moment
ultimate at moment
factor Strength =
0.001 of strainconcrete at deflection
ultimate at deflection
factor Deflection =
0.001 of strainconcrete at curvature
ultimate at curvature
factor Curvature =
In the following sections, ductility indices based on both approaches are computed
and compared.
Ductility Index Computed by the Energy Based Method
As shown in Fig. 12, the definition of elastic slope is dependent on the selections of
P1, P2, S1, and S2. Also, the experimental moment-deflection curves, as shown in Figs. 7
FRPRCS-7 905through 9, were difficult to be idealized into three portions with three distinct slopes and
it could induce some subjective errors if the curves were artificially divided. In this study
the elastic slopes were decided by the slopes of loading/unloading cycles during the tests
rather than using the theoretical predictions proposed by Naaman and Jerong.1
The
ductility indices computed are shown in Table 6.
Ductility Index Computed by the Deformation Based Method
Theriault, Benmokrane, and Gao13
found that the ductility indices computed by the
curvature factor demonstrated more consistent comparison to those computed by
deflection factor. Therefore, the curvature factor is adopted in this study. The ductility
indices are computed as shown in Table 7.
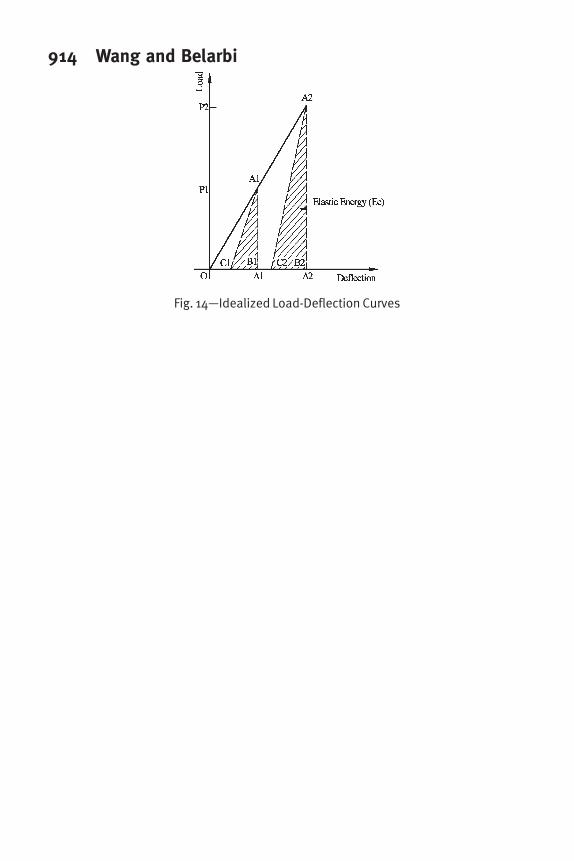
Discussions of Ductility Index
As shown in Tables 6 and 7, the ductility indices computed by the two methods are
quite different. Ductility indices by the Naaman and Jerong method are much smaller
than those by the Jaeger method. Another significant difference is that the effect from the
addition of fibers on the ductility indices is much more pronounced when calculated
based on the Jaeger method.
A schematic load-deflection curve for a certain material reinforced beam, as shown
in Fig. 14, is created to explain the different results by the two methods. With the
addition of fibers, the load capacity and deflection are increased from P1 to P2 and ∆1 to
∆2, proportionally.
Although there are different ways to calculate the ductility index, ductility can no
doubt be defined as the ability to absorb the inelastic energy without losing its load
capacity. Higher inelastic energy absorption of the same system means higher ductility.
Obviously, from this standpoint, the addition of fibers significantly improves the
system’s ductility. However, based on the prediction of Naaman and Jerong’s ductility
index, the ductility is the same before and after the addition of fibers. Because the ratios
of
e
t
E
E
are the same, µE
does not change. The reason is although the absorption of the
inelastic energy with the addition of fibers increases, the absorption of the elastic energy
is also increased proportionally. Thus, the index µE
remains constant in this example.
From this standpoint, the ductility index proposed by Naaman and Jerong cannot
efficiently take into account the benefits gained from the increase of the ultimate moment
capacity and the accompanying increase of the deflection with the addition of fibers. The
ductility index based on the Jaeger approach is more reasonable. It not only considers
factors resulting from the load capacity, but it also considers the deformation effect on
the ductility. The ductility increases approximately 40% with the addition of fibers, based
on the Jaeger approach. Also, all the ductility indices, as calculated by the Jaeger method,
were found to be above the lower limit of 4 recommended by Jaeger and the Canadian
Highway Bridge Design Code.14
Both the plain concrete beams and the FRC beams can,
therefore, be considered acceptable for design in terms of ductility requirement.
906 Wang and BelarbiCONCLUSIONS
An extensive research program was initiated to investigate the feasibility of steel-free
hybrid reinforcement system for concrete bridge decks by combining FRP reinforcement
with the polypropylene fiber reinforced concrete. From the flexural study covered in this
paper, the following conclusions can be drawn:
1. The deflection predicted by the current ACI 440 matches the experimental results
fairly well, especially at the service load, and it is suggested to be used for the design
purpose for both the plain concrete beams and the FRC beams.
2. The model proposed by Salib et al. gives reasonable predictions of the crack width
for both plain concrete beams and FRC beams. The predictions by the ACI 440 are
conservative.
3. With the addition of fibers, the crack widths are smaller at service load in the case of
FRC beams as compared to plain concrete beams.
4. The concrete ultimate strains measured in FRC beams were larger than that of the
plain concrete beams. They ranged from 4,000 microstrains to 5,500 microstrains
with an average of 4,500 microstrains for FRC beams; while 2,700 microstrains to
3,300 microstrains with an average of 2,950 microstrains were measured for the
plain concrete beams.
5. With the addition of fibers, the flexural behavior exhibits an improved ductility index
When compared to plain concrete beams, FRC beams failed in a relatively more
ductile fashion.
6. With the addition of polypropylene fibers, the ductility indices increased by
approximately 40% based on Jaeger approach. In addition, both plain concrete beams
and FRC beams provided adequate deformability level, as described by Jaeger
approach.
ACKNOWLEDGMENTS
The authors gratefully acknowledge the financial support of the Missouri
Department of Transportation and UMR University Transportation Center for this joint
research program. The authors are also thankful to Doug Gremel of Hughes Brothers and
Don Smith of SI Concrete Systems for their participation on the Research Advisory Panel
as well as the generous in-kind material donation to this project.
REFERENCES
1. Naaman, A.E., and Jeong, S.M. “Structural Ductility of Concrete Beams Prestressed
with FRP Tendons,” Proc., 2nd
Int. RILEM Symp. (FRPRXS-2), Non-Metric (FRP)
Reinforcement for Concrete Structures, RILEM, Bagneux, France, 1995, pp. 379-386.
2. Jaeger, G.L., Tadros, G., and Mufti, A.A., “Balanced Section, Ductility and
Deformability in Concrete with FRP Reinforcement,” Research Report No. 2-1995,
Industry Center for Computer-Aided Engineering, Technical University of Nova Scotia,
Halifax, Nova Scotia, Canada, 1995, 29 pp.
FRPRCS-7 9073. Belarbi, A., Chandrashkhara, K., and Watkins, S.E., “Performance Evaluation of FRP
Rebar Featuring Ductility and Health Monitoring Capability,” Proceedings of the Fourth
International Symposium on Fiber Reinforced Polymer for Reinforced Concrete
Structures (FRPRCS-4), Baltimore, MD, October 31 - November 5, 1999, pp. 1-12
4. Harris, H.G., Somboonsong, W., and Ko, F. K., “New Ductile Hybrid FRP Reinforcing
Bar for Concrete Structures,” Journal of composites for construction, Vol. 2, No. 1,
February 1998, pp. 28-37.
5. ACI committee 440, “Guide for the Design and Construction of Concrete Reinforced
with FRP Bars,” ACI 440.1R-03, American Concrete Institute, Farmington Hills,
Michigan, 2003, 41 pp.
6. Alsayed, S.H., and Alhozaimy, A.M., “Ductility of Concrete Beams Reinforced with
FRP Bars and Steel Fibers,” Journal of Composite Materials, Vol. 33, No. 19, 1999, pp.
1792-1806.
7. Li, V.C., and Wang, S., “Flexural Behaviors of Glass Fiber-Reinforced Polymer
(GFRP) Reinforced Engineered Cementitious Composite Beams,” ACI Materials Journal
Vol. 99, No. 1, January-February 2002, pp. 11-21.
8. Gergely, P, and Lutz, L.A., “Maximum Crack Width in Reinforced Concrete Flexural
Members,” Causes, Mechanism, and Control of Cracking in Concrete, SP-20, American
Concrete Institute, Farmington Hills, Michigan, 1999, pp.87-117.
9. Toutanji, H. A. and Saafi, M., “Flexural Behavior of Concrete Beams Reinforced with
Glaass Fiber-Reinforced Polymer (GFRP) Bars,” ACI Structural Journal, Vol. 97, No. 5,
September-October 2000, pp. 712-719.
10. Salib, S.R. and Abdel-Sayed, G., “Prediction of Crack Width for Fiber-Reinforced
Polymer-Reinforced Concrete Beams,” ACI Structural Journal, Vol. 101, No. 4, July-
August 2004, pp. 532-536.
11. ACI Committee 318. “Building Code Requirements for Structural Concrete (318-02)
and Commentary (318R-02),” American Concrete Institute, Farmington Hills, Michigan,
2002, 443 pp.
12. Belarbi. A and Wang, H., “Bond Splitting Behavior of FRP Reinforcing Bars
Embedded in Fiber Reinforced Concrete,” Proceeding for the 84th
Transportation
Research Board Annual Meeting, 2005, Washington D.C.
13. Tighiouart, B. Benmokrane, B., and Gao, D., “Investigation of Bond In Concrete
Member With Fiber Reinforced Polymer (FRP) Bars,” Construction and Building
Materials, Vol. 12, No. 8, December 1998, pp. 453-462.
14. CAN/CSA-S6-00, 2000, “Canadian Highway Bridge Design Code,” Canadian
Standard Association, Rexdale, Ontario, Canada, 190 pp.
908 Wang and Belarbi
FRPRCS-7 909
Fig. 1—Various FRP rods used in this study
910 Wang and Belarbi
Fig. 2— Flexural Beam Test Setup
Fig. 3— Mechanism of Crack Formation in Plain Concrete and FRC
Fig. 4—Crack Width vs. Applied Moment of #4 CFRP Beams
FRPRCS-7 911
Fig. 5— Crack Width vs. Applied Moment of #4 GFRP Beams
Fig. 6— Crack Width vs. Applied Moment of #8 GFRP Beams
Fig. 7—Moment-Deflection Curves for #4 CFRP in Plain Concrete/FRC
912 Wang and Belarbi
Fig. 8—Moment-Deflection Curves for #4 GFRP in Plain Concrete/FRC
Fig. 9— Moment-Deflection Curves for #8 GFRP in Plain Concrete/FRC
Fig. 10—Typical Loading/unloading Cycle’s Effect on FRC Beams
FRPRCS-7 913
Fig. 11—Typical Loading/unloading Cycle’s Effect on Plain Concrete Beams
Fig. 12—Typical Strain Distributions in Reinforcement and Concrete
Fig. 13—Naaman and Jeong’s Definition of Ductility Index
914 Wang and Belarbi
Fig. 14—Idealized Load-Deflection Curves