Embed Size (px)
Citation preview

JOURNAL OF MATERIALS AND ENGINEERING STRUCTURES 5 (2018) 333–346 333
Research Paper
Flexural Performance and Toughness Evaluation of Hybrid Steel- Polypropylene Fibre Reinforced Self Compacting Concrete
S. Bawa, S.P. Singh *
Department of Civil Engineering, Dr B R Ambedkar National Institute of Technology, Jalandhar, India
A R T I C L E I N F O
Article history :
Received : 26 June 2018
Revised : 24 September 2018
Accepted : 24 September 2018
Keywords:
Hybrid Fiber Reinforced Self Compacting Concrete
Flexural toughness
Flexural Fatigue
Steel and polypropylene fibers
A B S T R A C T
The paper presents the results of an investigation conducted to study the influence of fiber hybridization on the compressive strength, flexural strength, flexural fatigue and flexural toughness of the Hybrid Fiber Reinforced Self Compacting Concrete (HyFRSCC). The Steel Fibers (SF) and Polypropylene Fibers (PPF) at 1% by volume of concrete have been used. The PPF and SF proportions used are 100% PPF, 75% PPF + 25% SF, 50% PPF + 50% SF, 25% PPF + 75% SF and 100% SF. The flexural toughness parameters were calculated using procedure laid down in JCI Method, ASTM C-1018 C and ASTM 1609/C 1609 M. The flexural fatigue tests were conducted at stress levels of 0.65, 0.7, 0.75, 0.8, 0.85 and 0.9. The Weibull parameters have been calculated using the graphical method and the method of moments. The results indicate that the mix with a fiber combination of 25% PPF + 75% SF can be adjudged as the optimum combination for HyFRSCC in terms of compressive strength, flexural strength and flexural toughness. Gradual replacement of steel fibers with polypropylene fibers has been found to reduce the variability in fatigue life data of HyFRSCC.
1 Introduction
The improvement in mechanical properties of normally vibrated concrete using hybrid fibers is well known. Different combinations of fibers such as metallic - metallic and metallic - non-metallic fibers have been employed. The different types of fibers used are steel, glass, polyester, carbon and polypropylene fibers [1-6]. There is a positive interaction between the fibers in a well designed composite and the resulting hybrid performance exceeds the individual fiber performances [7]. Generally one metallic and one nonmetallic type of fibers are used. The metallic fiber is stronger and provides reasonable first crack strength and ultimate strength, while the non-metallic fiber is relatively flexible and imparts improved toughness and strain capacity in the post-crack zone. The Steel – Polypropylene fiber combination is such one promising combination which can be used for better performance [4].
* Corresponding author. Tel.: +91 98140 88475. E-mail address: [email protected] e-ISSN: 2170-127X,

334 JOURNAL OF MATERIALS AND ENGINEERING STRUCTURES 5 (2018) 333–346
Self Compacting Concrete (SCC) offers many benefits to the construction practice - the elimination of the compaction work results in reduced costs of placement, shortening of the construction time, reduction in noise during casting thus leading to better working conditions. Other advantages of SCC are - improved homogeneity of the concrete and the excellent surface quality without blowholes or other surface defects. The basic components of SCC are the same as used in Normally Vibrated Concrete (NVC). However, to obtain the required rheological properties of fresh SCC, a higher proportion of fine materials and the incorporation of chemical admixture, a super-plasticizer is necessary. Sometimes, a viscosity modifying agent may also be used for the stability of the mix [8-10].The need for high powder content in SCC is usually met by using pozzolanic fillers like fly ash, silica fume, blast furnace slag and non pozzolanic fillers like limestone powder, chalk powder, dolomite fines and quartzite powder.
Many researchers, in the last decade have started using fibers in SCC and as a result, Fiber Reinforced Self Compacting Concrete (FRSCC) is now being used in structures such as airport pavements, highway overlays, bridge decks and machine foundations. The fresh, mechanical properties under statically applied loads and durability characteristics of FRSCC have been investigated [11-15]. It has been observed that the performance of FRSCC was much better than that of Normally Vibrated Fiber Reinforced Concrete (NVFRC). Information on the mix proportioning methods of SCC and FRSCC is also available [16-18].
The fresh and hardened state properties of Hybrid Fiber Reinforced Self Compacting Concrete (HyFRSCC) have been tested by various researchers [5, 19-21]. The positive results show that in a well-designed hybrid composites, there is a positive interaction between the fibers and the resulting hybrid performance may exceed that of mono fiber composites.
The objective of this study is to evaluate the mechanical properties of the SCC containing steel, polypropylene and hybrid fiber combinations. The total volume fraction is kept constant at 1%. The proportions used are 100% polypropylene fibers (PPF), 100% Steel Fibers (SF), 25% PPF + 75% SF, 50% PPF + 50% SF and 25% SF + 75% PPF. The comparative evaluation of various HyFRSCC is made based on the hardened properties i.e. Compressive Strength, Flexural Strength, Flexural Fatigue and Flexural Toughness. The JCI, ASTM C1018 and ASTM C 1609/C 1609M have been employed to evaluate the toughness parameters of HyFRSCC. Probabilistic analysis of HyFRSCC mixes has been carried out using two-parameter Weibull distribution.
2 Experimental Programme
In the present study, Ordinary Portland Cement of 43 grade conforming to requirements of IS 8112-1989 has been used. Crushed stone aggregates (below 12.5 mm) of specific gravity 2.78 were used as coarse aggregates and locally available coarse sand of specific gravity 2.75 conforming to Zone II grain size distribution was used as fine aggregates. The water absorption of coarse aggregates was 0.28% and that of fine aggregates was 0.25%. The Class F fly ash was used with grading as shown in Figure 1.
Fig. 1 - Grading of Fly Ash used in this Investigation.
Glenium 51, a polycarboxylic ether based super-plasticizer as admixture was used in suitable dosages to obtain the required HyFRSCC mixes with different volume fractions of fibers. Glenium Stream II was used as Viscosity Modifying Agent (VMA).The following type of fibers in different combinations such as 100-0%, 75%-25%, 50%-50%, 25%-75% and 0-100% by volume were used at 1% volume fraction.
JOURNAL OF MATERIALS AND ENGINEERING STRUCTURES 5 (2018) 333–346 335
Figure 2, shows Corrugated Steel Fibers (SF) of 1mm diameter, 30mm length and specific gravity of 7.8 and Polypropylene Fibers (PPF) of 1mm diameter, 10mm length and specific gravity of 0.91.
Fig. 2 - Steel Fibers and Polypropylene Fibers used in HyFRSCC.
Suitable SCC mixes with different proportions of steel and polypropylene fibers were obtained through trials as per EFNARC guidelines. The Proportions of the SCC mix are shown in Table 1.
Table – 1 Mix Proportions of the SCC (kg/cum)
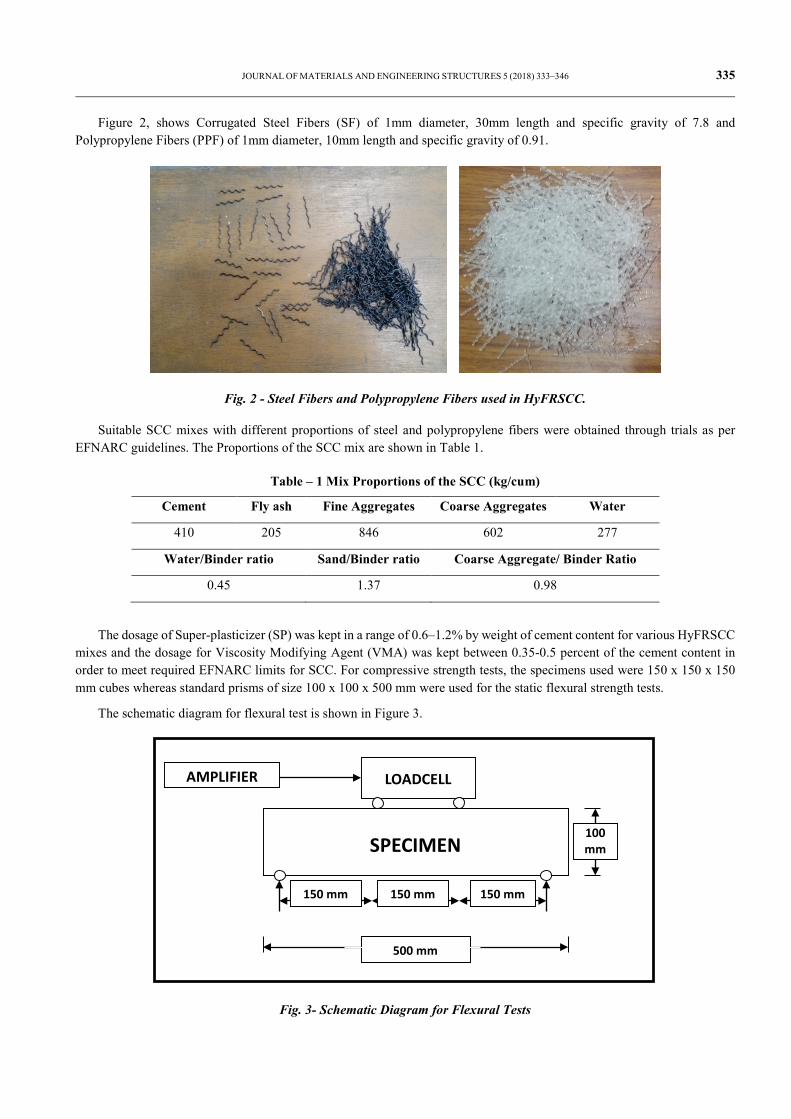
The dosage of Super-plasticizer (SP) was kept in a range of 0.6–1.2% by weight of cement content for various HyFRSCC mixes and the dosage for Viscosity Modifying Agent (VMA) was kept between 0.35-0.5 percent of the cement content in order to meet required EFNARC limits for SCC. For compressive strength tests, the specimens used were 150 x 150 x 150 mm cubes whereas standard prisms of size 100 x 100 x 500 mm were used for the static flexural strength tests.
The schematic diagram for flexural test is shown in Figure 3.
Fig. 3- Schematic Diagram for Flexural Tests
Cement Fly ash Fine Aggregates Coarse Aggregates Water
410 205 846 602 277
Water/Binder ratio Sand/Binder ratio Coarse Aggregate/ Binder Ratio
0.45 1.37 0.98
AMPLIFIER LOADCELL
SPECIMEN
150 mm 150 mm 150 mm
500 mm
100mm
336 JOURNAL OF MATERIALS AND ENGINEERING STRUCTURES 5 (2018) 333–346
The specimens were cast in the different batches. Each batch had fourteen flexural test specimen and six cubes for testing the 28-day compressive strength of each mix. The specimen for compressive strength tests were cured for 28 days, whereas, the specimens for flexural strength tests were cured for 90 days.
The compressive strength tests were conducted on concrete cubes in a 200 tons Universal Testing Machine. The flexural strength and flexural fatigue of HyFRSCC was obtained by testing prism specimens under four-point bending test.
All the flexural strength tests were done on a 100 kN servo-controlled actuator. The fatigue tests were performed at different stress levels of 0.65, 0.7, 0.75, 0.8, 0.85 and 0.95 for all the mixes with different fiber combinations.
3 Results And Discussion
3.1 Compressive Strength Results
The average of three batches has been taken as the compressive strength of a particular mix. The compressive strength results have been tabulated in Table 2 along with standard deviation.
Table – 2 Compressive Strength Test Results for HyFRSCC
Fiber Mix Proportion by Volume (%) Fiber Volume
Fraction
28 Days Compressive Strength (MPa)
SF PPF Average* Percentage Increase
-- -- 0.0 28.90 ± 3.28 ---
0 100 1.0 29.45 ± 3.41 1.9
25 75 1.0 34.98 ± 2.23 21
50 50 1.0 37.70 ± 3.31 30.4
75 25 1.0 44.32 ± 1.89 53.3
100 0 1.0 41.23 ± 2.28 42.6
* Average compressive strength along with standard deviation
It may be noted that the coefficient of variation of the compressive strength values of all the mixes was in the range of
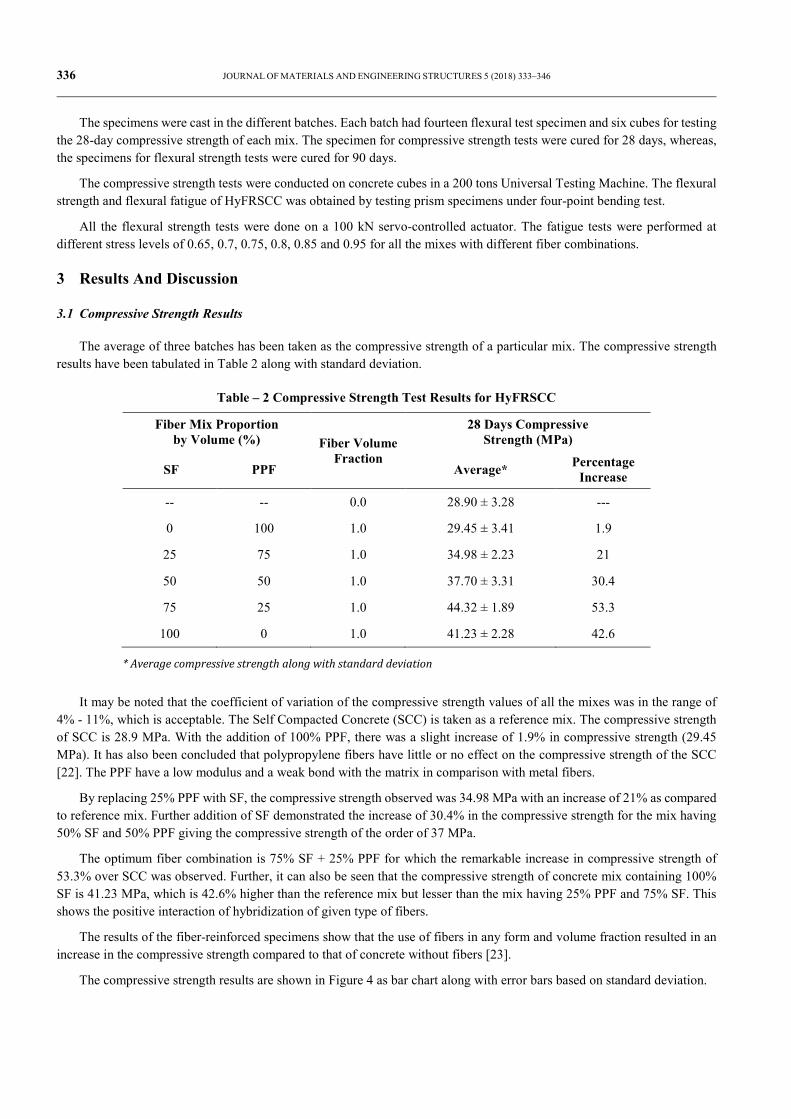
4% - 11%, which is acceptable. The Self Compacted Concrete (SCC) is taken as a reference mix. The compressive strength of SCC is 28.9 MPa. With the addition of 100% PPF, there was a slight increase of 1.9% in compressive strength (29.45 MPa). It has also been concluded that polypropylene fibers have little or no effect on the compressive strength of the SCC [22]. The PPF have a low modulus and a weak bond with the matrix in comparison with metal fibers.
By replacing 25% PPF with SF, the compressive strength observed was 34.98 MPa with an increase of 21% as compared to reference mix. Further addition of SF demonstrated the increase of 30.4% in the compressive strength for the mix having 50% SF and 50% PPF giving the compressive strength of the order of 37 MPa.
The optimum fiber combination is 75% SF + 25% PPF for which the remarkable increase in compressive strength of 53.3% over SCC was observed. Further, it can also be seen that the compressive strength of concrete mix containing 100% SF is 41.23 MPa, which is 42.6% higher than the reference mix but lesser than the mix having 25% PPF and 75% SF. This shows the positive interaction of hybridization of given type of fibers.
The results of the fiber-reinforced specimens show that the use of fibers in any form and volume fraction resulted in an increase in the compressive strength compared to that of concrete without fibers [23].
The compressive strength results are shown in Figure 4 as bar chart along with error bars based on standard deviation.
JOURNAL OF MATERIALS AND ENGINEERING STRUCTURES 5 (2018) 333–346 337
Fig. 4- Compressive Strength of HyFRSCC for Different Fiber Combinations
3.2 Flexural Strength Results
The flexural strength results of HyFRSCC mixes with different combinations of steel and polypropylene fibers are presented in Table 3 along with standard deviation.
Table – 3 Flexural Strength Test Results for HyFRSCC
Fiber Mix Proportion by Volume
Fiber Volume Fraction
Flexural Strength (MPa)
SF PPF Average* % Increase
--- --- 0.0 4.63 ± 0.38 --
0 100 1.0 5.44 ± 0.16 17.4
25 75 1.0 6.28 ± 0.36 35.6
50 50 1.0 6.90 ± 0.17 42.2
75 25 1.0 8.12 ± 0.24 49.0
100 0 1.0 7.34 ± 0.29 58.5
* Average flexural strength along with standard deviation
It may be noted that the coefficient of variation of the flexural strength values of all the mixes was in the range of 2% -
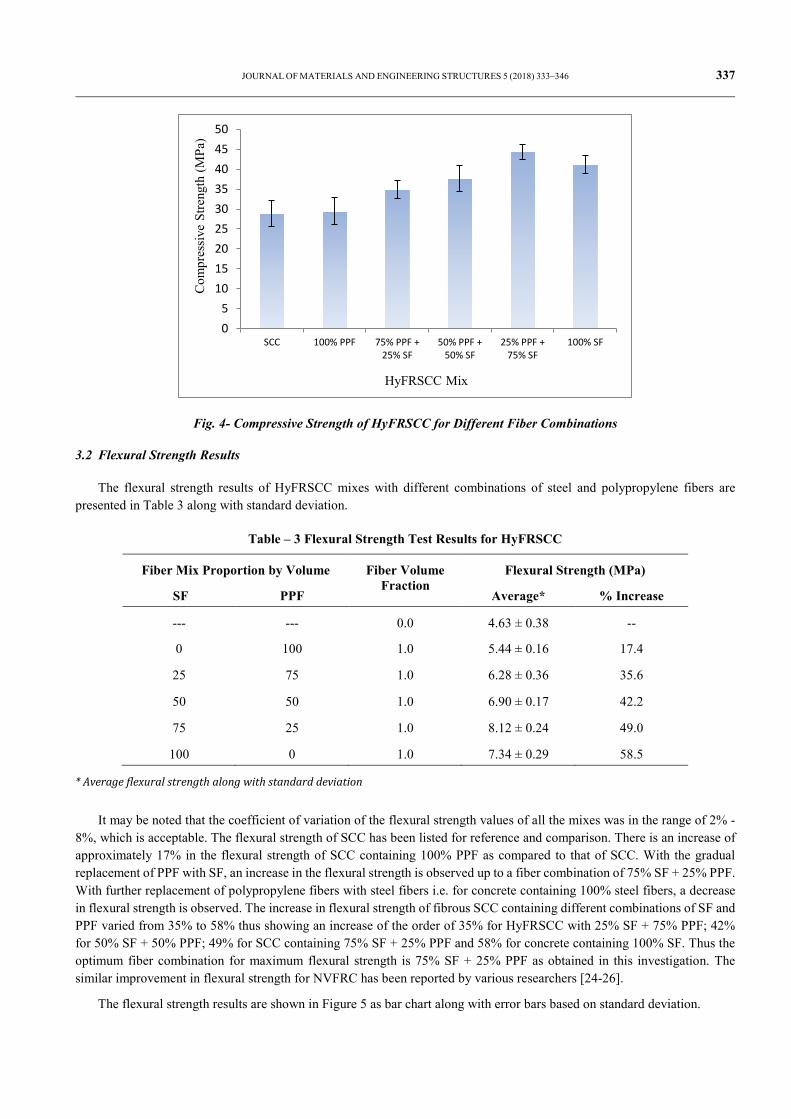
8%, which is acceptable. The flexural strength of SCC has been listed for reference and comparison. There is an increase of approximately 17% in the flexural strength of SCC containing 100% PPF as compared to that of SCC. With the gradual replacement of PPF with SF, an increase in the flexural strength is observed up to a fiber combination of 75% SF + 25% PPF. With further replacement of polypropylene fibers with steel fibers i.e. for concrete containing 100% steel fibers, a decrease in flexural strength is observed. The increase in flexural strength of fibrous SCC containing different combinations of SF and PPF varied from 35% to 58% thus showing an increase of the order of 35% for HyFRSCC with 25% SF + 75% PPF; 42% for 50% SF + 50% PPF; 49% for SCC containing 75% SF + 25% PPF and 58% for concrete containing 100% SF. Thus the optimum fiber combination for maximum flexural strength is 75% SF + 25% PPF as obtained in this investigation. The similar improvement in flexural strength for NVFRC has been reported by various researchers [24-26].
The flexural strength results are shown in Figure 5 as bar chart along with error bars based on standard deviation.
05
101520253035404550
SCC 100% PPF 75% PPF +25% SF
50% PPF +50% SF
25% PPF +75% SF
100% SF
Com
pres
sive
Stre
ngth
(MPa
)
HyFRSCC Mix
338 JOURNAL OF MATERIALS AND ENGINEERING STRUCTURES 5 (2018) 333–346
Fig. 5- Flexural Strength of HyFRSCC for Different Fiber Combinations
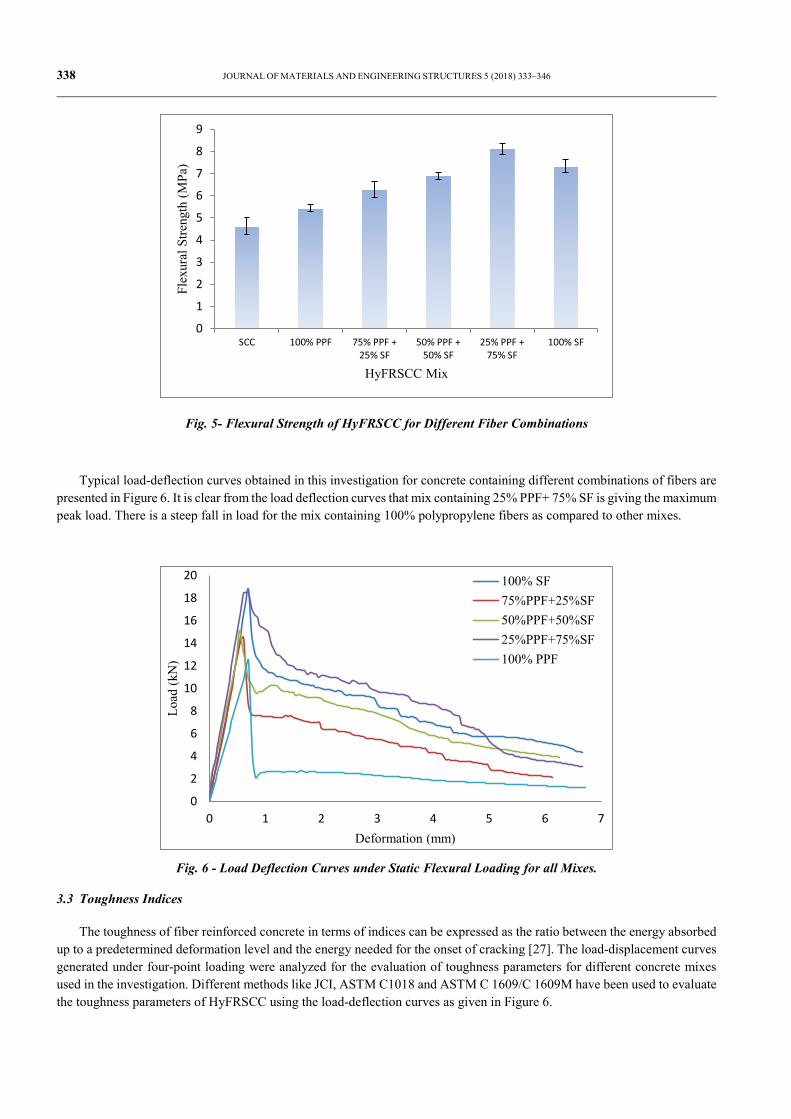
Typical load-deflection curves obtained in this investigation for concrete containing different combinations of fibers are presented in Figure 6. It is clear from the load deflection curves that mix containing 25% PPF+ 75% SF is giving the maximum peak load. There is a steep fall in load for the mix containing 100% polypropylene fibers as compared to other mixes.
Fig. 6 - Load Deflection Curves under Static Flexural Loading for all Mixes.
3.3 Toughness Indices
The toughness of fiber reinforced concrete in terms of indices can be expressed as the ratio between the energy absorbed up to a predetermined deformation level and the energy needed for the onset of cracking [27]. The load-displacement curves generated under four-point loading were analyzed for the evaluation of toughness parameters for different concrete mixes used in the investigation. Different methods like JCI, ASTM C1018 and ASTM C 1609/C 1609M have been used to evaluate the toughness parameters of HyFRSCC using the load-deflection curves as given in Figure 6.
0
1
2
3
4
5
6
7
8
9
SCC 100% PPF 75% PPF +25% SF
50% PPF +50% SF
25% PPF +75% SF
100% SF
Flex
ural
Stre
ngth
(MPa
)
HyFRSCC Mix
0
2
4
6
8
10
12
14
16
18
20
0 1 2 3 4 5 6 7
Load
(kN
)
Deformation (mm)
100% SF75%PPF+25%SF50%PPF+50%SF25%PPF+75%SF100% PPF
JOURNAL OF MATERIALS AND ENGINEERING STRUCTURES 5 (2018) 333–346 339
3.3.1 JCI method
The JCI method provides a single value of toughness. In this method, the toughness value TJCI has been defined as the area under the load-deflection curve up to the deflection of 1/150 of span (δ150). By taking into account the beam size and span, the flexural toughness factor (σb) (equivalent to the average residual strength) is determined as:
JCIb 2
150
T X Lσ
δ X b h= (1)
where TJCI is the energy absorbed (flexural toughness), δ150 is the deflection of 1/150 of span L, b and h are the width and depth of the specimen section respectively [28]. The toughness and flexural toughness factor values calculated as per JCI specifications for all HyFRSCC’s are given in Table 4, and are represented in graph in Figure 7.
Table – 4 Flexural Toughness Indices using JCI Method
Fiber Mix Proportion by Volume (%)
Fiber Volume Fraction
Toughness Indices
JCI METHOD
SF PPF TJCI
σJCI (MPa) TF.C.
0 100 1.0 10.77 1.62 4.38
25 75 1.0 21.40 3.21 4.63
50 50 1.0 27.47 4.12 4.08
75 25 1.0 35.35 5.30 6.54
100 0 1.0 30.67 4.60 6.33
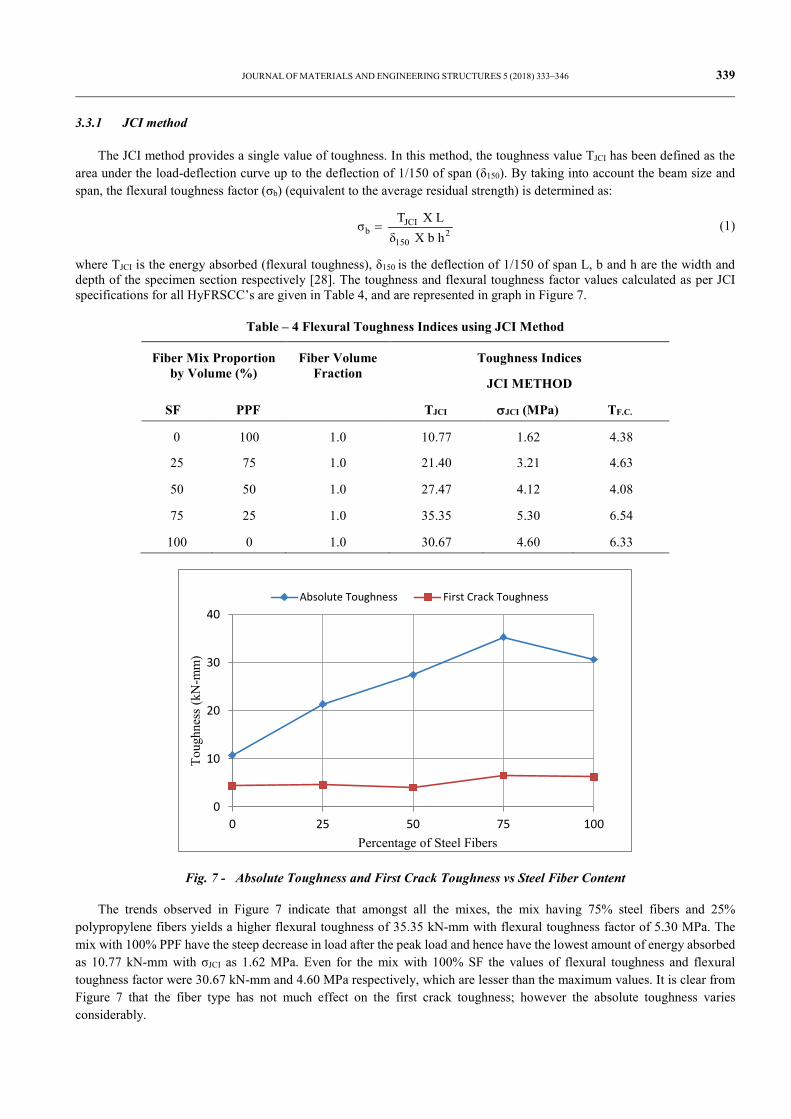
Fig. 7 - Absolute Toughness and First Crack Toughness vs Steel Fiber Content
The trends observed in Figure 7 indicate that amongst all the mixes, the mix having 75% steel fibers and 25% polypropylene fibers yields a higher flexural toughness of 35.35 kN-mm with flexural toughness factor of 5.30 MPa. The mix with 100% PPF have the steep decrease in load after the peak load and hence have the lowest amount of energy absorbed as 10.77 kN-mm with σJCI as 1.62 MPa. Even for the mix with 100% SF the values of flexural toughness and flexural toughness factor were 30.67 kN-mm and 4.60 MPa respectively, which are lesser than the maximum values. It is clear from Figure 7 that the fiber type has not much effect on the first crack toughness; however the absolute toughness varies considerably.
0
10
20
30
40
0 25 50 75 100
Toug
hnes
s (k
N-m
m)
Percentage of Steel Fibers
Absolute Toughness First Crack Toughness
340 JOURNAL OF MATERIALS AND ENGINEERING STRUCTURES 5 (2018) 333–346
3.3.2 ASTM C1018 method
In ASTM C 1018 method, the toughness is expressed as a ratio of the amount of energy required to deflect the beam to a specified deflection, expressed as multiples of the first crack deflection [28]. The evaluation of toughness is made on the basis of dimensionless parameters i.e. toughness indices and residual strength factors [29]. The Residual Strength Factor (RSF) can be obtained directly from toughness indices and represents the level of strength retained after first crack [30]. The toughness indices I5, I10 and I20 are calculated by taking the ratios of the energy absorbed to a certain multiple of first-crack deflection and residual strength factors R5,10, and R10,20 are calculated directly from toughness indices. The toughness calculated at the deflection (δ) is considered the elastic or pre-peak toughness (first-crack toughness), while the other three (at 3δ, 5.5δ and 10.5δ) are considered the post-peak toughness [31]. The residual strength represented by the average post-cracking load that the specimen may carry over a specific deflection interval, are determined as follows:
( )5,10 10 5 20 R I I= − (2)
( )10,20 20 10 10R I I= − (3)
Toughness indices and RSFs for all the mixes using ASTM C-1018 method are given in Table 5.
Table – 5 Flexural Toughness Indices using ASTM C-1018
Fiber Mix Proportion by Volume (%)
Fiber Volume Fraction
ASTM C-1018
Toughness Indices Toughness Index R i
Residual S h F
SF PPF I5 I10 I20 I10 / I5 I20 / I10 R5,10 R10,20
0 100 1.0 1.95 2.88 4.09 1.47 1.42 18.5 12.10
25 75 1.0 3.02 5.02 7.17 1.66 1.43 40.08 21.47
50 50 1.0 3.66 5.96 8.56 1.63 1.44 46.06 26.01
75 25 1.0 3.69 6.28 8.93 1.70 1.42 51.65 26.55
100 0 1.0 3.50 5.89 8.84 1.69 1.50 47.98 29.50
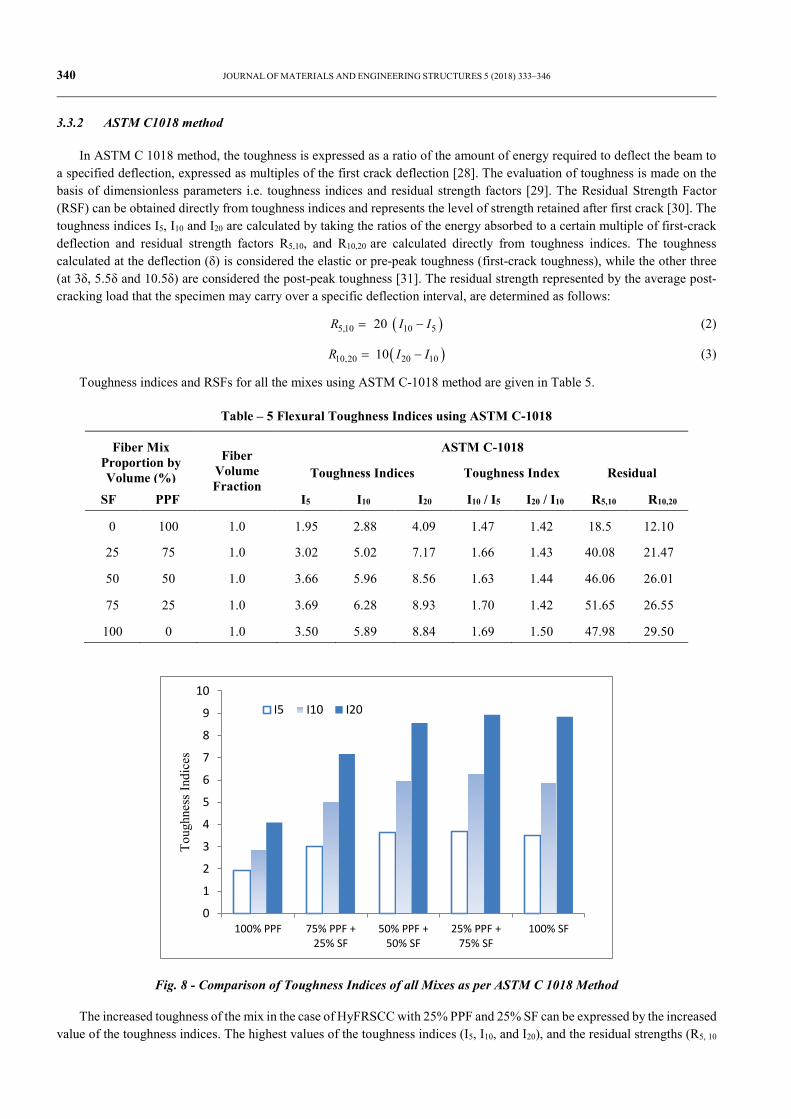
Fig. 8 - Comparison of Toughness Indices of all Mixes as per ASTM C 1018 Method
The increased toughness of the mix in the case of HyFRSCC with 25% PPF and 25% SF can be expressed by the increased value of the toughness indices. The highest values of the toughness indices (I5, I10, and I20), and the residual strengths (R5, 10
0
1
2
3
4
5
6
7
8
9
10
100% PPF 75% PPF +25% SF
50% PPF +50% SF
25% PPF +75% SF
100% SF
Toug
hnes
s In
dice
s
I5 I10 I20
JOURNAL OF MATERIALS AND ENGINEERING STRUCTURES 5 (2018) 333–346 341
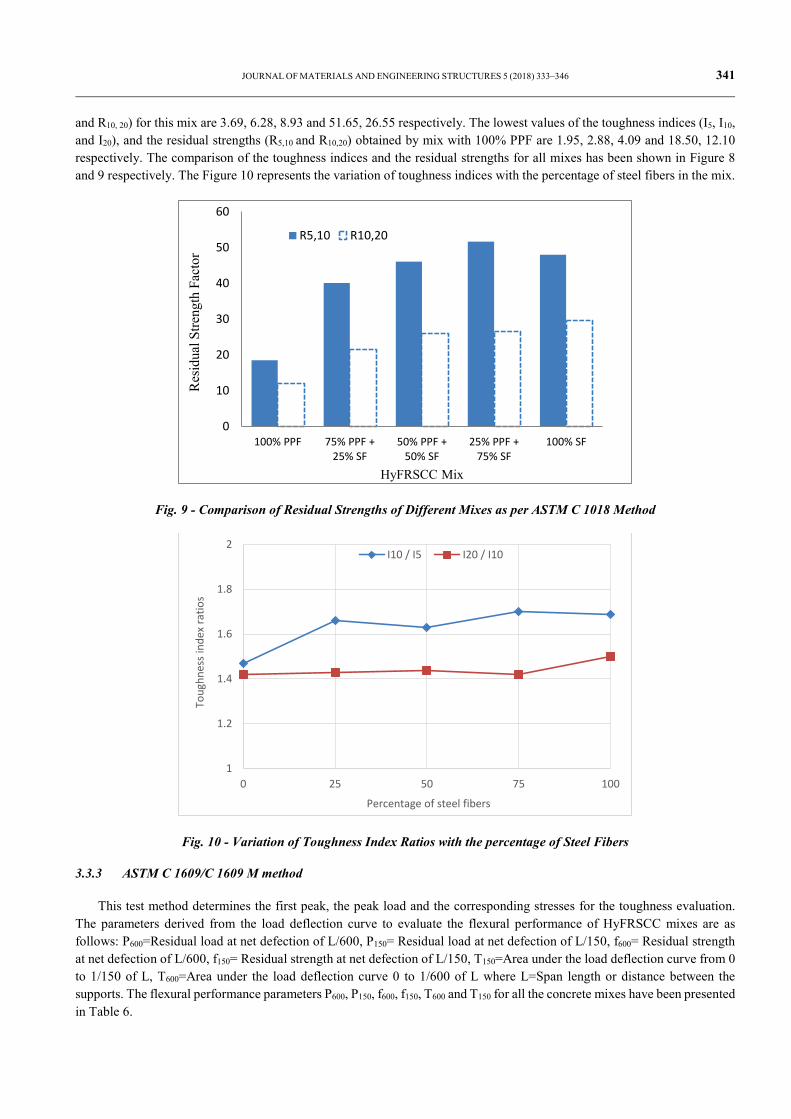
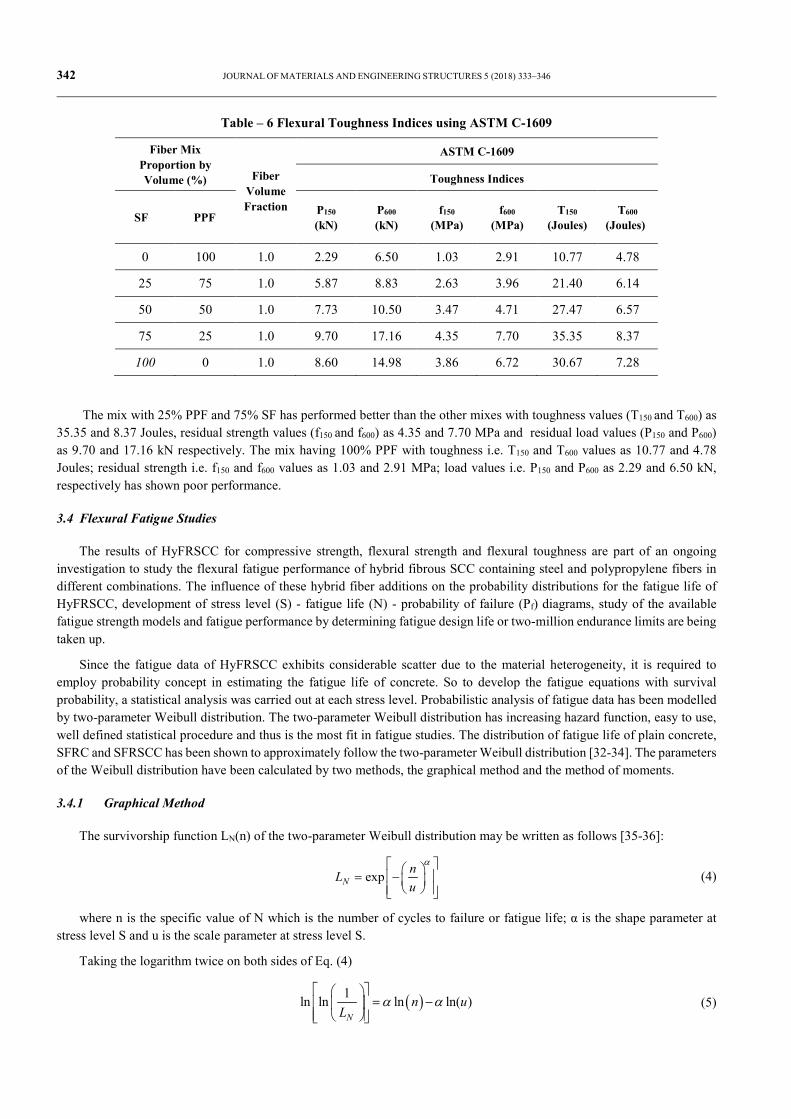
and R10, 20) for this mix are 3.69, 6.28, 8.93 and 51.65, 26.55 respectively. The lowest values of the toughness indices (I5, I10, and I20), and the residual strengths (R5,10 and R10,20) obtained by mix with 100% PPF are 1.95, 2.88, 4.09 and 18.50, 12.10 respectively. The comparison of the toughness indices and the residual strengths for all mixes has been shown in Figure 8 and 9 respectively. The Figure 10 represents the variation of toughness indices with the percentage of steel fibers in the mix.
Fig. 9 - Comparison of Residual Strengths of Different Mixes as per ASTM C 1018 Method
Fig. 10 - Variation of Toughness Index Ratios with the percentage of Steel Fibers
3.3.3 ASTM C 1609/C 1609 M method
This test method determines the first peak, the peak load and the corresponding stresses for the toughness evaluation. The parameters derived from the load deflection curve to evaluate the flexural performance of HyFRSCC mixes are as follows: P600=Residual load at net defection of L/600, P150= Residual load at net defection of L/150, f600= Residual strength at net defection of L/600, f150= Residual strength at net defection of L/150, T150=Area under the load deflection curve from 0 to 1/150 of L, T600=Area under the load deflection curve 0 to 1/600 of L where L=Span length or distance between the supports. The flexural performance parameters P600, P150, f600, f150, T600 and T150 for all the concrete mixes have been presented in Table 6.
0
10
20
30
40
50
60
100% PPF 75% PPF +25% SF
50% PPF +50% SF
25% PPF +75% SF
100% SF
Res
idua
l Stre
ngth
Fac
tor
HyFRSCC Mix
R5,10 R10,20
1
1.2
1.4
1.6
1.8
2
0 25 50 75 100
Toug
hnes
s in
dex
ratio
s
Percentage of steel fibers
I10 / I5 I20 / I10
342 JOURNAL OF MATERIALS AND ENGINEERING STRUCTURES 5 (2018) 333–346
Table – 6 Flexural Toughness Indices using ASTM C-1609 Fiber Mix
Proportion by Volume (%) Fiber
Volume Fraction
ASTM C-1609
Toughness Indices
SF PPF P150 (kN)
P600
(kN) f150
(MPa) f600
(MPa) T150
(Joules) T600
(Joules)
0 100 1.0 2.29 6.50 1.03 2.91 10.77 4.78
25 75 1.0 5.87 8.83 2.63 3.96 21.40 6.14
50 50 1.0 7.73 10.50 3.47 4.71 27.47 6.57
75 25 1.0 9.70 17.16 4.35 7.70 35.35 8.37
100 0 1.0 8.60 14.98 3.86 6.72 30.67 7.28
The mix with 25% PPF and 75% SF has performed better than the other mixes with toughness values (T150 and T600) as 35.35 and 8.37 Joules, residual strength values (f150 and f600) as 4.35 and 7.70 MPa and residual load values (P150 and P600) as 9.70 and 17.16 kN respectively. The mix having 100% PPF with toughness i.e. T150 and T600 values as 10.77 and 4.78 Joules; residual strength i.e. f150 and f600 values as 1.03 and 2.91 MPa; load values i.e. P150 and P600 as 2.29 and 6.50 kN, respectively has shown poor performance.
3.4 Flexural Fatigue Studies
The results of HyFRSCC for compressive strength, flexural strength and flexural toughness are part of an ongoing investigation to study the flexural fatigue performance of hybrid fibrous SCC containing steel and polypropylene fibers in different combinations. The influence of these hybrid fiber additions on the probability distributions for the fatigue life of HyFRSCC, development of stress level (S) - fatigue life (N) - probability of failure (Pf) diagrams, study of the available fatigue strength models and fatigue performance by determining fatigue design life or two-million endurance limits are being taken up.
Since the fatigue data of HyFRSCC exhibits considerable scatter due to the material heterogeneity, it is required to employ probability concept in estimating the fatigue life of concrete. So to develop the fatigue equations with survival probability, a statistical analysis was carried out at each stress level. Probabilistic analysis of fatigue data has been modelled by two-parameter Weibull distribution. The two-parameter Weibull distribution has increasing hazard function, easy to use, well defined statistical procedure and thus is the most fit in fatigue studies. The distribution of fatigue life of plain concrete, SFRC and SFRSCC has been shown to approximately follow the two-parameter Weibull distribution [32-34]. The parameters of the Weibull distribution have been calculated by two methods, the graphical method and the method of moments.
3.4.1 Graphical Method
The survivorship function LN(n) of the two-parameter Weibull distribution may be written as follows [35-36]:
expNnLu
α = −
(4)
where n is the specific value of N which is the number of cycles to failure or fatigue life; α is the shape parameter at stress level S and u is the scale parameter at stress level S.
Taking the logarithm twice on both sides of Eq. (4)
( )1ln ln ln ln( )N
n uL
α α
= −
(5)

JOURNAL OF MATERIALS AND ENGINEERING STRUCTURES 5 (2018) 333–346 343
Equation (5) represents a linear relationship between ( ) 1 / Nln ln L and ( )ln n and is used to verify the two-parameter
Weibull distribution for analysis of the fatigue life of concrete. To obtain a plot between ( ) 1 / Nln ln L and ( )ln n , the
fatigue test results for a given stress level S, are firstly arranged in ascending order of N, the number of cycles to failure and the empirical survivorship function LN is then obtained from the following expression [35-36]:
11N
iLk
= −+
(6)
Where i is a failure order number, and k is a number of fatigue data points at a given stress level S. If at a particular stress level, the test result data follows approximately a linear trend on the graph, then it can be concluded that the Weibull distribution is a reasonable assumption for the statistical analysis of fatigue life data at that particular stress level. The shape parameter α and the scale parameter u can be obtained directly from the regression analysis or graph. The parameters α and u calculated directly from the regression analysis for the fatigue life of HyFRSCC corresponding to all the proportions of steel and polypropylene fibers are listed in Table 7. The maximum value of shape parameter α as per graphical method is 2.7239 for mix having 100% polypropylene fibers at 0.85 stress level and the least value of α is 1.2711 as observed in mix having 100% steel fibers at 0.7 stress level.
3.4.2 Method of Moments
In this method, the parameters are obtained by calculating the appropriate sample moments, such as sample mean and sample variance. The following expressions may be used to obtain the values of shape parameter α and scale parameter u [36]:
( ) 1.08CVα −= (7)
1 1
uT
µ
α
= +
(8)
in which CV = µσ is the coefficient of variation of the fatigue data sample at a particular stress level S, is the standard
deviation and μ is the mean of the test data at particular stress level S.
Γ( ) is gamma function.
The parameters of the Weibull distribution for the fatigue life data of HyFRSCC containing different mix proportions of steel and polypropylene fibers were obtained by the method of moments using Eqs. (7) and (8) and are listed in Table 7.
The preliminary results on HyFRSCC mixes indicate that the probability distribution of fatigue life at a given stress level S, can be approximately represented by the two-parameter Weibull distribution. The parameters of the Weibull distribution have been obtained by both the methods of analysis.
The average values of parameters for different fiber combinations at stress levels of 0.65, 0.7, 0.75, 0.8, 0.85 and 0.9 are given in Table 7. It has been observed that for a particular HyFRSCC mix, the shape parameter increases with the increase of fatigue stress level, which means that the variability in the distribution of fatigue life becomes lesser as one move towards higher fatigue stress levels.
The average values of the shape parameter of the Weibull distribution for the fatigue life of HyFRSCC ranges from 3.0668 to 1.6141 for mix containing 100% polypropylene fibers, from 2.6286 to 1.4853 for mix having 75% PPF + 25% SF, from 2.8786 to 1.5404 for mix having 50% PPF + 50% SF, from 2.4714 to 1.4636 for mix having 25% PPF + 100% SF and from 2.1943 to 2.4147 for mix with 100% SF. It can be seen that as the proportion of polypropylene fibers increases, the value of shape parameter also increases.
The gradual replacement of steel fibers by the polypropylene fibers in the HyFRSCC concrete mix has been proved to significantly reduce the variability in the distribution of fatigue life of HyFRSCC at different stress levels.
σ

344 JOURNAL OF MATERIALS AND ENGINEERING STRUCTURES 5 (2018) 333–346
Table – 7 Values of Weibull Parameters for Fatigue Life of HyFRSCC at Different Stress Levels
Stress Level
‘S’ Parameter
Fiber Mix Proportion
100% PPF 75% PPF
+ 25% SF
50% PPF +
50% SF
25%PPF +
75%SF 100%SF
Graphical Method
0.9
- - 2.4759 2.117 1.8618
u - - 3095 12320 6376
Method of Moment
- - 3.2813 2.8259 2.5268
u - - 3011 11677 6114
Average 2.7239 2.4112 2.8786 2.4714 2.1943
u 3996 8728 3053 11998 6245
Graphical Method
0.85
3.4097 2.8460 2.1563 1.9043 1.7152
u 3918 8585 19497 98227 55271
Method of Moment
3.0668 2.6286 2.5516 2.3253 2.0618
u 3957 8657 19077 95585 53459
Average 2.1977 1.9075 2.3540 2.1148 1.8885
u 32471 60743 19287 96906 54365
Graphical Method
0.80
2.6585 2.3213 1.6747 1.6091 1.5682
u 31658 59149 153650 483140 232842
Method of Moment
2.4281 2.1144 2.2167 1.9963 1.8174
u 32064 59946 147871 467437 226194
Average 1.7987 1.6031 1.9457 1.8027 1.6928
u 155294 291231 150760 475289 229518
Graphical Method
0.75
2.2603 1.9721 1.5465 1.3803 1.3557
u 150160 281682 586309 1190296 1100893
Method of Moment
2.0295 1.7876 1.8212 1.7859 1.649922
u 152727 286456 564938 970320 1055765
Average
1.6533 1.5098 1.6839 1.5831 1.5028
u 370585 690719 575624 1080308 1078329
Graphical Method
0.70
1.9154 1.7592 1.3736 1.1985 1.2711
u 359375 667498 987710 1558900 1206964
Method of Moment
1.7844 1.6345 1.7073 1.7287 1.5582
u 364980 679109 943292 1200066 1143998
Average
1.4640 1.3706 1.5404 1.4636 1.4147
u 969129 1195256 965501 1379483 1175481
Graphical Method
0.65
1.7643 1.5999 - - -
u 936029 1135801 - - -
Method of Moment
1.6141 1.4853 - - -
u 952579 1165528 - - -
Average
2.7239 2.4112 - - -
u 3996 8728 - - -

JOURNAL OF MATERIALS AND ENGINEERING STRUCTURES 5 (2018) 333–346 345
4 Conclusion
It has been observed from the results of this investigation that hybridization of PPF and SF has positive influence on the compressive strength, flexural strength and flexural toughness of the HyFRSCC. There is a remarkable increase in compressive strength and flexural strength of the mix containing 25% PPF + 75% SF as compared to SCC. It has also been seen that the fiber addition has not much influence on the first crack toughness but the absolute toughness is highly influenced by the percentage of different types of fibers. The mix containing 25% PPF + 75% SF has been observed to give best performance in terms of flexural toughness of HyFRSCC. Increase of fiber availability in hybrid fiber system due to the low density non-metallic PPF could be the reason for enhanced flexural toughness. The preliminary results on the flexural fatigue studies on HyFRSCC show that the gradual replacement of SF with PPF results in higher values of the shape parameters of Weibull distribution, which indicates lower variability in test results.
REFERENCES
[1]- C.X. Qian, P. Stroeven, Development of hybrid polypropylene-steel fiber reinforced concrete. Cement Concrete Res. 30(1) (2000) 63-69. doi:10.1016/S0008-8846(99)00202-1
[2]- N. Banthia, N. Nandakumar, Crack growth resistance of hybrid fiber reinforced cement composites. Cement Concrete Comp. 25(1) (2003) 3-9. doi:10.1016/S0958-9465(01)00043-9
[3]- W. Yao, J. Li, K. Wu, Mechanical properties of hybrid fiber-reinforced concrete at low fiber volume fraction. Cement Concrete Res. 33(1) (2003) 23-30. doi:10.1016/S0008-8846(02)00913-4
[4]- A. Sivakumar, M. Santhanam, Mechanical properties of high strength concrete reinforced with metallic and non-metallic fibers. Cement Concrete Comp. 29(8) (2007) 603-608. doi:10.1016/j.cemconcomp.2007.03.006
[5]- M. Hsie, C. Tu, P.S. Song, Mechanical properties of polypropylene hybrid fiber-reinforced concrete. Material Science and Engineering: A. 494(1-2) (2008) 153-157. doi:10.1016/j.msea.2008.05.037
[6]- S.P. Singh, Fatigue strength of hybrid steel-polypropylene fibrous concrete beams in flexure. Procedia Engineering 14(2011) 2446 – 2452. doi:10.1016/j.proeng.2011.07.307
[7]- N. Banthia, M. Sappakittipakorn, Toughness enhancement in steel fiber reinforced concrete through fiber hybridization. Cement Concrete Res. 37(9) (2007) 1366-1372. doi:10.1016/j.cemconres.2007.05.005
[8]- ACI Committee 237, Self Consolidating Concrete - 237R-07. American Concrete Institute, 2007. [9]- Self-Compacting Concrete European Project Group SCCEPG, The european guidelines for self compacting
concrete, specification, production and use. SCCEPG, 2005. [10]- T. Omoto, K. Ozawa, Recommendation for self-compacting concrete. JSCE Concrete Eng. 31 (1999) 77 [11]- K.H. Khayat, Y. Roussel, Testing and performance of fiber-reinforced self-consolidating concrete. In: Proceedings
of First International RILEM Symposium on Self-Compacting Concrete. Stockholm, 1999, pp. 509-521. [12]- P. Groth, D. Nemegeer, The use of steel fibers in self-compacting concrete. In: Proceedings of First International
on Self-Compacting Concrete, Stockholm, 1999, pp. 497-507. [13]- M. Sahmaran, A.Yurtseven, I.O. Yaman, Workability of hybrid fiber reinforced self compacting concrete. Build
Environ. 40(12) (2005) 1672-1677. doi:10.1016/j.buildenv.2004.12.014 [14]- T.M. Grabois, G.C. Cordeiro, R.D.T. Filho, Fresh and hardened-state properties of self-compacting lightweight
concrete reinforced with steel fibers. Constr. Build. Mater. 104(2016) 284–292. doi:10.1016/j.conbuildmat.2015.12.060
[15]- G. Jen, W. Trono, C.P. Ostertag, Self-consolidating hybrid fiber reinforced concrete: Development, properties and composite behaviour. Constr. Build. Mater. 104(2016) 63–71. doi:10.1016/j.conbuildmat.2015.12.062
[16]- N. Su, K.C. Hsu, H.W. Chai, A Simple Mix Design Method for Self Compacting Concrete. Cement Concrete Res. 31(12) (2001) 1799-1807. doi:10.1016/S0008-8846(01)00566-X
[17]- V.V. Karjini, S.B. Anadini, Mixture proportions procedure for Self Compacting Concrete. Indian Concrete J. (2009) 35-41.
[18]- L. Ferrara, Y.D. Park, S. P. Shah, A method for mix-design of fiber reinforced self compacting concrete. Cement Concrete Res. 37(6) (2007) 957-971. doi:10.1016/j.cemconres.2007.03.014
[19]- H. Oucief, J. Zeghiche, M.F. Habita, Hybrid fiber reinforced self compacting concrete: fiber synergy at low volume fiber volume fraction. J. Eng. Appl. Sci. 1(2) (2006) 112–116.
[20]- G. Pons, M. Mouret, M. Alcantara, J.L Granju, Mechanical behaviour of self compacting concrete with hybrid fiber

346 JOURNAL OF MATERIALS AND ENGINEERING STRUCTURES 5 (2018) 333–346
reinforcement. Mater. Struct. 40(2) (2007) 201–210. doi:10.1617/s11527-006-9131-y [21]- A. Jameran, I.S. Ibrahim, S.H.S. Yazan, S.N.A.A. Rahim, Mechanical properties of steel-polypropylene fiber
reinforced concrete under elevated temperature. Procedia Engineering 125 (2015) 818–824. doi:10.1016/j.proeng.2015.11.146
[22]- R. Siddique, G. Kaur, Kunal, Strength and permeation properties of self-compacting concrete containing fly ash and hooked steel fibers. Constr. Build. Mater. 103 (2016) 15–22. doi:10.1016/j.conbuildmat.2015.11.044
[23]- V. Afroughsabet, T. Ozbakkaloglu, Mechanical and durability properties of high strength concrete containing steel and polypropylene fibers. Constr. Build. Mater. 94 (2015) 73–82. doi:10.1016/j.conbuildmat.2015.06.051
[24]- S.P. Singh, A.P. Singh, V. Bajaj, Flexural fatigue strength of hybrid fibrous concrete beams. P. I. Civil Eng – Constr. Mater. 165(2) (2012) 99-110. doi:10.1680/coma.10.0009
[25]- P.B. Shinde, S.V. Pawar, V.P. Kulkarni, Flexural behaviour of hybrid fiber reinforced concrete deep beam and effect of steel polypropylene fiber on mechanical properties of concrete. Int. J. Adv. Res. Sci. Eng. 4(2) (2015) 62 – 73.
[26]- M. Tamil Selvi, T.S. Thandavamoorthy, Load deflection characteristics of steel polypropylene and hybrid fiber reinforced concrete beams. Arch. Civil Eng. 61(1) (2015) 59 – 72. doi:10.1515/ace-2015-0004
[27]- P. Antonaci, P. Bocca, A. Grazzini, In-situ determination of toughness indices of fiber reinforced concrete. Mater. Struct. 39(3) (2006) 283–290. doi:10.1617/s11527-005-9003-x
[28]- J. Tejchman, J. Kozicki, Experimental and theoretical investigations of steel fibrous concrete. Springer Series in Geomechanics and Geoengineering. Springer-Verlag Berlin Heidelberg, 2010.
[29]- M. Skazlić, D. Bjegović, Toughness testing of ultra high performance fiber reinforced concrete. Mater. Struct. 42(8) (2009) 1025–1038. doi:10.1617/s11527-008-9441-3
[30]- ASTM C 1018-97, Standard test method for flexural toughness and first-crack strength of fiber- reinforced concrete (using ream with third-point loading). Annual Book of ASTM Standards, ASTM Committee C-9(1992)514-520, 1997. doi:10.1520/C1018-97
[31]- P. Sukontasukkul, Toughness Evaluation of steel and polypropylene fiber reinforced concrete beams under bending. Thammasat Int. J. Sc. Tech. 9(3) (2004) 35-41.
[32]- ASTM, STP91A, A Guide for Fatigue Testing and the Statistical Analysis of Fatigue Data, ASTM Spec. Tech. Publ. 91-A, Philadelphia, 1963. doi:10.1520/STP91A-EB
[33]- S. Goel, S.P. Singh, P. Singh, Flexural fatigue strength and failure probability of self compacting fiber reinforced concrete. Eng Struct. 40 (2012)131-140. doi:10.1016/j.engstruct.2012.02.035
[34]- S. Goel, S.P. Singh, P. Singh, S.K. Kaushik, Prediction of mean and design fatigue lives of self compacting concrete beam in flexure. J. Inst. Eng. India Ser. A. 93(1) (2012) 55-61. doi:10.1007/s40030-012-0007-6
[35]- B.H. Oh, Fatigue analysis of plain concrete in flexure. J. Struct. Eng. 112(2) (1986) 273-288. doi:10.1061/(ASCE)0733-9445(1986)112:2(273)
[36]- Y. Mohammadi, S.K. Kaushik, Flexural fatigue-life distributions of plain and fibrous concrete at various stress levels. J. Mater. Civil Eng. 17(6) (2005) 650-658. doi:10.1061/(ASCE)0899-1561(2005)17:6(650)


![Effect of stacking sequence on the flexural and fracture ...125-128]-06.pdf · 125 Effect of stacking sequence on the flexural and fracture properties of carbon/basalt/epoxy hybrid](https://img.pdfslide.net/doc/110x75/5abb1a8f7f8b9a321b8c7363/effect-of-stacking-sequence-on-the-flexural-and-fracture-125-128-06pdf125.jpg)