Embed Size (px)
Citation preview
NASA/TM-1998-206565
Flight Stability and Control and Performance Results from the Linear Aerospike SR-71 Experiment (LASRE)
Timothy R. Moes, Brent R. Cobleigh,Timothy H. Cox, Timothy R. Conners,and Kenneth W. IliffDryden Flight Research CenterEdwards, California
Bruce G. PowersAnalytical Services and Materials, Inc.Edwards, California
August 1998

The NASA STI Program Office . . . in Profile
Since its founding, NASA has been dedicatedto the advancement of aeronautics and space science. The NASA Scientific and Technical Information (STI) Program Office plays a keypart in helping NASA maintain thisimportant role.
The NASA STI Program Office is operated byLangley Research Center, the lead center forNASA’s scientific and technical information.The NASA STI Program Office provides access to the NASA STI Database, the largest collectionof aeronautical and space science STI in theworld. The Program Office is also NASA’s institutional mechanism for disseminating theresults of its research and development activities. These results are published by NASA in theNASA STI Report Series, which includes the following report types:
• TECHNICAL PUBLICATION. Reports of completed research or a major significantphase of research that present the results of NASA programs and include extensive dataor theoretical analysis. Includes compilations of significant scientific and technical data and information deemed to be of continuing reference value. NASA’s counterpart of peer-reviewed formal professional papers but has less stringent limitations on manuscriptlength and extent of graphic presentations.
• TECHNICAL MEMORANDUM. Scientificand technical findings that are preliminary orof specialized interest, e.g., quick releasereports, working papers, and bibliographiesthat contain minimal annotation. Does notcontain extensive analysis.
• CONTRACTOR REPORT. Scientific and technical findings by NASA-sponsored contractors and grantees.
• CONFERENCE PUBLICATION. Collected papers from scientific andtechnical conferences, symposia, seminars,or other meetings sponsored or cosponsoredby NASA.
• SPECIAL PUBLICATION. Scientific,technical, or historical information fromNASA programs, projects, and mission,often concerned with subjects havingsubstantial public interest.
• TECHNICAL TRANSLATION. English- language translations of foreign scientific and technical material pertinent toNASA’s mission.
Specialized services that complement the STIProgram Office’s diverse offerings include creating custom thesauri, building customizeddatabases, organizing and publishing researchresults . . . even providing videos.
For more information about the NASA STIProgram Office, see the following:
• Access the NASA STI Program Home Pageat
http://www.sti.nasa.gov
• E-mail your question via the Internet to [email protected]
• Fax your question to the NASA Access HelpDesk at (301) 621-0134
• Telephone the NASA Access Help Desk at(301) 621-0390
• Write to:NASA Access Help DeskNASA Center for AeroSpace Information7121 Standard DriveHanover, MD 21076-1320
NASA/TM-1998-206565
Flight Stability and Control and Performance Results from the Linear Aerospike SR-71 Experiment (LASRE)
Timothy R. Moes, Brent R. Cobleigh,Timothy H. Cox, Timothy R. Conners,and Kenneth W. IliffDryden Flight Research CenterEdwards, California
Bruce G. PowersAnalytical Services and Materials, Inc.Edwards, California
August 1998
National Aeronautics andSpace Administration
Dryden Flight Research CenterEdwards, California 93523-0273
NOTICE
Use of trade names or names of manufacturers in this document does not constitute an official endorsementof such products or manufacturers, either expressed or implied, by the National Aeronautics andSpace Administration.
Available from the following:
NASA Center for AeroSpace Information (CASI) National Technical Information Service (NTIS)7121 Standard Drive 5285 Port Royal RoadHanover, MD 21076-1320 Springfield, VA 22161-2171(301) 621-0390 (703) 487-4650
FLIGHT STABILITY AND CONTROL AND PERFORMANCE RESULTS FROM THE LINEAR AEROSPIKE SR-71 EXPERIMENT (LASRE)
Timothy R. Moes,* Brent R. Cobleigh,* Timothy H. Cox,† Timothy R. Conners,* and Kenneth W. Iliff*
NASA Dryden Flight Research Center,Edwards, CA
Bruce G. Powers† Analytical Services and Materials, Inc.
Edwards, CA
Abstract
The Linear Aerospike SR-71 Experiment (LASRE) ispresently being conducted to test a 20-percent-scaleversion of the Linear Aerospike rocket engine. Thisrocket engine has been chosen to power the X-33 SingleStage to Orbit Technology Demonstrator Vehicle. Therocket engine was integrated into a lifting bodyconfiguration and mounted to the upper surface of anSR-71 aircraft. This paper presents stability and controlresults and performance results from the envelopeexpansion flight tests of the LASRE configuration up toMach 1.8 and compares the results with wind tunnelpredictions. Longitudinal stability and elevator controleffectiveness were well-predicted from wind tunneltests. Zero-lift pitching moment was mispredictedtransonically. Directional stability, dihedral stability, andrudder effectiveness were overpredicted. The SR-71handling qualities were never significantly impacted as aresult of the missed predictions. Performance resultsconfirmed the large amount of wind-tunnel-predictedtransonic drag for the LASRE configuration. This dragincrease made the performance of the vehicle so poorthat acceleration through transonic Mach numbers couldnot be achieved on a hot day without depleting theavailable fuel.
Nomenclature
longitudinal accelerometer output (positive forward), ft/sec2
ax
1American Institute of Aero
*Aerospace Engineer, AIAA member.†Aerospace Engineer.Copyright 1998 by the American Institute of Aeronautics and
Astronautics, Inc. No copyright is asserted in the United States underTitle 17, U.S. Code. The U.S. Government has a royalty-free licenseto exercise all rights under the copyright claimed herein for Govern-mental purposes. All other rights are reserved by the copyright owner.
lateral accelerometer output (positive toward the right), ft/sec2
vertical accelerometer output (positive down), ft/sec2
b SR-71 reference span, 56.7 ft
B.L. butt line, in.
c SR-71 mean aerodynamic chord, 37.7 ft
c.g. center of gravity, percent c
rolling moment coefficient
rolling moment bias, coefficient estimate for = 0°
rolling moment due to nondimensional roll rate derivative, , rad-1
rolling moment due to nondimensional yaw rate derivative, , rad-1
rolling moment due to angle of sideslip derivative, , deg-1
rolling moment due to aileron derivative, , deg-1
rolling moment due to rudder derivative, , deg-1
pitching moment coefficient
pitching moment bias, linear coefficient estimate for = 0°
pitching moment due to nondimensional pitch rate derivative, , rad-1
pitching moment due to angle of attack derivative, , deg-1
pitching moment due to elevon derivative, , deg-1
ay
az
Cl
Clbβ
Clp∂Cl ∂ pb 2V⁄( )⁄
Clr∂Cl ∂⁄ rb 2V⁄( )
Clβ∂Cl ∂β⁄
Clδa∂Cl ∂δa⁄
Clδr∂Cl ∂δr⁄
Cm
Cmbα
Cmq∂Cm ∂ qc 2V⁄( )⁄
Cmα∂Cm ∂α⁄
Cmδe∂Cm ∂δe⁄
nautics and Astronautics
yawing moment coefficient
yawing moment bias, coefficient estimate for = 0°
yawing moment due to nondimensional roll rate derivative, , rad-1
yawing moment due to nondimensional yaw rate derivative, , rad-1
yawing moment due to angle of sideslip derivative, , deg-1
yawing moment due to aileron derivative, , deg-1
yawing moment due to rudder derivative, , deg-1
normal force coefficient
normal force bias, linear coefficient estimate for = 0°
normal force due to nondimensional pitch rate derivative, , rad-1
normal force due to angle of attack derivative, , deg-1
normal force due to elevon derivative, , deg-1
side force coefficient
side force bias, coefficient estimate for = 0°
side force due to nondimensional roll rate derivative, , rad-1
side force due to nondimensional yaw rate derivative, , rad-1
side force due to angle of sideslip derivative, , deg-1
side force due to aileron derivative, , deg-1
side force due to rudder derivative, , deg-1
D drag, lbf
EGT exhaust gas temperature
excess thrust, lbf
F.S. fuselage station, in.
g acceleration of gravity, 32.174 ft/sec2
Hp pressure altitude, ft
roll moment of inertia, slug-ft2
cross product of inertia, slug-ft2
pitch moment of inertia, slug-ft2
yaw moment of inertia, slug-ft2
KEAS equivalent airspeed, knots
LASRE linear aerospike SR-71 experiment
m mass, slugs
p roll rate, rad/sec
roll acceleration, rad/sec2
q pitch rate, rad/sec
dynamic pressure, lb/ft2
pitch acceleration, rad/sec2
r yaw rate, rad/sec
yaw acceleration, rad/sec2
ref aerodynamic moment derivatives corrected to the 25 percent c moment reference (F.S. 900)
S SR-71 reference area, 1605 ft2
T thrust, lb
u body x-axis wind-relative velocity, ft/sec
body x-axis wind-relative acceleration, ft/sec2
v body y-axis wind-relative velocity, ft/sec
body y-axis wind-relative acceleration, ft/sec2
V true airspeed, ft/sec
flightpath wind-relative acceleration, ft/sec2
w body z-axis wind-relative velocity, ft/sec
body z-axis wind-relative acceleration, ft/sec2
wing-reference-plane angle of attack, deg
angle of sideslip, deg
time rate of change of angle of sideslip, rad/sec
aileron deflection, deg
Cn
Cnbβ
Cnp∂Cn ∂ pb 2V⁄( )⁄
Cnr∂Cn ∂ rb 2V⁄( )⁄
Cnβ∂Cn ∂β⁄
Cnδa∂Cn ∂δa⁄
Cnδr∂Cn ∂δr⁄
CN
CNbα
CNq∂CN ∂ qc 2V⁄( )⁄
CNα∂CN ∂α⁄
CNδe∂CN ∂δe⁄
CY
CY bβ
CY p∂CY ∂ pb 2V⁄( )⁄
CY r∂CY ∂ rb 2V⁄( )⁄
CY β∂CY ∂β⁄
CY δa∂CY ∂δa⁄
CY δr∂CY ∂δr⁄
Fe
Ix
I xz
I y
Iz
p
q
q
r
u
v
V
w
α
β
β
δa
2American Institute of Aeronautics and Astronautics
elevon deflection, deg
rudder deflection, deg
pitch angle, deg
time rate of change of pitch attitude, rad/sec
roll angle, deg
time rate of change of roll angle, rad/sec
Introduction
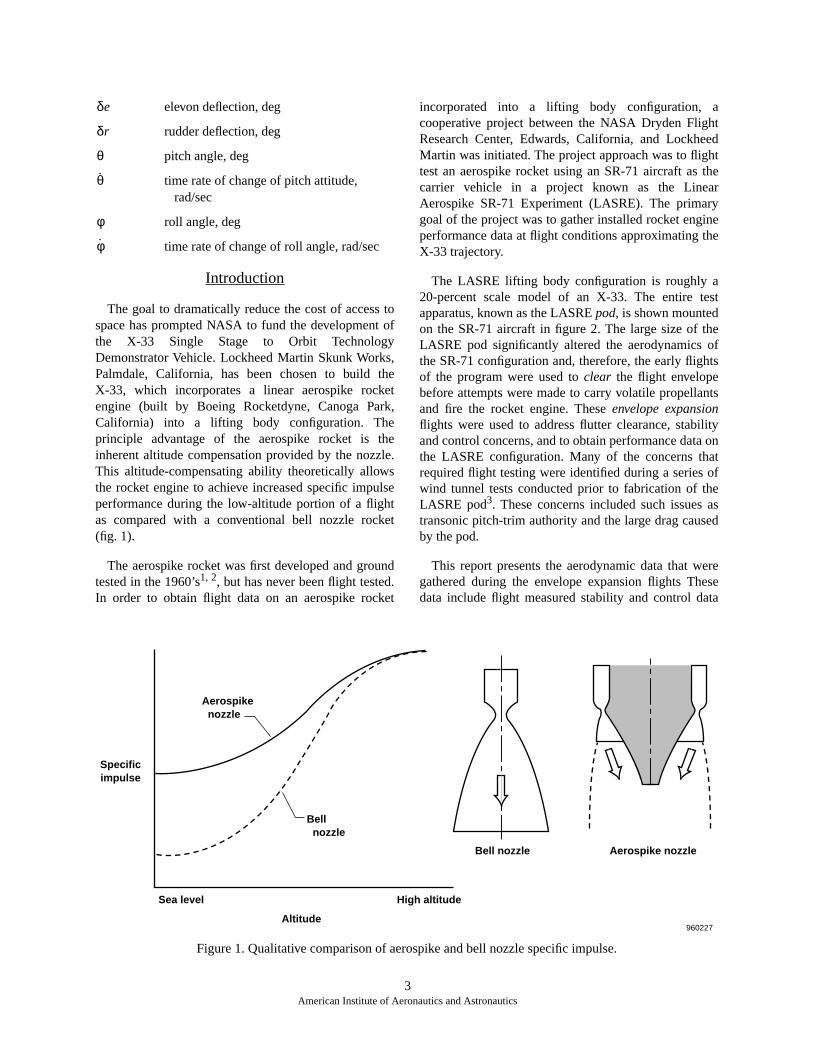
The goal to dramatically reduce the cost of access tospace has prompted NASA to fund the development ofthe X-33 Single Stage to Orbit TechnologyDemonstrator Vehicle. Lockheed Martin Skunk Works,Palmdale, California, has been chosen to build theX-33, which incorporates a linear aerospike rocketengine (built by Boeing Rocketdyne, Canoga Park,California) into a lifting body configuration. Theprinciple advantage of the aerospike rocket is theinherent altitude compensation provided by the nozzle.This altitude-compensating ability theoretically allowsthe rocket engine to achieve increased specific impulseperformance during the low-altitude portion of a flightas compared with a conventional bell nozzle rocket(fig. 1).
The aerospike rocket was first developed and groundtested in the 1960’s1, 2, but has never been flight tested.In order to obtain flight data on an aerospike rocket
incorporated into a lifting body configuration, acooperative project between the NASA Dryden FlightResearch Center, Edwards, California, and LockheedMartin was initiated. The project approach was to flighttest an aerospike rocket using an SR-71 aircraft as thecarrier vehicle in a project known as the LinearAerospike SR-71 Experiment (LASRE). The primarygoal of the project was to gather installed rocket engineperformance data at flight conditions approximating theX-33 trajectory.
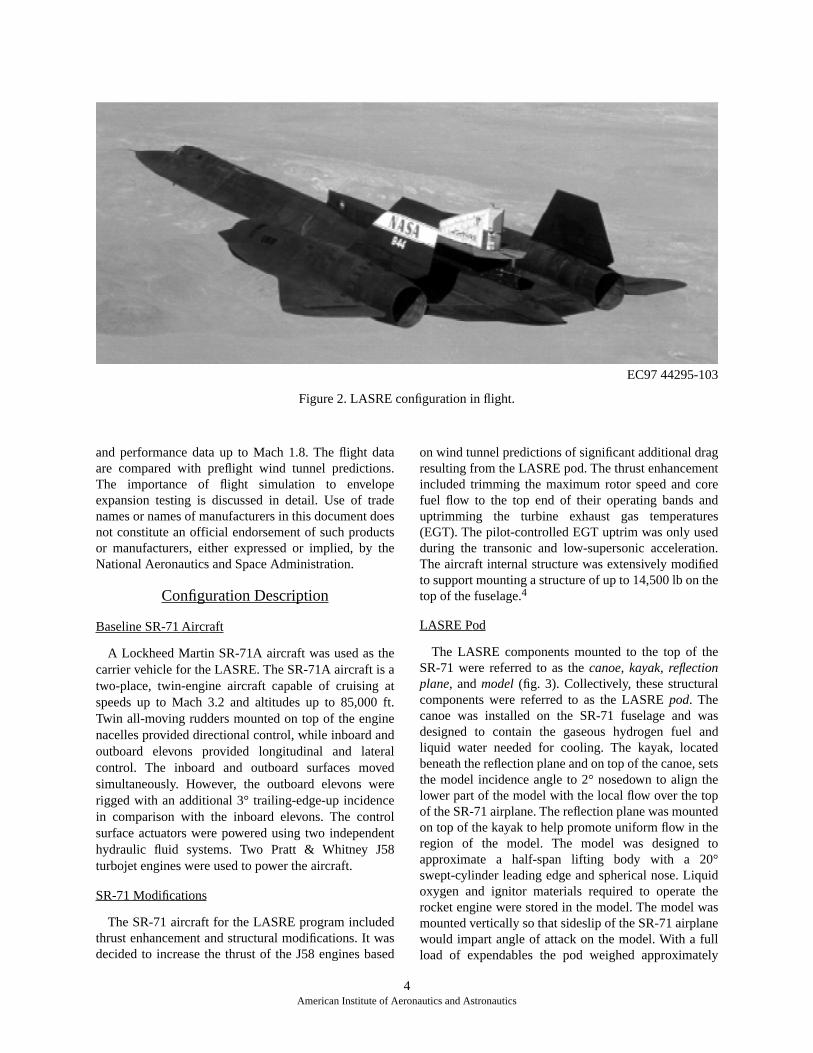
The LASRE lifting body configuration is roughly a20-percent scale model of an X-33. The entire testapparatus, known as the LASRE pod, is shown mountedon the SR-71 aircraft in figure 2. The large size of theLASRE pod significantly altered the aerodynamics ofthe SR-71 configuration and, therefore, the early flightsof the program were used to clear the flight envelopebefore attempts were made to carry volatile propellantsand fire the rocket engine. These envelope expansionflights were used to address flutter clearance, stabilityand control concerns, and to obtain performance data onthe LASRE configuration. Many of the concerns thatrequired flight testing were identified during a series ofwind tunnel tests conducted prior to fabrication of theLASRE pod3. These concerns included such issues astransonic pitch-trim authority and the large drag causedby the pod.
This report presents the aerodynamic data that weregathered during the envelope expansion flights Thesedata include flight measured stability and control data
δe
δr
θ
θ
φ
φ
3American Institute of Aeronautics and Astronautics
Figure 1. Qualitative comparison of aerospike and bell nozzle specific impulse.
Specificimpulse
Altitude
Sea level High altitude
Bell nozzle Aerospike nozzle
Bell nozzle
Aerospike nozzle
960227
EC97 44295-103
Figure 2. LASRE configuration in flight.
and performance data up to Mach 1.8. The flight dataare compared with preflight wind tunnel predictions.The importance of flight simulation to envelopeexpansion testing is discussed in detail. Use of tradenames or names of manufacturers in this document doesnot constitute an official endorsement of such productsor manufacturers, either expressed or implied, by theNational Aeronautics and Space Administration.
Configuration Description
Baseline SR-71 Aircraft
A Lockheed Martin SR-71A aircraft was used as thecarrier vehicle for the LASRE. The SR-71A aircraft is atwo-place, twin-engine aircraft capable of cruising atspeeds up to Mach 3.2 and altitudes up to 85,000 ft.Twin all-moving rudders mounted on top of the enginenacelles provided directional control, while inboard andoutboard elevons provided longitudinal and lateralcontrol. The inboard and outboard surfaces movedsimultaneously. However, the outboard elevons wererigged with an additional 3° trailing-edge-up incidencein comparison with the inboard elevons. The controlsurface actuators were powered using two independenthydraulic fluid systems. Two Pratt & Whitney J58turbojet engines were used to power the aircraft.
SR-71 Modifications
The SR-71 aircraft for the LASRE program includedthrust enhancement and structural modifications. It wasdecided to increase the thrust of the J58 engines based
on wind tunnel predictions of significant additional dragresulting from the LASRE pod. The thrust enhancementincluded trimming the maximum rotor speed and corefuel flow to the top end of their operating bands anduptrimming the turbine exhaust gas temperatures(EGT). The pilot-controlled EGT uptrim was only usedduring the transonic and low-supersonic acceleration.The aircraft internal structure was extensively modifiedto support mounting a structure of up to 14,500 lb on thetop of the fuselage.4
LASRE Pod
The LASRE components mounted to the top of theSR-71 were referred to as the canoe, kayak, reflectionplane, and model (fig. 3). Collectively, these structuralcomponents were referred to as the LASRE pod. Thecanoe was installed on the SR-71 fuselage and wasdesigned to contain the gaseous hydrogen fuel andliquid water needed for cooling. The kayak, locatedbeneath the reflection plane and on top of the canoe, setsthe model incidence angle to 2° nosedown to align thelower part of the model with the local flow over the topof the SR-71 airplane. The reflection plane was mountedon top of the kayak to help promote uniform flow in theregion of the model. The model was designed toapproximate a half-span lifting body with a 20°swept-cylinder leading edge and spherical nose. Liquidoxygen and ignitor materials required to operate therocket engine were stored in the model. The model wasmounted vertically so that sideslip of the SR-71 airplanewould impart angle of attack on the model. With a fullload of expendables the pod weighed approximately
4American Institute of Aeronautics and Astronautics
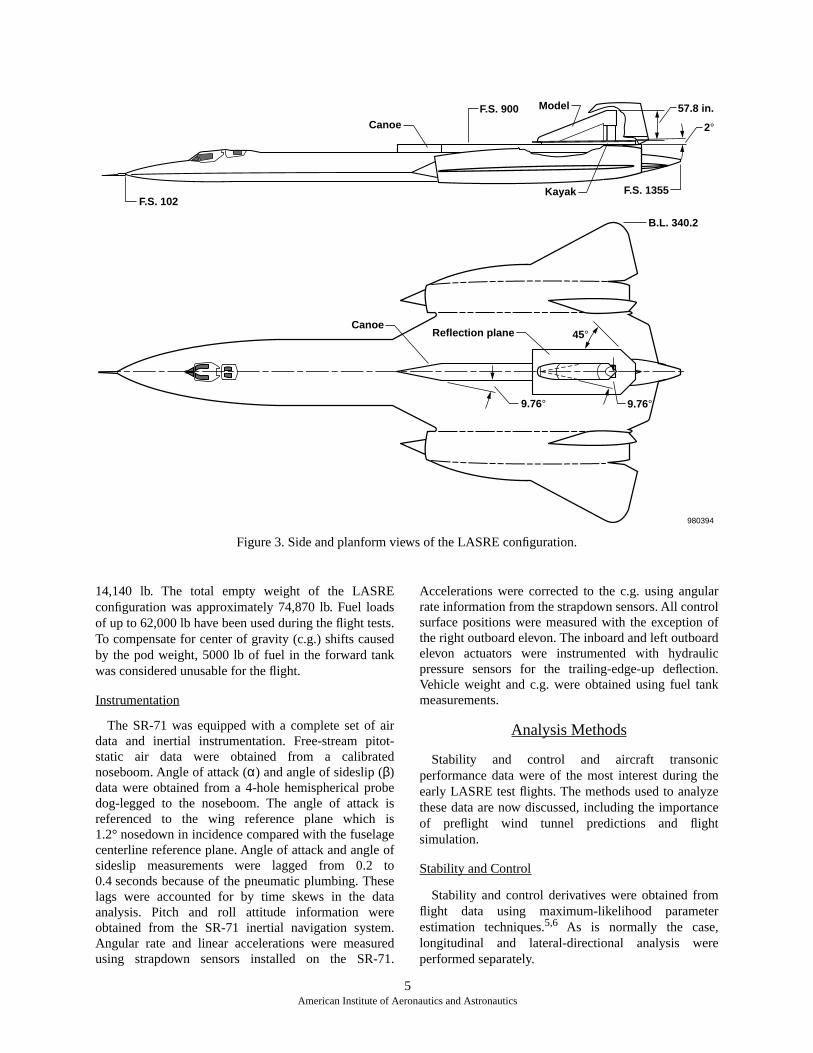
Figure 3. Side and planform views of the LASRE configuration.
Canoe
Model
Kayak
Reflection planeCanoe
9.76°
45°
B.L. 340.2
F.S. 102
F.S. 900
F.S. 1355
57.8 in.
2°
980394
9.76°
14,140 lb. The total empty weight of the LASREconfiguration was approximately 74,870 lb. Fuel loadsof up to 62,000 lb have been used during the flight tests.To compensate for center of gravity (c.g.) shifts causedby the pod weight, 5000 lb of fuel in the forward tankwas considered unusable for the flight.
Instrumentation
The SR-71 was equipped with a complete set of airdata and inertial instrumentation. Free-stream pitot-static air data were obtained from a calibratednoseboom. Angle of attack (α) and angle of sideslip (β)data were obtained from a 4-hole hemispherical probedog-legged to the noseboom. The angle of attack isreferenced to the wing reference plane which is1.2° nosedown in incidence compared with the fuselagecenterline reference plane. Angle of attack and angle ofsideslip measurements were lagged from 0.2 to0.4 seconds because of the pneumatic plumbing. Theselags were accounted for by time skews in the dataanalysis. Pitch and roll attitude information wereobtained from the SR-71 inertial navigation system.Angular rate and linear accelerations were measuredusing strapdown sensors installed on the SR-71.
Accelerations were corrected to the c.g. using angularrate information from the strapdown sensors. All controlsurface positions were measured with the exception ofthe right outboard elevon. The inboard and left outboardelevon actuators were instrumented with hydraulicpressure sensors for the trailing-edge-up deflection.Vehicle weight and c.g. were obtained using fuel tankmeasurements.
Analysis Methods
Stability and control and aircraft transonicperformance data were of the most interest during theearly LASRE test flights. The methods used to analyzethese data are now discussed, including the importanceof preflight wind tunnel predictions and flightsimulation.
Stability and Control
Stability and control derivatives were obtained fromflight data using maximum-likelihood parameterestimation techniques.5,6 As is normally the case,longitudinal and lateral-directional analysis wereperformed separately.
5American Institute of Aeronautics and Astronautics
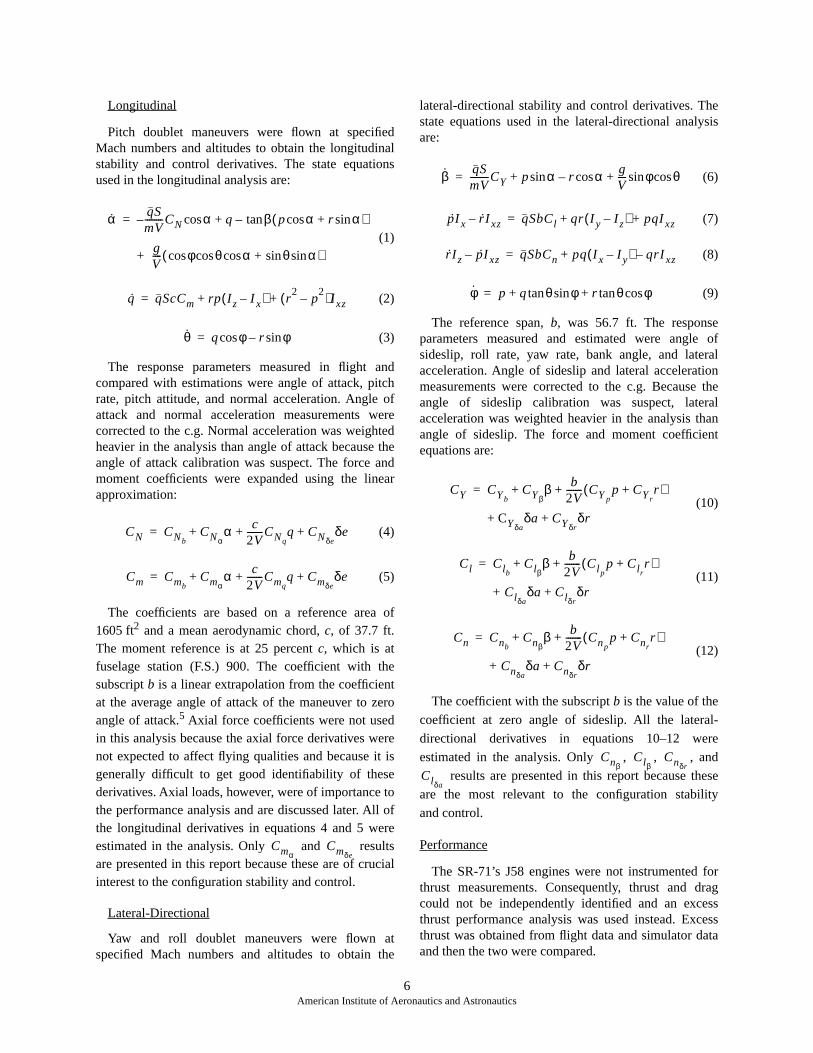
Longitudinal
Pitch doublet maneuvers were flown at specifiedMach numbers and altitudes to obtain the longitudinalstability and control derivatives. The state equationsused in the longitudinal analysis are:
(1)
(2)
(3)
The response parameters measured in flight andcompared with estimations were angle of attack, pitchrate, pitch attitude, and normal acceleration. Angle ofattack and normal acceleration measurements werecorrected to the c.g. Normal acceleration was weightedheavier in the analysis than angle of attack because theangle of attack calibration was suspect. The force andmoment coefficients were expanded using the linearapproximation:
(4)
(5)
The coefficients are based on a reference area of1605 ft2 and a mean aerodynamic chord, c, of 37.7 ft.The moment reference is at 25 percent c, which is atfuselage station (F.S.) 900. The coefficient with thesubscript b is a linear extrapolation from the coefficientat the average angle of attack of the maneuver to zeroangle of attack.5 Axial force coefficients were not usedin this analysis because the axial force derivatives werenot expected to affect flying qualities and because it isgenerally difficult to get good identifiability of thesederivatives. Axial loads, however, were of importance tothe performance analysis and are discussed later. All ofthe longitudinal derivatives in equations 4 and 5 wereestimated in the analysis. Only and resultsare presented in this report because these are of crucialinterest to the configuration stability and control.
Lateral-Directional
Yaw and roll doublet maneuvers were flown atspecified Mach numbers and altitudes to obtain the
lateral-directional stability and control derivatives. Thestate equations used in the lateral-directional analysisare:
(6)
(7)
(8)
(9)
The reference span, b, was 56.7 ft. The responseparameters measured and estimated were angle ofsideslip, roll rate, yaw rate, bank angle, and lateralacceleration. Angle of sideslip and lateral accelerationmeasurements were corrected to the c.g. Because theangle of sideslip calibration was suspect, lateralacceleration was weighted heavier in the analysis thanangle of sideslip. The force and moment coefficientequations are:
(10)
(11)
(12)
The coefficient with the subscript b is the value of the
coefficient at zero angle of sideslip. All the lateral-
directional derivatives in equations 10–12 were
estimated in the analysis. Only , , , and
results are presented in this report because these
are the most relevant to the configuration stability
and control.
Performance
The SR-71’s J58 engines were not instrumented forthrust measurements. Consequently, thrust and dragcould not be independently identified and an excessthrust performance analysis was used instead. Excessthrust was obtained from flight data and simulator dataand then the two were compared.
α qSmV--------CN α q β p α r αsin+cos( )tan–+cos–=
+ gV ---- φ θ α θ α sinsin+coscoscos ( )
q qScCm rp Iz I x–( ) r2
p2
–( )I xz+ +=
θ q φ r φsin–cos=
CN CNbCNα
α c2V-------CNq
q CNδeδe+ + +=
Cm CmbCmα
α c2V-------Cmq
q Cmδeδe+ + +=
CmαCmδe
β qSmV--------CY p α r α g
V---- φ θcossin+cos–sin+=
pI x r I xz– qSbCl qr Iy Iz–( ) pqIxz+ +=
r ˙ I z p ˙ I xz – qSbC n pq I x I y – ( ) qrI xz –+=
φ p q θ φ r θ φcostan+sintan+=
CY CY bCY β
β b2V------- CY p
p CY rr+( )+ +=
+ C Y δ
a δ a C Y
δ
r δ r +
Cl ClbClβ
β b2V------- Clp
p Clr+ r( )+ +=
+ C l δ
a
δ a C l δ
r
δ r +
Cn CnbCnβ
β b2V------- Cnp
p Cnrr+( )+ +=
+ C n δ
a
δ a C n δ
r
δ r +
CnβClβ
CnδrClδa
6American Institute of Aeronautics and Astronautics
Acceleration maneuvers at low angle of attack andnear zero angle of sideslip were used to obtain theperformance data. Excess thrust, , is defined as:5
(13)
where
(14)
Wind Tunnel
Before fabrication of the LASRE pod, wind tunneltesting of a 4-percent scale model was completed toobtain stability and control increments and dragincrements resulting from the pod.3 Wind tunneldata were obtained for the baseline SR-71 and theLASRE configuration. Increments were determined bysubtracting the baseline SR-71 wind tunnel data from theLASRE configuration wind tunnel data.
Simulation
Flight simulation was used extensively in preparationfor the LASRE flight tests. Two simulators were used; aworkstation-based batch simulator and a piloted real-time full-cockpit simulator. Wind-tunnel determinedstability and control increments and drag incrementsresulting from the LASRE pod were added to thebaseline SR-71 aerodynamic model7 for use in thesimulations. The batch simulation was used to obtainstability and control derivatives, trim elevon, and hingemoments predictions for the LASRE configuration. Thereal-time simulation was used for pilot training andperformance estimation.
Results and Discussion
This section of the paper focuses on stabilityand control and performance results. Results arediscussed from baseline SR-71 flight tests without theLASRE pod installed, wind tunnel tests, flightsimulation studies, and flight test with the LASRE podinstalled.
Baseline SR-71 Flight Results
Stability and Control
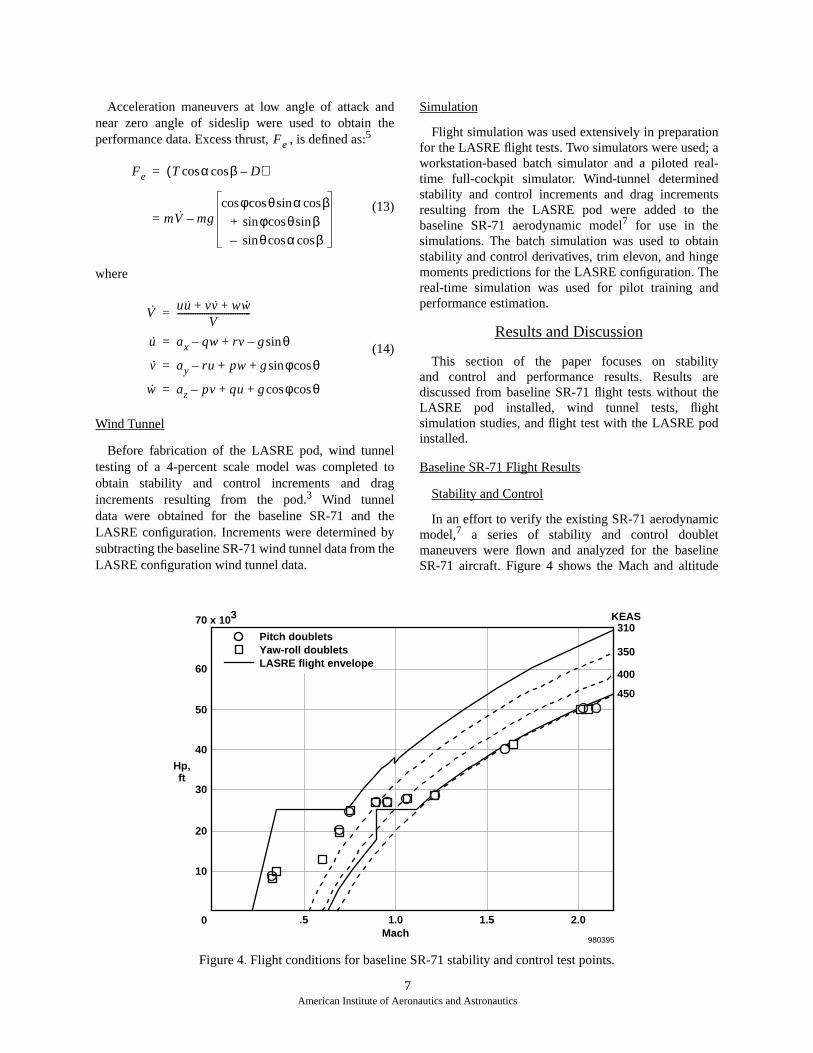
In an effort to verify the existing SR-71 aerodynamicmodel,7 a series of stability and control doubletmaneuvers were flown and analyzed for the baselineSR-71 aircraft. Figure 4 shows the Mach and altitude
Fe
Fe T α β D–coscos( )=
= mV ˙ mg φ θ α β
cossincoscos
+ φ θ β sincossin
– θ α β coscossin
–
Vuu vv ww++
V---------------------------------=
u ax qw– rv g θsin–+=
v ay ru– pw g φ θcossin+ +=
w az pv– qu g φ θcoscos+ +=
7
American Institute of Aeronautics and Astronautics
Figure 4. Flight conditions for baseline SR-71 stability and control test points.
0 .5 1.0Mach
1.5 2.0
10
20
30
40
50
60
70 x 103
980395
Hp,ft
310KEAS
350
400
450
Pitch doubletsYaw-roll doubletsLASRE flight envelope
envelope for the LASRE configuration and the testconditions for the baseline SR-71 aircraft stability andcontrol maneuvers shown in this report. Theflight-derived stability and control derivatives for thebaseline aircraft were compared with estimates from thebatch simulator.
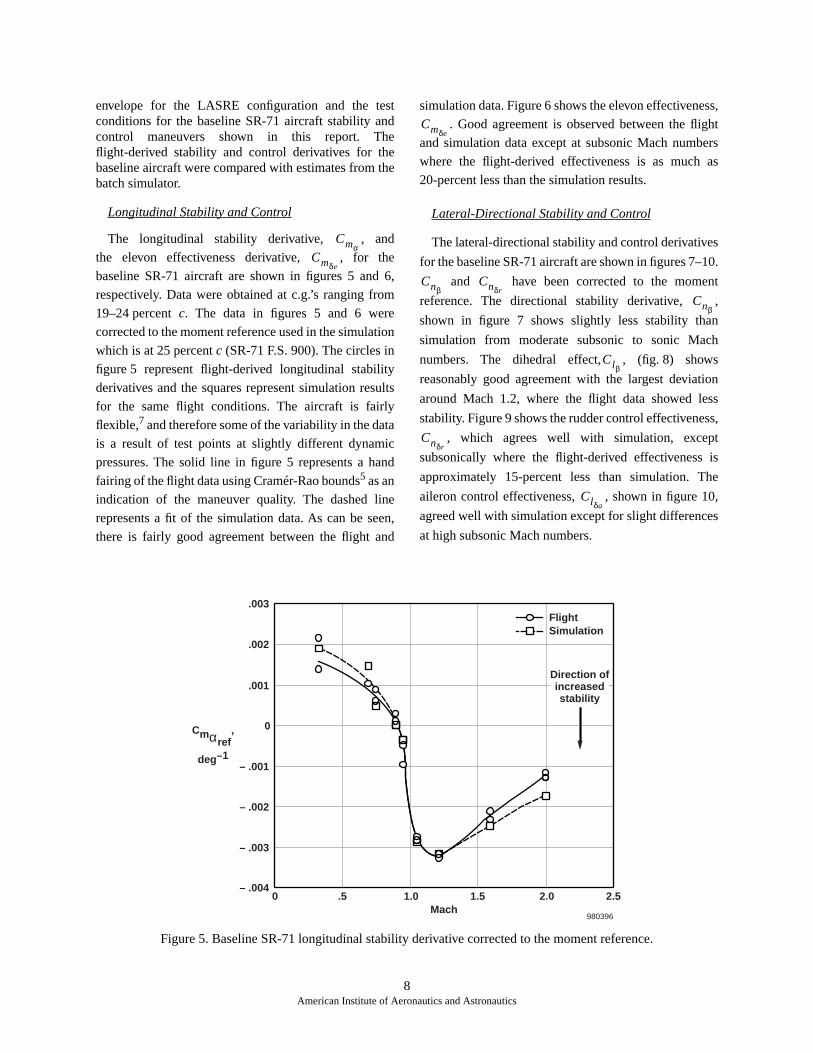
Longitudinal Stability and Control
The longitudinal stability derivative, , and
the elevon effectiveness derivative, , for the
baseline SR-71 aircraft are shown in figures 5 and 6,
respectively. Data were obtained at c.g.’s ranging from
19–24 percent
c
. The data in figures 5 and 6 were
corrected to the moment reference used in the simulation
which is at 25 percent
c
(SR-71 F.S. 900). The circles in
figure 5 represent flight-derived longitudinal stability
derivatives and the squares represent simulation results
for the same flight conditions. The aircraft is fairly
flexible,
7
and therefore some of the variability in the data
is a result of test points at slightly different dynamic
pressures. The solid line in figure 5 represents a hand
fairing of the flight data using Cramér-Rao bounds
5
as an
indication of the maneuver quality. The dashed line
represents a fit of the simulation data. As can be seen,
there is fairly good agreement between the flight and
simulation data. Figure 6 shows the elevon effectiveness,
. Good agreement is observed between the flight
and simulation data except at subsonic Mach numbers
where the flight-derived effectiveness is as much as
20-percent less than the simulation results.
Lateral-Directional Stability and Control
The lateral-directional stability and control derivatives
for the baseline SR-71 aircraft are shown in figures 7–10.
and have been corrected to the moment
reference. The directional stability derivative, ,
shown in figure 7 shows slightly less stability than
simulation from moderate subsonic to sonic Mach
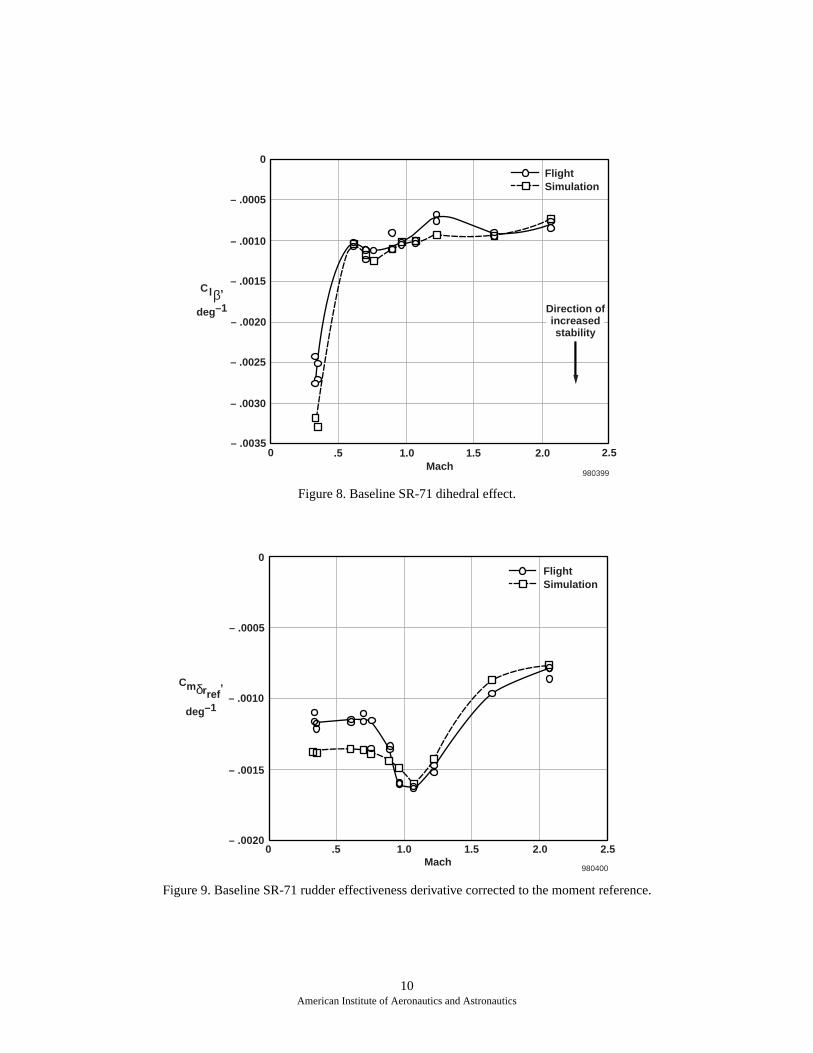
numbers. The dihedral effect, , (fig. 8) shows
reasonably good agreement with the largest deviation
around Mach 1.2, where the flight data showed less
stability. Figure 9 shows the rudder control effectiveness,
, which agrees well with simulation, except
subsonically where the flight-derived effectiveness is
approximately 15-percent less than simulation. The
aileron control effectiveness, , shown in figure 10,
agreed well with simulation except for slight differences
at high subsonic Mach numbers.
CmαCmδe
Cmδe
CnβCnδr
Cnβ
Clβ
Cnδr
Clδa
8American Institute of Aeronautics and Astronautics
Figure 5. Baseline SR-71 longitudinal stability derivative corrected to the moment reference.
0
Cmαref,
deg–1
.5 1.0 1.5 2.0 2.5
FlightSimulation
Mach980396
– .004
– .003
– .002
– .001
0
.001
.003
.002
Direction ofincreasedstability
9
American Institute of Aeronautics and Astronautics
Figure 6. Baseline SR-71 elevon effectiveness derivative corrected to the moment reference.
Figure 7. Baseline SR-71 directional stability derivative corrected to the moment reference.
0
Cmδeref,
deg–1
.5 1.0Mach
2.01.5 2.5
980397
– .006
– .005
– .007
– .008
– .004
– .002
– .001
– .003
0FlightSimulation
0
Cnβref,
deg–1
.5 1.0 1.5 2.0 2.5Mach
980398
.0005
.0010
.0020
.0015
.0025FlightSimulation
Direction ofincreasedstability
10
American Institute of Aeronautics and Astronautics
Figure 8. Baseline SR-71 dihedral effect.
Figure 9. Baseline SR-71 rudder effectiveness derivative corrected to the moment reference.
0
Clβ,
deg–1
.5 1.0 1.5 2.0 2.5
FlightSimulation
Mach980399
– .0035
– .0030
– .0025
– .0020
– .0015
– .0010
– .0005
0
Direction ofincreasedstability
0
Cmδrref,
deg–1
.5 1.0Mach
2.01.5 2.5
980400
– .0015
– .0020
– .0010
– .0005
0FlightSimulation
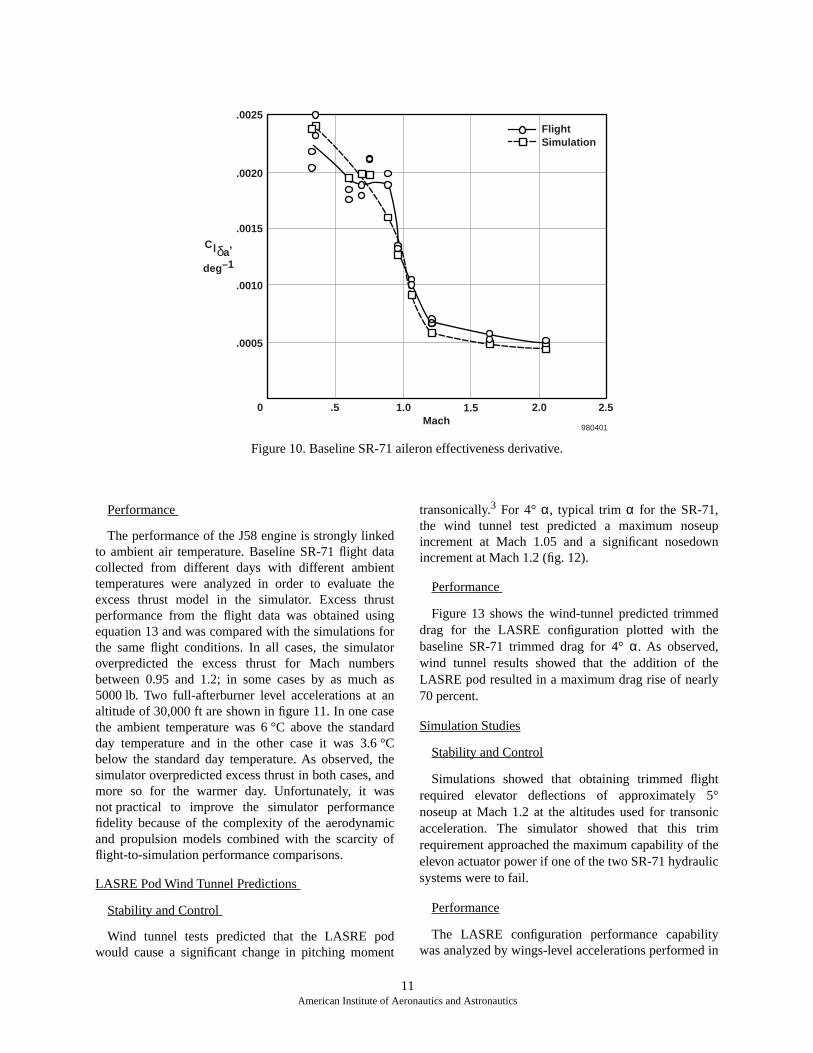
Figure 10. Baseline SR-71 aileron effectiveness derivative.
0
Clδa,
deg–1
.5 1.0 1.5 2.0 2.5Mach
980401
.0005
.0010
.0020
.0015
.0025FlightSimulation
Performance
The performance of the J58 engine is strongly linkedto ambient air temperature. Baseline SR-71 flight datacollected from different days with different ambienttemperatures were analyzed in order to evaluate theexcess thrust model in the simulator. Excess thrustperformance from the flight data was obtained usingequation 13 and was compared with the simulations forthe same flight conditions. In all cases, the simulatoroverpredicted the excess thrust for Mach numbersbetween 0.95 and 1.2; in some cases by as much as5000 lb. Two full-afterburner level accelerations at analtitude of 30,000 ft are shown in figure 11. In one casethe ambient temperature was 6 °C above the standardday temperature and in the other case it was 3.6 °Cbelow the standard day temperature. As observed, thesimulator overpredicted excess thrust in both cases, andmore so for the warmer day. Unfortunately, it wasnot practical to improve the simulator performancefidelity because of the complexity of the aerodynamicand propulsion models combined with the scarcity offlight-to-simulation performance comparisons.
LASRE Pod Wind Tunnel Predictions
Stability and Control
Wind tunnel tests predicted that the LASRE podwould cause a significant change in pitching moment
transonically.3 For 4° α, typical trim α for the SR-71,the wind tunnel test predicted a maximum noseupincrement at Mach 1.05 and a significant nosedownincrement at Mach 1.2 (fig. 12).
Performance
Figure 13 shows the wind-tunnel predicted trimmeddrag for the LASRE configuration plotted with thebaseline SR-71 trimmed drag for 4° α. As observed,wind tunnel results showed that the addition of theLASRE pod resulted in a maximum drag rise of nearly70 percent.
Simulation Studies
Stability and Control
Simulations showed that obtaining trimmed flightrequired elevator deflections of approximately 5°noseup at Mach 1.2 at the altitudes used for transonicacceleration. The simulator showed that this trimrequirement approached the maximum capability of theelevon actuator power if one of the two SR-71 hydraulicsystems were to fail.
Performance
The LASRE configuration performance capabilitywas analyzed by wings-level accelerations performed in
11American Institute of Aeronautics and Astronautics
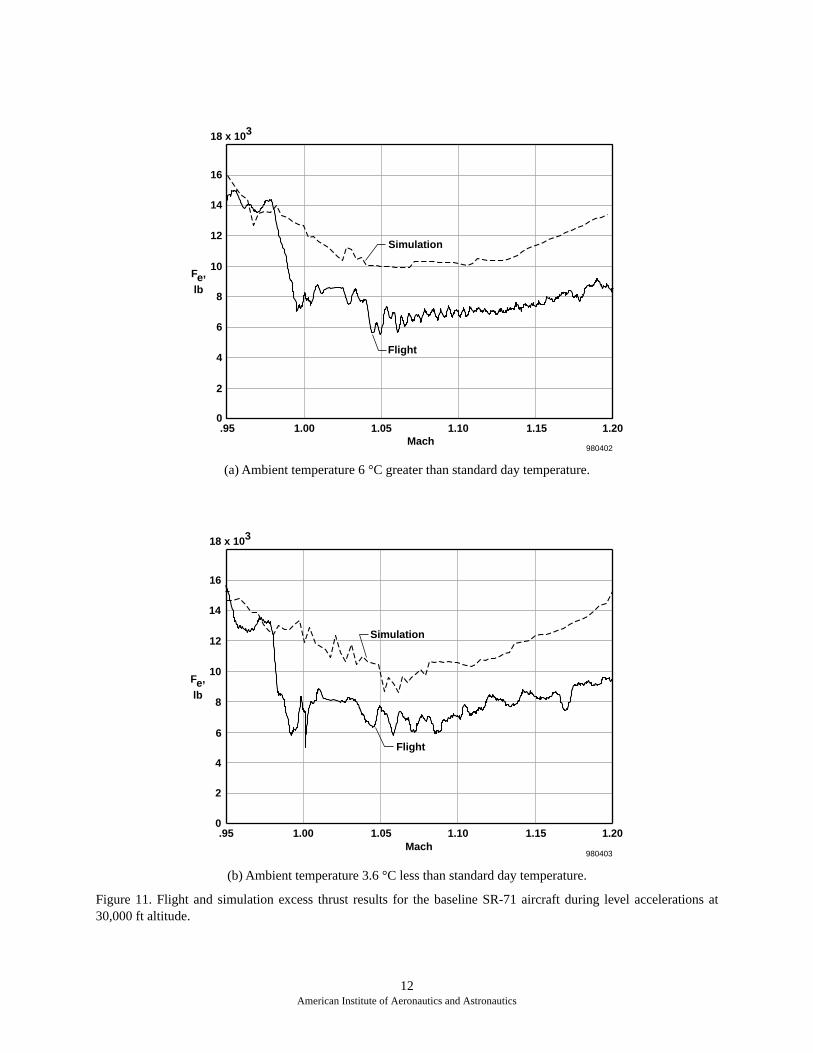
(a) Ambient temperature 6 °C greater than standard day temperature.
(b) Ambient temperature 3.6 °C less than standard day temperature.
Figure 11. Flight and simulation excess thrust results for the baseline SR-71 aircraft during level accelerations at30,000 ft altitude.
.95 1.00 1.05 1.10 1.15 1.20
Simulation
980402Mach
0
2
4
6
8
10
12
14
16
18 x 103
Fe,
lb
Flight
.95 1.00 1.05 1.10 1.15 1.20
Simulation
Flight
980403Mach
0
2
4
6
8
10
12
14
16
18 x 103
Fe,
lb
12American Institute of Aeronautics and Astronautics
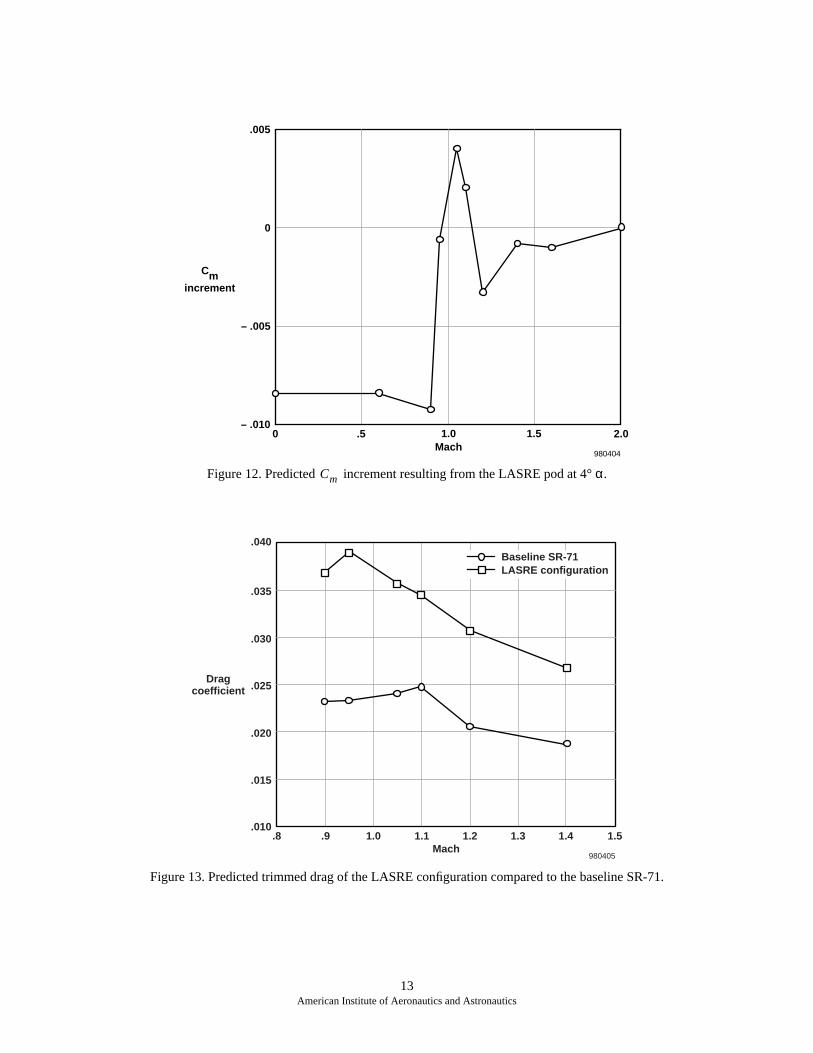
Figure 12. Predicted increment resulting from the LASRE pod at 4°
α
.
Figure 13. Predicted trimmed drag of the LASRE configuration compared to the baseline SR-71.
– .010
– .005
0
.005
1.0Mach
1.5 2.0.50
980404
Cmincrement
Cm
.8 1.0.9 1.1Mach
1.41.2 1.3 1.5
980405
.015
.010
.020
.025
.035
.040
.030
Dragcoefficient
Baseline SR-71LASRE configuration
13American Institute of Aeronautics and Astronautics
the simulator using the standard day atmospherictemperature profile.
8
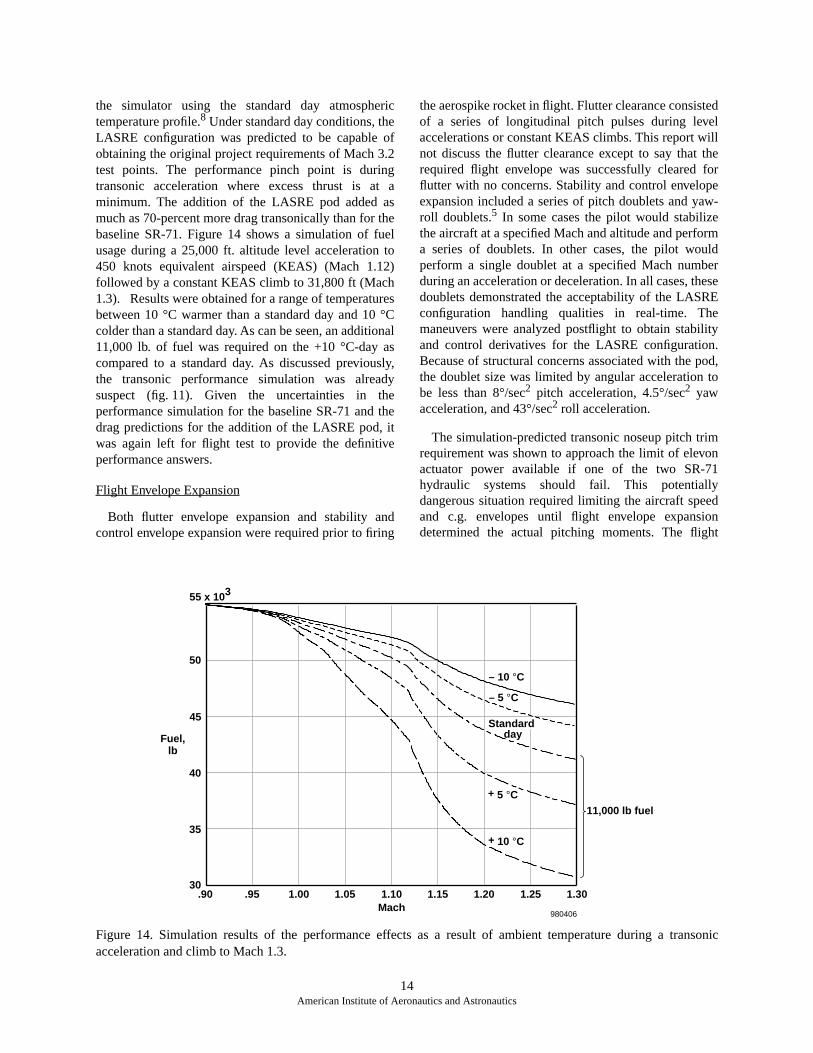
Under standard day conditions, theLASRE configuration was predicted to be capable ofobtaining the original project requirements of Mach 3.2test points. The performance pinch point is duringtransonic acceleration where excess thrust is at aminimum. The addition of the LASRE pod added asmuch as 70-percent more drag transonically than for thebaseline SR-71. Figure 14 shows a simulation of fuelusage during a 25,000 ft. altitude level acceleration to450 knots equivalent airspeed (KEAS) (Mach 1.12)followed by a constant KEAS climb to 31,800 ft (Mach1.3). Results were obtained for a range of temperaturesbetween 10 °C warmer than a standard day and 10 °Ccolder than a standard day. As can be seen, an additional11,000 lb. of fuel was required on the +10 °C-day ascompared to a standard day. As discussed previously,the transonic performance simulation was alreadysuspect (fig. 11). Given the uncertainties in theperformance simulation for the baseline SR-71 and thedrag predictions for the addition of the LASRE pod, itwas again left for flight test to provide the definitiveperformance answers.
Flight Envelope Expansion
Both flutter envelope expansion and stability andcontrol envelope expansion were required prior to firing
the aerospike rocket in flight. Flutter clearance consistedof a series of longitudinal pitch pulses during levelaccelerations or constant KEAS climbs. This report willnot discuss the flutter clearance except to say that therequired flight envelope was successfully cleared forflutter with no concerns. Stability and control envelopeexpansion included a series of pitch doublets and yaw-roll doublets.
5
In some cases the pilot would stabilizethe aircraft at a specified Mach and altitude and performa series of doublets. In other cases, the pilot wouldperform a single doublet at a specified Mach numberduring an acceleration or deceleration. In all cases, thesedoublets demonstrated the acceptability of the LASREconfiguration handling qualities in real-time. Themaneuvers were analyzed postflight to obtain stabilityand control derivatives for the LASRE configuration.Because of structural concerns associated with the pod,the doublet size was limited by angular acceleration tobe less than 8°/sec2 pitch acceleration, 4.5°/sec2 yawacceleration, and 43°/sec2 roll acceleration.
The simulation-predicted transonic noseup pitch trimrequirement was shown to approach the limit of elevonactuator power available if one of the two SR-71hydraulic systems should fail. This potentiallydangerous situation required limiting the aircraft speedand c.g. envelopes until flight envelope expansiondetermined the actual pitching moments. The flight
14American Institute of Aeronautics and Astronautics
Figure 14. Simulation results of the performance effects as a result of ambient temperature during a transonicacceleration and climb to Mach 1.3.
.90
Fuel,lb
.95 1.00 1.05 1.10Mach
1.15 1.20
980406
1.25
– 10 °C
– 5 °C
+ 10 °C
+ 5 °C11,000 lb fuel
1.30
55 x 103
45
50
40
35
30
Standard day
envelope was limited to avoid a flight configuration thatcould not recover from a failure of one of the twohydraulic systems. For this reason, instrumentation wasadded to the inboard elevons and to the left outboardelevon to measure hydraulic actuator pressures for theelevon trailing-edge-up deflections. Real-time flightmonitoring of these hydraulic pressures was done toensure that the aircraft would not fly into a flight regimewhere it could become hinge-moment limited in theevent of one hydraulic system failure.
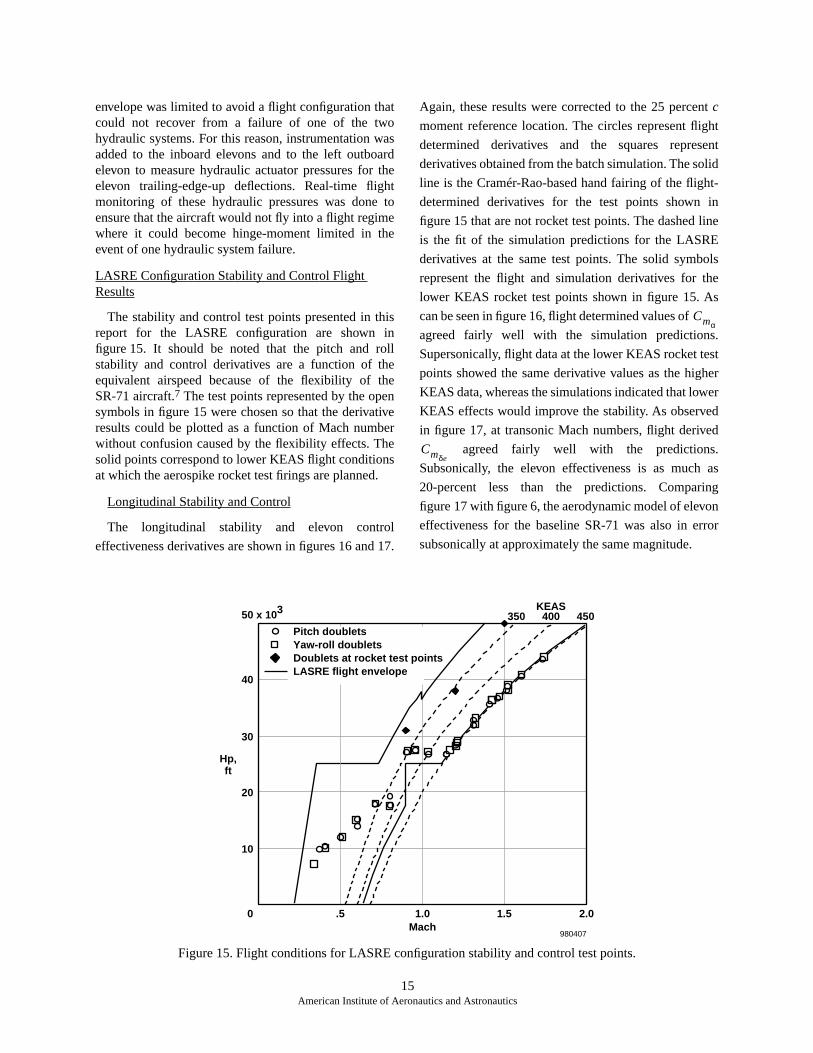
LASRE Configuration Stability and Control Flight Results
The stability and control test points presented in thisreport for the LASRE configuration are shown infigure 15. It should be noted that the pitch and rollstability and control derivatives are a function of theequivalent airspeed because of the flexibility of theSR-71 aircraft.7 The test points represented by the opensymbols in figure 15 were chosen so that the derivativeresults could be plotted as a function of Mach numberwithout confusion caused by the flexibility effects. Thesolid points correspond to lower KEAS flight conditionsat which the aerospike rocket test firings are planned.
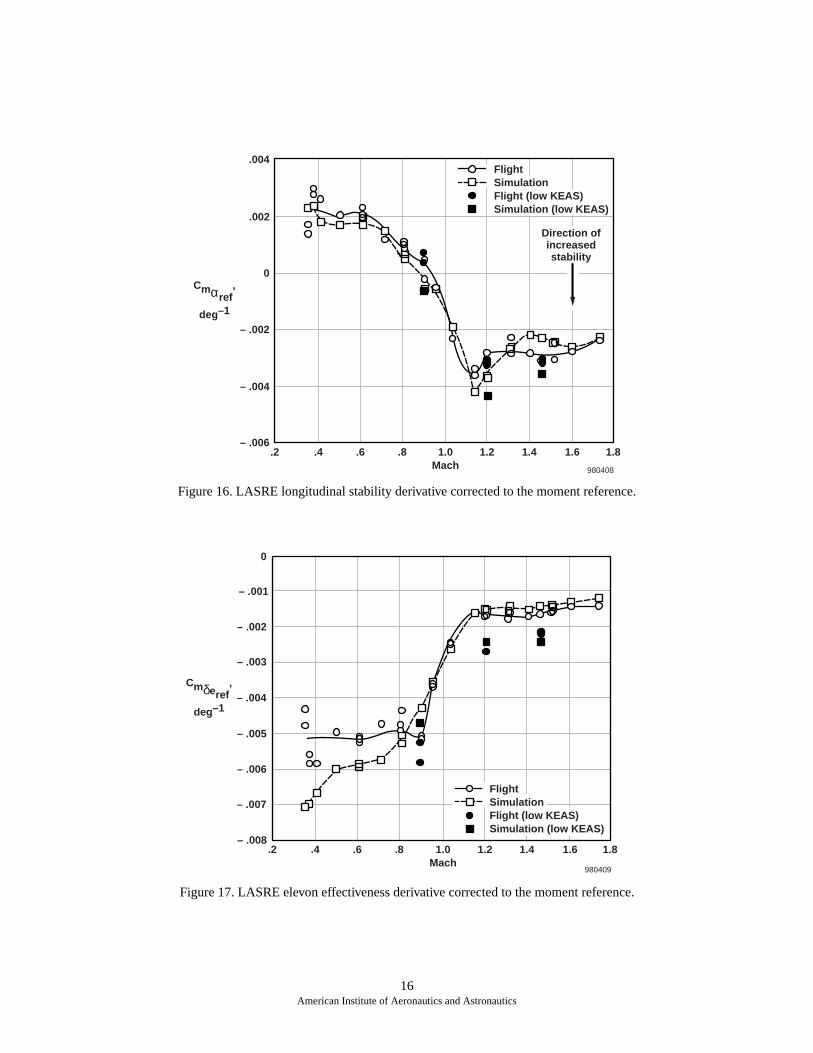
Longitudinal Stability and Control
The longitudinal stability and elevon control
effectiveness derivatives are shown in figures 16 and 17.
Again, these results were corrected to the 25 percent c
moment reference location. The circles represent flight
determined derivatives and the squares represent
derivatives obtained from the batch simulation. The solid
line is the Cramér-Rao-based hand fairing of the flight-
determined derivatives for the test points shown in
figure 15 that are not rocket test points. The dashed line
is the fit of the simulation predictions for the LASRE
derivatives at the same test points. The solid symbols
represent the flight and simulation derivatives for the
lower KEAS rocket test points shown in figure 15. As
can be seen in figure 16, flight determined values of
agreed fairly well with the simulation predictions.
Supersonically, flight data at the lower KEAS rocket test
points showed the same derivative values as the higher
KEAS data, whereas the simulations indicated that lower
KEAS effects would improve the stability. As observed
in figure 17, at transonic Mach numbers, flight derived
agreed fairly well with the predictions.
Subsonically, the elevon effectiveness is as much as
20-percent less than the predictions. Comparing
figure 17 with figure 6, the aerodynamic model of elevon
effectiveness for the baseline SR-71 was also in error
subsonically at approximately the same magnitude.
Cmα
Cmδe
15American Institute of Aeronautics and Astronautics
Figure 15. Flight conditions for LASRE configuration stability and control test points.
0 .5 1.0Mach
1.5 2.0
10
20
30
40
50 x 103
980407
Hp,ft
350 400 450KEAS
Pitch doubletsYaw-roll doubletsDoublets at rocket test pointsLASRE flight envelope
16American Institute of Aeronautics and Astronautics
Figure 16. LASRE longitudinal stability derivative corrected to the moment reference.
Figure 17. LASRE elevon effectiveness derivative corrected to the moment reference.
.2
Cmαref,
deg–1
.4 .6 .8 1.0Mach
1.2 1.61.4 1.8
980408
– .004
– .006
– .002
.002
0
.004
Direction ofincreasedstability
FlightSimulationFlight (low KEAS)Simulation (low KEAS)
.2
Cmδeref,
deg–1
.4 .6 .8 1.0Mach
1.2 1.61.4 1.8
980409
– .007
– .006
– .008
– .005
– .003
– .002
– .004
– .001
0
FlightSimulationFlight (low KEAS)Simulation (low KEAS)
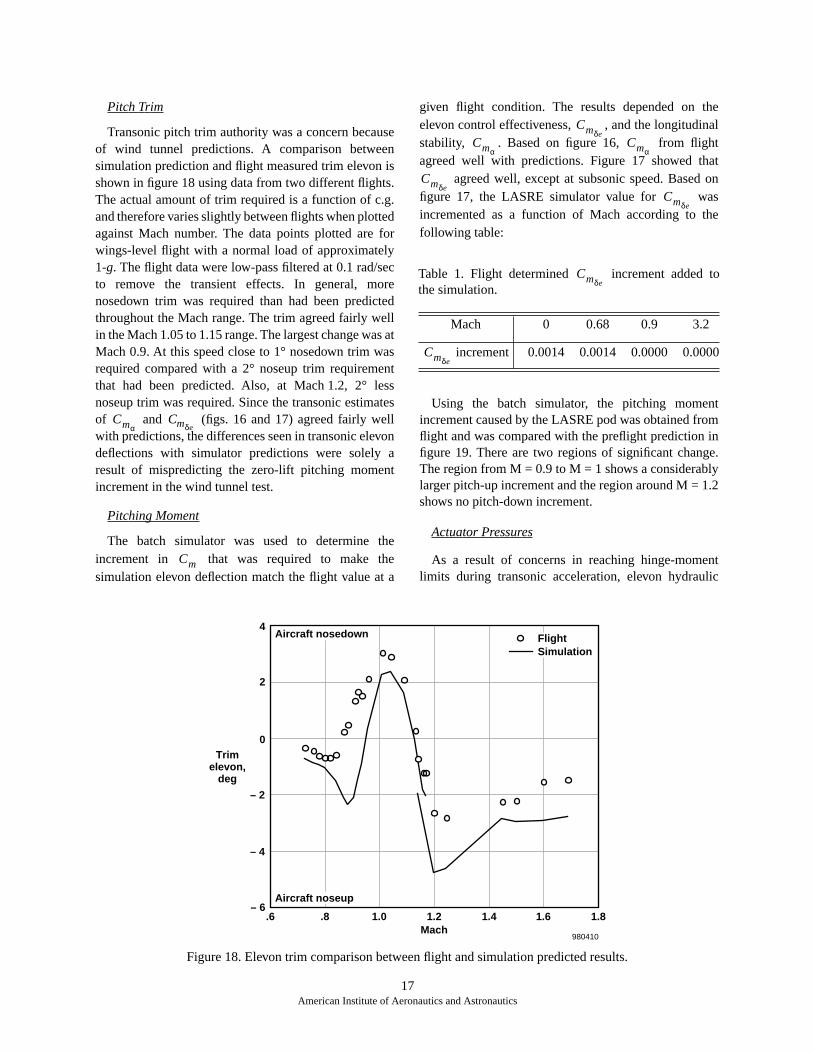
Pitch Trim
Transonic pitch trim authority was a concern becauseof wind tunnel predictions. A comparison betweensimulation prediction and flight measured trim elevon isshown in figure 18 using data from two different flights.The actual amount of trim required is a function of c.g.and therefore varies slightly between flights when plottedagainst Mach number. The data points plotted are forwings-level flight with a normal load of approximately1-g. The flight data were low-pass filtered at 0.1 rad/secto remove the transient effects. In general, morenosedown trim was required than had been predictedthroughout the Mach range. The trim agreed fairly wellin the Mach 1.05 to 1.15 range. The largest change was atMach 0.9. At this speed close to 1° nosedown trim wasrequired compared with a 2° noseup trim requirementthat had been predicted. Also, at Mach 1.2, 2° lessnoseup trim was required. Since the transonic estimatesof and (figs. 16 and 17) agreed fairly wellwith predictions, the differences seen in transonic elevondeflections with simulator predictions were solely aresult of mispredicting the zero-lift pitching momentincrement in the wind tunnel test.
Pitching Moment
The batch simulator was used to determine theincrement in that was required to make thesimulation elevon deflection match the flight value at a
given flight condition. The results depended on theelevon control effectiveness, , and the longitudinalstability, . Based on figure 16, from flightagreed well with predictions. Figure 17 showed that
agreed well, except at subsonic speed. Based onfigure 17, the LASRE simulator value for wasincremented as a function of Mach according to thefollowing table:
Using the batch simulator, the pitching momentincrement caused by the LASRE pod was obtained fromflight and was compared with the preflight prediction infigure 19. There are two regions of significant change.The region from M = 0.9 to M = 1 shows a considerablylarger pitch-up increment and the region around M = 1.2shows no pitch-down increment.
Actuator Pressures
As a result of concerns in reaching hinge-momentlimits during transonic acceleration, elevon hydraulic
CmαCmδe
Cm
Table 1. Flight determined increment added tothe simulation.
Mach 0 0.68 0.9 3.2
increment 0.0014 0.0014 0.0000 0.0000
CmδeCmα
Cmα
CmδeCmδe
Cmδe
Cmδe
17American Institute of Aeronautics and Astronautics
Figure 18. Elevon trim comparison between flight and simulation predicted results.
– 6
– 4
– 2
0
2
4
Trimelevon,
deg
.6 .8 1.0 1.2Mach
1.4 1.6 1.8
980410
Aircraft noseup
FlightSimulation
Aircraft nosedown
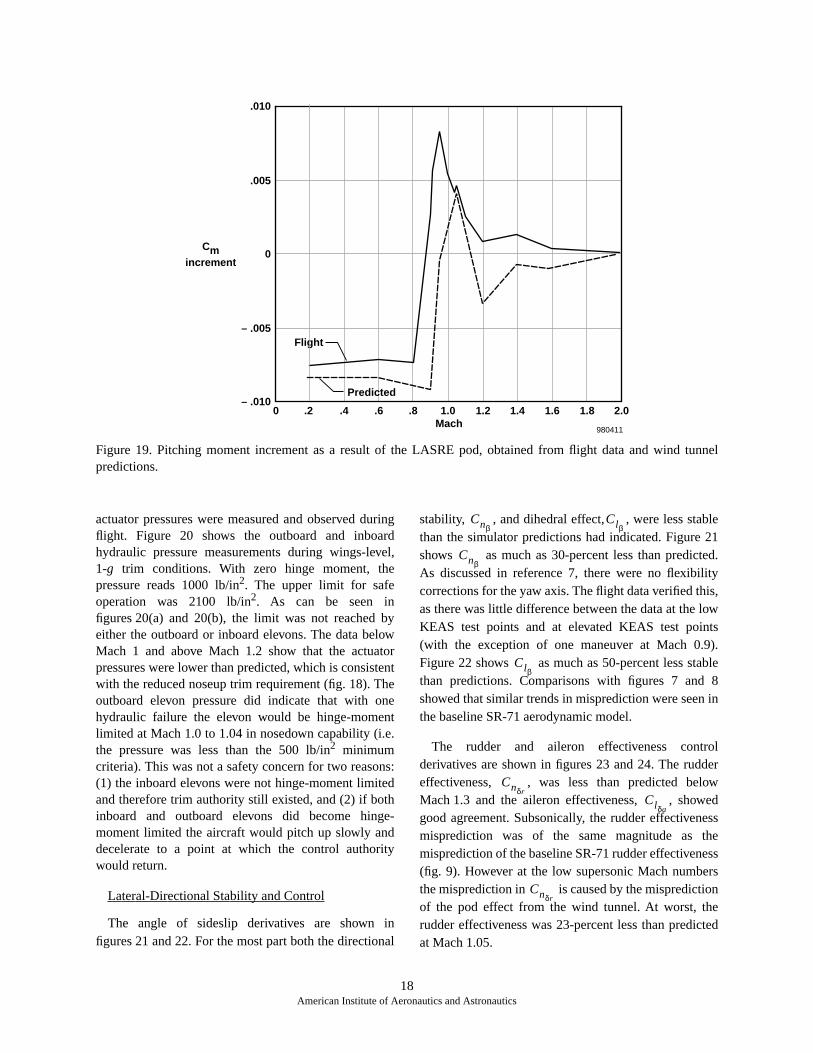
Figure 19. Pitching moment increment as a result of the LASRE pod, obtained from flight data and wind tunnelpredictions.
0
– .005
.010
.005
– .010
Mach.20
Predicted
Flight
Cmincrement
980411
.4 .6 .8 1.0 1.41.2 1.6 1.8 2.0
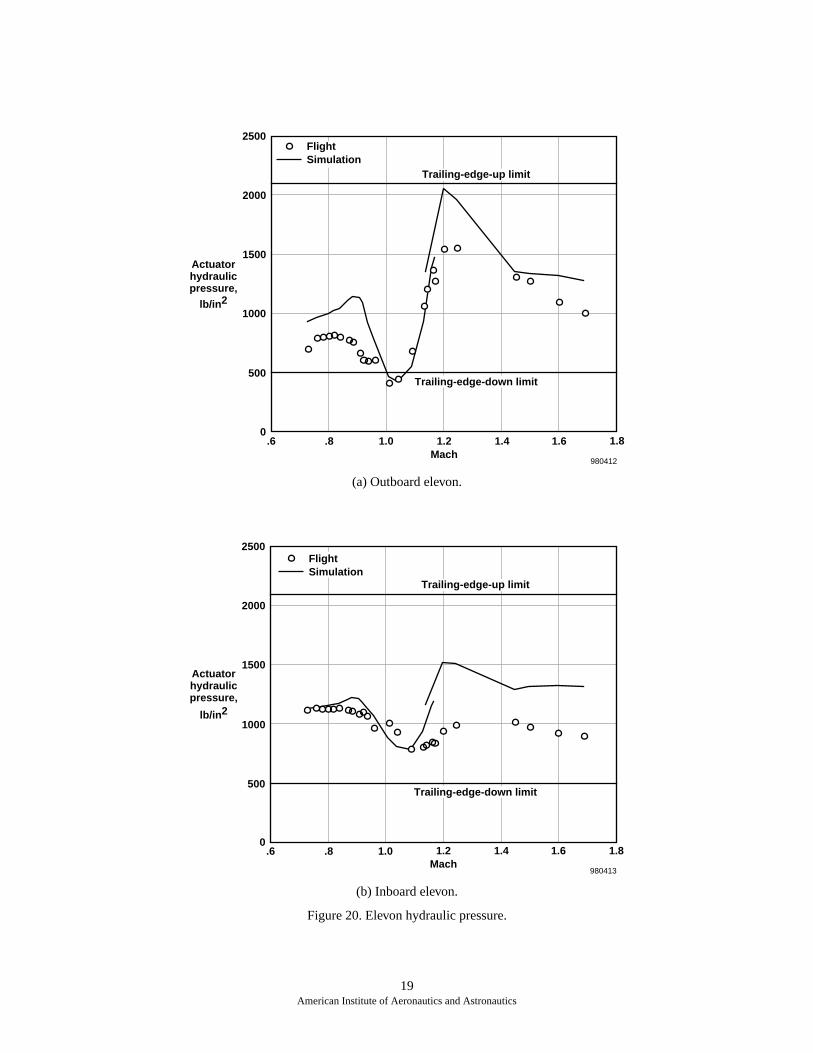
actuator pressures were measured and observed duringflight. Figure 20 shows the outboard and inboardhydraulic pressure measurements during wings-level,1-g trim conditions. With zero hinge moment, thepressure reads 1000 lb/in2. The upper limit for safeoperation was 2100 lb/in2. As can be seen infigures 20(a) and 20(b), the limit was not reached byeither the outboard or inboard elevons. The data belowMach 1 and above Mach 1.2 show that the actuatorpressures were lower than predicted, which is consistentwith the reduced noseup trim requirement (fig. 18). Theoutboard elevon pressure did indicate that with onehydraulic failure the elevon would be hinge-momentlimited at Mach 1.0 to 1.04 in nosedown capability (i.e.the pressure was less than the 500 lb/in2 minimumcriteria). This was not a safety concern for two reasons:(1) the inboard elevons were not hinge-moment limitedand therefore trim authority still existed, and (2) if bothinboard and outboard elevons did become hinge-moment limited the aircraft would pitch up slowly anddecelerate to a point at which the control authoritywould return.
Lateral-Directional Stability and Control
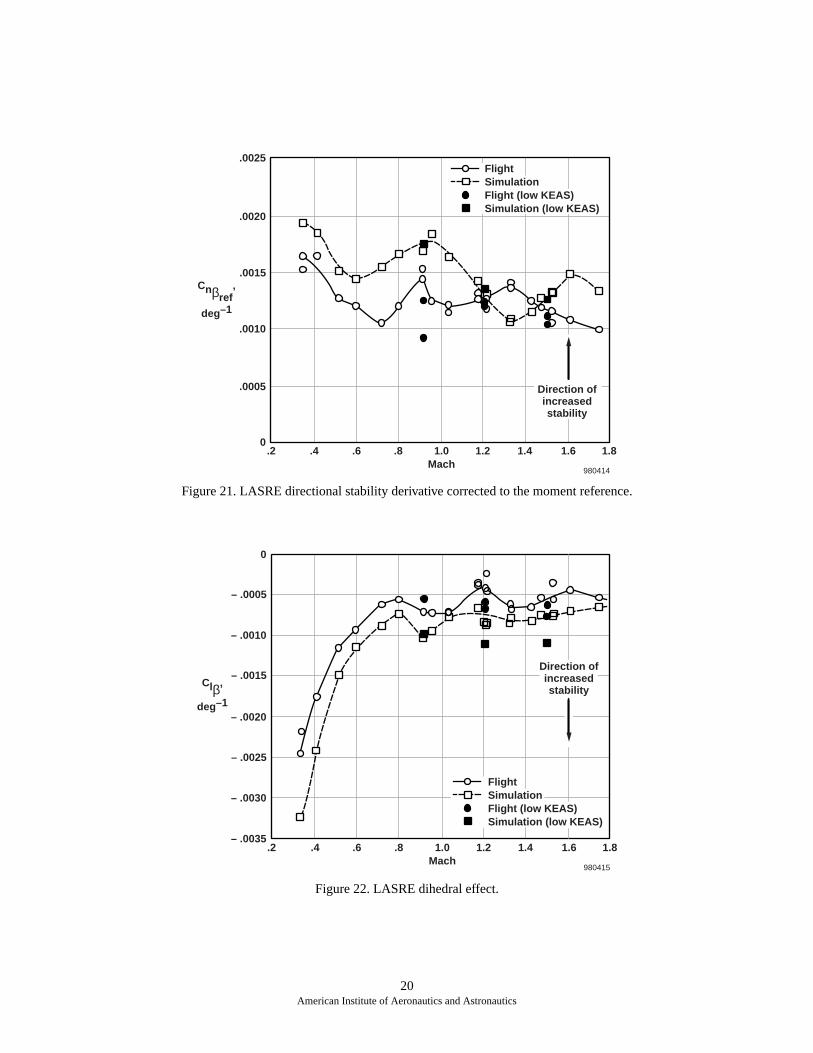
The angle of sideslip derivatives are shown infigures 21 and 22. For the most part both the directional
stability, , and dihedral effect, , were less stablethan the simulator predictions had indicated. Figure 21shows as much as 30-percent less than predicted.As discussed in reference 7, there were no flexibilitycorrections for the yaw axis. The flight data verified this,as there was little difference between the data at the lowKEAS test points and at elevated KEAS test points(with the exception of one maneuver at Mach 0.9).Figure 22 shows as much as 50-percent less stablethan predictions. Comparisons with figures 7 and 8showed that similar trends in misprediction were seen inthe baseline SR-71 aerodynamic model.
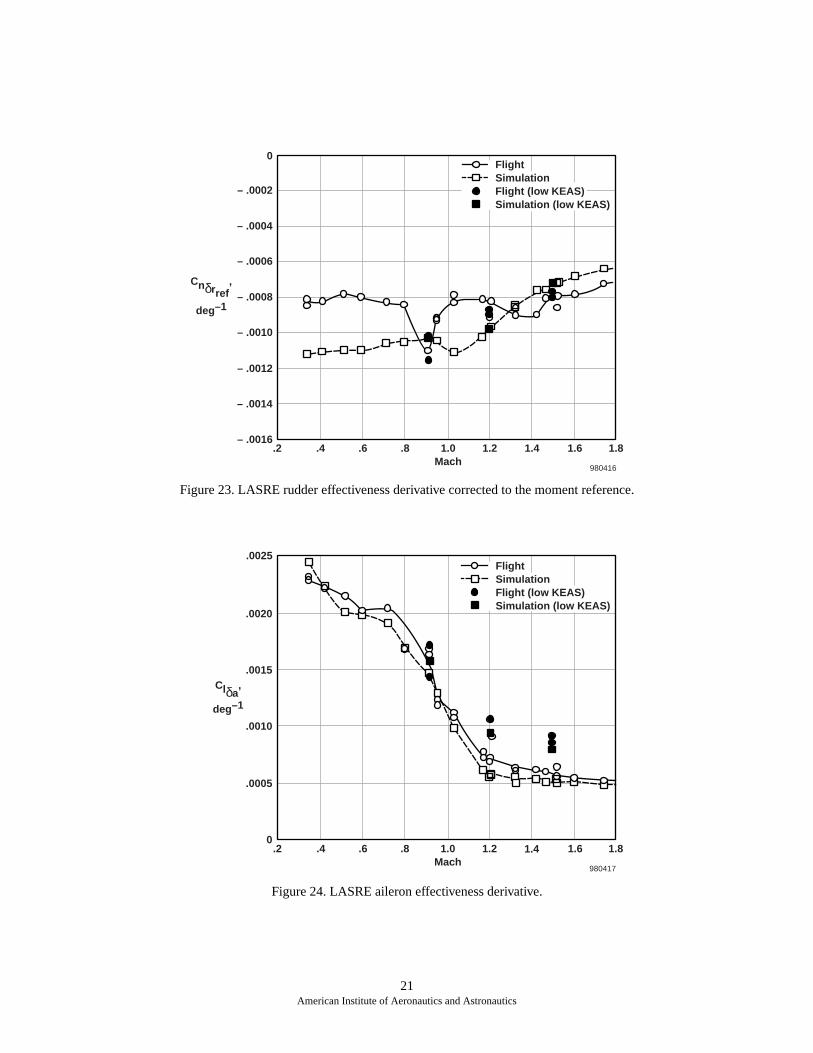
The rudder and aileron effectiveness controlderivatives are shown in figures 23 and 24. The ruddereffectiveness, , was less than predicted belowMach 1.3 and the aileron effectiveness, , showedgood agreement. Subsonically, the rudder effectivenessmisprediction was of the same magnitude as themisprediction of the baseline SR-71 rudder effectiveness(fig. 9). However at the low supersonic Mach numbersthe misprediction in is caused by the mispredictionof the pod effect from the wind tunnel. At worst, therudder effectiveness was 23-percent less than predictedat Mach 1.05.
CnβClβ
Cnβ
Clβ
CnδrClδa
Cnδr
18American Institute of Aeronautics and Astronautics
19American Institute of Aeronautics and Astronautics
(a) Outboard elevon.
(b) Inboard elevon.
Figure 20. Elevon hydraulic pressure.
0
500
1000
1500
2000
2500
Actuatorhydraulicpressure,
lb/in2
.6 .8 1.0 1.2Mach
1.4 1.6 1.8
FlightSimulation
980412
Trailing-edge-down limit
Trailing-edge-up limit
0
500
1000
1500
2000
2500
Actuatorhydraulicpressure,
lb/in2
.6 .8 1.0 1.2Mach
1.4 1.6 1.8
FlightSimulation
980413
Trailing-edge-down limit
Trailing-edge-up limit
20American Institute of Aeronautics and Astronautics
Figure 21. LASRE directional stability derivative corrected to the moment reference.
Figure 22. LASRE dihedral effect.
.2
Cnβref,
deg–1
.4 .6 .8 1.0Mach
1.2 1.61.4 1.8
980414
.0005
0
.0010
.0020
.0015
.0025
Direction ofincreasedstability
FlightSimulationFlight (low KEAS)Simulation (low KEAS)
.2
Clβ,
deg–1
.4 .6 .8 1.0Mach
1.2 1.61.4 1.8
980415
– .0030
– .0025
– .0035
– .0020
– .0010
– .0005
– .0015
0
FlightSimulationFlight (low KEAS)Simulation (low KEAS)
Direction ofincreasedstability
21American Institute of Aeronautics and Astronautics
Figure 23. LASRE rudder effectiveness derivative corrected to the moment reference.
Figure 24. LASRE aileron effectiveness derivative.
.2
Cnδrref,
deg–1
.4 .6 .8 1.0Mach
1.2 1.61.4 1.8
980416
– .0014
– .0012
– .0016
– .0010
– .0006
– .0004
– .0008
– .0002
0FlightSimulationFlight (low KEAS)Simulation (low KEAS)
.2 .4 .6 .8 1.0Mach
1.2 1.61.4 1.8
980417
.0005
0
.0010
.0020
.0015
.0025FlightSimulationFlight (low KEAS)Simulation (low KEAS)
Clδa,
deg–1
Simulation Update
Flight determined corrections to , , ,
, and were input into the piloted simulation for
handling qualities evaluations. These evaluations
included aerospike rocket firings at the specified test
conditions and emergency situations such as engine and
hydraulic system failures. In all cases, the simulations
showed acceptable handling qualities and that the
aircraft responses were within acceptable load factor
and angle of sideslip limits.
LASRE Configuration Performance Flight Results
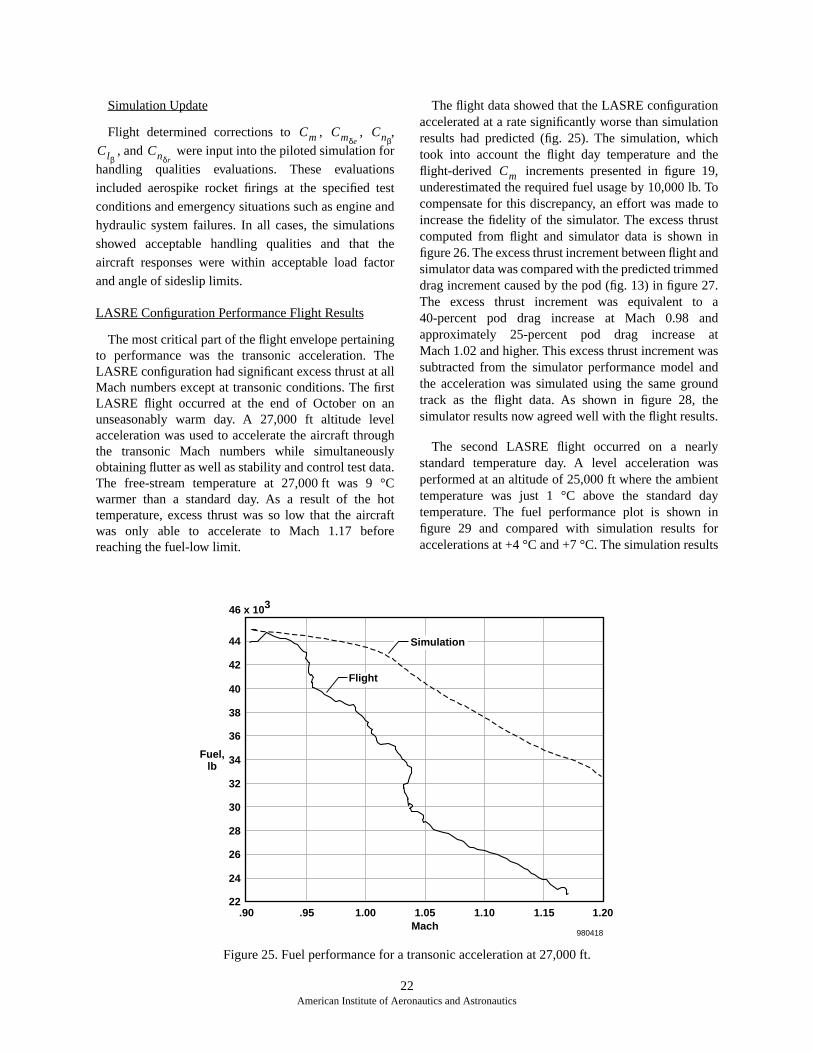
The most critical part of the flight envelope pertainingto performance was the transonic acceleration. TheLASRE configuration had significant excess thrust at allMach numbers except at transonic conditions. The firstLASRE flight occurred at the end of October on anunseasonably warm day. A 27,000 ft altitude levelacceleration was used to accelerate the aircraft throughthe transonic Mach numbers while simultaneouslyobtaining flutter as well as stability and control test data.The free-stream temperature at 27,000 ft was 9 °Cwarmer than a standard day. As a result of the hottemperature, excess thrust was so low that the aircraftwas only able to accelerate to Mach 1.17 beforereaching the fuel-low limit.
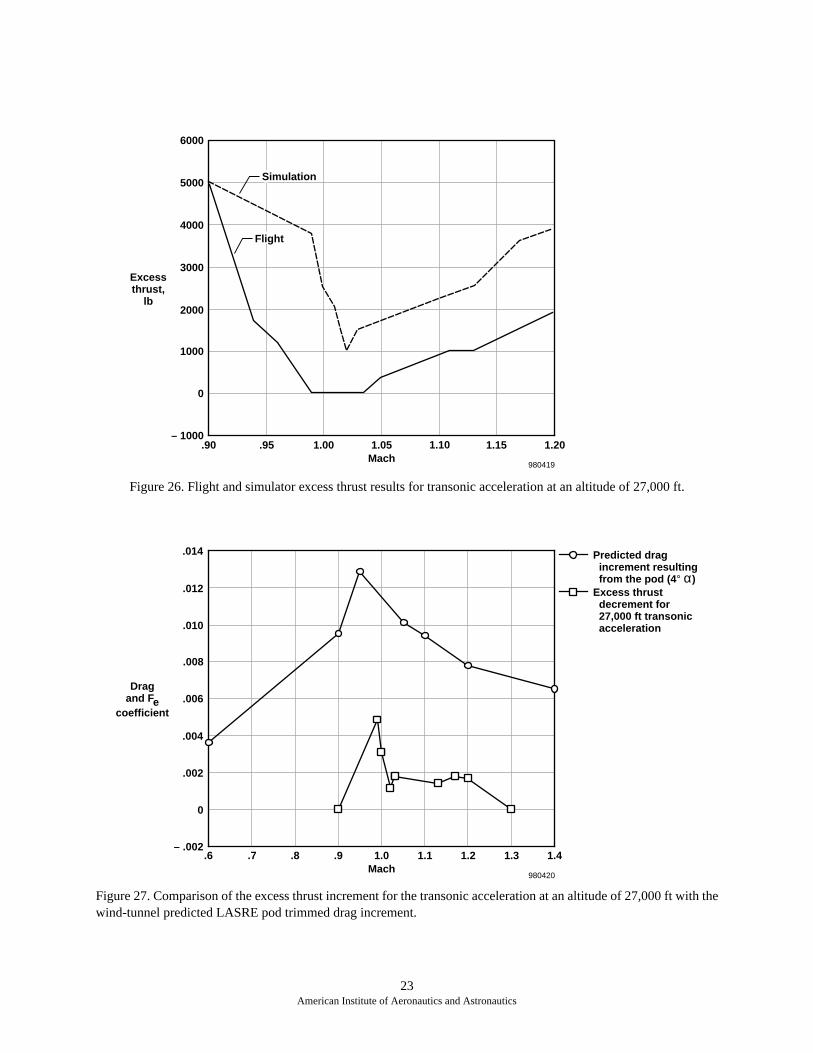
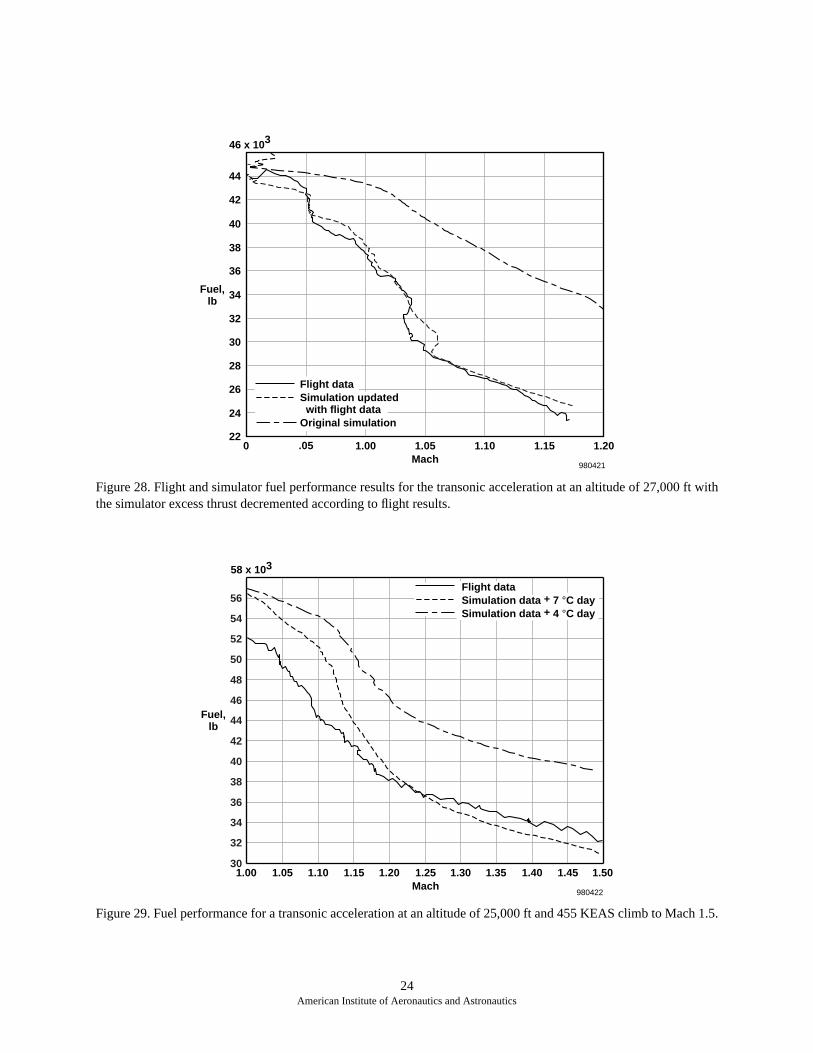
The flight data showed that the LASRE configurationaccelerated at a rate significantly worse than simulationresults had predicted (fig. 25). The simulation, whichtook into account the flight day temperature and theflight-derived increments presented in figure 19,underestimated the required fuel usage by 10,000 lb. Tocompensate for this discrepancy, an effort was made toincrease the fidelity of the simulator. The excess thrustcomputed from flight and simulator data is shown infigure 26. The excess thrust increment between flight andsimulator data was compared with the predicted trimmeddrag increment caused by the pod (fig. 13) in figure 27.The excess thrust increment was equivalent to a40-percent pod drag increase at Mach 0.98 andapproximately 25-percent pod drag increase atMach 1.02 and higher. This excess thrust increment wassubtracted from the simulator performance model andthe acceleration was simulated using the same groundtrack as the flight data. As shown in figure 28, thesimulator results now agreed well with the flight results.
The second LASRE flight occurred on a nearlystandard temperature day. A level acceleration wasperformed at an altitude of 25,000 ft where the ambienttemperature was just 1 °C above the standard daytemperature. The fuel performance plot is shown infigure 29 and compared with simulation results foraccelerations at +4 °C and +7 °C. The simulation results
Cm CmδeCnβ
ClβCnδr
Cm
22American Institute of Aeronautics and Astronautics
Figure 25. Fuel performance for a transonic acceleration at 27,000 ft.
.90 .95 1.00 1.05Mach
1.151.10
980418
1.20
Flight
Fuel,lb
46 x 103
44
42
40
38
36
34
32
30
28
26
24
22
Simulation
23American Institute of Aeronautics and Astronautics
Figure 26. Flight and simulator excess thrust results for transonic acceleration at an altitude of 27,000 ft.
Figure 27. Comparison of the excess thrust increment for the transonic acceleration at an altitude of 27,000 ft with thewind-tunnel predicted LASRE pod trimmed drag increment.
– 1000
0
1000
2000
3000
4000
5000
6000
.90 .95 1.00 1.05Mach
1.10 1.15 1.20
Excessthrust,
lb
980419
Flight
Simulation
– .002
0
.002
.004
.006
.008
.010
.012
.014
.6
Dragand Fe
coefficient
.7 .8 .9 1.0Mach
1.1 1.2 1.3 1.4
980420
Predicted drag increment resulting from the pod (4° α)Excess thrust decrement for 27,000 ft transonic acceleration
24American Institute of Aeronautics and Astronautics
Figure 28. Flight and simulator fuel performance results for the transonic acceleration at an altitude of 27,000 ft withthe simulator excess thrust decremented according to flight results.
Figure 29. Fuel performance for a transonic acceleration at an altitude of 25,000 ft and 455 KEAS climb to Mach 1.5.
0
Fuel,lb
1.00.05 1.05Mach
1.10 1.15
980421
1.20
46 x 103
44
42
40
38
36
34
32
30
28
26
24
22
Flight dataSimulation updated with flight dataOriginal simulation
1.00
Fuel,lb
1.15 1.201.05 1.10 1.25Mach
1.40 1.451.30 1.35
980422
1.50
58 x 103
56
54
52
50
48
46
44
42
40
38
36
34
32
30
Flight dataSimulation data + 7 °C daySimulation data + 4 °C day
included the excess thrust decrement obtained from thefirst flight (fig. 27). The simulator once againoverpredicted transonic performance. Because drag isnot a strong function of ambient temperature, it wasconcluded that the simulator does not correctly modelJ58 thrust changes as a function of ambient temperature.The shape of the flight curve agreed fairly well with the+4 °C curve. After more simulation studies, it wasconcluded that the flight data for a +1 °C day could beapproximated very well with a +5 °C day simulation.
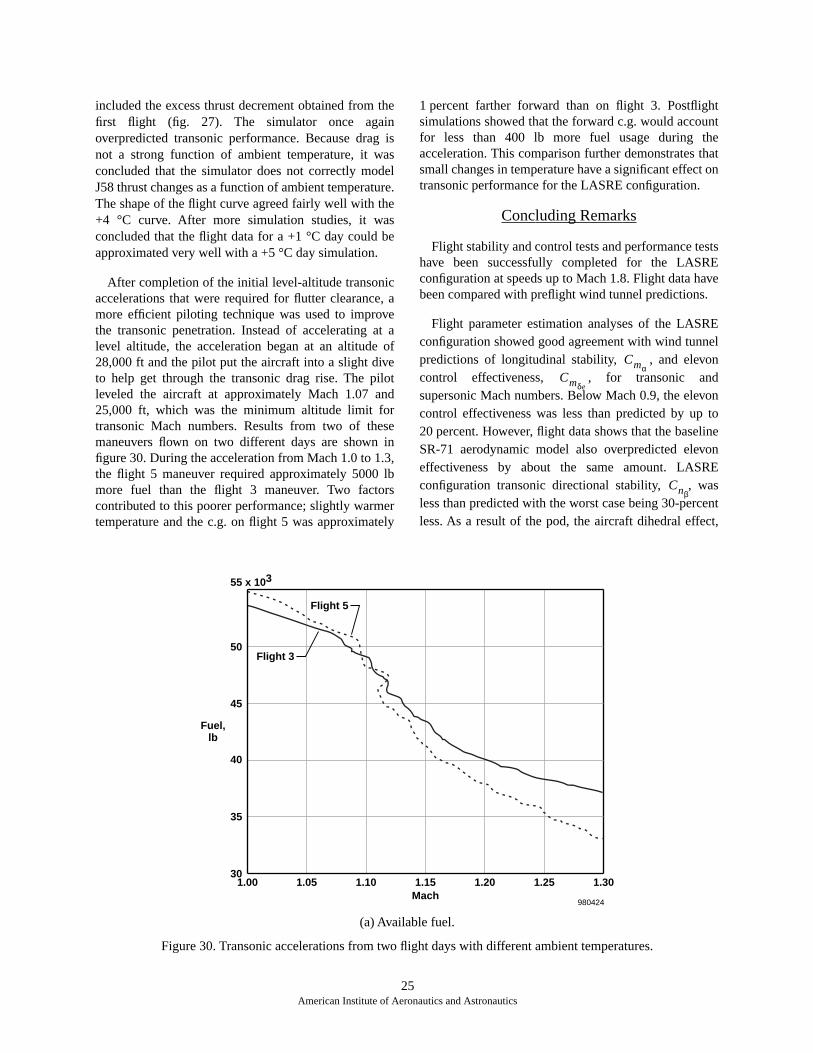
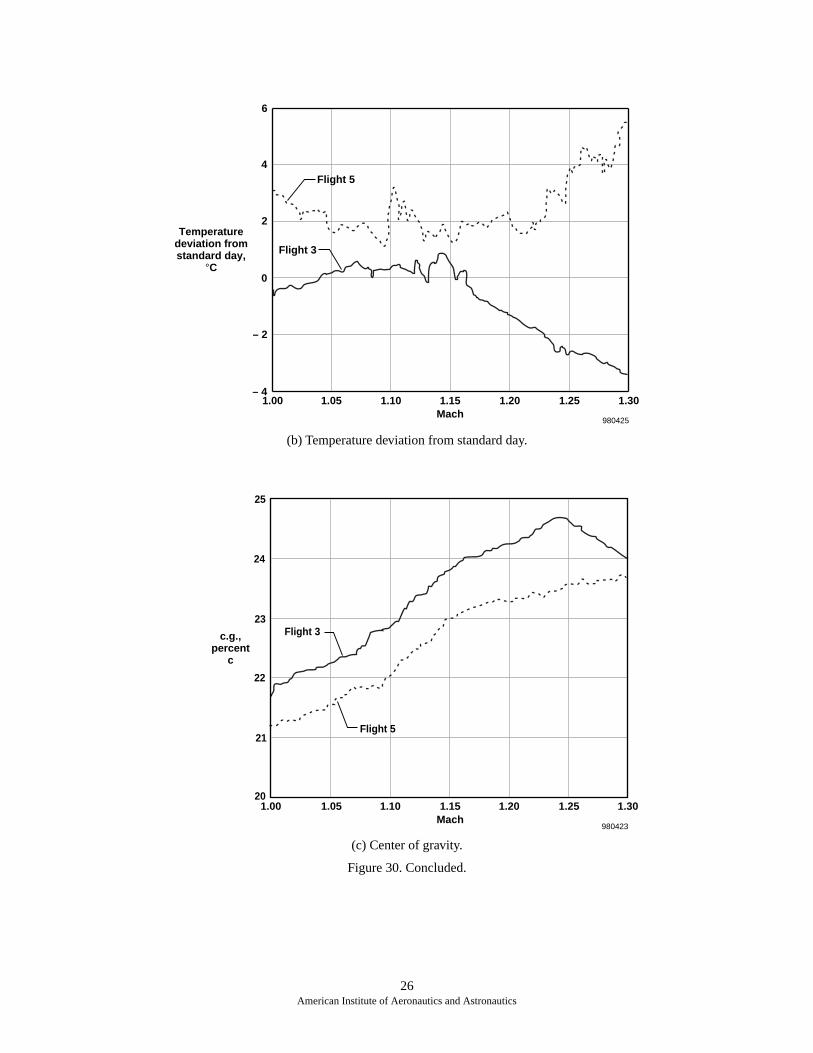
After completion of the initial level-altitude transonicaccelerations that were required for flutter clearance, amore efficient piloting technique was used to improvethe transonic penetration. Instead of accelerating at alevel altitude, the acceleration began at an altitude of28,000 ft and the pilot put the aircraft into a slight diveto help get through the transonic drag rise. The pilotleveled the aircraft at approximately Mach 1.07 and25,000 ft, which was the minimum altitude limit fortransonic Mach numbers. Results from two of thesemaneuvers flown on two different days are shown infigure 30. During the acceleration from Mach 1.0 to 1.3,the flight 5 maneuver required approximately 5000 lbmore fuel than the flight 3 maneuver. Two factorscontributed to this poorer performance; slightly warmertemperature and the c.g. on flight 5 was approximately
1 percent farther forward than on flight 3. Postflightsimulations showed that the forward c.g. would accountfor less than 400 lb more fuel usage during theacceleration. This comparison further demonstrates thatsmall changes in temperature have a significant effect ontransonic performance for the LASRE configuration.
Concluding Remarks
Flight stability and control tests and performance testshave been successfully completed for the LASREconfiguration at speeds up to Mach 1.8. Flight data havebeen compared with preflight wind tunnel predictions.
Flight parameter estimation analyses of the LASREconfiguration showed good agreement with wind tunnelpredictions of longitudinal stability, , and elevoncontrol effectiveness, , for transonic andsupersonic Mach numbers. Below Mach 0.9, the elevoncontrol effectiveness was less than predicted by up to20 percent. However, flight data shows that the baselineSR-71 aerodynamic model also overpredicted elevoneffectiveness by about the same amount. LASREconfiguration transonic directional stability, , wasless than predicted with the worst case being 30-percentless. As a result of the pod, the aircraft dihedral effect,
CmαCmδe
Cnβ
25American Institute of Aeronautics and Astronautics
(a) Available fuel.
Figure 30. Transonic accelerations from two flight days with different ambient temperatures.
1.00 1.05 1.10 1.15Mach
1.20 1.25 1.3030
35
40
45
50
55 x 103
Fuel,lb
980424
Flight 3
Flight 5
26American Institute of Aeronautics and Astronautics
(b) Temperature deviation from standard day.
(c) Center of gravity.
Figure 30. Concluded.
1.00 1.05 1.10 1.15Mach
1.20 1.25 1.30
– 2
– 4
2
0
4
6
Temperaturedeviation fromstandard day,
°C
980425
Flight 3
Flight 5
1.00 1.05 1.10 1.15Mach
1.20 1.25 1.30
980423
20
21
22
23
24
25
c.g.,percent
c
Flight 3
Flight 5
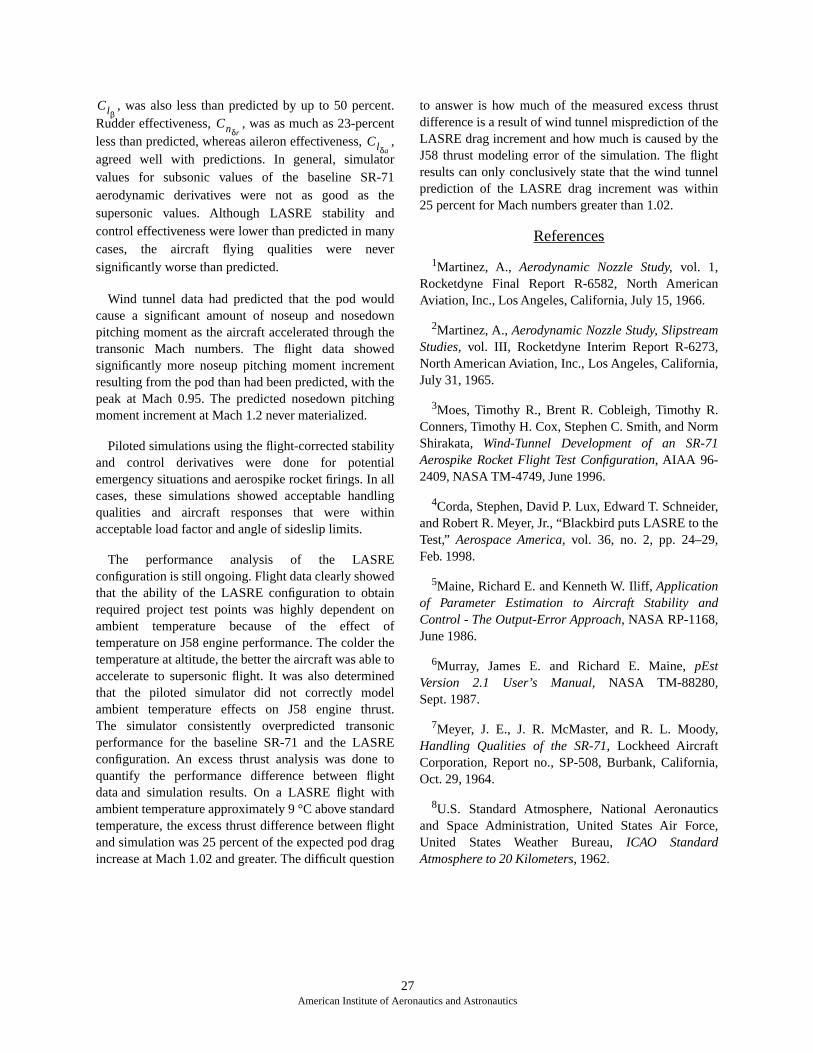
, was also less than predicted by up to 50 percent.Rudder effectiveness, , was as much as 23-percentless than predicted, whereas aileron effectiveness, ,agreed well with predictions. In general, simulatorvalues for subsonic values of the baseline SR-71aerodynamic derivatives were not as good as thesupersonic values. Although LASRE stability andcontrol effectiveness were lower than predicted in manycases, the aircraft flying qualities were neversignificantly worse than predicted.
Wind tunnel data had predicted that the pod wouldcause a significant amount of noseup and nosedownpitching moment as the aircraft accelerated through thetransonic Mach numbers. The flight data showedsignificantly more noseup pitching moment incrementresulting from the pod than had been predicted, with thepeak at Mach 0.95. The predicted nosedown pitchingmoment increment at Mach 1.2 never materialized.
Piloted simulations using the flight-corrected stabilityand control derivatives were done for potentialemergency situations and aerospike rocket firings. In allcases, these simulations showed acceptable handlingqualities and aircraft responses that were withinacceptable load factor and angle of sideslip limits.
The performance analysis of the LASREconfiguration is still ongoing. Flight data clearly showedthat the ability of the LASRE configuration to obtainrequired project test points was highly dependent onambient temperature because of the effect oftemperature on J58 engine performance. The colder thetemperature at altitude, the better the aircraft was able toaccelerate to supersonic flight. It was also determinedthat the piloted simulator did not correctly modelambient temperature effects on J58 engine thrust.The simulator consistently overpredicted transonicperformance for the baseline SR-71 and the LASREconfiguration. An excess thrust analysis was done toquantify the performance difference between flightdata and simulation results. On a LASRE flight withambient temperature approximately 9 °C above standardtemperature, the excess thrust difference between flightand simulation was 25 percent of the expected pod dragincrease at Mach 1.02 and greater. The difficult question
to answer is how much of the measured excess thrustdifference is a result of wind tunnel misprediction of theLASRE drag increment and how much is caused by theJ58 thrust modeling error of the simulation. The flightresults can only conclusively state that the wind tunnelprediction of the LASRE drag increment was within25 percent for Mach numbers greater than 1.02.
References
1Martinez, A., Aerodynamic Nozzle Study, vol. 1,Rocketdyne Final Report R-6582, North AmericanAviation, Inc., Los Angeles, California, July 15, 1966.
2Martinez, A., Aerodynamic Nozzle Study, SlipstreamStudies, vol. III, Rocketdyne Interim Report R-6273,North American Aviation, Inc., Los Angeles, California,July 31, 1965.
3Moes, Timothy R., Brent R. Cobleigh, Timothy R.Conners, Timothy H. Cox, Stephen C. Smith, and NormShirakata, Wind-Tunnel Development of an SR-71Aerospike Rocket Flight Test Configuration, AIAA 96-2409, NASA TM-4749, June 1996.
4Corda, Stephen, David P. Lux, Edward T. Schneider,and Robert R. Meyer, Jr., “Blackbird puts LASRE to theTest,” Aerospace America, vol. 36, no. 2, pp. 24–29,Feb. 1998.
5Maine, Richard E. and Kenneth W. Iliff, Applicationof Parameter Estimation to Aircraft Stability andControl - The Output-Error Approach, NASA RP-1168,June 1986.
6Murray, James E. and Richard E. Maine, pEstVersion 2.1 User’s Manual, NASA TM-88280,Sept. 1987.
7Meyer, J. E., J. R. McMaster, and R. L. Moody,Handling Qualities of the SR-71, Lockheed AircraftCorporation, Report no., SP-508, Burbank, California,Oct. 29, 1964.
8U.S. Standard Atmosphere, National Aeronauticsand Space Administration, United States Air Force,United States Weather Bureau, ICAO StandardAtmosphere to 20 Kilometers, 1962.
ClβCnδr
Clδa
27American Institute of Aeronautics and Astronautics
REPORT DOCUMENTATION PAGE Form ApprovedOMB No. 0704-0188
Public reporting burden for this collection of information is estimated to average 1 hour per response, including the time for reviewing instructions, searching existing data sources, gathering andmaintaining the data needed, and completing and reviewing the collection of information. Send comments regarding this burden estimate or any other aspect of this collection of information,including suggestions for reducing this burden, to Washington Headquarters Services, Directorate for Information Operations and Reports, 1215 Jefferson Davis Highway, Suite 1204, Arlington,VA 22202-4302, and to the Office of Management and Budget, Paperwork Reduction Project (0704-0188), Washington, DC 20503.
1. AGENCY USE ONLY (Leave blank) 2. REPORT DATE 3. REPORT TYPE AND DATES COVERED
4. TITLE AND SUBTITLE 5. FUNDING NUMBERS
6. AUTHOR(S)
8. PERFORMING ORGANIZATION REPORT NUMBER
7. PERFORMING ORGANIZATION NAME(S) AND ADDRESS(ES)
9. SPONSORING/MONITORING AGENCY NAME(S) AND ADDRESS(ES) 10. SPONSORING/MONITORING AGENCY REPORT NUMBER
11. SUPPLEMENTARY NOTES
12a. DISTRIBUTION/AVAILABILITY STATEMENT 12b. DISTRIBUTION CODE
13. ABSTRACT (Maximum 200 words)
14. SUBJECT TERMS 15. NUMBER OF PAGES
16. PRICE CODE
17. SECURITY CLASSIFICATION OF REPORT
18. SECURITY CLASSIFICATION OF THIS PAGE
19. SECURITY CLASSIFICATION OF ABSTRACT
20. LIMITATION OF ABSTRACT
NSN 7540-01-280-5500 Standard Form 298 (Rev. 2-89)Prescribed by ANSI Std. Z39-18298-102
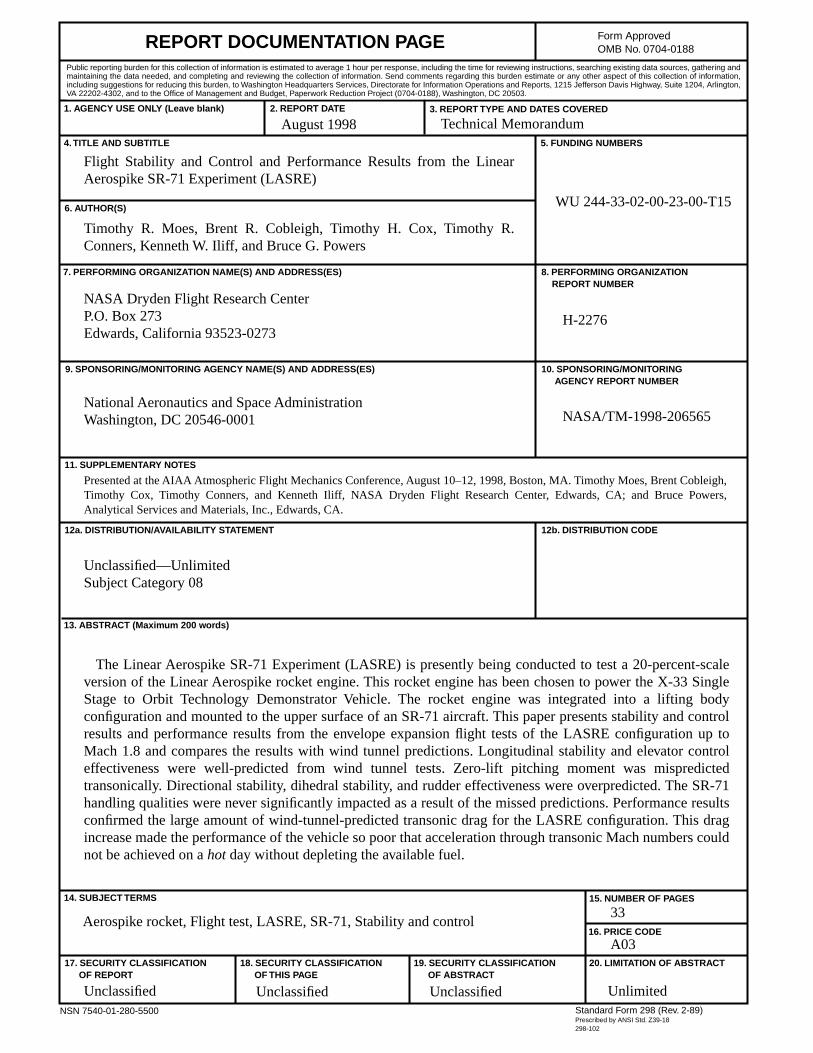
Flight Stability and Control and Performance Results from the LinearAerospike SR-71 Experiment (LASRE)
WU 244-33-02-00-23-00-T15
Timothy R. Moes, Brent R. Cobleigh, Timothy H. Cox, Timothy R.Conners, Kenneth W. Iliff, and Bruce G. Powers
NASA Dryden Flight Research CenterP.O. Box 273Edwards, California 93523-0273
H-2276
National Aeronautics and Space AdministrationWashington, DC 20546-0001 NASA/TM-1998-206565
The Linear Aerospike SR-71 Experiment (LASRE) is presently being conducted to test a 20-percent-scaleversion of the Linear Aerospike rocket engine. This rocket engine has been chosen to power the X-33 SingleStage to Orbit Technology Demonstrator Vehicle. The rocket engine was integrated into a lifting bodyconfiguration and mounted to the upper surface of an SR-71 aircraft. This paper presents stability and controlresults and performance results from the envelope expansion flight tests of the LASRE configuration up toMach 1.8 and compares the results with wind tunnel predictions. Longitudinal stability and elevator controleffectiveness were well-predicted from wind tunnel tests. Zero-lift pitching moment was mispredictedtransonically. Directional stability, dihedral stability, and rudder effectiveness were overpredicted. The SR-71handling qualities were never significantly impacted as a result of the missed predictions. Performance resultsconfirmed the large amount of wind-tunnel-predicted transonic drag for the LASRE configuration. This dragincrease made the performance of the vehicle so poor that acceleration through transonic Mach numbers couldnot be achieved on a hot day without depleting the available fuel.
Aerospike rocket, Flight test, LASRE, SR-71, Stability and control
A03
33
Unclassified Unclassified Unclassified Unlimited
August 1998 Technical Memorandum
Presented at the AIAA Atmospheric Flight Mechanics Conference, August 10–12, 1998, Boston, MA. Timothy Moes, Brent Cobleigh,Timothy Cox, Timothy Conners, and Kenneth Iliff, NASA Dryden Flight Research Center, Edwards, CA; and Bruce Powers,Analytical Services and Materials, Inc., Edwards, CA.
Unclassified—UnlimitedSubject Category 08


![Dynamics of Flight Stability and Control (3) [Etkin]](https://img.pdfslide.net/doc/110x75/55cf9825550346d03395d973/dynamics-of-flight-stability-and-control-3-etkin.jpg)