Embed Size (px)
Citation preview
NASA/TP-2002-210730
Flight Test Techniques Used to Evaluate Performance Benefits During Formation Flight
Ronald J. Ray, Brent R. Cobleigh, M. Jake Vachon, and Clinton St. John
NASA Dryden Flight Research CenterEdwards, California
August 2002
The NASA STI Program Office…in Profile
Since its founding, NASA has been dedicatedto the advancement of aeronautics and space science. The NASA Scientific and Technical Information (STI) Program Office plays a keypart in helping NASA maintain thisimportant role.
The NASA STI Program Office is operated byLangley Research Center, the lead center forNASA’s scientific and technical information.The NASA STI Program Office provides access to the NASA STI Database, the largest collectionof aeronautical and space science STI in theworld. The Program Office is also NASA’s institutional mechanism for disseminating theresults of its research and development activities. These results are published by NASA in theNASA STI Report Series, which includes the following report types:
• TECHNICAL PUBLICATION. Reports of completed research or a major significantphase of research that present the results of NASA programs and include extensive dataor theoretical analysis. Includes compilations of significant scientific and technical data and information deemed to be of continuing reference value. NASA’s counterpart of peer-reviewed formal professional papers but has less stringent limitations on manuscriptlength and extent of graphic presentations.
• TECHNICAL MEMORANDUM. Scientificand technical findings that are preliminary orof specialized interest, e.g., quick releasereports, working papers, and bibliographiesthat contain minimal annotation. Does notcontain extensive analysis.
• CONTRACTOR REPORT. Scientific and technical findings by NASA-sponsored contractors and grantees.
• CONFERENCE PUBLICATION. Collected papers from scientific andtechnical conferences, symposia, seminars,or other meetings sponsored or cosponsoredby NASA.
• SPECIAL PUBLICATION. Scientific,technical, or historical information fromNASA programs, projects, and mission,often concerned with subjects havingsubstantial public interest.
• TECHNICAL TRANSLATION. English- language translations of foreign scientific and technical material pertinent toNASA’s mission.
Specialized services that complement the STIProgram Office’s diverse offerings include creating custom thesauri, building customizeddatabases, organizing and publishing researchresults…even providing videos.
For more information about the NASA STIProgram Office, see the following:
• Access the NASA STI Program Home Pageat
http://www.sti.nasa.gov
• E-mail your question via the Internet to [email protected]
• Fax your question to the NASA Access HelpDesk at (301) 621-0134
• Telephone the NASA Access Help Desk at(301) 621-0390
• Write to:NASA Access Help DeskNASA Center for AeroSpace Information7121 Standard DriveHanover, MD 21076-1320
NASA/TP-2002-210730
Flight Test Techniques Used to Evaluate Performance Benefits During Formation Flight
Ronald J. Ray, Brent R. Cobleigh, M. Jake Vachon, and Clinton St. JohnNASA Dryden Flight Research CenterEdwards, California
August 2002
National Aeronautics andSpace Administration
Dryden Flight Research CenterEdwards, California 93523-0273

NOTICE
Use of trade names or names of manufacturers in this document does not constitute an official endorsementof such products or manufacturers, either expressed or implied, by the National Aeronautics andSpace Administration.
Available from the following:
NASA Center for AeroSpace Information (CASI) National Technical Information Service (NTIS)7121 Standard Drive 5285 Port Royal RoadHanover, MD 21076-1320 Springfield, VA 22161-2171(301) 621-0390 (703) 487-4650
FLIGHT TEST TECHNIQUES USED TO EVALUATE PERFORMANCE BENEFITS DURING FORMATION FLIGHT
Ronald J. Ray,* Brent R. Cobleigh,† M. Jake Vachon,‡ and Clinton St. John§
NASA Dryden Flight Research CenterEdwards, California
Abstract
The Autonomous Formation Flight research projecthas been implemented at the NASA Dryden FlightResearch Center to demonstrate the benefits offormation flight and develop advanced technologies tofacilitate exploiting these benefits. Two F/A-18 aircrafthave been modified to precisely control and monitorrelative position, and to determine performance of thetrailing airplane. Flight test maneuvers and analysistechniques have been developed to determine theperformance advantages, including drag and fuel flowreductions and improvements in range factor. By flyingthe trailing airplane through a matrix of lateral,longitudinal, and vertical offset positions, a detailed mapof the performance benefits has been obtained at twoflight conditions. Significant performance benefits havebeen obtained during this flight test phase. Dragreductions of more than 20 percent and fuel flowreductions of more than 18 percent have been measuredat flight conditions of Mach 0.56 and an altitude of25,000 ft. The results show favorable agreement withpublished theory and generic predictions. An F/A-18long-range cruise mission at Mach 0.8 and an altitude of40,000 ft has been simulated in the optimum formationposition and has demonstrated a 14-percent fuelreduction when compared with a controlled chaseairplane of similar configuration.
1American Institute of Aero
*Aerospace Engineer.†Aerospace Engineer, Member AIAA.‡Aerospace Engineer, Member AIAA.§Aerospace Engineer, Member AIAA.
Copyright 2002 by the American Institute of Aeronautics andAstronautics, Inc. No copyright is asserted in the United States underTitle 17, U.S. Code. The U.S. Government has a royalty-free licenseto exercise all rights under the copyright claimed herein forGovernmental purposes. All other rights are reserved by the copyrightowner.
Notice: the use of trade names or names of manufacturers in thisdocument does not constitute an official endorsement of suchproducts or manufacturers, either expressed or implied, by theNational Aeronautics and Space Administration.
Nomenclature
Acronyms
AFF Autonomous Formation Flight
ATC automatic throttle control
DPS digital performance simulation
GPS global positioning system
HUD head-up display
IFT in-flight thrust
INS inertial navigation system
NASA National Aeronautics and Space Administration
Symbols
acceleration along flightpath, g
lateral acceleration (wind axis), g
normal acceleration perpendicular to flightpath, g
CD coefficient of drag (CD = 2D/(S V2)
coefficient of induced drag ( )
coefficient of zero-lift drag
CL coefficient of lift (CL = 2L/(S V2)
D drag, lbf
FEX excess thrust, lbf
FEDRAG engine throttle–dependent drag, lbf
FG gross thrust, lbf
FRAM ram drag, lbf
g gravity constant
GW gross weight, lbf
L lift, lbf
AXW
AY W
AZW
ρ
CDiCDi
CD CD0–=
CD0
ρ
nautics and Astronautics

load factor perpendicular to flightpath, g
P power, lbf-ft/sec
S wing area, ft2
V velocity, ft/sec
W upwash velocity, ft/sec
WFT fuel flow rate, lbm/hr
X longitudinal separation, wingspan (37.5 ft)
Y lateral separation, wingspan
Z vertical separation, wingspan
angle of attack, deg
flightpath angle, deg
change in parameter
pitch angle, deg
density, lbm/ft3
Subscripts
BL baseline (nonformation flight)
est estimated
FF formation flight
lead leading airplane
trail trailing airplane
Introduction
The performance benefits of formation flight wereknown before man could even fly. Many bird species flyin “V” formation to take advantage of the upwash fieldgenerated by adjacent birds, resulting in less energyexpended.1 Analytical studies and qualitative flight testshave shown this benefit is significant and can bereproduced for a formation of aircraft.
Beukenberg and Hummel2 flew two aircraft information using autopilots and measured values ofinduced upwash velocity and aileron deflection tooptimize position within the vortex. This simple testachieved an average relative power reduction of 10.24percent using limited instrumentation.
A primary objective of the Autonomous FormationFlight (AFF) project at the NASA Dryden FlightResearch Center (Edwards, California) has been tovalidate the drag reduction concept and prediction toolsin the flight environment for aircraft in formation. Theproject intended to advance the concept of AFF drag
reduction from the experimental proof-of-concept stageto a prototype demonstration within three years ofcommencing. The prototype demonstration was plannedto be accomplished using two highly instrumented,NASA-owned F/A-18 aircraft (McDonnell DouglasCorporation, now The Boeing Company, St. Louis,Missouri; and Northrop Corporation, now NorthropGrumman, Newbury Park, California) equipped with thenecessary research systems. A primary factor toverifying the drag reduction goal has been theimplementation and validation of the in-flightperformance data system and the development of flighttest techniques to analyze performance benefits duringformation flight.
The AFF project goals and objectives originally wereplanned to be accomplished in four phases, with flighttest beginning in the first quarter of the 2001 fiscal yearand completing by the end of the 2003 fiscal year. Thefirst phase demonstrated precision autonomousstation-keeping. The second phase mapped the vortexeffects of the leading airplane on the trailing airplane,and evaluated the performance of the high-accuracyrelative-position sensor system and datalinkcommunications. This report presents the resultsobtained from this phase.
The AFF project was canceled shortly after thissecond phase because of budget constraints. The thirdphase contains the primary objective of the project andwas intended to demonstrate the integrated systemperformance by achieving a sustained 10-percent fuelsavings while under close formation flight. The resultsof this third phase have been envisioned to havecommercial and military applications to cargo andpassenger transports and unmanned air vehicles.Although not all the autonomous control goals wererealized during this now-truncated AFF project,significant vehicle performance improvements havebeen demostrated.
Determining vehicle performance and test techniquesto use while in formation flight has unique challenges.For example, the localized upwash effects from theleading airplane made the angle-of-attack probes of thetrailing airplane inaccurate during formation flight.Alternative measurement techniques had to bedeveloped. An important aspect of obtaining the datapresented in this report was the accurate positioning ofthe trailing airplane during formation flight to acquireimportant aerodynamic data for development of theautonomous control system. To enable the pilots tomanually fly the trailing formation position withaccuracy, a relative-position indicator was developed to
NZW
α
γ
∆
θ
ρ
2American Institute of Aeronautics and Astronautics
show position errors using the head-up display (HUD).In turn, flying with accuracy allowed for the systematicmapping of the drag and fuel consumption benefits. Anadditional challenge was to determine how the varyingfuel weights of the leading and trailing aircraft affectedthe results.
This report describes the analysis methods and testtechniques developed and employed to determineaircraft performance during the detailed mapping of thevortex, the second flight test phase of the AFF project. Asummary of prediction theory and the techniques usedto validate that theory is also provided. Sample resultsare given to demonstrate the data quality and arecompared to predictions obtained from basic theory.
Basic Theory
The most common theory on formation flight statesthat drag reduction is actually attained because of arotation of the lift vector that occurs while a trailingairplane is in the upwash field of the leading airplane.3–5
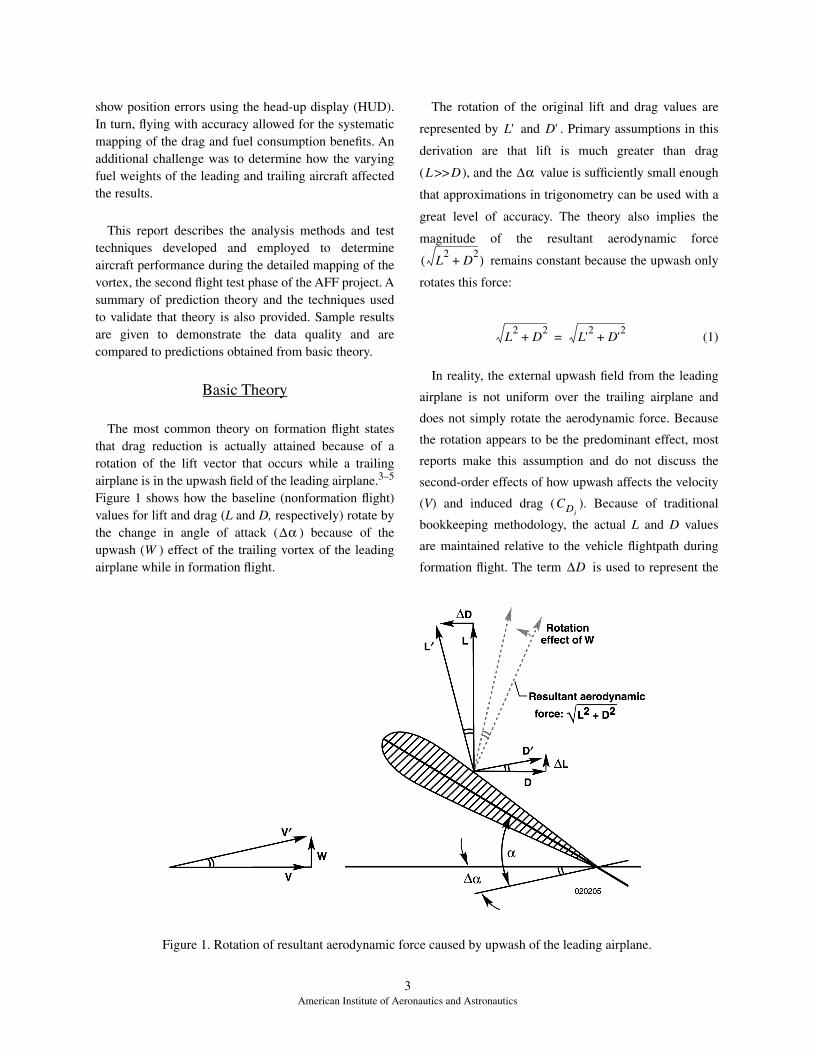
Figure 1 shows how the baseline (nonformation flight)values for lift and drag (L and D, respectively) rotate bythe change in angle of attack ( ) because of theupwash (W ) effect of the trailing vortex of the leadingairplane while in formation flight.
The rotation of the original lift and drag values are
represented by and . Primary assumptions in this
derivation are that lift is much greater than drag
( ), and the value is sufficiently small enough
that approximations in trigonometry can be used with a
great level of accuracy. The theory also implies the
magnitude of the resultant aerodynamic force
remains constant because the upwash only
rotates this force:
(1)
In reality, the external upwash field from the leading
airplane is not uniform over the trailing airplane and
does not simply rotate the aerodynamic force. Because
the rotation appears to be the predominant effect, most
reports make this assumption and do not discuss the
second-order effects of how upwash affects the velocity
(V) and induced drag ( ). Because of traditional
bookkeeping methodology, the actual L and D values
are maintained relative to the vehicle flightpath during
formation flight. The term is used to represent the
∆α
L' D'
L>> D ∆α
L2
D2
+( )
L2
D2
+ L'2
D'2
+=
CDi
∆D
3American Institute of Aeronautics and Astronautics
Figure 1. Rotation of resultant aerodynamic force caused by upwash of the leading airplane.
drag change caused by the rotation of the original lift
force from L to . The drag during formation flight,
DFF, is obtained as follows:
(2)
where
In a similar manner, the term is used to representthe lift change caused by the rotation of the drag forcefrom D to . The lift during formation flight, LFF, isobtained as follows:
(3)
where
In practice, the pilot will adjust the airplane pitchattitude and throttle setting while in formation to keepall the forces acting on the airplane in balance. That is,the reduction in drag requires the pilot to reduce powerto maintain speed, and the small increase in lift requiresthe pilot to slightly pitch the aircraft nose forward or itwill diverge from its flightpath. Because lift tends to bean order of magnitude greater than drag ( ), dragis influenced significantly more by the rotation effectthan lift is:
(4)
A considerable reduction in drag can be attained by asmall upwash angle while an insignificant increase inlift simultaneously occurs.
Because of the upwash effect while in formationflight, the effective or aerodynamic velocity vector is nolonger in the direction of the actual flightpath. Thischange makes the trailing airplane appear toaerodynamically be in a descent (relative to the wind),requiring the pilot to reduce power to maintain altitude.This characteristic is similar to how a glider soarswithout power because of thermals or vertical updraftsover a ridge.
The simplest theoretical analysis for predicting dragreduction while in formation flight replaces each wing
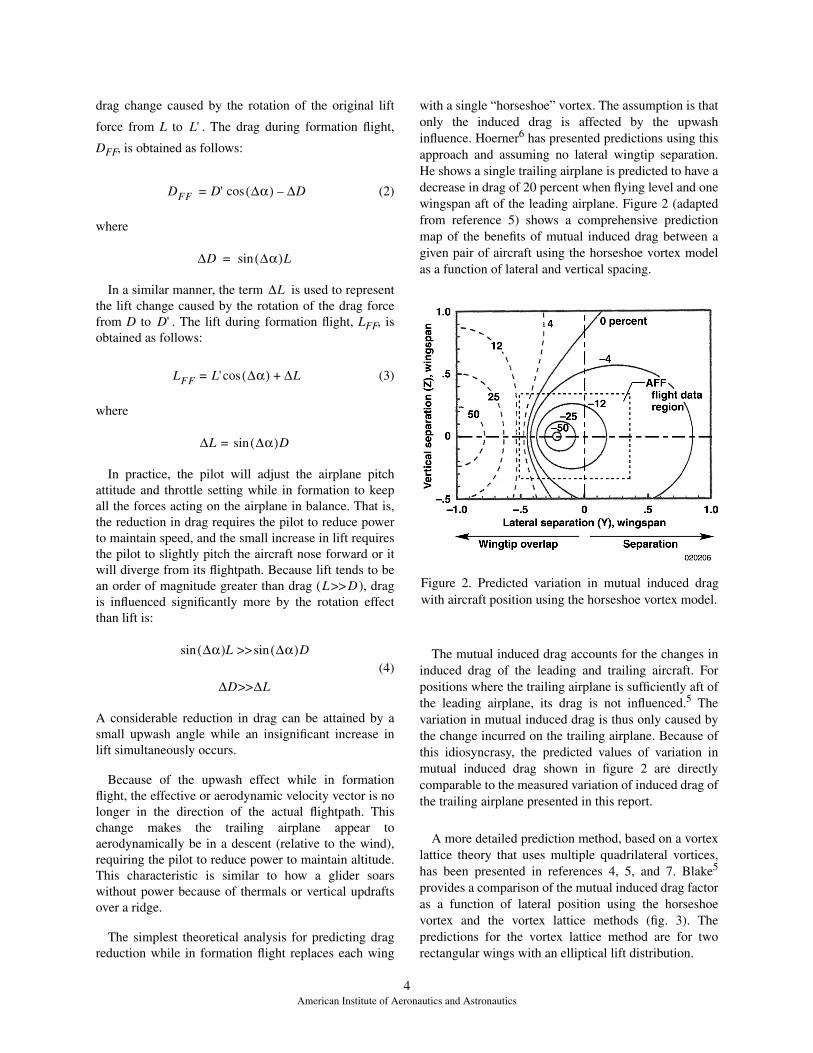
with a single “horseshoe” vortex. The assumption is thatonly the induced drag is affected by the upwashinfluence. Hoerner6 has presented predictions using thisapproach and assuming no lateral wingtip separation.He shows a single trailing airplane is predicted to have adecrease in drag of 20 percent when flying level and onewingspan aft of the leading airplane. Figure 2 (adaptedfrom reference 5) shows a comprehensive predictionmap of the benefits of mutual induced drag between agiven pair of aircraft using the horseshoe vortex modelas a function of lateral and vertical spacing.
The mutual induced drag accounts for the changes ininduced drag of the leading and trailing aircraft. Forpositions where the trailing airplane is sufficiently aft ofthe leading airplane, its drag is not influenced.5 Thevariation in mutual induced drag is thus only caused bythe change incurred on the trailing airplane. Because ofthis idiosyncrasy, the predicted values of variation inmutual induced drag shown in figure 2 are directlycomparable to the measured variation of induced drag ofthe trailing airplane presented in this report.
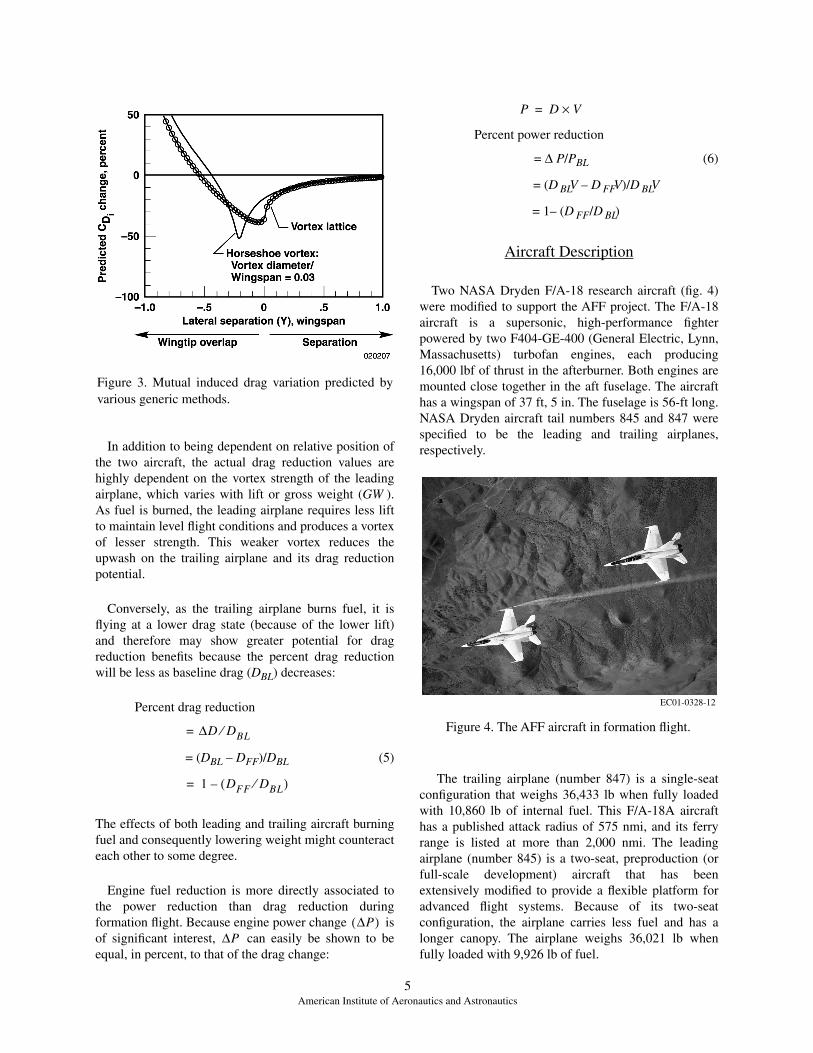
A more detailed prediction method, based on a vortexlattice theory that uses multiple quadrilateral vortices,has been presented in references 4, 5, and 7. Blake5
provides a comparison of the mutual induced drag factoras a function of lateral position using the horseshoevortex and the vortex lattice methods (fig. 3). Thepredictions for the vortex lattice method are for tworectangular wings with an elliptical lift distribution.
L'
DFF D' ∆α( ) ∆D–cos=
∆D ∆α( )Lsin=
∆L
D'
LFF L'= ∆α( ) ∆L+cos
∆L ∆α( )sin= D
L>> D
∆α( )sin L >> ∆α( )sin D
∆D>>∆L
Figure 2. Predicted variation in mutual induced dragwith aircraft position using the horseshoe vortex model.
4American Institute of Aeronautics and Astronautics
In addition to being dependent on relative position ofthe two aircraft, the actual drag reduction values arehighly dependent on the vortex strength of the leadingairplane, which varies with lift or gross weight (GW ).As fuel is burned, the leading airplane requires less liftto maintain level flight conditions and produces a vortexof lesser strength. This weaker vortex reduces theupwash on the trailing airplane and its drag reductionpotential.
Conversely, as the trailing airplane burns fuel, it isflying at a lower drag state (because of the lower lift)and therefore may show greater potential for dragreduction benefits because the percent drag reductionwill be less as baseline drag (DBL) decreases:
Percent drag reduction
=
= (DBL – DFF)/DBL (5)
The effects of both leading and trailing aircraft burningfuel and consequently lowering weight might counteracteach other to some degree.
Engine fuel reduction is more directly associated tothe power reduction than drag reduction duringformation flight. Because engine power change isof significant interest, can easily be shown to beequal, in percent, to that of the drag change:
Percent power reduction
= ∆ P/PBL (6)
= (D BLV – D FFV)/D BLV
= 1– (D FF /D BL)
Aircraft Description
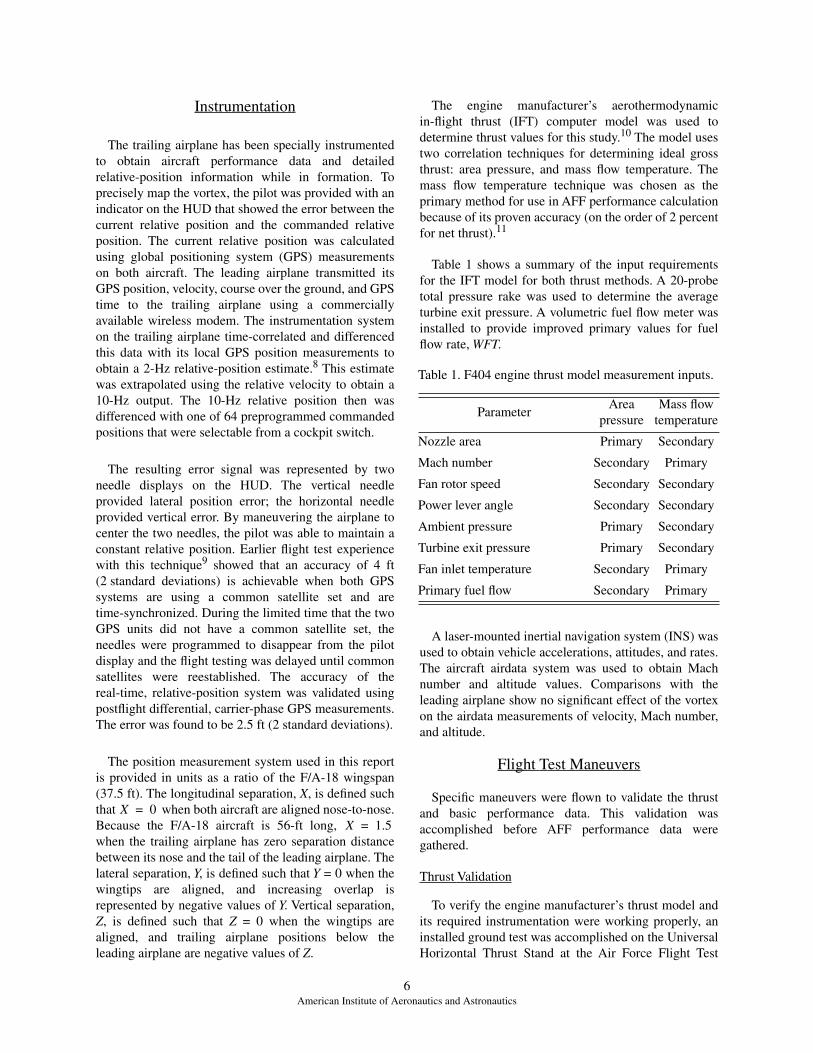
Two NASA Dryden F/A-18 research aircraft (fig. 4)were modified to support the AFF project. The F/A-18aircraft is a supersonic, high-performance fighterpowered by two F404-GE-400 (General Electric, Lynn,Massachusetts) turbofan engines, each producing16,000 lbf of thrust in the afterburner. Both engines aremounted close together in the aft fuselage. The aircrafthas a wingspan of 37 ft, 5 in. The fuselage is 56-ft long.NASA Dryden aircraft tail numbers 845 and 847 werespecified to be the leading and trailing airplanes,respectively.
The trailing airplane (number 847) is a single-seatconfiguration that weighs 36,433 lb when fully loadedwith 10,860 lb of internal fuel. This F/A-18A aircrafthas a published attack radius of 575 nmi, and its ferryrange is listed at more than 2,000 nmi. The leadingairplane (number 845) is a two-seat, preproduction (orfull-scale development) aircraft that has beenextensively modified to provide a flexible platform foradvanced flight systems. Because of its two-seatconfiguration, the airplane carries less fuel and has alonger canopy. The airplane weighs 36,021 lb whenfully loaded with 9,926 lb of fuel.
Figure 3. Mutual induced drag variation predicted byvarious generic methods.
∆D DBL⁄
1 DFF DBL⁄( )–=
∆P( )∆P
P D V×=
EC01-0328-12
Figure 4. The AFF aircraft in formation flight.
5American Institute of Aeronautics and Astronautics
Instrumentation
The trailing airplane has been specially instrumentedto obtain aircraft performance data and detailedrelative-position information while in formation. Toprecisely map the vortex, the pilot was provided with anindicator on the HUD that showed the error between thecurrent relative position and the commanded relativeposition. The current relative position was calculatedusing global positioning system (GPS) measurementson both aircraft. The leading airplane transmitted itsGPS position, velocity, course over the ground, and GPStime to the trailing airplane using a commerciallyavailable wireless modem. The instrumentation systemon the trailing airplane time-correlated and differencedthis data with its local GPS position measurements toobtain a 2-Hz relative-position estimate.8 This estimatewas extrapolated using the relative velocity to obtain a10-Hz output. The 10-Hz relative position then wasdifferenced with one of 64 preprogrammed commandedpositions that were selectable from a cockpit switch.
The resulting error signal was represented by twoneedle displays on the HUD. The vertical needleprovided lateral position error; the horizontal needleprovided vertical error. By maneuvering the airplane tocenter the two needles, the pilot was able to maintain aconstant relative position. Earlier flight test experiencewith this technique9 showed that an accuracy of 4 ft(2 standard deviations) is achievable when both GPSsystems are using a common satellite set and aretime-synchronized. During the limited time that the twoGPS units did not have a common satellite set, theneedles were programmed to disappear from the pilotdisplay and the flight testing was delayed until commonsatellites were reestablished. The accuracy of thereal-time, relative-position system was validated usingpostflight differential, carrier-phase GPS measurements.The error was found to be 2.5 ft (2 standard deviations).
The position measurement system used in this reportis provided in units as a ratio of the F/A-18 wingspan(37.5 ft). The longitudinal separation, X, is defined suchthat when both aircraft are aligned nose-to-nose.Because the F/A-18 aircraft is 56-ft long, when the trailing airplane has zero separation distancebetween its nose and the tail of the leading airplane. Thelateral separation, Y, is defined such that Y = 0 when thewingtips are aligned, and increasing overlap isrepresented by negative values of Y. Vertical separation,Z, is defined such that Z = 0 when the wingtips arealigned, and trailing airplane positions below theleading airplane are negative values of Z.
The engine manufacturer’s aerothermodynamicin-flight thrust (IFT) computer model was used todetermine thrust values for this study.10 The model usestwo correlation techniques for determining ideal grossthrust: area pressure, and mass flow temperature. Themass flow temperature technique was chosen as theprimary method for use in AFF performance calculationbecause of its proven accuracy (on the order of 2 percentfor net thrust).11
Table 1 shows a summary of the input requirementsfor the IFT model for both thrust methods. A 20-probetotal pressure rake was used to determine the averageturbine exit pressure. A volumetric fuel flow meter wasinstalled to provide improved primary values for fuelflow rate, WFT.
A laser-mounted inertial navigation system (INS) wasused to obtain vehicle accelerations, attitudes, and rates.The aircraft airdata system was used to obtain Machnumber and altitude values. Comparisons with theleading airplane show no significant effect of the vortexon the airdata measurements of velocity, Mach number,and altitude.
Flight Test Maneuvers
Specific maneuvers were flown to validate the thrustand basic performance data. This validation wasaccomplished before AFF performance data weregathered.
Thrust Validation
To verify the engine manufacturer’s thrust model andits required instrumentation were working properly, aninstalled ground test was accomplished on the UniversalHorizontal Thrust Stand at the Air Force Flight Test
X 0=X 1.5=
Table 1. F404 engine thrust model measurement inputs.
ParameterArea
pressureMass flow
temperature
Nozzle area Primary Secondary
Mach number Secondary Primary
Fan rotor speed Secondary Secondary
Power lever angle Secondary Secondary
Ambient pressure Primary Secondary
Turbine exit pressure Primary Secondary
Fan inlet temperature Secondary Primary
Primary fuel flow Secondary Primary
6American Institute of Aeronautics and Astronautics
Center (Edwards, California) before first flight. Thesetests were individually accomplished at various powersettings for each engine. Calculated gross thrust valuescompare favorably to those measured on the test stand,giving confidence the IFT model and requiredinstrumentation were working properly.
To complete the checkout of the IFT model andinstrumentation, both steady-state and dynamic enginetest points were accomplished at various test conditions.The steady-state data were obtained at cruise flightconditions, and the results from the in-flight thrustmodel were compared to predictions obtained from themanufacturer’s specification model. Throttle steps andthrottle frequency sweeps were used to assess the effectunsteady engine operation had on the IFT using thetechniques described in reference 12. Although the IFTmodel was designed for steady-state applications, thedata gathered during the unsteady throttle test indicatereasonable accuracy for the throttle rates used duringthis phase of the AFF project.
Basic Performance
Before conducting maneuvers for drag reduction, theaircraft performance data were validated by conductingclassical performance maneuvers and comparing theresults to F/A-18 predictions. The basic maneuver,initiated from stabilized cruise points, primarilyconsisted of a pushover-pullup (0–2 g) and a windupturn conducted at constant Mach number. These datawere compared to predictions to verify thereasonableness of the drag data.
Formation Flight Performance
Three maneuver techniques were evaluated for theirsuitability in obtaining the best quality of drag and fuelflow reduction data. The first technique evaluatedconsisted of flying several formation positions followedby an occasional dedicated baseline (nonvortex)position. The correction for changing fuel weight wasfound to be greater than desired. The second techniquewas to fly at a given position in the vortex and acquiredata. The throttle then was set to a fixed position, andthe leading airplane quickly moved out of formationposition. The change in velocity caused by the change indrag then was measured. Large velocity changes weremeasured using this technique as the trailing airplaneresponded to its change in drag, but failed to provide adirect comparison of drag in and out of the vortex at thesame velocity.
The third technique evaluated was found to be themost effective for determining formation flight
performance. This technique consisted of flying to theprescribed formation position using the HUD needlesfor ∆Y and ∆Z position and control room calls for∆X position. When in position, the pilot would hit thetrigger button on the control stick to indicate thebeginning of the maneuver. After approximately 30 sec,a control room call to “engage automatic throttlecontrol” (ATC) was made, indicating to the pilot toengage the ATC command button when the pilot thoughtconditions were stable. The use of ATC tended tosmooth out and limit throttle movement while holdingaircraft position.
After approximately 20-sec more, a control room callto “slide out” was made, for which the pilot laterallymaneuvered out of the formation and immediatelyengaged the altitude-hold autopilot. This final conditionwas held for a minimum of 20 sec. Because the ATCwas still engaged, it automatically increased the throttleto maintain speed at the higher drag condition outsidethe vortex. This maneuver provided both data at thedesired formation position and a “baseline”(nonformation) condition in one continuous(“back-to-back”) data set for direct comparison.Examples of the maneuver technique are presented inthe results section of this report.
More than 400 data points were conducted during thisphase of the AFF project. A matrix of test pointsconsisting of a maximum of seven lateral and sevenvertical positions was flown at four longitudinal trailingpositions: X = 2.0, 3.0, 4.4, and 6.6 (aft, nose-to-nose).
Experimental Methods and Analysis Techniques
An analysis technique was developed tosystematically and efficiently reduce the large volume ofperformance data obtained on the AFF project. Figure 5shows a summary of the performance data reductionprocess.
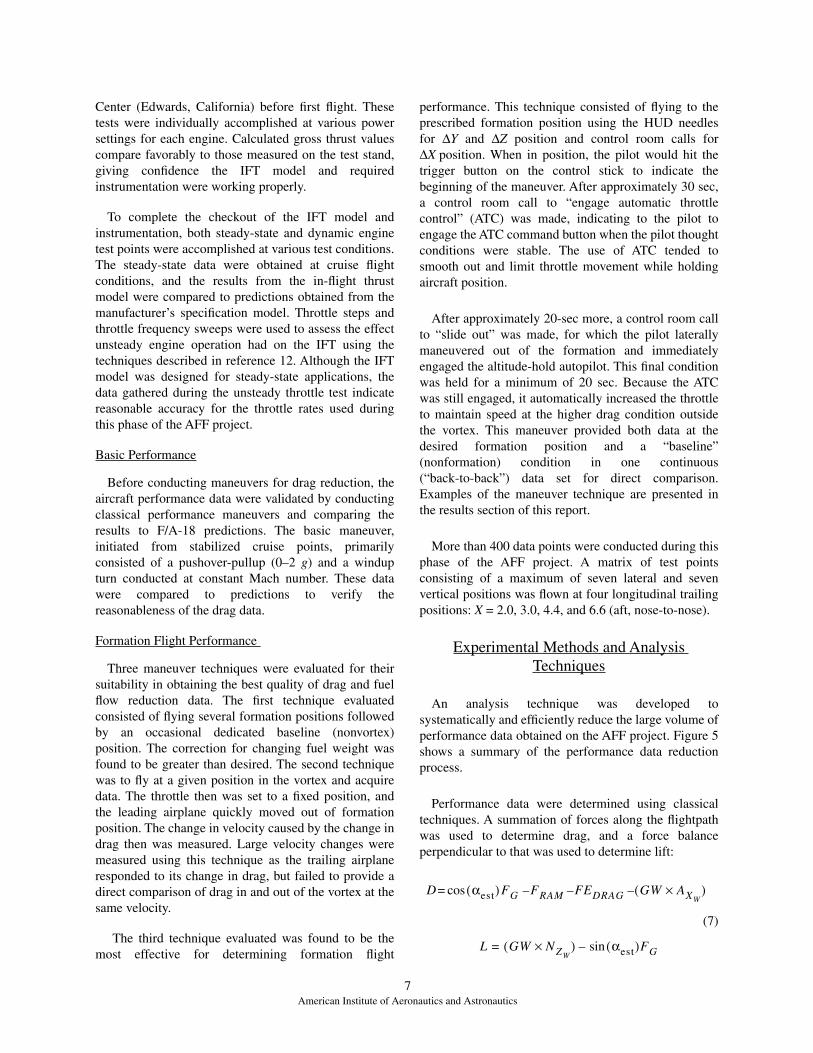
Performance data were determined using classicaltechniques. A summation of forces along the flightpathwas used to determine drag, and a force balanceperpendicular to that was used to determine lift:
(7)
D αest( )cos= FG FRAM FEDRAG GW AXW×( )–––
L GW NZW×( ) αest( )sin–= FG
7American Institute of Aeronautics and Astronautics
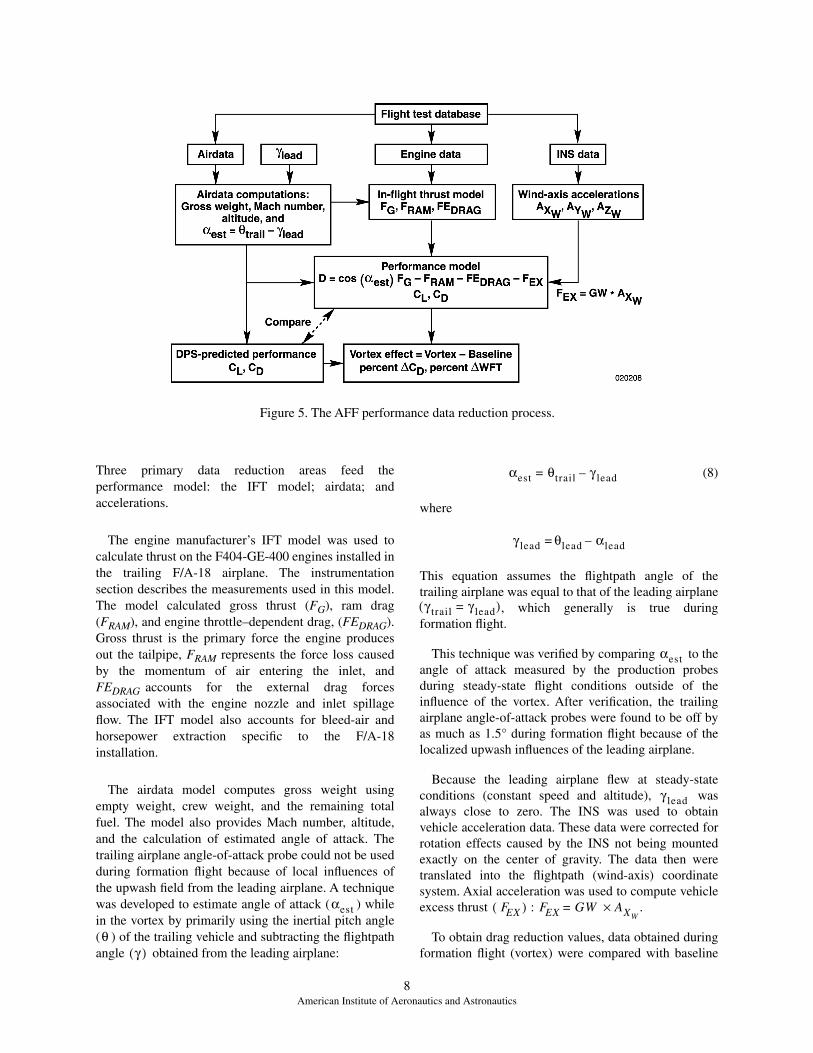
Figure 5. The AFF performance data reduction process.
Three primary data reduction areas feed theperformance model: the IFT model; airdata; andaccelerations.
The engine manufacturer’s IFT model was used tocalculate thrust on the F404-GE-400 engines installed inthe trailing F/A-18 airplane. The instrumentationsection describes the measurements used in this model.The model calculated gross thrust (FG), ram drag(FRAM), and engine throttle–dependent drag, (FEDRAG).Gross thrust is the primary force the engine producesout the tailpipe, FRAM represents the force loss causedby the momentum of air entering the inlet, andFEDRAG accounts for the external drag forcesassociated with the engine nozzle and inlet spillageflow. The IFT model also accounts for bleed-air andhorsepower extraction specific to the F/A-18installation.
The airdata model computes gross weight usingempty weight, crew weight, and the remaining totalfuel. The model also provides Mach number, altitude,and the calculation of estimated angle of attack. Thetrailing airplane angle-of-attack probe could not be usedduring formation flight because of local influences ofthe upwash field from the leading airplane. A techniquewas developed to estimate angle of attack ( ) whilein the vortex by primarily using the inertial pitch angle( ) of the trailing vehicle and subtracting the flightpathangle obtained from the leading airplane:
(8)
where
This equation assumes the flightpath angle of thetrailing airplane was equal to that of the leading airplane
, which generally is true duringformation flight.
This technique was verified by comparing to theangle of attack measured by the production probesduring steady-state flight conditions outside of theinfluence of the vortex. After verification, the trailingairplane angle-of-attack probes were found to be off byas much as 1.5° during formation flight because of thelocalized upwash influences of the leading airplane.
Because the leading airplane flew at steady-stateconditions (constant speed and altitude), wasalways close to zero. The INS was used to obtainvehicle acceleration data. These data were corrected forrotation effects caused by the INS not being mountedexactly on the center of gravity. The data then weretranslated into the flightpath (wind-axis) coordinatesystem. Axial acceleration was used to compute vehicleexcess thrust .
To obtain drag reduction values, data obtained duringformation flight (vortex) were compared with baseline
αest
θγ( )
αest θtrail= γ lead–
γ lead θlead= αlead–
γ trail γ lead=( )
αest
γ lead
FEX( ) : FEX GW AXW×=
8American Institute of Aeronautics and Astronautics
(nonvortex) data. Some AFF test points did not include aslide-out maneuver to obtain baseline conditions. Forthese few points, baseline data were estimated based onpredictions and data trends in drag related to grossweight. The digital performance simulation (DPS)computer model provided predictions for a similarlyconfigured F/A-18 airplane.13 This simple predictionmodel was developed from previous flight testing andwas used to evaluate the reasonableness of the baselineL and D values.
The was calculated to compare with basicprediction theory. The in-flight data werecalculated using predicted values of parasite dragobtained from wind-tunnel data and the followingrelationship:
(9)
An important element in the data analysis process wasdetermining the proper time period to use. Thecalculated drag plot was evaluated first to assureadequate data quality. Position data then were evaluatedto assure the conditions closest to the desired positionwere used. The fuel flow data were reviewed last, andthe time period was adjusted to account for localizedvariations in these data. The pilot (or ATC system, whenengaged) continuously pulsed the throttle to try andmaintain longitudinal position (or constant speed). Thispulsation resulted in cycles of increasing and decreasingfuel flow values. Because of the cyclic nature of the fuelflow data, small adjustments (1–2 sec) in choosing thetime period could have large effects on the average fuelflow value for a given time period. More reasonablevalues of fuel flow were obtained by adjusting the timeperiod to capture complete cycles of throttle movement.This adjustment had little impact on the overall dragresults.
A real-time drag reduction model was implemented inthe control room using the manufacturer’s IFT model tocalculate thrust. Although not as sophisticated as thepostflight analysis model, the real-time drag model didprovide sufficient information regarding the quality ofperformance data while the data were being obtained,thus enhancing the efficiency of the data gathering.14
Because of this capability, poor quality test points couldbe immediately repeated and other test points droppedwhen the previous point resulted in little or noperformance benefit.
To maximize the number of points obtained, some testpoints where performance benefits were predicted to be
small did not include a baseline or slide-out maneuver.For these cases, performance trend data based on grossweight from other slide-out points were used to estimatethe baseline drag.
The uncertainty in the calculated coefficient of drag(CD) is estimated to be on the order of 5 percent. Theflight test technique of comparing calculated CD information flight ( ) to that of the baseline condition( ) minimizes any bias effects. Several additionalfactors influenced the final uncertainty of the data;including variations in maneuver technique, airturbulence, stability of the vortex location, and theaccuracy of the position measurement system. Anotherimportant factor was the effect fuel burn had on vortexstrength of the leading airplane and on the absolute dragvalue calculated for the trailing airplane. No correctionsfor trim drag effects were made. Time-averaging thedata and repeating several data points helped improvethe overall quality of the results. However, the finaluncertainty is difficult to fully access because the factorsdiscussed above are difficult to quantify.
Results
This report focuses on the AFF performance flight testand analysis techniques developed and applied to get theAFF performance result. Only samples of the flightresult are presented to illustrate this aspect. Thesesamples focus on one flight condition: Mach 0.56 at analtitude of 25,000 ft and a trailing position of .Most of the AFF data were gathered at this testcondition, and reference 15 provides a comprehensivereview of the drag and fuel flow results for all testconditions for this phase of the AFF project.
Data quality varied during this phase of the testingprimarily because of the difficulty pilots incurred tryingto hold the specified relative position required to mapthe performance benefits, and because of atmospheric orturbulence effects. Several positions were highlyunstable, particularly those with large overlap in wingposition. In some cases, the leading airplane wingtipvortex impinged directly on the trailing airplane tail.Where possible, testing was repeated to try to improvedata quality.
Basic Performance
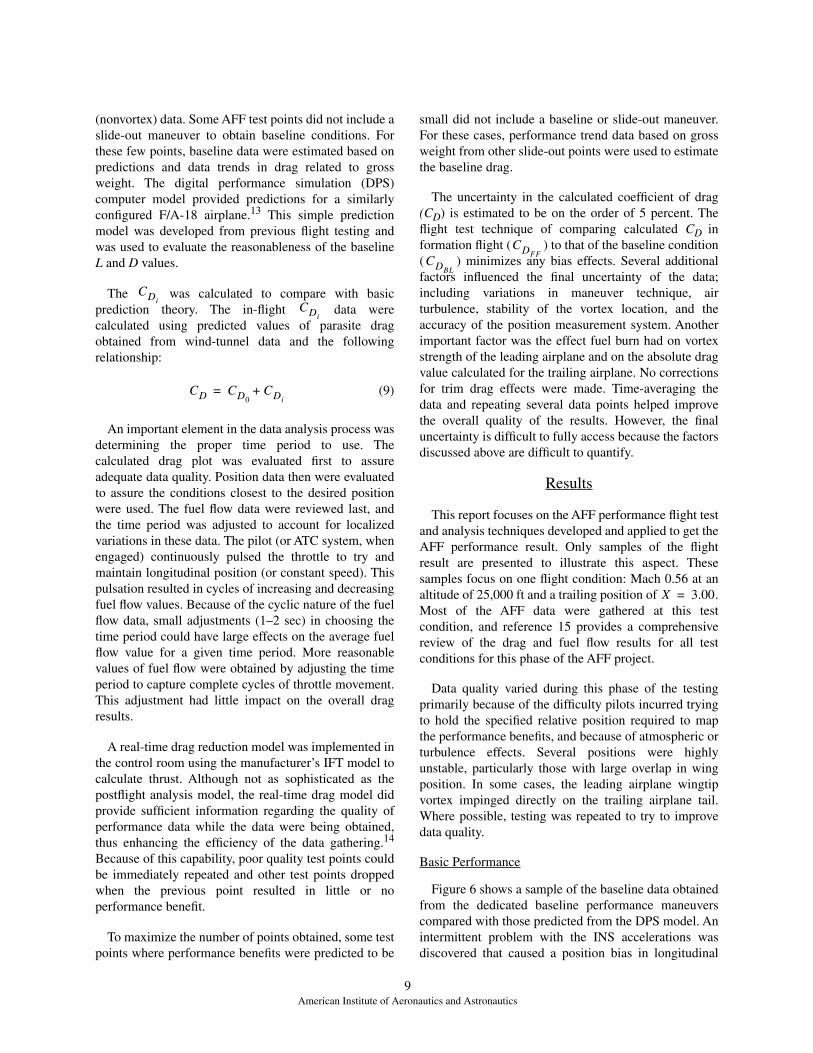
Figure 6 shows a sample of the baseline data obtainedfrom the dedicated baseline performance maneuverscompared with those predicted from the DPS model. Anintermittent problem with the INS accelerations wasdiscovered that caused a position bias in longitudinal
CDiCDi
CD CD0CDi
+=
CDFFCDBL
X 3.00=
9American Institute of Aeronautics and Astronautics
Figure 6. Sample comparison of baseline and slide-out performance data with predicted data from flight testconditions of Mach 0.56 and an altitude of 25,000 ft.
acceleration for some early test points. The INS wasreplaced after flight 731 and the problem was resolved.The resulting bias CD was limited to less than 5 percentof the total test points. Because CD was always biased(approximately 10-percent) higher than actual duringthis anomaly, it resulted in conservative values ofcalculated percent drag reduction (approximately 0.9 ofactual). Many of these test points were repeated later inthe flight program, particularly those near maximumdrag reduction. Except for this anomaly, the stabilizedbaseline test points compare favorably to thepredictions. These results give confidence to the validityof the performance values obtained from the AFFperformance analysis code. Because of their simplicity,the DPS-predicted results were added to allperformance data outputs (fig. 5) to assure the baselinemaneuvers continued to yield reasonable results.
Figure 6 also shows excellent agreement between theslide-out performance data and the dedicatedperformance baseline points. Because of this agreement,very few dedicated baseline points were flown later inthe program.
Drag Reduction
Figure 7 shows a sample of an AFF test point and thecalculated drag reduction results. The figure showsMach number and fuel flow values for both aircraft, and
positioning and calculated performance data for thetrailing airplane. Using the direct comparison withbaseline conditions the flight test maneuver techniqueprovides, the data clearly show a large reduction in CDoccurs while the airplane is in the vortex. Fuel flow alsoundergoes a significant change as the ATC responds tothe drag change when the airplane transitions out of thevortex. The cyclic nature of the fuel flow data is alsoevident, particularly when using manual throttle control.The fuel flow values for the leading airplane show noevidence the trailing airplane is influencing itsperformance.
Data Quality
The overall quality of each maneuver and the totaldata varied because of atmospheric conditions, unstablevortex effects at some positions, and pilot technique orexperience. Turbulent flight conditions made it difficultto obtain stabilized data at the prescribed conditions.Fortunately, most flight data were gathered on dayswhen calm weather existed at altitude. Certain positionsin the vortex were very difficult to fly because the vorteximpinged directly on the vertical tail or fuselage and thenose wanted to wander back and forth. Some conditionscompletely discharged the airplane out of position.Because getting quality data at each condition wasdesired, most unstable points were repeated (sometimes
10American Institute of Aeronautics and Astronautics

11American Institute of Aeronautics and Astronautics
Figure 7. Sample performance maneuver from flight test conditions of Mach 0.56 and an altitude of 25,000 ftshowing drag reduction.
more than once) to try and improve the results. Aftergaining a feel for what to expect, the pilot usually did abetter job on the repeat maneuver. The real-time displayof aeroperformance data, in particular CD and thecoefficient of lift (CL), greatly aided in assessing thequality of the data.
The pilots often had difficulty gauging when to turnthe ATC system on while in the vortex. Often the throttlewould immediately adjust up or down, moving theairplane out of the longitudinal tolerance requirements.The pilots or control room would monitor this and makea call to reacquire the X position. Good quality pointstypically had more than 15 sec of ATC engaged whilethe airplane was in the desired vortex position, andmaintained Mach number and altitude conditions duringthe slide-out segment to the baseline condition. The useof ATC on these maneuvers clearly show the fuelsavings while in the vortex. Manual throttle use tendedto have significantly larger throttle transients while thepilot tried to maintain condition, often affecting the fuelflow results (fig. 7). The drag values tend to be not verysensitive to throttle change unless the amplitude or rateis very high.
One challenge in evaluating the drag reduction datawas finding periods of time within a maneuver wherethe pilot maintained proper positioning. For a30–60-sec formation maneuver, sometimes only 10 secwere adequately on the target conditions becauseconditions were unstable. Also, 10 sec sometimeselapsed after the slide out before the airplane settleddown to a good baseline condition.
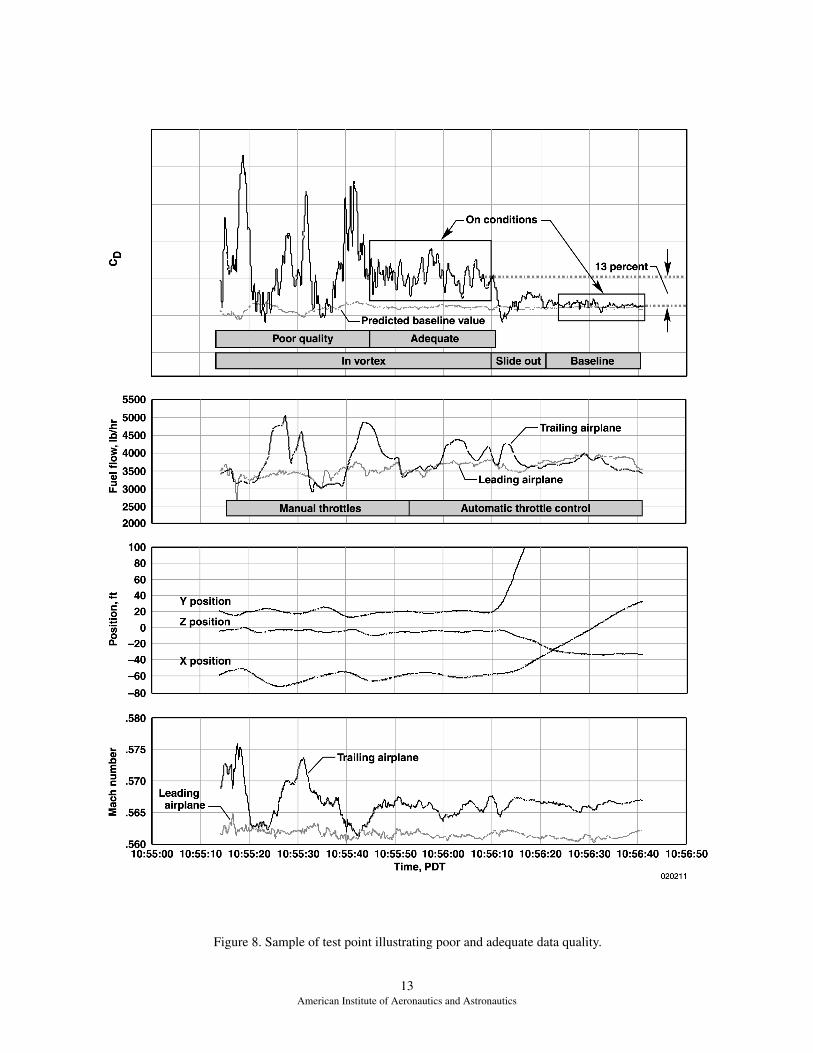
To help ascertain the overall quality of the final dataset, a rating system was applied to the results obtainedfrom each test point. Based on the maneuver and dataquality issues discussed above, a rating of “good,”“adequate,” or “poor” was applied. Typically, the testpoints where large performance gains were obtainedrated adequate to good. Test points that were unstable ordifficult at which to fly were often rated poor. A fewrandom points rated poor because of extreme turbulentconditions. Several data points in the region with thelargest gains were repeated at least once, allowing thebest quality of data to complete the final matrix of data.Figure 7 shows an example of a data point rated good;figure 8 shows examples of adequate and poor ratings.
The problems with the region of the test point ratedpoor are caused by two accumulative factors: excessivedynamics of position data, and inconsistent drag valueswhile the airplane is in the vortex. This maneuverillustrates how the pilot was able to “improve”technique during the test point and eventually obtainadequate data. Figure 8 also shows the significant dragpenalty that occurs when flying at positions with largewing overlap.
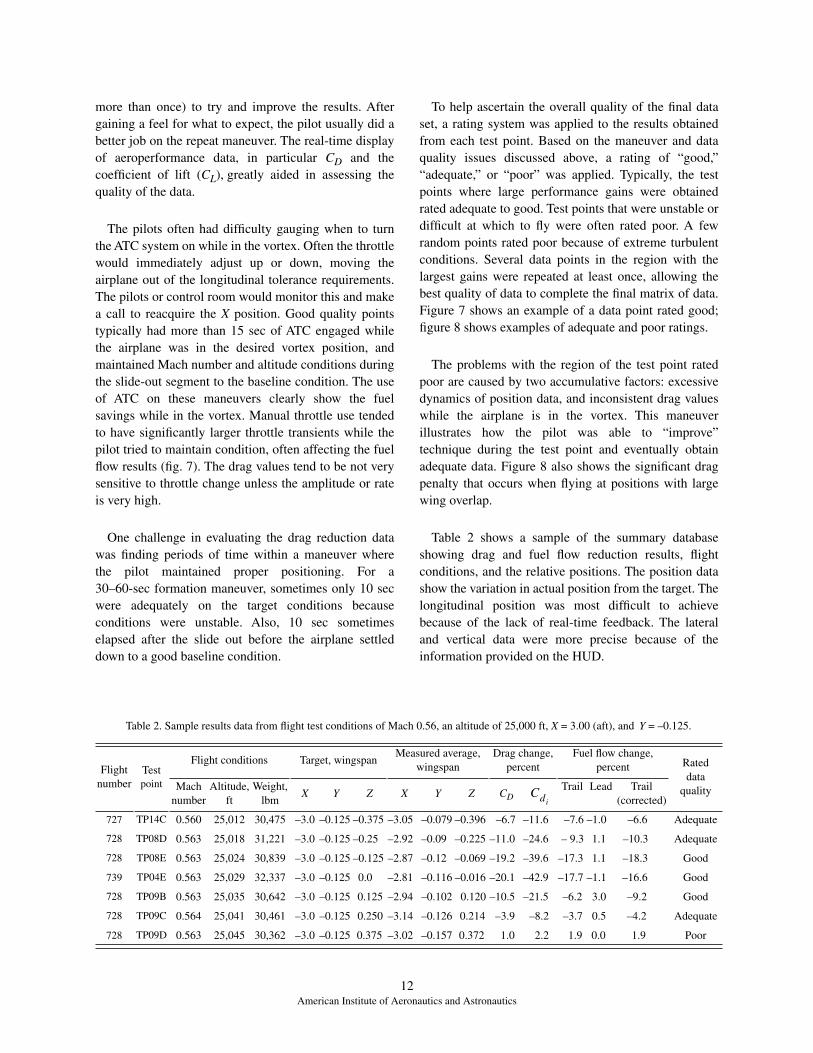
Table 2 shows a sample of the summary databaseshowing drag and fuel flow reduction results, flightconditions, and the relative positions. The position datashow the variation in actual position from the target. Thelongitudinal position was most difficult to achievebecause of the lack of real-time feedback. The lateraland vertical data were more precise because of theinformation provided on the HUD.
12American Institute of Aeronautics and Astronautics
Table 2. Sample results data from flight test conditions of Mach 0.56, an altitude of 25,000 ft, X = 3.00 (aft), and Y = –0.125.
Flight number
Test point
Flight conditions Target, wingspanMeasured average,
wingspanDrag change,
percentFuel flow change,
percent Rated data
qualityMach number
Altitude,ft
Weight,lbm
X Y Z X Y Z CDTrail Lead Trail
(corrected)
727 TP14C 0.560 25,012 30,475 –3.0 –0.125 –0.375 –3.05 –0.079 –0.396 –6.7 –11.6 –7.6 –1.0 –6.6 Adequate
728 TP08D 0.563 25,018 31,221 –3.0 –0.125 –0.25 –2.92 –0.09 –0.225 –11.0 –24.6 – 9.3 1.1 –10.3 Adequate
728 TP08E 0.563 25,024 30,839 –3.0 –0.125 –0.125 –2.87 –0.12 –0.069 –19.2 –39.6 –17.3 1.1 –18.3 Good
739 TP04E 0.563 25,029 32,337 –3.0 –0.125 0.0 –2.81 –0.116 –0.016 –20.1 –42.9 –17.7 –1.1 –16.6 Good
728 TP09B 0.563 25,035 30,642 –3.0 –0.125 0.125 –2.94 –0.102 0.120 –10.5 –21.5 –6.2 3.0 –9.2 Good
728 TP09C 0.564 25,041 30,461 –3.0 –0.125 0.250 –3.14 –0.126 0.214 –3.9 –8.2 –3.7 0.5 –4.2 Adequate
728 TP09D 0.563 25,045 30,362 –3.0 –0.125 0.375 –3.02 –0.157 0.372 1.0 2.2 1.9 0.0 1.9 Poor
Cdi
13American Institute of Aeronautics and Astronautics
Figure 8. Sample of test point illustrating poor and adequate data quality.
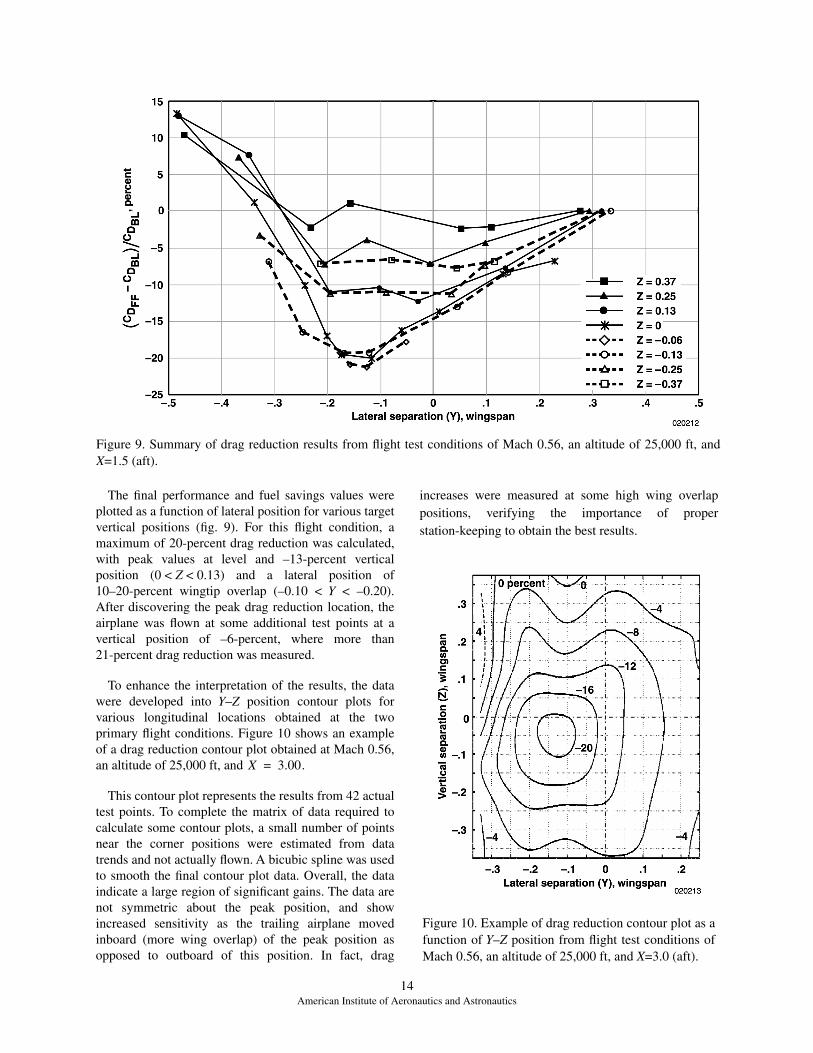
Figure 9. Summary of drag reduction results from flight test conditions of Mach 0.56, an altitude of 25,000 ft, andX=1.5 (aft).
The final performance and fuel savings values wereplotted as a function of lateral position for various targetvertical positions (fig. 9). For this flight condition, amaximum of 20-percent drag reduction was calculated,with peak values at level and –13-percent verticalposition (0 < Z < 0.13) and a lateral position of10–20-percent wingtip overlap (–0.10 < Y < –0.20).After discovering the peak drag reduction location, theairplane was flown at some additional test points at avertical position of –6-percent, where more than21-percent drag reduction was measured.
To enhance the interpretation of the results, the datawere developed into Y–Z position contour plots forvarious longitudinal locations obtained at the twoprimary flight conditions. Figure 10 shows an exampleof a drag reduction contour plot obtained at Mach 0.56,an altitude of 25,000 ft, and
This contour plot represents the results from 42 actualtest points. To complete the matrix of data required tocalculate some contour plots, a small number of pointsnear the corner positions were estimated from datatrends and not actually flown. A bicubic spline was usedto smooth the final contour plot data. Overall, the dataindicate a large region of significant gains. The data arenot symmetric about the peak position, and showincreased sensitivity as the trailing airplane movedinboard (more wing overlap) of the peak position asopposed to outboard of this position. In fact, drag
increases were measured at some high wing overlappositions, verifying the importance of properstation-keeping to obtain the best results.
X 3.00.=
Figure 10. Example of drag reduction contour plot as afunction of Y–Z position from flight test conditions ofMach 0.56, an altitude of 25,000 ft, and X=3.0 (aft).
14American Institute of Aeronautics and Astronautics
Fuel Reduction
To provide a one-to-one correspondence with the dragreduction data, fuel reduction values were alsocalculated for the same exact time periods used for thedrag contour. In addition, the leading airplane was alsoevaluated for these periods to determine if a pattern offuel flow changes could be detected corresponding tothe trailing airplane position. Although nocorrespondence was determined, the leading airplanedid sometimes show fuel flow shifts corresponding tochanges in atmospheric conditions such as wind shear.
Figures 7 and 8 show this effect to some degree, andhow the autopilot or throttles of both aircraft try tomaintain constant speed during the baseline testcondition. When both the leading and trailing aircrafthave ATC engaged, they react similarly (in fuel flowchanges) to the same atmospheric disturbance. Thediscovery of this result led to adding a correction to thetrailing airplane fuel flow reduction based on changes inthe leading airplane as follows:
(10)
Table 2 shows the percent of fuel flow change for boththe leading and trailing aircraft for a sample of data.Figure 11 shows the resulting contour plot using thecorrected fuel flow values for the same matrix of dataused to calculate the drag contour plot from flightconditions of Mach 0.56, an altitude of 25,000 ft, and
aft.
The fuel flow reduction data trends are very similar inshape to the drag reduction data, averaging 2–3-percentless in overall magnitude. These results give confidenceto the overall drag reduction values.
Validation of Basic Theoretical Predictions
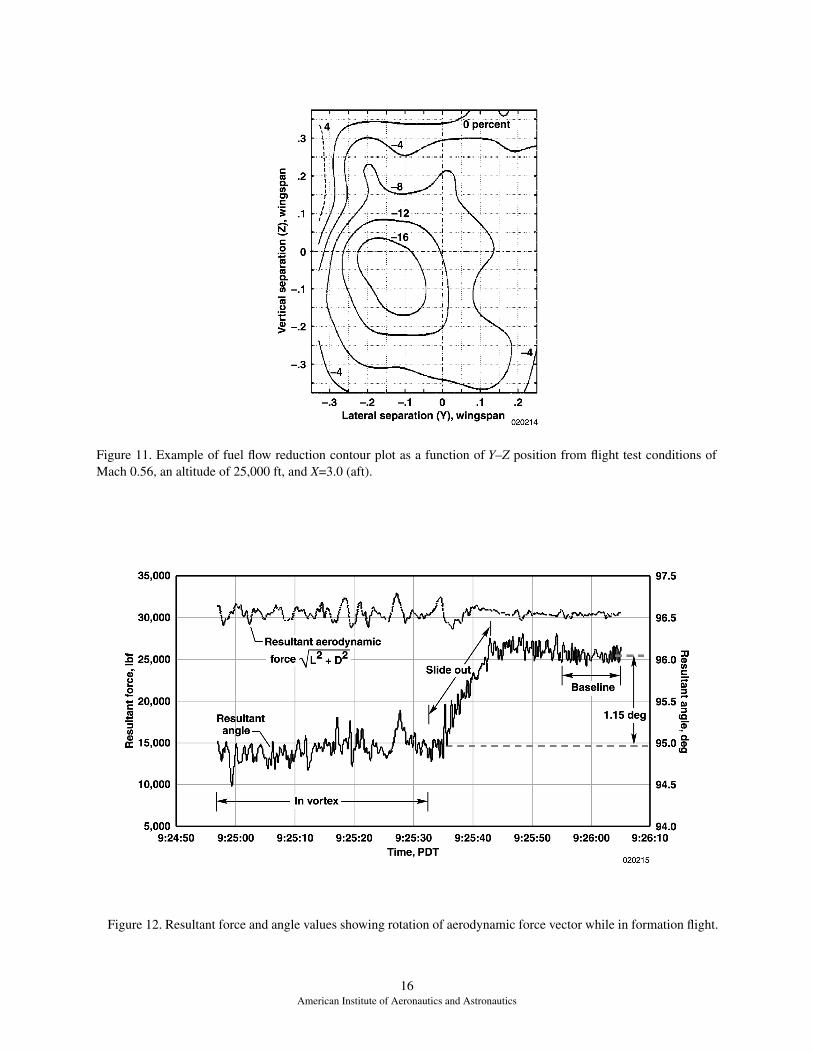
Figure 12 shows the resultant force and corresponding
angle (relative to the horizon) for the maneuver shown
in figure 7. Although the resultant force value varies
more while the airplane is in formation because of
aircraft dynamics, no significant change in overall
magnitude is seen compared to nonformation flight.
This result confirms the theoretical assumptions
previously discussed that drag reduction is the result of
the rotation of the aerodynamic resultant force
, which can be assumed to remain constant
(fig. 1).
Note the similarity in shape of the resultant angle plotin figure 12 and the drag coefficient plot shown infigure 7. This similarity is because drag is highlydependent on angle of attack, which changes similarlyto how the resultant force angle does when the airplanepitches down while the airplane is in formation flight.The force vector angle shows a rotation of 1.15-degforward with respect to the horizon while the airplane isin formation flight.
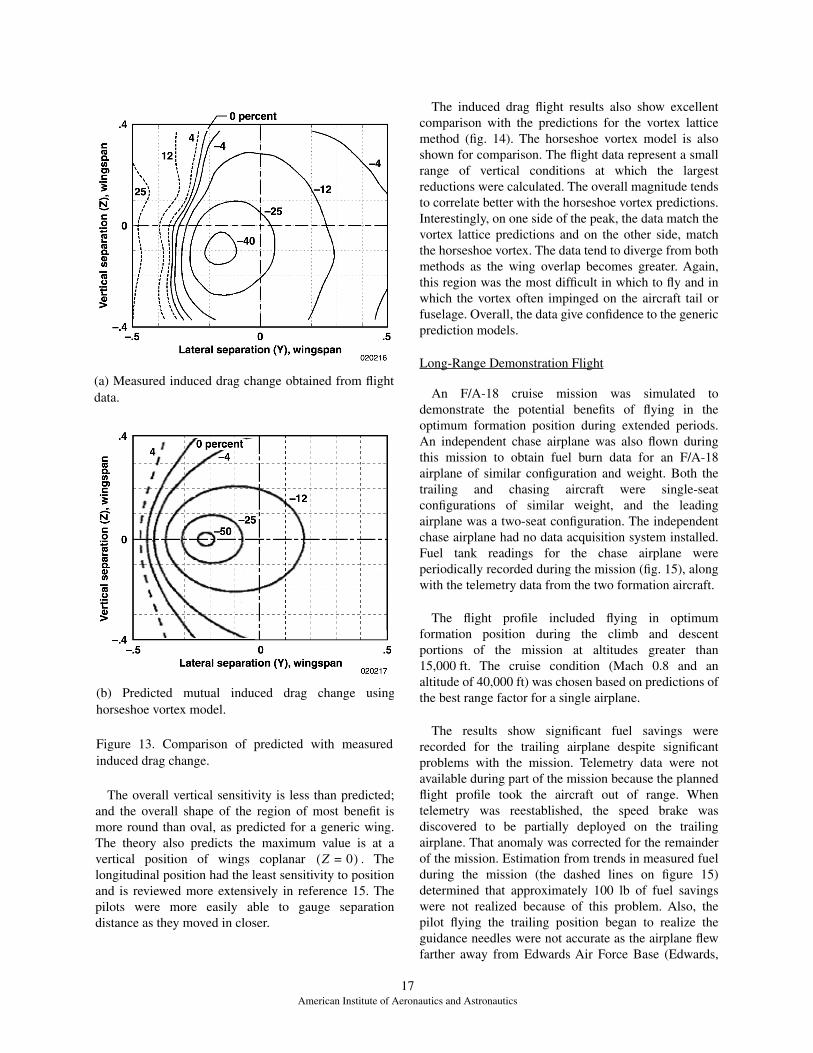
The induced drag reduction results (fig. 13) showexcellent comparison to the simple horseshoe vortexprediction model previously discussed. To improve theoverall quality of the database for developing thiscontour plot, the data were interpolated from 45 originaldata points to a finer grid (147 data points) followinggeneral trends and using extrapolation techniques to fillin missing data points along the outer edges. A bicubicspline was again used to smooth the final contour plotdata.
The overall shape and magnitudes of the flight and
simple prediction model are very similar. The maximum
flight-measured drag location is at a slightly lower
vertical location, which is caused by the generic model
assuming a planar wake. The size of the “sweet spot”
region (more than 25-percent reduction) was
calculated to be significantly larger in flight than in the
simple analytical model. This result is important,
indicating that an AFF controller might not need to be as
precise as predicted to achieve large benefits.
The flight results also show higher drag increases atlarge wingtip overlap than predicted by the generictheory, but this region is also the one where data qualityis worse because the points are more difficult at whichto fly. Higher trim drag effects can also contribute to thelarge drag increases. The line of zero benefit is alsolocated at a lower overlap position than in the simpletheory. These results indicate substantially highersensitivity to lateral positioning inboard of the sweetspot than predicted. Small changes in lateral positioningin this region can result in large changes in benefits.
Percent∆WFT trail (corrected)
= Percent ∆WFT trail Percent – ∆WFT lead
X 3.00=
L2
D2
+
CDi
CDi
15American Institute of Aeronautics and Astronautics
16American Institute of Aeronautics and Astronautics
Figure 11. Example of fuel flow reduction contour plot as a function of Y–Z position from flight test conditions ofMach 0.56, an altitude of 25,000 ft, and X=3.0 (aft).
Figure 12. Resultant force and angle values showing rotation of aerodynamic force vector while in formation flight.
The overall vertical sensitivity is less than predicted;and the overall shape of the region of most benefit ismore round than oval, as predicted for a generic wing.The theory also predicts the maximum value is at avertical position of wings coplanar . Thelongitudinal position had the least sensitivity to positionand is reviewed more extensively in reference 15. Thepilots were more easily able to gauge separationdistance as they moved in closer.
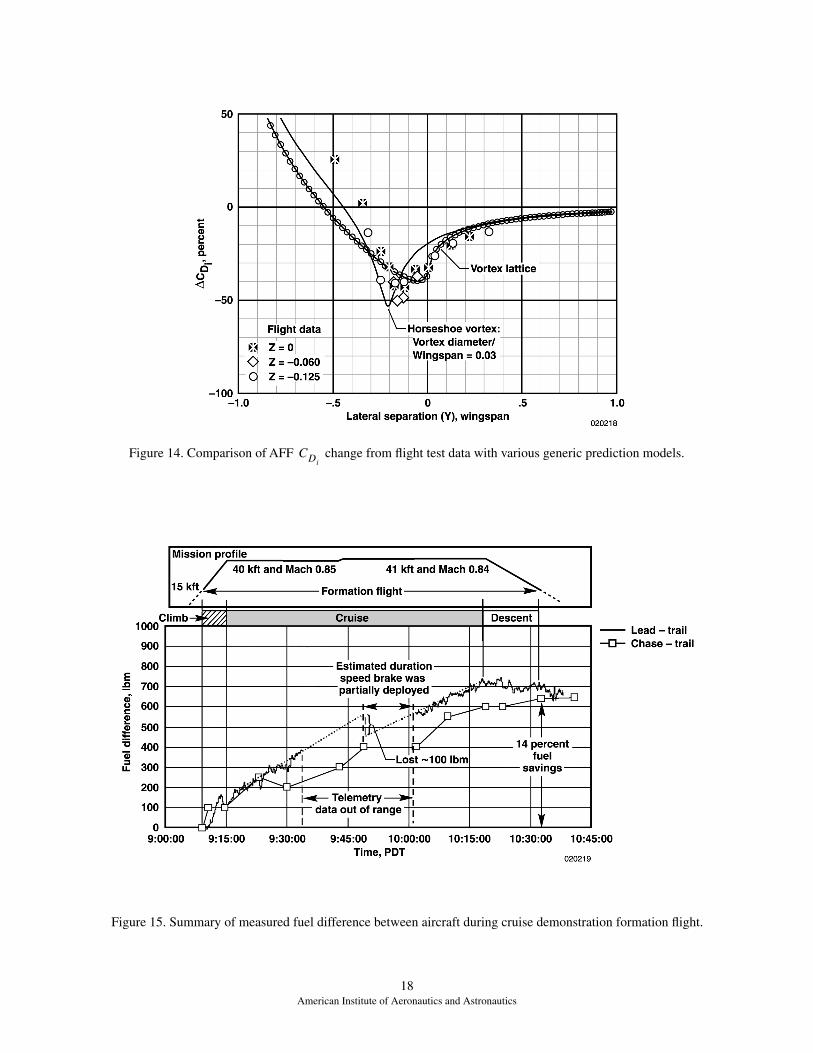
The induced drag flight results also show excellentcomparison with the predictions for the vortex latticemethod (fig. 14). The horseshoe vortex model is alsoshown for comparison. The flight data represent a smallrange of vertical conditions at which the largestreductions were calculated. The overall magnitude tendsto correlate better with the horseshoe vortex predictions.Interestingly, on one side of the peak, the data match thevortex lattice predictions and on the other side, matchthe horseshoe vortex. The data tend to diverge from bothmethods as the wing overlap becomes greater. Again,this region was the most difficult in which to fly and inwhich the vortex often impinged on the aircraft tail orfuselage. Overall, the data give confidence to the genericprediction models.
Long-Range Demonstration Flight
An F/A-18 cruise mission was simulated todemonstrate the potential benefits of flying in theoptimum formation position during extended periods.An independent chase airplane was also flown duringthis mission to obtain fuel burn data for an F/A-18airplane of similar configuration and weight. Both thetrailing and chasing aircraft were single-seatconfigurations of similar weight, and the leadingairplane was a two-seat configuration. The independentchase airplane had no data acquisition system installed.Fuel tank readings for the chase airplane wereperiodically recorded during the mission (fig. 15), alongwith the telemetry data from the two formation aircraft.
The flight profile included flying in optimumformation position during the climb and descentportions of the mission at altitudes greater than15,000 ft. The cruise condition (Mach 0.8 and analtitude of 40,000 ft) was chosen based on predictions ofthe best range factor for a single airplane.
The results show significant fuel savings wererecorded for the trailing airplane despite significantproblems with the mission. Telemetry data were notavailable during part of the mission because the plannedflight profile took the aircraft out of range. Whentelemetry was reestablished, the speed brake wasdiscovered to be partially deployed on the trailingairplane. That anomaly was corrected for the remainderof the mission. Estimation from trends in measured fuelduring the mission (the dashed lines on figure 15)determined that approximately 100 lb of fuel savingswere not realized because of this problem. Also, thepilot flying the trailing position began to realize theguidance needles were not accurate as the airplane flewfarther away from Edwards Air Force Base (Edwards,
(b) Predicted mutual induced drag change usinghorseshoe vortex model.
Figure 13. Comparison of predicted with measuredinduced drag change.
Z 0=( )
(a) Measured induced drag change obtained from flightdata.
17American Institute of Aeronautics and Astronautics
18American Institute of Aeronautics and Astronautics
Figure 14. Comparison of AFF change from flight test data with various generic prediction models.CDi
Figure 15. Summary of measured fuel difference between aircraft during cruise demonstration formation flight.
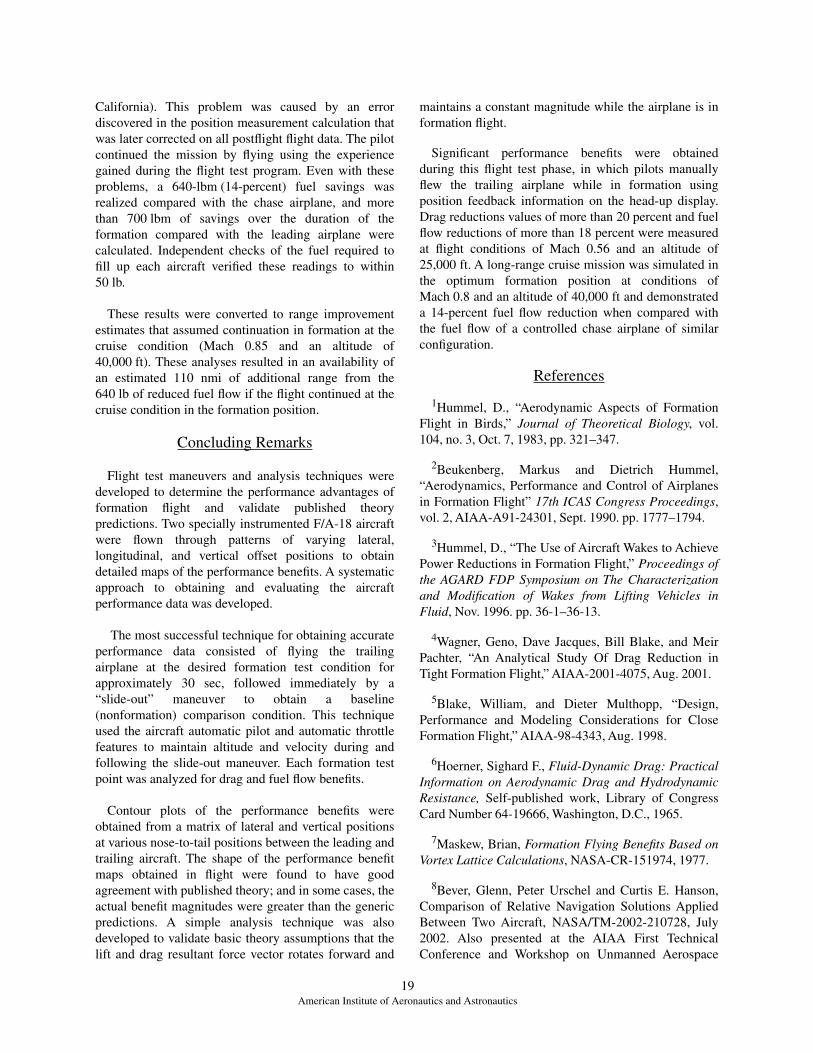
California). This problem was caused by an errordiscovered in the position measurement calculation thatwas later corrected on all postflight flight data. The pilotcontinued the mission by flying using the experiencegained during the flight test program. Even with theseproblems, a 640-lbm (14-percent) fuel savings wasrealized compared with the chase airplane, and morethan 700 lbm of savings over the duration of theformation compared with the leading airplane werecalculated. Independent checks of the fuel required tofill up each aircraft verified these readings to within50 lb.
These results were converted to range improvementestimates that assumed continuation in formation at thecruise condition (Mach 0.85 and an altitude of40,000 ft). These analyses resulted in an availability ofan estimated 110 nmi of additional range from the640 lb of reduced fuel flow if the flight continued at thecruise condition in the formation position.
Concluding Remarks
Flight test maneuvers and analysis techniques weredeveloped to determine the performance advantages offormation flight and validate published theorypredictions. Two specially instrumented F/A-18 aircraftwere flown through patterns of varying lateral,longitudinal, and vertical offset positions to obtaindetailed maps of the performance benefits. A systematicapproach to obtaining and evaluating the aircraftperformance data was developed.
The most successful technique for obtaining accurateperformance data consisted of flying the trailingairplane at the desired formation test condition forapproximately 30 sec, followed immediately by a“slide-out” maneuver to obtain a baseline(nonformation) comparison condition. This techniqueused the aircraft automatic pilot and automatic throttlefeatures to maintain altitude and velocity during andfollowing the slide-out maneuver. Each formation testpoint was analyzed for drag and fuel flow benefits.
Contour plots of the performance benefits wereobtained from a matrix of lateral and vertical positionsat various nose-to-tail positions between the leading andtrailing aircraft. The shape of the performance benefitmaps obtained in flight were found to have goodagreement with published theory; and in some cases, theactual benefit magnitudes were greater than the genericpredictions. A simple analysis technique was alsodeveloped to validate basic theory assumptions that thelift and drag resultant force vector rotates forward and
maintains a constant magnitude while the airplane is information flight.
Significant performance benefits were obtainedduring this flight test phase, in which pilots manuallyflew the trailing airplane while in formation usingposition feedback information on the head-up display.Drag reductions values of more than 20 percent and fuelflow reductions of more than 18 percent were measuredat flight conditions of Mach 0.56 and an altitude of25,000 ft. A long-range cruise mission was simulated inthe optimum formation position at conditions ofMach 0.8 and an altitude of 40,000 ft and demonstrateda 14-percent fuel flow reduction when compared withthe fuel flow of a controlled chase airplane of similarconfiguration.
References
1Hummel, D., “Aerodynamic Aspects of FormationFlight in Birds,” Journal of Theoretical Biology, vol.104, no. 3, Oct. 7, 1983, pp. 321–347.
2Beukenberg, Markus and Dietrich Hummel,“Aerodynamics, Performance and Control of Airplanesin Formation Flight” 17th ICAS Congress Proceedings,vol. 2, AIAA-A91-24301, Sept. 1990. pp. 1777–1794.
3Hummel, D., “The Use of Aircraft Wakes to AchievePower Reductions in Formation Flight,” Proceedings ofthe AGARD FDP Symposium on The Characterizationand Modification of Wakes from Lifting Vehicles inFluid, Nov. 1996. pp. 36-1–36-13.
4Wagner, Geno, Dave Jacques, Bill Blake, and MeirPachter, “An Analytical Study Of Drag Reduction inTight Formation Flight,” AIAA-2001-4075, Aug. 2001.
5Blake, William, and Dieter Multhopp, “Design,Performance and Modeling Considerations for CloseFormation Flight,” AIAA-98-4343, Aug. 1998.
6Hoerner, Sighard F., Fluid-Dynamic Drag: PracticalInformation on Aerodynamic Drag and HydrodynamicResistance, Self-published work, Library of CongressCard Number 64-19666, Washington, D.C., 1965.
7Maskew, Brian, Formation Flying Benefits Based onVortex Lattice Calculations, NASA-CR-151974, 1977.
8Bever, Glenn, Peter Urschel and Curtis E. Hanson,Comparison of Relative Navigation Solutions AppliedBetween Two Aircraft, NASA/TM-2002-210728, July2002. Also presented at the AIAA First TechnicalConference and Workshop on Unmanned Aerospace
19American Institute of Aeronautics and Astronautics
Vehicles, Systems, Technologies and Operations,Portsmouth, Virginia, 20-23 May 2002.
9Hanson, Curtis E., Jack Ryan, Michael J. Allen, andSteven R. Jacobson, “An Overview of Flight TestResults for a Formation Flight Autopilot,”AIAA-2002-4755, Aug. 2002.
10General Electric Co., “In-Flight Thrust CalculationProgram,” software program no. 83112, version8-08-83, General Electric Co., 1983.
11Ray, Ronald J., Evaluation of Various ThrustCalculation Techniques on an F404 Engine, NASATP-3001, 1990.
12Ray, Ronald J., Evaluating the Dynamic Responseof In-Flight Thrust Calculation Techniques DuringThrottle Transients, NASA TM-4591, 1994.
13Orme, John S., Digital Performance SimulationModels of the F-15, F-16XL, F-18, F104, TACT F-111,X-29 and Hypersonic Research Vehicle, NASATM-104244, 1992. (Distribution authorized to U.S.Government agencies and their contractors.)
14Ray, R. J., J. W. Hick, and R. I. Alexander,Development of a Real-Time Aeroperformance AnalysisTechnique for the X-29A Advanced TechnologyDemonstrator, NASA TM-100432, 1988.
15Vachon, M. Jake, Ronald J. Ray, Kevin R. Walsh,Kimberly A. Ennix, “Measured Performance BenefitsDuring the Autonomous Formation Flight Program,”AIAA 2002-4491, August 2002.
20American Institute of Aeronautics and Astronautics
REPORT DOCUMENTATION PAGE
Form ApprovedOMB No. 0704-0188
Public reporting burden for this collection of information is estimated to average 1 hour per response, including the time for reviewing instructions, searching existing data sources, gathering andmaintaining the data needed, and completing and reviewing the collection of information. Send comments regarding this burden estimate or any other aspect of this collection of information,including suggestions for reducing this burden, to Washington Headquarters Services, Directorate for Information Operations and Reports, 1215 Jefferson Davis Highway, Suite 1204, Arlington,VA 22202-4302, and to the Office of Management and Budget, Paperwork Reduction Project (0704-0188), Washington, DC 20503.
1. AGENCY USE ONLY (Leave blank) 2. REPORT DATE 3. REPORT TYPE AND DATES COVERED
4. TITLE AND SUBTITLE 5. FUNDING NUMBERS
6. AUTHOR(S)
8. PERFORMING ORGANIZATION REPORT NUMBER
7. PERFORMING ORGANIZATION NAME(S) AND ADDRESS(ES)
9. SPONSORING/MONITORING AGENCY NAME(S) AND ADDRESS(ES) 10. SPONSORING/MONITORING AGENCY REPORT NUMBER
11. SUPPLEMENTARY NOTES
12a. DISTRIBUTION/AVAILABILITY STATEMENT 12b. DISTRIBUTION CODE
13. ABSTRACT (Maximum 200 words)
14. SUBJECT TERMS 15. NUMBER OF PAGES
16. PRICE CODE
17. SECURITY CLASSIFICATION OF REPORT
18. SECURITY CLASSIFICATION OF THIS PAGE
19. SECURITY CLASSIFICATION OF ABSTRACT
20. LIMITATION OF ABSTRACT
NSN 7540-01-280-5500 Standard Form 298 (Rev. 2-89)
Prescribed by ANSI Std. Z39-18298-102
Flight Test Techniques Used to Evaluate Performance Benefits DuringFormation Flight
706 35 00 E8 28 00 AFF
Ronald J. Ray, Brent R. Cobleigh, M. Jake Vachon, and Clinton St. John
NASA Dryden Flight Research CenterP.O. Box 273Edwards, California 93523-0273
H-2500
National Aeronautics and Space AdministrationWashington, DC 20546-0001 NASA/TP-2002-210730
Previous investigations into formation flight have shown the possibility for significant fuel savings throughdrag reduction. Using two F/A-18 aircraft, NASA Dryden Flight Research Center has investigated flyingaircraft in autonomous formation. Positioning the trailing airplane for best drag reduction requiresinvestigation of the wingtip vortex effects induced by the leading airplane. A full accounting of the vortexeffect on the trailing airplane is desired to validate vortex-effect prediction methods and provide a database forthe design of a formation flight autopilot. A recent flight phase has mapped the complete wingtip vortex effectsat two flight conditions with the trailing airplane at varying distances behind the leading one. Force andmoment data at Mach 0.56 and an altitude of 25,000 ft and Mach 0.86 and an altitude of 36,000 ft have beenobtained with 20, 55, 110, and 190 ft of longitudinal distance between the aircraft. The moments induced bythe vortex on the trailing airplane were well within the pilot’s ability to control. This report discusses the dataanalysis methods and vortex-induced effects on moments and side force. An assessment of the impact of thenonlinear vortex effects on the design of a formation autopilot is offered.
Aircraft performance, drag reduction, drag measurement, performance tests, fuelconsumption
23
Unclassified Unclassified Unclassified Unlimited
August 2002 Technical Publication
Also presented at the AIAA Atmospheric Flight Mechanics Conference and Exhibit, Monterey, CA,August 5-8, 2002.
Unclassified—UnlimitedSubject Category 05
This report is available at http://www.dfrc.nasa.gov/DTRS/


![Flight! Magazin - Flight! März 2012 [CLASSICS]](https://img.pdfslide.net/doc/110x75/568ca7871a28ab186d95bb74/flight-magazin-flight-maerz-2012-classics.jpg)


![Flight! Magazin - Flight! Februar 2012 [CLASSICS]](https://img.pdfslide.net/doc/110x75/568ca77e1a28ab186d9592a3/flight-magazin-flight-februar-2012-classics.jpg)
![Flight! Magazin - Flight! November 2012 [CLASSICS]](https://img.pdfslide.net/doc/110x75/568ca77d1a28ab186d9590a4/flight-magazin-flight-november-2012-classics.jpg)