Embed Size (px)
Citation preview
FLOOD WARNING SYSTEMS IN THE
CARIBBEAN
by
Kailas Narayan
Hydrologist, CIMH

WORLD WATER FORUM III
KYOTO, JAPAN
16-23 MARCH, 2003
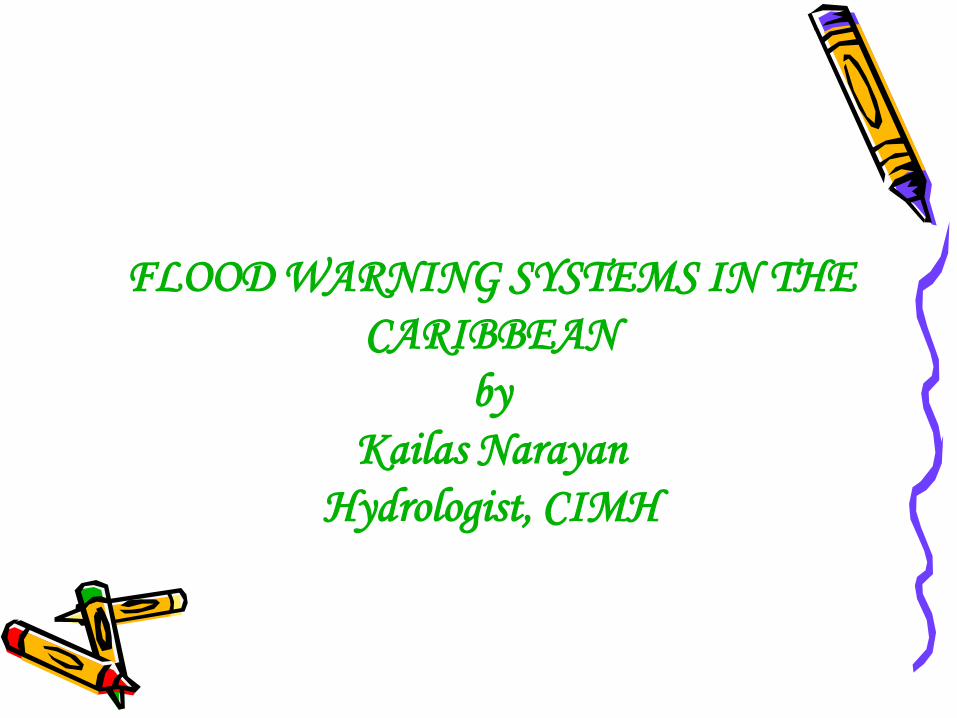
Flooding in the Caribbean Islands – mainly as a result of tropical storms & hurricanes;
most prevalent during the period August to October.
Floods in the smaller islands mainly flashy in nature & lasts for several hours. In larger islands, like Jamaica, they can persist for
longer periods.
A floodplain is defined as lowlands adjoining a channel, river, stream, water course or
lake that have been or may be inundated by flood water.
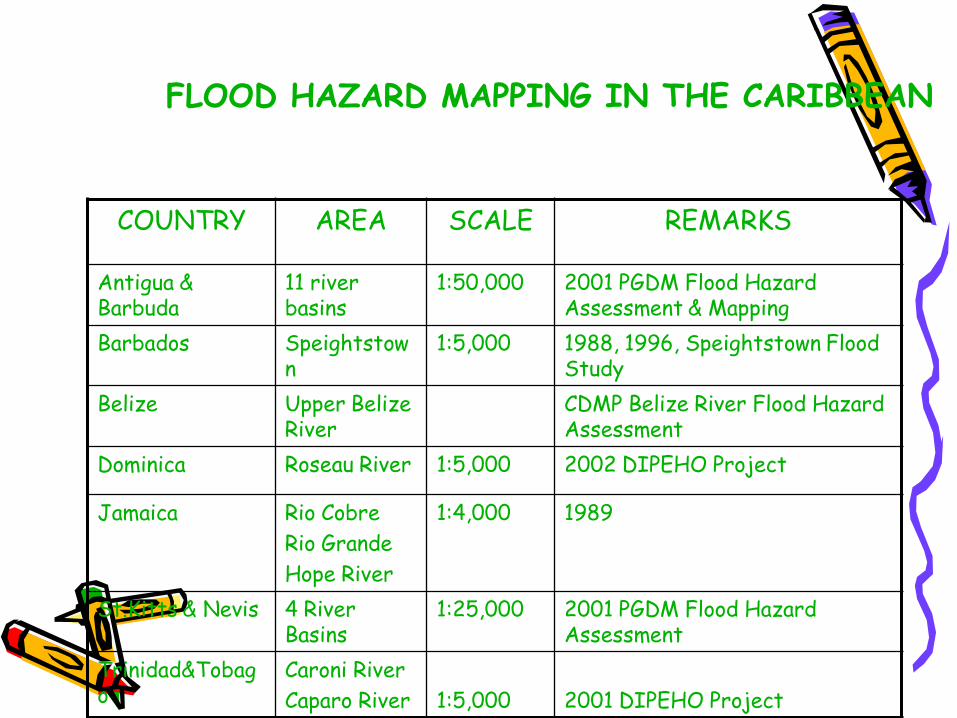
FLOOD HAZARD MAPPING IN THE CARIBBEAN
COUNTRY AREA SCALE REMARKS
Antigua & Barbuda
11 river basins
1:50,000 2001 PGDM Flood Hazard Assessment & Mapping
Barbados Speightstown
1:5,000 1988, 1996, Speightstown Flood Study
Belize Upper Belize River
CDMP Belize River Flood Hazard Assessment
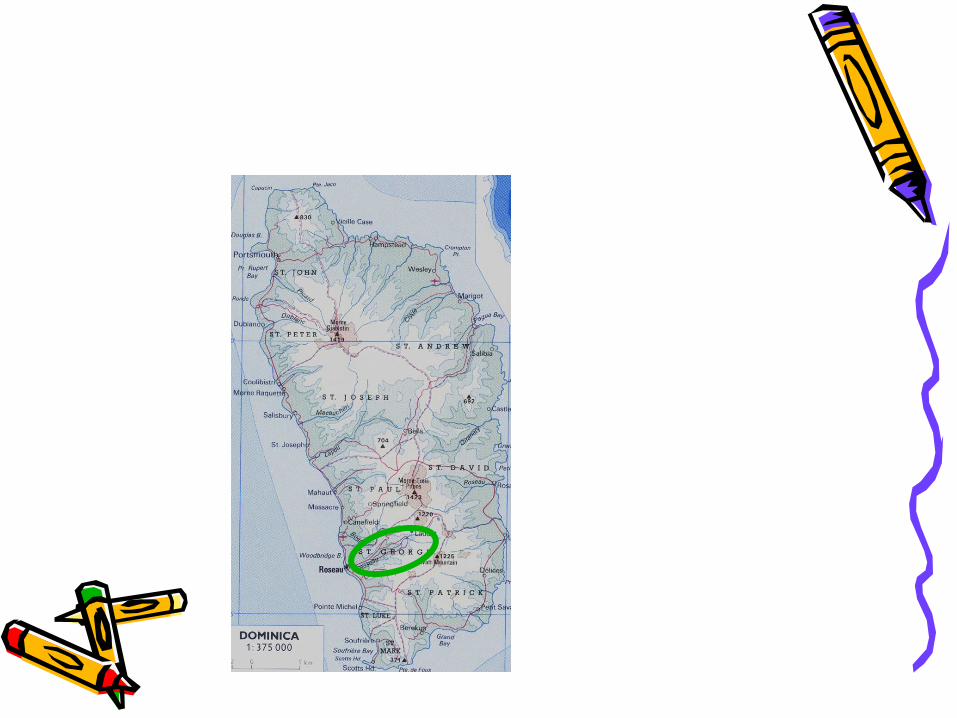
Dominica Roseau River 1:5,000 2002 DIPEHO Project
Jamaica Rio Cobre
Rio Grande
Hope River
1:4,000 1989
St.Kitts & Nevis 4 River Basins
1:25,000 2001 PGDM Flood Hazard Assessment
Trinidad&Tobago
Caroni River
Caparo River 1:5,000 2001 DIPEHO Project
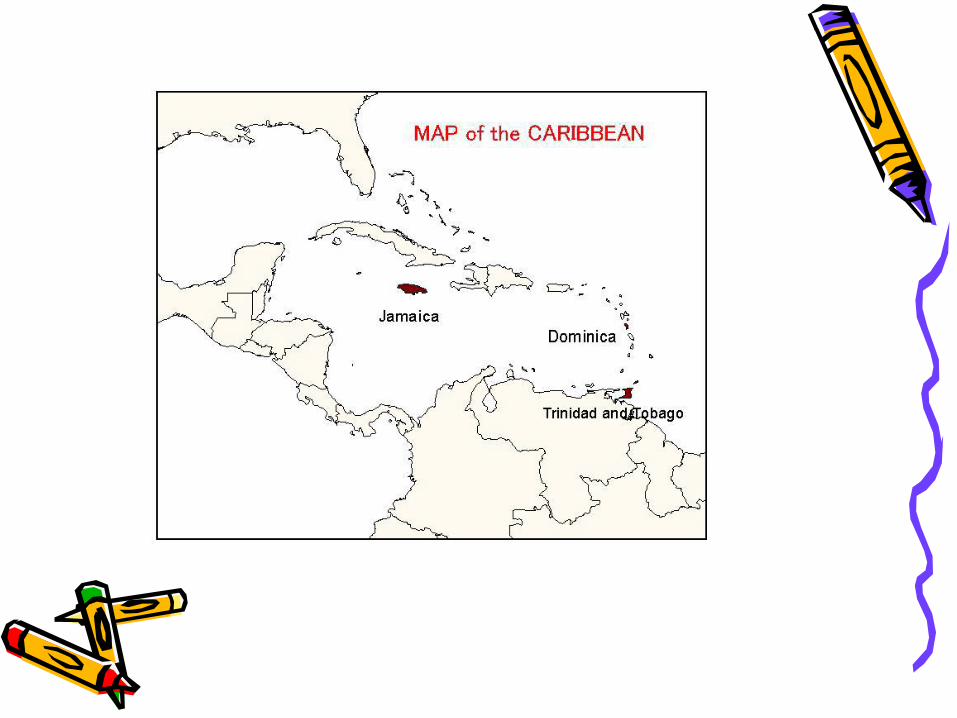

JAMAICA
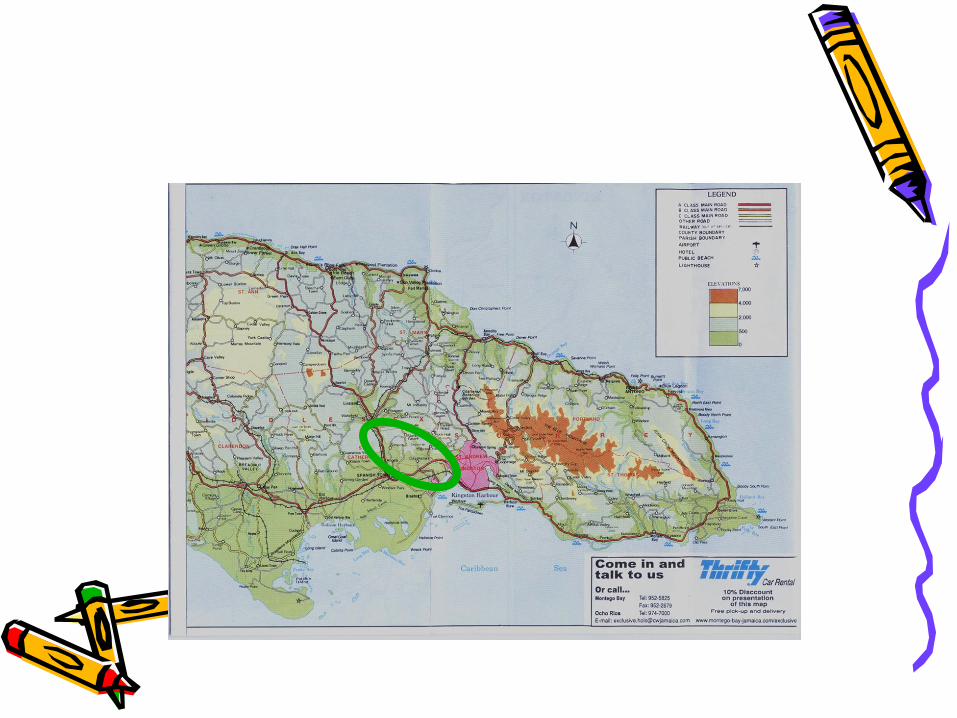
Rio Cobre watershed – located in South East quadrant of island.
Study done by Hydrological Support Unit Project (HSUP) of the Underground Water
Authority.
1989-Office of Disaster Preparedness/Flood Plain Mapping
Project: - first attempt at mapping Rio Cobre
Opportunity to verify map afforded by floods of May, 1991.
Peak discharge estimated at 1780 cumecs based on observed gauge height
of 12 m. & rating curve..

Return period for this flow estimated at 139 years
Extent of inundation was significantly less than that predicted for the 100 &
50 yr. floods as shown on draft of flood plain maps.
Necessary to review the mapping process as more accurate maps were required. HSUP revised plan to include mapping of the Rio
Cobre flood plain.
Study objective:1. Enactment of land use planning;
2. Floodplain management, including flood warning systems, by ODP, Town Planning dept,
Natural Resource Conservation Authority (NRCA) & UWA.
3. Enable establishment of flood insurance rates by insurance companies.
METHODOLOGY:
Review of previous hydrologic studies of Rio Cobre;
Review of previous hydraulic analysis for the study reach;
Preparation of the HEC2 model input data;Field checks & interviews to verify the HEC2
model calibration;Hydraulic analysis to determine the water
levels of the 10,25,50 & 100 yr. Floods.
HYDROLOGIC ANALYSIS:Review of previous hydrologic analysis showed
three approaches to flood frequency determination used:
1.Rainfall-runoff modeling using HEC-1 –discharge corresponding to 10,25,50,100yr.
Rainfall derived by model.
2.Regional flood frequency model which uses mean annual peak flows to determine T-yr
flood.
3.Single site estimation of the T-yr. Flood based on a frequency distribution (IWAI)
used by the Japanese.
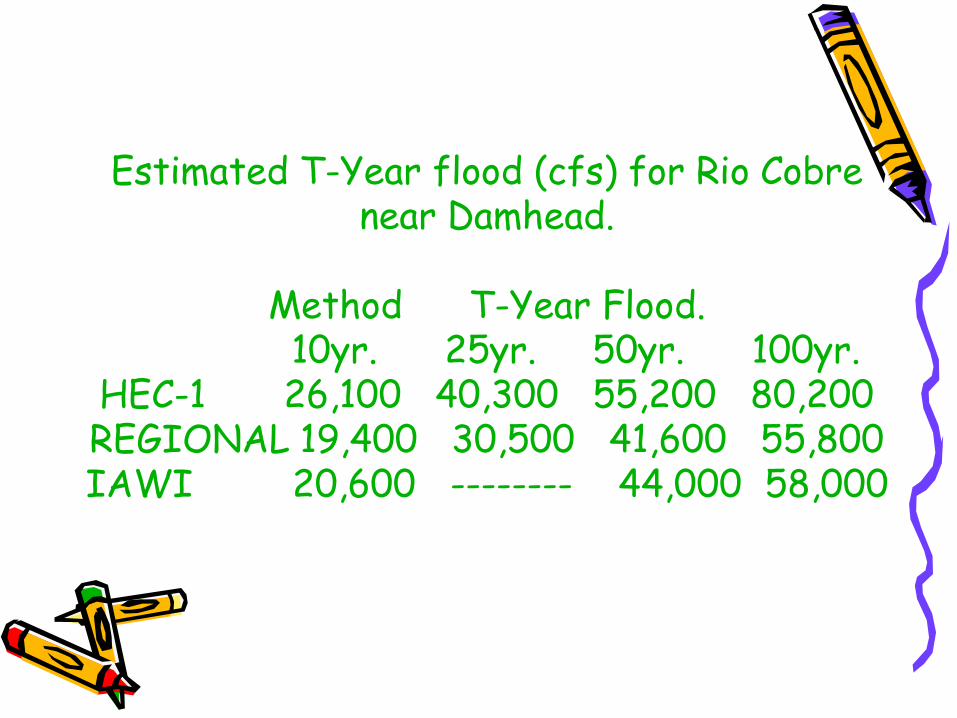
Estimated T-Year flood (cfs) for Rio Cobre near Damhead.
Method T-Year Flood.10yr. 25yr. 50yr. 100yr.
HEC-1 26,100 40,300 55,200 80,200REGIONAL 19,400 30,500 41,600 55,800IAWI 20,600 -------- 44,000 58,000
Previous flood plain mapping made use of HEC-1 results which proved to be too
conservative – corresponding 100 yr flood inundation boundaries were significantly
greater than that observed for the May 1991 flood rains – a 139 year event.
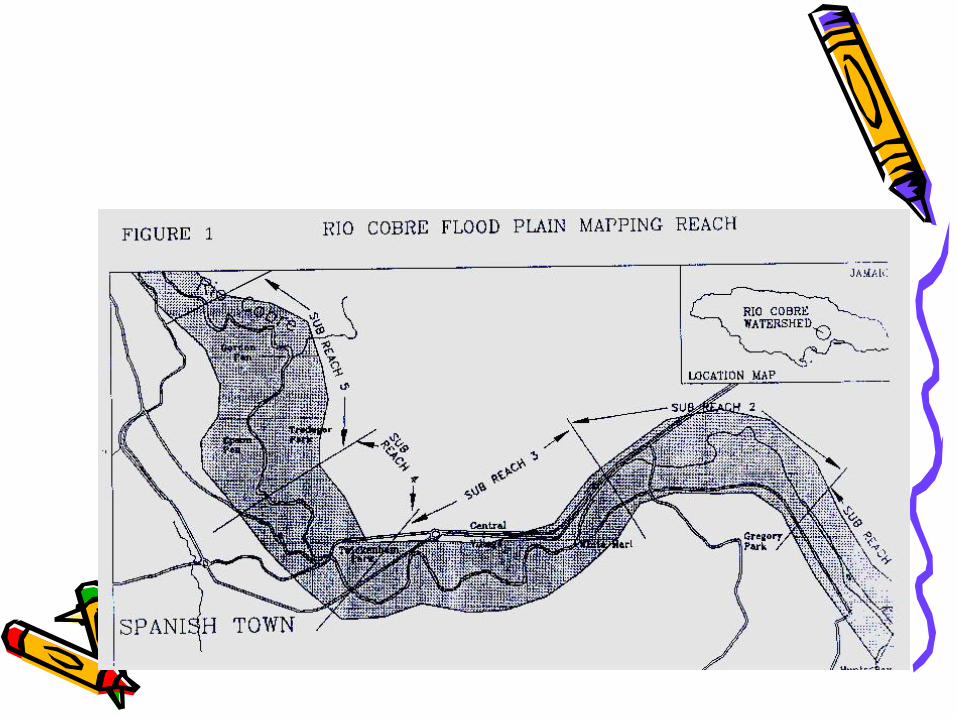
FINAL RESULTS:Maps consisting of a total of eight sheets
at scale 1:4000 showing the areas inundated by the 10,25,50 & 100 yr. Floods, available
at the UWA.
An important recommendation – Verification should be an ongoing process & effort should
be made to take areal photographs of the next big flood event to facilitate verification
of maps & improvement of calibration.
ROSSEAU RIVER – DOMINICA.
HYDROLOGICAL & HYDRAULIC ANALYSIS FOR THE DEVELOPMENT OF FLOOD HAZARD MAPS
FOR THE ROSEAU RIVER BASIN.
CARIBBEAN COUNCIL FOR SCIENCE & TECHNOLOGY:
HASKONING CARIBBEAN LTD.
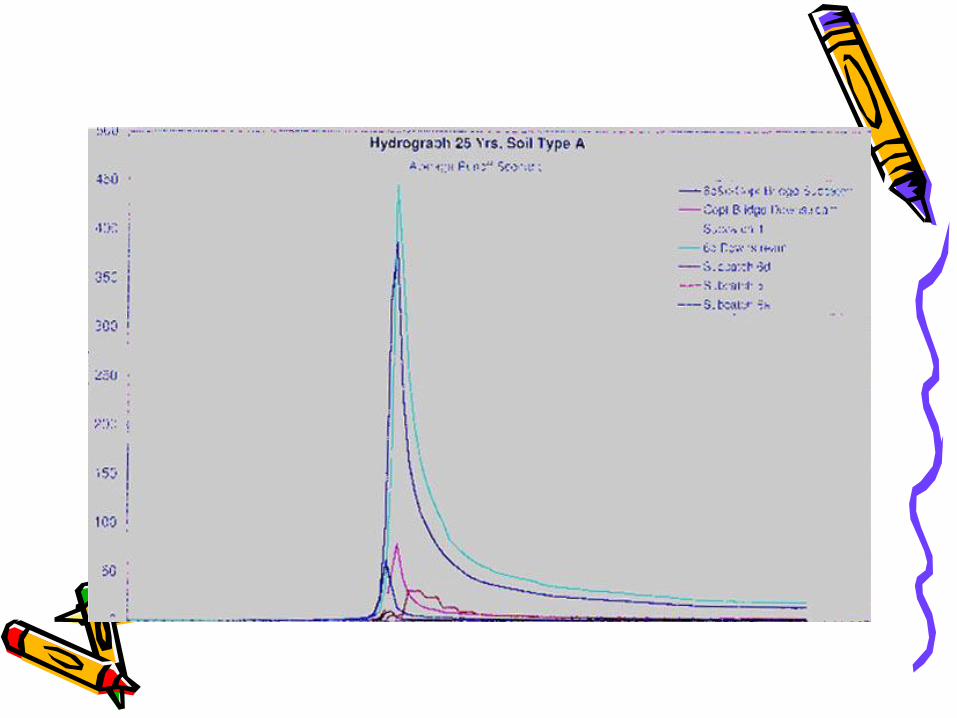
Design storms for return periods of 5, 10, 25, 50 & 100 years defined for this project.
The Natural Resources Conservation Service “storm hyetograph – type II” of the USDA
used, based on its recommendation for use for U.S. Caribbean Islands & Puerto Rico.
Runoff was determined from the “runoff curve number” (RCN) system of the NRCS. (Runoff is a function of rainfall, soil type,
antecedent moisture condition, land cover).
CALCULATING PROCEDURES:
Hydrological model TR-55 used.
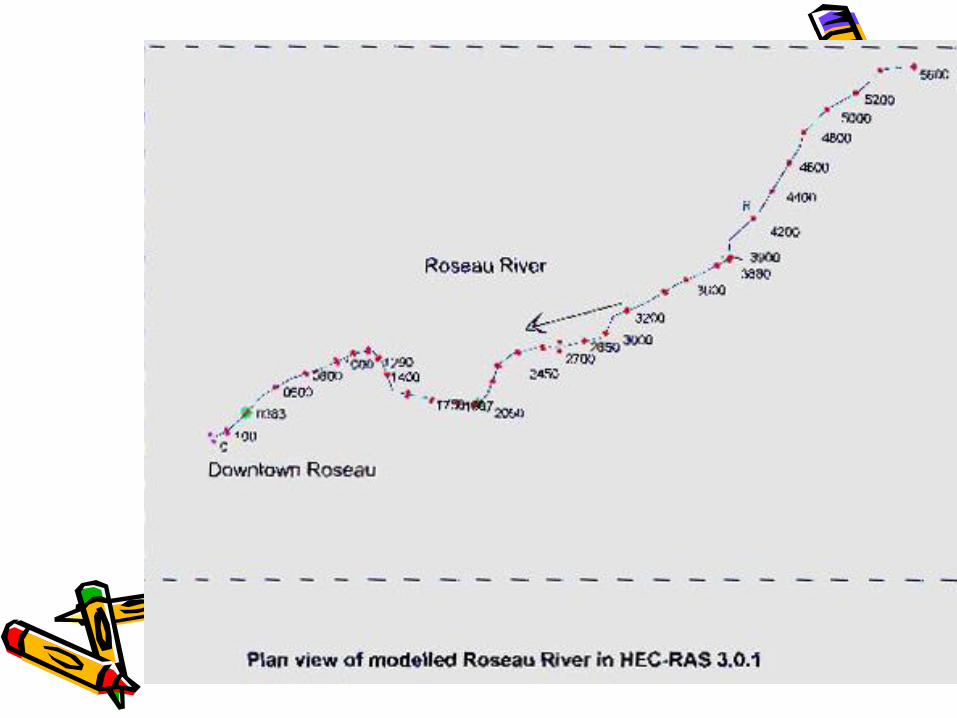
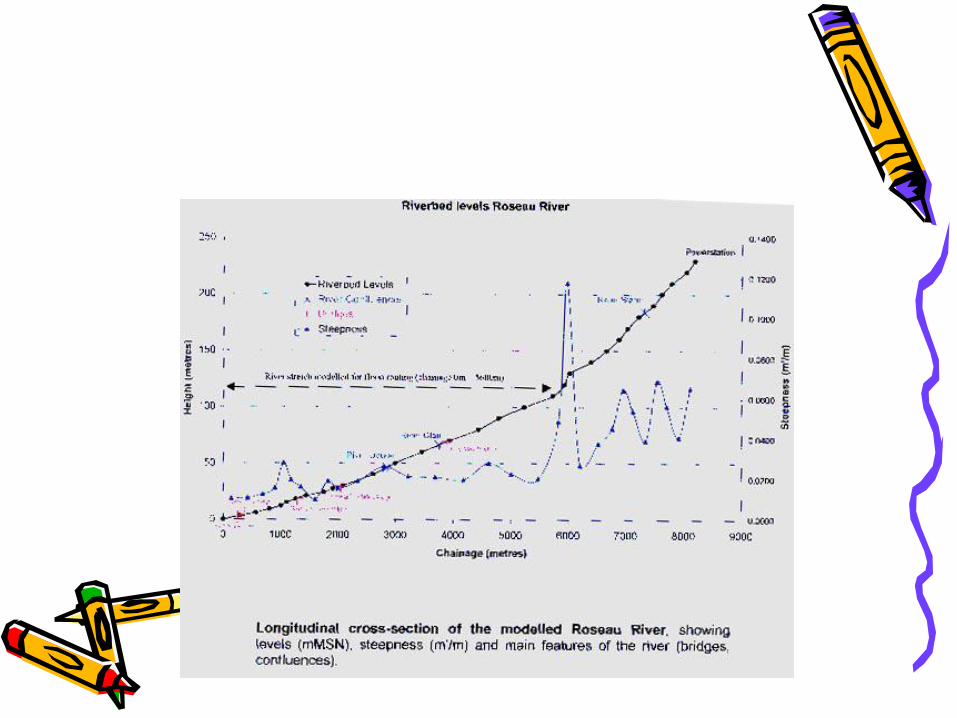
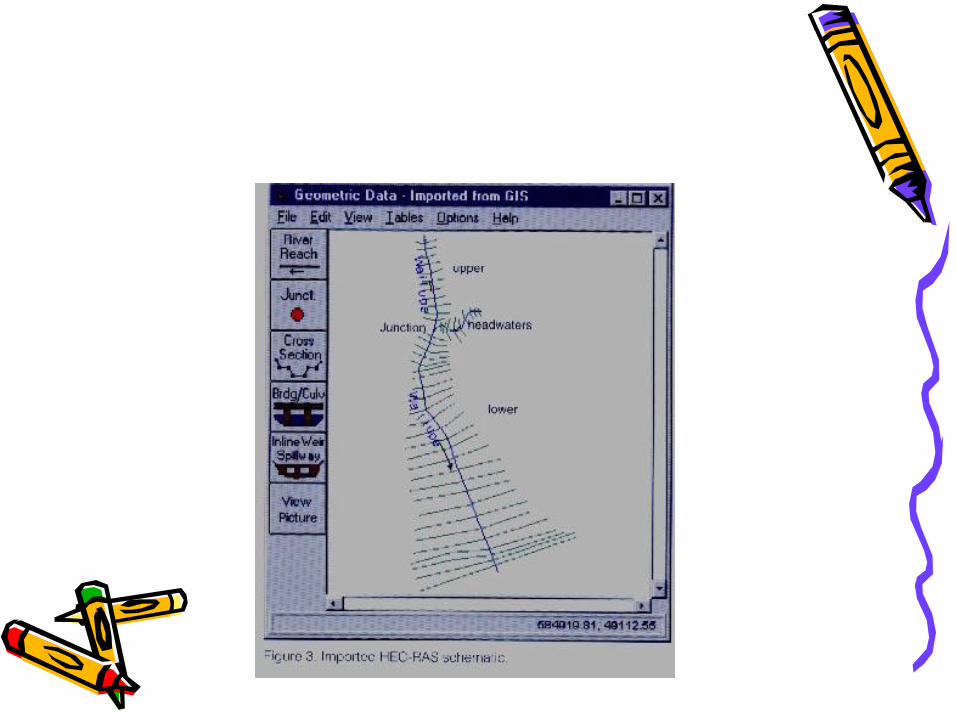
HYDRAULIC MODEL:represents the main stem of the Roseau river in 31 sections. Sections taken where contour
lines cross the river. Flood hydrographs calculated for each section & for the duration
for which the flood flows are modeled.
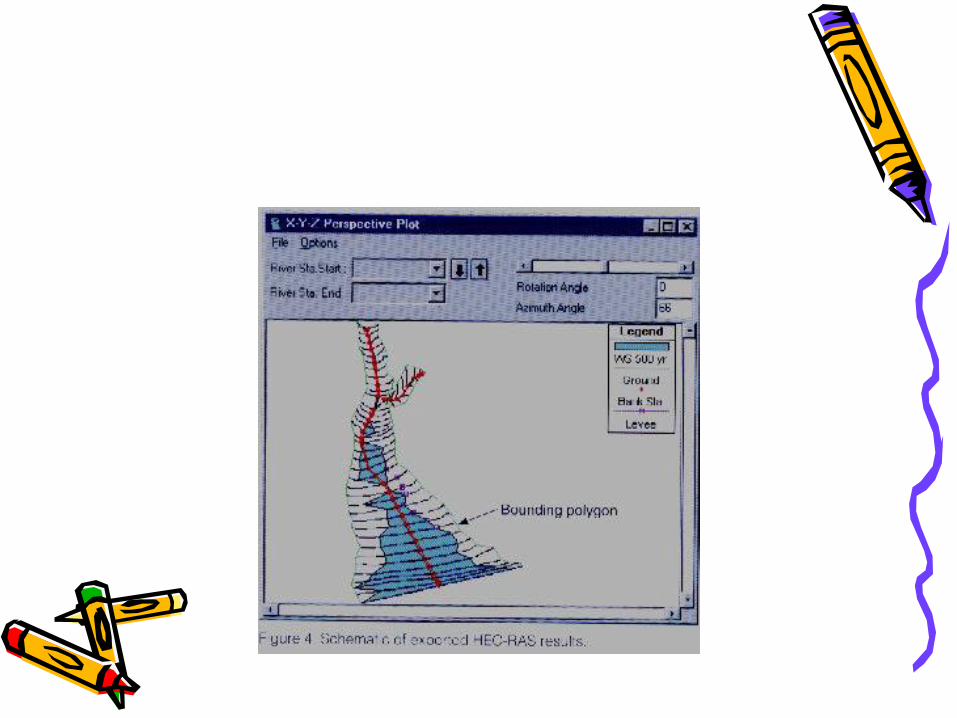
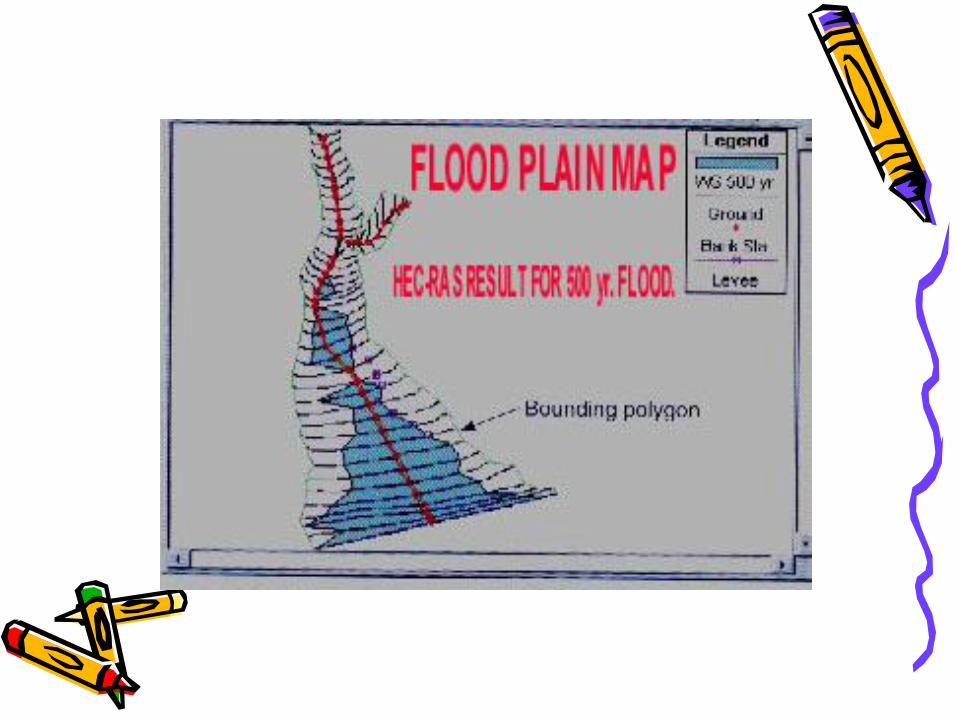
For the hydraulic modelling use was made of the HEC-RAS version 3.1. Modelling
carried out for the lower reaches of the Roseau river basin ( 0 – 5600 m.)

CONCLUSIONS:
1. Results obtained considered acceptable –in view of the limitations of the existing data & the intended purpose of preparing
“general flood hazard mapping” in the Roseau river basin.
Elaboration of accurate flood hazard mapping ( to put into evidence human & economic
hazards) if more detailed data – hydrologic, hydraulic, soil types, soil use, etc. is available.
To improve accuracy of present results, min. additional data req. include stage curves,
increased r/f series, detailed survey of river bed, evidences of past flood events, updated
land use.

Implementation of adequate river monitoring programme.
Trinidad & Tobago
COMMUNITY FLOOD WARNING in Trinidad & Tobago - an example of
use of hazard map for flood warning
The flood watcher in the up-stream monitors the water
level, determine the magnitude of the possible flood and notify it to the watchers in the middle
and down-stream area.
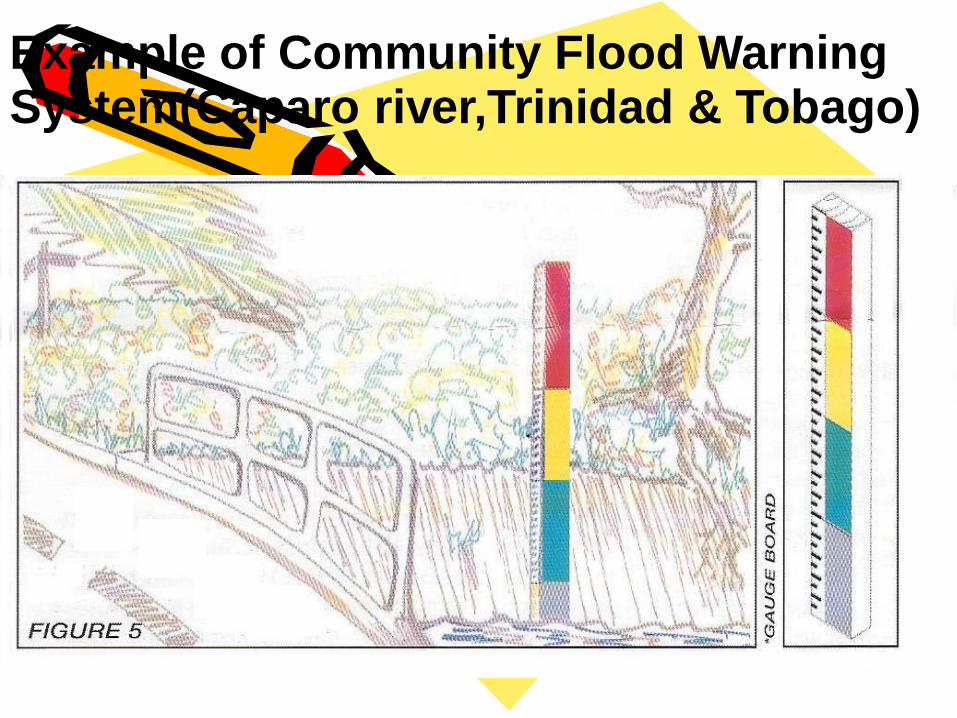
The colours on the boards indicate the potential area to be inundated by flooding as displayed on the map(purple, green, yellow and red for 2, 5,10 and 50 years return period flood respectively, as shown in the following slides) .
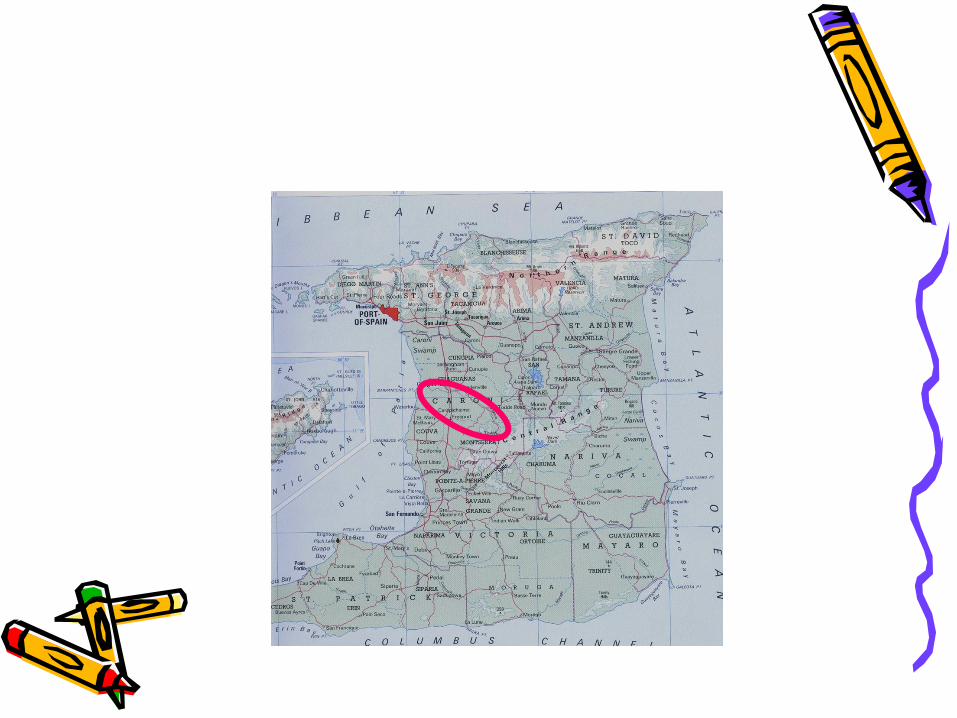
The system works with the cooperation with the Caparo basin community. Community members from the upper, middle & lower
basin are nominated to be “flood watchers.”
Flood watchers in the upper basin monitor the guage boards & warn d/s communities of
the scale of flooding.
Watchers d/s monitor their guage boards & take the necessary precautions to protect
life & property.
The gauge boards are placed in easily visible & stragetic locations in the Caparo river
channel & can be viewed from a safe position.
The colours on the boards indicate the potential area to be affected by flooding as
displayed on the maps.
Upon notification from the up-stream watcher, the down-stream watcher begins to monitor the rise of water on their own gauge
board and inform it to the residents for precautions.
Flood
Example of Community Flood Warning System(Caparo river,Trinidad & Tobago)
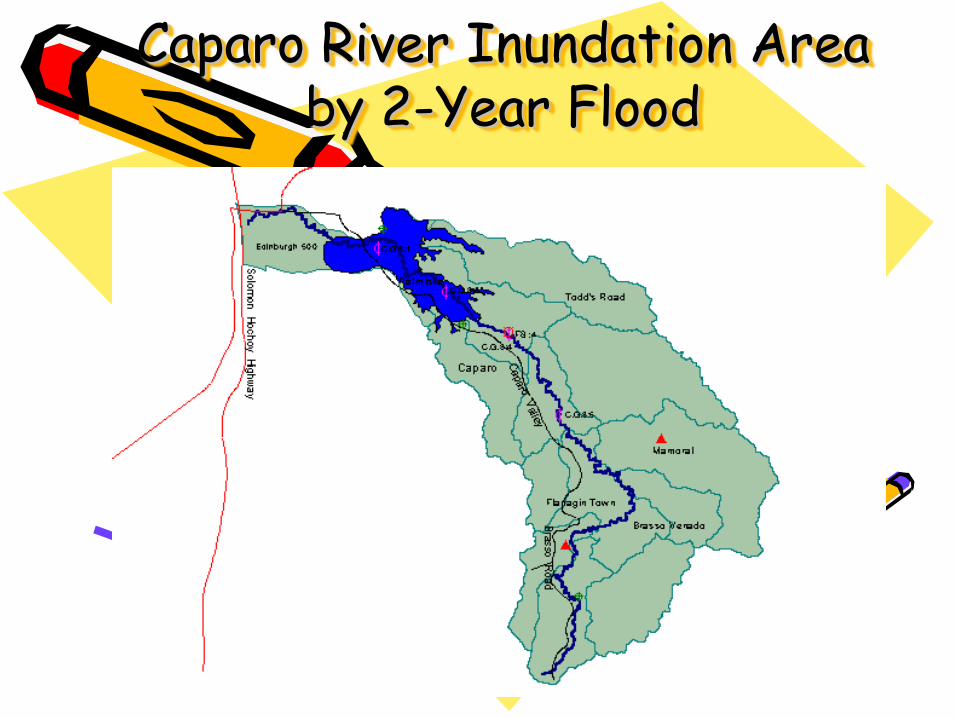
Caparo River Inundation Area by 2-Year Flood
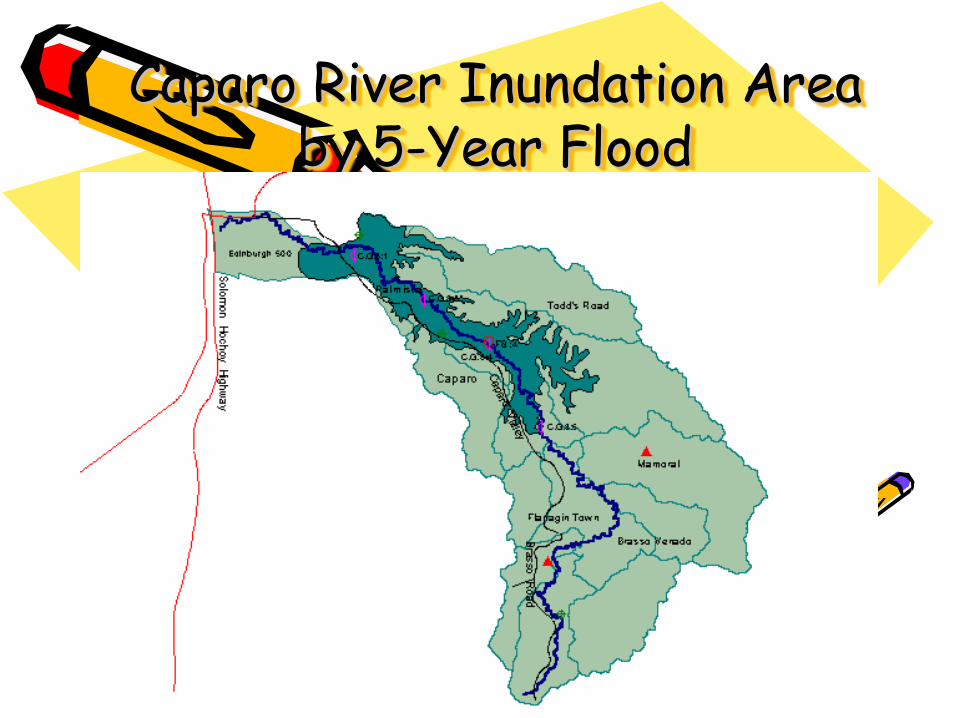
Caparo River Inundation Area by 5-Year Flood
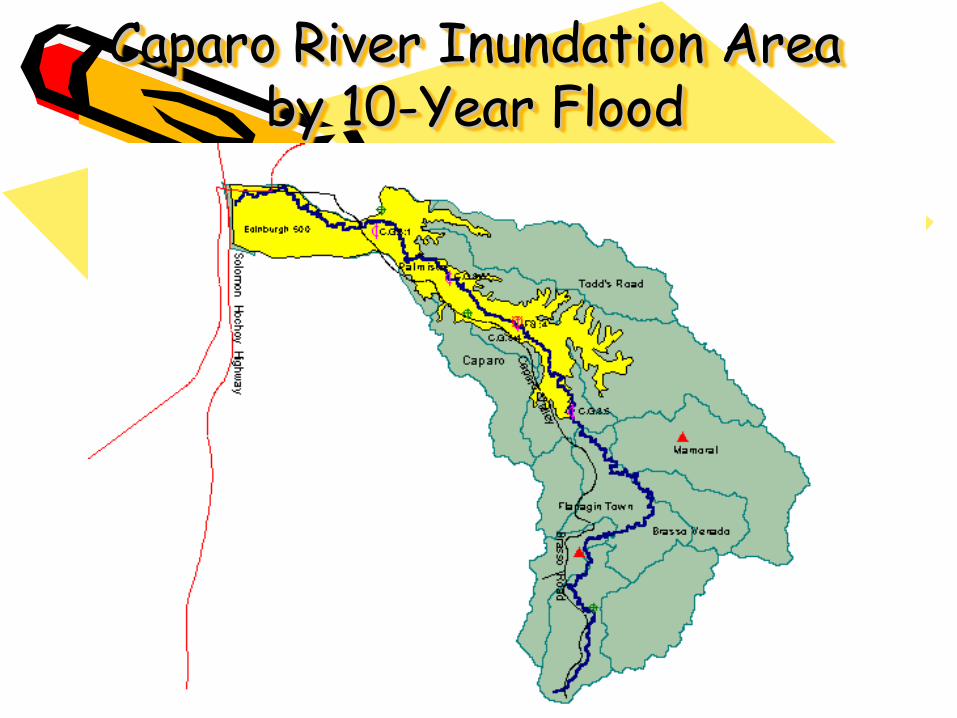
Caparo River Inundation Area by 10-Year Flood
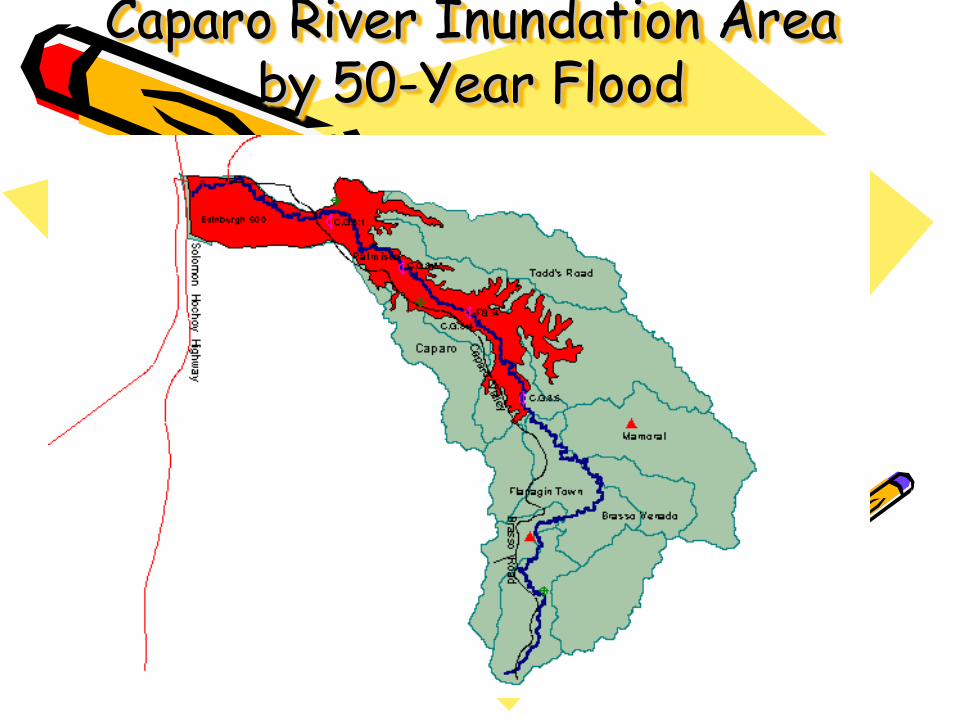
Caparo River Inundation Area by 50-Year Flood
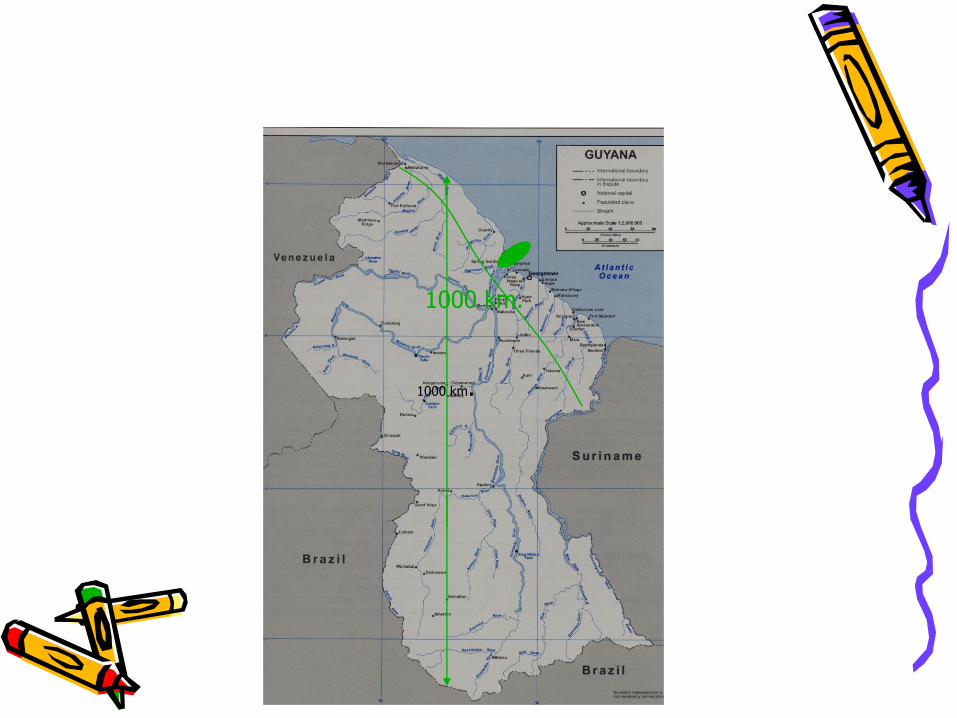
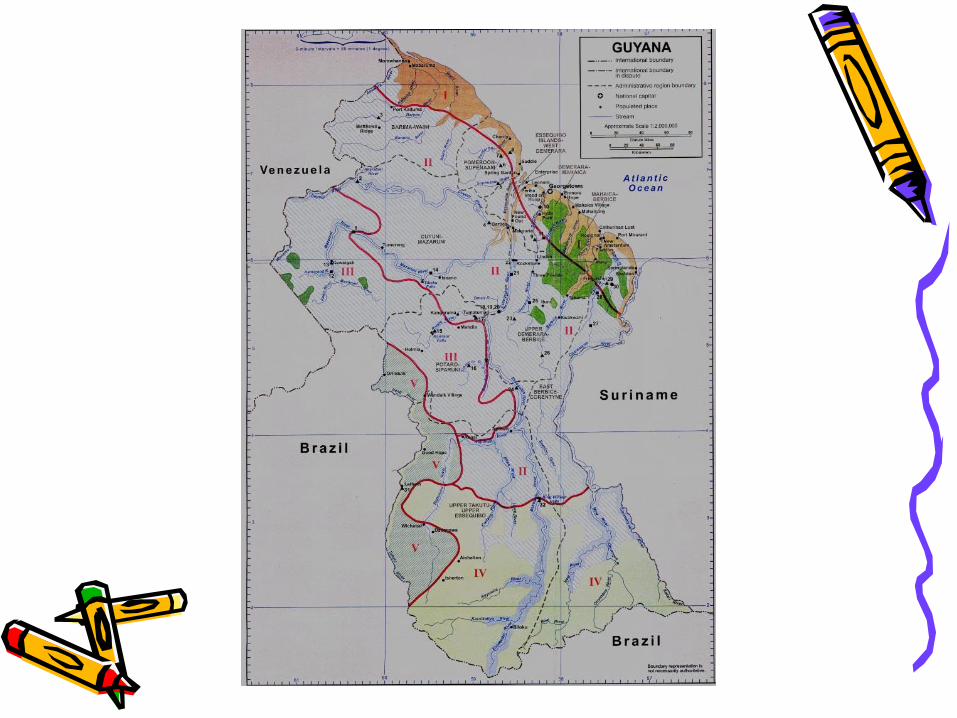
GUYANA
1000 km.
1000 km.

Background:
This study was done through the “CARIBBEAN PLANNING FOR
ADAPTATION TO CLIMATE CHANGE” project, component 6 – “Coastal Vulnerability
& Risk assessment”.
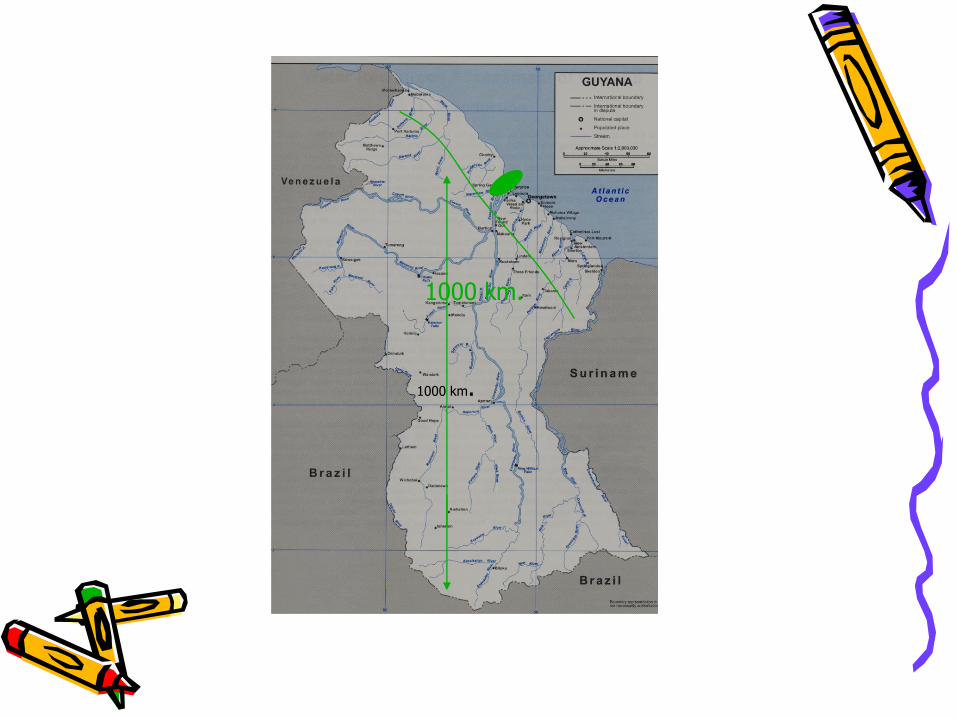
Guyana – situated on the North East Coast of South America.
Area – 215,000 sq. km.Population – 775,000.
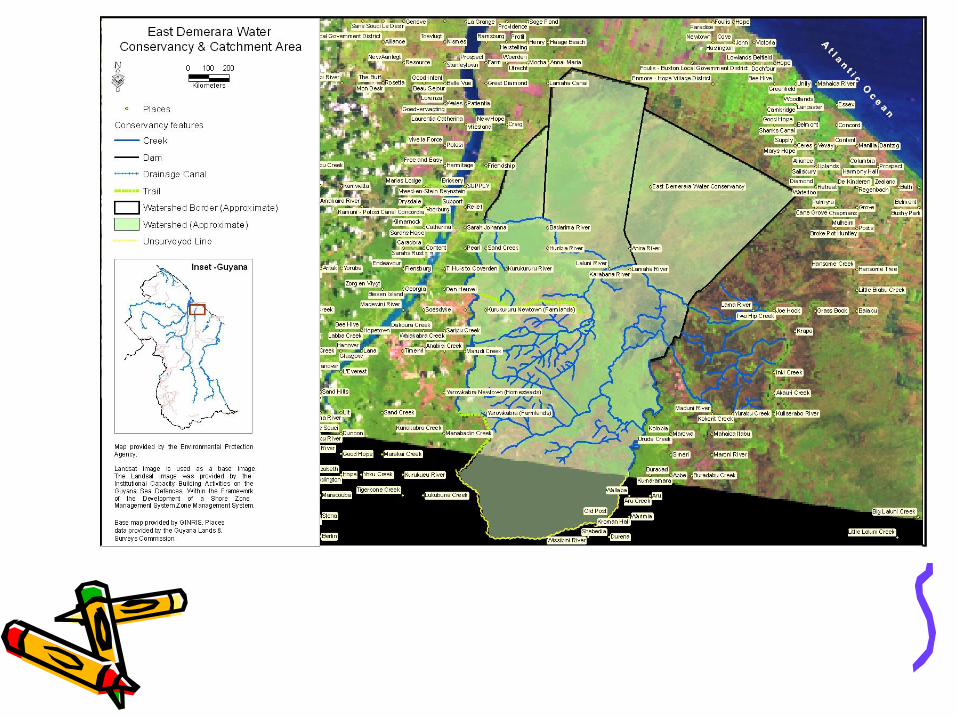
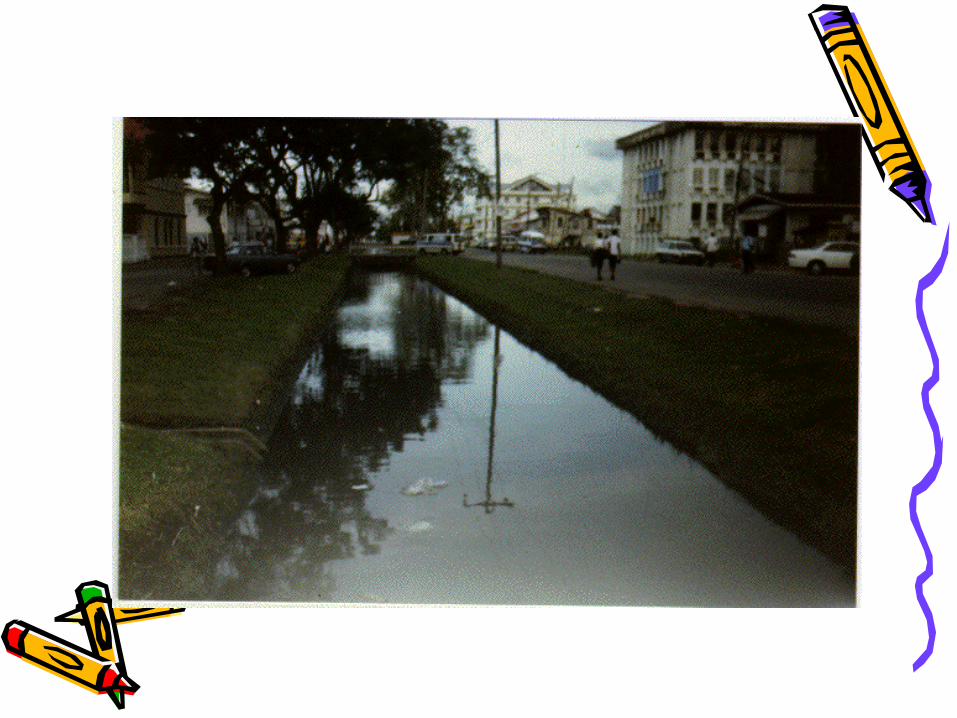
Population concentrated on the narrow coastal strip, 5 – 15 km. deep, from the Pomeroon to Corentyne rivers. All agricultural & industrial
activities concentrated in this area.This strip is part of the coastal area, which is below the high tide level of the Atlantic ocean, & thus subjected to flooding from the ocean.
1000 km.
1000 km.
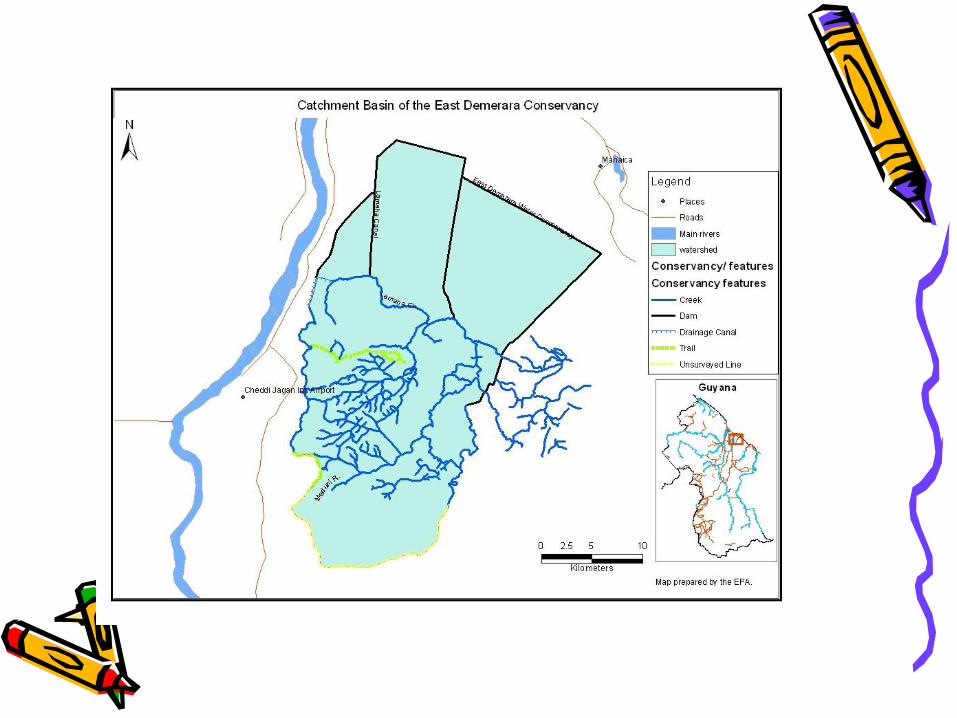
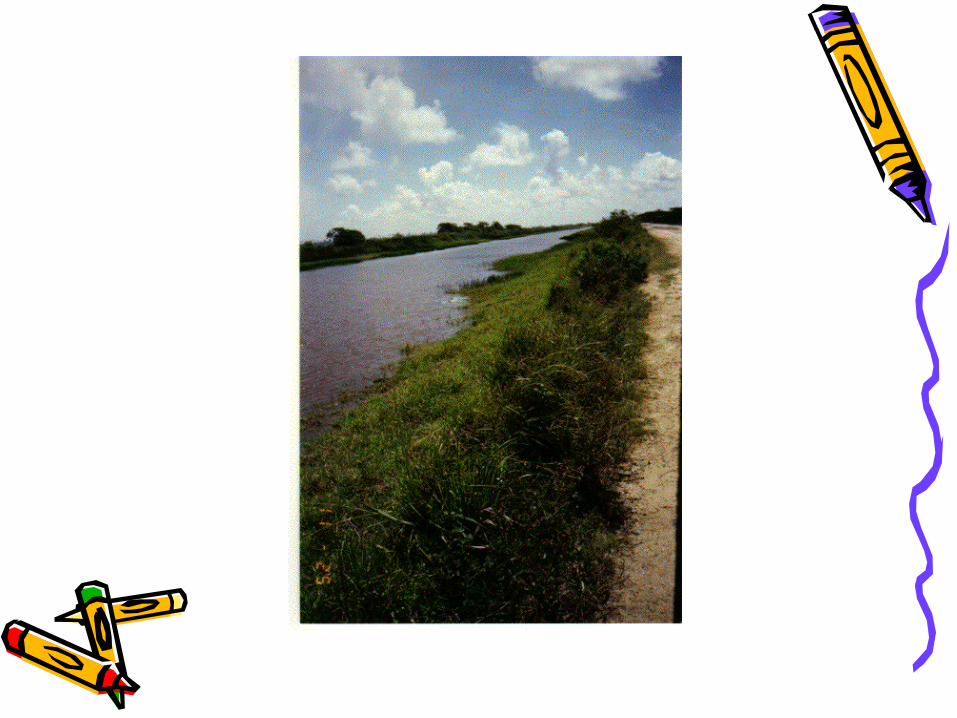
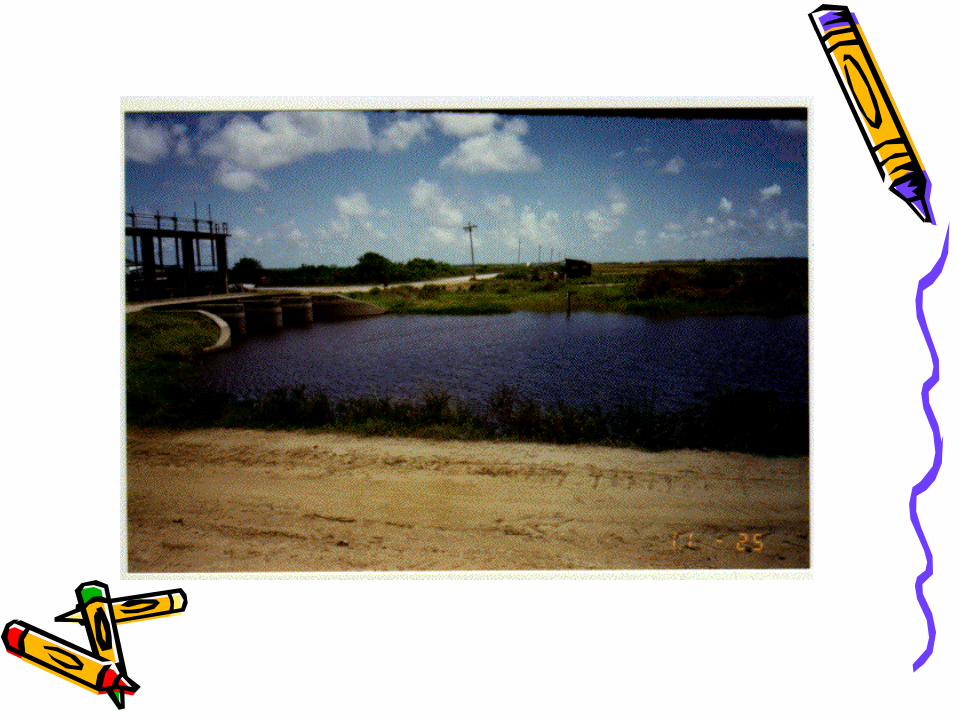
The coastal area is also subjected to flood waters from the interior of the country.
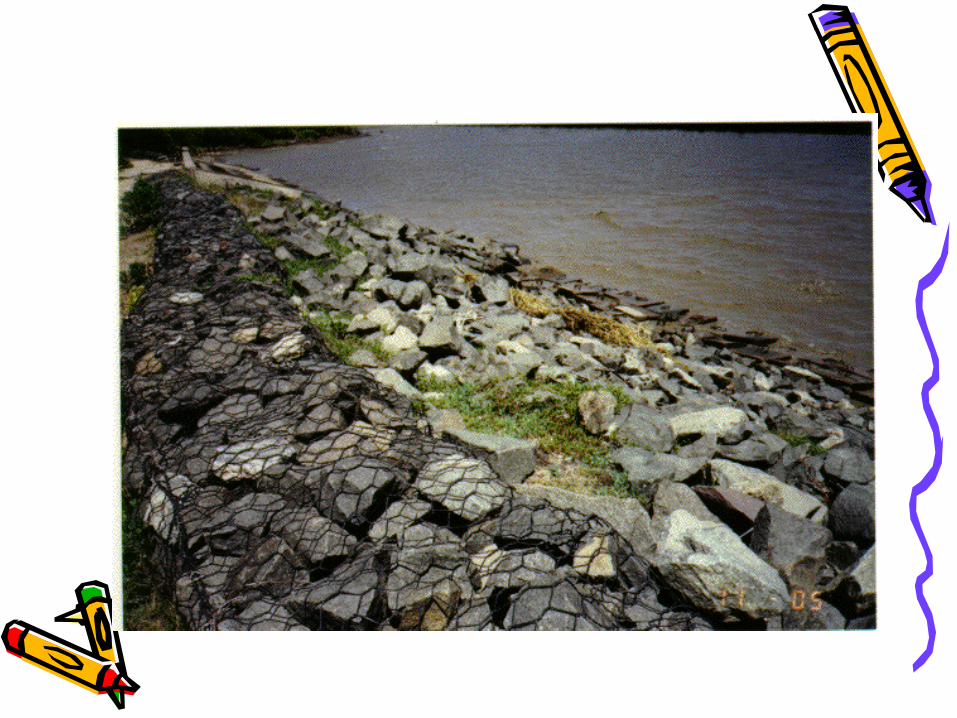
Flood protection works consist of a concrete wall on the ocean side and clay dams on the
interior side.
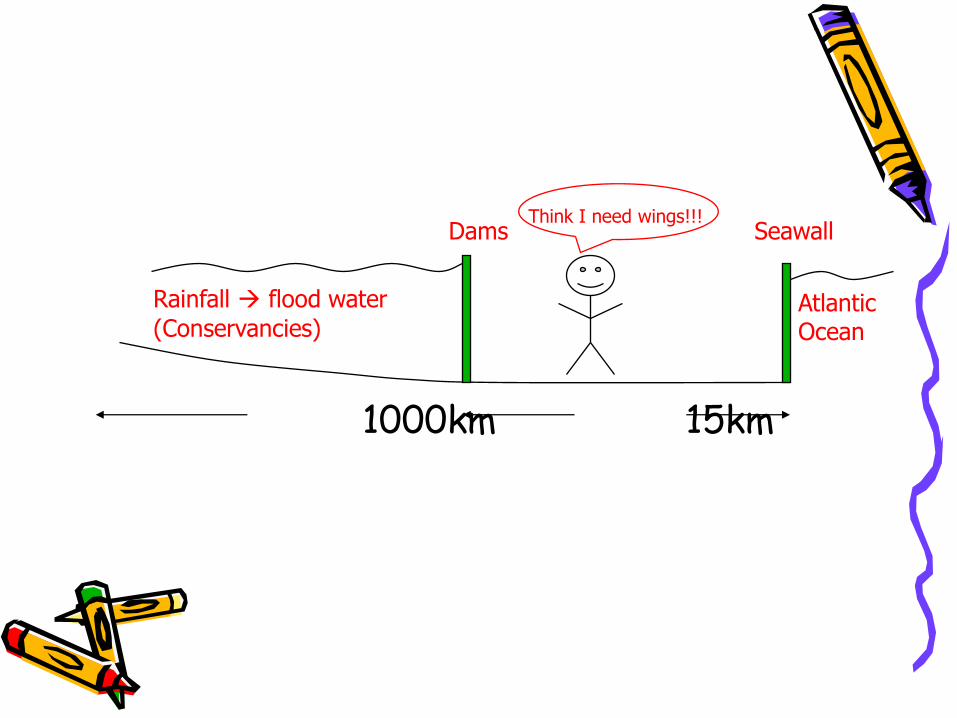
1000km 15km
Rainfall flood water
(Conservancies)AtlanticOcean
Dams SeawallThink I need wings!!!
Climate – High rainfall & humidity;narrow range of temperature typical of the
equatorial region.
Average rainfall range – 3600 – 1600 mm.
Two rainfall seasons – May – mid-August; December – January.
Surface Water:Principal streams – Berbice, Abary, Mahaicony, Mahaica, Demerara, Essequibo, Pomeroon, Waini & Barima rivers. All discharge into the Atlantic
Ocean.Discaharge range : <10m3sec-1 to 10,000m3 sec-1
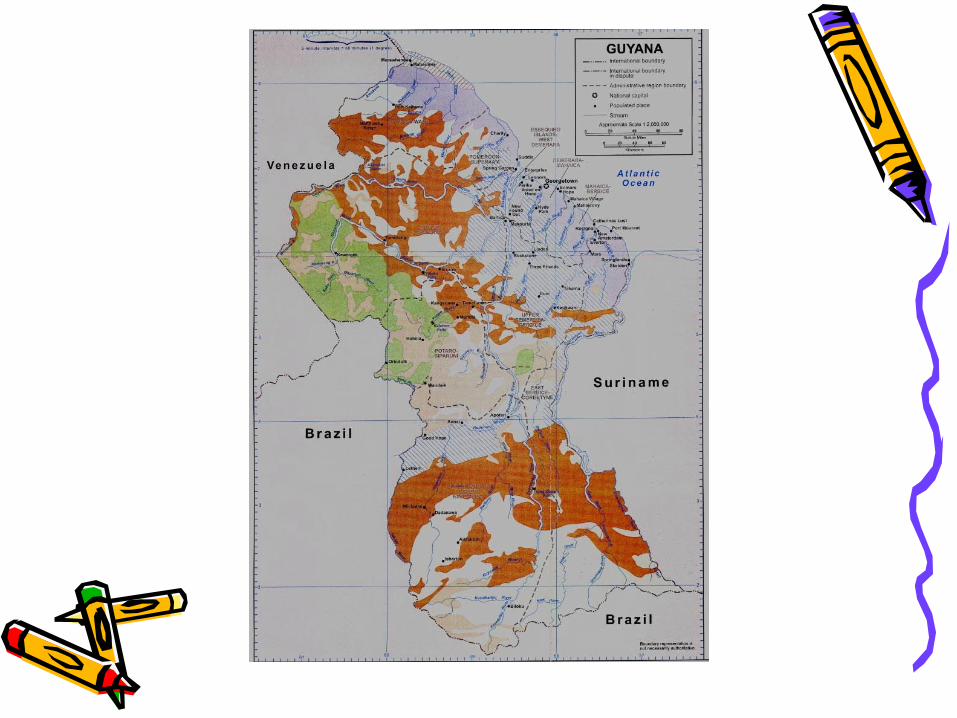
Surface water resources of Guyana.
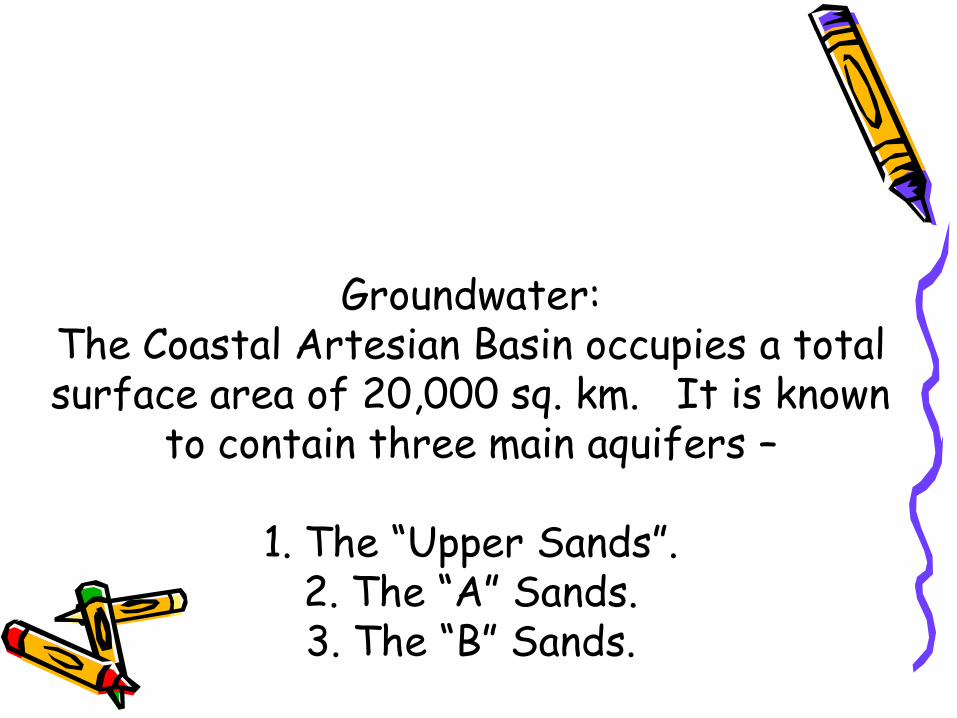
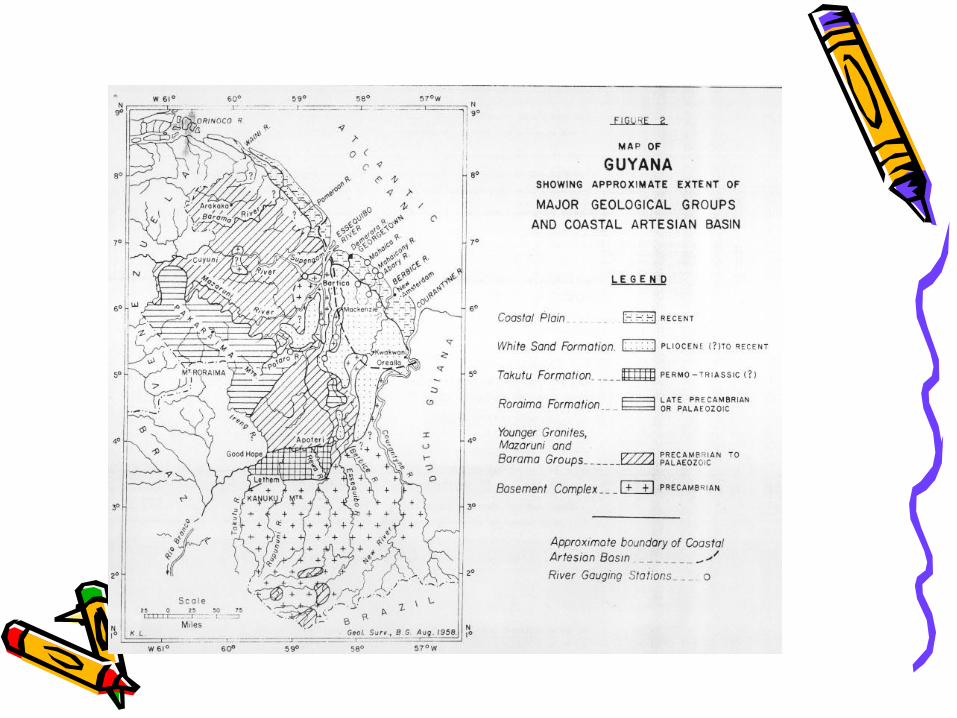
Groundwater:The Coastal Artesian Basin occupies a total surface area of 20,000 sq. km. It is known
to contain three main aquifers –
1. The “Upper Sands”.2. The “A” Sands.3. The “B” Sands.
Ground Water Resources of Guyana
Geological Cross Section in the Georgetown area.
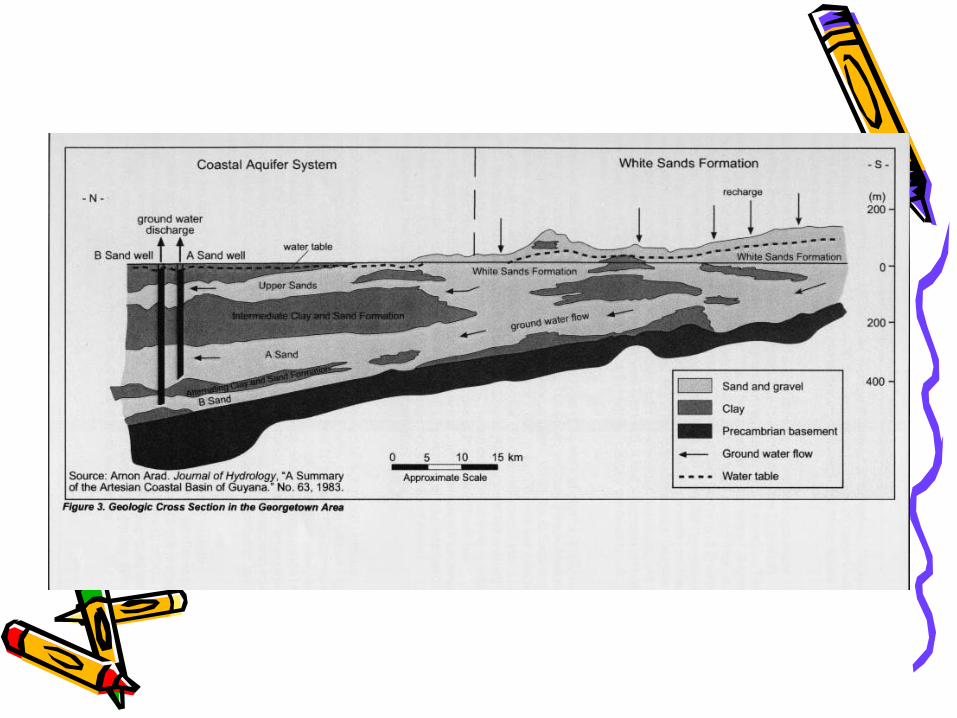
Description – (Gibson, 1971).
Upper Sands – shallowest, along the coast; varies in depth from 30 – 60 m. in an
easterly direction. Thickness correspondingly ranges from 20
– 150 m. Not exploited for water, except in isolated cases by individuals for domestic purposes.
“A” Sands aquifer – underlies the “Upper” Sands. Almost all of the country’s domestic water supply is obtained from this aquifer.
“A” Sands aquifer found at depths ranging from 100 – 300 m. in an easterly direction. Thickness
correspondingly range from 20 – 60 m. Transmissivity is high – 2500m2./day.
“B” Sands aquifer – the deepest and extends eastwards from the Demerara river. Depths
vary from 400 – 800 m. & thickness from 20 –60 m.
Transmissivity much less than that of the “A” Sand.
SEA WATER INTRUSION INTO RIVERS. The Problem.
When the fresh water from a river empties into the ocean, the saline water tends to propagate into the river mouth, resulting in contamination of the river in its lower reaches. The density of saline water is higher than that of fresh water; this results in the saline water sliding over the bottom of the river in an upstream direction
against the flow of the river.
This sea water intrusion can be discerned up to several tens of kilometers
upstream, and under extreme conditions, the reach of the river affected can extend for more than two hundred
kilometers.
The differences in density between salt and fresh water have the major effect of causing
stratification in estuaries.
To overcome this stratification mixing within the water body is required; this in turn requires
energy. This energy is supplied by tidal flow which induces turbulence and effects the mixing. Stratification is therefore most
pronounced in estuaries through which a river issues into a non-tidal sea, while it is weaker
when tidal action is strong.
On this basis Pritchard(1955) and Cameron & Pritchard(1963) have classified estuaries
according to their stratification and salinity distribution. They define the following types of
estuaries:highly stratified salt-wedge type estuaries;
partly mixed estuarieswell mixed estuaries.
The hydrodynamic formulation of well and partially mixed situations are similar and can be
carried out on the basis of two concepts:(1). Advection and dispersion;
(2). Tidal prism.
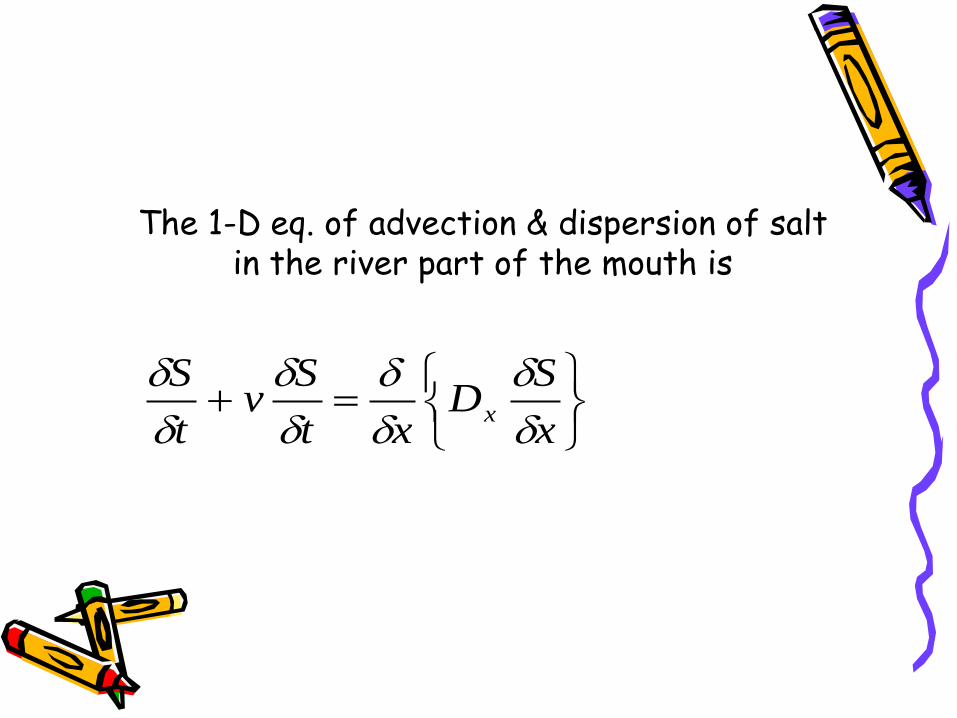
The 1-D eq. of advection & dispersion of salt in the river part of the mouth is
x
SD
xt
Sv
t
Sx
S = water salinityv = flow velocity
Dx = longitudinal dispersion coefficient
Solution of this equation gives an expression for the distance over which brackish water will extend in the
river, in terms of the sea water salinity and the fresh water discharge averaged over the tidal cycle.
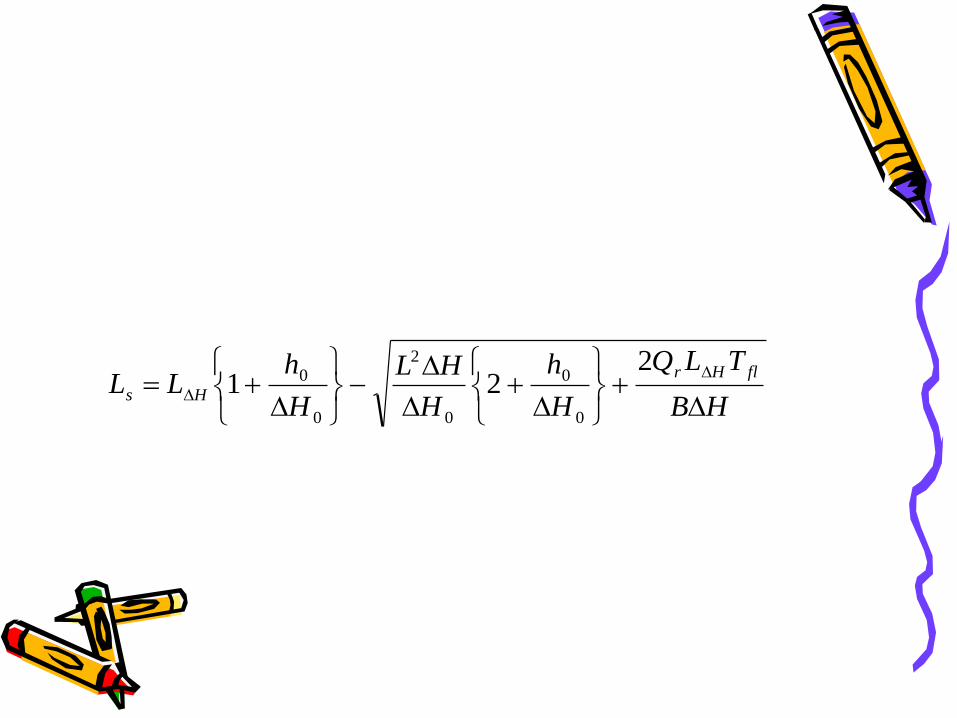
V.N.Mikhailov (1971) deduced an expression for computation of sea water intrusion into a
river:
HB
TLQ
H
h
H
HL
H
hLL
flHr
Hs
221
0
0
0
2
0
0
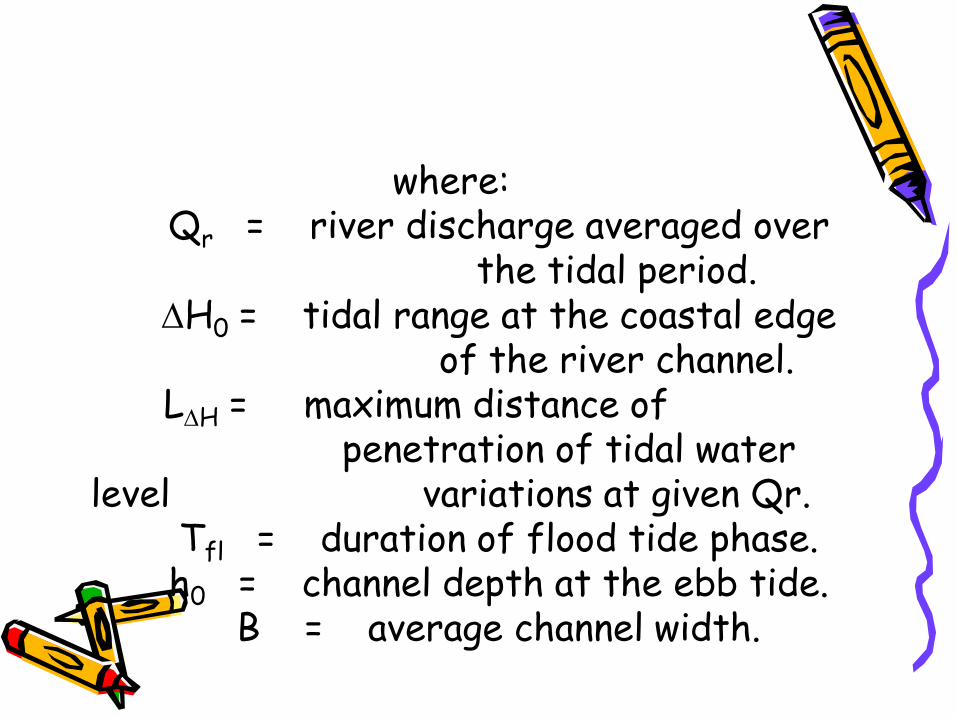
where:Qr = river discharge averaged over
the tidal period.H0 = tidal range at the coastal edge
of the river channel.LH = maximum distance of
penetration of tidal water level variations at given Qr.
Tfl = duration of flood tide phase. h0 = channel depth at the ebb tide.
B = average channel width.
The concept of advection and dispersion allows for the consideration of the longitudinal
distribution of water salinity along the river part of the mouth area and to estimate the
length of tidal averaged intrusion of brackish water with a given river discharge.
The concept of tidal prism allows for an estimation of the maximum limit of
intrusion of salt water into the river during flood tide.
The foregoing analyses have been applied to the Mahaica, Demerara and Essequibo rivers, to calculate the extent of salt and
brackish water into the rivers.
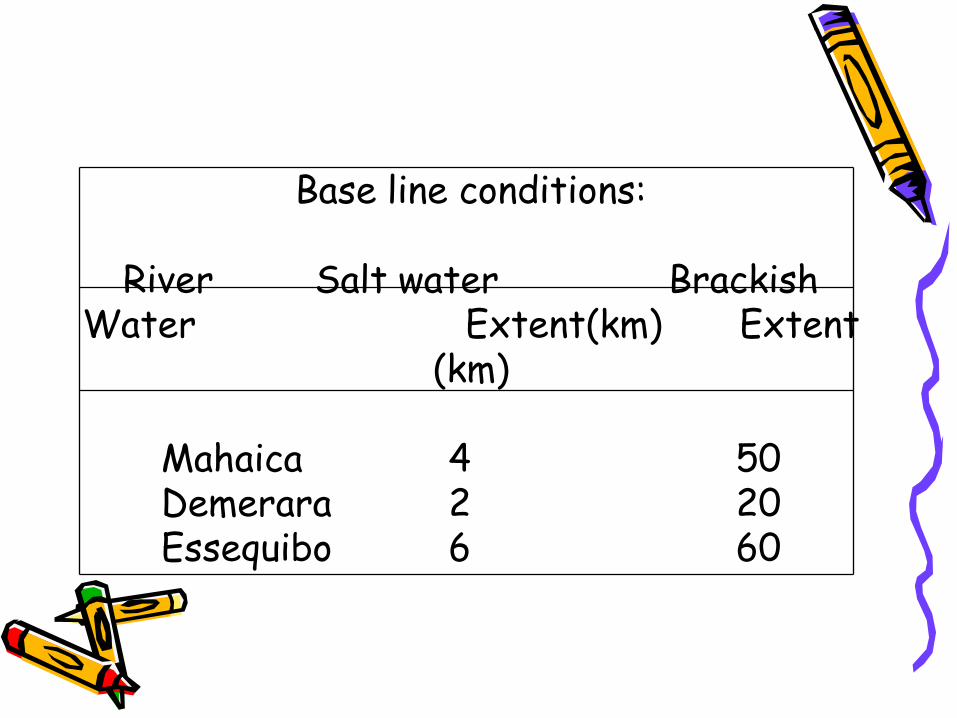
Base line conditions:
River Salt water Brackish Water Extent(km) Extent
(km)
Mahaica 4 50Demerara 2 20Essequibo 6 60
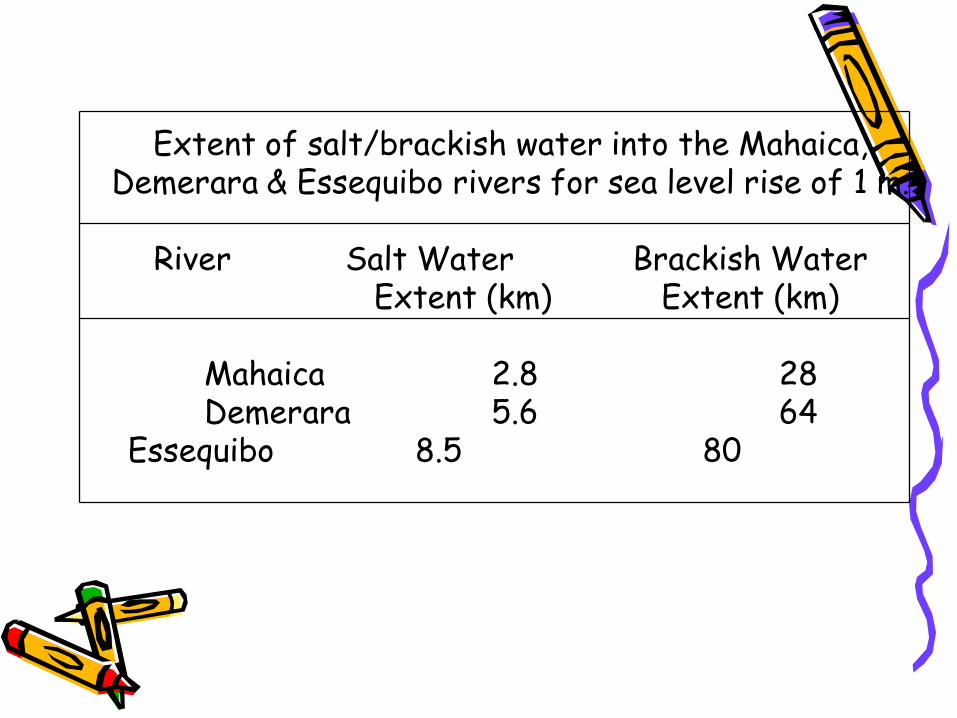
Extent of salt/brackish water into the Mahaica, Demerara & Essequibo rivers for sea level rise of 1 m.
River Salt Water Brackish WaterExtent (km) Extent (km)
Mahaica 2.8 28Demerara 5.6 64
Essequibo 8.5 80
SALTWATER INTRUSION INTO AQUIFERS.
Large numbers of coastal aquifers are already experiencing salt water intrusion caused by both natural and man-induced
processes. Sea level rise will only aggravate such situations.
The coastal plain of Guyana, below high tide level of the Atlantic ocean, will be subjected to severe adverse consequences as a result
of sea level rise. The high level of dependence on the coastal aquifers for
domestic water supply renders the population extremely vulnerable to the effects of salt
water intrusion as a result of sea level rise.

r
r
w
w
pw Qgpk
kt
U
U
pS
t
p
p
SSS
)).((.0
Calculations based on the Groundwater Flow
Model:
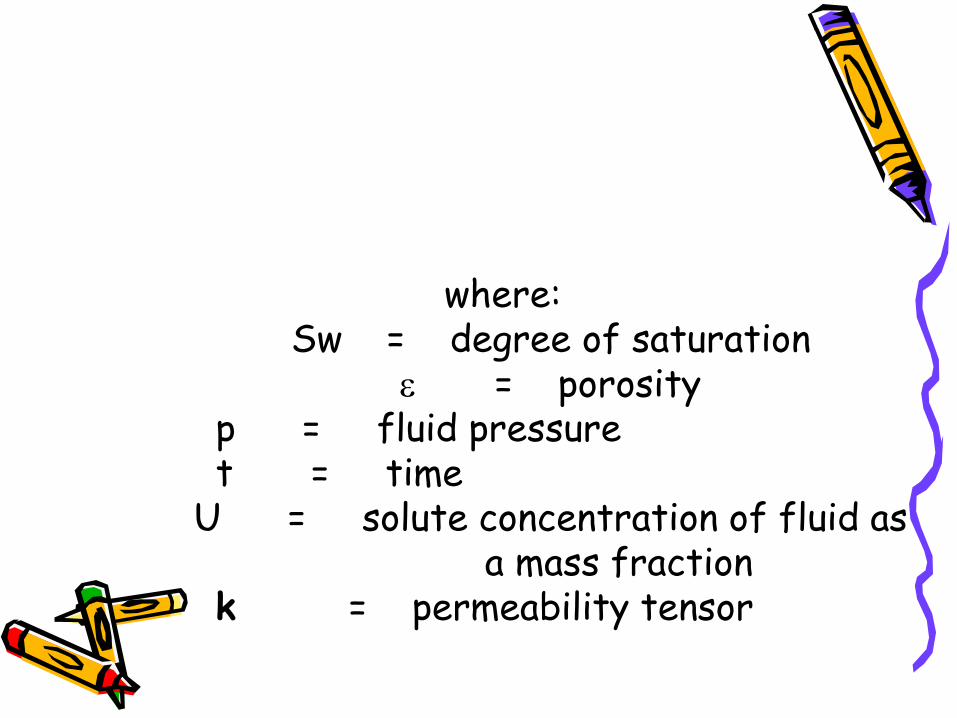
where:Sw = degree of saturation
= porosityp = fluid pressuret = time
U = solute concentration of fluid as a mass fraction
k = permeability tensor
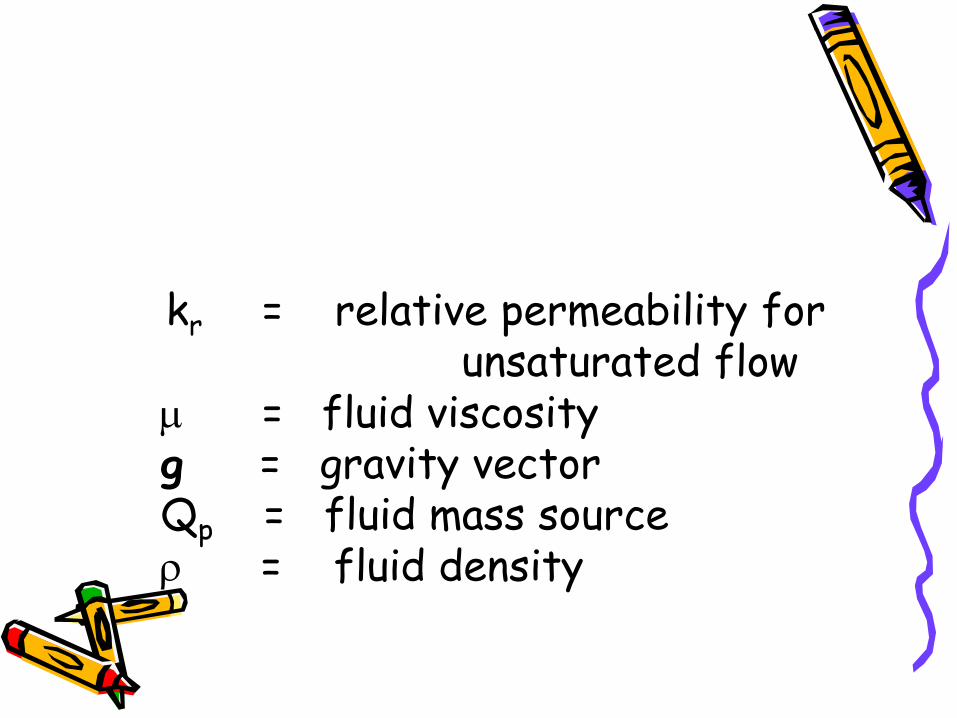
kr = relative permeability for unsaturated flow
= fluid viscosityg = gravity vectorQp = fluid mass source = fluid density
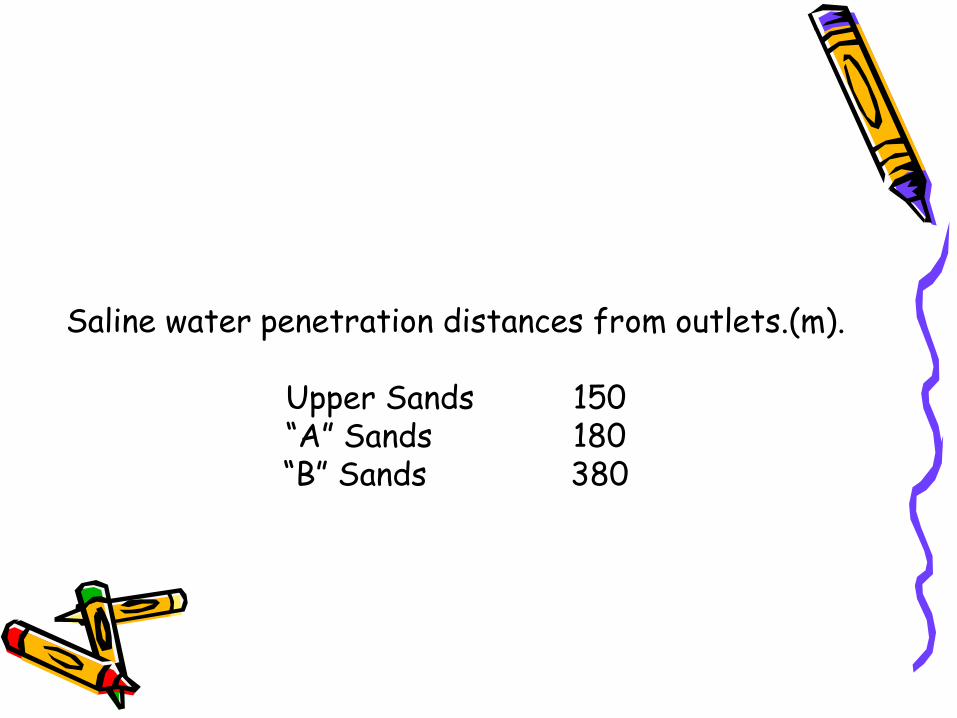
Saline water penetration distances from outlets.(m).
Upper Sands 150“A” Sands 180“B” Sands 380
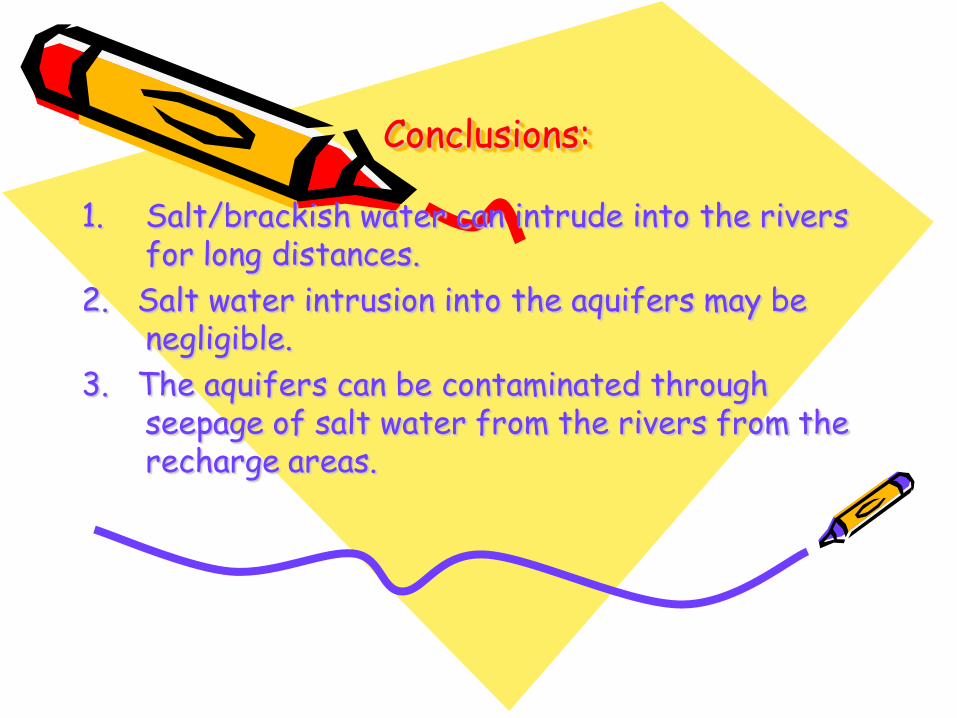
Conclusions:
1. Salt/brackish water can intrude into the rivers for long distances.
2. Salt water intrusion into the aquifers may be negligible.
3. The aquifers can be contaminated through seepage of salt water from the rivers from the recharge areas.

Case studies…….Climate Change…?????
Leguan : a small island in the Essequibo river.Area : ~400 km.2
Population : 6000Economy : Agriculture (Rice).
Recent finding: high salt content in soil.
This has the effect of reducing yields. National Agricultural Research Institute
(NARI) scientists working to find a strain of rice that can withstand the higher salt
content of the soil.

Reason for the higher salt content….????
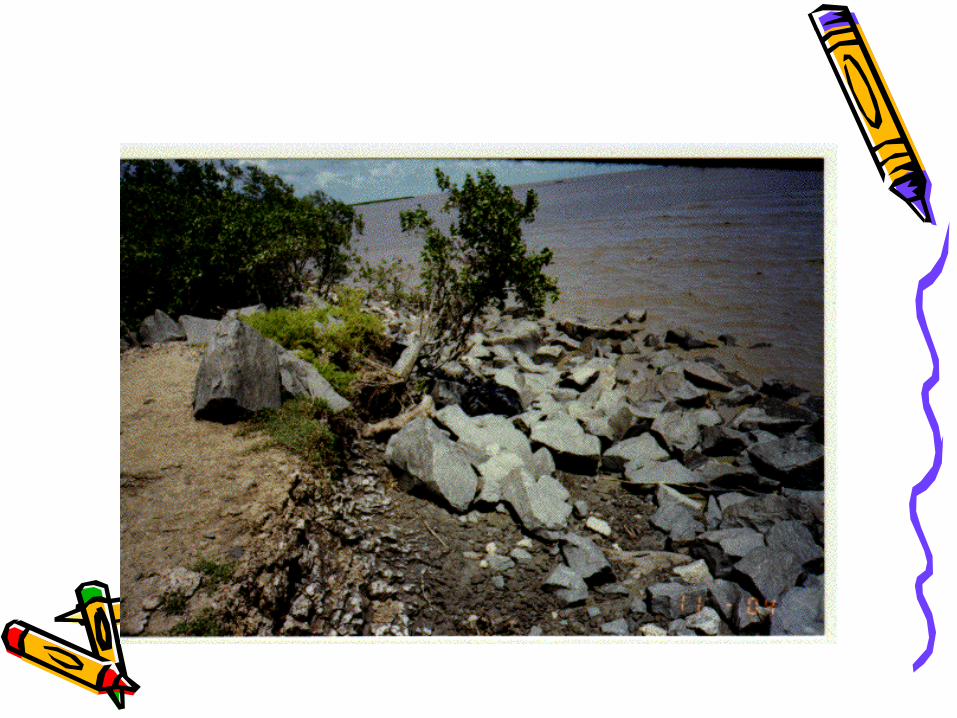
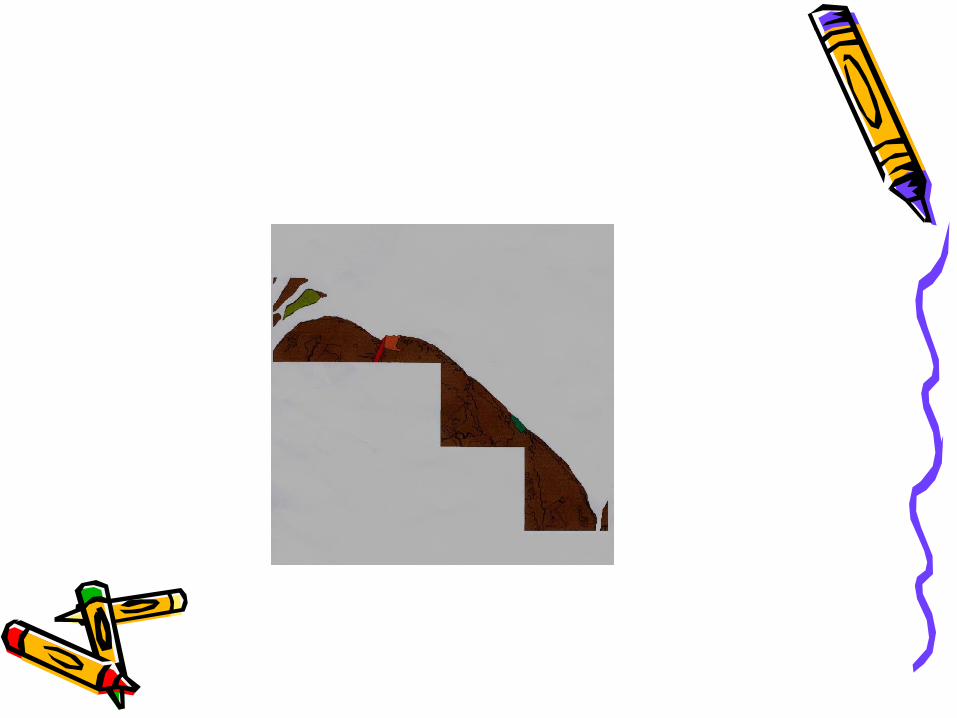
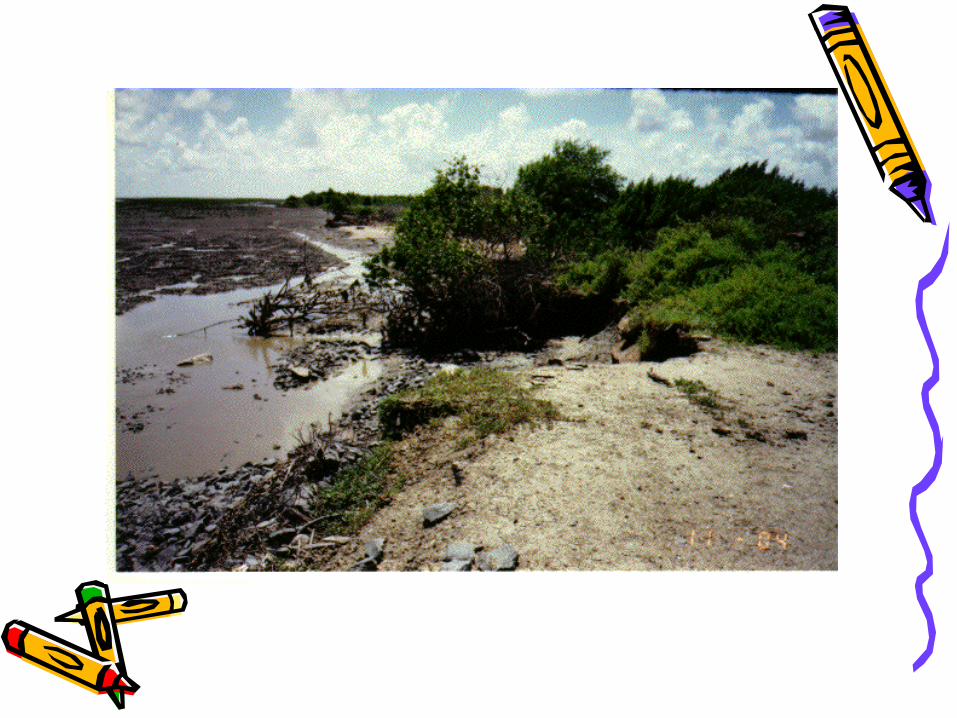
Beach Erosion……Reason..? Sea level rise..???
In the 50’s & 6o’s the mangrove forest on the sea shore was completely destroyed because of mosquitoes…..most likely the cause of the
erosion.
Extreme rainfall in 2004/5 & 2005/6….. Estimated to have return periods of 1000-1500 years. Last occurrence 100 years ago.
Result of Climate Change..???

Loris Nathoo, DDL's senior management personnel dong his bit
to help out
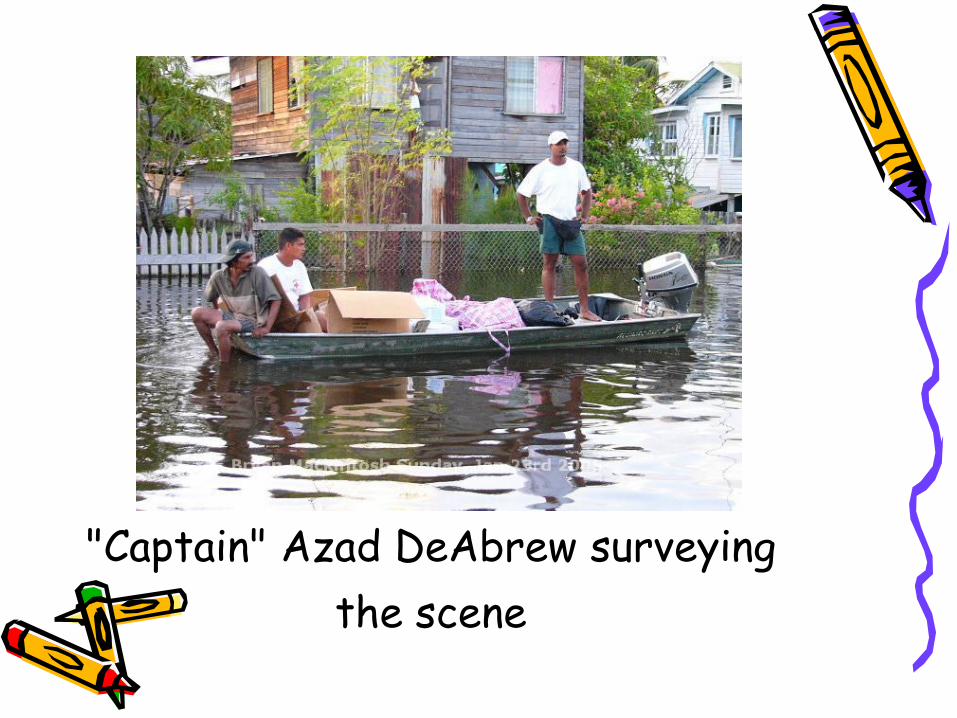
"Captain" Azad DeAbrew surveying
the scene
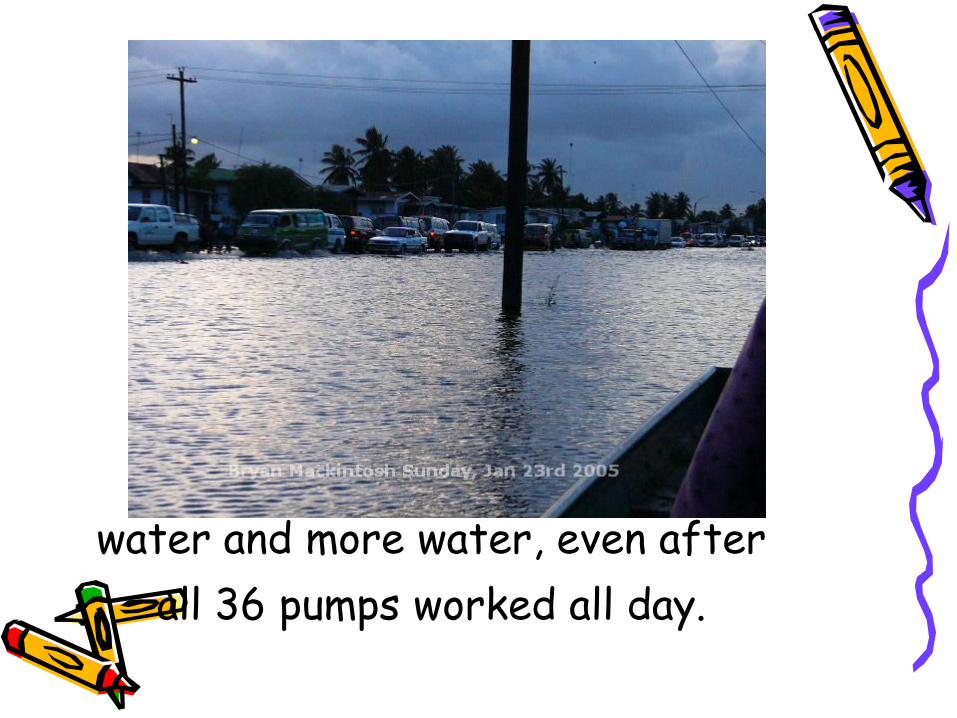
water and more water, even after
all 36 pumps worked all day.
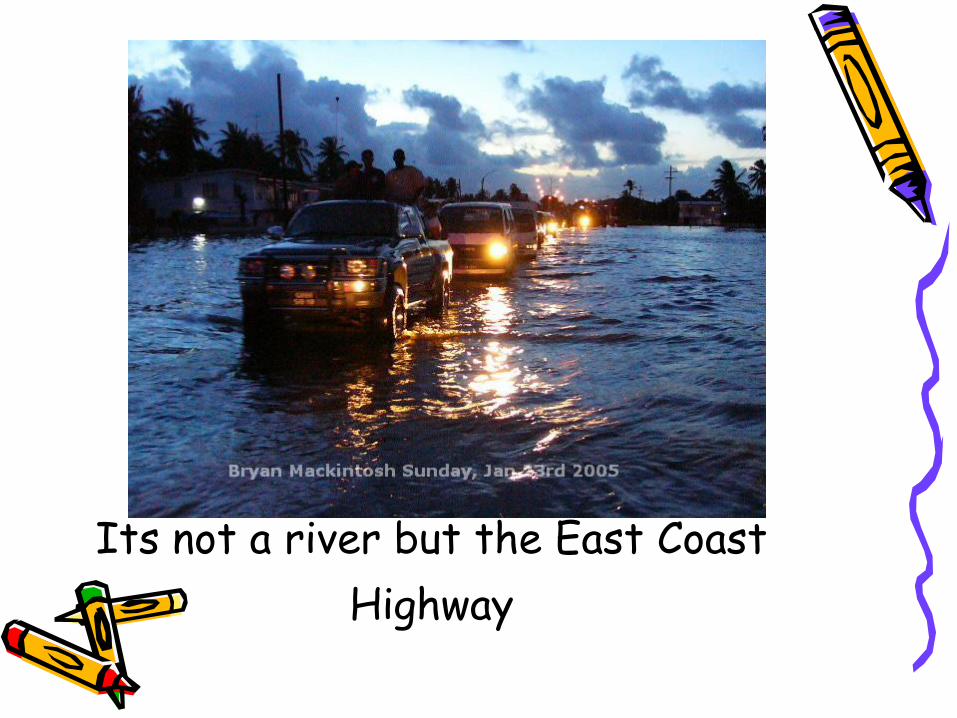
Its not a river but the East Coast
Highway
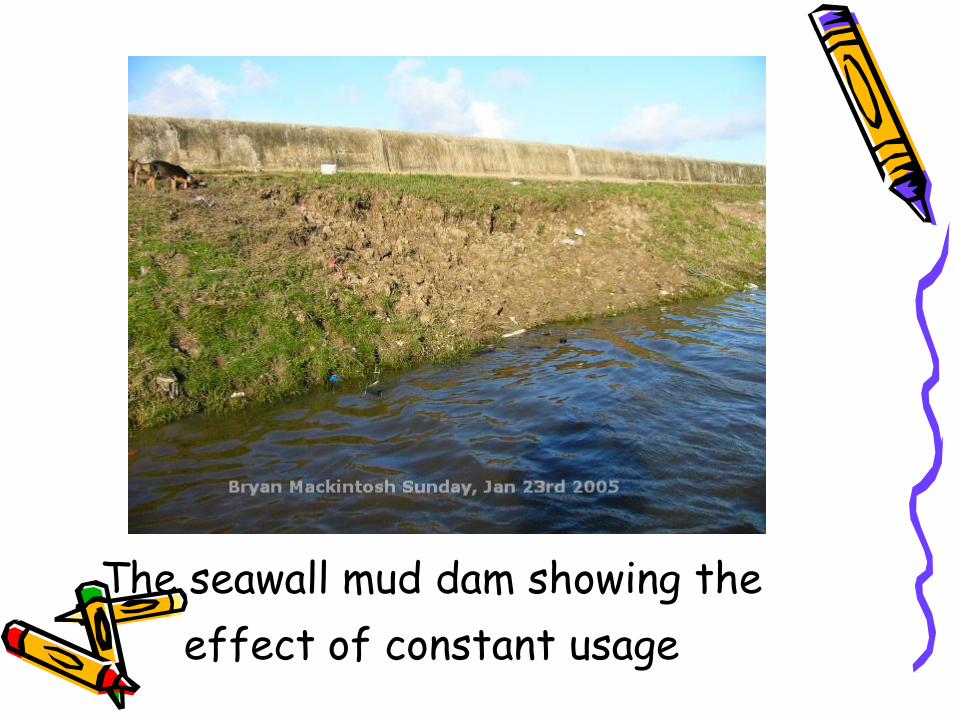
The seawall mud dam showing the
effect of constant usage

Housewife collecting her hamperon her roof

This is what makes it all worth the
hard work

Our Canadian medical friend
decided to improve his tan
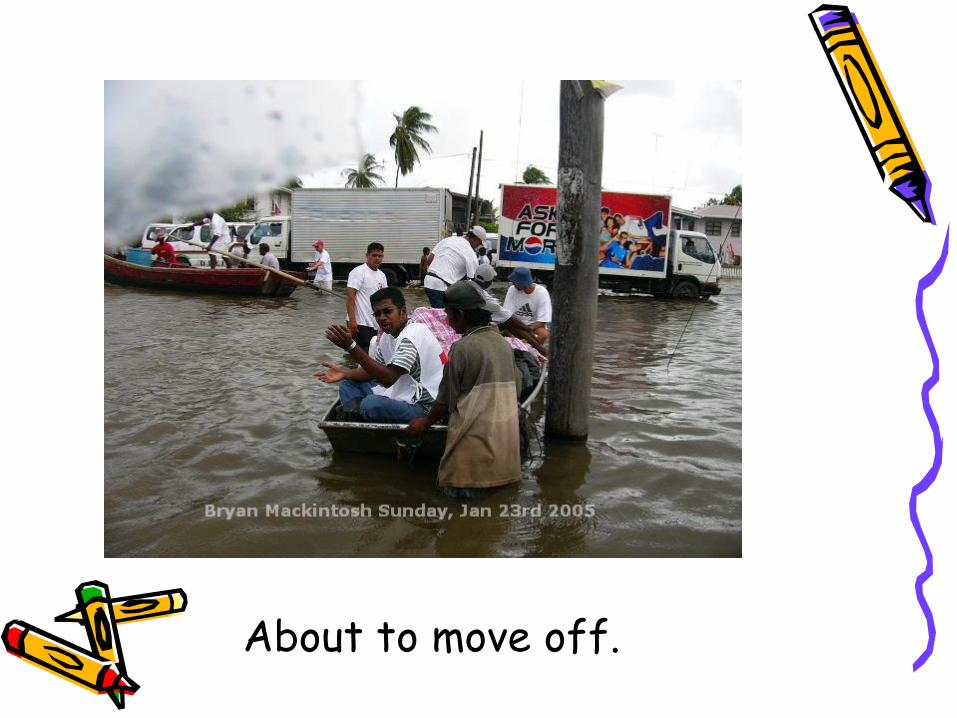
About to move off.
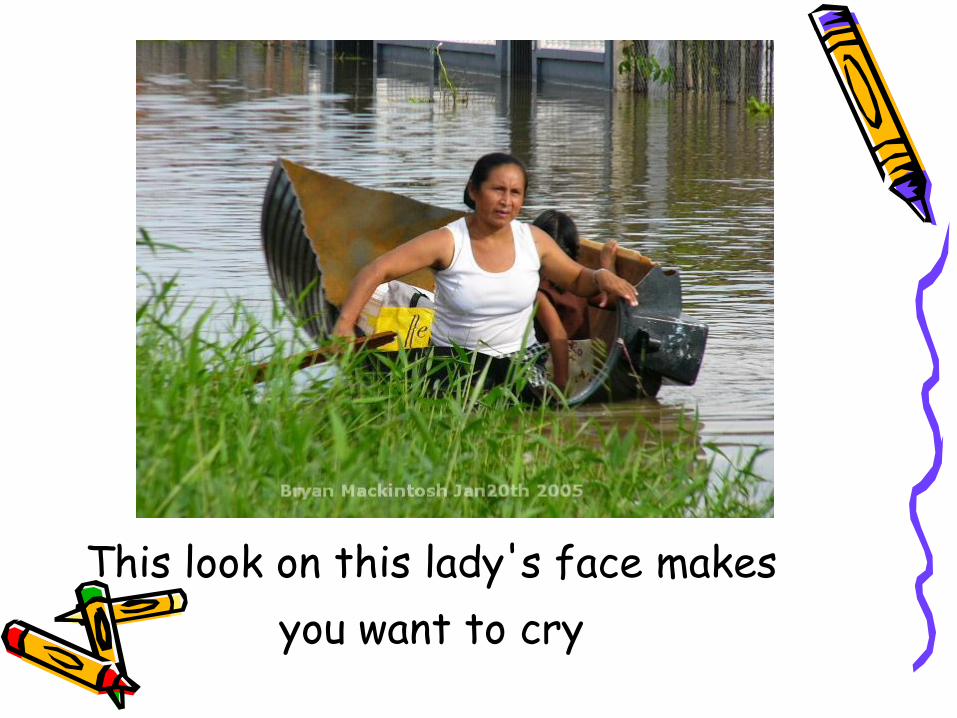
This look on this lady's face makes
you want to cry
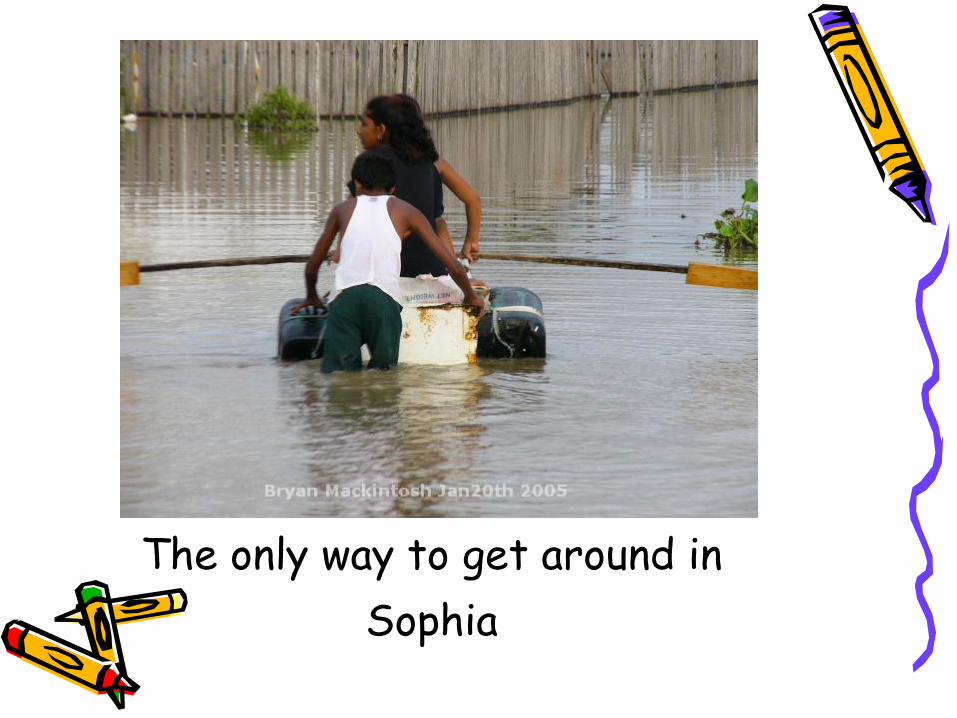
The only way to get around in
Sophia
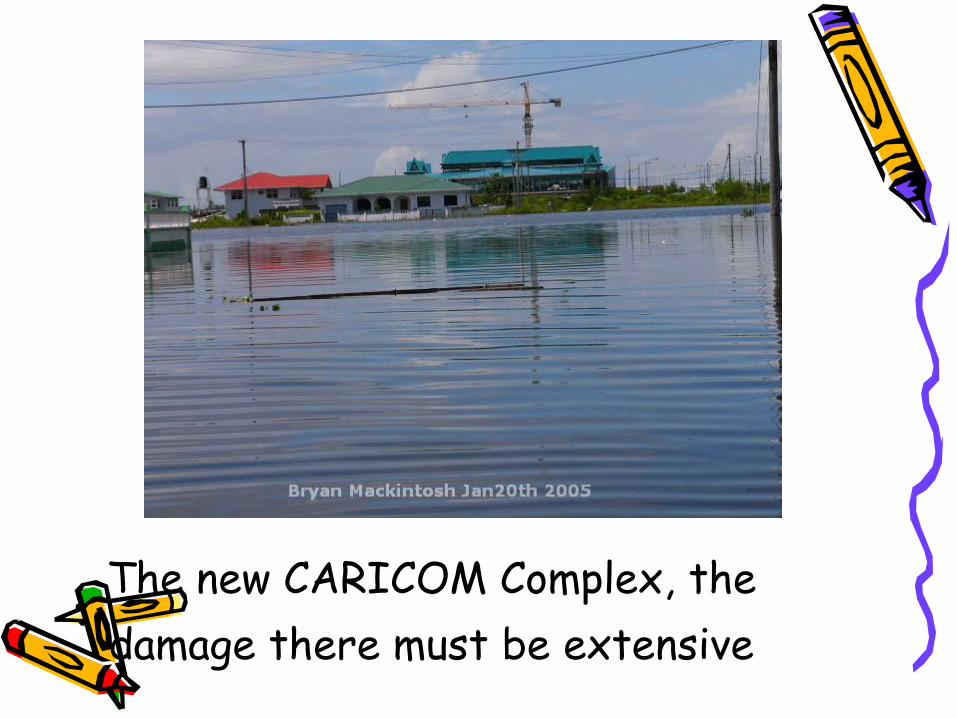
The new CARICOM Complex, the
damage there must be extensive
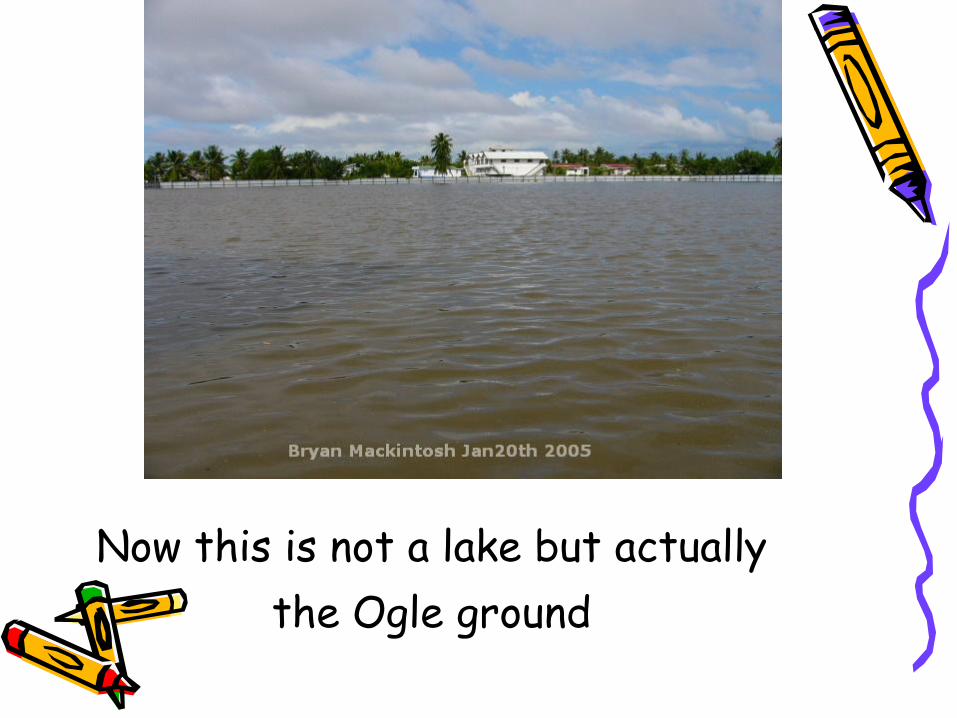
Now this is not a lake but actually
the Ogle ground
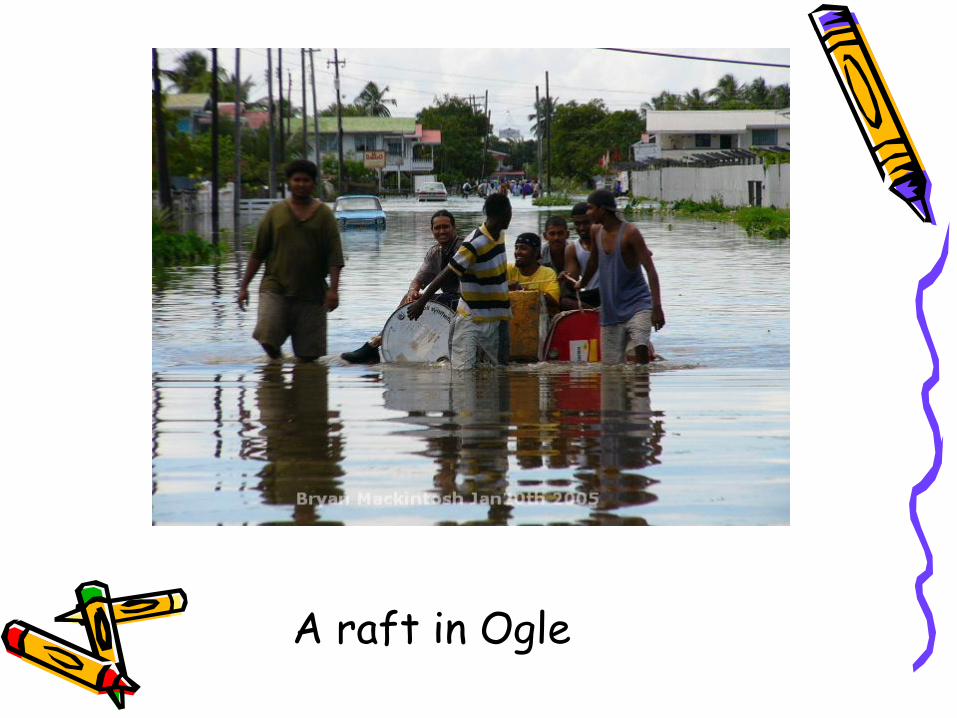
A raft in Ogle
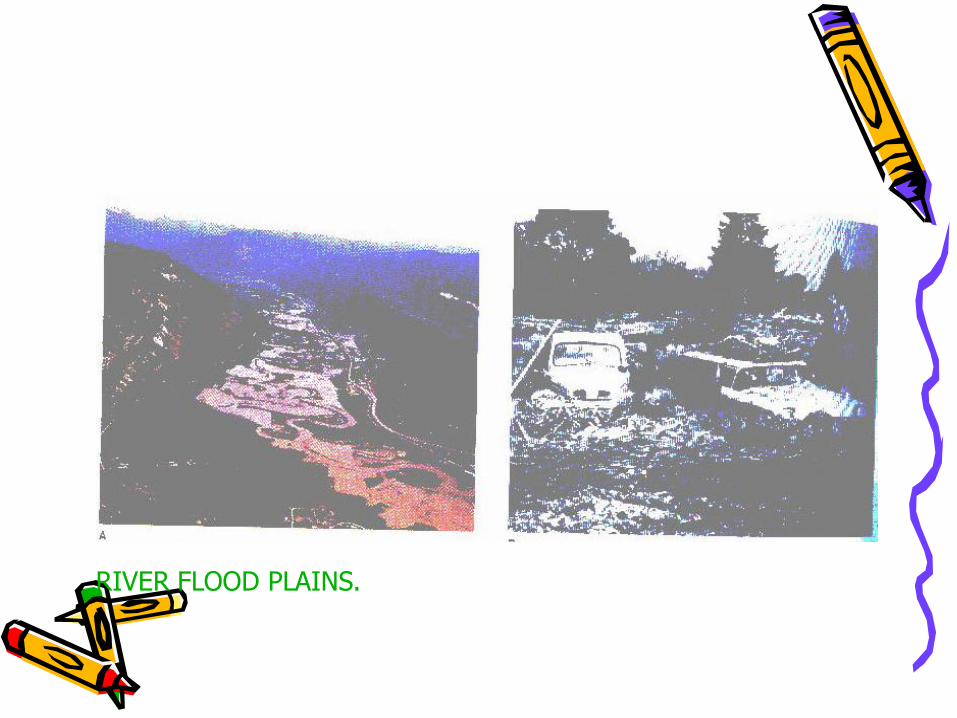
RIVER FLOOD PLAINS.
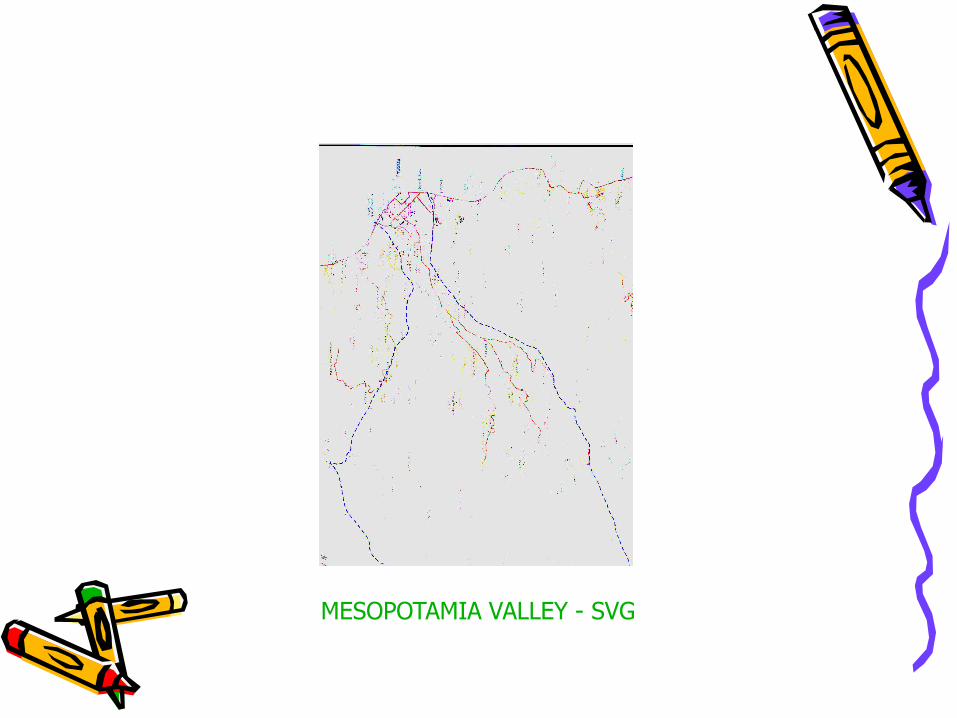
MESOPOTAMIA VALLEY - SVG
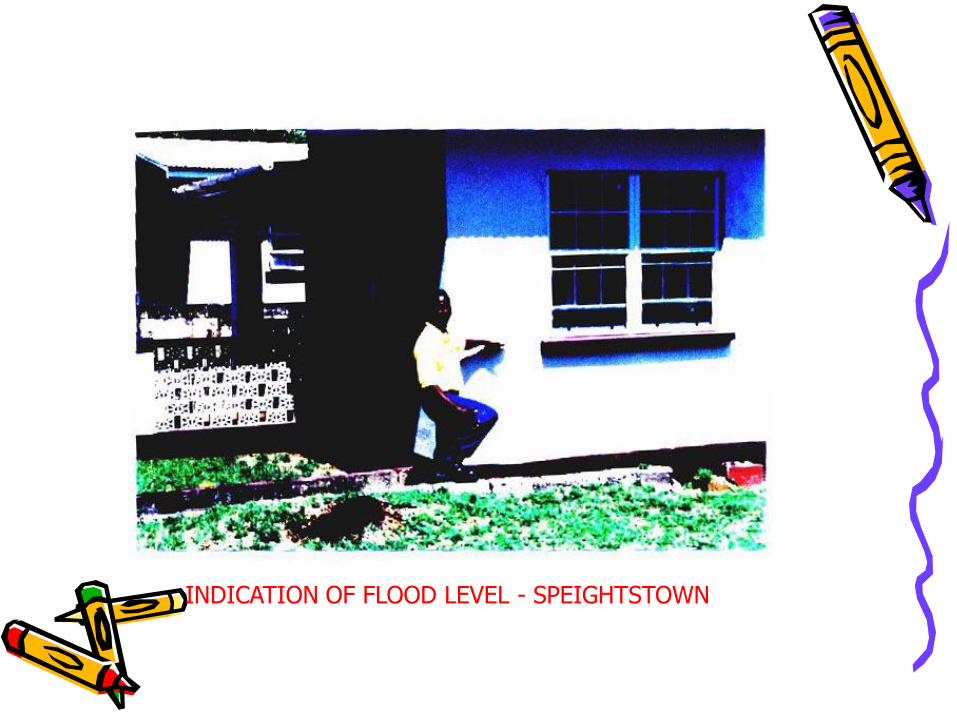
INDICATION OF FLOOD LEVEL - SPEIGHTSTOWN
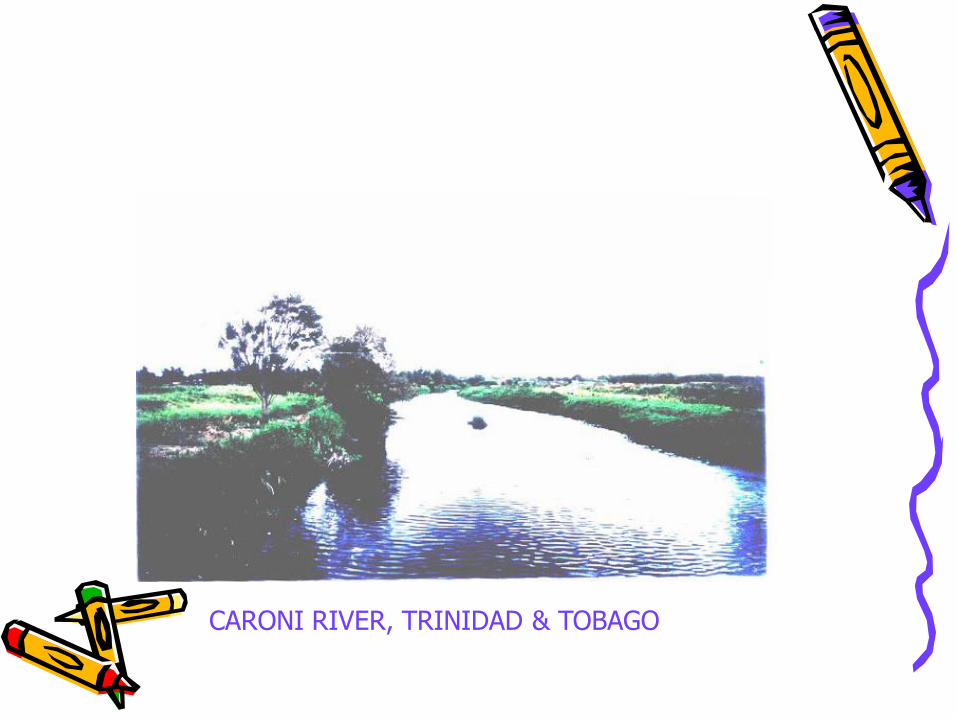
CARONI RIVER, TRINIDAD & TOBAGO
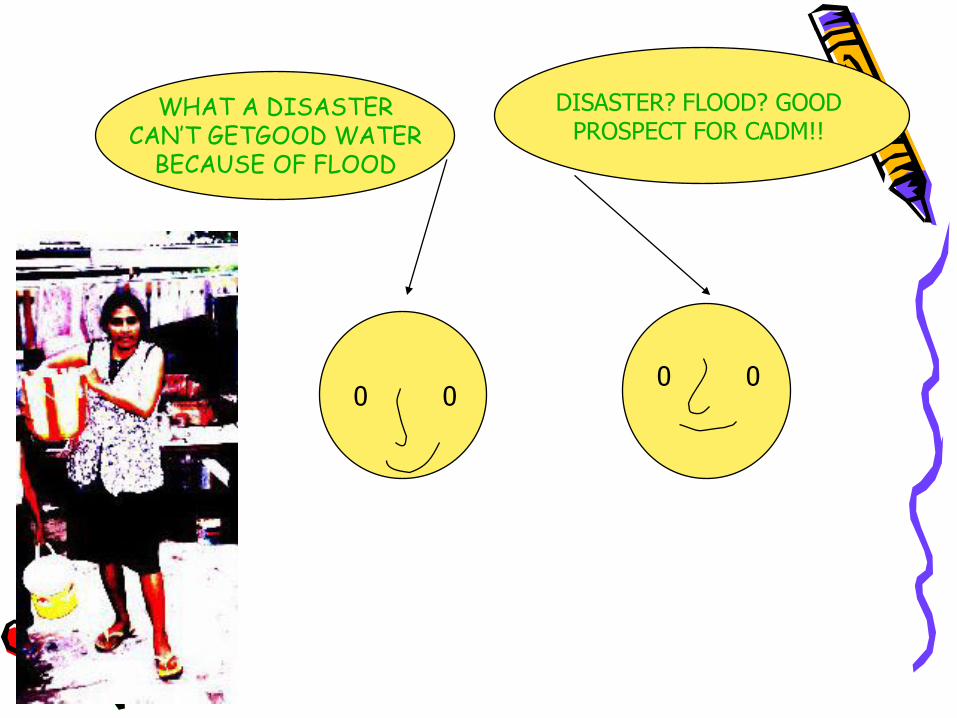
WHAT A DISASTERCAN’T GETGOOD WATER
BECAUSE OF FLOOD
DISASTER? FLOOD? GOOD PROSPECT FOR CADM!!
0 00 0