Embed Size (px)
Citation preview
Floods and Exports: An Empirical Study on
Natural Disaster Shocks in Southeast Asia
Kaori Tembata
Kenji Takeuchi
April 2018
Discussion Paper No.1817
GRADUATE SCHOOL OF ECONOMICS
KOBE UNIVERSITY
ROKKO, KOBE, JAPAN
Floods and Exports: An Empirical Study onNatural Disaster Shocks in Southeast Asia
Kaori Tembata∗ and Kenji Takeuchi†
April 11, 2018
Abstract
This study analyzes the effects of climate-related disasters on internationaltrade in Southeast Asia. We use monthly trade data to examine the rela-tionship between disaster shocks and exports. The empirical analysis showsthat natural disasters have a significant negative effect on exports. Theestimation results suggest that flooding causes immediate export losses ofUSD 305–557 million. In addition, we find that the effect persists in thepost-disaster period, with floods causing annual export losses of USD 2.54billion in total. We further investigate the impact of disasters by productgroup and show that disasters are negatively associated with the exportsof agricultural and manufacturing products. The findings suggest that ex-treme weather events have severe repercussions on Southeast Asia, whereexports play an important role in economic development.
Keywords: Climate change; Exports; Extreme weather; Flood; Natural dis-aster; Southeast Asia; Storm
∗Graduate School of Economics, Kobe University. 2-1, Rokkodaicho, Nadaku, Kobe, Hyogo657-8501 Japan. E-mail: [email protected]
†Graduate School of Economics, Kobe University. 2-1, Rokkodaicho, Nadaku, Kobe, Hyogo657-8501 Japan E-mail: [email protected]
1
1 Introduction
Natural disasters can cause severe destruction and devastation, leading to signifi-
cant economic and human damage. According to the Emergency Events Database
(EM-DAT), a total of 6,457 weather-related disasters have occurred worldwide be-
tween 1995 and 2015 (CRED and UNISDR 2015). These disasters have caused
economic damages of USD 1,891 billion and, on average, affected 205 million peo-
ple every year. Among such disasters, floods are the most frequent disaster type,
accounting for 43% of the natural disasters. In the past two decades, 2.3 million
people have been affected by floods, causing economic losses of USD 662 billion.
The Intergovernmental Panel on Climate Change (IPCC) reports growing eco-
nomic losses as a result of flooding since the 1970s (IPCC 2014). This trend is
likely to continue with flood events projected to increase in certain parts of the
world, especially developing nations where economic losses relative to GDP are
the most significant.
Researchers have examined the effects of natural disasters on socioeconomic
activities at the aggregate and disaggregate levels (Anttila-Hughes and Hsiang
2013; El Hadri et al. 2017; Gassebner et al. 2010; Hsiang 2010; Hsiang and Narita
2012; Leiter et al. 2009; Loayza et al. 2012; Mendelsohn et al. 2011). For example,
Hsiang and Narita (2012) use global cross-sectional data for 1950 to 2008 to exam-
ine the marginal damages of tropical cyclones. The authors find that an increase in
cyclone exposure is associated with greater economic damages and human losses.
Loayza et al. (2012) investigate four types of natural hazards using cross-country
panel data. They find that storms negatively affect agricultural growth in de-
veloping countries. However, their study shows mixed results for flood impacts.
2
While moderate flooding positively affects economic growth, severe floods have a
negative growth effect. By using firm-level data, Leiter et al. (2009) also find a
positive effect of floods on the firms’ capital accumulation and employment growth
while demonstrating a negative flood impact on productivity. The effects of nat-
ural disasters may not be limited to one country but involve multiple countries
through international trade. Oh and Reuveny (2010) examine the effect of cli-
matic disasters and political risk on trade. Their analysis includes bilateral trade
data and various types of weather-related disasters, showing that these climatic
events reduce imports. Gassebner et al. (2010) also use bilateral trade data to
investigate the impact of large-scale natural and technological disasters. El Hadri
et al. (2017) focus on four types of natural disasters to examine their impacts
on export values. These studies draw attention to the economic costs of climate
change through trade channel, considering the growing importance of international
trade to the world economy. However, studies analyzing the relationship between
climate-related disasters and trade remain limited.
The objective of this study is to examine the effects of climate-related disasters
on international trade. We focus on two types of extreme weather events, that
is, floods and storms, to explore the relationship between natural hazards and
exports in Southeast Asian countries. Southeast Asia provides a good opportunity
to analyze the topic for two reasons. First, floods and storms in Southeast Asia
are the two most frequent and damaging natural hazards. Between 2006 and 2015,
the average annual costs incurred as a result of floods and storms were USD 5.8
billion and USD 2.7 billion, respectively (Guha-Sapir et al. 2016). Economic losses
in lower-income countries are smaller in absolute value, compared to those in high-
income countries; however, these losses are relatively large as a share of GDP. In
3
this sense, natural disasters can lead to severe consequences in Southeast Asia.
Second, Southeast Asia’s exports are a key factor for economic development. In
ASEAN countries, for example, the total traded goods amounted to USD 2,270
billion in 2015, accounting for 93% of the region’s GDP (ASEAN 2016). Since
more than 70% of the goods are exported to the outside of ASEAN countries,
Southeast Asia’s export losses caused by natural disasters may also affect other
countries’ economy through the global supply chain.
Our study is also related to the literature that examines climate impacts on
various socioeconomic activities (see Dell et al. 2014; Heal and Park 2016). While
researchers have analyzed and found links between climate and aggregate eco-
nomic outcomes, recent works emphasize broader dimensions of socioeconomic
activities and explore them as channels through which climate affects macroecon-
omy. Such channels include agriculture, labor productivity, energy production,
migration, health and mortality, and conflicts (Anttila-Hughes and Hsiang 2013;
Barrios et al. 2006; Cachon et al. 2012; Chen et al. 2016; Di Falco et al. 2012;
Marchiori et al. 2012; McDermott and Nilsen 2014; Miguel et al. 2004). Among
these channels, agriculture has been the primary focus of climate studies because
of the sector’s critical dependence on weather conditions. Nevertheless, there is
a growing body of literature that investigates climate impacts associated with
non-agricultural outputs. Using international trade data, Jones and Olken (2010)
examine the effects of weather shocks on exports and find that a 1◦C increase in
temperature reduces export growth by 2.0–5.7 percentage points in poor countries.
They further analyze climate impacts on exports by product and show that tem-
perature shocks in poor countries negatively affect the exports of agricultural and
light manufacturing products. Dell et al. (2012) show that temperature shocks af-
4
fect both agricultural and industrial value-added in poor countries. Hsiang (2010)
examines the impact of temperature and cyclones and find that production losses
from non-agricultural outputs outweigh those from agricultural ones. The existing
literature suggests that economic impacts of extreme weather are not limited to
the agricultural sector but also observed in broader aspects of the economy.
This paper makes the following contributions to the literature on climate im-
pacts. First, we focus on two types of weather shocks, that is, floods and storms,
to investigate the extent to which natural disasters affect exports. While Jones
and Olken (2010) estimate the impact of temperature on trade, they do not con-
sider weather-related disasters, which may be greatly affected by climate change in
terms of intensity and frequency. Second, our analysis adopts export data classified
by the Harmonized System (HS) code. The breakdown of export data in our study
allows us to compare product groups and identify industries affected by disaster
shocks. In addition, monthly data can capture the effect of climate disasters more
precisely than annual data used in most studies (Gassebner et al. 2010; Oh and
Reuveny 2010). Third, this study uses alternative measures for disaster variables,
one of which represents the duration of disaster events. Flooding exhibits greater
variability in duration depending on its type: while flash floods occur for a shorter
duration, riverine and costal floods may last for longer periods, thereby leading to
greater impacts on economic outputs. An advantage of using alternative variables
is their ability to capture such severity of disasters.
The results of the regression analysis show that floods and storms are nega-
tively associated with export values, suggesting that the disasters reduce exports
from Southeast Asia. The findings suggest that the occurrence of floods has an im-
mediate effect on export values, as well as a persistent impact that sustains in the
5
post-disaster period. To explore this possibility, we include lagged disaster vari-
ables in the estimation. We find that these variables are negatively correlated with
exports, showing that flood effects persist for several months. In addition, we find
that the exports of both agricultural and manufacturing products are affected by
disasters. While many studies on climatic impact focus on agriculture, this study
identifies the effect of weather shocks on non-agricultural products. Our findings
support recent research findings that the negative effects of weather shocks tend
to prevail in various economic outcomes, including non-agricultural outputs (e.g.,
Hsiang 2010; Jones and Olken 2010).
The remainder of this paper is organized as follows. Section 2 provides an
overview of flood and storm events in Southeast Asia. Section 3 presents the
regression model and describes the data employed in the analyses. Section 4
discusses the empirical results. Finally, Section 5 concludes.
2 Floods and Storms in Southeast Asia
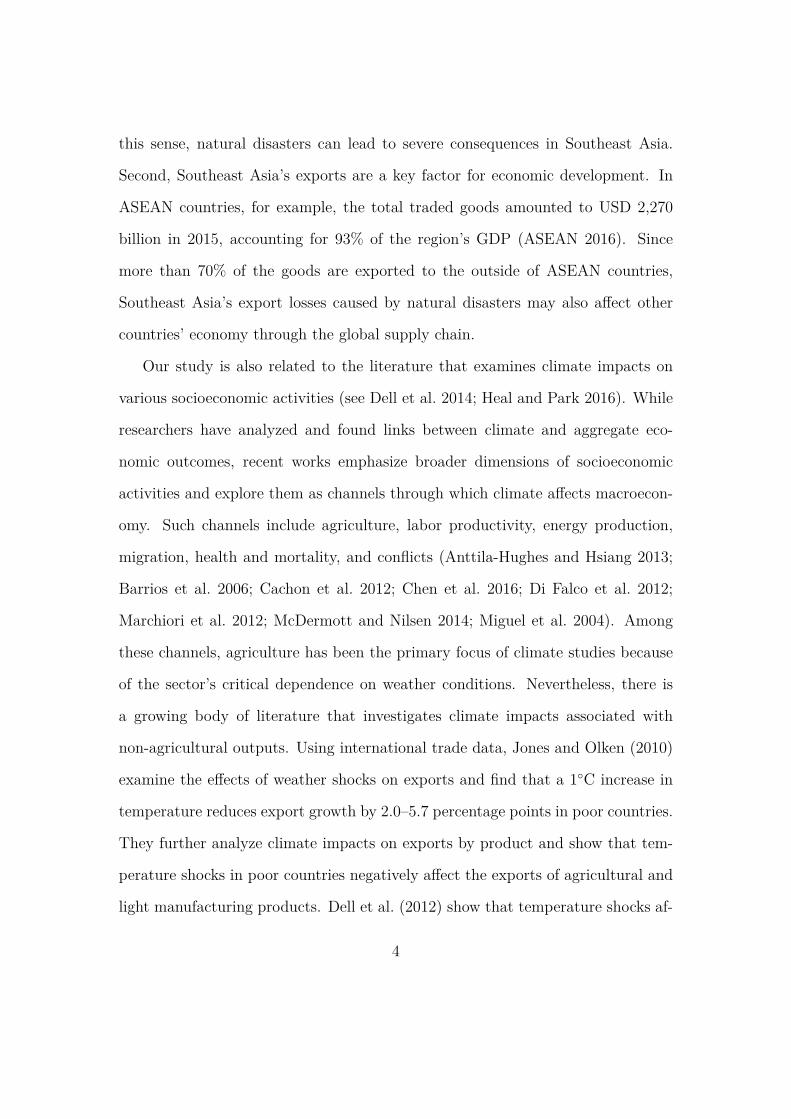
Southeast Asia, as part of the Asia-Pacific region, is one of the most disaster-prone
areas in the world. Figure 1 illustrates the annual number of flood events in four
Southeast Asian countries: Indonesia, Malaysia, the Philippines, and Thailand.
As shown in the figure, the number of floods has been steadily increasing over the
years. Floods, which were less frequent in the 1990s, have increased to about 10–25
times per year and intensified over the past decade. Figure 1 also depicts the extent
of damages caused by floods; the circle-shaped markers indicate damages in areas
proportional to the number of people affected. The larger circles observed in recent
years denote the greater number of people affected by the flooding. Similarly,
6
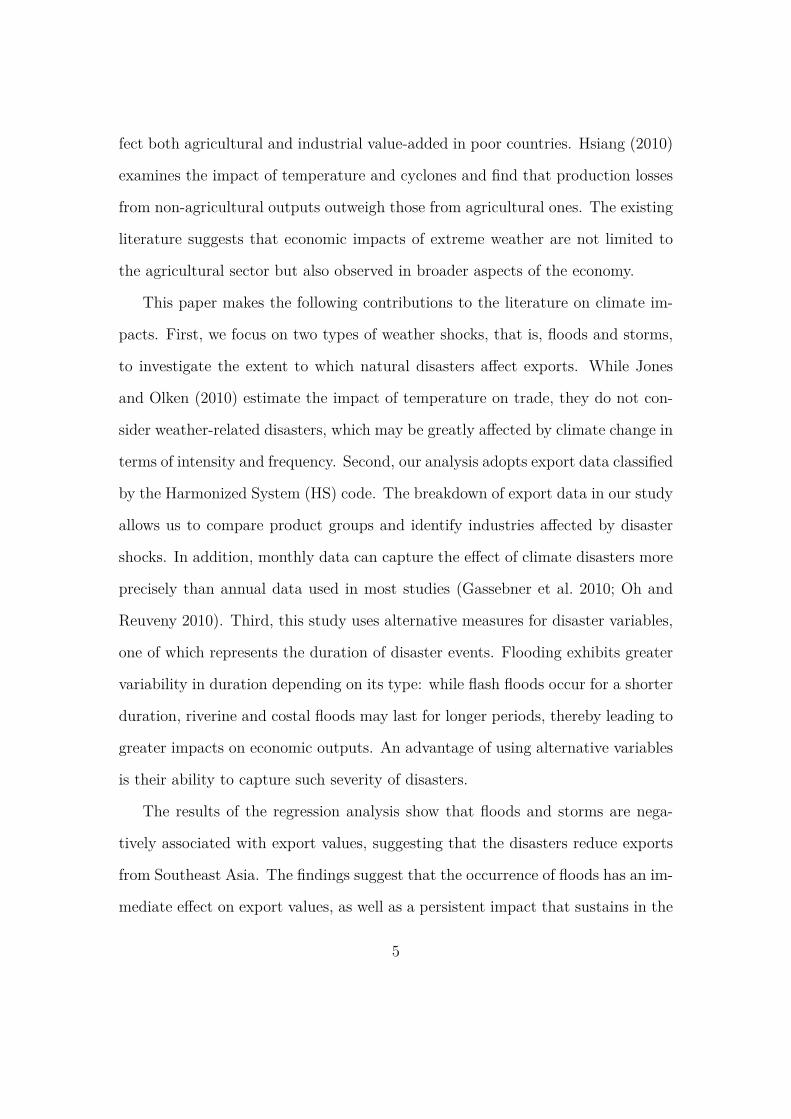
Figure 2 presents the annual number of storm events in Southeast Asia. While
the figure suggests only a modest increase in the number of storm events, storm
damages are likely to become larger in the subsequent years. The larger circles
in the figure indicate the severe impact of recent storms on countries in terms of
human damages.
Table 1 presents the five most extreme disasters that have occurred in Southeast
Asia between 1990 and 2016. These individual events caused the most costly
damages during this period. Flood and storm events are presented by country,
along with year of occurrence, economic damage, death toll, and number of people
affected. As the table shows, most of the severe disasters have taken place after
2010. The most extensive flood occurred in Thailand, followed by Indonesia and
the Philippines. On the other hand, the five most damaging storms reported during
this period occurred in the Philippines.
The 2011 flooding in Thailand resulted in more than 800 deaths and affected
9.5 million people across the country, causing economic damages of USD 40 billion.
The flood also reportedly destroyed 19,000 houses and damaged about 18,000 km2
of farmland (World Bank 2012). The record-breaking precipitation levels and mul-
tiple typhoons from May to September are largely responsible for the widespread
and prolonged flooding. The flood initiated in the northern region of Thailand, in-
undating 66 of the 77 provinces in the country and reaching the Bangkok metropoli-
tan region by November. The primary reason for the devastating economic damage
is that the flood affected the central part of the country, where foreign manufac-
turing firms are accumulated in industrial parks (Oizumi 2012).1 Manufacturing1These areas are covered by the Chao Phraya River Basin that drains through the central
region to Bangkok and eventually, into the Gulf of Thailand.
7
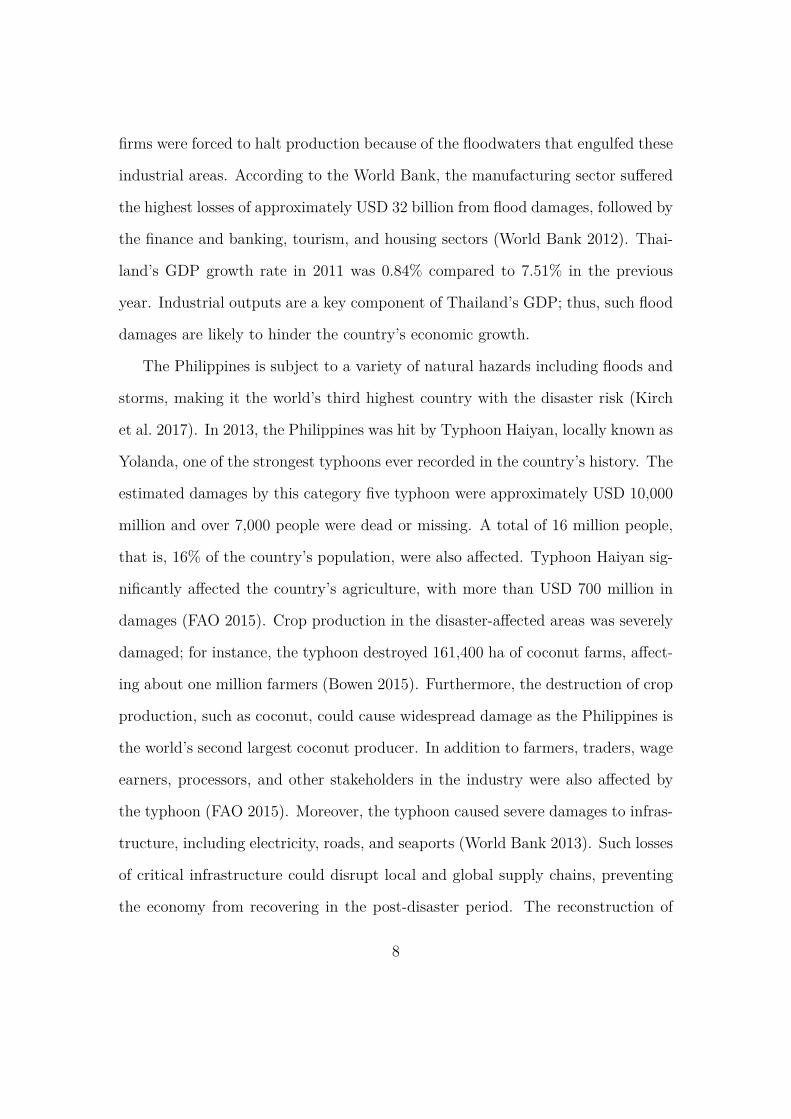
firms were forced to halt production because of the floodwaters that engulfed these
industrial areas. According to the World Bank, the manufacturing sector suffered
the highest losses of approximately USD 32 billion from flood damages, followed by
the finance and banking, tourism, and housing sectors (World Bank 2012). Thai-
land’s GDP growth rate in 2011 was 0.84% compared to 7.51% in the previous
year. Industrial outputs are a key component of Thailand’s GDP; thus, such flood
damages are likely to hinder the country’s economic growth.
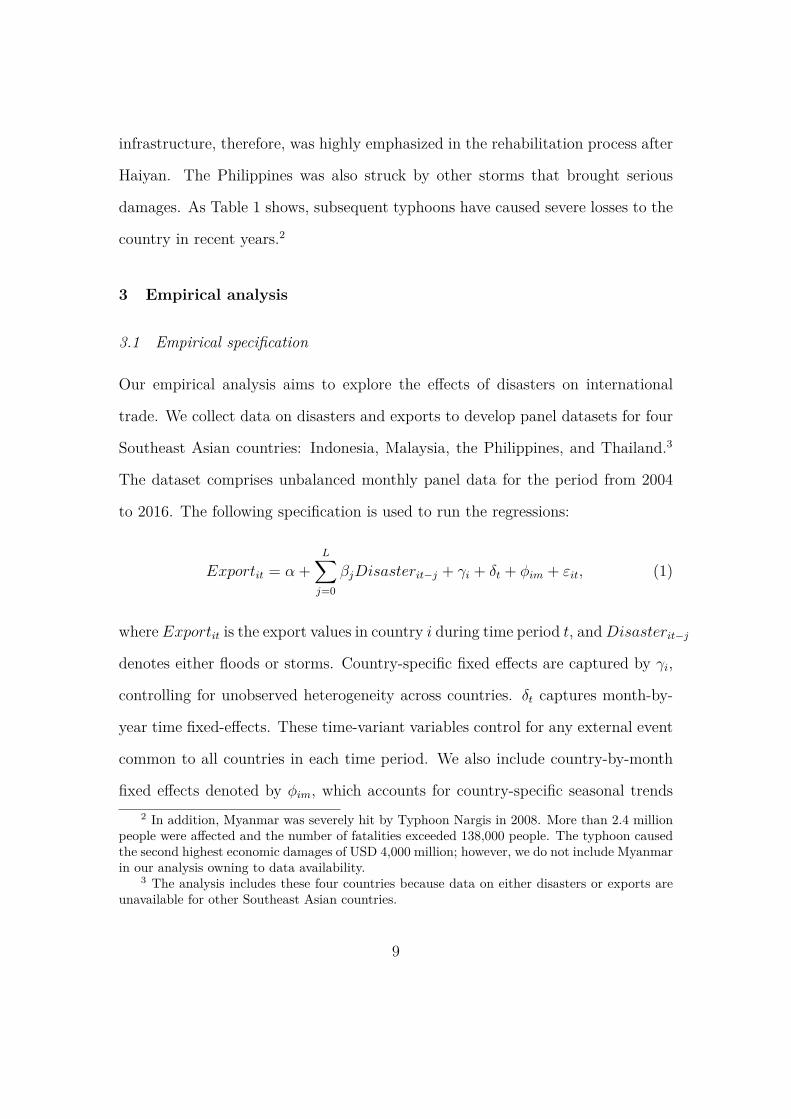
The Philippines is subject to a variety of natural hazards including floods and
storms, making it the world’s third highest country with the disaster risk (Kirch
et al. 2017). In 2013, the Philippines was hit by Typhoon Haiyan, locally known as
Yolanda, one of the strongest typhoons ever recorded in the country’s history. The
estimated damages by this category five typhoon were approximately USD 10,000
million and over 7,000 people were dead or missing. A total of 16 million people,
that is, 16% of the country’s population, were also affected. Typhoon Haiyan sig-
nificantly affected the country’s agriculture, with more than USD 700 million in
damages (FAO 2015). Crop production in the disaster-affected areas was severely
damaged; for instance, the typhoon destroyed 161,400 ha of coconut farms, affect-
ing about one million farmers (Bowen 2015). Furthermore, the destruction of crop
production, such as coconut, could cause widespread damage as the Philippines is
the world’s second largest coconut producer. In addition to farmers, traders, wage
earners, processors, and other stakeholders in the industry were also affected by
the typhoon (FAO 2015). Moreover, the typhoon caused severe damages to infras-
tructure, including electricity, roads, and seaports (World Bank 2013). Such losses
of critical infrastructure could disrupt local and global supply chains, preventing
the economy from recovering in the post-disaster period. The reconstruction of
8
infrastructure, therefore, was highly emphasized in the rehabilitation process after
Haiyan. The Philippines was also struck by other storms that brought serious
damages. As Table 1 shows, subsequent typhoons have caused severe losses to the
country in recent years.2
3 Empirical analysis
3.1 Empirical specification
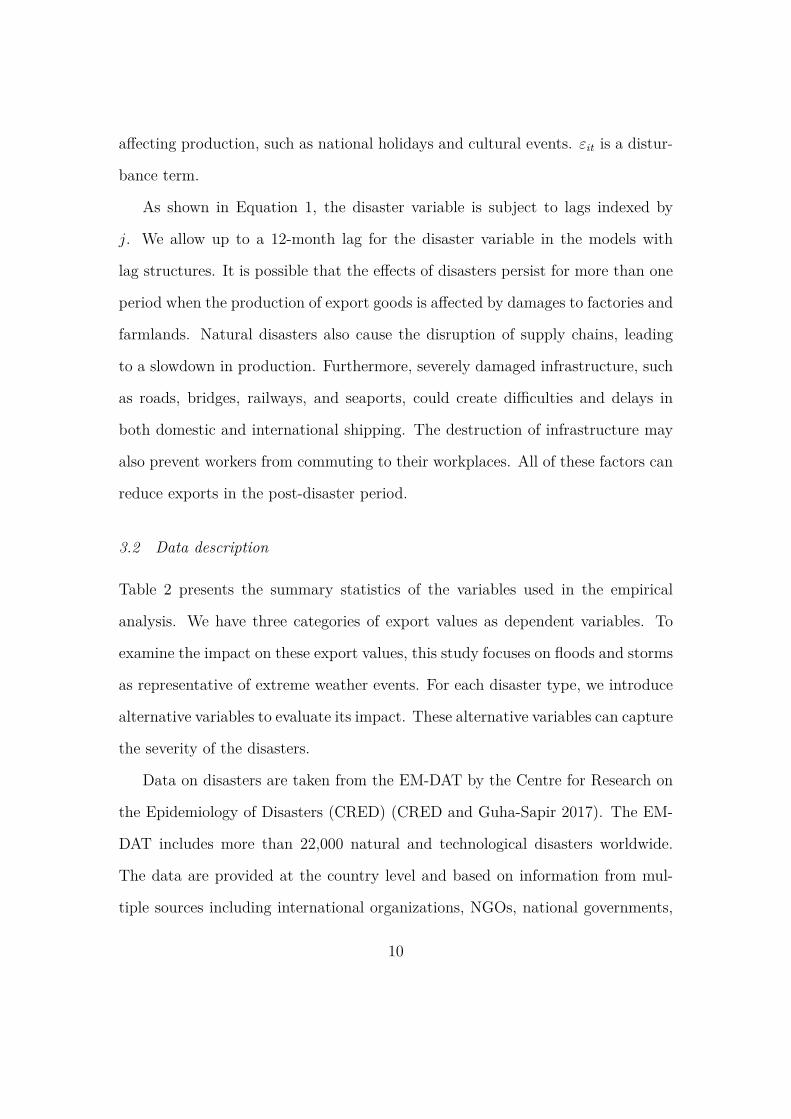
Our empirical analysis aims to explore the effects of disasters on international
trade. We collect data on disasters and exports to develop panel datasets for four
Southeast Asian countries: Indonesia, Malaysia, the Philippines, and Thailand.3
The dataset comprises unbalanced monthly panel data for the period from 2004
to 2016. The following specification is used to run the regressions:
Exportit = α +L∑
j=0
βjDisasterit−j + γi + δt + ϕim + εit, (1)
where Exportit is the export values in country i during time period t, and Disasterit−j
denotes either floods or storms. Country-specific fixed effects are captured by γi,
controlling for unobserved heterogeneity across countries. δt captures month-by-
year time fixed-effects. These time-variant variables control for any external event
common to all countries in each time period. We also include country-by-month
fixed effects denoted by ϕim, which accounts for country-specific seasonal trends2 In addition, Myanmar was severely hit by Typhoon Nargis in 2008. More than 2.4 million
people were affected and the number of fatalities exceeded 138,000 people. The typhoon causedthe second highest economic damages of USD 4,000 million; however, we do not include Myanmarin our analysis owning to data availability.
3 The analysis includes these four countries because data on either disasters or exports areunavailable for other Southeast Asian countries.
9
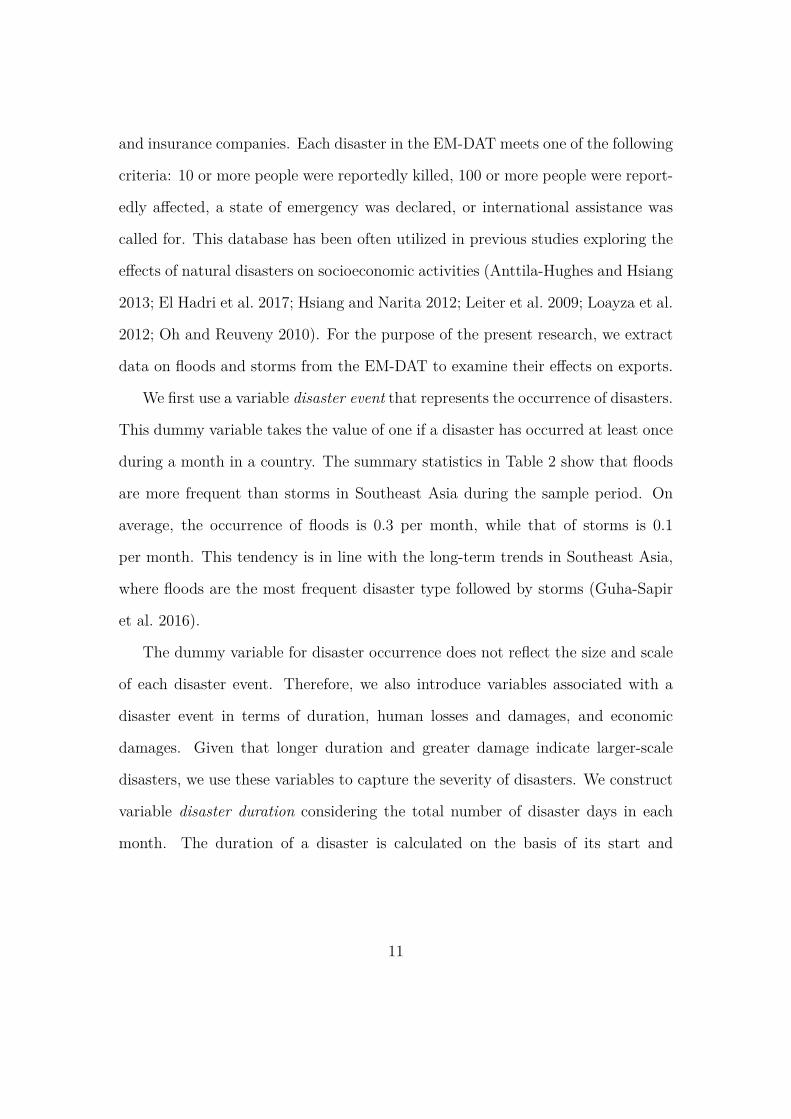
affecting production, such as national holidays and cultural events. εit is a distur-
bance term.
As shown in Equation 1, the disaster variable is subject to lags indexed by
j. We allow up to a 12-month lag for the disaster variable in the models with
lag structures. It is possible that the effects of disasters persist for more than one
period when the production of export goods is affected by damages to factories and
farmlands. Natural disasters also cause the disruption of supply chains, leading
to a slowdown in production. Furthermore, severely damaged infrastructure, such
as roads, bridges, railways, and seaports, could create difficulties and delays in
both domestic and international shipping. The destruction of infrastructure may
also prevent workers from commuting to their workplaces. All of these factors can
reduce exports in the post-disaster period.
3.2 Data description
Table 2 presents the summary statistics of the variables used in the empirical
analysis. We have three categories of export values as dependent variables. To
examine the impact on these export values, this study focuses on floods and storms
as representative of extreme weather events. For each disaster type, we introduce
alternative variables to evaluate its impact. These alternative variables can capture
the severity of the disasters.
Data on disasters are taken from the EM-DAT by the Centre for Research on
the Epidemiology of Disasters (CRED) (CRED and Guha-Sapir 2017). The EM-
DAT includes more than 22,000 natural and technological disasters worldwide.
The data are provided at the country level and based on information from mul-
tiple sources including international organizations, NGOs, national governments,
10
and insurance companies. Each disaster in the EM-DAT meets one of the following
criteria: 10 or more people were reportedly killed, 100 or more people were report-
edly affected, a state of emergency was declared, or international assistance was
called for. This database has been often utilized in previous studies exploring the
effects of natural disasters on socioeconomic activities (Anttila-Hughes and Hsiang
2013; El Hadri et al. 2017; Hsiang and Narita 2012; Leiter et al. 2009; Loayza et al.
2012; Oh and Reuveny 2010). For the purpose of the present research, we extract
data on floods and storms from the EM-DAT to examine their effects on exports.
We first use a variable disaster event that represents the occurrence of disasters.
This dummy variable takes the value of one if a disaster has occurred at least once
during a month in a country. The summary statistics in Table 2 show that floods
are more frequent than storms in Southeast Asia during the sample period. On
average, the occurrence of floods is 0.3 per month, while that of storms is 0.1
per month. This tendency is in line with the long-term trends in Southeast Asia,
where floods are the most frequent disaster type followed by storms (Guha-Sapir
et al. 2016).
The dummy variable for disaster occurrence does not reflect the size and scale
of each disaster event. Therefore, we also introduce variables associated with a
disaster event in terms of duration, human losses and damages, and economic
damages. Given that longer duration and greater damage indicate larger-scale
disasters, we use these variables to capture the severity of disasters. We construct
variable disaster duration considering the total number of disaster days in each
month. The duration of a disaster is calculated on the basis of its start and
11
end dates recorded in the EM-DAT.4 Similar to the occurrence of disasters, the
duration of floods tends to be longer than that of storms; the mean duration is 3.3
days per month for floods and 0.6 days per month for storms (see Table 2). Floods
could persist for days or weeks, thus lasting longer than storms, which typically
do not occur for more than a few days.
We also use human damages to measure the severity of disasters. Human
damages are denoted by death toll, defined as the number of deaths and missing
people, and people affected, which is the number of the injured, affected, and left
homeless as a result of a disaster. Contrary to the occurrence and duration of
disasters mentioned above, storms tend to cause greater consequences in terms
of damages related to mortality and injury. On average, storms lead to higher
number of deaths and people affected than floods.
Moreover, we use two variables that measure economic damages from floods and
storms: economic damages and insured losses. The former is the total value of all
damages and economic losses related to the disaster and the latter denotes damages
covered by insurance companies. Unlike human damages, these two indicators
exhibit larger impacts from floods than storms.
Trade data are based on monthly export values in each country. The data are
obtained from the International Trade Centre (ITC), a joint agency by the World
Trade Organization and United Nations.5 The ITC database provides detailed
trade data that classify products into groups using the HS classification code,
thereby enabling us to investigate the effects of disasters on exports by sector. We4 In the case of disasters simultaneously occurring in different regions of a country, we include
the durations for all such events in the calculation. This explains certain observations exhibitingdisaster duration that exceeds the number of total days in a given month.
5 Available at http://www.intracen.org/.
12
collect export values for all products and disaggregate export values at the two-
digit HS code level. The latter is then aggregated to two major sectors: agriculture
and manufacturing. In this study, agricultural goods include products with HS
codes 1 to 15, whereas manufacturing goods mean products with HS codes 16 to
97.
4 Results
4.1 Main results
We run regressions to estimate the effects of floods and storms on export values
using the fixed-effects model. The regression models include up to a 12-month
lag in disaster variables. The models with lag structures allow us to investigate
whether a disaster effect appears and persists in the post-disaster periods.
The regression results are presented in Table 3. Columns 1–4 show the results
for flood events and columns 5–8 show the results for storm events. For each
disaster type, the models include variables with no lag, 3 lags, 6 lags, or 12 lags.
In addition, the bottom row of each column presents the total effect of disasters,
calculated using the estimated coefficients of the disaster variable and its lagged
variables.
According to the results in columns 1–4 in Table 3, the occurrence of floods is
negatively related to the export values for all products. In the first column, the
coefficients of disaster event, that is, the immediate effect of floods, are negative
and statistically significant: the occurrence of floods reduces export values by USD
557 million in a month. This implies that, on average, export losses from floods are
13
approximately 4% of the total export values per month.6 The result of the model
with no lag shows that exports are immediately affected by floods. The effect of
floods is also observed in models with lags. In columns 2–4, the immediate impact
of floods remains significant, with export losses ranging from USD 305 million
to USD 405 million. The lagged variables are also negatively correlated with
export values. These results are mostly consistent in magnitude and statistical
significance, suggesting that the impact of floods appears two to three months
after the floods. When we add 12 lags, the effect of floods is observed six months
after the disaster. In these lag models, the coefficients of the cumulative effect
at the bottom row are all negative and statistically significant. For instance, the
model with 12 lags indicates that the annual export loss from floods that occurred
in a given month is USD 2.54 billion. This shows the total export losses from
floods more than four times as large as those of USD 557 million estimated without
lags in the first column. These results suggest that ignoring lagged effects may
underestimate flood damages that persist for over a period of time.
Columns 5–8 in Table 3 present the estimation results for storm events. In
contrast to the results for floods, we find no statistically significant effect of storms
on exports. While the effect of floods is statistically significant both with and
without lags, we find little evidence of storm impacts on export values from the
variable representing the disaster occurrence. One reason for the insignificance
might be the fact that the dummy variable of disaster occurrence does not fully
capture the difference in the scale of storm events. In Section 4.3, we conduct
the analysis by incorporating alternative variables that reflect the size of climate-6 According to the summary statistics in Table 2, the mean export values for all products in
the sample are USD 12.68 billion.
14
related disasters.
4.2 Agricultural and manufacturing products
We estimate the effect of floods and storms on the total export values in Section
4.1. The results suggest that extreme weather events contribute to reductions in
exports. This leads us to further analysis on the relationship between disasters
and exports. This section investigates the effect of floods and storms on exports,
with focus on specific components of exporting products. The export data are
classified into two industrial sectors using the two-digit HS code: agriculture and
manufacturing.
Table 4 presents the effect of floods on exports by two product groups. Agri-
cultural products are examined in columns 1–4 and manufacturing products are
in columns 5–8. In the first column, the coefficients of disaster event are negative
and statistically related to the export values of agricultural products. This imme-
diate effect is also correlated with export values when the models include lagged
variables, as shown in columns 2–4. The magnitude of these coefficients is slightly
smaller than the model without lags, although the negative signs and statistical
significance remain consistent. The total effect of flood variables suggests that
the export losses of agricultural products from floods occurred in a given month
are USD 133 million in the model with no lag and USD 595 million in the model
with 12 lags. Comparing these losses with the mean export values of agricultural
products in the sample (see Table 2), we find that the export losses from floods
per month are about 4–12% of the export values of agricultural products.
Similarly, we find that floods are associated with reductions in the export
values of manufacturing products. The model in the fifth column shows that
15
the immediate impact of flood events is statistically related to export values of
manufacturing products. The coefficients of disaster event in columns 6–8 are
also statistically significant. Moreover, the effect of floods is significant two to
three months after the disasters. The cumulative effect at the bottom row of
Table 4 indicates that, in the model without lags, floods that occurred in a given
month reduce the export values of manufacturing products by USD 398 million.
In the model with 12 lags, floods are associated with export losses of USD 1.90
billion. Applying the same calculation as that for agricultural products, we find
that monthly export losses from floods are 1–3% of the mean export values for
manufacturing products.
The estimation results by product group suggest that both agricultural and
manufacturing sectors suffer export losses caused by floods. Related research by
Jones and Olken (2010) also investigates weather shocks on export values. Using
the two-digit SITC data, their study finds that higher temperature negatively
affects agricultural and light manufacturing products in poor countries. In the
study on the relationship between temperature and economic growth, Dell et al.
(2012) find the impact of temperature on agricultural and industrial value-added
as potential channels for aggregate outputs. In line with these studies, our results
indicate that extreme weather events negatively affect both sectors.
Table 5 presents the results for the impact of storms on the exports of agricul-
tural and manufacturing products. Contrary to floods, we find no clear evidence
of storms affecting exports. The coefficients of storm variables are negative and
statistically significant in the first and second columns. These models suggest that
storms are correlated with the export values of agricultural products. However,
the impact of storms does not remain when lags are added. As for manufacturing
16
products, we find no significant impact of storm variables, although the coefficients
of these variables mostly show negative signs, as expected.
4.3 Alternative measures for disaster variables
We conduct additional analyses using alternative measures for disaster variables.
The five variables examined in this section depict the extent of effect floods and
storms have on exports in terms of duration, human losses and damages, and
economic damages. As described in Section 3.2, floods and storms have different
characteristics in terms of disaster severity. Therefore, these variables may better
represent disaster impacts. We apply the same estimation strategy as used for the
main results and examine the effect of disasters using alternative measures.
We begin with a variable representing the duration of disasters. Table 6 shows
the results using the total days of flood and storm events during a month. Columns
1–4 show the negative impact of floods on export values for all products. In
the second column, the coefficients of the immediate flood impact indicate that
an additional day of flooding increases export losses by USD 17 million. The
coefficients of the immediate impact in other models also show negative signs,
but statistically insignificant. In the lag models, the flood effect also appears
two months after the disaster. The coefficients of these variables are all negative
and statistically significant. Columns 5–8 present the results using the total days
of storm events during a month. In these models, certain storm variables have a
positive effect on exports, which is contrary to our hypothesis. However, a positive
effect becomes statistically insignificant when we estimate the model by product
group (see Appendix Table A2).
Table 7 shows the effect of floods and storms measured by human losses; that
17
is, the number of deaths and missing people by disasters. In columns 2–4, we find
that exports are affected by floods in the post-disaster periods. For instance, the
coefficients of the two-month lagged variable in the second column indicate that
export losses per death in a given month amount to USD 3 million. These flood
impacts are consistent in the remaining lag models. In the case of storms, we
find a persistent effect of the disasters, as shown in columns 5–8. The coefficients
of both immediate and lagged variables are negative and statistically significant,
suggesting that the impact of storms lasts for five months. The cumulative effect
of storms shows that export losses are between USD 0.4 million (no lag) and USD
3 million (12 lags) per death. Interestingly, the magnitude of the coefficients of
storm variables is smaller than that of flood variables, whereas we find the effect
of storms to be more persistent than that of floods. These findings suggest that
floods and storms may affect exports differently. When measured in terms of
human losses, floods are associated with larger and temporary export losses, while
storms with the same levels of severity lead to smaller and persistent export losses.
When the disaster variable is measured by the number of people affected, the
estimation results show similar patterns to those for the number of deaths. Table 8
presents the regression results with the number of people affected by disasters. In
the lag models in columns 2–4, the coefficients of the two-month lagged variable are
correlated with export values, indicating that export losses from floods are USD
0.2–0.3 million per 1,000 people affected. In columns 5–8, we find a negative and
statistically significant effect of storms that persists up to four months after the
disaster. In the fifth column, for example, the coefficients suggest that economic
losses from storms are USD 0.1 million per 1,000 people affected. These results
show coefficient patterns similar to those for the death toll variable. That is, the
18
coefficients of each storm variable are smaller but the post-disaster effect persists
for a longer period. We again find that the effect of floods tends to be larger and
temporary, while the effect of storms tends to be smaller and persistent. Together
with the death toll variable, these findings show that the indicators for human
losses and damages predict reductions in export values.
Furthermore, we estimate the effect of floods and storms on the basis of eco-
nomic damages, presented in Table 9. The effect of floods appears in lagged
variables, as shown in columns 2–4. The coefficients of the two- and three-month
lagged variables are negative and significantly related to export values. On the
other hand, we find a positive effect of floods in the four-month lagged variable,
as shown in columns 3–4. For the storm variables, the impact on exports appears
immediately and persistently in all models. The coefficients of these storm vari-
ables are negative and a significant effect persists for four months. In the model
with no lag, economic damages of USD one million by storms are associated with a
reduction in export values of USD 0.2 million.7 In the models with lags, the total
effect of storms in the bottom row of Table 9 shows that the estimated export
losses are approximately USD 0.8–1.3 million.
We also estimate the models with the disaster variable measured by damages
covered by insurance. Table 10 presents the results using insured losses as a proxy
for disaster impacts. In columns 2–4, the flood variables with two- and three-month
lags are negatively correlated with export values. We also find a positive sign for
the four-month lagged variable in the models with more than six lags. Columns
5–8 show the immediate and persistent impact of storms on export values. These7 A response from the CRED to our inquiry suggests that economic damages and insured
losses recorded in the EM-DAT do not include losses in export values.
19
models suggest that the immediate storm effect causes export values to decrease by
approximately USD 3 million. When lagged variables are included, the cumulative
effect of storms indicates export losses of USD 11–19 million.
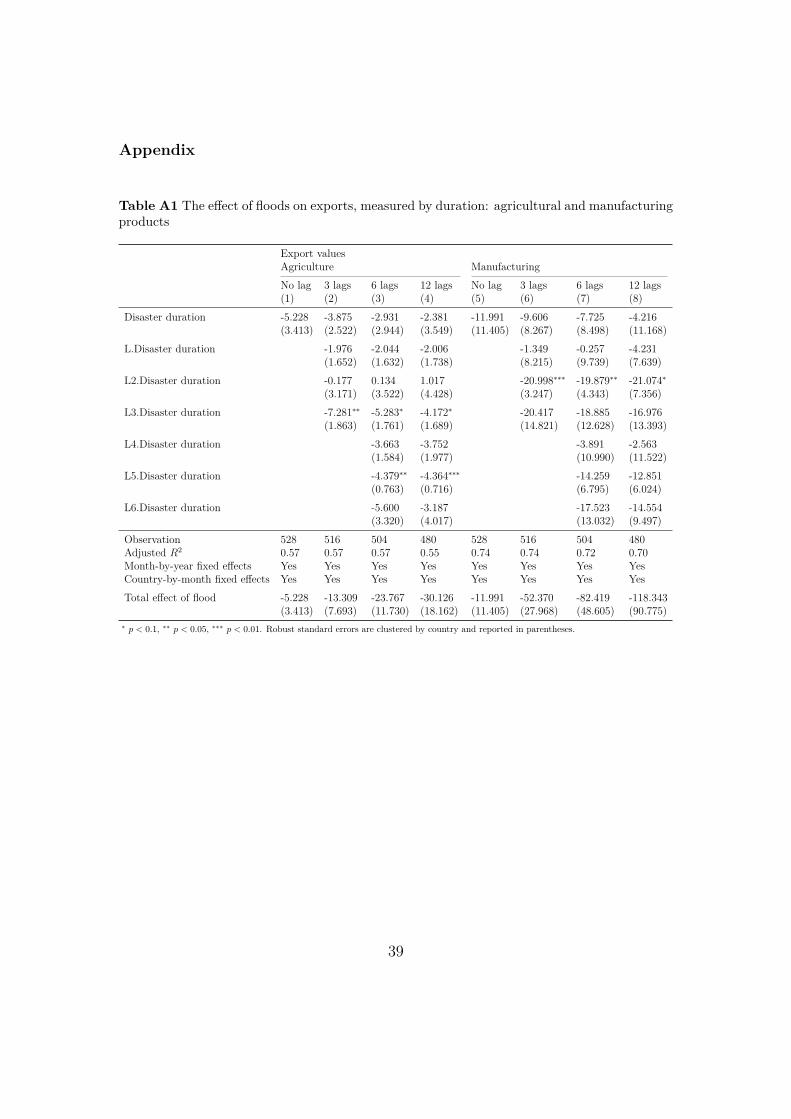
In addition, we separately examine the effect on the export values of agricul-
tural and manufacturing products using alternative disaster variables discussed
in this section. The results by product category show that both agriculture and
manufacturing are affected by floods and storms. This supports our findings in
the previous sections that both agricultural and manufacturing sectors account for
export losses from disasters. Furthermore, we find a significant effect of lagged vari-
ables, suggesting that the effect of floods and storms persists in the post-disaster
periods. These results are presented in Appendix Tables A1 to A10.
5 Conclusions
This paper examines the effect of natural disaster shocks on exports in Southeast
Asia. We focus on the two most frequent weather-related disasters: floods and
storms. The panel dataset comprises monthly export data for four Southeast
Asian countries for the past two decades. In the empirical analysis, disasters are
measured by occurrence and severity to examine the extent to which floods and
storms affect exports.
The regression results show a significant effect of natural disasters on exports,
suggesting that flood and storm events reduce export values. In the case of floods,
we find that the occurrence of flooding is significantly correlated with total export
values. The findings suggest that the immediate effect of floods leads to a reduction
in exports by USD 305–557 million. This study also analyzes models with lag
20
structures and finds flood impacts in the post-disaster periods. When considering
12-month lags, we find that the total effect of floods occurred in a given month
decreases export values by USD 2.54 billion. The effect of storms is also found in
the case of alternative disaster variables. For instance, we use human losses as a
disaster variable and find a negative and significant impact of storms. Moreover,
the results show that storm effects appear immediately and persistently in the post-
disaster periods. With 12-month lags, we find that storm impacts are associated
with export losses of USD 3 million per death.
When disasters are measured by human losses and damages, we find that floods
and storms affect differently in terms of size and length. The results show that
floods are associated with larger export losses that appear in a relatively short
period of time. On the other hand, estimated export losses incurred by storms are
smaller but more persistent than those by floods. These findings suggest that floods
and storms have different implications on trade in Southeast Asia. In addition, this
may also suggest that each disaster type should be examined individually when
evaluating their impacts.
Furthermore, our study suggests that floods and storms have a significant im-
pact on exports across industrial sectors. We find that extreme weather events
negatively affect agricultural and manufacturing products. Climatic impacts on
agriculture is in line with the findings presented in the existing literature (for ex-
ample, Dell et al. 2012; Jones and Olken 2010). In addition, we also find extreme
weather effects on manufacturing, which have not been largely emphasized in pre-
vious studies. This result also offers support to the findings of studies examining
the effect of weather shocks on firm-level labor productivity (Cachon et al. 2012;
Li et al. 2016).
21
The results of our study suggest international trade as a channel through which
climate may affect aggregate economic outputs. A better understanding of the
channels and mechanisms of the relationship between climate and economy is im-
portant to achieve economic development while facing the risks of climate change.
For developing countries, particularly those where exports play a crucial role in
boosting economic growth, disaster shocks can be a great concern that needs im-
mediate policy responses. Such issues are also related to developed countries,
whose firms are located in disaster-prone regions and who trade various products
through a global supply chain. Therefore, this study highlights the need for busi-
ness entities and policymakers to pay more attention to the risks associated with
extreme weather events in the context of international trade.
22
References
Anttila-Hughes JK, Hsiang SM (2013) Destruction, disinvestment, and death: Eco-
nomic and human losses following environmental disaster
ASEAN (2016) ASEAN Economic Community Chartbook 2016. The Association
of Southeast Asian Nations (ASEAN) Secretariat, Jakarta
Barrios S, Bertinelli L, Strobl E (2006) Climatic change and rural–urban migration:
The case of sub-Saharan Africa. Journal of Urban Economics 60(3):357–371
Bowen T (2015) Social protection and disaster risk management in the Philip-
pines : The case of Typhoon Yolanda (Haiyan). Policy Research Working Paper;
No 7482, world Bank, Washington, DC, https://openknowledge.worldbank.org/
handle/10986/23448 License: CC BY 3.0 IGO
Cachon GP, Gallino S, Olivares M (2012) Severe weather and automobile assembly
productivity. Columbia Business School Research Paper No 12/37, available at
SSRN: https://ssrn.com/abstract=2099798 or http://dx.doi.org/10.2139/ssrn.
2099798
Chen S, Chen X, Xu J (2016) Impacts of climate change on agriculture: Evidence
from China. Journal of Environmental Economics and Management 76:105–124
CRED, Guha-Sapir D (2017) EM-DAT: The Emergency Events Database, univer-
sité catholique de Louvain (UCL), www.emdat.be, Brussels, Belgium
CRED, UNISDR (2015) The human cost of weather-related disasters 1995-2015,
Centre for Research on the Epidemiology of Disasters (CRED) and The United
Nations Office for Disaster Risk Reduction (UNISDR)
23
Dell M, Jones BF, Olken BA (2012) Temperature shocks and economic growth:
Evidence from the last half century. American Economic Journal: Macroeco-
nomics 4(3):66–95
Dell M, Jones BF, Olken BA (2014) What do we learn from the weather? The
new climate–economy literature. Journal of Economic Literature 52(3):740–798
Di Falco S, Yesuf M, Kohlin G, Ringler C (2012) Estimating the impact of climate
change on agriculture in low-income countries: Household level evidence from
the Nile Basin, Ethiopia. Environmental and Resource Economics 52(4):457–478
El Hadri H, Mirza D, Rabaud I (2017) Natural disasters and countries’ exports:
New insights from a new (and an old) database. LEO Working Papers / DR
LEO 2503, Orleans Economics Laboratory / Laboratoire d’Economie d’Orleans
(LEO), University of Orleans
FAO (2015) Typhoon Haiyan - Portraits of resilience, Food and Agriculture Or-
ganization of the United Nations (FAO)
Gassebner M, Keck A, Teh R (2010) Shaken, not stirred: The impact of disasters
on international trade. Review of International Economics 18(2):351–368
Guha-Sapir D, Hoyois P, Wallemacq P, Below R (2016) Annual disaster statistical
review 2016: The numbers and trends, brussels, CRED
Heal G, Park J (2016) Temperature stress and the direct impact of climate change:
A review of an emerging literature. Review of Environmental Economics and
Policy 10(2):347–362
24
Hsiang SM (2010) Temperatures and cyclones strongly associated with economic
production in the caribbean and central america. Proceedings of the National
Academy of Sciences 107(35):15367–15372
Hsiang SM, Narita D (2012) Adaptation to cyclone risk: Evidence from the global
cross-section. Climate Change Economics 03(02):1250011
IPCC (2014) Climate change 2014: Impacts, adaptation, and vulnerability. Part
A: Global and sectoral aspects. In: Field C, Barros V, Dokken D, Mach K,
Mastrandrea M, Bilir T, Chatterjee M, Ebi K, Estrada Y, Genova R, Girma B,
Kissel E, Levy A, MacCracken S, Mastrandrea P, White L (eds) Contribution
of Working Group II to the Fifth Assessment Report of the Intergovernmen-
tal Panel on Climate Change, Cambridge University Press, Cambridge, United
Kingdom and New York, NY, USA
Jones BF, Olken BA (2010) Climate shocks and exports. The American Economic
Review 100(2):454–459
Kirch L, Luther S, Mucke P, Prütz R, Radtke K, Schrader C (2017) World Risk
Report 2017. Bündnis Entwicklung Hilft, Berlin
Leiter AM, Oberhofer H, Raschky PA (2009) Creative disasters? Flooding effects
on capital, labour and productivity within European firms. Environmental and
Resource Economics 43(3):333–350
Li C, Cong J, Gu H, Xiang X (2016) Extreme heat and exports: Evidence from
chinese exporters, available at SSRN: https://ssrn.com/abstract=2864893
25
Loayza NV, Olaberría E, Rigolini J, Christiaensen L (2012) Natural disasters and
growth: Going beyond the averages. World Development 40(7):1317–1336
Marchiori L, Maystadt JF, Schumacher I (2012) The impact of weather anomalies
on migration in sub-Saharan Africa. Journal of Environmental Economics and
Management 63(3):355–374
McDermott GR, Nilsen ØA (2014) Electricity prices, river temperatures, and cool-
ing water scarcity. Land Economics 90(1):131–148
Mendelsohn R, Emanuel K, Chonabayashi S (2011) The impact of climate change
on hurricane damages in the United States. World Bank Policy Research working
paper; no WPS 5561, license: CC BY 3.0 IGO
Miguel E, Satyanath S, Sergenti E (2004) Economic shocks and civil conflict: An
instrumental variables approach. Journal of Political Economy 112(4):725–753
Oh CH, Reuveny R (2010) Climatic natural disasters, political risk, and interna-
tional trade. Global Environmental Change 20(2):243–254
Oizumi K (2012) Thai no kozui wo dou toraeruka–sapuraichen no shizen-
saigairisuku wo ikani keigen suruka (How do we understand the flood in
Thailand–How do we reduce the natural disaster risk in the supply chain). Re-
search for International Management 12(44):24–48
World Bank (2012) Thai flood 2011: rapid assessment for resilient recovery and
reconstruction planning: Overview (English). World Bank, Washington, DC,
http://documents.worldbank.org/curated/en/677841468335414861/Overview
World Bank (2013) Philippine Economic Update, World Bank
26
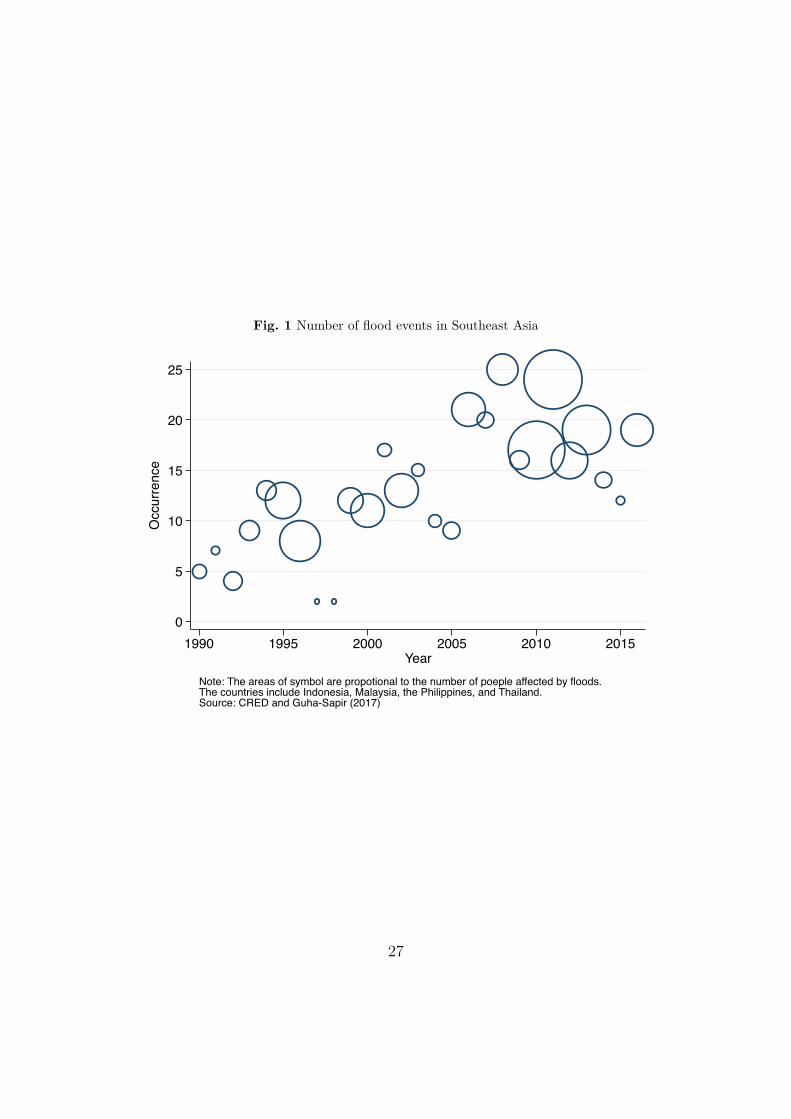
Fig. 1 Number of flood events in Southeast Asia
0
5
10
15
20
25
Occ
urre
nce
1990 1995 2000 2005 2010 2015Year
Note: The areas of symbol are propotional to the number of poeple affected by floods.The countries include Indonesia, Malaysia, the Philippines, and Thailand.Source: CRED and Guha-Sapir (2017)
27
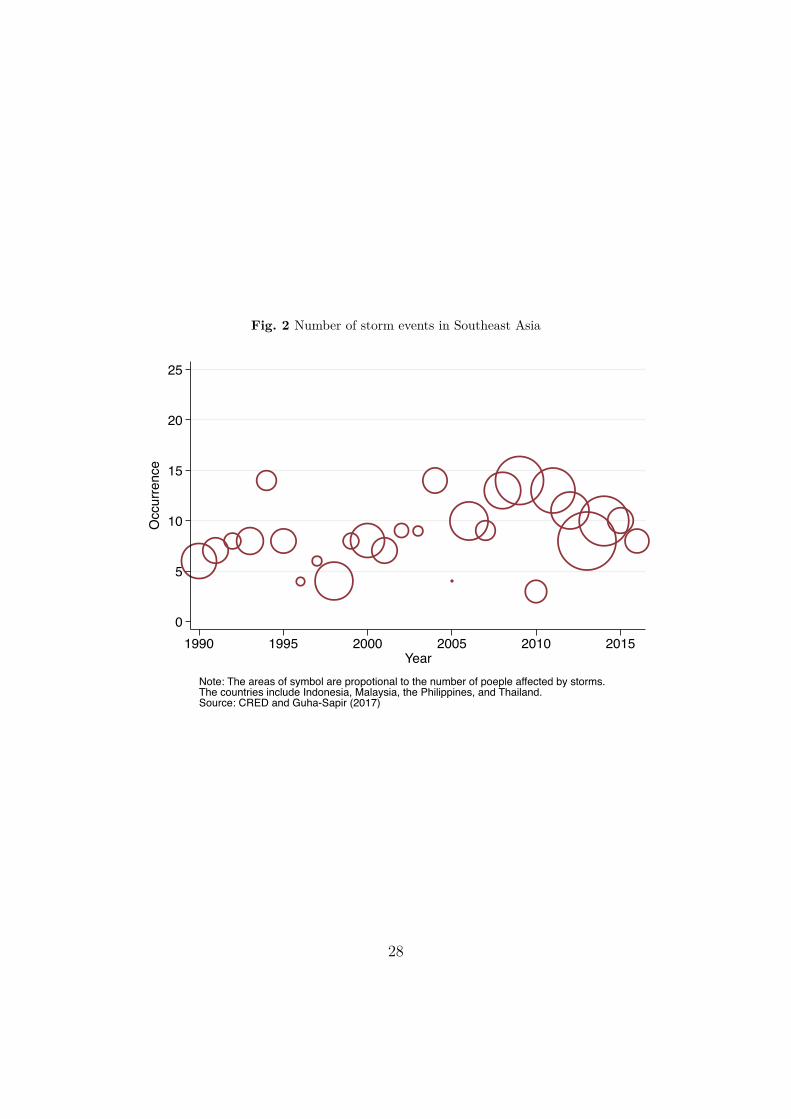
Fig. 2 Number of storm events in Southeast Asia
0
5
10
15
20
25
Occ
urre
nce
1990 1995 2000 2005 2010 2015Year
Note: The areas of symbol are propotional to the number of poeple affected by storms.The countries include Indonesia, Malaysia, the Philippines, and Thailand.Source: CRED and Guha-Sapir (2017)
28
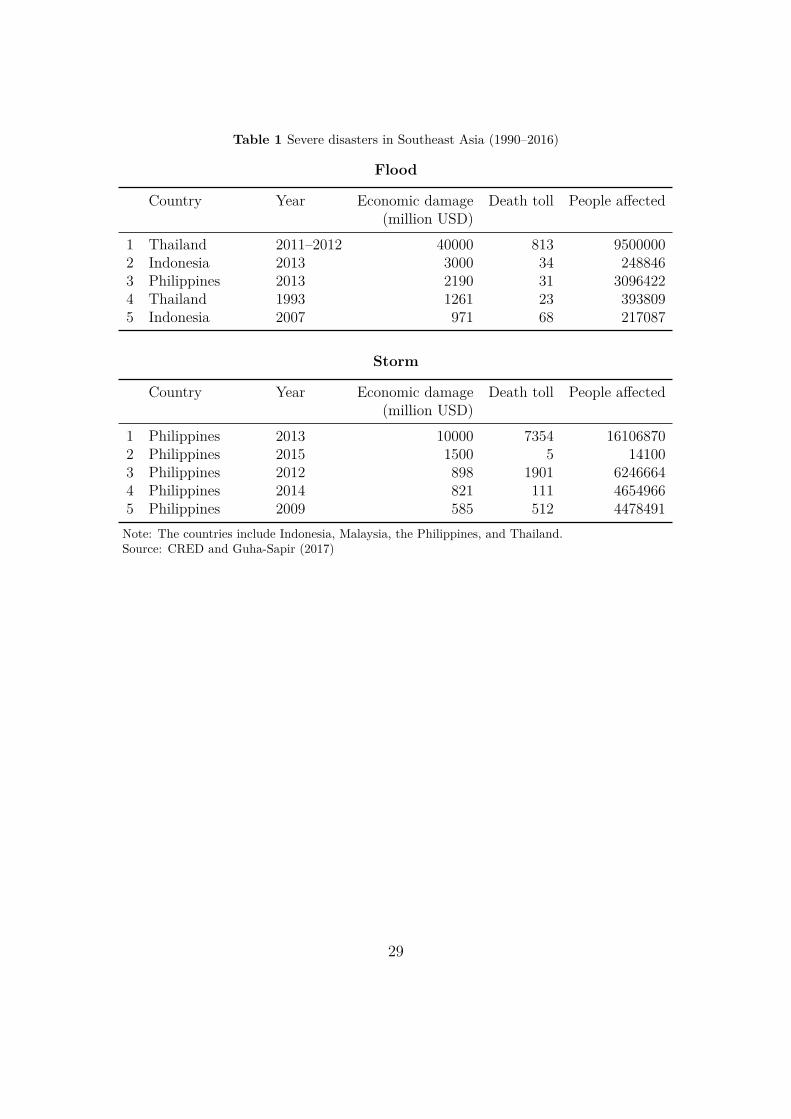
Table 1 Severe disasters in Southeast Asia (1990–2016)
Flood
Country Year Economic damage Death toll People affected(million USD)
1 Thailand 2011–2012 40000 813 95000002 Indonesia 2013 3000 34 2488463 Philippines 2013 2190 31 30964224 Thailand 1993 1261 23 3938095 Indonesia 2007 971 68 217087
Storm
Country Year Economic damage Death toll People affected(million USD)
1 Philippines 2013 10000 7354 161068702 Philippines 2015 1500 5 141003 Philippines 2012 898 1901 62466644 Philippines 2014 821 111 46549665 Philippines 2009 585 512 4478491
Note: The countries include Indonesia, Malaysia, the Philippines, and Thailand.Source: CRED and Guha-Sapir (2017)
29
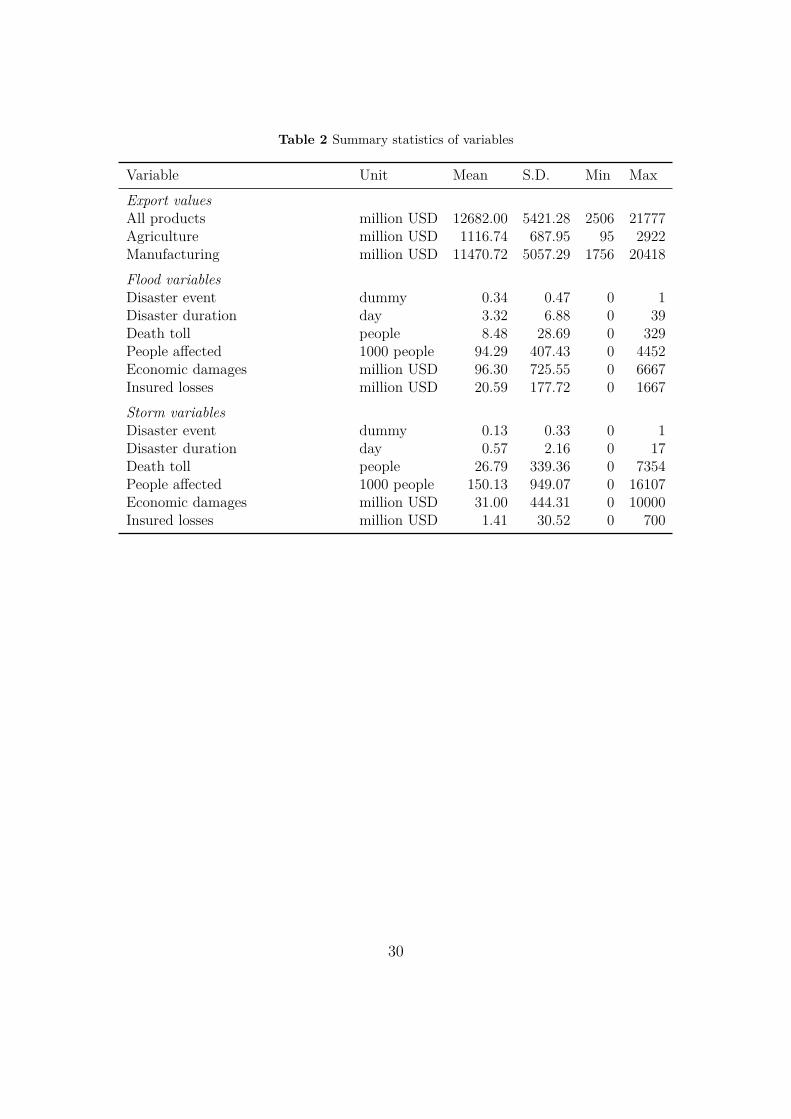
Table 2 Summary statistics of variables
Variable Unit Mean S.D. Min Max
Export valuesAll products million USD 12682.00 5421.28 2506 21777Agriculture million USD 1116.74 687.95 95 2922Manufacturing million USD 11470.72 5057.29 1756 20418Flood variablesDisaster event dummy 0.34 0.47 0 1Disaster duration day 3.32 6.88 0 39Death toll people 8.48 28.69 0 329People affected 1000 people 94.29 407.43 0 4452Economic damages million USD 96.30 725.55 0 6667Insured losses million USD 20.59 177.72 0 1667Storm variablesDisaster event dummy 0.13 0.33 0 1Disaster duration day 0.57 2.16 0 17Death toll people 26.79 339.36 0 7354People affected 1000 people 150.13 949.07 0 16107Economic damages million USD 31.00 444.31 0 10000Insured losses million USD 1.41 30.52 0 700
30
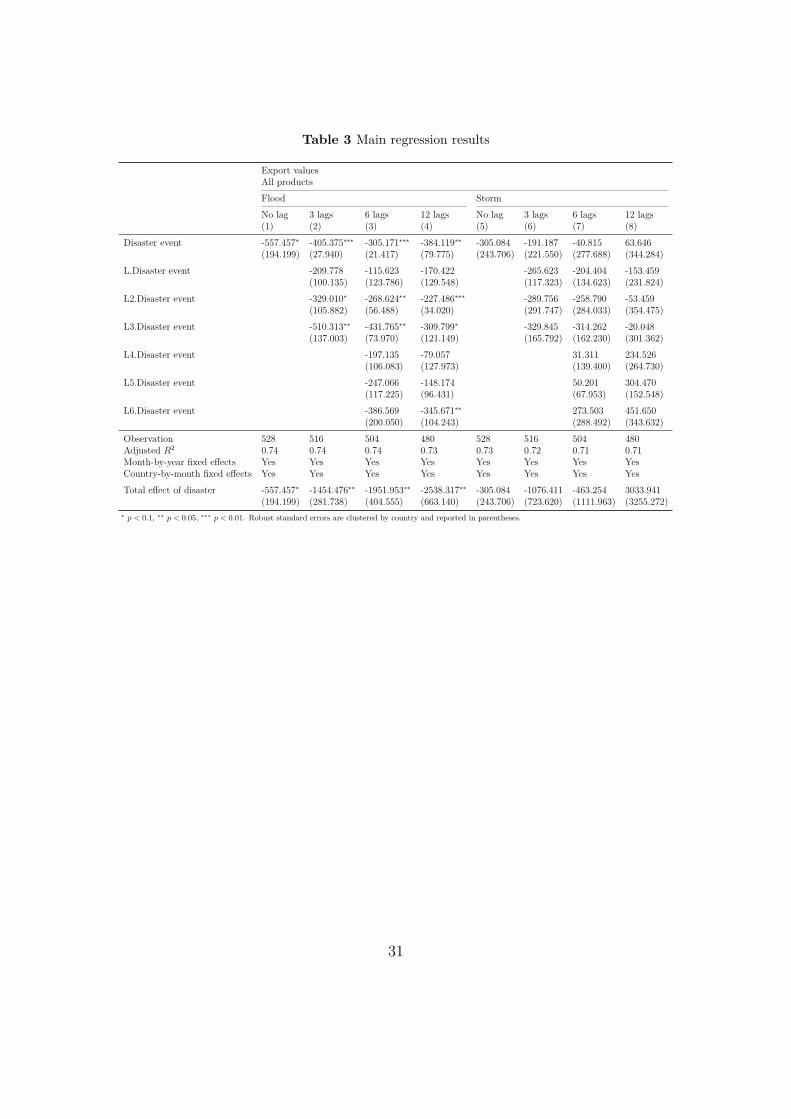
Table 3 Main regression results
Export valuesAll productsFlood StormNo lag 3 lags 6 lags 12 lags No lag 3 lags 6 lags 12 lags(1) (2) (3) (4) (5) (6) (7) (8)
Disaster event -557.457∗ -405.375∗∗∗ -305.171∗∗∗ -384.119∗∗ -305.084 -191.187 -40.815 63.646(194.199) (27.940) (21.417) (79.775) (243.706) (221.550) (277.688) (344.284)
L.Disaster event -209.778 -115.623 -170.422 -265.623 -204.404 -153.459(100.135) (123.786) (129.548) (117.323) (134.623) (231.824)
L2.Disaster event -329.010∗ -268.624∗∗ -227.486∗∗∗ -289.756 -258.790 -53.459(105.882) (56.488) (34.020) (291.747) (284.033) (354.475)
L3.Disaster event -510.313∗∗ -431.765∗∗ -309.799∗ -329.845 -314.262 -20.048(137.003) (73.970) (121.149) (165.792) (162.230) (301.362)
L4.Disaster event -197.135 -79.057 31.311 234.526(106.083) (127.973) (139.400) (264.730)
L5.Disaster event -247.066 -148.174 50.201 304.470(117.225) (96.431) (67.953) (152.548)
L6.Disaster event -386.569 -345.671∗∗ 273.503 451.650(200.050) (104.243) (288.492) (343.632)
Observation 528 516 504 480 528 516 504 480Adjusted R2 0.74 0.74 0.74 0.73 0.73 0.72 0.71 0.71Month-by-year fixed effects Yes Yes Yes Yes Yes Yes Yes YesCountry-by-month fixed effects Yes Yes Yes Yes Yes Yes Yes YesTotal effect of disaster -557.457∗ -1454.476∗∗ -1951.953∗∗ -2538.317∗∗ -305.084 -1076.411 -463.254 3033.941
(194.199) (281.738) (404.555) (663.140) (243.706) (723.620) (1111.963) (3255.272)∗ p < 0.1, ∗∗ p < 0.05, ∗∗∗ p < 0.01. Robust standard errors are clustered by country and reported in parentheses.
31
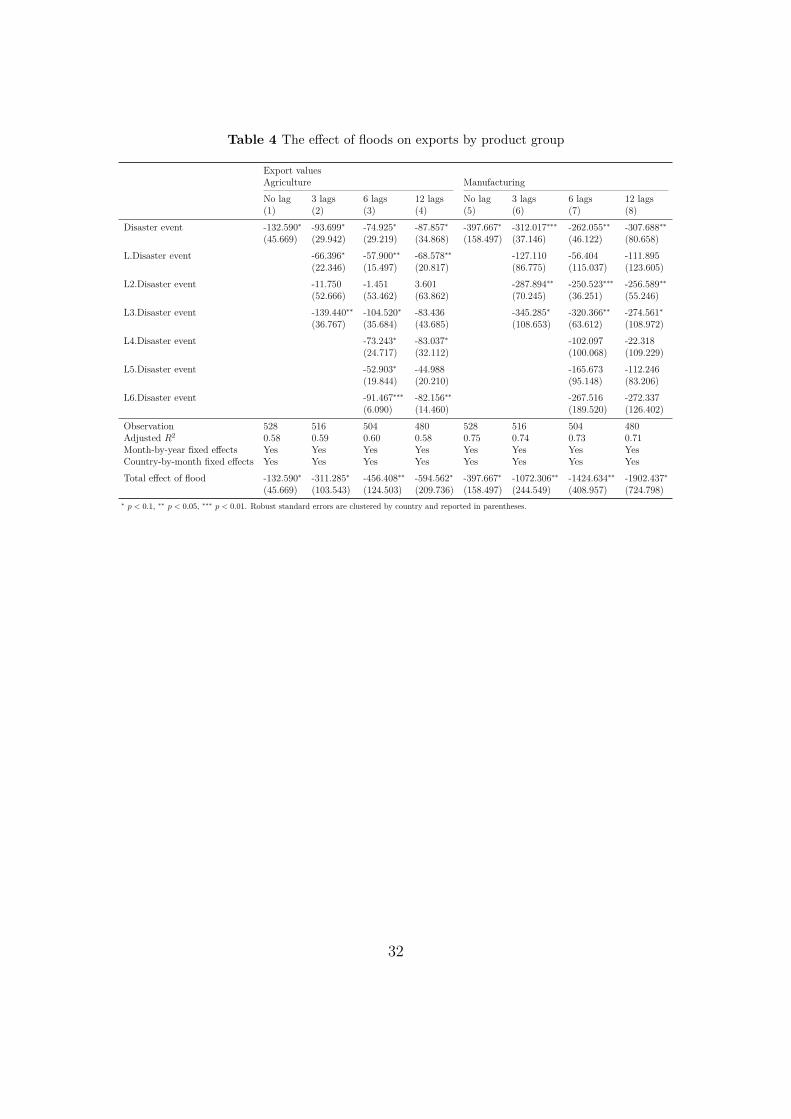
Table 4 The effect of floods on exports by product group
Export valuesAgriculture ManufacturingNo lag 3 lags 6 lags 12 lags No lag 3 lags 6 lags 12 lags(1) (2) (3) (4) (5) (6) (7) (8)
Disaster event -132.590∗ -93.699∗ -74.925∗ -87.857∗ -397.667∗ -312.017∗∗∗ -262.055∗∗ -307.688∗∗
(45.669) (29.942) (29.219) (34.868) (158.497) (37.146) (46.122) (80.658)L.Disaster event -66.396∗ -57.900∗∗ -68.578∗∗ -127.110 -56.404 -111.895
(22.346) (15.497) (20.817) (86.775) (115.037) (123.605)L2.Disaster event -11.750 -1.451 3.601 -287.894∗∗ -250.523∗∗∗ -256.589∗∗
(52.666) (53.462) (63.862) (70.245) (36.251) (55.246)L3.Disaster event -139.440∗∗ -104.520∗ -83.436 -345.285∗ -320.366∗∗ -274.561∗
(36.767) (35.684) (43.685) (108.653) (63.612) (108.972)L4.Disaster event -73.243∗ -83.037∗ -102.097 -22.318
(24.717) (32.112) (100.068) (109.229)L5.Disaster event -52.903∗ -44.988 -165.673 -112.246
(19.844) (20.210) (95.148) (83.206)L6.Disaster event -91.467∗∗∗ -82.156∗∗ -267.516 -272.337
(6.090) (14.460) (189.520) (126.402)
Observation 528 516 504 480 528 516 504 480Adjusted R2 0.58 0.59 0.60 0.58 0.75 0.74 0.73 0.71Month-by-year fixed effects Yes Yes Yes Yes Yes Yes Yes YesCountry-by-month fixed effects Yes Yes Yes Yes Yes Yes Yes YesTotal effect of flood -132.590∗ -311.285∗ -456.408∗∗ -594.562∗ -397.667∗ -1072.306∗∗ -1424.634∗∗ -1902.437∗
(45.669) (103.543) (124.503) (209.736) (158.497) (244.549) (408.957) (724.798)∗ p < 0.1, ∗∗ p < 0.05, ∗∗∗ p < 0.01. Robust standard errors are clustered by country and reported in parentheses.
32

Table 5 The effect of storms on exports by product group
Export valuesAgriculture ManufacturingNo lag 3 lags 6 lags 12 lags No lag 3 lags 6 lags 12 lags(1) (2) (3) (4) (5) (6) (7) (8)
Disaster event -65.822∗∗ -56.719∗∗ -22.375 2.055 -245.341 -153.623 -83.752 25.030(11.685) (10.905) (14.997) (14.503) (231.567) (223.914) (265.555) (323.562)
L.Disaster event -60.193 -44.553 -17.956 -241.056 -221.483 -195.409(29.445) (35.135) (39.920) (119.259) (132.473) (216.165)
L2.Disaster event 28.419 35.940 90.321 -349.256 -334.170 -220.404(99.055) (99.217) (113.357) (199.712) (195.151) (251.423)
L3.Disaster event -43.349∗ -45.646 5.759 -318.764 -309.450 -132.371(17.300) (19.505) (23.485) (148.680) (143.256) (261.776)
L4.Disaster event -51.776 0.152 28.763 119.240(56.461) (58.097) (78.753) (178.900)
L5.Disaster event 33.074 71.464 -15.785 114.679(39.573) (44.057) (63.942) (119.415)
L6.Disaster event 112.282 138.476∗ 148.327 249.578(51.428) (50.917) (264.044) (316.389)
Observation 528 516 504 480 528 516 504 480Adjusted R2 0.57 0.55 0.54 0.54 0.74 0.73 0.71 0.69Month-by-year fixed effects Yes Yes Yes Yes Yes Yes Yes YesCountry-by-month fixed effects Yes Yes Yes Yes Yes Yes Yes YesTotal effect of storm -65.822∗∗ -131.843 16.946 821.381 -245.341 -1062.699 -787.549 1601.853
(11.685) (108.268) (155.716) (371.173) (231.567) (619.940) (971.417) (2811.712)∗ p < 0.1, ∗∗ p < 0.05, ∗∗∗ p < 0.01. Robust standard errors are clustered by country and reported in parentheses.
33
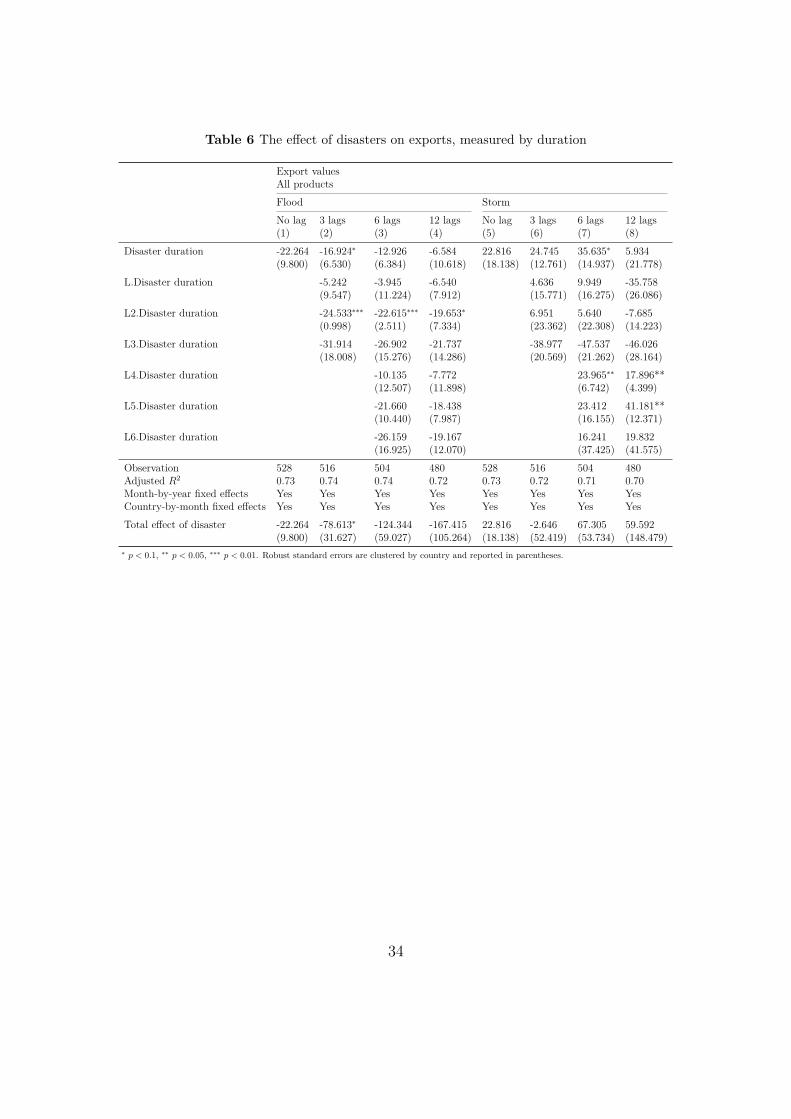
Table 6 The effect of disasters on exports, measured by duration
Export valuesAll productsFlood StormNo lag 3 lags 6 lags 12 lags No lag 3 lags 6 lags 12 lags(1) (2) (3) (4) (5) (6) (7) (8)
Disaster duration -22.264 -16.924∗ -12.926 -6.584 22.816 24.745 35.635∗ 5.934(9.800) (6.530) (6.384) (10.618) (18.138) (12.761) (14.937) (21.778)
L.Disaster duration -5.242 -3.945 -6.540 4.636 9.949 -35.758(9.547) (11.224) (7.912) (15.771) (16.275) (26.086)
L2.Disaster duration -24.533∗∗∗ -22.615∗∗∗ -19.653∗ 6.951 5.640 -7.685(0.998) (2.511) (7.334) (23.362) (22.308) (14.223)
L3.Disaster duration -31.914 -26.902 -21.737 -38.977 -47.537 -46.026(18.008) (15.276) (14.286) (20.569) (21.262) (28.164)
L4.Disaster duration -10.135 -7.772 23.965∗∗ 17.896**(12.507) (11.898) (6.742) (4.399)
L5.Disaster duration -21.660 -18.438 23.412 41.181**(10.440) (7.987) (16.155) (12.371)
L6.Disaster duration -26.159 -19.167 16.241 19.832(16.925) (12.070) (37.425) (41.575)
Observation 528 516 504 480 528 516 504 480Adjusted R2 0.73 0.74 0.74 0.72 0.73 0.72 0.71 0.70Month-by-year fixed effects Yes Yes Yes Yes Yes Yes Yes YesCountry-by-month fixed effects Yes Yes Yes Yes Yes Yes Yes YesTotal effect of disaster -22.264 -78.613∗ -124.344 -167.415 22.816 -2.646 67.305 59.592
(9.800) (31.627) (59.027) (105.264) (18.138) (52.419) (53.734) (148.479)∗ p < 0.1, ∗∗ p < 0.05, ∗∗∗ p < 0.01. Robust standard errors are clustered by country and reported in parentheses.
34

Table 7 The effect of disasters on exports, measured by death toll
Export valuesAll productsFlood StormNo lag 3 lags 6 lags 12 lags No lag 3 lags 6 lags 12 lags(1) (2) (3) (4) (5) (6) (7) (8)
Death toll -5.852 -4.076 -3.623 -2.606 -0.380∗∗ -0.400∗∗ -0.401∗∗ -0.328**(2.563) (2.800) (2.977) (3.118) (0.074) (0.081) (0.083) (0.082)
L.Death toll -1.206 -0.857 -1.946 -0.363∗ -0.367∗ -0.330*(1.375) (1.346) (1.834) (0.126) (0.128) (0.135)
L2.Death toll -3.338∗∗ -3.264∗∗ -2.941 -0.393∗∗ -0.398∗∗ -0.391**(0.582) (0.702) (1.294) (0.083) (0.085) (0.089)
L3.Death toll -5.038 -4.121∗∗ -3.929∗∗ -0.350∗∗ -0.364∗∗ -0.358**(2.733) (0.972) (1.219) (0.063) (0.065) (0.069)
L4.Death toll 0.345 0.375 -0.216∗∗∗ -0.217***(3.520) (4.203) (0.024) (0.026)
L5.Death toll -2.148 -1.653 -0.301∗ -0.304*(2.010) (1.063) (0.096) (0.102)
L6.Death toll -0.118 -0.062 -0.186 -0.196(3.445) (1.581) (0.110) (0.116)
Observation 528 516 504 480 528 516 504 480Adjusted R2 0.73 0.73 0.72 0.70 0.73 0.73 0.73 0.71Month-by-year fixed effects Yes Yes Yes Yes Yes Yes Yes YesCountry-by-month fixed effects Yes Yes Yes Yes Yes Yes Yes YesTotal effect of disaster -5.852 -13.657 -13.786 -5.920 -0.380∗∗ -1.507∗∗ -2.233∗∗ -2.919∗∗
(2.563) (5.899) (11.285) (15.553) (0.074) (0.338) (0.505) (0.785)∗ p < 0.1, ∗∗ p < 0.05, ∗∗∗ p < 0.01. Robust standard errors are clustered by country and reported in parentheses.
35
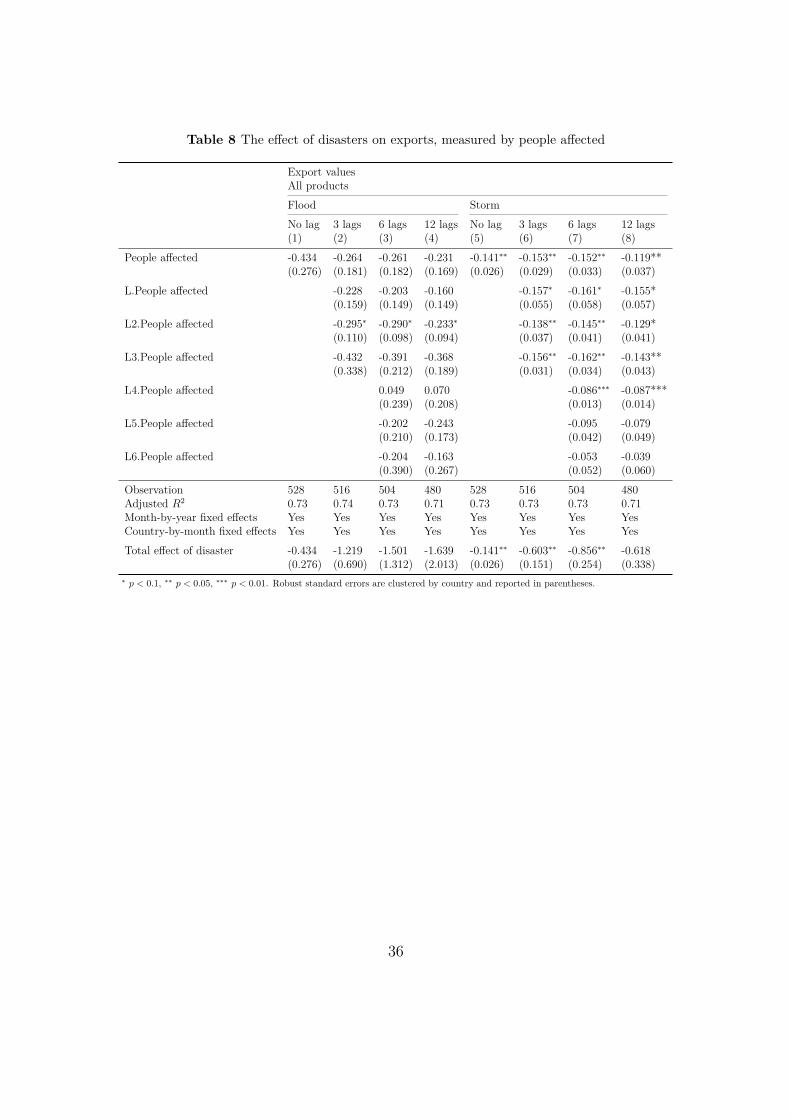
Table 8 The effect of disasters on exports, measured by people affected
Export valuesAll productsFlood StormNo lag 3 lags 6 lags 12 lags No lag 3 lags 6 lags 12 lags(1) (2) (3) (4) (5) (6) (7) (8)
People affected -0.434 -0.264 -0.261 -0.231 -0.141∗∗ -0.153∗∗ -0.152∗∗ -0.119**(0.276) (0.181) (0.182) (0.169) (0.026) (0.029) (0.033) (0.037)
L.People affected -0.228 -0.203 -0.160 -0.157∗ -0.161∗ -0.155*(0.159) (0.149) (0.149) (0.055) (0.058) (0.057)
L2.People affected -0.295∗ -0.290∗ -0.233∗ -0.138∗∗ -0.145∗∗ -0.129*(0.110) (0.098) (0.094) (0.037) (0.041) (0.041)
L3.People affected -0.432 -0.391 -0.368 -0.156∗∗ -0.162∗∗ -0.143**(0.338) (0.212) (0.189) (0.031) (0.034) (0.043)
L4.People affected 0.049 0.070 -0.086∗∗∗ -0.087***(0.239) (0.208) (0.013) (0.014)
L5.People affected -0.202 -0.243 -0.095 -0.079(0.210) (0.173) (0.042) (0.049)
L6.People affected -0.204 -0.163 -0.053 -0.039(0.390) (0.267) (0.052) (0.060)
Observation 528 516 504 480 528 516 504 480Adjusted R2 0.73 0.74 0.73 0.71 0.73 0.73 0.73 0.71Month-by-year fixed effects Yes Yes Yes Yes Yes Yes Yes YesCountry-by-month fixed effects Yes Yes Yes Yes Yes Yes Yes YesTotal effect of disaster -0.434 -1.219 -1.501 -1.639 -0.141∗∗ -0.603∗∗ -0.856∗∗ -0.618
(0.276) (0.690) (1.312) (2.013) (0.026) (0.151) (0.254) (0.338)∗ p < 0.1, ∗∗ p < 0.05, ∗∗∗ p < 0.01. Robust standard errors are clustered by country and reported in parentheses.
36
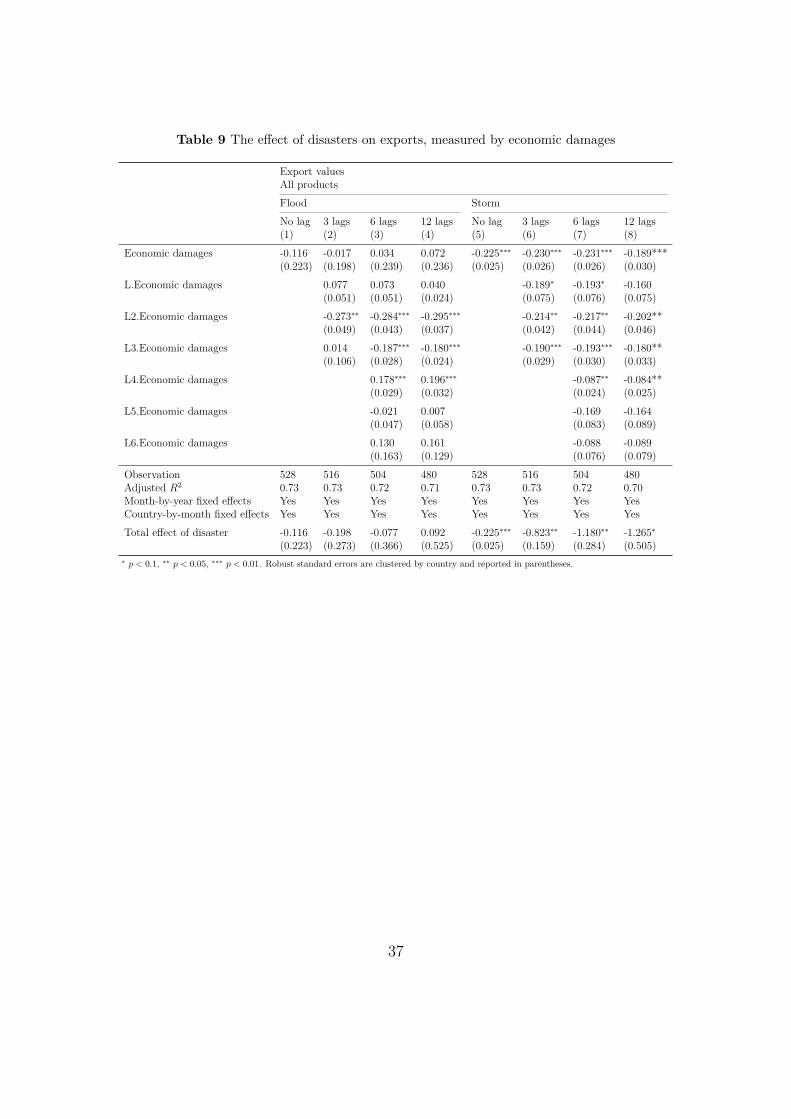
Table 9 The effect of disasters on exports, measured by economic damages
Export valuesAll productsFlood StormNo lag 3 lags 6 lags 12 lags No lag 3 lags 6 lags 12 lags(1) (2) (3) (4) (5) (6) (7) (8)
Economic damages -0.116 -0.017 0.034 0.072 -0.225∗∗∗ -0.230∗∗∗ -0.231∗∗∗ -0.189***(0.223) (0.198) (0.239) (0.236) (0.025) (0.026) (0.026) (0.030)
L.Economic damages 0.077 0.073 0.040 -0.189∗ -0.193∗ -0.160(0.051) (0.051) (0.024) (0.075) (0.076) (0.075)
L2.Economic damages -0.273∗∗ -0.284∗∗∗ -0.295∗∗∗ -0.214∗∗ -0.217∗∗ -0.202**(0.049) (0.043) (0.037) (0.042) (0.044) (0.046)
L3.Economic damages 0.014 -0.187∗∗∗ -0.180∗∗∗ -0.190∗∗∗ -0.193∗∗∗ -0.180**(0.106) (0.028) (0.024) (0.029) (0.030) (0.033)
L4.Economic damages 0.178∗∗∗ 0.196∗∗∗ -0.087∗∗ -0.084**(0.029) (0.032) (0.024) (0.025)
L5.Economic damages -0.021 0.007 -0.169 -0.164(0.047) (0.058) (0.083) (0.089)
L6.Economic damages 0.130 0.161 -0.088 -0.089(0.163) (0.129) (0.076) (0.079)
Observation 528 516 504 480 528 516 504 480Adjusted R2 0.73 0.73 0.72 0.71 0.73 0.73 0.72 0.70Month-by-year fixed effects Yes Yes Yes Yes Yes Yes Yes YesCountry-by-month fixed effects Yes Yes Yes Yes Yes Yes Yes YesTotal effect of disaster -0.116 -0.198 -0.077 0.092 -0.225∗∗∗ -0.823∗∗ -1.180∗∗ -1.265∗
(0.223) (0.273) (0.366) (0.525) (0.025) (0.159) (0.284) (0.505)∗ p < 0.1, ∗∗ p < 0.05, ∗∗∗ p < 0.01. Robust standard errors are clustered by country and reported in parentheses.
37
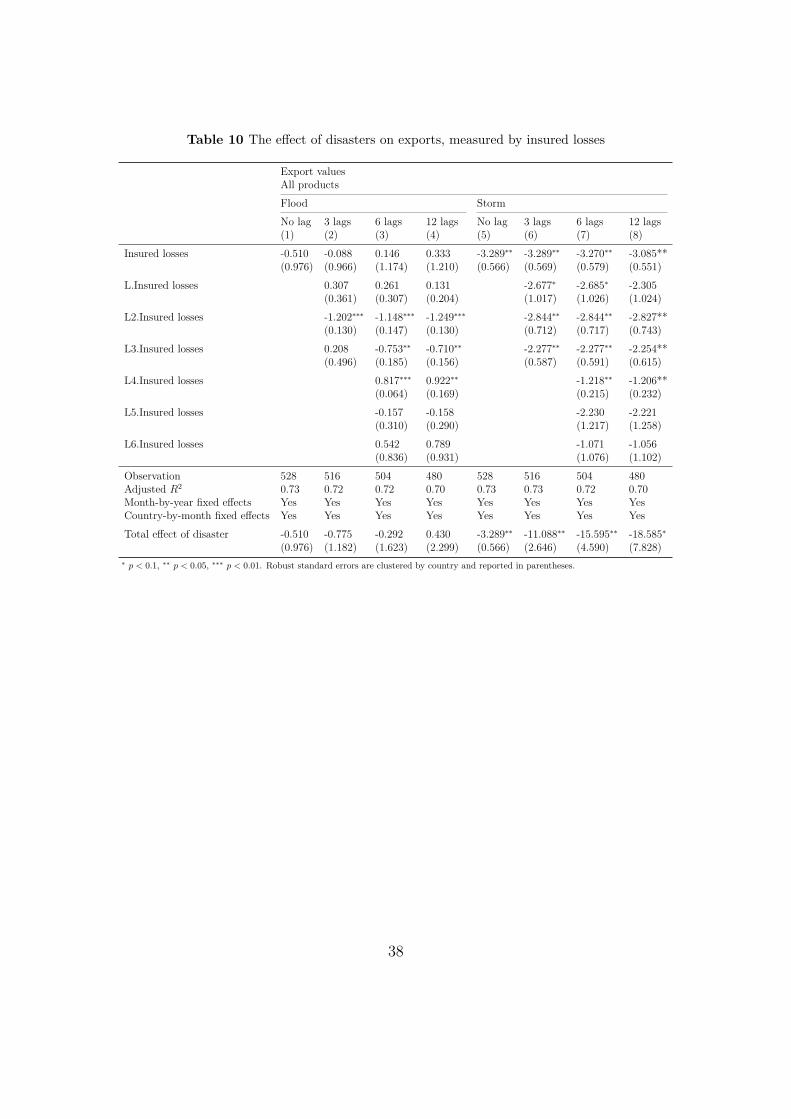
Table 10 The effect of disasters on exports, measured by insured losses
Export valuesAll productsFlood StormNo lag 3 lags 6 lags 12 lags No lag 3 lags 6 lags 12 lags(1) (2) (3) (4) (5) (6) (7) (8)
Insured losses -0.510 -0.088 0.146 0.333 -3.289∗∗ -3.289∗∗ -3.270∗∗ -3.085**(0.976) (0.966) (1.174) (1.210) (0.566) (0.569) (0.579) (0.551)
L.Insured losses 0.307 0.261 0.131 -2.677∗ -2.685∗ -2.305(0.361) (0.307) (0.204) (1.017) (1.026) (1.024)
L2.Insured losses -1.202∗∗∗ -1.148∗∗∗ -1.249∗∗∗ -2.844∗∗ -2.844∗∗ -2.827**(0.130) (0.147) (0.130) (0.712) (0.717) (0.743)
L3.Insured losses 0.208 -0.753∗∗ -0.710∗∗ -2.277∗∗ -2.277∗∗ -2.254**(0.496) (0.185) (0.156) (0.587) (0.591) (0.615)
L4.Insured losses 0.817∗∗∗ 0.922∗∗ -1.218∗∗ -1.206**(0.064) (0.169) (0.215) (0.232)
L5.Insured losses -0.157 -0.158 -2.230 -2.221(0.310) (0.290) (1.217) (1.258)
L6.Insured losses 0.542 0.789 -1.071 -1.056(0.836) (0.931) (1.076) (1.102)
Observation 528 516 504 480 528 516 504 480Adjusted R2 0.73 0.72 0.72 0.70 0.73 0.73 0.72 0.70Month-by-year fixed effects Yes Yes Yes Yes Yes Yes Yes YesCountry-by-month fixed effects Yes Yes Yes Yes Yes Yes Yes YesTotal effect of disaster -0.510 -0.775 -0.292 0.430 -3.289∗∗ -11.088∗∗ -15.595∗∗ -18.585∗
(0.976) (1.182) (1.623) (2.299) (0.566) (2.646) (4.590) (7.828)∗ p < 0.1, ∗∗ p < 0.05, ∗∗∗ p < 0.01. Robust standard errors are clustered by country and reported in parentheses.
38
Appendix
Table A1 The effect of floods on exports, measured by duration: agricultural and manufacturingproducts
Export valuesAgriculture ManufacturingNo lag 3 lags 6 lags 12 lags No lag 3 lags 6 lags 12 lags(1) (2) (3) (4) (5) (6) (7) (8)
Disaster duration -5.228 -3.875 -2.931 -2.381 -11.991 -9.606 -7.725 -4.216(3.413) (2.522) (2.944) (3.549) (11.405) (8.267) (8.498) (11.168)
L.Disaster duration -1.976 -2.044 -2.006 -1.349 -0.257 -4.231(1.652) (1.632) (1.738) (8.215) (9.739) (7.639)
L2.Disaster duration -0.177 0.134 1.017 -20.998∗∗∗ -19.879∗∗ -21.074∗
(3.171) (3.522) (4.428) (3.247) (4.343) (7.356)L3.Disaster duration -7.281∗∗ -5.283∗ -4.172∗ -20.417 -18.885 -16.976
(1.863) (1.761) (1.689) (14.821) (12.628) (13.393)L4.Disaster duration -3.663 -3.752 -3.891 -2.563
(1.584) (1.977) (10.990) (11.522)L5.Disaster duration -4.379∗∗ -4.364∗∗∗ -14.259 -12.851
(0.763) (0.716) (6.795) (6.024)L6.Disaster duration -5.600 -3.187 -17.523 -14.554
(3.320) (4.017) (13.032) (9.497)
Observation 528 516 504 480 528 516 504 480Adjusted R2 0.57 0.57 0.57 0.55 0.74 0.74 0.72 0.70Month-by-year fixed effects Yes Yes Yes Yes Yes Yes Yes YesCountry-by-month fixed effects Yes Yes Yes Yes Yes Yes Yes YesTotal effect of flood -5.228 -13.309 -23.767 -30.126 -11.991 -52.370 -82.419 -118.343
(3.413) (7.693) (11.730) (18.162) (11.405) (27.968) (48.605) (90.775)∗ p < 0.1, ∗∗ p < 0.05, ∗∗∗ p < 0.01. Robust standard errors are clustered by country and reported in parentheses.
39
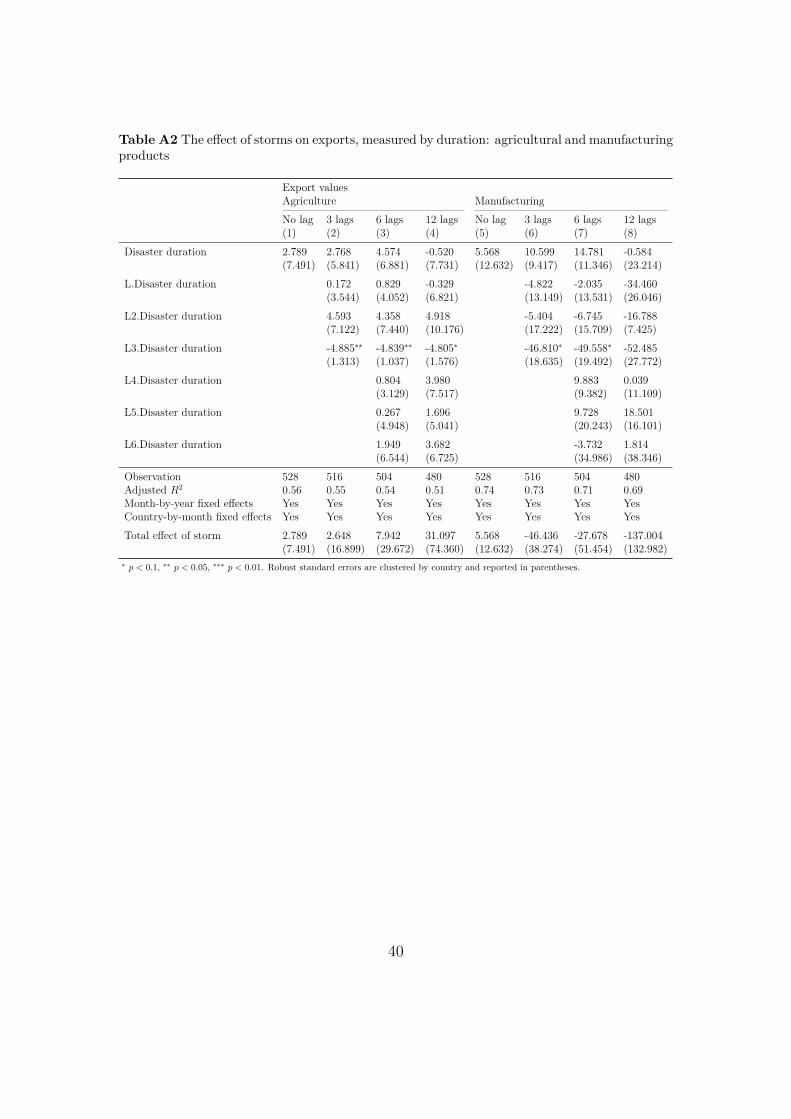
Table A2 The effect of storms on exports, measured by duration: agricultural and manufacturingproducts
Export valuesAgriculture ManufacturingNo lag 3 lags 6 lags 12 lags No lag 3 lags 6 lags 12 lags(1) (2) (3) (4) (5) (6) (7) (8)
Disaster duration 2.789 2.768 4.574 -0.520 5.568 10.599 14.781 -0.584(7.491) (5.841) (6.881) (7.731) (12.632) (9.417) (11.346) (23.214)
L.Disaster duration 0.172 0.829 -0.329 -4.822 -2.035 -34.460(3.544) (4.052) (6.821) (13.149) (13.531) (26.046)
L2.Disaster duration 4.593 4.358 4.918 -5.404 -6.745 -16.788(7.122) (7.440) (10.176) (17.222) (15.709) (7.425)
L3.Disaster duration -4.885∗∗ -4.839∗∗ -4.805∗ -46.810∗ -49.558∗ -52.485(1.313) (1.037) (1.576) (18.635) (19.492) (27.772)
L4.Disaster duration 0.804 3.980 9.883 0.039(3.129) (7.517) (9.382) (11.109)
L5.Disaster duration 0.267 1.696 9.728 18.501(4.948) (5.041) (20.243) (16.101)
L6.Disaster duration 1.949 3.682 -3.732 1.814(6.544) (6.725) (34.986) (38.346)
Observation 528 516 504 480 528 516 504 480Adjusted R2 0.56 0.55 0.54 0.51 0.74 0.73 0.71 0.69Month-by-year fixed effects Yes Yes Yes Yes Yes Yes Yes YesCountry-by-month fixed effects Yes Yes Yes Yes Yes Yes Yes YesTotal effect of storm 2.789 2.648 7.942 31.097 5.568 -46.436 -27.678 -137.004
(7.491) (16.899) (29.672) (74.360) (12.632) (38.274) (51.454) (132.982)∗ p < 0.1, ∗∗ p < 0.05, ∗∗∗ p < 0.01. Robust standard errors are clustered by country and reported in parentheses.
40
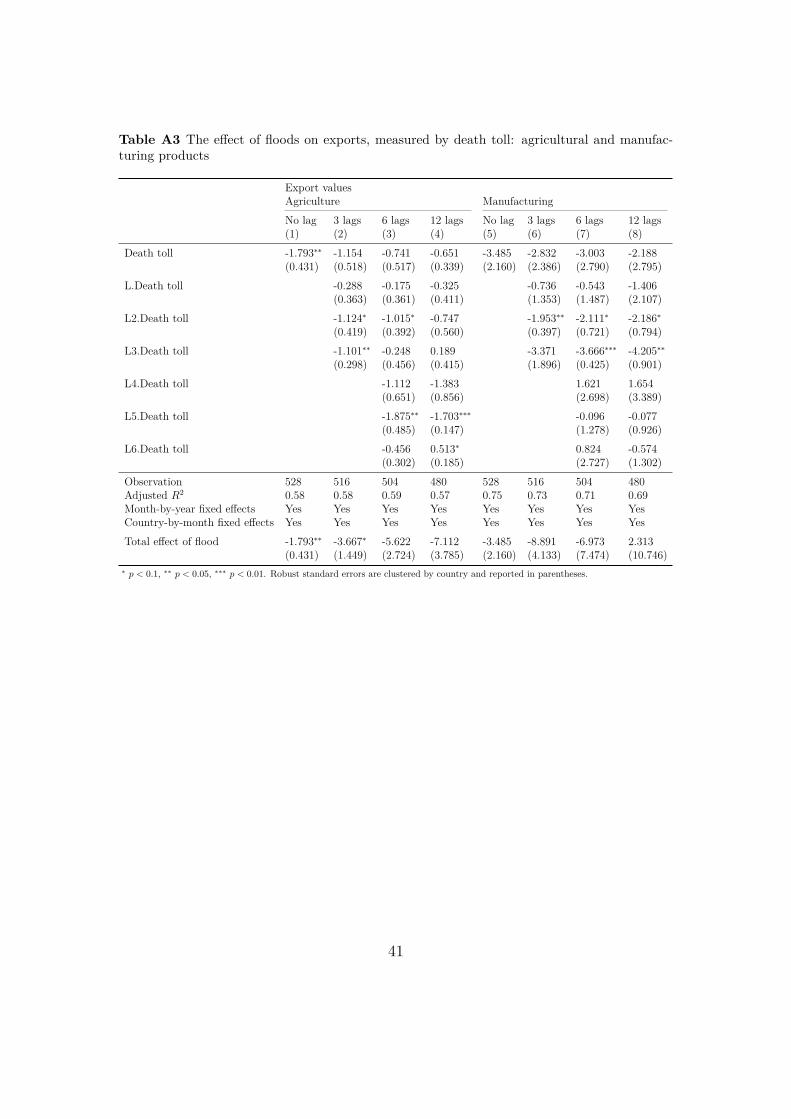
Table A3 The effect of floods on exports, measured by death toll: agricultural and manufac-turing products
Export valuesAgriculture ManufacturingNo lag 3 lags 6 lags 12 lags No lag 3 lags 6 lags 12 lags(1) (2) (3) (4) (5) (6) (7) (8)
Death toll -1.793∗∗ -1.154 -0.741 -0.651 -3.485 -2.832 -3.003 -2.188(0.431) (0.518) (0.517) (0.339) (2.160) (2.386) (2.790) (2.795)
L.Death toll -0.288 -0.175 -0.325 -0.736 -0.543 -1.406(0.363) (0.361) (0.411) (1.353) (1.487) (2.107)
L2.Death toll -1.124∗ -1.015∗ -0.747 -1.953∗∗ -2.111∗ -2.186∗
(0.419) (0.392) (0.560) (0.397) (0.721) (0.794)L3.Death toll -1.101∗∗ -0.248 0.189 -3.371 -3.666∗∗∗ -4.205∗∗
(0.298) (0.456) (0.415) (1.896) (0.425) (0.901)L4.Death toll -1.112 -1.383 1.621 1.654
(0.651) (0.856) (2.698) (3.389)L5.Death toll -1.875∗∗ -1.703∗∗∗ -0.096 -0.077
(0.485) (0.147) (1.278) (0.926)L6.Death toll -0.456 0.513∗ 0.824 -0.574
(0.302) (0.185) (2.727) (1.302)
Observation 528 516 504 480 528 516 504 480Adjusted R2 0.58 0.58 0.59 0.57 0.75 0.73 0.71 0.69Month-by-year fixed effects Yes Yes Yes Yes Yes Yes Yes YesCountry-by-month fixed effects Yes Yes Yes Yes Yes Yes Yes YesTotal effect of flood -1.793∗∗ -3.667∗ -5.622 -7.112 -3.485 -8.891 -6.973 2.313
(0.431) (1.449) (2.724) (3.785) (2.160) (4.133) (7.474) (10.746)∗ p < 0.1, ∗∗ p < 0.05, ∗∗∗ p < 0.01. Robust standard errors are clustered by country and reported in parentheses.
41
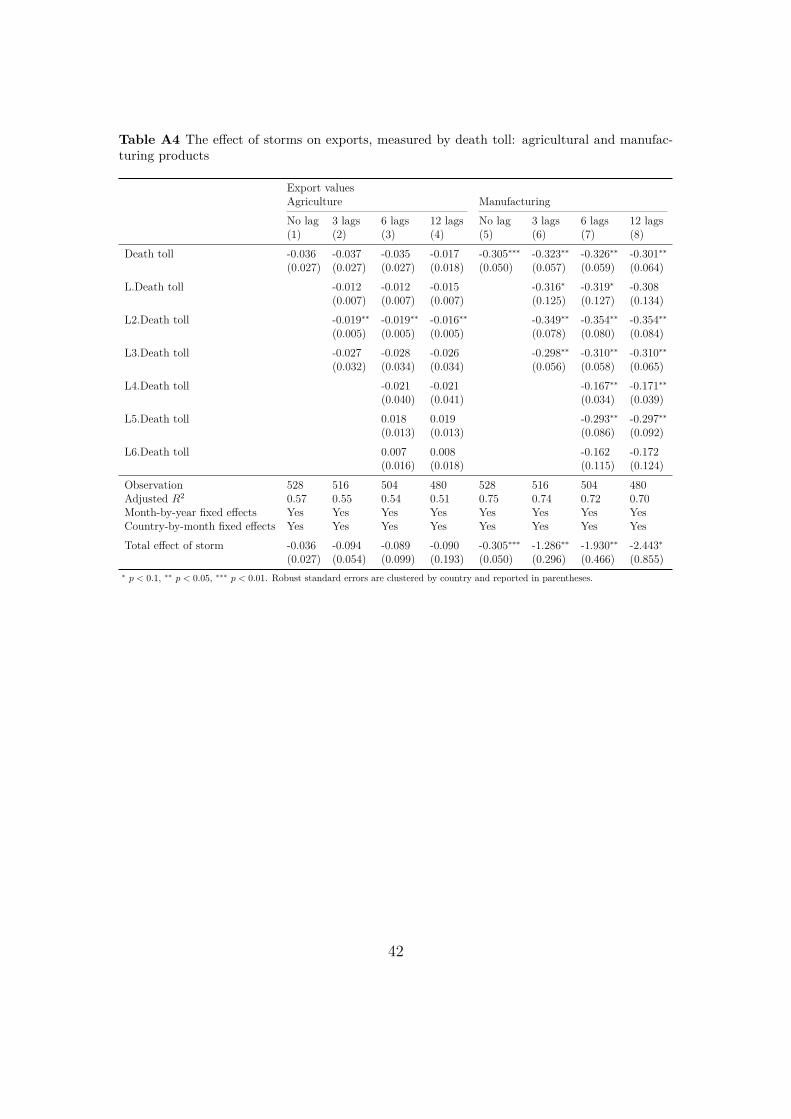
Table A4 The effect of storms on exports, measured by death toll: agricultural and manufac-turing products
Export valuesAgriculture ManufacturingNo lag 3 lags 6 lags 12 lags No lag 3 lags 6 lags 12 lags(1) (2) (3) (4) (5) (6) (7) (8)
Death toll -0.036 -0.037 -0.035 -0.017 -0.305∗∗∗ -0.323∗∗ -0.326∗∗ -0.301∗∗
(0.027) (0.027) (0.027) (0.018) (0.050) (0.057) (0.059) (0.064)L.Death toll -0.012 -0.012 -0.015 -0.316∗ -0.319∗ -0.308
(0.007) (0.007) (0.007) (0.125) (0.127) (0.134)L2.Death toll -0.019∗∗ -0.019∗∗ -0.016∗∗ -0.349∗∗ -0.354∗∗ -0.354∗∗
(0.005) (0.005) (0.005) (0.078) (0.080) (0.084)L3.Death toll -0.027 -0.028 -0.026 -0.298∗∗ -0.310∗∗ -0.310∗∗
(0.032) (0.034) (0.034) (0.056) (0.058) (0.065)L4.Death toll -0.021 -0.021 -0.167∗∗ -0.171∗∗
(0.040) (0.041) (0.034) (0.039)L5.Death toll 0.018 0.019 -0.293∗∗ -0.297∗∗
(0.013) (0.013) (0.086) (0.092)L6.Death toll 0.007 0.008 -0.162 -0.172
(0.016) (0.018) (0.115) (0.124)
Observation 528 516 504 480 528 516 504 480Adjusted R2 0.57 0.55 0.54 0.51 0.75 0.74 0.72 0.70Month-by-year fixed effects Yes Yes Yes Yes Yes Yes Yes YesCountry-by-month fixed effects Yes Yes Yes Yes Yes Yes Yes YesTotal effect of storm -0.036 -0.094 -0.089 -0.090 -0.305∗∗∗ -1.286∗∗ -1.930∗∗ -2.443∗
(0.027) (0.054) (0.099) (0.193) (0.050) (0.296) (0.466) (0.855)∗ p < 0.1, ∗∗ p < 0.05, ∗∗∗ p < 0.01. Robust standard errors are clustered by country and reported in parentheses.
42
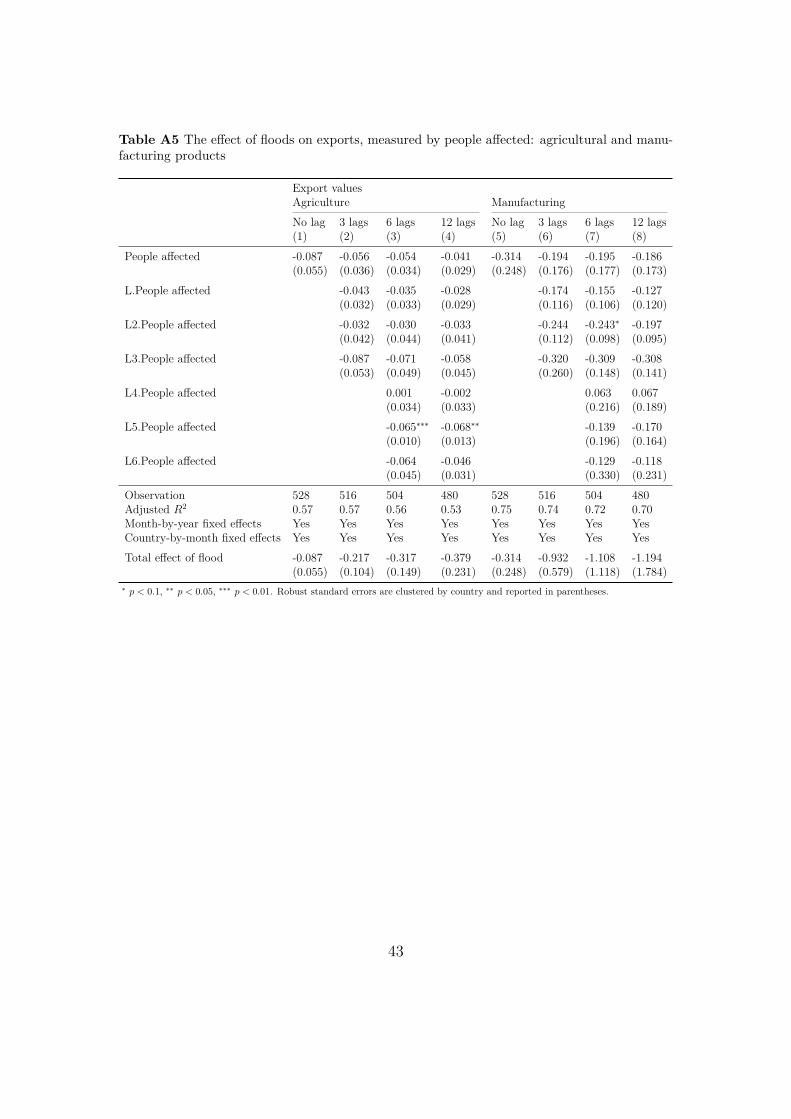
Table A5 The effect of floods on exports, measured by people affected: agricultural and manu-facturing products
Export valuesAgriculture ManufacturingNo lag 3 lags 6 lags 12 lags No lag 3 lags 6 lags 12 lags(1) (2) (3) (4) (5) (6) (7) (8)
People affected -0.087 -0.056 -0.054 -0.041 -0.314 -0.194 -0.195 -0.186(0.055) (0.036) (0.034) (0.029) (0.248) (0.176) (0.177) (0.173)
L.People affected -0.043 -0.035 -0.028 -0.174 -0.155 -0.127(0.032) (0.033) (0.029) (0.116) (0.106) (0.120)
L2.People affected -0.032 -0.030 -0.033 -0.244 -0.243∗ -0.197(0.042) (0.044) (0.041) (0.112) (0.098) (0.095)
L3.People affected -0.087 -0.071 -0.058 -0.320 -0.309 -0.308(0.053) (0.049) (0.045) (0.260) (0.148) (0.141)
L4.People affected 0.001 -0.002 0.063 0.067(0.034) (0.033) (0.216) (0.189)
L5.People affected -0.065∗∗∗ -0.068∗∗ -0.139 -0.170(0.010) (0.013) (0.196) (0.164)
L6.People affected -0.064 -0.046 -0.129 -0.118(0.045) (0.031) (0.330) (0.231)
Observation 528 516 504 480 528 516 504 480Adjusted R2 0.57 0.57 0.56 0.53 0.75 0.74 0.72 0.70Month-by-year fixed effects Yes Yes Yes Yes Yes Yes Yes YesCountry-by-month fixed effects Yes Yes Yes Yes Yes Yes Yes YesTotal effect of flood -0.087 -0.217 -0.317 -0.379 -0.314 -0.932 -1.108 -1.194
(0.055) (0.104) (0.149) (0.231) (0.248) (0.579) (1.118) (1.784)∗ p < 0.1, ∗∗ p < 0.05, ∗∗∗ p < 0.01. Robust standard errors are clustered by country and reported in parentheses.
43
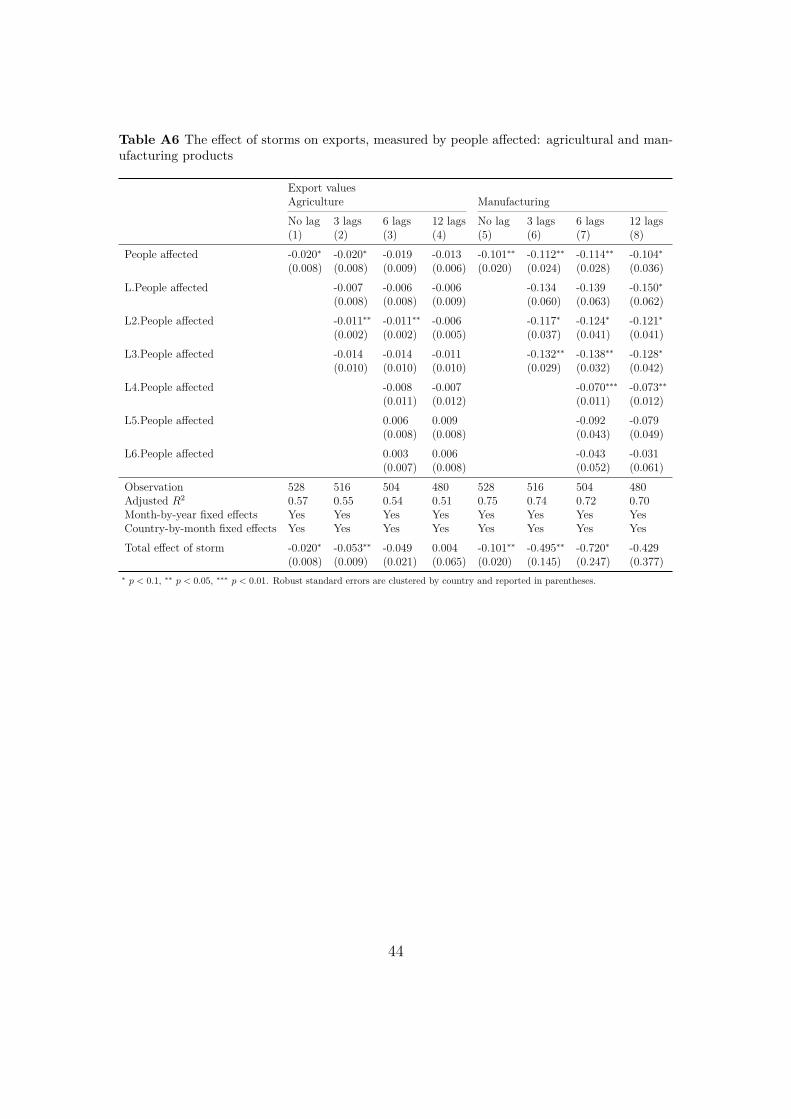
Table A6 The effect of storms on exports, measured by people affected: agricultural and man-ufacturing products
Export valuesAgriculture ManufacturingNo lag 3 lags 6 lags 12 lags No lag 3 lags 6 lags 12 lags(1) (2) (3) (4) (5) (6) (7) (8)
People affected -0.020∗ -0.020∗ -0.019 -0.013 -0.101∗∗ -0.112∗∗ -0.114∗∗ -0.104∗
(0.008) (0.008) (0.009) (0.006) (0.020) (0.024) (0.028) (0.036)L.People affected -0.007 -0.006 -0.006 -0.134 -0.139 -0.150∗
(0.008) (0.008) (0.009) (0.060) (0.063) (0.062)L2.People affected -0.011∗∗ -0.011∗∗ -0.006 -0.117∗ -0.124∗ -0.121∗
(0.002) (0.002) (0.005) (0.037) (0.041) (0.041)L3.People affected -0.014 -0.014 -0.011 -0.132∗∗ -0.138∗∗ -0.128∗
(0.010) (0.010) (0.010) (0.029) (0.032) (0.042)L4.People affected -0.008 -0.007 -0.070∗∗∗ -0.073∗∗
(0.011) (0.012) (0.011) (0.012)L5.People affected 0.006 0.009 -0.092 -0.079
(0.008) (0.008) (0.043) (0.049)L6.People affected 0.003 0.006 -0.043 -0.031
(0.007) (0.008) (0.052) (0.061)
Observation 528 516 504 480 528 516 504 480Adjusted R2 0.57 0.55 0.54 0.51 0.75 0.74 0.72 0.70Month-by-year fixed effects Yes Yes Yes Yes Yes Yes Yes YesCountry-by-month fixed effects Yes Yes Yes Yes Yes Yes Yes YesTotal effect of storm -0.020∗ -0.053∗∗ -0.049 0.004 -0.101∗∗ -0.495∗∗ -0.720∗ -0.429
(0.008) (0.009) (0.021) (0.065) (0.020) (0.145) (0.247) (0.377)∗ p < 0.1, ∗∗ p < 0.05, ∗∗∗ p < 0.01. Robust standard errors are clustered by country and reported in parentheses.
44

Table A7 The effect of floods on exports, measured by economic damages: agricultural andmanufacturing products
Export valuesAgriculture ManufacturingNo lag 3 lags 6 lags 12 lags No lag 3 lags 6 lags 12 lags(1) (2) (3) (4) (5) (6) (7) (8)
Economic damages -0.029 -0.020 -0.026 -0.021 -0.097 -0.006 0.049 0.085(0.035) (0.035) (0.041) (0.044) (0.192) (0.172) (0.207) (0.209)
L.Economic damages 0.040 0.038 0.033 0.034 0.033 0.008(0.028) (0.028) (0.026) (0.030) (0.029) (0.023)
L2.Economic damages -0.033∗∗ -0.033∗∗ -0.035∗∗ -0.238∗∗ -0.250∗∗∗ -0.261∗∗∗
(0.009) (0.010) (0.009) (0.043) (0.035) (0.034)L3.Economic damages -0.038 -0.040 -0.038 0.051 -0.146∗∗∗ -0.141∗∗
(0.029) (0.048) (0.042) (0.073) (0.023) (0.026)L4.Economic damages 0.030 0.031 0.147∗ 0.161∗∗
(0.022) (0.018) (0.049) (0.049)L5.Economic damages -0.010 -0.018 -0.009 0.025
(0.026) (0.025) (0.022) (0.040)L6.Economic damages -0.021 0.001 0.144 0.157
(0.028) (0.024) (0.126) (0.110)
Observation 528 516 504 480 528 516 504 480Adjusted R2 0.57 0.56 0.55 0.52 0.74 0.73 0.72 0.69Month-by-year fixed effects Yes Yes Yes Yes Yes Yes Yes YesCountry-by-month fixed effects Yes Yes Yes Yes Yes Yes Yes YesTotal effect of flood -0.029 -0.051 -0.061 -0.080 -0.097 -0.159 -0.031 0.156
(0.035) (0.040) (0.052) (0.072) (0.192) (0.228) (0.308) (0.443)∗ p < 0.1, ∗∗ p < 0.05, ∗∗∗ p < 0.01. Robust standard errors are clustered by country and reported in parentheses.
45
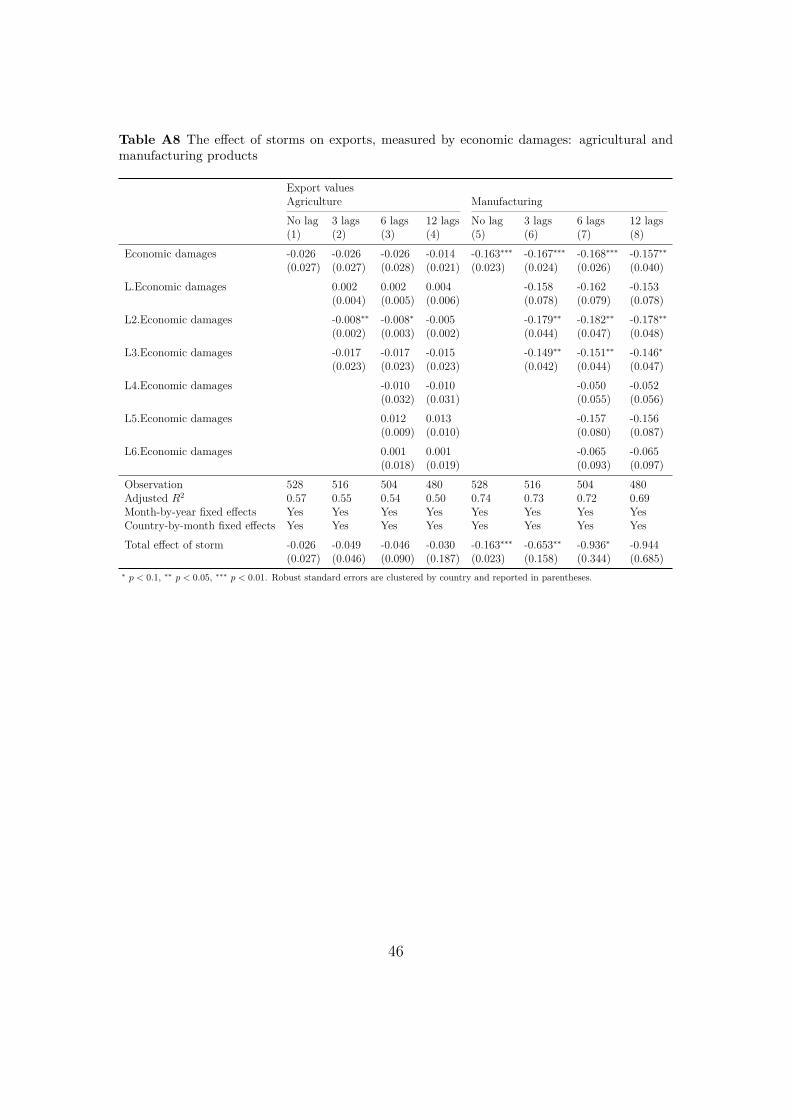
Table A8 The effect of storms on exports, measured by economic damages: agricultural andmanufacturing products
Export valuesAgriculture ManufacturingNo lag 3 lags 6 lags 12 lags No lag 3 lags 6 lags 12 lags(1) (2) (3) (4) (5) (6) (7) (8)
Economic damages -0.026 -0.026 -0.026 -0.014 -0.163∗∗∗ -0.167∗∗∗ -0.168∗∗∗ -0.157∗∗
(0.027) (0.027) (0.028) (0.021) (0.023) (0.024) (0.026) (0.040)L.Economic damages 0.002 0.002 0.004 -0.158 -0.162 -0.153
(0.004) (0.005) (0.006) (0.078) (0.079) (0.078)L2.Economic damages -0.008∗∗ -0.008∗ -0.005 -0.179∗∗ -0.182∗∗ -0.178∗∗
(0.002) (0.003) (0.002) (0.044) (0.047) (0.048)L3.Economic damages -0.017 -0.017 -0.015 -0.149∗∗ -0.151∗∗ -0.146∗
(0.023) (0.023) (0.023) (0.042) (0.044) (0.047)L4.Economic damages -0.010 -0.010 -0.050 -0.052
(0.032) (0.031) (0.055) (0.056)L5.Economic damages 0.012 0.013 -0.157 -0.156
(0.009) (0.010) (0.080) (0.087)L6.Economic damages 0.001 0.001 -0.065 -0.065
(0.018) (0.019) (0.093) (0.097)
Observation 528 516 504 480 528 516 504 480Adjusted R2 0.57 0.55 0.54 0.50 0.74 0.73 0.72 0.69Month-by-year fixed effects Yes Yes Yes Yes Yes Yes Yes YesCountry-by-month fixed effects Yes Yes Yes Yes Yes Yes Yes YesTotal effect of storm -0.026 -0.049 -0.046 -0.030 -0.163∗∗∗ -0.653∗∗ -0.936∗ -0.944
(0.027) (0.046) (0.090) (0.187) (0.023) (0.158) (0.344) (0.685)∗ p < 0.1, ∗∗ p < 0.05, ∗∗∗ p < 0.01. Robust standard errors are clustered by country and reported in parentheses.
46
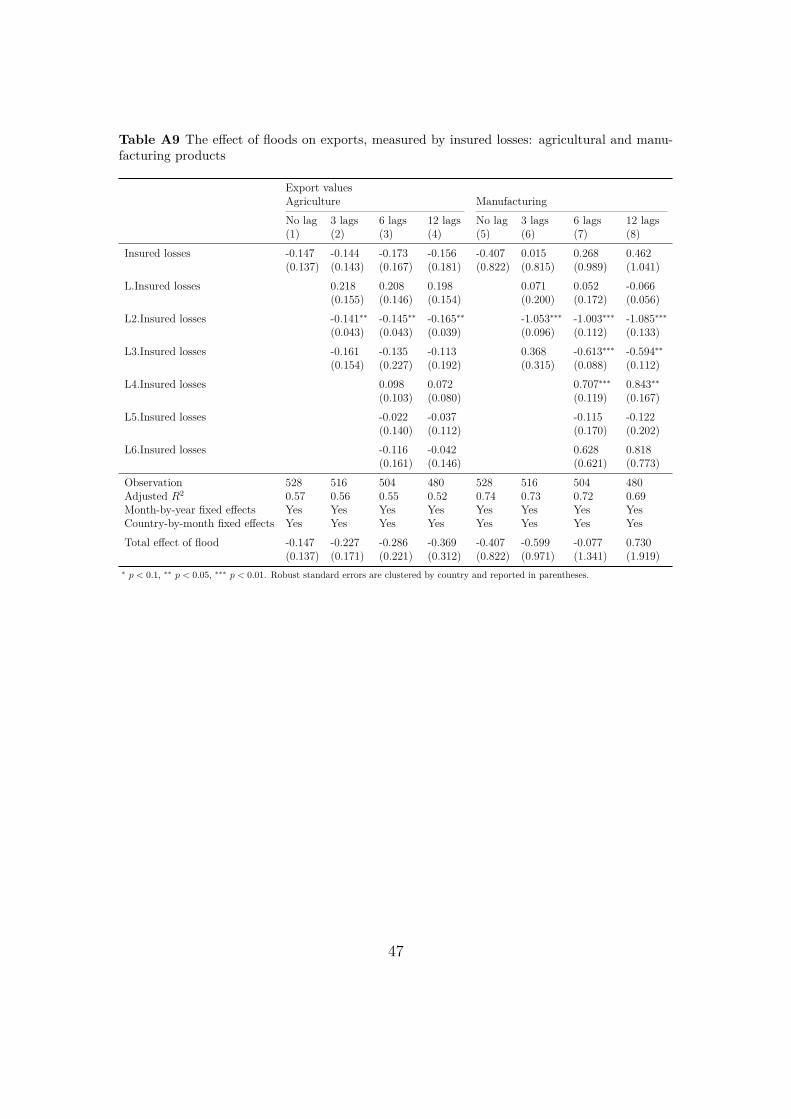
Table A9 The effect of floods on exports, measured by insured losses: agricultural and manu-facturing products
Export valuesAgriculture ManufacturingNo lag 3 lags 6 lags 12 lags No lag 3 lags 6 lags 12 lags(1) (2) (3) (4) (5) (6) (7) (8)
Insured losses -0.147 -0.144 -0.173 -0.156 -0.407 0.015 0.268 0.462(0.137) (0.143) (0.167) (0.181) (0.822) (0.815) (0.989) (1.041)
L.Insured losses 0.218 0.208 0.198 0.071 0.052 -0.066(0.155) (0.146) (0.154) (0.200) (0.172) (0.056)
L2.Insured losses -0.141∗∗ -0.145∗∗ -0.165∗∗ -1.053∗∗∗ -1.003∗∗∗ -1.085∗∗∗
(0.043) (0.043) (0.039) (0.096) (0.112) (0.133)L3.Insured losses -0.161 -0.135 -0.113 0.368 -0.613∗∗∗ -0.594∗∗
(0.154) (0.227) (0.192) (0.315) (0.088) (0.112)L4.Insured losses 0.098 0.072 0.707∗∗∗ 0.843∗∗
(0.103) (0.080) (0.119) (0.167)L5.Insured losses -0.022 -0.037 -0.115 -0.122
(0.140) (0.112) (0.170) (0.202)L6.Insured losses -0.116 -0.042 0.628 0.818
(0.161) (0.146) (0.621) (0.773)
Observation 528 516 504 480 528 516 504 480Adjusted R2 0.57 0.56 0.55 0.52 0.74 0.73 0.72 0.69Month-by-year fixed effects Yes Yes Yes Yes Yes Yes Yes YesCountry-by-month fixed effects Yes Yes Yes Yes Yes Yes Yes YesTotal effect of flood -0.147 -0.227 -0.286 -0.369 -0.407 -0.599 -0.077 0.730
(0.137) (0.171) (0.221) (0.312) (0.822) (0.971) (1.341) (1.919)∗ p < 0.1, ∗∗ p < 0.05, ∗∗∗ p < 0.01. Robust standard errors are clustered by country and reported in parentheses.
47
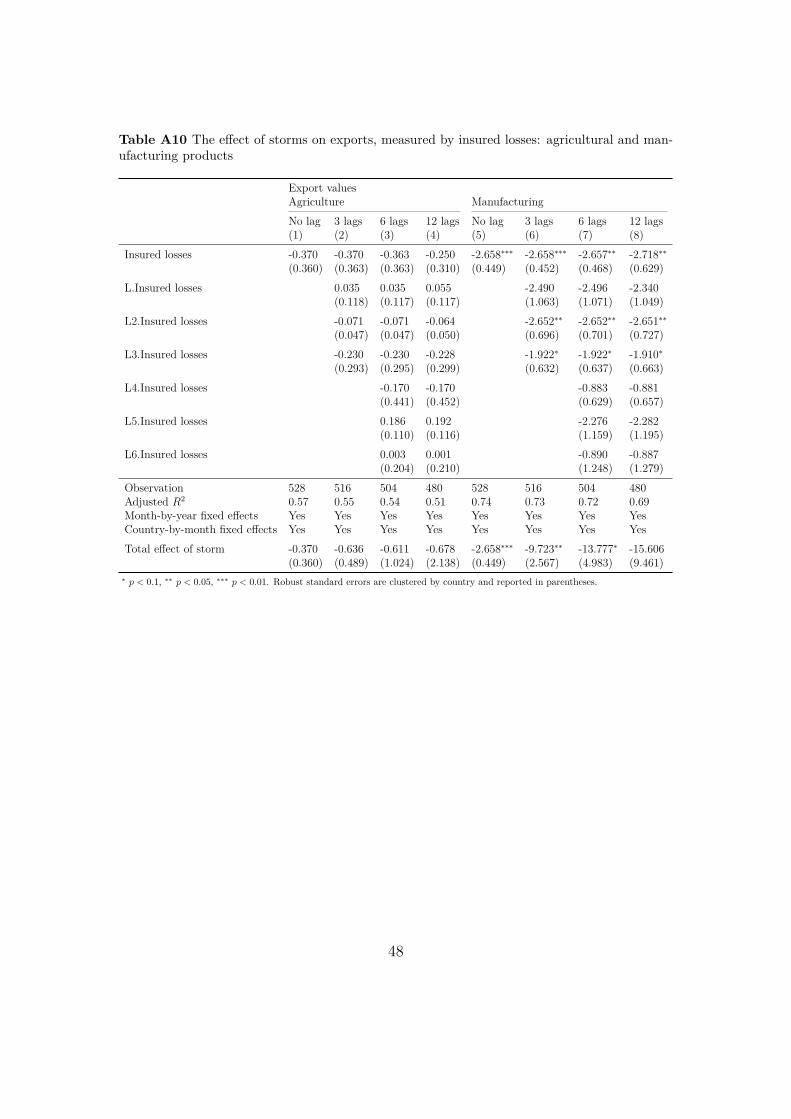
Table A10 The effect of storms on exports, measured by insured losses: agricultural and man-ufacturing products
Export valuesAgriculture ManufacturingNo lag 3 lags 6 lags 12 lags No lag 3 lags 6 lags 12 lags(1) (2) (3) (4) (5) (6) (7) (8)
Insured losses -0.370 -0.370 -0.363 -0.250 -2.658∗∗∗ -2.658∗∗∗ -2.657∗∗ -2.718∗∗
(0.360) (0.363) (0.363) (0.310) (0.449) (0.452) (0.468) (0.629)L.Insured losses 0.035 0.035 0.055 -2.490 -2.496 -2.340
(0.118) (0.117) (0.117) (1.063) (1.071) (1.049)L2.Insured losses -0.071 -0.071 -0.064 -2.652∗∗ -2.652∗∗ -2.651∗∗
(0.047) (0.047) (0.050) (0.696) (0.701) (0.727)L3.Insured losses -0.230 -0.230 -0.228 -1.922∗ -1.922∗ -1.910∗
(0.293) (0.295) (0.299) (0.632) (0.637) (0.663)L4.Insured losses -0.170 -0.170 -0.883 -0.881
(0.441) (0.452) (0.629) (0.657)L5.Insured losses 0.186 0.192 -2.276 -2.282
(0.110) (0.116) (1.159) (1.195)L6.Insured losses 0.003 0.001 -0.890 -0.887
(0.204) (0.210) (1.248) (1.279)
Observation 528 516 504 480 528 516 504 480Adjusted R2 0.57 0.55 0.54 0.51 0.74 0.73 0.72 0.69Month-by-year fixed effects Yes Yes Yes Yes Yes Yes Yes YesCountry-by-month fixed effects Yes Yes Yes Yes Yes Yes Yes YesTotal effect of storm -0.370 -0.636 -0.611 -0.678 -2.658∗∗∗ -9.723∗∗ -13.777∗ -15.606
(0.360) (0.489) (1.024) (2.138) (0.449) (2.567) (4.983) (9.461)∗ p < 0.1, ∗∗ p < 0.05, ∗∗∗ p < 0.01. Robust standard errors are clustered by country and reported in parentheses.
48