Embed Size (px)
Citation preview
Floods of December 1966 in the Kern-Kaweah Area, Kern and Tulare Counties, California
GEOLOGICAL SURVEY WATER-SUPPLY PAPER 1870-C
Floods of December 1966 in the Kern-Kaweah Area, Kern and Tulare Counties, CaliforniaBy WILLARD W. DEAN
fPith a section on GEOMORPHIC EFFECTS IN THE KERN RIVER BASINBy KEVIN M. SCOTT
FLOODS OF 1966 IN THE UNITED STATES
GEOLOGICAL SURVEY WATER-SUPPLY PAPER 1870-C
UNITED STATES GOVERNMENT PRINTING OFFICE, WASHINGTON : 1971
UNITED STATES DEPARTMENT OF THE INTERIOR
ROGERS C. B. MORTON, Secretary
GEOLOGICAL SURVEY
W. A. Radlinski, Acting Director
Library of Congress catalog-card No. 73-610922
For sale by the Superintendent of Documents, U.S. Government Printing Office Washington, D.C. 20402 - Price 45 cents (paper cover)
CONTENTS
Page
Abstract_____________________________________________________ ClIntroduction.____________ _ ________________________________________ 1Acknowledgments. ________________________________________________ 3Precipitation__ ____________________________________________________ 5General description of the floods___________________________________ 9
Kern River basin______________________________________________ 12Tule River basin______________________________________________ 16Kaweah River basin____________________________--_-____-_---_- 18Miscellaneous basins___________________________________________ 22
Storage regulation _________________________________________________ 22Flood damage.__________________________________________________ 23Comparison to previous floods___________-_____________--___------_ 25Flood frequency.__________________________________________________ 27Geom orphic effects in the Kern River basin, by Kevin M. Scott. __________ 28Sedimentation and channel changes______________-_--_-___-___------- 30Determination of flood discharges___________________---_-_-----_ 31Summary of flood stages and discharges_________-____-___-__------__- 33Explanation of station data--_--_-_--_-_--_--_---_-_---__----------- 36Selected references.._______________________________--____----_-_--- 37Station data.______________________________________________________ 39Index____________________________.___________ 79
ILLUSTRATIONS
Page FIGURE 1. Index map showing area of extreme flooding in December
1966____._____________________________-----.__ C22. Map showing location of gaging stations_________________ 43. Graph showing hourly precipitation at selected stations.____ 64. Map showing isohyets of total precipitation, December 2-6,
1966_.__._._________________-_-___-__----____------- 85. Graph showing area-altitude relations upstream from selected
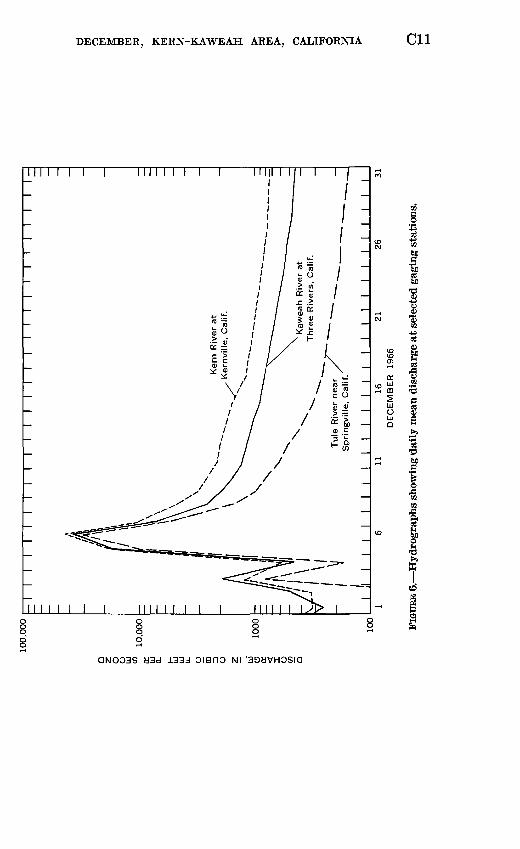
gaging stations or reservoirs____-____-___--__---_------ 106. Hydrographs showing daily mean discharge at selected gaging
stations.____________________________________________ 117. Hydrographs showing discharge at selected gaging stations
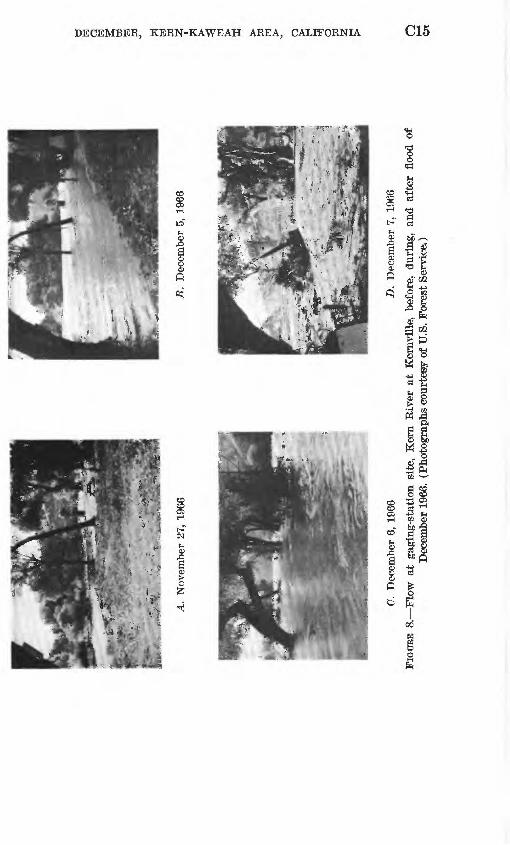
in Kern River basin._________________________________ 138. Photographs showing flow at gaging-station site on the Kern
River at Kernville, before, during, and after flood of December 1966____________________________-_---. 15
9. Hydrographs showing discharge at selected gaging stationsin the Tule River basin_______________________________ 17
m
IV CONTENTS
Page FIGURE 10. Hydrographs showing discharge at selected gaging stations
in the Kaweah River basin____________________________ C2C11. Graphs showing cumulative precipitation or runoff in the
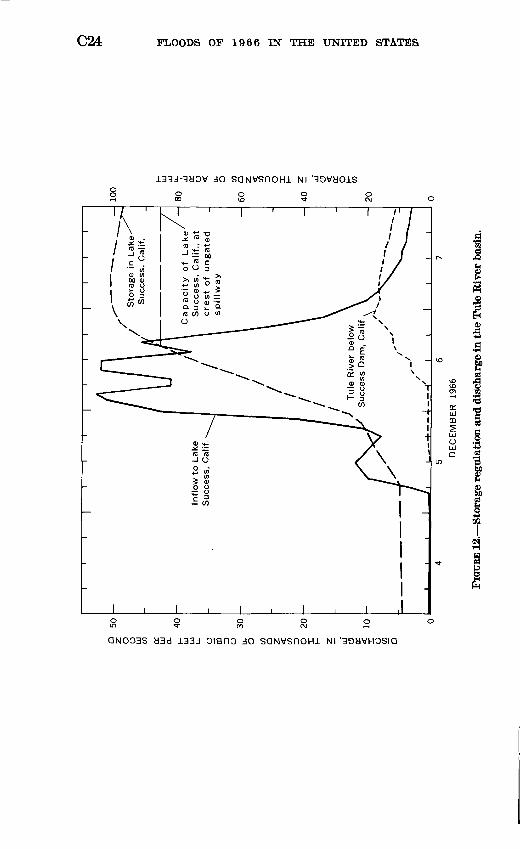
Kaweah River basin__________________________________ 2112. Graphs showing storage regulation and discharge in the Tule
River basin__________________________________________ 2413. Photograph of Kelso Creek near Weldon; downstream view,
January 1967______-_-__-_-__----__-__--__-________ 2914. Graphs showing change in river-channel cross section of the
Kern River at Kernville and the South Fork Kern River near Onyx, 1966, 1967, and 1969_______._______ 32
15. Photograph of South Kern River near Onyx; upstream view,January 1967___.________________________ 33
TABLES
Page TABLE 1. Precipitation at selected stations_________________________ C5
2. Peak discharge at selected stations during the floods of 1950,1955, 1963, and 1966____________________._____-______. 26
3. Runoff at selected gaging stations for 3-day periods during thefloods of 1950, 1955, 1963, and 1966__________________ 26
4. Summary of flood stages and discharges__________________ 34
FLOODS OF 1966 IN THE UNITED STATES
FLOODS OF DECEMBER 1966 IN THEKERN-KAWEAH AREA,
KERN AND TULARE COUNTIES,CALIFORNIA
By WILLARD W. DEAN
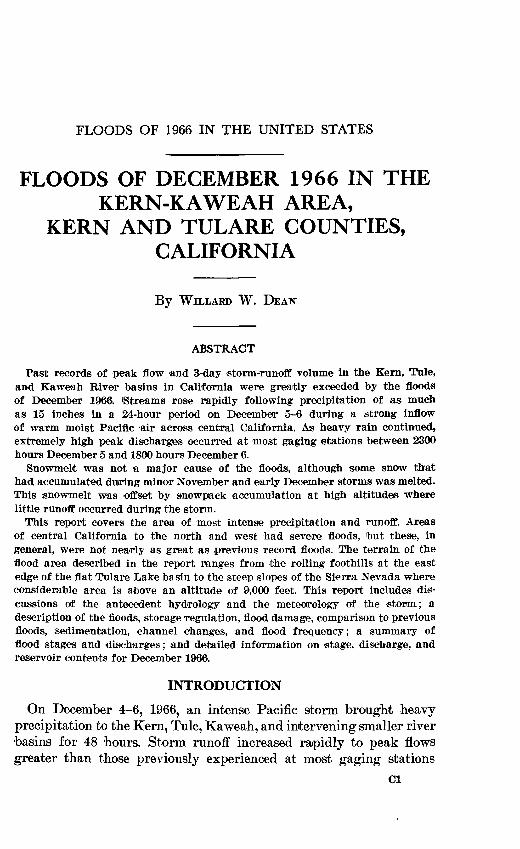
ABSTRACT
Past records of peak flow and 3-day storm-runoff volume in the Kern, Tule, and Kaweah River basins in California were greatly exceeded by the floods of December 1966. 'Streams rose rapidly following precipitation of as much as 15 inches in a 24-hour period on December 5-6 during a strong inflow of warm moist Pacific air across central California. As heavy rain continued, extremely high peak discharges occurred at most gaging 'stations 'between 2300 hours December 5 and 1800 hours December 6.
Snowmelt was not a major cause of the floods, although some snow that had accumulated during minor November and early December storms was melted. This snowmelt was offset by snowpack accumulation at high altitudes where little runoff occurred during the storm.
This report covers the area of most intense precipitation and runoff. Areas of central California to the north and west had severe floods, but these, in general, were not nearly as great as previous record floods. The terrain of the flood area described in the report ranges from the rolling foothills at the east edge of the flat Tulare Lake basin to the steep slopes of the Sierra Nevada where considerable area is above an altitude of 9,000 feet. This report includes dis cussions of the antecedent hydrology and the meteorology of the storm; a description of the floods, storage regulation, flood damage, comparison to previous floods, sedimentation, channel changes, and flood frequency; a summary of flood stages and discharges; and detailed information on stage, discharge, and reservoir contents for December 1966.
INTRODUCTION
On December 4-6, 1966, an intense Pacific storm brought heavy precipitation to the Kern, Tule, Kaweah, and intervening smaller river basins for 48 hours. Storm runoff increased rapidly to peak flows greater than those previously experienced at most gaging stations
Cl
C2 FLOODS OF 1966 IN THE UNITED STATES
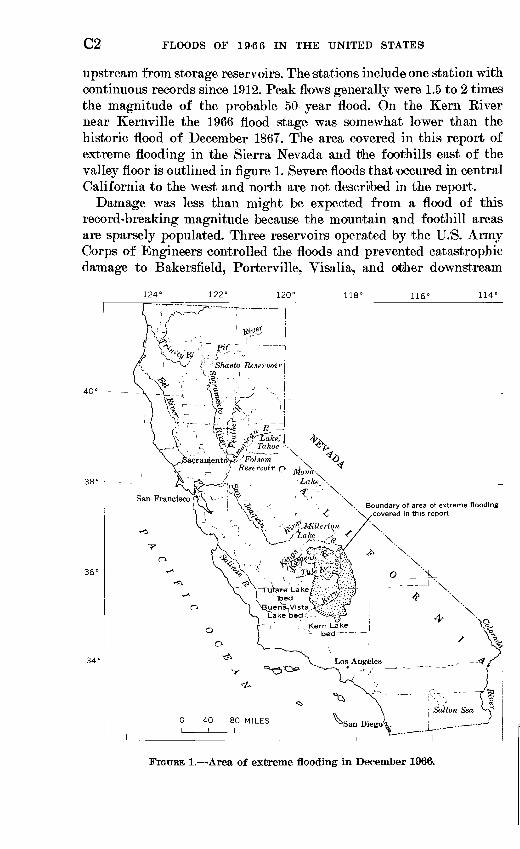
upstream from storage reservoirs. The stations include one station with continuous records since 1912. Peak flows generally were 1.5 to 2 times the magnitude of the probable 50-year flood. On the Kern River near Kernville the 1966 flood stage was somewhat lower than the historic flood of December 1867. The area covered in this report of extreme flooding in the Sierra Nevada and the foothills east of the valley floor is outlined in figure 1. Severe floods that occured in central California to the west and north are not described in the report.
Damage was less than might be expected from a flood of this record-breaking magnitude because the mountain and foothill areas are sparsely populated. Three reservoirs operated by the U.'S. Army Corps of Engineers controlled the floods and prevented catastrophic damage to Bakersfield, Porterville, Visalia, and other downstream
124' 122° 120° 118° 116° 114°
FIGURE 1. Area of extreme flooding in December 1966.
DECEMBER, KERN-KAWEAH AREA, CALIFORNIA C3
cities. Actual damage is estimated at $13 million in mountain and foothill areas upstream from these reservoirs. This total includes $4,500,000 damage t>o U.S. Forest Service and National Park Service facilities. The three reservoirs are estimated to have prevented a total of $81,300,000 in potential downstream damage. Three lives were lost in the flood.
This report provides detailed hydrologic data for use in flood-control planning and in other studies involving flood hydrology. Flood stage and discharge information collected by the U.S. Geological Survey is presented for the flood area. This information includes all available data on stage and discharge for each gaging station during the period of storm runoff, a summary table of flood stages and discharges, a comparison to the maximum floods previously known, and the esti mated recurrence interval. Information provided by other agencies on storm precipitation, flood damage, and storage regulation is included.
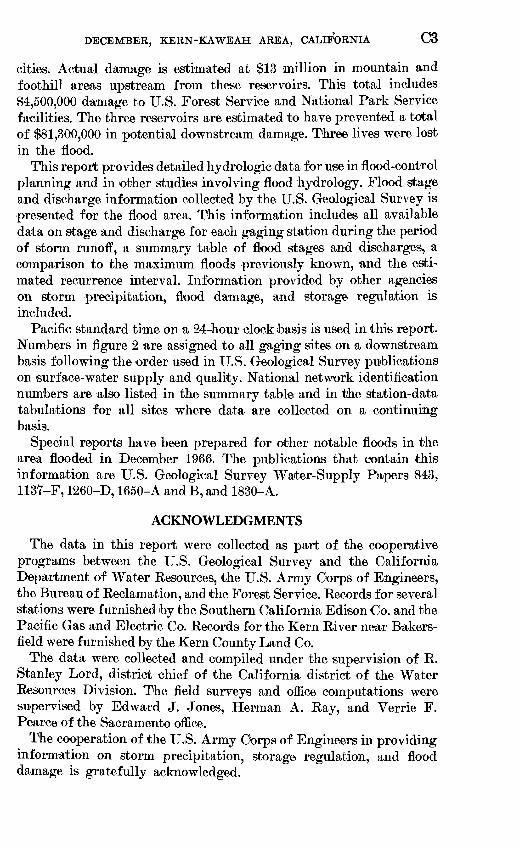
Pacific standard time on a 24-hour clock basis is used in this report. Numbers in figure 2 are assigned to all gaging sites on a downstream basis following the order used in U.S. 'Geological Survey publications on surface-water supply and quality. National network identification numbers are also listed in the summary table and in the station-data tabulations for all sites where data are collected on a continuing basis.
Special reports have been prepared for other notable floods in the area flooded in December 1966. The publications that contain this information are U.S. Geological Survey Water-Supply Papers 843, 1137-F, 1260-D, 1650-A and B, and 1830-A.
ACKNOWLEDGMENTS
The data in this report were collected as part of the cooperative programs between the U.S. Geological Survey and the California Department of Water Resources, the U.S. Army Corps of Engineers, the Bureau of Reclamation, and the Forest Service. Records for several stations were furnished by the Southern California Edison Co. and the Pacific Gas and Electric Co. Records for the Kern River near Bakers- field were furnished by the Kern County Land Co.
The data were collected and compiled under the supervision of R. Stanley Lord, district chief of the California district of the Water Resources Division. The field surveys and office computations were supervised by Edward J. Jones, Herman A. Ray, and Verrie F. Pearce of the Sacramento office.
The cooperation of the U.S. Army Corps of Engineers in providing information on storm precipitation, storage regulation, and flood damage is gratefully acknowledged.
C4 FLOODS OF 1966 IN THE UNITED STATES
119° 118°
Data-collection site / Number corresponds to
that in table 4
FIGURE 2. Location of gaging stations.
DECEMBER, KERN-KAWEAH AREA, CALIFORNIA
PRECIPITATION
C5
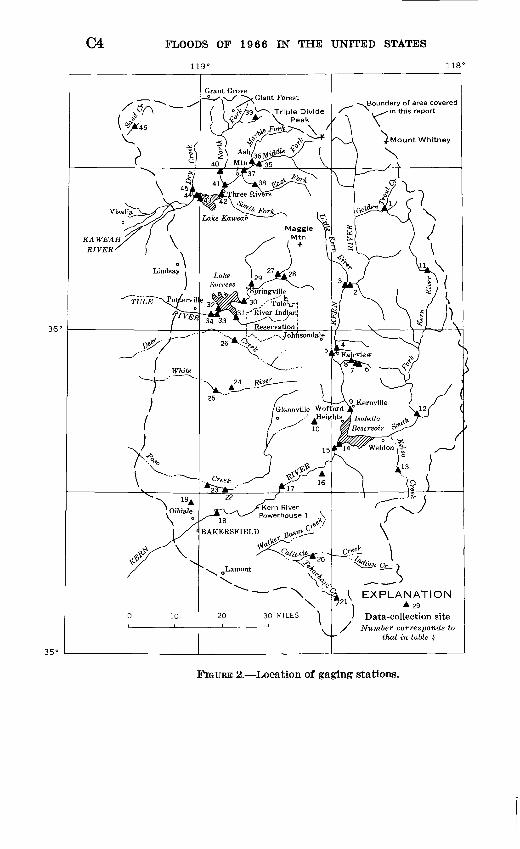
The primary cause of the floods in December 196'6 was the persistent moderate to heavy rainfall that began about 1600 hours on December 4 and continued until 1800 hours on December 6. Antecedent precipita tion had reduced soil-moisture deficiencies. Some melting of accu mulated low-altitude snow may have augmented flood peaks slightly. The intense precipitation of up to 15 inches in '24 hours would have been sufficient to cause record floods without any antecedent precipi tation or snow.
Above-normal precipitation occurred during the latter part of No vember from several small storms. On December 2, a moderate storm deposited 2-6 inches of precipitation at mountain stations. Late in the afternoon of December 4, an influx of warm moist Pacific air began the period of heavy precipitation and runoff that culminated in the flood peaks late on December 5 or early on December 6. Hourly precipitation at selected stations is plotted in figure 3. The precipita tion intensity lessened for a Ifew hours before noon on December 5. Very heavy precipitation resumed after noon and increased generally to its highest rates during the evening of December 5.
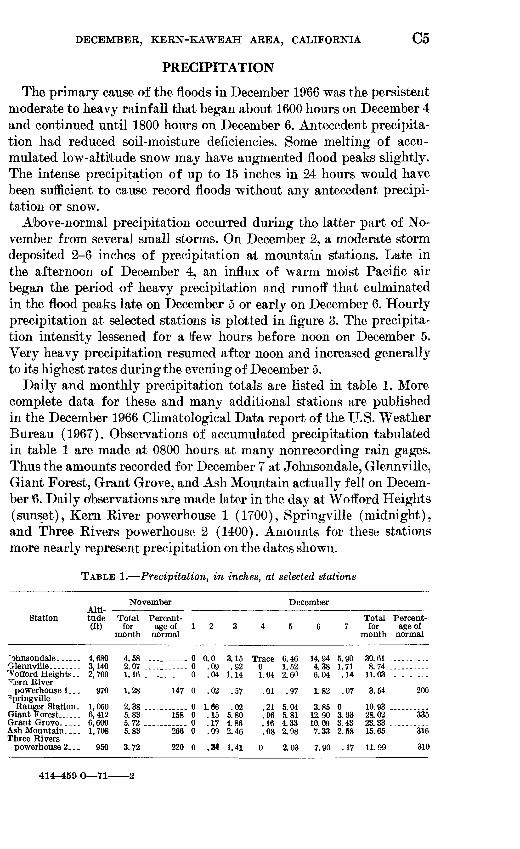
Daily and monthly precipitation totals are listed in table 1. More complete data for these and many additional stations are published in the December 1966 Climatological Data report of the U.S. Weather Bureau (1967). Observations of accumulated precipitation tabulated in table 1 are made at 0800 hours at many nonrecording rain gages. Thus the amounts recorded for December 7 at Johnsondale, Glennville, Giant Forest, Grant Grove, and Ash Mountain actually fell on Decem ber !6. Daily observations are made later in the day at Wofford Heights (sunset), Kern Eiver powerhouse 1 (1700), Springville (midnight), and Three Eivers powerhouse 2 (1400). Amounts for these stations more nearly represent precipitation on the dates shown.
TABLE 1. Precipitation, in inches, at selected stations
Station
"ohnsondale -.-..-
'Voflord Heights.. Tern Eiver
powerhouse 1... ^pringville
Banger Station . Giant Forest...... Grant Grove. .... .Ash Mountain. ... Three Rivers
Alti tude (ft)
4,680 3,140 2,700
970
1,050 6,412 6,600 1,708
November
Total for
month
4.58 2.07 1.16
1.28
2.38 5.83 5.72 5.83
Percent age of
normal
147
158
266
1
0 0 0
0
0 0 0 0
2
0.0 .09 .04
.02
1.66 .15 .17.09
3
3.15 .92
1.14
.57
.02 5.80 4.86 2.46
4
Trace 0 1.04
.01
.21
.06
.16
.08
December
5
6.46 1.52 2.60
.97
5.04 5.81 4.33 2.98
6
14.94 4.38 6.04
1.82
3.85 12.90 10.09 7.33
7
5.90 1.71 .14
.07
0 3.03 3.432.58
Total for
month
30.61 8.74
11.03
3.54
10.93 28.02 23.33 15.65
Percent age of
normal
200
335
316
powerhouse 2... 950 3.72 220 0 .34 1.41 0 2.03 7.90 .17 11.99 310
414-459 O 71-

0
0.4
0.2
DA
ILY
T
OT
AL
S
FIG
URE
3.
Ho
url
y p
reci
pita
tion
at
sele
cted
sta
tion
s.
DECEMBER, KERN-KAWEAH AREA, CALIFORNIA O7
Measurements at the many high-altitude snow courses in the flood area are not made until January 1 or February 1 of each year. There fore, there are few data on snowpack accumulation or loss during the storm. Snow depth on the ground is measured daily at Grant Grove (alt, 6,600 ft); however, no snow was reported on the ground there before the December storm, and the 4 inches reported at 0800 hours December 5 was gone December 6. During an inspection of Kern River basin gaging stations December 8 and 9, no snow was noted on the ground below 7,000 feet altitude, but thin patches of saturated snow and snow-ice were noted between 7,000 and 8,000 feet, and con tinuous snow cover was noted above 8,500 feet. At the Golden Trout Creek gaging station (site 1) the snow on the ground at 9,000 feet consisted of a 2-foot-deep dense frozen base which was covered with 1 foot of powder snow. Evidently rain had fallen at that altitude dur ing part of the storm, but the snowpack absorbed most of the rain. Above 9,000 feet the storm precipitation caused little runoff in the Kern River basin.
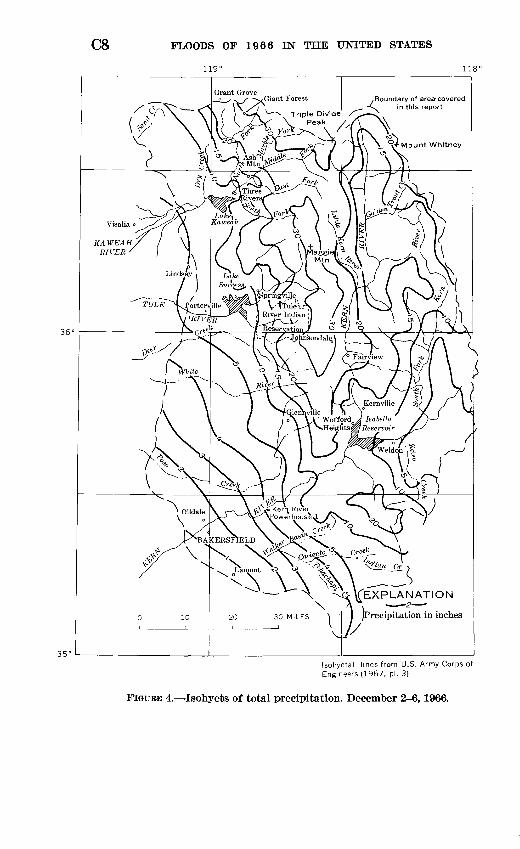
The isohyetal map (fig. 4) adapted from data furnished by the U.S. Army Corps of Engineers (1967, pi. 3) shows the generalized total precipitation December 2-6 over the flood area. The map is based on all available precipitation data from recording gages, non- recording daily observation gages, and high-altitude storage gages. Precipitation accumulated since September 1966 in storage gages was measured December 13 and proportioned on the basis of lower altitude daily precipitation records to estimate total December 2-6 storm pre cipitation for the high altitudes.
To relate precipitation to runoff in the December 1966 flood area, it is necessary to determine the altitude above which precipitation fell as snow and did not contribute to runoff. Analysis by the U.S. Corps df Engineers (1967, chart 1) indicates that the incoming warm moist air brought rain as high as 8,000 feet altitude during the evening of December 5 and up to 10,000 feet early on December 6. This rainfall melted most of the shallow residual snowpack from December 2-4 and previous storms. Observation by the Corps of Engineers of the snow- pack near high-altitude precipitation gages in the Kern, Tule, and Kaweah River basins on December 13 indicated that heavy rain had fallen during the December 5-6 storm above 8,000 feet altitude. Per sonal observation December 9 of snowpack and stream-channel condi tions at the Golden Trout Creek gaging station disclosed that little storm runoff had occurred above 9,000 'feet in the Kern River basin. To the west, runoff probably occurred from all altitudes in the Tule River basin (highest alt, 10,042 ft) because practically the entire basin was bare, with only patches of snowpack being observed at high est altitudes December 8. No direct observations were made to define
C8 FLOODS OF 1966 IN THE UNITED STATES
119° 118°
EXPLANATIONI ~^2 jPrecipitation in inches
Isohyetal lines from U.S. Army Corps of Engineers (1967, pi. 3)
FIGURE 4. Isohyets of total precipitation. December 2-6,1966.
DECEMBER, KERN-KAWEAH AREA, CALIFORNIA C9
the upper altitude boundary of the runoff-producing area in the Kaweah Eiver basin. The altitude of the snowline in the Kaweah Eiver basin probably was comparable to that in the Tule Eiver basin, with little snow below 9,000-10,000 feet altitude.
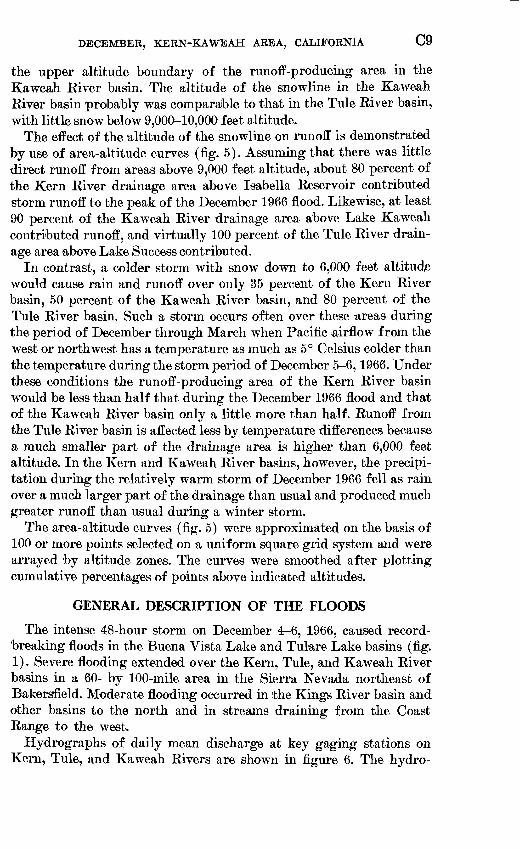
The effect of the altitude of the snowline on runoff is demonstrated by use of area-altitude curves (fig. 5). Assuming that there was little direct runoff from areas above 9,000 feet altitude, about 80 percent of the Kern Eiver drainage area above Isabella Eeservoir contributed storm runoff to the peak of the December 1966 flood. Likewise, at least 90 percent of the Kaweah Eiver drainage area above Lake Kaweah contributed runoff, and virtually 100 percent of the Tule Eiver drain age area above Lake Success contributed.
In contrast, a colder storm with snow down to 6,000 feet altitude would cause rain and runoff over only 35 percent of the Kern River basin, 50 percent of the Kaweah River basin, and 80 percent of the Tule River basin. Such a storm occurs often over these areas during the period of December through March when Pacific airflow from the west or northwest has a temperature as much as 5° Celsius colder than the temperature during the storm period of December 5-6,1966. Under these conditions the runoff-producing area of the Kern Eiver basin would be less than half that during the December 1966 flood and that of the Kaweah Eiver basin only a little more than half. Eunoff from the Tule Eiver basin is affected less by temperature differences because a much smaller part of the drainage area is higher than 6,000 feet altitude. In the Kern and Kaweah River basins, however, the precipi tation during the relatively warm storm of December 1966 fell as rain over a much larger part of the drainage than usual and produced much greater runoff than usual during a winter storm.
The area-altitude curves (fig. 5) were approximated on the basis of 100 or more points selected on a uniform square grid system and were arrayed by altitude zones. The curves were smoothed after plotting cumulative percentages of points above indicated altitudes.
GENERAL DESCRIPTION OF THE FLOODS
The intense 48-hour storm on December 4r-6, 1966, caused record- breaking floods in the Buena Vis'ta Lake and Tulare Lake basins (fig. 1). Severe flooding extended over the Kern, Tule, and Kaweah River basins in a 60- by 100-mile area in the Sierra Nevada northeast of Bakersfield. Moderate flooding occurred in the Kings River basin and other basins to the north and in streams draining from the Coast Range to the west.
Hydrographs of daily mean discharge at key gaging stations on Kern, Tule, and Kaweah Rivers are shown in figure 6. The hydro-
CIO FLOODS OF 1966 IN THE UNITED STATES
EXPLANATION
Isabella Reservoir near Isabella
Kern River at Kernville
Lake Kaweah near Lemoncove
Lake Success near Success
South Fork Kern River near Onyx
2 -
0 20 40 60 80 100
PERCENTAGE OF DRAINAGE AREA BELOW INDICATED ALTITUDE
FIGURE 5. Area-altitude relations upstream from selected gaging stations or reservoirs.
DECEMBER, KERN-KAWEAH AREA, CALIFORNIA Oil
C12 FLOODS OF 1966 IN THE UNITED STATES
graph shape is remarkably similar for the three rivers. Flood peakr were the greatest of record at many gaging stations in the Kern, Tule, and Kaweah River basins. Damage was severe in all headwater areas Most highway bridges were destroyed or severely damaged. Culverts were overflowed or plugged with debris, or usually a combination of 'both. Sustained discharged in excess of normal channel capacity eroded streambeds and streambanks and damaged all adjacent struc tures. Details regarding the flood in each basin are given in the follow ing sections.
KERN RIVER BASIN
The Kern River basin upstream from the gaging station near Bakersfield (site 18), a drainage area of 2,407 square miles, ranges ir altitude from 450 feet to 14,495 feet at the summit of Mount Whitney. Runoff from 2,074 square miles, 86 percent of the area above the Bakersfield gage, is controlled in Isabella Reservoir (site 14). Record? are available from 18 gaging stations in the Kern River basin to docu ment the flood. A good sample of different hydrologic conditions is provided because runoff is measured from drainage areas with a wide- range of size, altitude, and location in the basin. Eleven of the station? were installed since the November 1950 and December 1955 floods, which were the greatest previous floods of record. Continuous record? are available since 1893 for Kern River near Bakersfield and since 1912 for Kern River near Kernville.
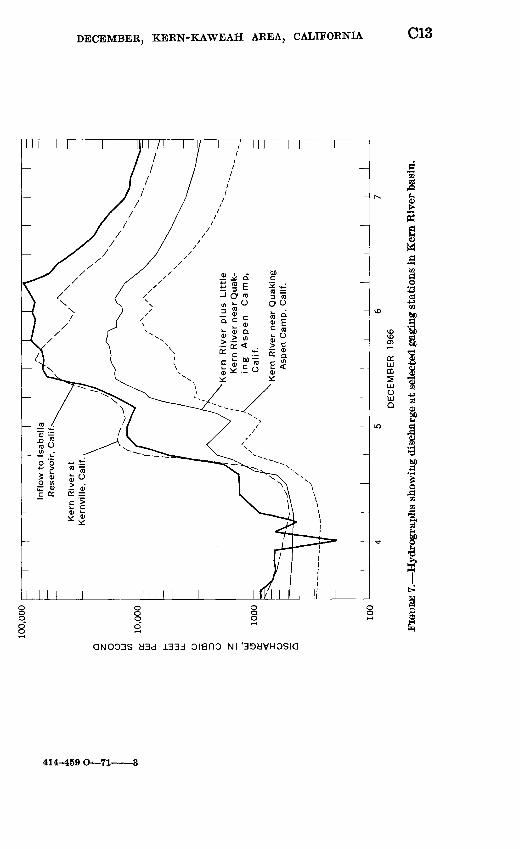
Peak flows of the December 1966 flood exceeded previous maximums at all stations except those on Golden Trout Creek, the one at South Fork Kern River near Olancha (site 11), and those below Isabella Dam (sites 15,17,18). The stations on Golden Trout Creek and South Fork Kern River near Olancha are at high altitudes above which December 1966 storm precipitation fell mostly as snow. Flows during December 1966 at the three stations on Kern River downstream from Isabella Dam were less than those during several floods prior to comple tion of the dam in 1954. Detailed hydrographs during December 4-7, 1966, at four selected Kern River stations are shown in figure 7. The hydrograph of computed inflow to Isabella Reservoir near Isabella (site 14) shows unusual fluctuations on December 4; the trend of actual inflow probably follows that of the Kern River at Kernville.
The maximum discharge of 60,000 cfs (cubic feet per second) of the Kern River near Kernville (site 5) on December 6,1966, was more than twice the previous maximum of 27,400 cfs in November 1950 and December 1955. The maximum discharge of 28,700 cfs on the South Fork Kern River near Onyx (site 12) was eight times as great as the previous maximum of 3,460 cfs recorded in February 1963. The com puted maximum bihourly inflow of 96,900 cfs to Isabella Reservoir
100,
000
O z O
O UJ c/> a-
10,0
00
1000
100
Inflow
to
Isa
bella
R
ese
rvo
ir,
Ca
lif.
Ke
rn R
iver
at
Ke
rnvi
lle,
Ca
lif.
Kern
R
ive
r plu
s Little
Kern
Riv
er
ne
ar
Qu
ak-
in
g
Aspen
Cam
p,
Calif
.
Ke
rn R
iver
near
Quaki
ng
Asp
en C
am
p,
Ca
lif.
5 6
DE
CE
MB
ER
19
66
FIG
URE
7. H
ydro
grap
hs s
how
ing
disc
harg
e at
sel
ecte
d ga
ging
sta
tion
s in
Ker
n R
iver
bas
in.
d O O I O
i-* CO
C14 FLOODS OF 1966 IN THE UNITED STATES
near Isabella was 2.5 times the previous maximum flow of 39,000 cfs at the damsite in November 1950 prior to dam construction.
Little storm runoff occurred above 9,000 feet altitude where the precipitation fell during part of the storm as snow and during the remainder as rain, as the freezing level changed during the storm. When inspected on December 9, the channel of Golden Trout Creek was nearly full of ice and frozen saturated snow. There was no evidence, of substantial high flow during the storm. Snow already on the ground apparently absorbed and held most of the rain that fell upstream from this gaging station.
The next highest Kern Eiver basin gaging station is at 7,840 feet on the South Fork Kern Eiver near Olancha, A moderate peak oc curred on December 6, but the yield per square mile was low because of a substantial noncontributing area above about 9,000 feet. The rela tions between drainage area and altitude upstream from the gaging stations on the South Fork Kern River near Onyx and the Kern Eiver at Kernville are shown in figure 5.
For the December 1966 flood the computed peak runoff per square mile at main Kern Eiver gaging stations increases in a downstream direction because downstream tributaries drain more area at altituder below 9,000 feet. The unit runoff of Kern Eiver tributaries near Fair- view and Kernville exceeded 100 cfs per square mile. The greatest known unit runoff was 490 cfs per square mile from a 1.21-square-mile area above a crest-stage gage (slope-area measurement) at Kern Eiver tributary near Miracle Hot Springs (site 16). Heavy precipitatior on December 6 caused this peak and the peak discharge of 9,290 cfs at Kern Eiver near Bakersfield (site 18) on December 7 that was thfc result of storm runoff from the 333-square-mile drainage area down stream from Isabella Dam. The only release from Isabella Dam for the first 10 days during and after the flood was the 300-500 cfs re leased to Borel Canal for power production.
Damage was heavy along stream channels in the Kern Eiver basin. The road from Kernville upstream to Johnsondale is close to the river at many locations. This road was obliterated at the outside bank of many river bends, and the pavement was scoured away in other loca tions. The modern steel girder and concrete deck bridge at Kernville was destroyed by floodflow. Bridge debris, including one 3-foot by 40-foot steel girder, was moved several hundred feet downstream. A. trailer court and other buildings along the river at Kernville were badly damaged.
The flood destroyed the water-stage recorder structures and the measuring cableways on the Kern Elver at Kernville (site 9) anc1 South Fork Kern Eiver near Onyx (site 12). The series of four pic tures in figure 8, taken by personnel of the U.S. Forest Service or
DECEMBER, KERN-KAWEAH AREA, CALIFORNIA C15
iH rjj- rit- &
t-i
1 I?
§ *|^ aj- QQ
aT3 02 > pw *ti^> O
M b
S8 -aV Oj 0)0 I
C16| FLOODS OF 1966 IN THE UNITED STATES
November 27 and December 5, 6, and 7, shows the gaging-station site on the Kern River at Kernville before and after the flood. The gaging station on the Little Kern Eiver near Quaking Aspen Camp was tilted downstream when the riverbank of boulders and cobbles was scoured away, but the station remained in operation. The concrete recorder structure on the Kern River near Kernville survived the flood, although the recorder was submerged and the cableway de stroyed. Later this station also had to be replaced because the low-flow channel had been scoured during the flood below the altitude of the intake pipes to the gage well. The gaging station on Kelso Creek near Weldon was put out of service permanently when a sand fill 8 feet deep plugged the channel during flow recession on December 6. The fill extends on a level plain 200 feet wide from cutbank to cutbank in the alluvial terrain. Most gages were destroyed and discharge-rated culverts were plugged at small-area crest-stage gage stations in the Kern River basin.
The flood caused the loss of two lives in the Kern River basin. One woman died from exposure after she and a companion were isolated by the flood in the Lament Meadows area on the South Fork Kern River. One man cleaning a weir on the lower Kern River fell into the river and suffered a fatal heart attack.
TULE RIVER BASIN
The Tule River drains a fan-shaped 391-square-mile area above Lake Success east of Porterville. The drainage area extends from an altitude of 560 feet at the reservoir to 10,042 feet at the crest of Maggie Mountain on the Tule-Kern River basin drainage divide. The rela tion between drainage area and altitude in the Tule River basin above Lake Success is shown in figure 5. Only a very small part of the basin is above 9,000 feet altitude and was noncontributing during the 1966 flood. Steep slopes in the upper part of this basin cause rapid concen tration of runoff during all major storms. The basin is heavily tim bered above 5,000 feet altitude. Lower slopes are covered with brush and scrub timber. Valleys along the North Fork Tule and main Tule Rivers have large open cultivated fields.
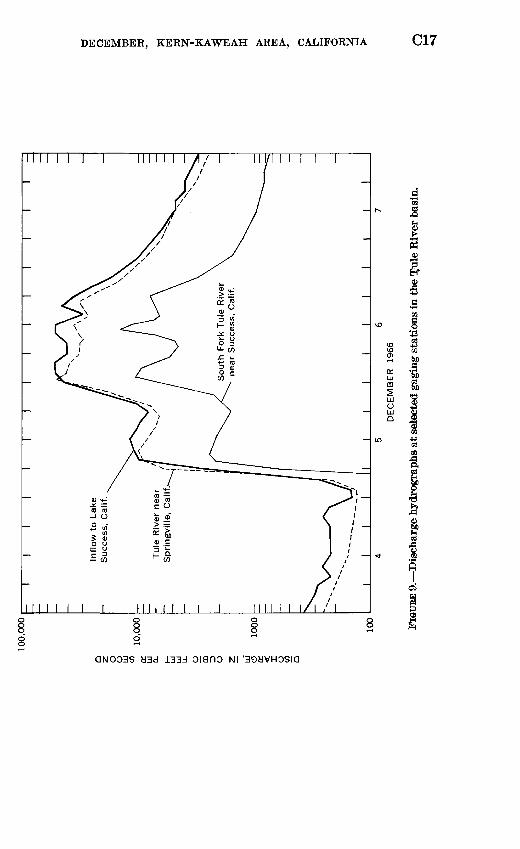
Records for the December 1966 flood are available from eight gag ing stations in the Tule River basin. Detailed hydrographs at three selected stations in the basin are shown for the period December 4-7 in figure 9. The December 1966 maximum flow of 49,600 cfs at the gag ing station on the Tule River near Springville (site 30) was the great est flood of record and more than double the previous record flow of 22,400 cfs in November 1950. Records at a former gage site inundated by Lake Success in 1961 show that the 1950 flood was the greatest dur ing the period of record, from 1901 to 1960. The December 1955 peak
DECEMBER, KERN-KAWEAH AREA, CALIFORNIA C17
III I
QNOO3S U3d 133J Nl
CIS FLOODS OF 1966 IN THE UNITED STATES
discharge was slightly less than that in 1950 and thus was the third highest recorded flood on the Tule Eiver. The December 1966 peak discharge of 14,300 cfs on the South Fork Tule Eiver near Success (site 31) was also more than double the previous record flow of 7,000 cfs in November 1950. The computed maximum bihourly inflow to Lake Success near Success (site 32) of 52,800 cfs on December 6 simi larly was 1.7 times the peak flow of 32,000 cfs in November 1950 at a former gaging station near the damsite. The 85,400 acre-feet of nomi nal storage capacity in Lake Success plus 16,000 acre-feet of flood sur charge storage were utilized by the Corps of Engineers to reduce the record-high inflow of December 1966 to a peak outflow of 9,050 cfs about 18 hours later.
Peak runoff of 430 cfs per square mile from a 39.3-square-mile area on the North Fork of Middle Fork Tule Eiver near Springville (site 27) was the highest in the Tule Eiver basin. Unit runoff exceeded 130 cfs per square mile throughout the basin.
Damage in the Tule Eiver basin was greatest along headwater stream channels, where all manmade structures suffered some degree of damage. The concrete bridge across North Fork Tule Eiver at Springville and two bridges across the Tule Eiver downstream from Springville were destroyed. Houses along the banks of the Tule Eiver at Springville were damaged severely by flooding. Many road culverts on normally small channels were destroyed when they were plugged or overflowed by the record runoff. On the Tule Eiver Indian Eeser- vation a 6-year-old boy died from exposure when he was isolated after a bridge washed out. Some flooding occurred in agricultural areas downstream from Lake Success during sustained release of flood- water December 6-11.
Gaging stations were heavily damaged, including total destruction of the station on the North Fork Tule Eiver at Springville (site 29) adjacent to the bridge that was destroyed. Downstream, the station on Tule Eiver near Springville survived the destruction of the bridge to which it was attached, but had to be rebuilt at a different site be cause of channel scour. Upstream, two low-flow gaging stations be longing to the Southern California Edison Co. were badly damaged.
KAWEAH RIVER BASIN
The Kaweah Eiver basin includes 560 square miles of forest, brush, and open areas above Lake Kaweah, the Corps of Engineers' flood- control and conservation reservoir east of Visalia. Headwater drain age extends up to an altitude of 12,634 feet at the summit of Triple Divide Peak on the Great Western Divide, which separates the Ka weah Eiver basin from the Kern Eiver basin to the east. Triple Divide Peak lies at the juncture with the Kings Eiver basin to the north. The
DECEMBER, KERN-KAWEAH AREA, CALIFORNIA C19
relation between drainage area and altitude in the Kaweah Eiver basin above Lake Kaweah is shown in figure 5.
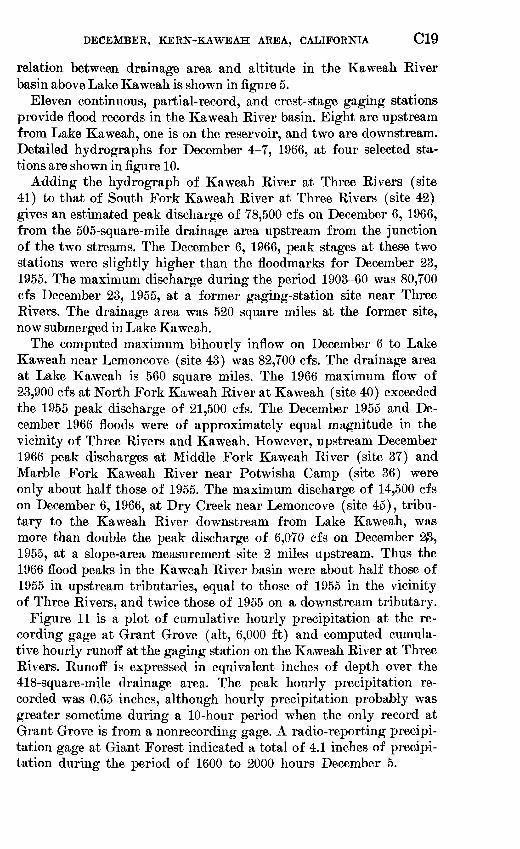
Eleven continuous, partial-record, and crest-stage gaging stations provide flood records in the Kaweah Eiver basin. Eight are upstream from Lake Kaweah, one is on the reservoir, and two are downstream. Detailed hydrographs for December 4-7, 1966, at four selected sta tions are shown in figure 10.
Adding the hydrograph of Kaweah Eiver at Three Eivers (site 41) to that of South Fork Kaweah Eiver at Three Eivers (site 42) gives an estimated peak discharge of 78,500 cfs on December 6, 1966, from the 505-square-mile drainage area upstream from the junction of the two streams. The December 6, 1966, peak stages at these two stations were slightly higher than the floodmarks for December 23, 1955. The maximum discharge during the period 1903-60 was 80,700 cfs December 23, 1955, at a former gaging-station site near Three Eivers. The drainage area was 520 square miles at the former site, now submerged in Lake Kaweah.
The computed maximum bihourly inflow on December 6 to Lake Kaweah near Lemoncove (site 43) was 82,700 cfs. The drainage area at Lake Kaweah is 560 square miles. The 1966 maximum flow of 23,900 cfs at North Fork Kaweah Eiver at Kaweah (site 40) exceeded the 1955 peak discharge of 21,500 cfs. The December 1955 and De cember 1966 floods were of approximately equal magnitude in the vicinity of Three Eivers and Kaweah. However, upstream December 1966 peak discharges at Middle Fork Kaweah Eiver (site 37) and Marble Fork Kaweah Eiver near Potwisha Camp (site 36) were only about half those of 1955. The maximum discharge of 14,500 cfs on December 6, 1966, at Dry Creek near Lemoncove (site 45), tribu tary to the Kaweah Eiver downstream from Lake Kaweah, was more than double the peak discharge of 6,070 cfs on December 23, 1955, at a slope-area measurement site 2 miles upstream. Thus the 1966 flood peaks in the Kaweah Eiver basin were about half those of 1955 in upstream tributaries, equal to those of 1955 in the vicinity of Three Eivers, and twice those of 1955 on a downstream tributary.
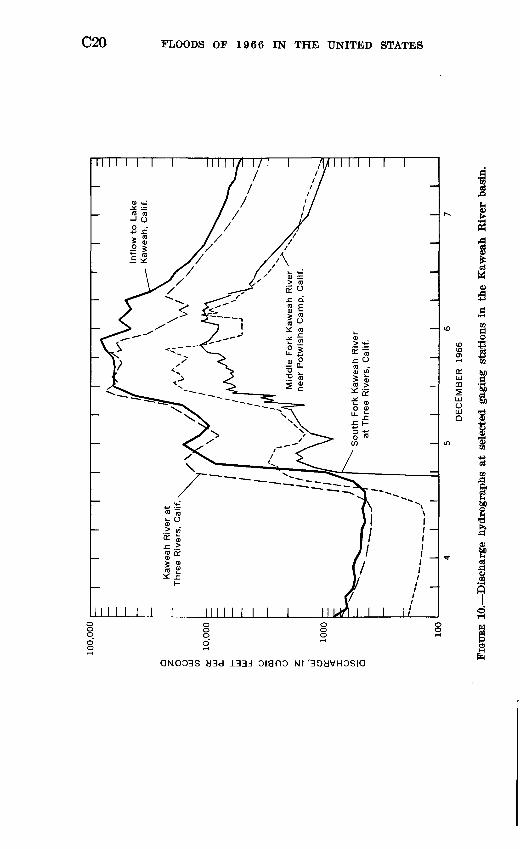
Figure 11 is a plot of cumulative hourly precipitation at the re cording gage at Grant Grove (alt, 6,000 ft) and computed cumula tive hourly runoff at the gaging station on the Kaweah Eiver at Three Eivers. Eunoff is expressed in equivalent inches of depth over the 418-square-mile drainage area. The peak hourly precipitation re corded was 0.65 inches, although hourly precipitation probably was greater sometime during a 10-hour period when the only record at Grant Grove is from a nonrecording gage. A radio-reporting precipi tation gage at Giant Forest indicated a total of 4.1 inches of precipi tation during the period of 1600 to 2000 hours December 5.
DISCHARGE, IN CUBIC FEET PER SECOND
I I II I II
am, NI 9961 £0 saoo'iioso
DECEMBER, KERN-KAWEAH AREA, CALIFORNIA
18
C21
16
14
12
10
Q.O 8
Cumulative hourly precipitation at Grant Grove
Estimated from daily total
-Peak hourly precipitation recorded, 0.65 inches at 2000 hours, December 5
Cumulative runoff, Kaweah River at Three Rivers
'Maximum = 73,000 cfs = 0.27 inches per hour at 2300 hours, December 5
4567 DECEMBER 1966
FIGURE 11. Cumulative precipitation or runoff in the Kaweah River basin.
414-459 O - 71 - 4
C22 FLOODS OF 1966 IN THE UNITED STATES
The maximum runoff rate of the Kaweah Eiver at Three Eivers was equivalent to 0.27 inches per hour at 2300 hours on December 5. Total runoff past this gaging station during December 1966 was equivalent to 7.59 inches. Total precipitation during December was 23.33 inches at Grant Grove. Assuming that Grant Grove precipi tation data are somewhat representative of the basin mean, then about two-thirds of the precipitation that fell in December remained in storage in the Kaweah Eiver basin as snow, ground water, and soil moisture. Evapotranspiration losses would be small during December.
MISCELLANEOUS BASINS
Available records indicate that the December 1966 flood was the greatest flood of record on most major streams within the Kern- Kaweah area. These include Poso Creek draining the area, west of the lower Kern Eiver basin, Deer Creek draining the area west of the Kern Eiver and south of the Tule Eiver, and Sand Creek draining the area west of the North Fork Kaweah Eiver. Peak runoff was less to the south on Caliente and Tehachapi Creeks, which were close to the south boundary of the intense storm precipitation. Poso Creek and White Eiver, which is a smaller stream in the western foothills between Poso Creek and Deer Creek, had lower peak discharges in December 1966 than the estimated maximums during the flood of March 9,1943.
The 10,000 cfs peak discharge on December 6, 1966, on Deer Creek near Terra Bella (site 26) was particularly destructive. The main road to California Hot Springs follows Deer Creek and crosses it at several locations. All bridges were destroyed or badly damaged. Downstream irrigation diversion structures were washed out and were further damaged by deposition of coarse sediment. The damage pattern on Deer Creek was very similar to that in the Kern and Tule Eiver headwater areas.
STORAGE REGULATION
Three reservoirs were operated by the Corps of Engineers to re duce floodflows and keep flood damage to comparatively low amounts downstream from the reservoirs. All inflow from the Kern Eiver basin was stored in Isabella Eeservoir during the critical peak run off period. No releases were made at Isabella Dam until December 17, except to Borel Canal for power generation. A peak discharge of 9,290 cfs on December 7 on the Kern Eiver near Bakersfield re sulted from tributary inflow below Isabella Dam. In contrast, the
DECEMBER, KERN-KAWEAH AREA, CALIFORNIA C23
computed peak bihourly inflow to Isabella Eeservoir was 96,900 cfs on December 6.
Lake Success filled rapidly during the record-high Tule River basin inflow December 5 and 6. Flow began over the spillway crest during the afternoon of December 6 and peaked at 8,260 cfs at 0400 hours December 7. Releases through Success Dam outlet works were manip ulated to obtain 6 feet of surcharge above the ungated spillway crest. This caused 16,000 acre-feet of surcharge storage and greatly reduced the rate of discharge to the lower Tule River. The combined flow through the outlet works and over the spillway reached a peak of 9,050 cfs. The computed peak bihourly inflow was 52,800 cfs (fig. 12).
Storage in Lake Kaweah was also regulated to provide maximum flow reduction downstream. At the time of the peak bihourly inflow of 82,700 cfs on December 6, floodflow from Dry Creek entering Kaweah River downstream from the reservoir filled all available channel capacity, and there was no significant release at Terminus Dam. As local flows receded, the release was stepped up to 5,740 cfs on December 8. Approximately 99 percent of the available reservoir space was utilized, but there was no spill at Terminus Dam.
FLOOD DAMAGE
The recordbreaking floodflows of December 1966 caused severe dam age in mountain and foothill areas. Parts of the communities of Kern- ville, Lamont, Springville, and Three Rivers adjacent to streams were damaged heavily by stream overflow, streambank erosion, and deposi tion of sediment and debris. Roads and bridges were hard hit, and some bridges were totally destroyed. Many smaller culverts and bridges were damaged to some degree from debris and overflows. Inun dation of downstream agricultural areas caused additional damage.
Storage in Isabella Reservoir, Lake Success, and Lake Kaweah reduced record inflows to near channel capacity downstream and pre vented catastrophic damage to Bakersfield, Porterville, Visalia, and smaller downstream cities. Data on the amount of flow reduction are given in the preceding section. Flood-damage prevention has been estimated by the U.S. Army Corps of Engineers (1967, p. A-24, A-16, A-12) as $51,300,000 downstream from Isabella Dam, $10,400,000 downstream from Success Dam, and $19,600,000 downstream from Terminus Dam. The benefit by operation of the three reservoirs thus was $81,300,000 in a single flood.
Actual flood damage was determined by the Corps of Engineers to have totalled $18,003,000. A detailed breakdown by type of damage is
DISCHARGE, IN THOUSANDS OF CUBIC FEET PER SECOND
"-1 l\3 CO £t OlO O O O O
1 'I ' I
DECEMBER, KERN-KAWEAH AREA, CALIFORNIA C25
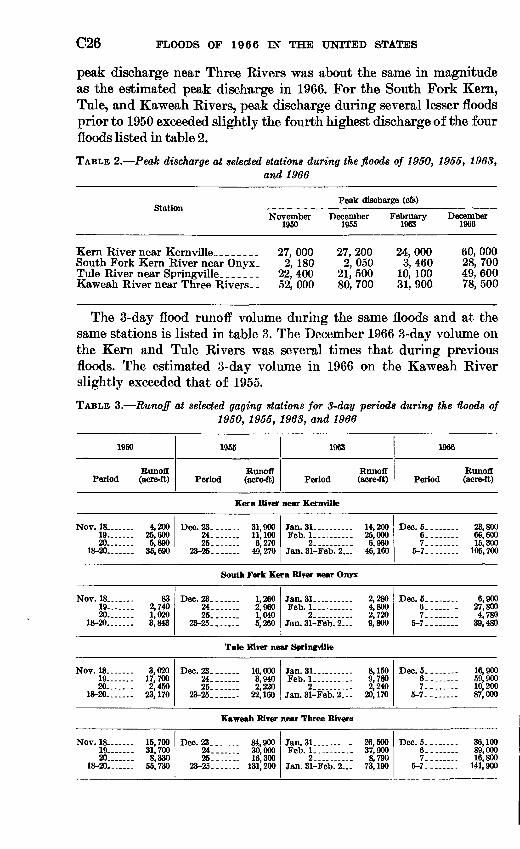
given in a report of the U.S. Army Corps of Engineers (1967) for the Kern-Tule-Kaweah area. The damage is summarized below:
Mountain and Stream basin foothill area Valley floor Total
Kern River__________________ $4,369,000 $271,000 $4,640,000Caliente Creek..______._..._____.___ 355,000 774,000 1,129,000PosoCreek.._________________ 83,000 1,215,000 1,298,000Tule River.________________________ 4,647,000 1,539,000 6,186,000Kaweah River._________________ 3,468,000 1,282,000 4,750,000
Total_____._____.______________ 12, 922, 000 5,081,000 18,003,000
The figure for flood damage in mountain and foothill areas include $4,457,000 damage to U.S. Forest Service and National Park Service facilities.
COMPARISON TO PREVIOUS FLOODS
Descriptions and streamflow data for floods of record in the Kern, Tule, and Kaweah River basins are found in Water-Supply Papers 843, 1137-F, 1260-D, 1650-A and B, and 1830-A. Historic floods of 1861-62,1867,1875,1879,1884,1890, and 1893 are discussed in Water- Supply Papers 843,1137-F, and 1650-A. No reliable estimates of flood discharge can be made for these earlier years. The information avail able indicates that the flood in December 1867 was the largest on all three streams, and the flood in January 1862 probably was the second highest, prior to 1900.
Streamflow records began in October 1893 on the Kern River, in May 1901 on the Tule River, and in May 1903 on the Kaweah River. Records are continuous since those dates. Gaging sites were moved upstream on the Tule River in November 1961 and on the Kaweah River in February 1962, when new reservoirs inundated former sites. The peak discharge of the Tule River near Springville has been es timated for the 1950 and 1955 floods on the basis of the ratio of the drainage area at the present site near Springville and that at the former site downstream near Porterville. The peak discharge of the Kaweah River during the 1963 and 1966 floods has been estimated at the former site near Three Rivers by the summation of flow at present gaging stations on the Kaweah River at Three Rivers (upstream from South Fork) and the South Fork Kaweah River at Three Rivers (near mouth). These estimates permit comparison of all major floods on the Tule and Kaweah Rivers since records began in 1901 and 1903, respectively.
Records indicate that the rain-produced floods of 1950, 1955, 1963, and 1966 were the greatest since streamflow records began in the Kern, Tule, and Kaweah River basins. The peak discharges during the four floods at principal long-term gaging stations on these rivers are listed in table 2. The December 1966 flood was by far the greatest in the Kern and Tule River basins. In the Kaweah River basin the December 1955
C26 FLOODS OF 1966 IN THE UNITED STATES
peak discharge near Three Rivers was about the same in magnitude as the estimated peak discharge in 1966. For the South Fork Kern, Tule, and Kaweah Rivers, peak discharge during several lesser floods prior to 1950 exceeded slightly the fourth highest discharge of the four floods listed in table 2.
TABLE 2. Peak dit at selected stations during the floods of 1950, 1955, 1963, and 1966
Station
Kern River near Kernville _______South Fork Kern River near Onyx. Tule River near Springville. _Kaweah River near Three Rivers. _
Peak discharge (cfs)
November I960
27, 000 2, 180
22, 400 52, 000
December 1955
27, 200 2,050
21,500 80, 700
February 1963
24,000 3,460
10, 100 31, 900
December 1966
60, 00028, 700 49, 600 78, 500
The 3-day flood runoff volume during the same floods and at the same stations is listed in table 3. The December 1966 3-day volume on the Kern and Tule Rivers was several times that during previous floods. The estimated 3-day volume in 1966 on the Kaweah River slightly exceeded that of 1955.
TABLE 3. Runoff at selected gaging stations for 3-day periods during the Hoods of 1950, 1955, 1963, and 1966
I960
Runoff Period (acre-ft)
1955
Runoff Period (acre-ft)
1963
Runoff Period (acre-ft)
1966
Runoff Period (acre-ft)
Kern River near Kernville
Nov. 18 19 ...20.......
18-20.......
4,20025,6005,89035,690
Dec. 23.......24.......25.......
23-25.......
31,90011,1006,270
49, 270
Feb. 1.. ..2. .........
14,20025,0006,96046,160
Dec. 5.....6.....7-....
5-7..-..
23,80066,60015,300
... 105,700
South Fork Kern River near Onyx
Nov. 18 19 20.....
18-20......
832,7401,0203,843
Dec. 23.....24.....25.....
23-25.....
1,260*> ofin1,0405,260
Feb. 1. ......2.. ........
2,2804,8002,7209,800
Dec. 5......6......7......
5-7-- .
6,90027,8004,780
39,480
Tule River near Springville
Nov. 18 19 20.. -.
18-20.......
3,02017,7002,450
23,170
Dec. 23.....24.-...25-....
23-25.....
- 16,0001 Qlf)2,220
.- 22,160
Feb. 1- 2.... ......
8,1509,7802,240
20,170
6-- .7-_
5-7--.-.
16,90059,90010,20087,000
Kaweah River near Three Rivers
Nov. 18.....19 20 .
18-20
.. 15,700
.. 31,7008,330
.. 55,730
Dec. 23... .24....25....
23-25....
81 (MYt30,000
... 16,300
... 131,200
Jan. 31.... -.--Feb. 1_. ...
2.. ........Jan. 31-Feb. 2...
26,50037,9008,790
73,190
6.- 7..--
5-7-.--
36,10089,00016,800
... 141,900
DECEMBER, KERN-KAWEAH AREA, CALIFORNIA C27
Comparison of the historic flood of December 1867 with that of December 1966 is possible at two locations. At the gaging station on the Kern River near Kernville drift, logs were found in 1938 that are believed to have been deposited during the peak of the flood of 1867; the logs were 13 feet above the peak stage of the flood of February 1937. The peak stage for the flood of 1966 was 10.3 feet higher than that of February 1937, but whether the peak discharge in 1867 was greater than that in 1966 is open to conjecture. In fact, the Kern River channel at the gage site was scoured considerably in 1966 and thus may have carried a greater floodflow at a given stage than in 1867; nevertheless, the peak discharges of 1867 and 1966 may have been approximately the same in the Kern River in the vicinity of Kernville.
At the former gaging station on the Kaweah River near Three Rivers the maximum stage of the December 1867 flood was about 22.7 feet, referred to the datum of the December 1955 flood, whose flood peak stage was 22.24 feet. As previously explained, the peak discharge of the December 1966 flood on the Kaweah River is estimated to have been about the same as that in December 1955, but the 3-day flood runoff was greater in 1966. Thus the 1867, 1955, and 1966 peak dis charges in the Kaweah River basin were about the same; however, the 1867 peak near Three Rivers probably was slightly greater than the peaks in 1955 and 1966.
FLOOD FREQUENCY
A method for determining the probable magnitude and return fre quency of floods for recurrence intervals between 1.2 and 50 years for streams in the flood area is presented by Young and Gruff (1967) in Water-Supply Paper 1686. On the basis of regional equations pre sented in that report, the recurrence interval for the December 1966 flood has been determined (table 4) for all gaging sites with 10 years or more of record, unregulated flow, and more than 10 square miles of drainage area. The procedure for computing flood magnitude given in Water-Supply Paper 1686 is not applicable at sites where the drainage area is less than 10 square miles.
A ratio of the 1966 peak discharge to the 50-year flood is given whenever the December 1966 flood exceeded the probable 50-year flood. Extension of calculated flood-frequency curves beyond 50 years is not recommended because of limitations of available flood records. Com parison of the peak discharge for a given flood with the probable 50-year flood provides an approximate measure of the severity of the flood. In general, gaging stations with a lower percentage of high- altitude drainage area had the larger ratios. The highest ratio deter mined was 3.5 for North Fork of Middle Fork Tule River near Springville (site 27).
C28 FLOODS OF 1966 IN THE UNITED STATES
Other methods may be used to analyze flood frequency including the uniform technique (log-Pearson type III) described in a U.S. Water Kesources Council report (1967). Use of other techniques could produce different recurrence intervals for peak discharges of Decem ber 1966 from those given in this report.
GEOMORPHIC EFFECTS IN THE KERN RIVER BASIN
By KEVIN M. SCOTT
Effects of the 1966 flood in the Kern Kiver drainage basin were impressive, not only in channels, which were radically modified, but on sparsely vegetated hillslopes as well. Overland flow clearly occurred over much of the basin, in spite of the fact that lower hillslopes are mantled by grus, a fragmental accumulation 'formed by weathering from granite and having a high infiltration capacity. Much of the basin is underlain by vast expanses of bare granitic rock, the effect of which was to increase the rapidity of runoff. Local rillwash and gulleying occurred on depositional surfaces, 'but rangeland was not extensively eroded because of the high infiltration capacity of grus.
Press reports of numerous large landslides in the area referred in large part to relatively small failures oif artificial slopes and roadcuts. Failures of natural slopes were rare because of the anisotropic nature of the bedrock and a thin soil cover rather than a lack of intensity of the storm. Small tributaries with steep gradients were locally the sites of mudflows which transported large volumes of forest debris and boulders to the main channels. The driver of a Corps of Engineers truck, attempting the first postflood traverse of the main Kern Kiver canyon, reported that he got 2^4 miles into the canyon when a mud slide sent rocks "as big as houses" onto the road in front of his vehicle.
Small tributaries were radically affected by the storm runoff. Most striking were the changes in channel configuration in the normally dry desert washes of the southeastern part of the Kern River drainage basin. Here the effects were those of a widespread desert thunder storm : overland flow, flashy runoff, widespread rill formation on depo sitional surfaces, and major changes in main channels. These effects are strikingly demonstrated in the Kelso Creek watershed, draining into the South Fork Kern River near Weldon. The main channel of Kelso Creek has been widened by lateral scour and now is bounded by nearly vertical cutbanks. The bed of the channel has undergone ap preciable fill, apparently continuously along its entire length. Fill was locally at least 12 feet deep, inundating a stunted growth of willows along the previous thalweg.
Fill at the site of a former stream-gaging station was about 8 feet deep, leaving only the recorder shelter protruding above the surface.
DECEMBER, KERN-KAWEAH AREA, CALIFORNIA C29
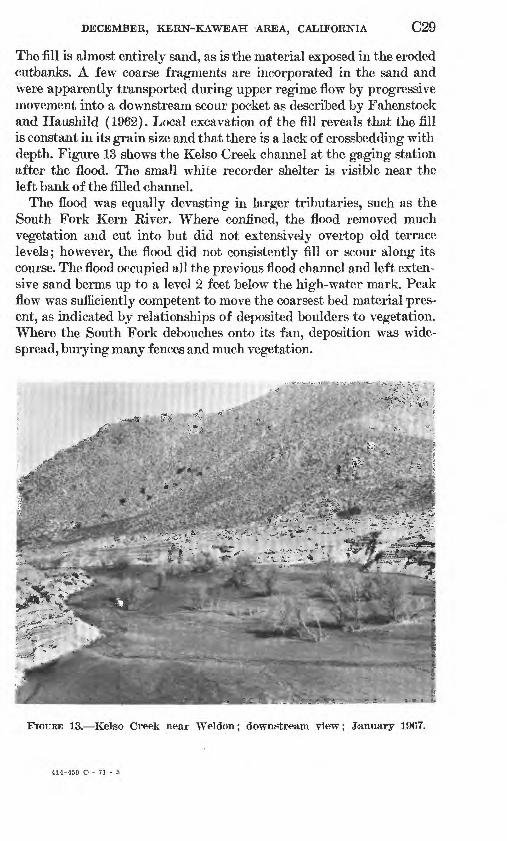
The fill is almost entirely sand, as is the material exposed in the eroded cutbanks. A few coarse fragments are incorporated in the sand and were apparently transported during upper regime flow by progressive movement into a downstream scour pocket as described by Fahenstock and Haushild (1962). Local excavation of the fill reveals that the fill is constant in its grain size and that there is a lack of crossbedding with depth. Figure 13 shows the Kelso Creek channel at the gaging station after the flood. The small white recorder shelter is visible near the left bank of the filled channel.
The flood was equally devasting in larger tributaries, such as the South Fork Kern River. Where confined, the flood removed much vegetation and cut into but did not extensively overtop old terrace levels; however, the flood did not consistently fill or scour along its course. The flood occupied all the previous flood channel and left exten sive sand berms up to a level 2 feet below the high-water mark. Peak flow was sufficiently competent to move the coarsest bed material pres ent, as indicated by relationships of deposited boulders to vegetation. Where the South Fork debouches onto its fan, deposition was wide spread, burying many fences and much vegetation.
._<*.
VJa
, -^^^:^mm.3^1.r -H^TT^ ^^y ^j^¥^: ! "
FIGURE 13. Kelso Greek near Weldon; downstream view; January 1967.
414-459 O - 71 - 5
C30 FLOODS OF 1966 IN THE UNITED STATES
Effects in the canyon df the main Kern River were similar to those in the South Fork drainage, but were of a larger scale. Flow depth was at least 25 feet over much of the flood route, and with a relatively high gradient, flow was sufficiently competent to move all material previ ously in the channel, including boulders 10-15 feet in intermediate diameter. The pool-and-riffle pattern was modified. Much vegetation was lost and transported to Lake Isabella; however, little timber of economic value was lost. The pool above a diversion dam on the main Kern River near Fairview was completely filled with flood detritus.
Boulder and timber "jams" were formed in both the Kern and South Fork Kern Rivers, similar in this respect to other floods of mountain rivers (Krumbein, 1942). Such deposits consist of an abrupt front composed of boulders and timber. In an upstream direction, material becomes progressively finer. The surface of the deposit has a lower gradient than that df the reach in which it occurs, and coarse material is commonly present on the surface as a lag deposit. The snouts of the jams apparently formed at channel constrictions or in areas of re duced competency and acted as dams for the finer material. The low- water channel then formed laterally to the jam. These deposits, with apparently random spacing, do not seem to be related to riffles, which show a characteristic spacing related to channel width.
No definite idea of the flood frequency can be obtained from the erosional and depositional effects relative to previous deposits. On the main Kern River, the flood locally overtopped a terrace level at 20-25 feet with mature Coulter pines. A second pronounced terrace level occurs at a level 40-45 feet above the main Kern River thalweg. Some trees in the main channel that were older than 200 years were destroyed by the flood. The relative magnitude of the flood on the South Fork Kern River was similar the flood locally overtopped a terrace 15-18 'feet above the stream thalweg.
SEDIMENTATION AND CHANNEL CHANGES
No direct measurements of fluvial sediment are available for the flood area. Hydrographers reported visibly high suspended-sediment load and very audible moving bedload at streamflow-measuring sta tions. Large areas of channel scour and fresh deposits of sand were evident in all streams after recession of floodflow.
Reconnaissance surveys by the U.S. Army Corps of Engineers, Sacramento District, indicate an accumulation of 2,550 acre-feet of sediment in headwater reaches of Lake Success on the Tule River be tween May 19'61 and November 1967. Depth df sediment was as great as 12 feet on the ranges surveyed. Surveys show that 2,500 acre-feet of sediment up to 25 feet deep was deposited between June 1962 and
DECEMBER, KERN-KAWEAH AREA, CALIFORNIA C31
November 1967 in the headwater reaches of Lake Kaweah on the Kaweah Eiver. These estimates do not include sediment deposits below the reservoir water levels at the time the surveys were made or the suspended sediment that passed through the reservoirs.
The sediment accumulation in Lake Success corresponds to an aver age annual rate of 1.1 acre-feet per square mile for the 1961-67 period and in Lake Kaweah to 0.9 acre-foot per square mile for 1962-67. These rates are about double the average annual sediment yields in this area, which are estimated to be less than 0.5 acre-foot per square mile. Much of the sediment in Lakes Success and Kaweah was deposited during the December 1966 flood, although part must have accumulated during the February 1963 and lesser floods.
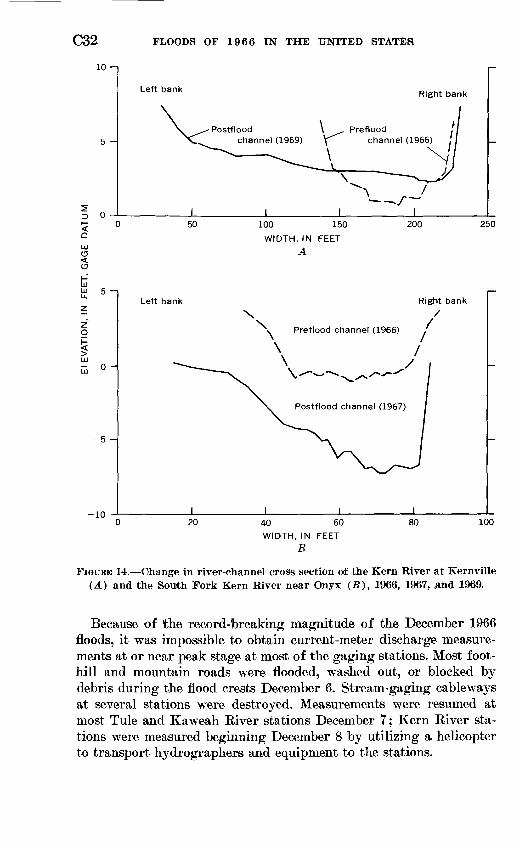
There is little documentation olf channel changes except at gaging- station cableways where stream cross sections are surveyed often dur ing streamflow measurements. The greatest changes measured were in the Kern River basin, where the 1966 peak flows were most in excess of previously recorded maximums. Channel cross sections before and after the flood are plotted for two gaging stations in figure 14. The cross section on the Kern River at Kernville was widened considerably when sand and other small alluvial material was scoured from the left bank for a considerable distance. The section on the South Fork Kern River near Onyx was enlarged greatly in both width and depth with a maximum scour over 5 feet deep. Part of this scour was induced by the total destruction of a concrete weir. Figure 15 shows the scoured left bank and streambed and the top of the tipped concrete recorder shelter and stilling well which stood at the left end of the concrete control section before the flood. The A-frame for the former gaging cableway upstream from the recorder installation was dropped about 4 feet vertically when the left bank was eroded.
DETERMINATION OF FLOOD DISCHARGES
The operation of a streamflow-measuriiig station consists princi pally of the measurement of stage and discharge and the definition of the stage-discharge relation from which discharge can be calculated for a given stage. The development of a stage-discharge relation is based upon current-meter discharge measurements throughout the range of stage experienced, or through a sufficient part of the range that the discharge corresponding to the maximum stage can be ob tained by a reasonable extension of the stage-discharge relation, or rating curve. Short extensions of a rating curve are usually made by logarithmic plotting, by velocity-area studies, or by use of other \ydraulic or hydrologic principles.
C32 FLOODS OF 1966 IN THE UNITED STATES
10 -
5 -
Left bankRight bank
50
LU 5 _.
Zo <UJ
d o H
100 150WIDTH,IN FEET
A
200 250
-5 -
-10
Left bank
20 40 60
WIDTH,IN FEET
B
80 100
FIGURE 14. 'Change in river-channel cross section of the Kern River at Kemville (A) and the South Fork Kern River near Onyx (B), 1966, 1967, and 1969.
Because of the record-breaking magnitude of the December 1966 floods, it was impossible to obtain current-meter discharge measure ments at or near peak stage at most of the gaging stations. Most foot hill and mountain roads were flooded, washed out, or blocked by debris during the flood crests December 6. Stream-gaging cableways at several stations were destroyed. Measurements were resumed at most Tule and Kaweah Eiver stations December 7; Kern Eiver sta tions were measured beginning December 8 by utilizing a helicopter to transport hydrographers and equipment to the stations.
'DECEMBER, KERN-KAWEAH AREA, CALIFORNIA C33
For most of the gaging stations at which no extremely high-water current-meter measurements were made, peak discharges were ob tained by slope-area measurements, computation of flow through culverts, contracted-opening measurements, critical-depth measure ments, and other types of indirect discharge measurements. These in direct measurements are based on channel geometry and high-water profiles obtained by field survey and are computed by use of proce dures and equations based on established hydraulic principles. They are indirect only in the sense that the data are collected subsequent to the passage of the peak discharge.
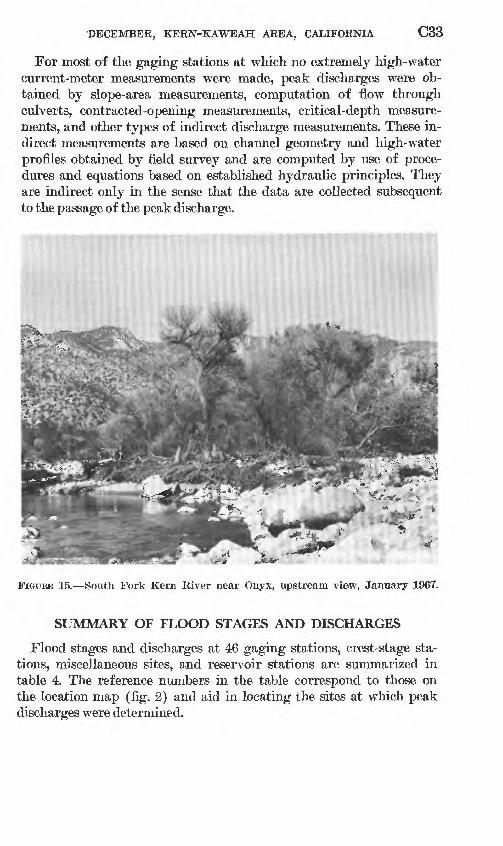
FIGURE 15. South Fork Kern River near Onyx, upstream view, January 1967.
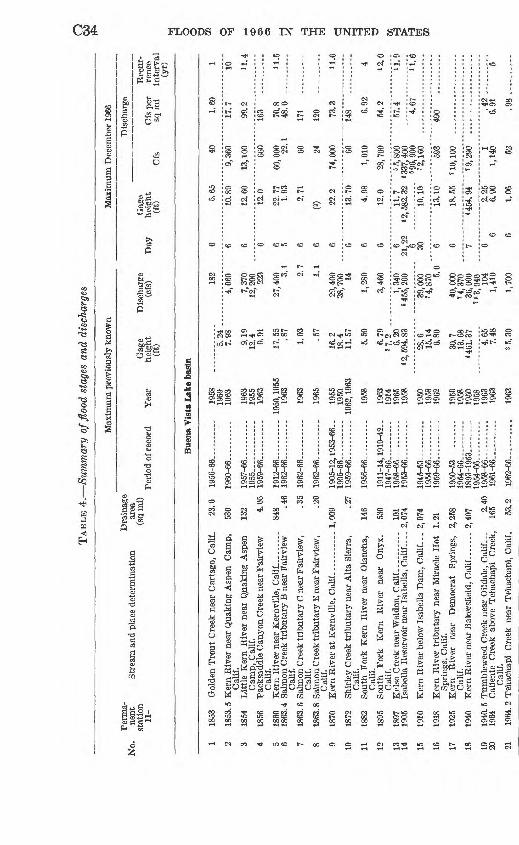
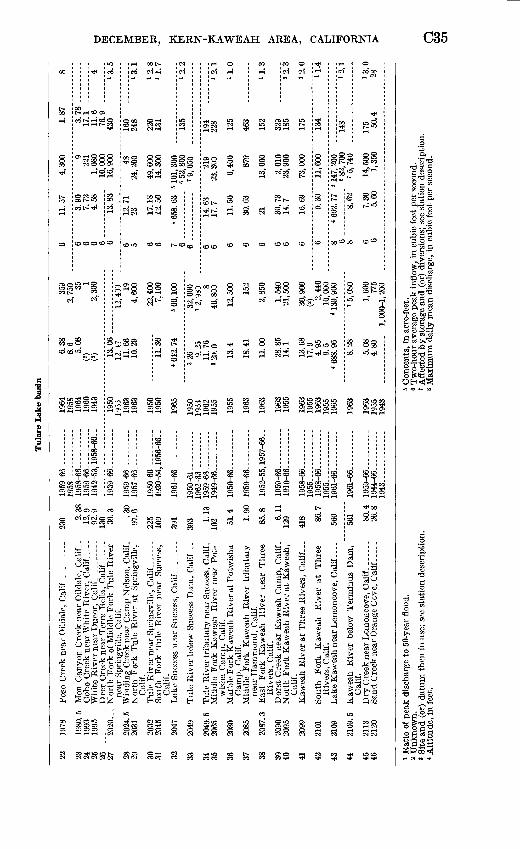
SUMMARY OF FLOOD STAGES AND DISCHARGES
Flood stages and discharges at 46 gaging stations, crest-stage sta tions, miscellaneous sites, and reservoir stations are summarized in table 4. The reference numbers in the table correspond to those on the location map (fig. 2) and aid in locating the sites at which peak discharges were determined.
TAB
LE 4
. S
umm
ary
of fl
ood
stag
es a
nd d
isch
arge
s
Max
imum
pre
viou
sly
know
n
No.
Perm
a-
Dra
inag
e ne
nt
Stre
am a
nd p
lace
det
erm
inat
ion
area
st
atio
n (s
q m
i)
11-
O
CO
.1^
Max
imum
Dec
embe
r 19
66
Dis
char
ge
Peri
od o
f rec
ord
Yea
rG
age
heig
ht
(ft)
Dis
char
ge
(cfs
)D
ayG
age
heig
ht
(ft)
Cfs
Rec
ur-
Cfs
per
re
nce
sq m
i in
terv
al
(yr)
Bue
na V
ista
Lak
e ba
sin
1 2 3 4 5 6 7 8 9 10
11
12 13
14 15
16
17
18 19
20 21
1853
G
olde
n T
rout
Cre
ek n
ear
Car
tago
, C
alif
.
1853
. 5 K
ern
Riv
er n
ear
Qua
king
Asp
en C
amp,
C
alif
. 18
54
Lit
tle
Ker
n R
iver
nea
r Q
uaki
ng A
spen
C
amp,
Cal
if.
1856
P
acks
addl
e C
anyo
n C
reek
nea
r F
airv
iew
C
alif
. 18
60
Ker
n R
iver
nea
r K
ernv
ille,
Cal
if _ . .
....
1863
. 4 S
alm
on C
reek
tri
buta
ry B
nea
r F
airv
iew
C
alif
. 18
63. 6
Sal
mon
Cre
ek tr
ibut
ary
C ne
ar F
airv
iew
, C
alif
. 18
63. 8
Sal
mon
Cre
ek tr
ibut
ary
E n
ear
Fair
view
, C
alif
. 18
70
Ker
n R
iver
at
Ker
nvill
e, C
alif
. ...
....
.
1872
Sh
irle
y C
reek
tri
buta
ry n
ear
Alt
a Si
erra
, C
alif
. 18
82
Sout
h F
ork
Ker
n R
iver
nea
r O
lanc
ha,
Cal
if.
1895
S
outh
F
ork
Ker
n R
iver
ne
ar
Ony
x,
Cal
if.
1897
K
elso
Cre
ek n
ear
Wel
don,
Cal
if. .
....
....
1905
Is
abel
la R
eser
voir
nea
r Is
abel
la,
Cal
if..
..
1910
K
ern
Riv
er b
elow
Isa
bella
Dam
, C
alif
...
1918
K
ern
Riv
er t
ribu
tary
nea
r M
irac
le H
ot
Spri
ngs,
Cal
if.
1925
K
ern
Riv
er
near
D
emoc
rat
Spri
ngs,
C
alif
.
1940
. 5 T
umbl
ewee
d C
reek
nea
r O
ildal
e, C
alif
...
1964
C
alie
nte
Cre
ek a
bove
Teh
acha
pi
Cre
ek,
Cal
if.
1964
. 2 T
ehac
hapi
Cre
ek n
ear
Teh
acha
pi,
Cal
if.
23.6
530
132 4.
05
848 .4
6
.35
.20
1,00
9 .27
146
530
101
2,07
4
2,07
4
1.21
2,25
8
2,40
7 2.40
16
5 53.2
1956
-66.
1960
-66.
---
-..
19
57
-66
1955
.... .
........
1959
-66.
- ........
19
12
-66
1962-6
6 .
1962-6
6 .
1962
-66.
... ......
1905
-12,
1953
-66-
19
05-6
6. ...
1959-6
6 .
19
56
-66
1911
-14,
1919
-42-
1
94
7-6
6 -
1958
-66-
.
1953-6
6 .
1945
-53-
..
1954
-66.
. .... .
...
19
59
-66
1950
-53.
1954
-66_
___ ...
1893
-195
3- .
1954-6
6
1958
-66.
1961
-66.
.
19
62
-66
.
.
1958
19
59
1963
1963
19
55
1963
1950
, 195
5 19
63
1963
1965
1955
19
50
1962
, 196
3
1958
1963
19
14
1965
19
58
1950
19
58
1962
1950
19
58
1950
19
58
1963
19
63
1963
5.24
..
7.98
9.19
12
.4
9.91
17.5
5.8
7
1.03 .57
16.2
18
.4
11.5
7
5.50
6.79
37.2
..
6.20
42
,594
.83
28.6
15
.14
6.80
30.7
13
.68
4461
.37
4.65
7.48
35.3
0
182
4,06
0
7,37
0 12
, 200
22
3
27,4
00 3.1
2.7
1.1
29,4
00
38,7
00
14
1,28
0
3,46
0
1,34
0 84
55,2
00
39,0
00
7 4, 8
70 5.0
40,0
00
74,3
70
36,0
00
783,
940
104
1,41
0
1.70
0
6 6 6 6 6 5 6 6 6 6 6 6 6 21
,22
6 30 6 6 7 6 6 6
5.65
10.8
9
12.6
0
12.0
22.7
7 1.
93
2.71
22.2
13.7
0
4.98
12.0
11.7
42
,582
.32
10.1
0
13.1
0
18.5
5
4454
.94
2.25
6.
90
1.06
40
9,36
0
13,1
00 660
60,0
00
22.1
60
24
74,0
00 60
1,01
0
28,7
00
85,8
00
s 337
, 400
« 9
6, 9
00
72,1
60 593
7 10,
100
.
1 1,
140 52
1.69
1
17. 7
10
99.2
11
.4
163
....
....
..
70.8
11
.5
48.0
..
....
....
171
..... ..
. ._
ion 73
.3
11.6
148
. ....
6.92
4
54. 2
1 2
. 0
57. 4
1 1
. 9
4. 6
7 1 1
. 6
490
....
....
..
426.
91
5
.98
....
....
..
FLOODS
OF
1966
IN
THE
UNITED
STATES
Tul
are
Lak
e ba
sin
22 23 24 25 26 27 28 29 30 31
32 .S3 34 35 36 37 38 40 41 42 43 44 45 46
1978
1980
. 5
1993
1995
2024
.520
31
2032
2045
2047
2049
2049
520
65
2080
2085
2087
. 3
2090
2095
2099
2101
2109
. 5
2113
2120
Pos
o C
reek
nea
r O
ilda
le,
Cal
if. .
_._
Whi
te R
iver
nea
r D
ucor
, C
alif
.. -
----
-
Cal
if.
Sout
h F
ork
Tul
e R
iver
nea
r Su
cces
s,
Cal
if.
wis
ha C
amp,
Cal
if.
Cam
p, C
alif
.
near
Ila
mm
ond,
Cal
if.
Eas
t F
ork
Kaw
eah
Riv
er n
ear
Thr
ee
Riv
ers,
Cal
if.
Cal
if.
Cal
if.
230 2.
3812
.992
.913
0 39.3 .3
097
.6
225
109
391
393
102 51
.4
1 90
85.8
6.11
129
418 86
.7
560
561 80
.426
.8
1959
-66-
.. ..
....
.19
58-
19
58
-66
1959
-66
1942
-53,
1958
-66-
19
59
-66
-
1957
-66.
1950-6
6 -
1930
-54,
1956
-66-
1961
-66.
--_- --
19
50
-61
..
.
1962
-53 -----.
1959
-65
1949
-66-
19
50
-66
-
1952
-55,
1957
-66.
.
19
59
-66
1
91
0-6
6 -
1958-6
6
1958-6
6
1955
-
1961
-66
19
61
-66
19
59
-66
19
44
-66
1943...-
---
---
1964
1958
1964
1960
1943
1950
1963
1963
1950
1950
1965
1950
193}
1955
1955
1963
1963
1963
1955
1963
1955
1963
1955
1965
1963
1963
1955
1943
6.38
8.6
5.08
(2) 13
.06
.12
. 17
11.6
610
.29
11.3
6
* 6i
2. 7
4
326 9.
2511
.76
3 29
. 0
13.4
18.4
1
11.0
0
28.8
514
.1
13.6
817
.94.
959.
546
88.9
6
8.28
5.08
4.80
359
2,75
0 ..
35 12,
300
12,4
03
..19
4,60
0
22,4
007,
100
« 66
, 100
32, 0
00'2
,93
3
...
46, 8
00
12, 5
00 152
2,85
0
1,54
021
,500
30, 9
00
2,44
010
, 000
- .
» 13
9 90
0'
7 5,
080
1,60
077
51,
000-
1,20
0 _.
6 6 6 6 6 -.
6 6 5 6 6 6 ..
6 ...
6 6 6 6 6 6 6 6 6 8 6 .
8 6 6
11.5
7
3.90
7.72
4.58
13.8
3
12.7
123 17
.18
12.5
0
« 65
8. 6
3
14.6
317
.7
11.5
0
30.6
3
21
30.7
314
.7
16.6
9
9.30
8.62
7.30
5.60
4,30
0 922
11,
080
10, 0
0016
, 900 48
24,2
00
49,6
0014
, 300
5 10
1, 3
008
52, 8
007
9, 0
50
.
219
23, 3
00
6,40
0
879
13,0
00
2,01
023
,900
73,0
00
11,6
00
5 14
7, 2
00.
682,
700
7 5,
740
14, 5
001,
350
1.87
3.78
...
17.1
...
11.6
76.9
...
430
160
248
220
131
135
194
228
125
463
152
329
185
175
134
148
175 50
.4
8 4
13.5
13.1
12.8
11.7
12.2
12.1
11
.0
11.3
12
.3
12.0
11.4
12.1
13.0
28
O s to
M W W i W 5i M > w w o h- 1 O ^
1 R
atio
of
peak
dis
char
ge t
o 50
-yea
r fl
ood.
2 U
nkno
wn.
* Si
te a
nd (
or)
datu
m t
hen
In u
se;
see
stat
ion
desc
ript
ion.
4 Alt
itud
e, i
n fe
et.
* C
onte
nts,
in
acre
-fee
t.6 T
wo-
hour
ave
rage
pea
k in
flow
, in
cubi
c fe
et p
er s
econ
d.7 A
ffec
ted
by s
tora
ge a
nd (
or)
dive
rsio
ns;
see
stat
ion
desc
ript
ion.
8 Max
imum
dai
ly m
ean
disc
harg
e, i
n cu
bic
feet
per
sec
ond.
C36 FLOODS OF 1966 IN THE UNITED STATES
The derivation of the peak data is explained in the station descrip tion for each site. The peak discharges in table 4 are those actually determined; that is, no adjustments for upstream storage have been made for stations downstream from reservoirs. For reservoir sta tions the peak stage, contents, and computed peak bihourly inflow are given.
Explanation of data in the 13 columns of table 4 follows:Number. The number by which each station is referenced in this
report. The numerical order follows the Geological Survey's stand ard downstream order for listing stations.
Permanent station number. The number used in the Geological Survey's Water-Supply Papers of surface-water supply in the United States and the annual surface-water basic-data reports for California.
Stream and place of determination. The permanent name adopted for the site to which the listed data apply; each name is unique.
Drainage area. The gross drainage area, in square miles, above the station site as determined by the topography.
The last nine columns of the table give data for all known floods at the site:
Period of record. The period of known floods prior to December 1966.
Tear. The calendar year of the maximum discharge known prior to December 1966.
Day. The date of the peak discharge or stage during the flood of December 1966.
Gage height and discharge. Data in each pair of columns are as sociated with the year or day in the preceding column. The 1966 peak discharge is also expressed in cubic feet per second per square mile of drainage area.
Recurrence interval. The average interval of time in which the peak discharge of December 1966 can be expected to be exceeded once. When the recurrence interval is greater than 50 years, the ratio of the peak discharge to the discharge of the 50-year flood is shown.
EXPLANATION OF STATION DATA
Detailed information on stage and discharge during the floods of December 1966 are given in the following section. Many of the data are in addition to records published in annual streamflow reports of the Geological Survey. The data consist of descriptions of the sta tions or sites, tables of daily discharge at gaging stations for Decem ber 1966, and tables of stages and discharges at indicated times for many of the gaging stations.
DECEMBER, KERN-KAWEAH AREA, CALIFORNIA C37
The station description gives information relative to the location of the gage, size of drainage area above the gage, nature of the gage- height record obtained during the period covered by this report, datum of gage, definition of the stage-discharge relation, peak stage and discharge during the December 1966 floods and previous maxi mum of record, maximum data for floods outside the period of record, effect of regulation and diversion, and other pertinent general information.
The table of daily mean discharge gives data for the month of De cember 1966 to show discharges during antecedent and recession periods. The monthly figures of the table show the monthly mean dis charge, in cubic feet per second; the volume of monthly runoff, in acre-feet; and the volume of monthly runoff, in inches, at selected sta tions. Monthly figures for a few stations downstream from a reservoir have been adjusted for change in contents of the reservoir.
The table of stages and discharges at indicated times gives sufficient data so that hydrographs of stage and discharge can be drawn. The period of time covered is from prior to the start of the major rise to an arbitrary cutoff point on the recession and is not the same for all sta tions. The stages and associated discharges given should not be used to prepare a stage-discharge relation (rating curve) for use outside the flood period. For many stations the relation used to compute the discharge was shifted from the basic rating for various reasons, such as backwater from debris blockage or other changes in control condition.
SELECTED REFERENCES
Fahnestock, R. K., and Haushild, W. L., 1962, Flume studies of the transport of pebbles and cobbles on a sand bed: Geol. Soc. Am. Bull. v. 73, p. 1431-1436.
Hofmann, Walter, and Rantz, S. E., 1963, Description, pt. 1 of Floods of Decem ber 1955-January 1956 in the Far Western States: U.S. Geol. Survey Water- Supply Paper 1650-A, 156 p.
1963, Streamflow data, pt. 2 of Floods of December 1955-January 1956 in the Far Western States: U.S. Geol. Survey Water-Supply Paper 1650-B, 580 p.
Krumbein, W. C., 1942, Flood deposits of Arroyo Seco, Los Angeles County, California: Geol. Soc. Am. Bull. v. 53, p. 1355-1402.
McGlashan, H. D., and Briggs, R. C., 1939, Floods of December 1937 in northern California: U.S. Geol. Survey Water-Supply Paper 843, 497 p.
Rantz, S. E., !and Stafford, H. M., 1956, Floods of 1952 in California: U.S. Geol. Survey Water-Supply Paper 1260-D, p. 531-575.
U.S. Army Corps of Engineers, 1967, Report on floods, Central Valley of Cali fornia, 1966-67 flood season: Sacramento District. 44 p.
U.S. Weather Bureau, 1967, Climatological data : v. 70, no. 12, p. 379-420.U.S. Geological Survey, 1953, Floods of November-December 1950 in the Central
Valley basin, California. U.S. Geol. Survey Water-Supply Paper 1137-F, p. 505-789.
C38 FLOODS OF 1966 IN THE UNITED STATES
U.S. Water Resources Council, 1967, A uniform technique for determining flaodflow frequencies: U.S. Water Resources Council Bull. no. 15.
Young, L. E., and Gruff, R. W., 1967, Magnitude and frequency of floods in the United States, Part 11, Pacific slope basins in California, Volume 2, Klamath and Smith River basins and Central Valley drainage from the east: U.S. Geol. Survey Water-Supply Paper 1686, 308 p.
Young, L. E., and Harris, E. E., 1966, Floods of January-February 1963 in California and Nevada: U.S. Geol. Survey Water-Supply Paper 1830-A, 472 p.
STATION DATA
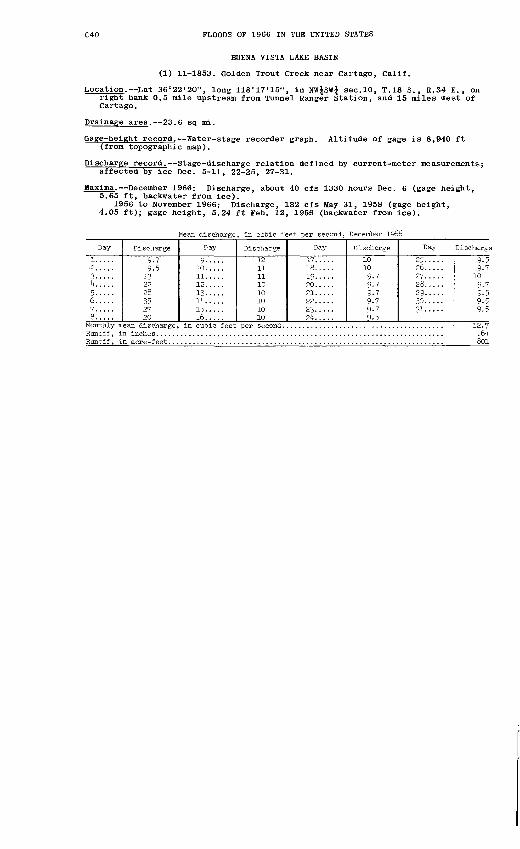
C40 FLOODS OF 1966 IN THE UNITED STATES
BUENA VISTA LAKE BASIN
(1) 11-1853. Golden Trout Creek near Cartago, Calif.
Location. Lat 36°22'20", long 118°17'15", in NW^SWj sec.10, T.18 S. , R.34 E. , on right bank 0.5 mile upstream from Tunnel Ranger Station, and 15 miles west of Cartago.
Drainage area. 23.6 sq mi.
Gage-height record. Water-stage recorder graph. Altitude of gage is 8,940 ft (from topographic map).
Discharge record. Stage-discharge relation defined by current-meter measurements; affected by ice Dec. 5-11, 22-25, 27-31.
Maxima. December 1966: Discharge, about 40 cfs 1330 hours Dec. 6 (gage height, 5.65 ft, backwater from ice).
1956 to November 1966: Discharge, 182 cfs May 31, 1958 (gage height, 4.05 ft); gage height, 5.24 ft Feb. 12, 1959 (backwater from ice).
Mean discharge, in cubic feet per second, December 1966
Day
1..... 2... . .3-....k..... }.....6.....7.....&.....
Runoff, i
Discharge
9-79-5
132228352720
n acre-feet. . .
Day
9.....10 .....11. ....12.....13.....Ut.....15.....16.....
Discharge
1211111010101010
Day
17. ....18.....19.....20.....21.. ...22.....23.. ...2k.....
Discharge
10109-79-79-79-79-79.5
Day
25.....26.....27.....28.....29-....30.....31.....
Discharge
9-59.7
109.79.59-59.5
12.7.6k801
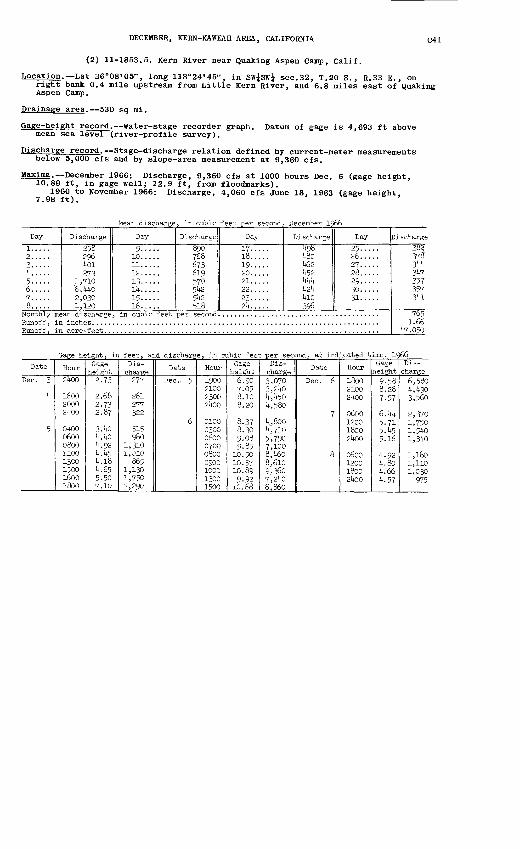
DECEMBER, KERN-KAWEAH AREA, CALIFORNIA C41
(2) 11-1853.5. Kern River near Quaking Aspen Camp, Calif.
Location. Lat 36°08'05", long 118 0 24'45", in SW^SWj sec.32, T.20 S. , R.33 E., onright bank 0.4 mile upstream from Little Kern River, and 6.8 miles east of Quaking Aspen Camp.
Drainage area. 530 sq mi.
Gage-height record. Water-stage recorder graph. Datum of gage is 4,693 ft above mean sea level (river-profile survey).
Discharge record. Stage-discharge relation defined by current-meter measurements below 5,000 cfs and by slope-area measurement at 9,360 cfs.
Maxima. December 1966: Discharge, 9,360 cfs at 1000 hours Dec. 6 (gage height. 10.89 ft, in gage well; 12.9 ft, from floodmarks).
1960 to November 1966: Discharge, 4.060 cfs June 18. 1963 (gage height, 7.98 ft). '
Mean discharge, in cubic feet per second, December
Day
1.....2.....3.....It.....5.....6.....7.....8.....
Discharge
258296itoi273
1,7106,kkO2,0301,120
Day
9.....10.....11. ....12 .....13.....lit. ....15-....16.....
Discharge
8907686736195705lt251*2518
Day
17.....18. ....19-....20. ....21.....22. ....23.....2k.....
Discharge1*98It801*621*521*1*1*k2k1*10396
Day
25.....26.....27.....28.....29.....30.....31. ....
Runoff, in acre-feet. ...................................................................
Discharge3«33783kk31*735735731*1
1.661*7,050
Gage height, in feet, and discharge, in cubic feet per second, at indicated time,
Date
Dec. 3
1*
5
Hour
2UOO
1600200021*00
04000600080011001300150016001800
Gage height
2.73
2.682.732.87
3.1*0k.ko1*.92l*.l*5it. 18it. 655-507.10
Dis charge
277
261277322
515980
1,3101,010
8651,1301,7503,290
Date
Dec.. 5
6
Hour
1900210023002ltOO
010003000600070008000900100013001500
Gage height
6.QO7-058.108.20
8.378.309.089.85
10.5010.5710.899-92
10.68
Dis charge3,0703,21(0It, 1(50It, 580
kj,800It, 7105,7907,1008,it608,6109,3607,2kO8,860
Date
Dec. 6
7
8
Hour
1800210021+00
0600120018002UOO
0600120018002UOO
Gage height
9-588.287-57
6.kk5-715A55-16
it. 92it. 80it. 66it. 57
Dis charge
6,580it, It 903,560
2,3701,750l,5itO1,31*0
1,1801,1101,030
975
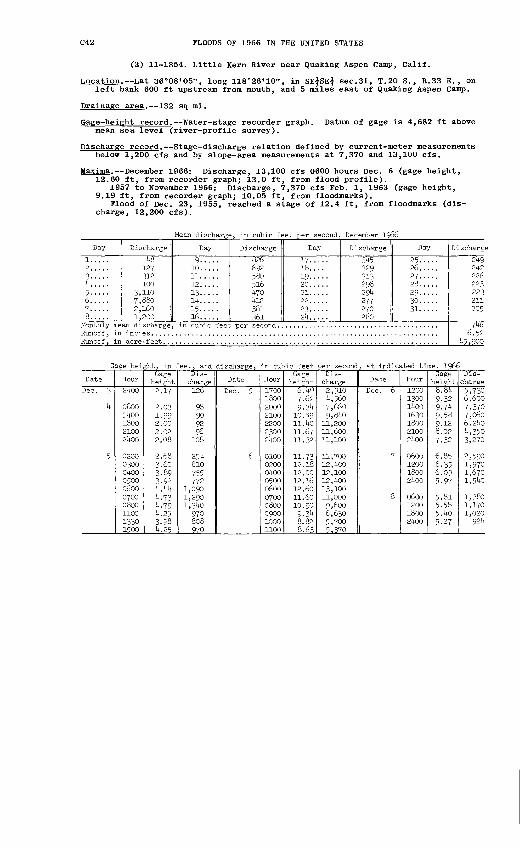
C42 FLOODS OF 1966 IN THE UNITED STATES
(3) 11-1854. Little Kern River near Quaking Aspen Camp, Calif.
Location. Lat 36 G 08'05", long 118°26'10", in SE^SEj sec.31, T.2O S., R.33 E., on left bank 600 ft upstream from mouth, and 5 miles east of Quaking Aspen Camp.
Drainage area. 132 sq mi.
Gage-height record. Water-stage recorder graph. Datum of gage is 4,682 ft above mean sea level (river-profile survey).
Discharge record. Stage-discharge relation defined by current-meter measurements below 1,200 cfs and by slope-area measurements at 7,370 and 13,100 cfs.
Maxima. December 1966: Discharge, 13,100 cfs 0600 hours Dec. 6 (gage height, 12.60 ft, from recorder graph; 13.0 ft, from flood profile).
1957 to November 1966: Discharge, 7,370 cfs Feb. 1, 1963 (gage height, 9.19 ft, from recorder graph; 10.05 ft, from floodmarks).
Flood of Dec. 23, 1955, reached a stage of 12.4 ft, from floodmarks (dis charge, 12,200 cfs).
Mean discharge, in cubic feet per second, December 1966
Discharge Day
826
516 4?0 412 381 361
Monthly Runoff, Runoff,
mean discharge, in cubic feet per second. in inches. ...............................in acre-feet .............................
7466.52
^5,900
ge height, in feet, and discharge, in cubic feet per second, at indicated time. 1966
HourGage
heightDis charge
Gage height
Dis charge Date Hour height charge
2400
08001400180021002400
0200030004000500060007000800110013301500
2.17 1200130014001630180021002400
120018002400
0600120018002400
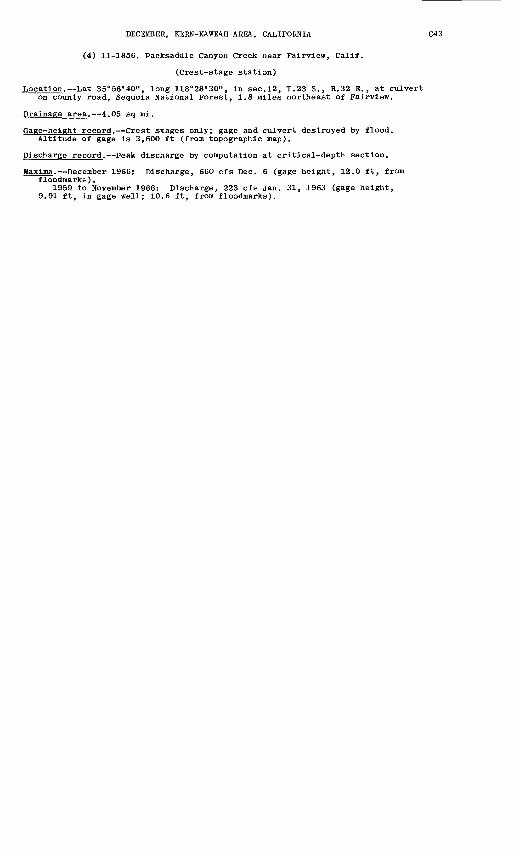
DECEMBER, KERN-KAWEAH AREA, CALIFORNIA
(4) 11-1856. Packsaddle Canyon Creek near Fairview, Calif.
(Crest-stage station)
Location. Lat 35°56'40", long 118 0 28'30", in sec.12, T.23 S. , R.32 E., at culvert on county road, Sequoia National Forest, 1.8 miles northeast of Fairview.
Drainage area. 4.05 sq mi.
Gage-height record. Crest stages only; gage and culvert destroyed by flood. Altitude of gage is 3,600 ft (from topographic map).
Discharge record. Peak discharge by computation at critical-depth section.
Maxima. December 1966: Discharge, 660 cfs Dec. 6 (gage height, 12.0 ft, from floodmarks).
1959 to November 1966: Discharge, 223 cfs Jan. 31, 1963 (gage height, 9.91 ft, in gage well; 10.6 ft, from floodmarks).
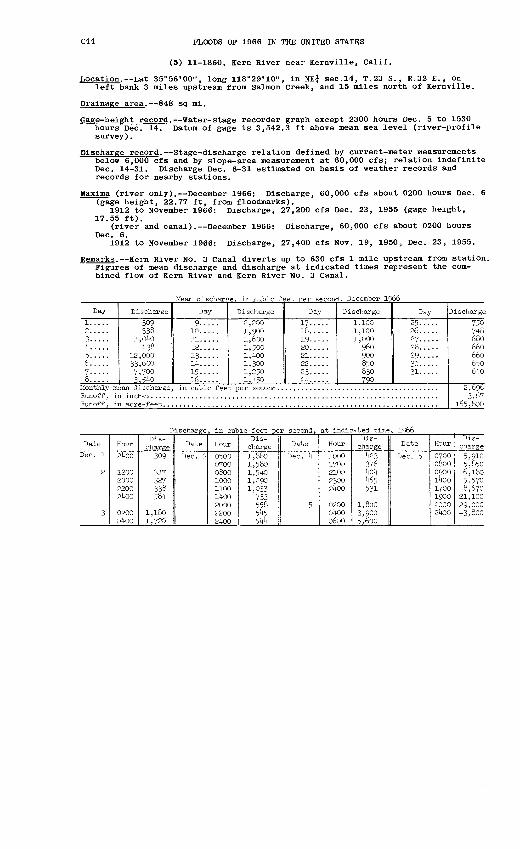
C44 FLOODS OF 1966 IN THE UNITED STATES
(5) 11-1860. Kern River near Kernville, Calif.
Location. Lat 35°56'00", long 118°29'10", in NE$ sec.14, T.23 S., R.32 E., on left bank 3 miles upstream from Salmon Creek, and 15 miles north of Kernville.
Drainage area. 848 sq mi.
Gage-height record. Water-stage recorder graph except 2300 hours Dec. 5 to 1530 hours Dec. 14. Datum of gage is 3,542.3 ft above mean sea level (river-profile survey).
Discharge record. Stage-discharge relation defined by current-meter measurements below 6,000 cfs and by slope-area measurement at 60,000 cfs; relation indefinite Dec. 14-31. Discharge Dec. 6-31 estimated on basis of weather records and records for nearby stations.
Maxima (river only). December 1966: Discharge, 60,000 cfs about 0200 hours Dec. 6 (gage height, 22.77 ft, from floodmarks).
1912 to November 1966; Discharge, 27,200 cfs Dec. 23, 1955 (gage height, 17.55 ft).
(river and canal). December 1966: Discharge, 60,000 cfs about 0200 hours Dec. 6.
1912 to November 1966: Discharge, 27,400 cfs Nov. 19, 1950, Dec. 23, 1955.
Remarks. Kern River No. 3 Canal diverts up to 630 cfs 1 mile upstream from station. Figures of mean discharge and discharge at indicated times represent the com bined flow of Kern River and Kern River No. 3 Canal.
Mean discharge, in .cubic feet per second. December 1966
Discharge Day Discharge Day Discharge Discharge
1,1001,1001,000
750
650
Discharge, in cubic feet per second, at indicated time. 1066
Hour Hour DateDis
charge2400
120020002200
0200ohoo
309 0500070008001000 1100 1^00 2000 2200 2kOO
1000170021002300
Dec. 5
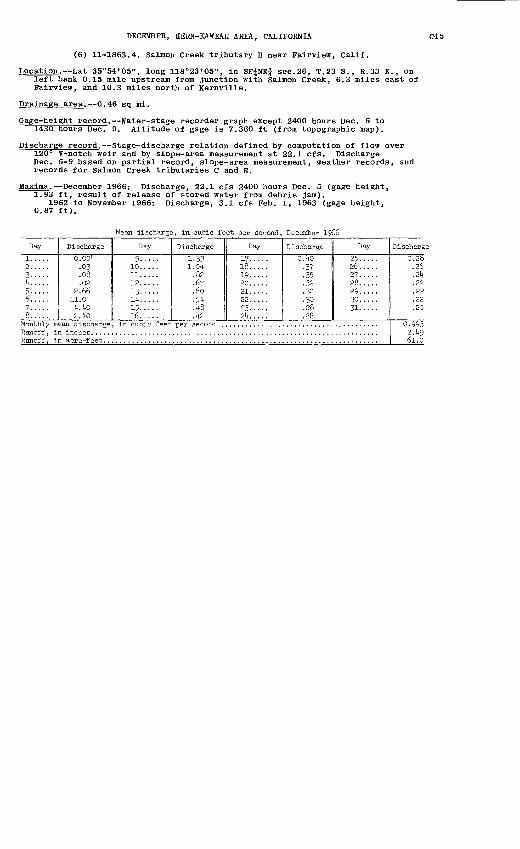
DECEMBER, KERN-KAWEAH AREA, CALIFORNIA
(6) 11-1863.4. Salmon Creek tributary B near Fairview, Calif.
Location. Lat 35°54'05", long 118°23'05", in SEjNEj sec.26, T.23 S., R.33 E., on left bank 0.15 mile upstream from junction with Salmon Creek, 6.3 miles east of Fairview, and 10.3 miles north of Kernville.
Drainage area. 0.46 sq mi.
Gage-height record. Water-stage recorder graph except 2400 hours Dec. 5 to 1430 hours Dec. 9. Altitude of gage is 7.360 ft (from topographic map).
Discharge record. Stage-discharge relation defined by computation of flow over 120° V-notch weir and by slope-area measurement at 22.1 cfs. Discharge Dec. 5-9 based on partial record, slope-area measurement, weather records, and records for Salmon Creek tributaries C and E.
Maxima. December 1966: Discharge, 22.1 cfs 2400 hours Dec. 5 (gage height, 1.93 ft, result of release of stored water from debris Jam).
1962 to November 1966: Discharge, 3.1 cfs Feb. 1, 1963 (gage height, 0.87 ft).
Mean discharge, in cubic feet per second, December 1966
Day Discharge Day Discharge
0.00^ .03
Monthly mean discharge, in cubic feet per second. Runoff, in inche s................................Runoff, in acre-feet.............................
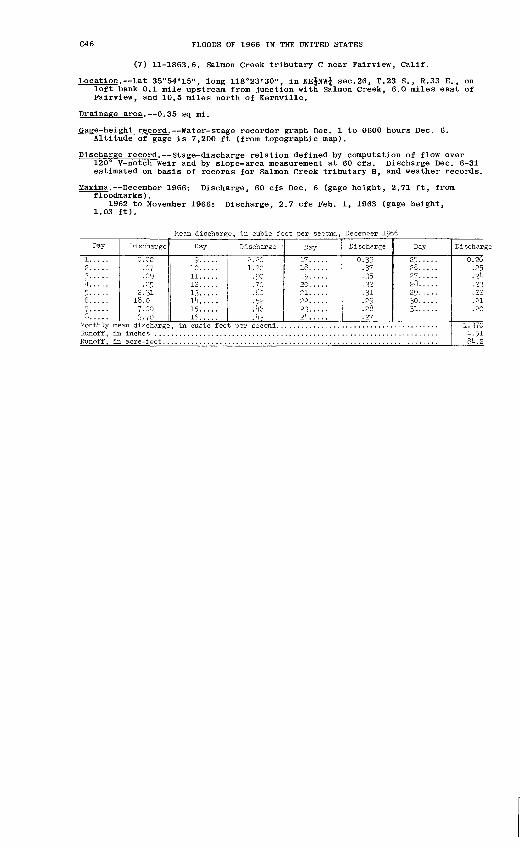
C46 FLOODS OF 1966 IN THE UNITED STATES
(7) 11-1863.6. Salmon Creek tributary C near Fairview, Calif.
Location. Lat 35°54'15", long 118°23'30", in NE^NWj sec.26, T.23 S., R.33 E., on left bank 0.1 mile upstream from junction with Salmon Creek, 6.0 miles east of Fairview, and 10.5 miles north of Kernville.
Drainage area. 0.35 sq mi.
_Gage-height record. Water-stage recorder graph Dec. 1 to 0600 hours Dec. 6. Altitude of gage is 7,200 ft (from topographic map).
Discharge record. Stage-discharge relation defined by computation of flow over 120 V-notch~weir and by slope-area measurement at 60 cfs. Discharge Dec. 6-31 estimated on basis of records for Salmon Creek tributary B, and weather records.
Maxima. December 1966: Discharge, 60 cfs Dec. 6 (gage height, 2.71 ft, from floodmarks).
1962 to November 1966: Discharge, 2.7 cfs Feb. 1, 1963 (gage height, 1.03 ft).
chai-ge Day Discharge Discharge Discharge
1.370 It.51 8U.2
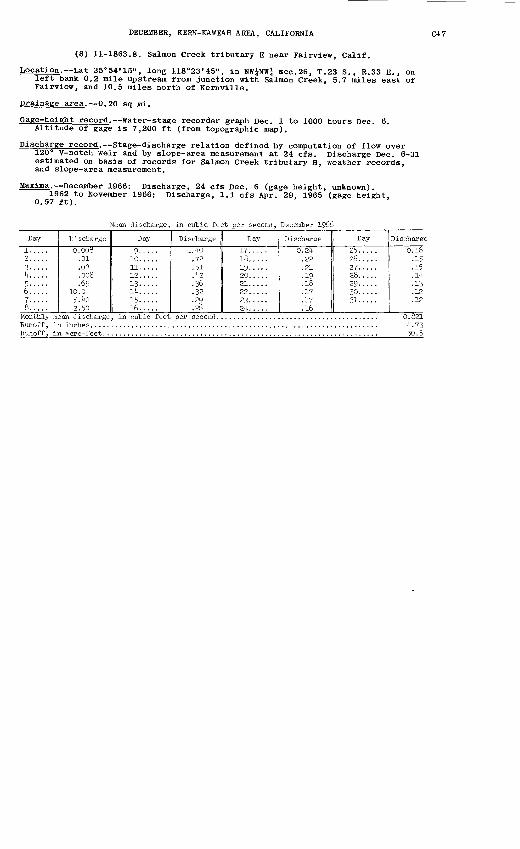
DECEMBER, KERN-KAWEAH AREA, CALIFORNIA
(8) 11-1863.8. Salmon Creek tributary E near Fairview, Calif.
Location. Lat 35°54'15", long 118°23'45", in NWjNWj sec.26, T.23 S., R.33 E., on left bank 0.2 mile upstream from junction with Salmon Creek, 5.7 miles east of Fairview, and 10.5 miles north of Kernville.
Drainage area. 0.20 sq mi.
Gage-height record. Water-stage recorder graph Dec. 1 to 1000 hours Dec. 6. Altitude of gage is 7,200 ft (from topographic map).
Discharge record. Stage-discharge relation defined by computation of flow over 120° V-notch weir and by slope-area measurement at 24 cfs. Discharge Dec. 6-31 estimated on basis of records for Salmon Creek tributary B, weather records, and slope-area measurement.
Maxima. December 1966: Discharge, 24 cfs Dec. 6 (gage height, unknown).1962 to November 1966: Discharge, 1.1 cfs Apr. 29, 1965 (gage height,
0.57 ft).
C47
Day
1..... 2..... 3-....k.....
6..... 7..... 8.....
Runoff, i
Discharge
0.008 .01 .03 .008 .69
10.0 5.40 2.50
a acre-feet. .
Day
9-.... 10. .... 11. .... 12 ..... 13.....lit..... 15..... 16.....
Discharge
1.40 72 .51 .42 .36.32 .2Q .26
Day
17..... 18. .... 19..... 20. .... 21.....22. .... 23..... 2k.....
Discharge
0.24 .22 .21 19 .18.17.17 .16
Day
25.....26..... 27..... 28..... 29. ....30..... 31.... .
Discharge
0.16 .15 .15 .14
.12
.12
0.8214.7350.5
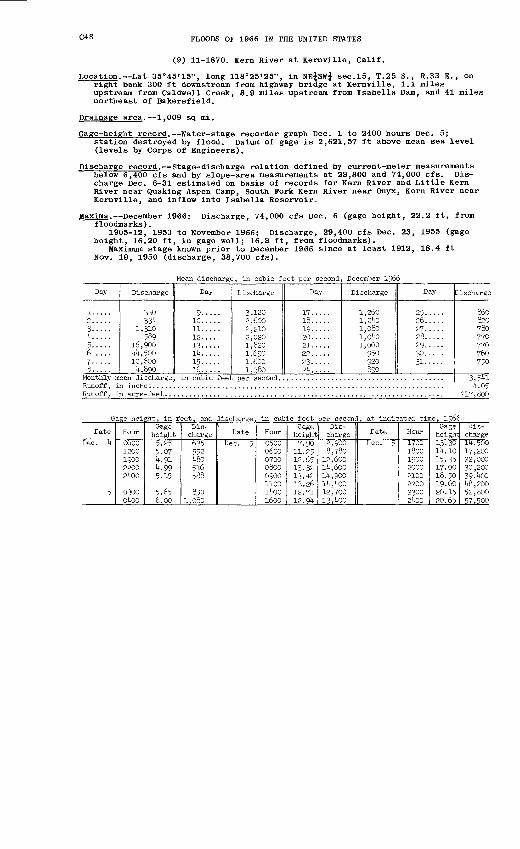
C48 FLOODS OF 1966 IN THE UNITED STATES
(9) 11-1870. Kern River at Kernville, Calif.
Location. Lat 35°45'15", long 118°25'25", in NE^SffJ sec.15, T.25 S., R.33 E., on right bank 300 ft downstream from highway bridge at Kernville, 1.1 miles upstream from Caldwell Creek, 8.9 miles upstream from Isabella Dam, and 41 miles northeast of Bakersfield.
Drainage area. 1,009 sq mi.
Gage-height record. Water-stage recorder graph Dec. 1 to 2400 hours Dec. 5;station destroyed by flood. Datum of gage is 2,621.57 ft above mean sea level (levels by Corps of Engineers).
Discharge record. Stage-discharge relation defined by current-meter measurements below 6,400 cfs and by slope-area measurements at 28,800 and 74,000 cfs. Dis charge Dec. 6-31 estimated on basis of records for Kern River and Little Kern River near Quaking Aspen Camp, South Fork Kern River near Onyx, Kern River near Kernville, and inflow into Isabella Reservoir.
Maxima. December 1966; Discharge, 74,000 cfs Dec. 6 (gage height, 22.2 ft, from floodmarks).
1905-12, 1953 to November 1966: Discharge, 29,400 cfs Dec. 23, 1955 (gage height, 16.20 ft, in gage well; 16.8 ft, from floodmarks).
Maximum stage known prior to December 1966 since at least 1912, 18.4 ft Nov. 19, 1950 (discharge, 38,700 cfs).
Mean discharge, in cubic feet per second, December 1966
Day
1. ....2.... .3.....k..... 5.....6.....?.....8.....
Discharge
330334
1,310589
16,90044,50010,6004,890
Day
9.....10. ....11. ....12.....13.....lit.....15.....16.....
Discharge
3,1202,6002,2102,0201,8201,6901,6001,380
Day
17.....18.....19. ....20.....21.....22. ....23..-..?k.....
Discharge
1,2601,2k)1,0801,0401,000
950920890
Day
25.....26.....27.....28.....29.....30.....31.-...
Monthly mean discharge, in cubic feet per second. ........................................
Runoff, in acre-feet. ....................................................................
Discharge
860820780770770760750
217,800
Gage height, in feet, and discharge, in cubic feet per second, at indicated time, 1966
Date
Dec. 4
5
Hour
06001200190022002400
0300o4oo
Gage height5.255.074.914.995.15
5.656.00
Dis charge635552480516588
8501,080
Date
Dec. 5
Hour
05000600070008000900110014001600
Gage height7.90
11.2512.6513.3213.4213.2612.7112.94
Dis charge2,9008,780
12,60014,60014,90014, 40012,70013,400
Date
Dec. 5
Hour
17001800190020002100220023002400
Gage he i girt13.3014.1015.3517.0018.5019.6020.1520.65
Dis charge14,50017,20022,00030,20039,40048,20052,80057,500
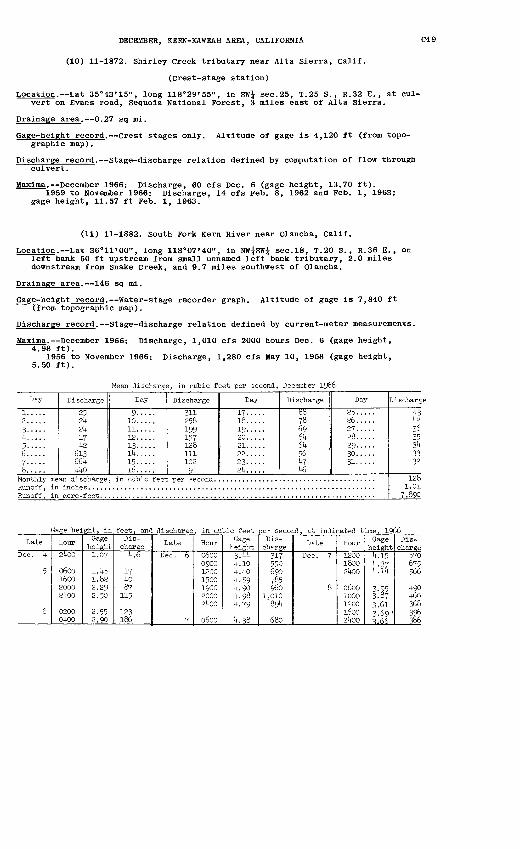
DECEMBER, KERN-KAWEAH AREA, CALIFORNIA C
(10) 11-1872. Shirley Creek tributary near Alta Sierra, Calif.
(Crest-stage station)
Location. Lat 35°43'15", long 118 0 29'55", in SWj sec.25, T.25 S. , R.32 E., at cul vert on Evans road, Sequoia National Forest, 3 miles east of Alta Sierra.
Drainage area. 0.27 sq mi.
Gage-height record. Crest stages only. Altitude of gage is 4,120 ft (from topo graphic map).
Discharge record. Stage-discharge relation defined by computation of flow through culvert.
Maxima. December 1966: Discharge, 60 cfs Dec. 6 (gage height, 13.70 ft).1959 to November 1966; Discharge, 14 cfs Feb. 8, 1962 and Feb. 1, 1963;
gage height, 11.57 ft Feb. 1, 1963.
(11) 11-1882. South Fork Kern River near Olancha, Calif.
Location. Lat se'll'OO", long 118°07'40", in NWjSWj sec.18, T.20 S., R.36 E., on left bank 50 ft upstream from small unnamed left bank tributary, 2.0 miles downstream from Snake Creek, and 9.7 miles southwest of Olancha.
Drainage area. 146 sq mi.
Gage-height record. Water-stage recorder graph. Altitude of gage is 7,840 ft (from topographic map).
Discharge record. Stage-discharge relation defined by current-meter measurements.
Maxima. December 1966: Discharge, 1,010 cfs 2000 hours Dec. 6 (gage height, 4.98 ft).
1956 to November 1966; Discharge, 1,280 cfs May 10, 1958 (gage height, 5.50 ft).
Mean discharge, in cubic feet per second, December
Day
1. ....2.....3.....k. ....5.....6.....1.....8.....
Discharge
252k2k1742
613664440
Day
9.....10.....11. ....12.....13.....14.....15..-..16.....
Discharge
3112581991571281111029k
Day
17.....18.....19.....20.....21.....22.....23.....2k.....
Discharge
88786Q646k56^7k6
Day
25.....26.....27.....28.....29.....30.....31.....
Runoff, in acre-feet. ...................................................................
Discharge
k3k236353k3332
1281.01
7,890
Gage height, in feet, and discharge, in cubic feet per second, at indicated time, 1966
Date
Dec. k
5
6
Hour
24-00
0600160020002400
0200o4oo
Gage height1.07
1.451.822.292.50
2.552.90
Dis charge
k.6
174087
115
123186
Date
Dec. 6
7
Hour
0600090012001500190020002400
0600
Gage height3.kk4.104.404.594.904.984.79
4.38
Dis charge
317550600785960
1,O10894
680
Date
Dec. 7
8
Hour
120018002400
06001000120016002400
Gage height4.154.374.14
3-953.873.613.69'^.66
Dis charge
570675566
490460368396386
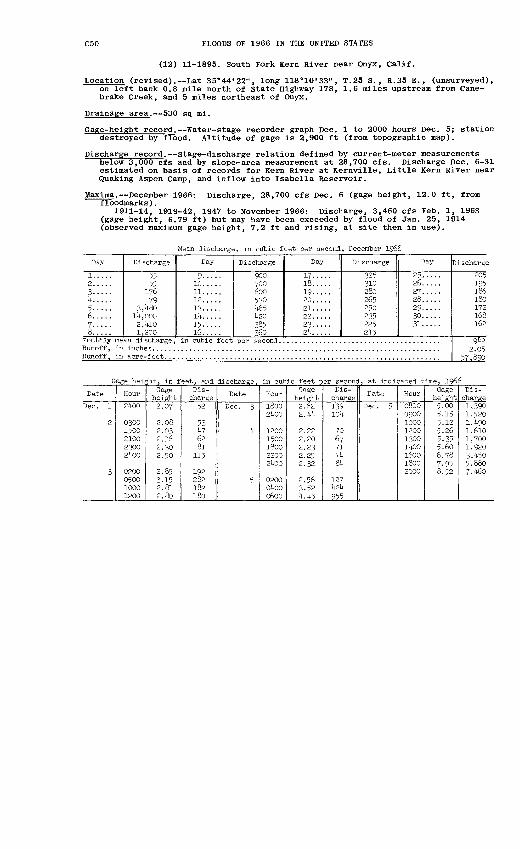
FLOODS OF 1966 IN THE UNITED STATES
(12) 11-1895. South Fork Kern River near Onyx, Calif.
Location (revised). Lat 35"44'22", long 118°10'33", T.25 S., R.35 E. , (unsurveyed), on left bank 0.8 mile north of State Highway 178, 1.6 miles upstream from Cane- brake Creek, and 5 miles northeast of Onyx.
Drainage area. 530 sq mi.
Gage-height record. Water-stage recorder graph Dec. 1 to 2000 hours Dec. 5; station destroyed by flood. Altitude of gage is 2,900 ft (from topographic map).
Discharge record. Stage-discharge relation defined by current-meter measurements below 3,000 cfs and by slope-area measurement at 28,700 cfs. Discharge Dec. 6-31 estimated on basis of records for Kern River at Kernville, Little Kern River near Quaking Aspen Camp, and inflow into Isabella Reservoir.
Maxima. December 1966: Discharge, 28,700 cfs Dec. 6 (gage height, 12.0 ft, from floodmarks).
1911-14, 1919-42, 1947 to November 1966: Discharge, 3,460 cfs Feb. 1, 1963 (gage height, 6.79 ft) but may have been exceeded by flood of Jan. 25, 1914 (observed maximum gage height, 7.2 ft and rising, at site then in use).
Mean discharge, in cuMc feet per second, December 1966
Day
1..... 2.....3..... It..... 5..... 6.....7..... 8.....
FTonttily me Runoff, in Runoff, in
Discharge
55 55
176 79
3,480 14,000
2,4-10 1,200
Day
9.....10 .....11 .....12.. ... 13..... 14. .... 15..... 16.....
an discharge, in cubic feet inches
Discharge
900 700 600 530 465 420 385 360
Day
17..... 18. .... 19.. ...20..... 21..... 22..... 23..... 24. ....
Discharge
325 310 280 265 250 235 225 215
Day
25..... 26..... 27..... 28..... 29. .. .. 30. .... 31.....
acre-feet. .................... . ............................... . .. ..
Discharge
205 195 186 180 172 168 162
942 2.05
57,890
Gage height, in feet, and discharge ibic feet per second, at indicated time,
Date
Dec. 1
2
3
Hour
2400
03001500210023002400
0200050010001200
Gage height2.07
2.082.032.162.302.50
2.853.152.812.8o
Dis charge
52
53476281
115
192282182180
Date
Dec. 3
4
5
Hour
18002400
12001500180022002400
0200o4oo0600
Ontjeheight2.622.44
2.222.202.232.252.32
2.563-524.45
Dis charge139104
7067717484
127424955
Date
Dec. 5
Hour
080009001000120013001400160018002000
Gage height5.005.155.125.265.355.606.787.958.52
Dis charge1,3901,5201,4901,6101,7001,9203,4505,8807.460
DECEMBER, KERN-KAWEAH AREA, CALIFORNIA
(13) 11-1897. Kelso Creek near Weldon, Calif.
Location. Lat 35°34'10", long 118°15'05", in NWj sec.20, T.27 S., R.35 E. , on left bank 0.5 mile upstream from Woolstaff Creek, and 7 miles southeast of Weldon.
Drainage area. 101 sq mi.
Gage-height record. Water-stage recorder graph Dec. 1-5; flood-deposited detritus destroyed station effectiveness. Altitude of gage is 3,180 ft (from topographic map).
Discharge record. Stage-discharge relation defined by current-meter measurements and weir discharge computations below 7 cfs and by one slope-area measurement at 1,180 cfs. Maximum discharge Dec. 6 estimated on basis of field survey of site.
Maxima. December 1966: Discharge, about 5,800 cfs Dec. 6 (gage height, 11.7 ft, from floodmarks).
1958 to November 1966: Discharge, 1,340 cfs Aug. 15, 1965 (gage height, 6.20 ft, from floodmarks).
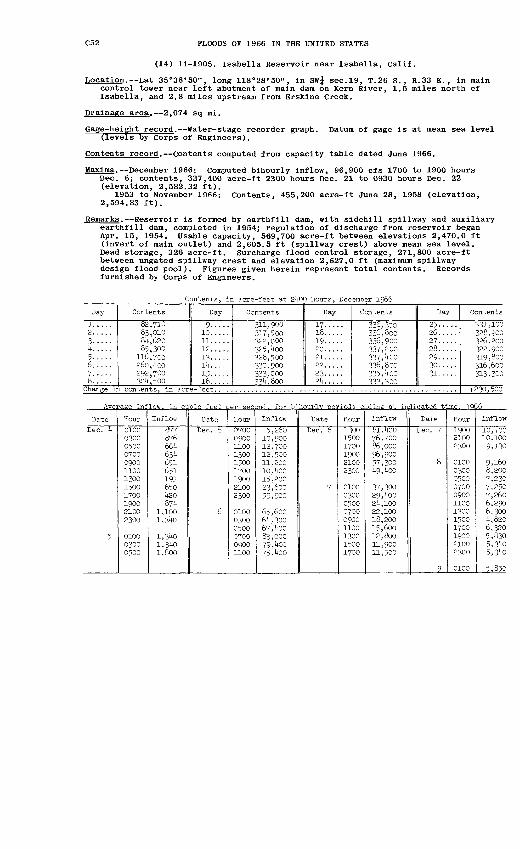
C52 FLOODS OF 1966 IN THE UNITED STATES
(14) 11-1905. Isabella Reservoir near Isabella, Calif.
Location. Lat 35°38'50", long 118°28'50", in SffJ sec.19, T.26 S., R.33 E., in main control tower near left abutment of main dam on Kern River, 1.5 miles north of Isabella, and 2.8 miles upstream from Erskine Creek.
Drainage area. 2,074 sq mi.
Gage-height record. ffater-stage recorder graph. Datum of gage is at mean sea level (levels by Corps of Engineers).
Contents record. Contents computed from capacity table dated June 1966.
Maxima. December 1966: Computed bihourly inflow, 96,900 cfs 1700 to 1900 hours Dec. 6; contents, 337,400 acre-ft 2300 hours Dec. 21 to 0930 hours Dec. 22 (elevation, 2,582.32 ft).
1953 to November 1966: Contents, 455,200 acre-ft June 28, 1958 (elevation, 2,594.83 ft).
Remarks. Reservoir is formed by earthfill dam, with sidehill spillway and auxiliary earthfill dam, completed in 1954; regulation of discharge from reservoir began Apr. 15, 1954. Usable capacity, 569,700 acre-ft between elevations 2,470.0 ft (invert of main outlet) and 2,605.5 ft (spillway crest) above mean sea level. Dead storage, 326 acre-ft. Surcharge flood control storage, 271,800 acre-ft between ungated spillway crest and elevation 2,627.0 ft (maximum spillway design flood pool). Figures given herein represent total contents. Records furnished by Corps of Engineers.
Contents, in acre-feet at 2^00 hours, December 1966
Day Day Contents Day Day
9....10....11....12....13.... Ht....15....16....
Change in contents, in acre-feet.
Average Inflow. b: lourlv periods ending at Lcated time. 1066
Hour010003000500070009001100130015001700190021002300
010003000500
Dec. 5
63k 651 651 191 650 lf-20
1,3^0 1,3^0 1,800
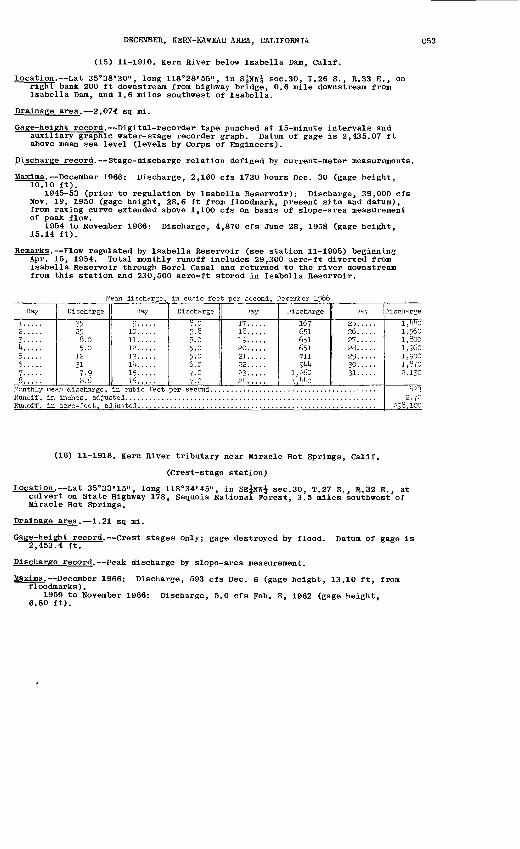
DECEMBER, KERN-KAWEAH AREA, CALIFORNIA C53
(15) 11-1910. Kern River below Isabella Dam, Calif.
Location. Lat 35°38'30", long 118°28'55", in SjNWJ sec. 30, T.26 S. , R.33 E., on right bank 200 ft downstream from highway bridge, 0.6 mile downstream from Isabella Dam, and 1.6 miles southwest of Isabella.
Drainage area. 2,074 sq mi.
Gage-height record. Digital-recorder tape punched at 15-minute intervals and auxiliary graphic water-stage recorder graph. Datum of gage is 2,435.07 ft above mean sea level (levels by Corps of Engineers).
Discharge record. Stage-discharge relation defined by current-meter measurements.
Maxima. December 1966: Discharge, 2,160 cfs 1730 hours Dec. 30 (gage height, 10.10 ft).
1945-53 (prior to regulation by Isabella Reservoir): Discharge, 39,000 cfs Nov. 19, 1950 (gage height, 28.6 ft from floodmark, present site and datum), from rating curve extended above 1,100 cfs on basis of slope-area measurement of peak flow.
1954 to November 1966: Discharge, 4,870 cfs June 28, 1958 (gage height, 15.14 ft).
Remarks . Flow regulated by Isabella Reservoir (see station 11-1905) beginning Apr. 15, 1954. Total monthly runoff includes 29,300 acre-ft diverted from Isabella Reservoir through Borel Canal and returned to the river downstream from this station and 230,500 acre-ft stored in Isabella Reservoir.
Mean discharge, in cubic feet per second, December 1966
Day
1.....2.....3.....IK....5.....6.....7.....8.....
Discharge
35258.05-0
12317-98.6
Day
9.....10 .....11 .....12 .....13.....llK....
15.....16.....
Discharge
8.05.85.05-05-06.07-07.0
Day
17.....18.....19-....20.....21.....22. ....23.....2k.....
Discharge
1676516516517119kk
1,260l,VtQ
Day
25.....26.....27. ....28.....29.....30.....31. ....
Runoff, in acre-feet, adjusted. ..........................................................
Discharge
1,^01,5601,8001,9601,9001,8702,130
6232.70
298,100
(16) 11-1918. Kern River tributary near Miracle Hot Springs, Calif.
(Crest-stage station)
Location. Lat 35°33'15", long 118°34'45", in SE^NW^ sec.30, T.27 S., R.32 E., at culvert on State Highway 178, Sequoia National Forest, 3.5 miles southwest of Miracle Hot Springs.
Drainage area. 1.21 sq mi.
Gage-height record. Crest stages only; gage destroyed by flood. Datum of gage is 2,453.4 ft.
Discharge record. Peak discharge by slope-area measurement.
Maxima. December 1966: Discharge, 593 cfs Dec. 6 (gage height, 13.10 ft, from floodmarks).
1959 to November 1966: Discharge. 5.0 cfs Feb. 8, 1962 (gage height, 6.80 ft).
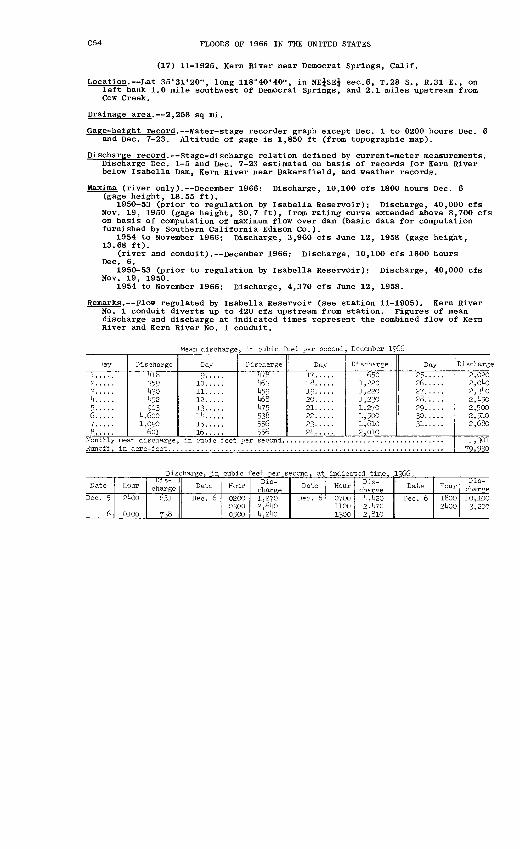
C54 FLOODS OF 1966 IN THE UNITED STATES
(17) 11-1925. Kern River near Democrat Springs, Calif.
Location. Lat 35°31'20", long 118°40'40" J in NE^SEj sec.6, T.28 S. , R.31 E., on left bank 1.0 mile southwest of Democrat Springs, and 2.1 miles upstream from Cow Creek.
Drainage area. 2,258 sq mi.
Gage-height record. Water-stage recorder graph except Dec. 1 to 0200 hours Dec. 6 and Dec. 7-23. Altitude of gage is 1,850 ft (from topographic map).
Discharge record. Stage-discharge relation defined by current-meter measurements. Discharge Dec. 1-5 and Dec. 7-23 estimated on basis of records for Kern River below Isabella Dam, Kern River near Bakersfield, and weather records.
Maxima (river only). December 1966: Discharge, 10,100 cfs 1800 hours Dec. 6 (gage height, 18.55 ft).
1950-53 (prior to regulation by Isabella Reservoir): Discharge, 40,000 cfs Nov. 19, 1950 (gage height, 30.7 ft), from rating curve extended above 8,700 cfs on basis of computation of maximum flow over dam (basic data for computation furnished by Southern California Edison Co.).
1954 to November 1966: Discharge, 3,960 cfs June 12, 1958 (gage height, 13.68 ft).
(river and conduit). December 1966: Discharge, 10,100 cfs 1800 hours Dec. 6.
1950-53 (prior to regulation by Isabella Reservoir): Discharge, 40,000 cfs Nov. 19, 1950.
1954 to November 1966: Discharge, 4,370 cfs June 12, 1958.
Remarks. Flow regulated by Isabella Reservoir (see station 11-1905). Kern River No. 1 conduit diverts up to 420 cfs upstream from station. Figures of mean discharge and discharge at indicated times represent the combined flow of Kern River and Kern River No. 1 conduit.
Mean discharge, in cubic feet per second, December 1966
Day
1..... 2. ....
1*..... 5..... 6..... 7..... 8.....
Runoff, in
Discharge1*18 359
1*52 903
It, 600 1,090
601an discharge acre-feet. .
Day9. ....
10 .....
12 ..... 13.....14..... 15..... 16.....
in ciibic feet
Discharge
1*63 1*591*68 1*75 538 556 556
per second.
Day17. .... 18..... 19. ....20..... 21..... 22 ..... 23.....
Discharge650
1,220
1,230 1,270 1,500 1,810 2,010
Day25.....26.....
28.....29.....30..... 31.....
Discharg
2,020 2,0l*0
2,1*50 2,500 2,510 2,680
79,930
Dis charge
2400
0100
020003000500
070011001300
1800 21*00
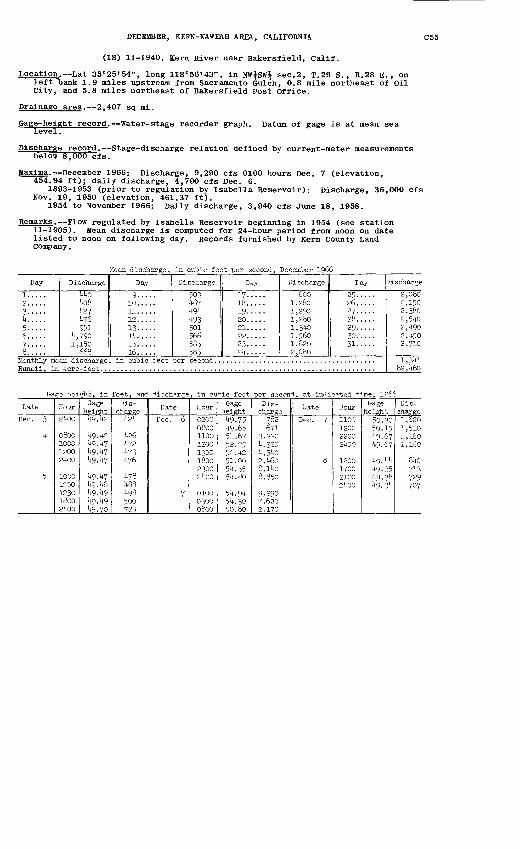
DECEMBER, KERN-KAWEAH AREA, CALIFORNIA (
(18) 11-1940. Kern River near Bakersfield, Calif.
Location. Lat 35°25'54", long 118°56'43", in NW^SWj sec.2, T.29 S. , R.28 E., on left bank 1.9 miles upstream from Sacramento Gulch, 0.8 mile northeast of Oil City, and 5.8 miles northeast of Bakersfield Post Office.
Drainage area. 2,407 sq mi.
Gage-height record. Water-stage recorder graph. Datum of gage is at mean sea level.
Discharge record. Stage-discharge relation defined by current-meter measurements below 8,000 cfs.
Maxima. December 1966; Discharge, 9,290 cfs 0100 hours Dec. 7 (elevation, 454.94 ft); daily discharge, 4,790 cfs Dec. 6.
1893-1953 (prior to regulation by Isabella Reservoir): Discharge, 36,000 cfs Nov. 19, 1950 (elevation, 461.37 ft).
1954 to November 1966: Daily discharge, 3,940 cfs June 18, 1958.
Remarks. Flow regulated by Isabella Reservoir beginning in 1954 (see station 11-1905). Mean discharge is computed for 24-hour period from noon on date listed to noon on following day. Records furnished by Kern County Land Company.
Mean discharge, in cubic feet per second, December 1966
Day
1.....2. ....3.....It.....5.....6.....7.....8.....
Discharge
¥*Q!t08!t27V/6951
It, 7901,150
668
Day
9.....10. ....11.....12 .....13.....lit. ....15.....16.....
Discharge
503!t87lt9Ult93501566585585
Day
17.....18.....19.....20. ....21.. ...22.....23.....2 It. ....
Discharge
6001,2801,2901,280IjSto1,5601,8202,080
Day
25.....26.....27.....28.....29.....30.....31.....
Runoff, in acre-feet. ...................................................................
Discharge
2,0802,1502,3802,5ltO2,^902,^502,710
1,3^1
height, in feet, and charge at indicated t^'me, 1°66Dis charge
Gage height Hour
Dis charge
1000 1200 2^00
1000 1200 1230 1800 2!)-00
0200 0800 1100 1200 1300 1800 2300 2ltOO
01000300
110012002200
1200 1700 2100 2 It-00
1,6201,5101,1601,160
713729707
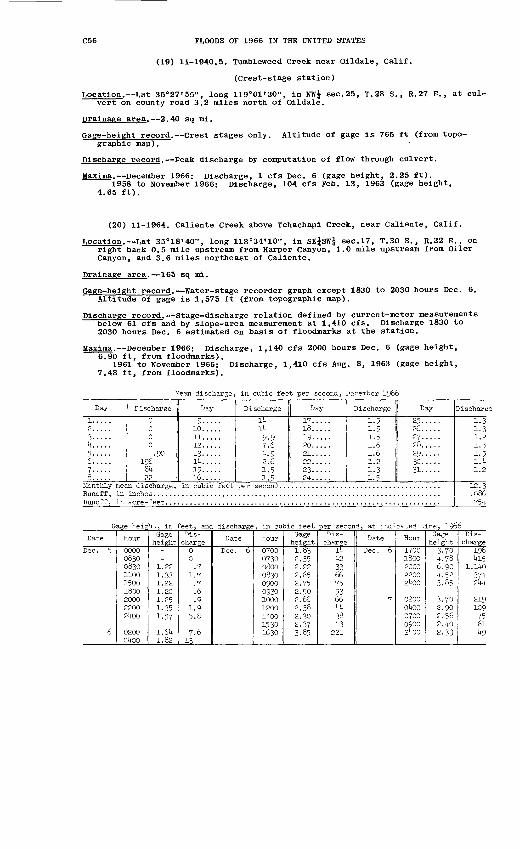
C56 FLOODS OF 1966 IN THE UNITED STATES
(19) 11-1940.5. Tumbleweed Creek near Oildale, Calif.
(Crest-stage station)
Location. Lat 35°27'55", long 119°01'30", in NWj sec. 25, T.28 S., R.27 E., at cul vert on county road 3.2 miles north of Oildale.
Drainage area. 2.40 sq mi.
Gage-height record. Crest stages only. Altitude of gage is 765 ft (from topo graphic map).
Discharge record. Peak discharge by computation of flow through culvert.
Maxima. December 1966: Discharge, 1 cfs Dec. 6 (gage height, 2.25 ft).1958 to November 1966: Discharge, 104 cfs Feb. 13, 1963 (gage height,
4.65 ft).
(20) 11-1964. Caliente Creek above Tehachapi Creek, near Caliente, Calif.
Location. Lat 35°18'40", long 118°34'10", in SEjSffi sec.17, T.30 S., R.32 E., on right bank 0.5 mile upstream from Harper Canyon, 1.0 mile upstream from Oiler Canyon, and 3.6 miles northeast of Caliente.
Drainage area. 165 sq mi.
Gage-height record. Water-stage recorder graph except 1830 to 2030 hours Dec. 6. Altitude of gage is 1,575 ft (from topographic map).
Discharge record. Stage-discharge relation defined by current-meter measurements below 61 cfs and by slope-area measurement at 1,410 cfs. Discharge 1830 to 2030 hours Dec. 6 estimated on basis of floodmarks at the station.
Maxima. December 1966: Discharge, 1,140 cfs 2000 hours Dec. 6 (gage height, 6.90 ft, from floodmarks).
1961 to November 1966; Discharge, 1,410 cfs Aug. 8, 1963 (gage height, 7.48 ft, from floodmarks).
Mean discharge, in cubic feet per second, December 1966
Day
1. ....2. ....3.....1*.....5.....6.....7.....8.....
Discharge
0000
.90196
81*22
Day
9.....10.....11.....12.....13.....l»t. ....15.....16.....
Discharge
14lit9-97.6^.92.61.51.5
Day
17.....18.....19-....20.....21.....22....,23.....2i*.....
Discharge
1.51.51.51.61.61.21.31.5
Day
25.....26.....27.....28.....29. ....30.....31.....
Runoff, in acre-feet. ...................................................................
Discharge1.31.31.21.51.5l.l*1.2
12.3.08675*t
Gage heig
Date
Dec. 5
6
Hour
0000083008301100150018002000220021*00
020001*00
ht, in feet, and discharge, in cubic feet per second, at indicated time, 1966Gage
height--
1.221.331.221.201.251.351.57
1.61*1.82
Dis charge
00.7
1.7.7.6,Q
1.95.8
7.613
Date
Dec. 6
Hour
07000730080008300900093010001200ll*0015301630
Gage height1.832.352.222.652.752.502.662.382.302.373.85
Dis charge
lit1*233667553661*1*38^3
221
Date
Dec. 6
7
Hour
17001800200022002 1*00
0200oi*oo0700090021*00
Gage height
3-70it. 786.90it. 523.85
3.702.902.562.1*02.33
Dis charge
1961*15
1,11*0371*21*1*
21910975611*9
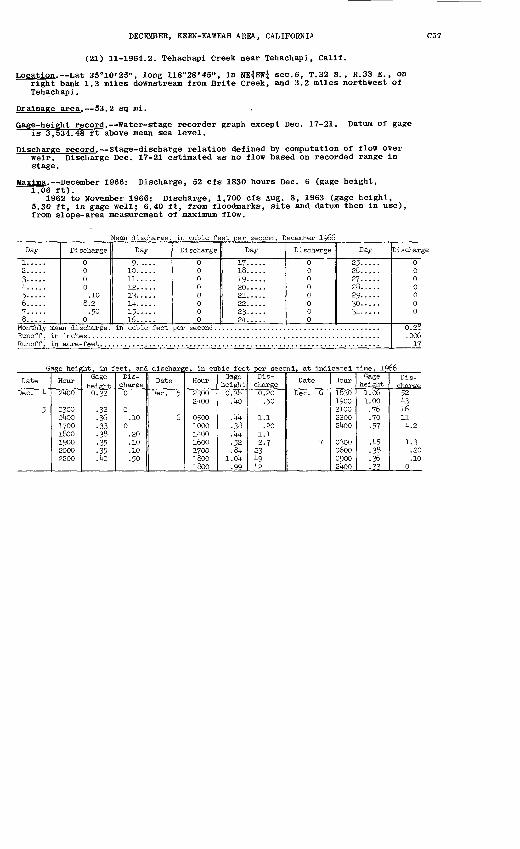
DECEMBER, KERN-KAWEAH AREA, CALIFORNIA C57
(21) 11-1964.2. Tehachapi Creek near Tehachapi, Calif.
Location. Lat 35°10'25", long 118°28'45", in NE$SW$ sec.6, T.32 S., R.33 E., on right bank 1.3 miles downstream from Brite Creek, and 3.2 miles northwest of Tehachapi.
Drainage area. 53.2 sq mi.
Gage-height record. Water-stage recorder graph except Dec. 17-21. Datum of gage is 3,534.48 ft above mean sea level.
Discharge record. Stage-discharge relation defined by computation of flow over weir. Discharge Dec. 17-21 estimated as no flow based on recorded range in stage.
Maxima. December 1966: Discharge, 52 cfs 1830 hours Dec. 6 (gage height, 1.06 ft).
1962 to November 1966: Discharge, 1,700 cfs Aug. 8, 1963 (gage height, 5.30 ft, in gage well; 6.40 ft, from floodmarks, site and datum then in use), from slope-area measurement of maximum flow.
Mean discharge, in cubic feet per second, December 1966
Day
1.....2.....3.....k. ....5.....6.....7.....8.....
Discharge
0000
.108.2
.500
Day
9. ....10 .....11.....12. ....13.....ll+. . . . .15.....16.....
Discharge
00000000
Monthly mean discharge in cubic feet per second
Day
17.....18.....19.....20.....21.....22.....23.....2k.....
Discharge
00000000
Day
25.....26.....2.1.....28. ....29.....30.....31.....
Runoff , in acre-feet .....................................................................
Discharge
0000000
0.28.006
17
Gage height, in feet, and discharge, in cubic feet per second, at indicated time, 1966
Date
Dec. k
5
Hour
21+00
0300oi+oo17001800190020002200
Gage heiccht
0.32
32.36.33.38 35.35.ko
Dis charge
0
0.10
0.20.10.10.50
Date
Dec. 5
6
Hour
230021+00
05001000ii+oo16001700l&OO1800
Gage height
0.38.1+0
.kk
.38
.kk 52.81+
1.01+.99
Dis charge0.20
50
1.1.20
1.12.7
231+91+2
Date
Dec. 6
7
Hour
183019002100220021+00
03000600090021+00
Gage height
1.061.00
.76
.70
.57
.1+5
.38
.36
.33
Dis- charee
521+31611
1+.2
1.3.20.10
0
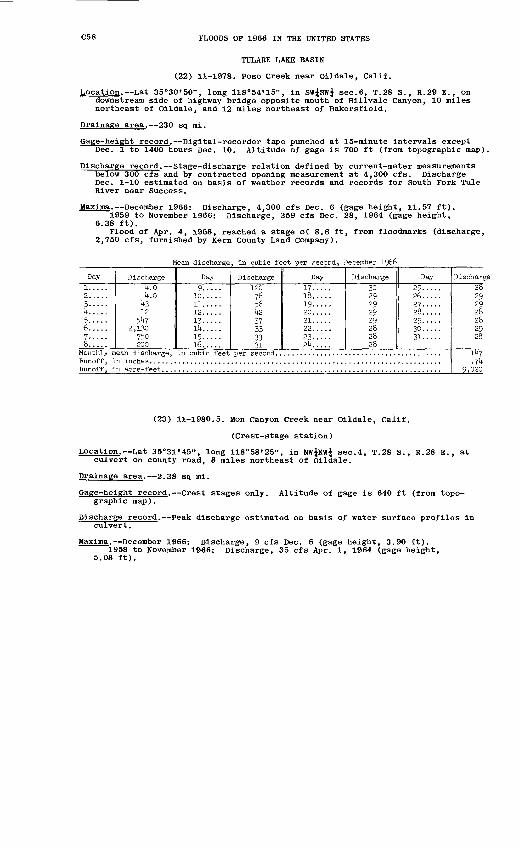
C58 FLOODS OF 1966 IN THE UNITED STATES
TULAEE LAKE BASIN
(22) 11-1978. Poso Creek near oildale, Calif.
Location. Lat 35°30 t 50", long 118°54'15", in SWjSWj sec.6, T.28 S., R.29 E., on downstream side of highway bridge opposite mouth of Hillvale Canyon, 10 miles northeast of Oildale, and 12 miles northeast of Bakersfield.
Drainage area. 230 sq mi.
Gage-height record. Digital-recorder tape punched at 15-minute intervals exceptDec. 1 to 1400 hours Dec. 10. Altitude of gage is 700 ft (from topographic map).
Discharge record. Stage-discharge relation defined by current-meter measurements below 300 cfs and by contracted opening measurement at 4,300 cfs. Discharge Dec. 1-10 estimated on basis of weather records and records for South Fork Tule River near Success.
Maxima. December 1966: Discharge, 4,300 cfs Dec. 6 (gage height, 11.57 ft).1959 to November 1966: Discharge, 359 cfs Dec. 28, 1964 (gage height,
6.38 ft).Flood of Apr. 4, 1958, reached a stage of 8.6 ft, from floodmarks (discharge,
2,750 cfs, furnished by Kern County Land Company).
Mean discharge, in cubic feet per second, December 1966
Day1... .. 2..... 3.....k..... "}..... 6.....7..... 8.....
Monthly m Runoff, i Runoff, i
Discharge4.0 4.0
43 12
547 2,130
750 200
Day9.....
10..... 11..... 12..... 13..... 14..... 15..... 16.....
ean discharge, in cubic feet n inches
Discharge120
76 56 42 37 33 33 31
Day17..... 18..... 19..... 20.. ... 21. .... 22. .... 23..... 2k.....
Discharge30 29 29 2929 28 28 28
Day25..... 26..... 27..... 28..... 29..... 30..... 31.....
n acre-feet .....................................................................
Discharg28 29 29 28 28 29 28
147 .74
9,020
(23) 11-1980.5. Mon Canyon Creek near Oildale, Calif.
(Crest-stage station)
Location. Lat 35°31'45", long 118°58'25", in NW^NWj sec.4, T.28 S., R.28 E., at culvert on county road, 8 miles northeast of oildale.
Drainage area. 2.38 sq mi.
Gage-height record. Crest stages only. Altitude of gage is 640 ft (from topo graphic map).
Discharge record. Peak discharge estimated on basis of water surface profiles in culvert.
Maxima. December 1966: Discharge, 9 cfs Dec. 6 (gage height, 3.90 ft).1958 to November 1966: Discharge, 35 cfs Apr. 1, 1964 (gage height,
5.08 ft).
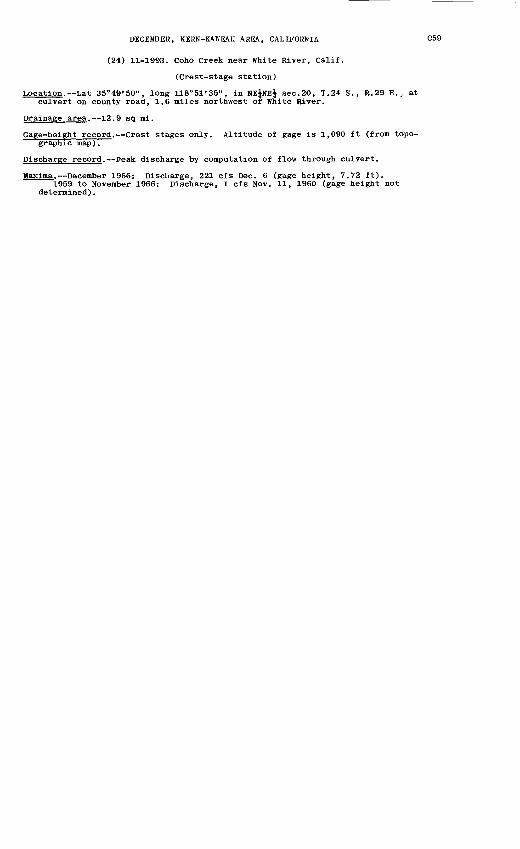
DECEMBER, KERN-KAWEAH AREA, CALIFORNIA
(24) 11-1993. Coho Creek near White River, Calif.
(Crest-stage station)
Location. Lat 35°49'50", long 118°51'35", in NE^NE^ sec.20, T.24 S., R.29 E., at culvert on county road, 1.6 miles northwest of White River.
Drainage area. 12.9 sq mi.
Gage-height record. Crest stages only. Altitude of gage is 1,090 ft (from topo graphic map).
Discharge record. Peak discharge by computation of flow through culvert.
Maxima. December 1966: Discharge, 221 cfs Dec. 6 (gage height, 7.72 ft).1959 to November 1966: Discharge, 1 cfs Nov. 11, 1960 (gage height not
determined).
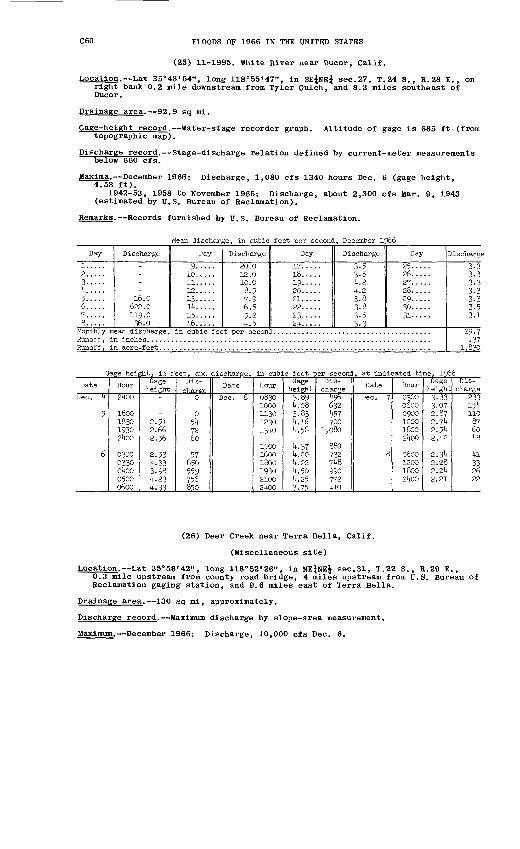
FLOODS OF 1966 IN THE UNITED STATES
(25) 11-1995. ffhite River near Ducor, Calif.
Location. Lat 35°48'54", long 118°55'47", in SE^NEj sec.27, T.24 S., R.28 E., on right bank 0.2 mile downstream from Tyler Gulch, and 8.3 miles southeast of Ducor.
Drainage area. 92.9 sq mi.
Gage-height record. ffater-stage recorder graph. Altitude of gage is 685 ft (from topographic map).
Discharge record. Stage-discharge relation defined by current-meter measurements below 660 cfs.
Maxima. December 1966: Discharge, 1,080 cfs 1340 hours Dec. 6 (gage height. 4.58 ft).
1942-53, 1958 to November 1966: Discharge, about 2,300 cfs Mar. 9, 1943 (estimated by U.S. Bureau of Reclamation).
Remarks. Records furnished by U.S. Bureau of Reclamation.
Mean discharge, in cuMc feet per second, December 1966
Day
1..... 2..... 3.....1+..... }..... 6.....7..... 8.....
Monthly m
Runoff, i
Discharge
16.0 622.0 119.0 36.0
n acre-feet. . .
Day
9..... 10. .... 11..... 12..... 13..... 14. .... 15..... 16.....
Discharge
20.0 12.0 10.0
8.5 7-9 6.5 5.2 4.5
Day
17..... 18..... 19..... 20..... 21..... 22..... 23..... 2k.....
Discharge
3-53-5 4.2 4.2 3.8 3.8 3-5 3-3
Day
25-.... 26..... 27. .... 28..... 29..... 30..... 31-....
Discharge
3.3 3.3 3.3 3.3 3.3 3.5 3.1
29-7.37
1,830
;e height, in feet, and discharge, in cubic feet per second, at indicated t
Date
Dec. 4
5
6
Hour
2itOO
1800183019302kOO
03000330o4oo05000600
Gage height
-
-2.512.662.56
2.534.333.984.234.33
Dis
charge0
0547260
57850559756850
Date
Dec. 6
Hour
OB301000113012301340
150016001800193021002400
Gage height3.«94.083.834.164.58
4.374.204.224.504.253.75
Dis charge
496632457700
1,080
880732748990772410
Date
Dec. 7
8
Hour
0300060009001200l&OO2400
0600120018002400
Gage height3.333.072.872.742.542.42
2.342.282.242.21
Dis charge
233154110876048
41332622
(26) Deer Creek near Terra Bella, Calif.
(Miscellaneous site)
Location. Lat 35°58'42", long 118°52'26", in NEjNEj sec.31, T.22 S., R.29 E.,0.3 mile upstream from county road bridge, 4 miles upstream from U.S. Bureau of Reclamation gaging station, and 9.6 miles east of Terra Bella.
Drainage area. 130 sq mi, approximately.
Discharge record. Maximum discharge by slope-area measurement.
Maximum. December 1966: Discharge, 10,000 cfs Dec. 6.
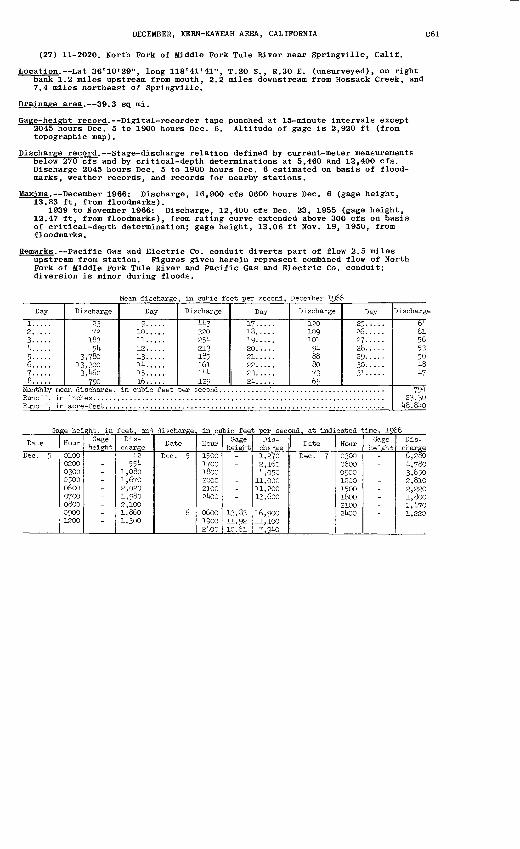
DECEMBER, KERN-KAWEAH AREA, CALIFORNIA C61
(27) 11-2020. North Fork of Middle Fork Tule River near Springville, Calif.
Location. Lat 36°10'29", long 118°41'41", T.20 S. , R.30 E. (unsurveyed), on right bank 1.2 miles upstream from mouth, 2.2 miles downstream from Hossack Creek, and 7.4 miles northeast of Springville.
Drainage area. 39.3 sq mi.
Gage-height record. Digital-recorder tape punched at 15-minute intervals except 2045 hours Dec. 5 to 1900 hours Dec. 6. Altitude of gage is 2,920 ft (from topographic map).
Discharge record. Stage-discharge relation defined by current-meter measurements below 270 cfs and by critical-depth determinations at 5,460 and 12,400 cfs. Discharge 2045 hours Dec. 5 to 1900 hours Dec. 6 estimated on basis of flood- marks, weather records, and records for nearby stations.
Maxima. December 1966: Discharge, 16,900 cfs 0600 hours Dec. 6 (gage height, 13.83 ft, from floodmarks).
1939 to November 1966: Discharge, 12,400 cfs Dec. 23, 1955 (gage height, 12.47 ft, from floodmarks), from rating curve extended above 300 cfs on basis of critical-depth determination; gage height, 13.06 ft Nov. 19, 1950, from floodmarks.
Remarks. Pacific Gas and Electric Co. conduit diverts part of flow 2.5 miles upstream from station. Figures given herein represent combined flow of North Fork of Middle Fork Tule River and Pacific Gas and Electric Co. conduit; diversion is minor during floods.
Mean discharge, in cubic feet per second, December 1966
Day Discharge Day Discharge Day Discharge Day Discharge
320 25 1* 213 185
129
120109101
9k
7369
Monthly Runoff, Runoff,
Gage height, in feet, and discharge
Date
Dec. 5
Hour
010002000300050006000700080009001200
Gage height
---------
Dis charge
te55U
1,0801,6702,0201,9802,1001,8601,300
Date
Dec. 5
6
in cuMc feet per second, at indicated time, 1966
Hour
150017001800200021002lK>0
060019002kOO
Gage height
-_---_
13.8311.9210.61
Dis charge1,2702,l6o4,050
11,00011,20013,600
16,90011,100
7.9UO
Date
Dec. 7
Hour
03000600090012001500180021002UOO
Gage height
-_--.._-
Dis charge6,280U,7803,6502,8102,2201,8001,1+701,220
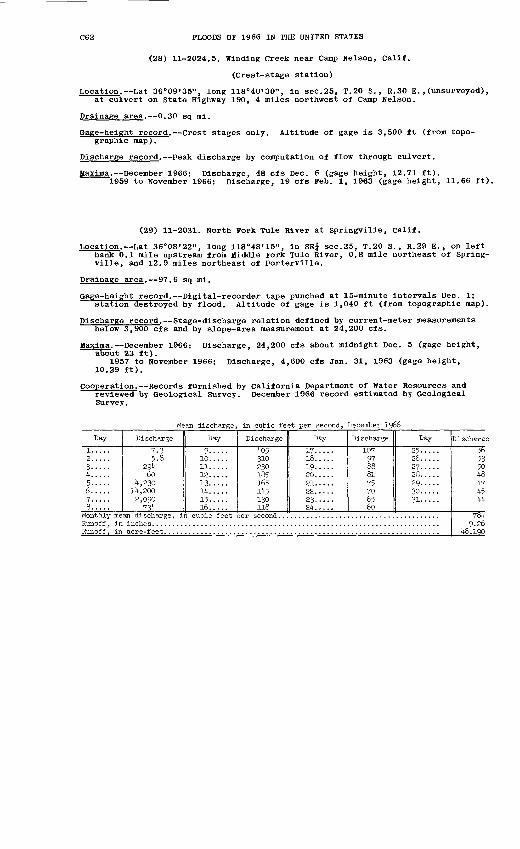
C62 FLOODS OF 1966 IN THE UNITED STATES
(28) 11-2024.5. Winding Creek near Camp Nelson, Calif.
(Crest-stage station)
Location. Lat 36°09'35", long 118°40'30", in sec.25, T.20 S., R.30 E.,(unsurveyed), at culvert on State Highway 190, 4 miles northwest of Camp Nelson.
Drainage area. 0.30 sq mi.
Gage-height record. crest stages only. Altitude of gage is 3,500 ft (from topo graphic map).
Discharge record. Peak discharge by computation of flow through culvert.
Maxima. December 1966: Discharge, 48 cfs Dec. 6 (gage height, 12.71 ft).1959 to November 1966: Discharge, 19 cfs Feb. 1, 1963 (gage height, 11.66 ft).
(29) 11-2031. North Fork Tule River at Springville, Calif.
Location. Lat 36°08'22", long 118°48'15", in SEj sec.35, T.20 S., R.29 E., on left bank 0.1 mile upstream from Middle Fork Tule River, 0.8 mile northeast of Spring ville, and 12.9 miles northeast of Porterville.
Drainage area. 97.6 sq mi.
Gage-height record. Digital-recorder tape punched at 15-minute intervals Dec. 1; station destroyed by flood. Altitude of gage is 1,040 ft (from topographic map).
Discharge record. Stage-discharge relation defined by current-meter measurements below 3,900 cfs and by slope-area measurement at 24,200 cfs.
Maxima. December 1966: Discharge, 24,200 cfs about midnight Dec. 5 (gage height, about 23 ft).
1957 to November 1966: Discharge, 4,600 cfs Jan. 31, 1963 (gage height, 10.29 ft).
Cooperation. Records furnished by California Department of Water Resources and reviewed by Geological Survey. December 1966 record estimated by Geological Survey.
Mean discharge, in cubic feet per second, December 1966
Day
1..... 2.....3..... 4.....(,'.'.'.'.'.
7.....a.....
Monthly me Runoff, in Runoff, in
Discharge
7.3 5.8
294 60
4,230 14,200 2,090
73^
Day
9. .... 10.....11. ....12..... 13..... 14..... 15..... 16.....
an discharge, in cubic feet
Discharge
405 310 230 185 165 145 130 118
Day
17..... 18. .... 19..... 20. .... 21..... 22..... 23..... 24.....
Discharge
107 97 88 81 75 70 65 60
Day
25..... 26.....27.....28.....29.....30..... 31.....
acre-feet. ...................................................................
Discharge
56 53 5048 ^7 ^ 44
784 9.26
48,190
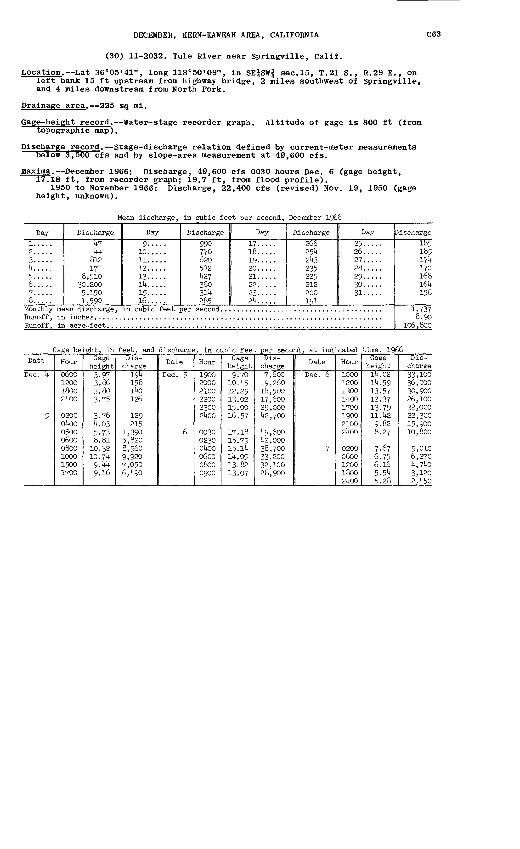
DECEMBER, KERN-KAWEAH AREA, CALIFORNIA C63
(30) 11-2032. Tule River near Springville, Calif.
Location. Lat 36°05'41", long 118°50'09", in SE^SWj sec.15, T.21 S., R.29 E., on left bank 15 ft upstream from highway bridge, 2 miles southwest of Springville, and 4 miles downstream from North Fork.
Drainage area. 225 sq mi.
Gage-height record. Water-stage recorder graph. Altitude of gage is 800 ft (from topographic map).
Discharge record. Stage-discharge relation defined by current-meter measurements below 3,500 cfs and by slope-area measurement at 49,600 cfs.
Maxima. December 1966: Discharge, 49,600 cfs 0030 hours Dec. 6 (gage height, 17.18 ft, from recorder graph; 19.7 ft, from flood profile).
1950 to November 1966: Discharge, 22,400 cfs (revised) Nov. 19, 1950 (gage height, unknown).
Mean discharge, in cubic feet per second, December 1966
Day1..... 2.. ... 3..... U. .... 5..... 6..... 7-.... 8.....
Monthly me Runoff, ir Runoff, ir
Discharge^7 1A
812171
8,510 30,2005,1501,590
Day
9..... 10..... 11. .... 12..... 13..... 1U. . . . . 15..... 16.....
an discharge, in cubic feet ]
Discharge
990 770 620 532 U27 360 3U 285
Day
17..... 18..... 19-.... 20..... 21..... 22..... 23..... 2U.....
Discharge266 25U 2U3 235 225 212 200 191
Day
25.....26..... 27..... 28.....29.....30..... 31.....
acre-feet ....................................................................
Discharge185 185 17U 170 168 16U 156
1,737 8.90
106,800
Gage height, in feet, and discharge, in cubic feet per second, at indicated time, 1966Date
Dec. If
5
Hour
0600120018002UOO
0200OliOO050006000800100015001700
Gage height
3-973.863.803-75
3.76U.035-738.81
10.3210. fk
9.1A9.16
Dis charge
194158Ik)126
129215
1,3905,8208,9609,9207,0506,U90
Date
Dec. 5
6
Hour
190020002100220023002toO
0030023001*00060008000900
Gage height
9.7010. U512.2913.0215.0016.57
17.1815.7915. lUlU.0513.8213.07
Dis charge7,6009,260
lU,50017,60029,000U2,700
119,6001|2,00038,70033,20032,10028,900
Date
Dec. 6
7
Hour
100012001300lUOO1700190021002ta>
02000600120018002UOO
Gage height
14.021U.5913.5712.3713.7911.1)29.828.27
7.676.756.165.5U5.28
Dis charge33,10036,00030,90026,10032,00022,30015,90010,800
9,0106,270U,7^03,1202,ll50
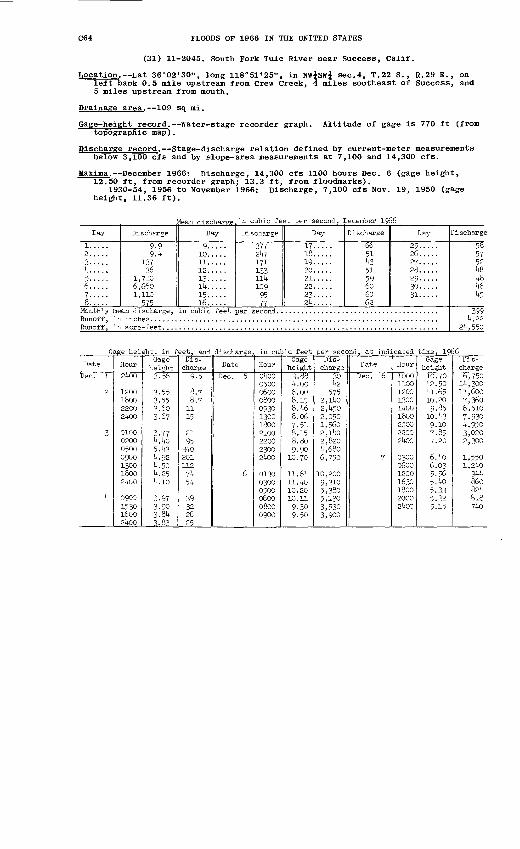
FLOODS OF 1966 IN THE UNITED STATES
(31) 11-2045. South Fork Tule River near Success, Calif.
Location. Lat 36°02'30", long 118°51'25", in NWjSffJ sec. 4, T.22 S. , R.29 E., on left bank 0.5 mile upstream from Crew Creek, 4 miles southeast of Success, and 5 miles upstream from mouth.
Drainage area. 109 sq mi.
Gage-height record. Water-stage recorder graph. Altitude of gage is 770 ft (from topographic map) .
Discharge record. Stage-discharge relation defined by current-meter measurements below 3,100 cfs and by si ope- area measurements at 7,100 and 14,300 cfs.
Maxima. December 1966: Discharge, 14,300 cfs 1100 hours Dec. 6 (gage height, 12.50 ft, from recorder graph; 13.3 ft, from f loodmarks) .
1930-54, 1956 to November 1966: Discharge, 7,100 cfs Nov. 19, 1950 (gage height, 11.36 ft).
Mean discharge
Day
1..... 2..... 3.....k..... 5..... 6.....7-.... 8.....
Monthly me Runoff, in Runoff, in
Discharge
9-99.1*
137 36
1,710 6,6601,110
575
Day
9..... 10.....11. ....12..... 13..... lit. .... 15....-16.....
an discharge, in cubic feet
in cubic feet per second, December 1966
Discharge
377 2l*7 171 133 111* log
95 77
Day
17..... 18..... 19..... 20..... 21..... 22..... 23-.... 21*.....
Discharge
6651 1*3 51 59 60 6062
Day
25.....26.....27.....28.....29.....30..... 31.....
acre-feet ....................................................................
Discharge
58 57 52 1*8 1*8 1*6 1*5
399It. 22
2l*,550
Gage hei
Date
Dec. 1
2
3
1*
Hour
21*00
12001800220021*00
01000200050009001300180021*00
09001530160021*00
ght, in feet, and dischargeGage
height3.56
3.553.553.603.67
3.771*.1*05.1*3l*.921*.501+.251*.10
3.973.903.81*3.83
Dis charge
9.5
8.78.7
1115
2195
31*0201112
7»*51*
39322625
Date
Dec. 5
6
in cubic feet per second, at indicated time, 1966
Hour
01*0005000600080009301300180021002200230021*00
013003000500060008000900
Gage height
3.88It. 006.008.158.1*68.067.518.158.809.90
10.70
11.6111.1*010.2010.11
9-309.50
Dis charge
301*2
5752,11*02,1*502,0501,5602,ll*02,820i*,68o6,750
10,2009,3105,3805,1303,5303,900
Date
Dec. 6
7
Hour
100011001200130011*0018002000220021*00
03000600120016301800200021*00
Gage height
10.7012.5011.6510.209.85
10.1*3q.io7.857.20
6.Uo6.035.565.1*05.335.325.15
Dis charge6,750
lit, 30011,6007,3606,5107,9301*,9503,0202,300
1,5501,21*0
91*1*860821*81871*0
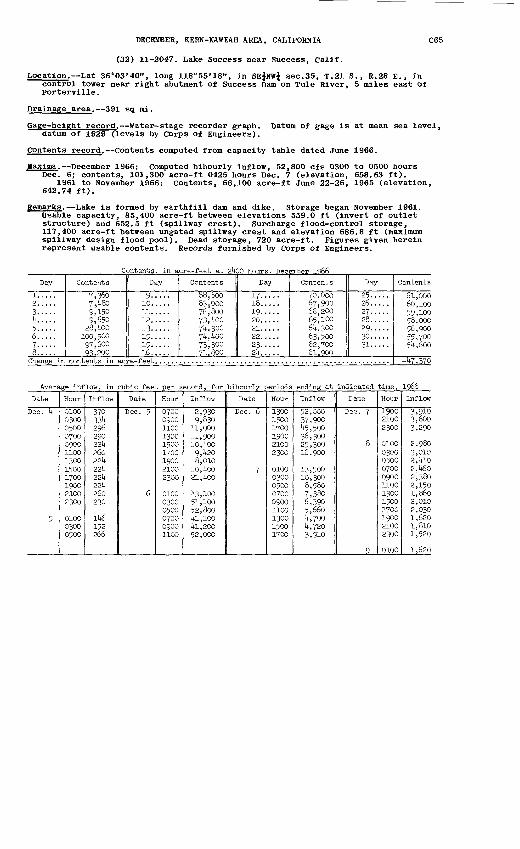
DECEMBER, KERN-KAWEAH AREA, CALIFORNIA C65
(32) 11-2047. Lake Success near Success, Calif.
Location. Lat 36°03'40", long 118°55'18", in SEjNWj sec.35, T.21 S., R.28 E., in control tower near right abutment of Success Dam on Tule River, 5 miles east of Porterville.
Drainage area. 391 sq mi.
Gage-height record. water-stage recorder graph. Datum of gage is at mean sea level, datum of 1929 (levels by Corps of Engineers).
Contents record. Contents computed from capacity table dated June 1966.
Maxima. December 1966: Computed bihourly inflow, 52,800 cfs 0300 to 0500 hours Dec. 6; contents, 101,300 acre-ft 0425 hours Dec. 7 (elevation, 658.63 ft).
1961 to November 1966: Contents, 66,100 acre-ft June 22-26, 1965 (elevation, 642.74 ft).
Remarks. Lake is formed by earthfill dam and dike. Storage began November 1961. Usable capacity, 85,400 acre-ft between elevations 559.0 ft (invert of outlet structure) and 652.5 ft (spillway crest). Surcharge flood-control storage, 117,400 acre-ft between ungated spillway crest and elevation 686.8 ft (maximum spillway design flood pool). Dead storage, 720 acre-ft. Figures given herein represent usable contents. Records furnished by Corps of Engineers.
..____Contents, in acre-feet at 2UOO hours. December 1966
Day Day Contents Day Day
70,000 67,900 66,200 65,100 6U,300 63,500 62,700 61.900
Change in contents in acre-feet.
Average inflow, in cubic feet per second, for bihourly periods ending at indicated time, 1966
Date
Dec. k
5
Hour
010003000500070009001100130015001700190021002300
010003000500
Inflow
37033U29629022U26022U22U22U22U260230
11(6152266
Date
Dec. 5
6
Hour
070009001100130015001700190021002300
010003000500070009001100
Inflow
2,9309,830
11,00011,90010, too9,U208,010
10,UOO21,1(00
1^3,10051,10052,800ia, 100ia, 20052,000
Date
Dec. 6
7
Hour
130015001700190021002300
010003000500070009001100130015001700
Inflow
52,00037,900U5,50036,30025,30016,900
13,50010,3008,5807,3806,3905,660U,700U,7203,910
Date
Dec. 7
8
9
Hour
190021002300
010003000500070009001100130015001700190021002300
0100
Inflow
3,9103,6003,290
2,9803,0102,UlO2,1(602,3802,1501,8602,0102,0301,6201,8101,520
1,620
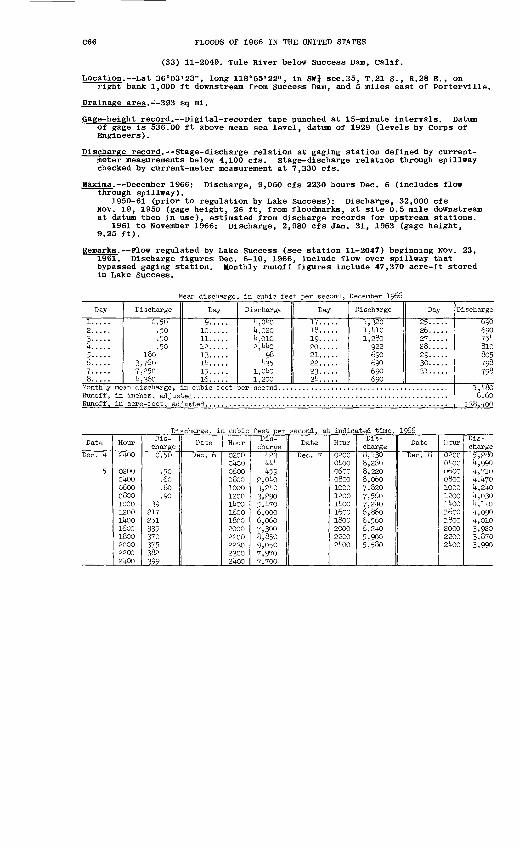
C66 FLOODS OF 1966 IN THE UNITED STATES
(33) 11-2049. Tule River below Success Dam, Calif.
Location. Lat 36°03'23", long 118°55'22", in SWj sec.35, T,21 S., R.28 E., onright bank 1,000 ft downstream from Success Dam, and 5 miles east of Porterville.
Drainage area.-'-393 sq mi.
Gage-height record. Digital-recorder tape punched at 15-minute intervals. Datum of gage is 536.00 ft above mean sea level, datum of 1929 (levels by Corps of Engineers).
Discharge record. Stage-discharge relation at gaging station defined by current- meter measurements below 4,100 cfs. Stage-discharge relation through spillway checked by current-meter measurement at 7,330 cfs.
Maxima. December 1966; Discharge, 9,050 cfs 2230 hours Dec. 6 (includes flow through spillway).
1950-61 (prior to regulation by Lake Success): Discharge, 32,000 cfs Nov. 19, 1950 (gage height, 26 ft, from floodmarks, at site 0.5 mile downstream at datum then in use), estimated from discharge records for upstream stations.
1961 to November 1966: Discharge, 2,980 cfs Jan. 31, 1963 (gage height, 9.25 ft).
Remarks. Flow regulated by Lake Success (see station 11-2047) beginning Nov. 23, 1961. Discharge figures Dec. 6-10, 1966, include flow over spillway that bypassed gaging station. Monthly runoff figures include 47,370 acre-ft stored in Lake Success.
Mean discharge, in cubic feet per second, December 1966
Day
1. ... . 2..... 3.....4..... 5..... 6..... 7. .... 8.....
Discharge
0.50 .50 .50 .50
180 3,760 7,250 ^, 360
Monthly mean discharge, Runoff, in inches, ad jus Runoff, in acre-feet, ad
Day
9..... 10 .....11.....12..... 13..... lit..... 15..... 16.....
i_n cubic feet ned
Discharge
4,040 4,020 4,010 2,440
98 >t35
1,040 1,200
Day
17..... 18..... 19. .... 20 ..... 21..... 22..... 23..... 24.....
Discharge
1,320 1,410 1,280
922 690 690 690 690
Day
25..... 26..... 27..... 28..... 29..... 30. .... 31. ....
lister-. ...........................................................
Discharge
690 690754 810 805 798 798
1,480 6.60
138,400
Discharge, in cubic feet per second, at indicated time
Date
Dec. 4
5
Hour
2400
020004000600080010001200140016001800200022002400
Dis charge ;0.50
50.60.60 90
39217251335370375382399
Date
Dec. 6
Hour
02000400060008001000120014001600180020002200223023002400
Dis charge
423444^59
2,0403,2403,2905,4706,0006,0607,3008,8509,0507,9707,700
Date
Dec. 7
Hour
020004000600080010001200140016001800200022002400
Dis charge8,1308,2608,2208,0607,8207,5607,2406,8606,5606,2405,9005,580
Date
Dec. 8
Hour
020004000600080010001200140016001800200022002400
Dis charge5,2804,9904,7104,4704,240M304,1104,0904,0103,9203,8703,990
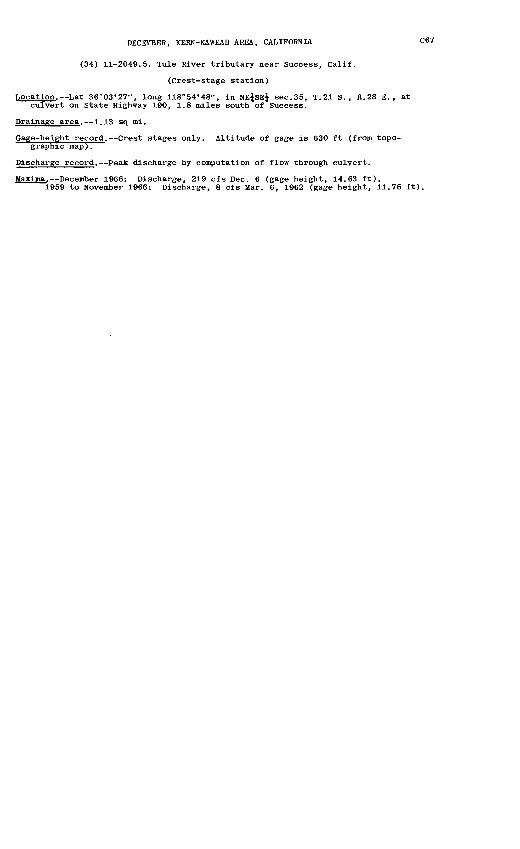
DECEMBER, KERN-KAWEAH AREA, CALIFORNIA C67
(34) 11-2049.5. Tule River tributary near Success, Calif.
(Crest-stage station)
Location. Lat 36°03'27", long 118°54'48", in NEjSEj sec.35, T.21 S., R.28 E., at culvert on State Highway 190, 1.8 miles south of Success.
Drainage area. 1.13 sq mi.
Gage-height record. Crest stages only. Altitude of gage is 630 ft (from topo- graphic map).
Discharge record. Peak discharge by computation of flow through culvert.
Maxima. December 1966: Discharge, 219 cfs Dec. 6 (gage height, 14.63 ft).1959 to November 1966: Discharge, 8 cfs Mar. 6, 1962 (gage height, 11.76 ft).
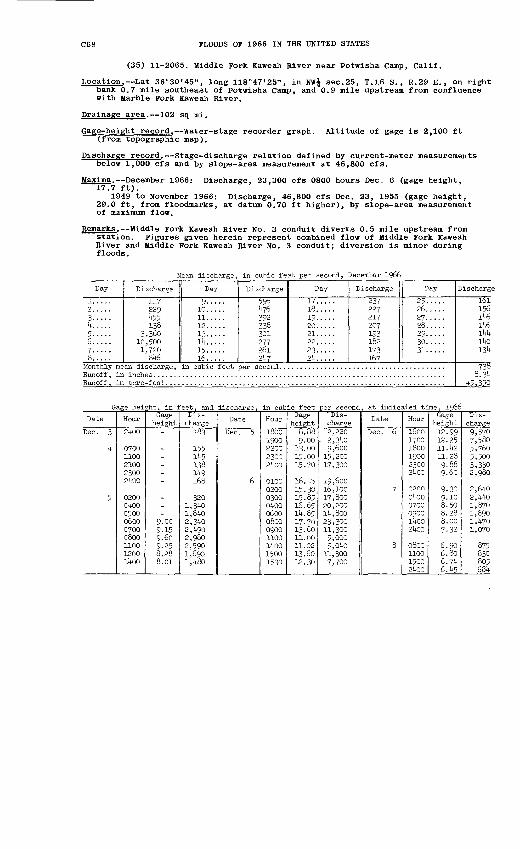
C68 FLOODS OF 1966 IN THE UNITED STATES
(35) 11-2065. Middle Fork Kaweah River near Potwisha Camp, Calif.
Location. Lat 36°30'45", long 118°47'25", in NWj sec.25, T.16 S., R.29 E., on right bank 0.7 mile southeast of Potwisha Camp, and 0.9 mile upstream from confluence with Marble Fork Kaweah River.
Drainage area. 102 sq mi.
Gage-height record. Water-stage recorder graph. Altitude of gage is 2,100 ft (from topographic map).
Discharge record. Stage-discharge relation defined by current-meter measurements below 1,000 cfs and by slope-area measurement at 46,800 cfs.
Maxima. December 1966: Discharge, 23,300 cfs 0800 hours Dec. 6 (gage height, 17.7 ft).
1949 to November 1966: Discharge, 46,800 cfs Dec. 23, 1955 (gage height, 29.0 ft, from floodmarks, at datum 0.70 ft higher), by slope-area measurement of maximum flow.
Remarks. Middle Fork Kaweah River No. 3 conduit diverts 0.5 mile upstream from station. Figures given herein represent combined flow of Middle Fork Kaweah River and Middle Fork Kaweah River No. 3 conduit; diversion is minor during floods.
Mean discharge, in cubic feet per second, December 1966
Day
1. . ... 2.. ... 3..... k..... 5..... 6..... ?..... 8.....
Monthly me Runoff, in Runoff, in
Discharge
117 229 455 138
3,360 10,500 1,720
846
Day
9.....10 .....11.....12..... 13....-11+..... 15..... 16.....
Discharge
596 1+76 392 338 301 277 261 247
Day
17..... 18. .... 19..... 20..... 21. .... 22. .... 23..... 21+.....
Discharge
237 227 217 207 193 182 173 167
Day
25..... 26.....27..... 28. .... 29..... 30..... 31.....
an discharge, in cubic feet per second. ........................................
acre-feet .....................................................................
Discharge
161 156146 146 144 l4o 131+
738 8.34
45,390
;e height, in feet, and discharge, in cubic feet per second at indicated time, 1966
Date
Dec. 3
1+
5
Hour
2400
07001100210023002400
0200okoo050006000700080011001200ll+OO
Gage height
-
--_-.
---
9.009-159.609-258.288.01
Dis charge
183
155145138ll+9168
3201,3401,81+02,3Uo2,1+902,9802,5901,6901,1+80
Date
Dec. 5
6
Hour
180019002200230021+00
010002000300o4oo0600080009001100ll+OO15001530
Gage height
8.889.00
13.0015.0015.70
16.1+515.3015.8516.6514.8517.7013.6011.0011.0213.6012.30
Dis charge2,220
2,3409,600
15,20017,300
19,60016,10017,80020,20014, 80023,30011,3005,0005,o4o
11,3007,700
Date
Dec. 6
7
8
Hour
1600170018001900230024-00
0200040007000900i4oo2400
0800110015002400
Gage height
12.9912.2511.4211.289.889.60
9-309.108.508.288.007-32
6.906.806.746.45
Dis charge9,5707,5805,7605,5003,3302,980
2,6402,4401,8701,6901,4701,070
875830805684
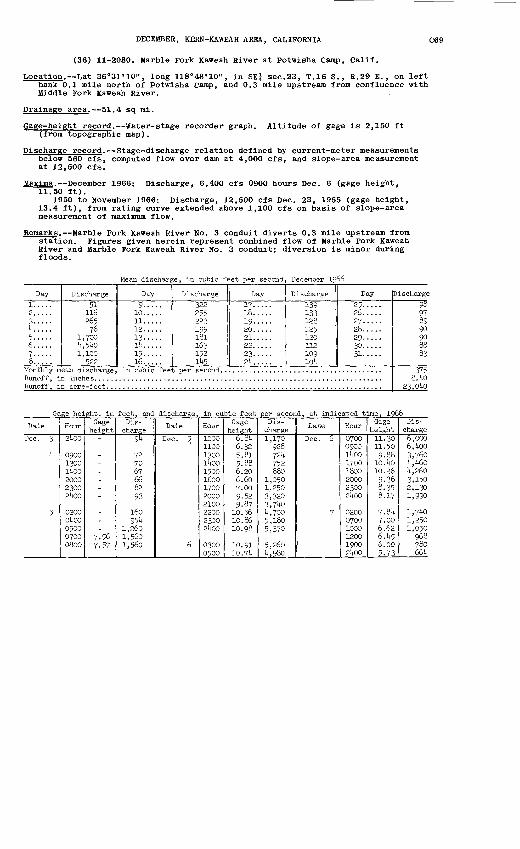
DECEMBER, KERN-KAWEAH AREA, CALIFORNIA (
(36) 11-2080. Marble Fork Kaweah River at Potwisha Camp, Calif.
Location. Lat 36°31'10", long 118°48'10", in SEj sec.23, T.16 S., R.29 E., on left bank 0.1 mile north of Potwisha Camp, and 0.3 mile upstream from confluence with Middle Fork Kaweah River.
Drainage area. 51.4 sq mi.
Gage-height record. ffater-stage recorder graph. Altitude of gage is 2,150 ft (from topographic map).
Discharge record. Stage-discharge relation defined by current-meter measurements below 560 cfs, computed flow over dam at 4,000 cfs, and slope-area measurement at 12,500 cfs.
Maxima. December 1966: Discharge, 6,400 cfs 0900 hours Dec. 6 (gage height, 11.50 ft).
1950 to November 1966: Discharge, 12,500 cfs Dec. 23, 1955 (gage height, 13.4 ft), from rating curve extended above 1,100 cfs on basis of slope-area measurement of maximum flow.
Remarks. Marble Fork Kaweah River No. 3 conduit diverts 0.3 mile upstream from station. Figures given herein represent combined flow of Marble Fork Kaweah River and Marble Fork Kaweah River No. 3 conduit; diversion is minor during floods.
Mean discharge, in _cubic feet per second, December
Day
1..... 2.....k'.'.'.'.'.
5..... 6.....7..... 8.....
Monthly m Runoff, i Runoff, i
Discharge
51 116 265
76 1,700 it,5!»0 1,100
522
Day
9..... 10..... 11. .... 12..... 13...-. lU. . . . . 15..... 16.....
ean discharge, in cubic fee
Discharge
322 255 223 199 181 163 152 1U5
Day
17..... 18..... 19..... 20..... 21..... 22..... 23..... 2k.....
Discharge
139 133 128 125 120 112 109 KA
Day
25..... 26.....27..... 28.....29.....30. .... 31.....
n acre-feet ....................................................................
Discharge98 97 89 90 90 88 83
375 8. ho
23,0to
Gage height, in feet, and discharge, in cubic feet per second, at indicated time, 1966
Date
Dec. 3
k
5
Hour
2^00
090013001UOO200023002kOO
0200OtaD050007000800
Gage height
-
__._-_
--_
7.567-57
Dis charge
^h
727067668293
16095^
1,2601,5601,560
Date
Dec. 5
6
Hour
100011001300lltOO15001600170020002100220023002koo
03000500
Gage height
6.8^6.325.815.886.206.607.009.529.87
10.5610.8610.98
10.9110.7^
Dis charge1,170
92872^752880
1,0501,2503,3203,7toIt-, 7005,1805,370
5,260k,9&0
Date
Dec. 6
7
Hour
07000900lit- 0017001800200023002UOO
020007001000120019002UOO
Gage height
11.3011.509.88
ioAo10.269.368.358.17
7.8^7.006.626.U56.005.73
Dis charge6,0006, too3,760h,h6oh,26o3,1502,1301,990
1,71*01,2501,050
96878066^
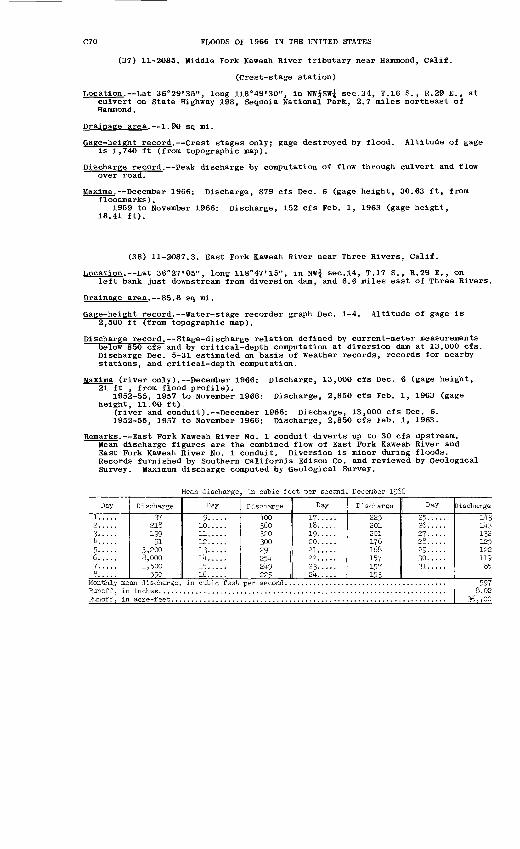
C70 FLOODS OF 1966 IN THE UNITED STATES
(37) 11-2085. Middle Fork Kaweah River tributary near Hammond, Calif.
(Crest-stage station)
Location. Lat 36°29'35", long 118°49'30", in NWjSWj sec.34, T.16 S., R.29 E., at culvert on State Highway 198, Sequoia National Park, 2.7 miles northeast of Hammond.
Drainage area. 1.90 sq mi.
Gage-height record. Crest stages only; gage destroyed by flood. Altitude of gage is 1,740 ft (from topographic map).
Discharge record. Peak discharge by computation of flow through culvert and flow over road.
Maxima. December 1966: Discharge, 879 cfs Dec. 6 (gage height, 30.63 ft, from floodmarks).
1959 to November 1966: Discharge, 152 cfs Feb. 1, 1963 (gage height, 18.41 ft).
(38) 11-2087.3. East Fork Kaweah River near Three Rivers, Calif.
Location. Lat 36°27'05", long 118°47'15", in NWj sec.14, T.17 S., R.29 E., onleft bank just downstream from diversion dam, and 6.6 miles east of Three Rivers.
Drainage area. 85.8 sq mi.
Gage-height record. Water-stage recorder graph Dec. 1-4. Altitude of gage is 2,500 ft(from topographic map).
Discharge record. Stage-discharge relation defined by current-meter measurements below 850 cfs and by critical-depth computation at diversion dam at 13,000 cfs. Discharge Dec. 5-31 estimated on basis of weather records, records for nearby stations, and critical-depth computation.
Maxima (river only). December 1966: Discharge, 13,000 cfs Dec. 6 (gage height, 21 ft , from flood profile).
1952-55, 1957 to November 1966: Discharge, 2,850 cfs Feb. 1, 1963 (gage height, 11.00 ft).
(river and conduit). December 1966: Discharge, 13,000 cfs Dec. 6. 1952-55, 1957 to November 1966: Discharge, 2,850 cfs Feb. 1, 1963.
Remarks. East Fork Kaweah River No. 1 conduit diverts up to 30 cfs upstream. Mean discharge figures are the combined flow of East Fork Kaweah River and East Fork Kaweah River No. 1 conduit. Diversion is minor during floods. Records furnished by Southern California Edison Co. and reviewed by Geological Survey. Maximum discharge computed by Geological Survey.
Mean discharge, in cubic feet per second, December 1966
Day
1. .... 2..... 3.....
5....!6.....7..... 8.....
Monthly me Runoff, in Runoff, in
Discharge
37 218 199
91 3,200 8,000 1,500
550
Day
9-....10. ....11 .....12 ..... 13.....
15.....16.....
Discharge
koo 360320 300 291 254 2^9 225
Day
17-.... 13..... 19-.... 20.. ... 21... .. 22. .... 23..... 2k.....
Discharge
225 201 201 176 168 157 157 153
Day
25..... 26..... 27..... 28..... 29..... 30. .... 31.....
an discharge, in cuMc feet per second. .......................................
acre-feet ....................................................................
Discharge
132 125 122 119
85
597 8.02
36,700
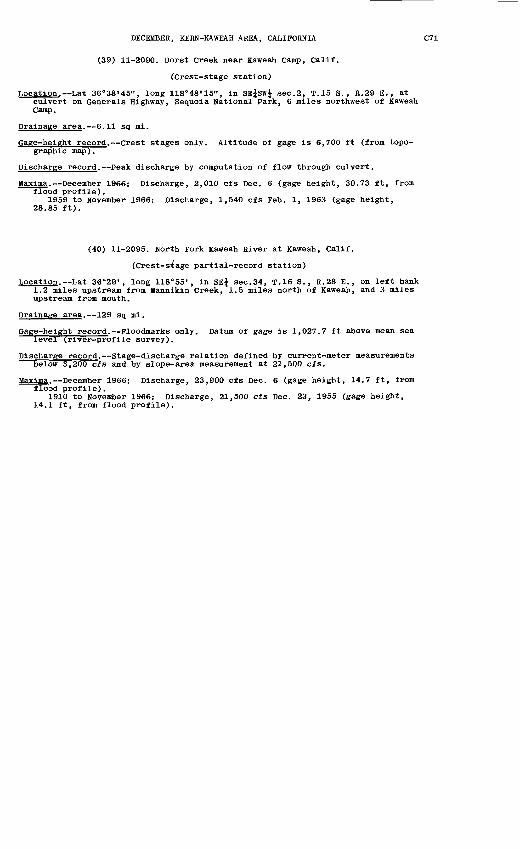
DECEMBER, KERN-KAWEAH AREA, CALIFORNIA
(39) 11-2090. Dorst Creek near Kaweah Camp, Calif.
(Crest-stage station)
Location. Lat 36°38'45", long 118 0 48'15", in SEjSW^ sec.2, T.15 S., R.29 E., at culvert on Generals Highway, Sequoia National Park, 6 miles northwest of Kaweah Camp.
Drainage area. 6.11 sq mi.
Gage-height record. Crest stages only. Altitude of gage is 6,700 ft (from topo- graphic map).
Discharge record. Peak discharge by computation of flow through culvert.
Maxima. December 1966: Discharge, 2,010 cfs Dec. 6 (gage height, 30.73 ft, from flood profile).
1959 to November 1966: Discharge, 1,540 cfs Feb. 1, 1963 (gage height, 28.85 ft).
(40) 11-2095. North Fork Kaweah River at Kaweah, Calif.
(Crest-stage partial-record station)
Location. Lat 36°29', long 118 C 55', in SEj sec.34, T.16 S., R.28 E., on left bank 1.2 miles upstream from Mannikin Creek, 1.5 miles north of Kaweah, and 3 miles upstream from mouth.
Drainage area. 129 sq mi.
Gage-height record. Floodmarks only. Datum of gage is 1,027.7 ft above mean sea level (river-profile survey).
Discharge record. Stage-discharge relation defined by current-meter measurements below 3,200 cfs and by slope-area measurement at 21,500 cfs.
Maxima. December 1966: Discharge, 23,900 cfs Dec. 6 (gage height, 14.7 ft, from flood profile).
1910 to November 1966: Discharge, 21,500 cfs Dec. 23, 1955 (gage height, 14.1 ft, from flood profile).
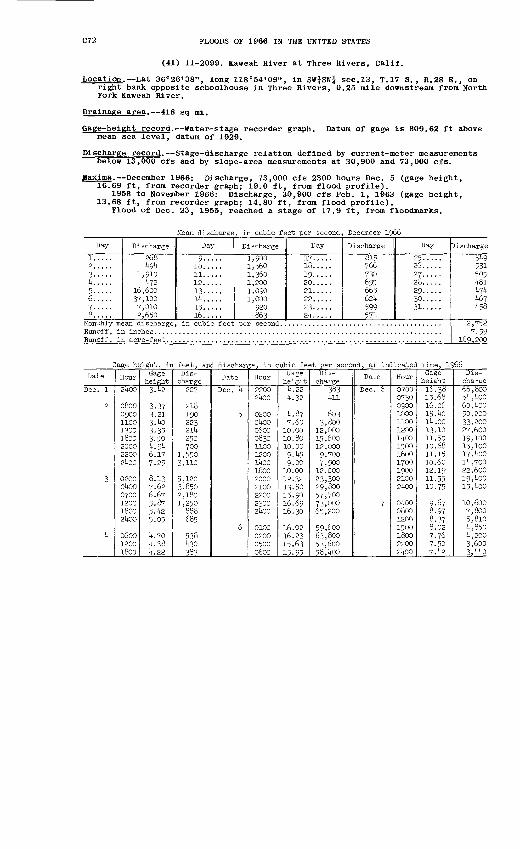
C72 FLOODS OF 1966 IN THE UNITED STATES
(41) 11-2099. Kaweah River at Three Rivers, Calif.
Location. Lat 36°26'38", long 118°54'09", in SW^SW^ sec.13, T.17 S. , R.28 E., on right bank opposite schoolhouse in Three Rivers, 0.25 mile downstream from North Fork Kaweah River.
Drainage area. 418 sq mi.
Gage-height record. Water-stage recorder graph. Datum of gage is 809.62 ft above mean sea level, datum of 1929.
Discharge record. Stage-discharge relation defined by current-meter measurements below 13,000 cfs and by slope-area measurements at 30,900 and 73,000 cfs.
Maxima. December 1966: Discharge, 73,000 cfs 2300 hours Dec. 5 (gage height, 16.69 ft, from recorder graph; 19.0 ft, from flood profile).
1958 to November 1966: Discharge, 30,900 cfs Feb. 1, 1963 (gage height, 13.68 ft, from recorder graph; 14.80 ft, from flood profile).
Flood of Dec. 23, 1955, reached a stage of 17.9 ft, from floodmarks.
Mean discharge, in cubic feet per second, December
Day Discharge Day Discharge Day Discharge"BIT
766 730 695 665 62k 599 571
Day Discharge5^9 531 505 kSi
1,910^72
16,60037,1007,0102,650
17....18....19....20....21....22....23.... 2k....
Gage height, in feet, and discharge, in cubic feet per second, at indicated time, 1966
Hour
0900 1100 1300 1800 2000 2200 2kOO
0200 OkOO 0700 1200 1800 2kOO
12001800
Gage height
Dis charge Date Hour
2200 2kOO
0200 Ol+OO
1100 1200 1400 1800 2000 2100 2200 2300 2^4-00
010002000500
It. 87 7.60
10.00 10.80 10.00 9-^5 9.00
10.00 12.32 13-50 15.90 16.69 16.30
Hour
otoo
Dis charge
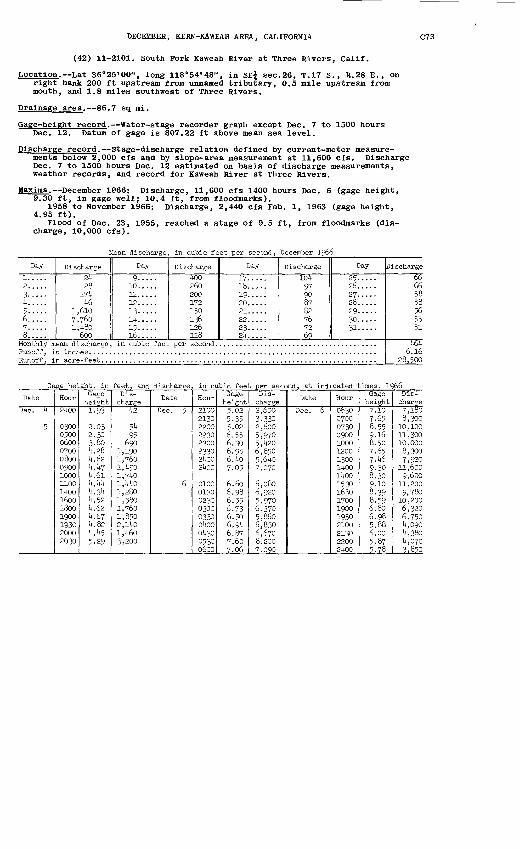
DECEMBER, KERN-KAWEAH AREA, CALIFORNIA
(42) 11-2101. South Fork Kaweah River at Three Rivers, Calif.
Location. Lat 36°25'00", long 118°54'48", in SEj sec.26, T.17 S. , R.28 E., on right bank 200 ft upstream from unnamed tributary, 0.5 mile upstream from mouth, and 1.8 miles southwest of Three Rivers.
Drainage area. 86.7 sq mi.
Gage-height record. Water-stage recorder graph except Dec. 7 to 1500 hours Dec. 12. Datum of gage is 807.22 ft above mean sea level.
Discharge record. Stage-discharge relation defined by current-meter measure ments below 2,000 cfs and by slope-area measurement at 11,600 cfs. Discharge Dec. 7 to 1500 hours Dec. 12 estimated on basis of discharge measurements, weather records, and record for Kaweah River at Three Rivers.
Maxima. December 1966: Discharge, 11,600 cfs 1400 hours Dec. 6 (gage height, 9.30 ft, in gage well; 10.4 ft, from floodmarks).
1958 to November 1966: Discharge, 2,440 cfs Feb. 1, 1963 (gage height, 4.95 ft).
Flood of Dec. 23, 1955, reached a stage of 9.5 ft, from floodmarks (dis charge, 10,000 cfs).
Mean discharge, in cubic feet per second, December 1966
Day
1.....2.....3.....1*.....5.....6.....7-....8.....
Discharge21*28
171*1*6
1,6107,7601,1*80
600
Day
9.....10 .....11.....12.....13.....11*.....15.....16.....
Discharge1*00260200172150136126118
Day
17.....18.....19. ....20.....21.....22.....23.....21*.....
Discharge101*
97908782767269
Day
25.....26.....27.....28.....29.....30.....31.....
Monthly mean discharge, in cubic feet per second. .......................................
Runoff, in acre-feet. ...................................................................
Discharge
66665858565551
6.1628,500
Gage height, in feet, and discharge
Date
Dec. 4
5
Hour
21*00
0300050006000700080009001000110011*00160018001900193020002030
Cage height1.93
2.032.303.801*.281*.621*.1*7l*.6l1*.1*1*l*.3l*1*.521*.62l*.67l*.82i*.l*55.29
Dis charge
1*2
^95
6901,1901,7601,^901,71*01,1*1*01,2801,5801,7601,8502,11*01,1*603,200
Date
Dec. 5
6
in cubic feet per second, at indicated times, 1966
Hour
21002130220022302300233021*0021*00
01000130023003000330oi*oo01*3005300600
Gage height
5.025.355.026.556.306.956.^07.05
6.606.986.556.736.506.91*6.877.6o7.06
Dis charge2,6003,3302,6005,9705,1*206,8505,61*07,070
6,0806,9205,9706,3705,8606,8306,6708,2007,090
Date
Dec. 6
Hour
063007000730090010001200130011*0011*001530163017001900193021002130220021*00
Gage height
7.107.658.559.168.507.657.1*69-308.309.108.398.596.806.985.886.005.875.78
Dis charge7,1808,300
10,10011,30010,0008,3007,920
11,6009,600
11,2009,780
10,2006,3206,7501*,090l*,38o1*,0703,850
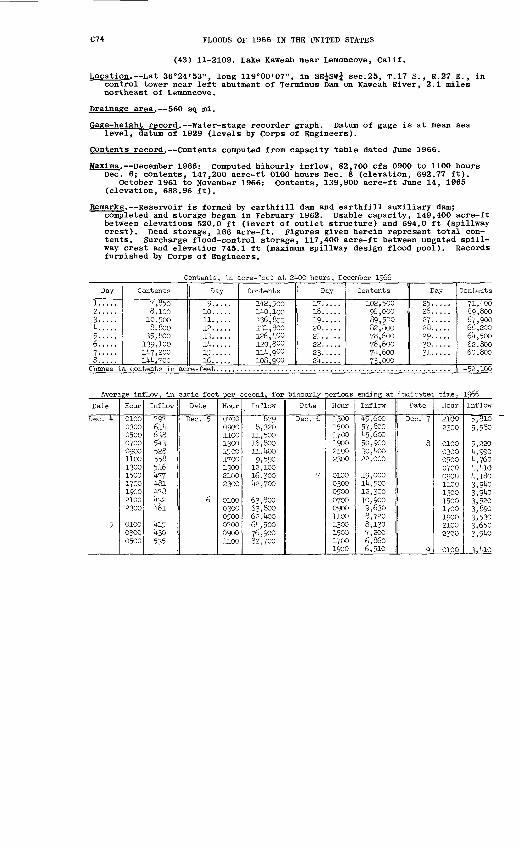
C74 FLOODS OF 1966 IN THE UNITED STATES
(43) 11-2109. Lake Kaweah near Lemoncove, Calif.
Location. Lat 36°24'53", long 119°00'07", in SE^SW^ sec.25, T.17 S., R.27 E., in control tower near left abutment of Terminus Dam on Kaweah River, 2.1 miles northeast of Lemoncove.
Drainage area. 560 sq mi.
Gage-height record. Water-stage recorder graph. Datum of gage is at mean sea level, datum of 1929 (levels by Corps of Engineers).
Contents record. Contents computed from capacity table dated June 1966.
Maxima. December 1966: Computed bihourly inflow, 82,700 cfs 0900 to 1100 hours Dec. 6; contents, 147,200 acre-ft 0100 hours Dec. 8 (elevation, 692.77 ft).
October 1961 to November 1966: Contents, 139,900 acre-ft June 14, 1965 (elevation, 688.96 ft).
Remarks. Reservoir is formed by earthfill dam and earthfill auxiliary dam;completed and storage began in February 1962. Usable capacity, 149,400 acre-ft between elevations 520.0 ft (invert of outlet structure) and 694.0 ft (spillway crest). Dead storage, 166 acre-ft. Figures given herein represent total con tents. Surcharge flood-control storage, 117,400 acre-ft between ungated spill way crest and elevation 745.1 ft (maximum spillway design flood pool). Records furnished by Corps of Engineers.
Contents, in acre-feet at 2400 hours, December
Day
1. ....2.....3.....4.....5.....6.....?.....8.....
Contents
7,8508,10010,5008,800
35,800139,100147,200144,700
Day
9.....10.....11. ....12.....13.....Ik.....15.....16.....
Contents
142,500140,100136,800131,800126,400120,800114,900108,900
Day
1?.....18. ....19.....20.....21.....22.....23.....24.....
Contents
102,50096,00089,50082,80078,60076,60074,60073,000
Day
25.....26.....27.....28.....29.....30.....31- ....
Change in contents in acre-feet ..........................................................
Contents
71,40069,80067,90066,20064,50062,80060,800
+52,100
Average inflow, in cubic feet per second, for Mhourly periods ending at indicated time, 1966
Date
Dec. 4
5
Hour
0100 03000500070009001100130015001700190021002300
010003000500
Inflow
797 614638543528558516477481478432461
415430535
Date
Dec. 5
6
Hour
0700 09001100130015001700190021002300
010003000500070009001100
Inflow
879 8,320
11,50016,80011,4009,590
12,10016,30042,700
63,80063,80062,40064,50076,90082,700
Date
Dec. 6
7
Hour
1300 15001700190021002300
0100030005000700090011001300150017001900
Inflow
45,600 57,80045,60050,90030,40022,000
19,00014,50012,30010,9009,6308,7208,1307,2006,8606,510
Date
Dec. 7
8
9
Hour
2100 2300
010003000500070009001100130015001700190021002300
0100
Inflow
5,810 5,580
5,2204,9904,7604,4104,1803,9^03,9403,5203,8903,5303,6503,540
3,410
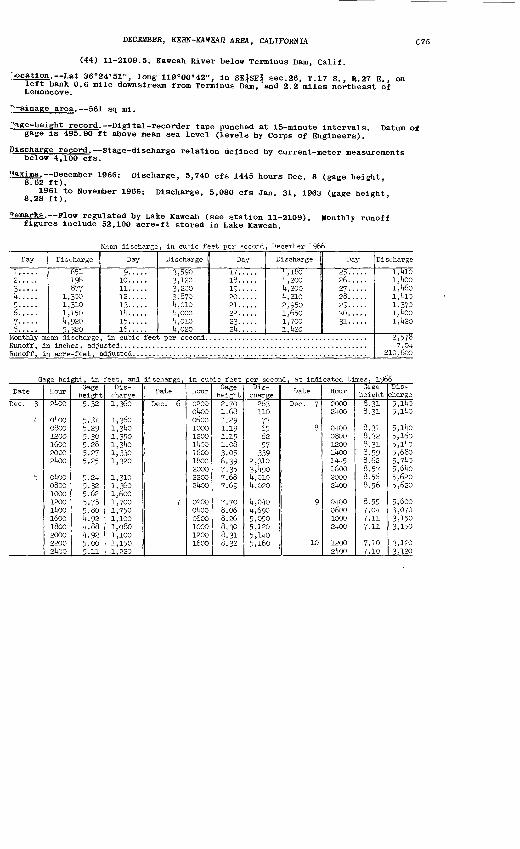
DECEMBER, KERN-KAWEAH AREA, CALIFORNIA
(44) 11-2109.5. Kaweah River below Terminus Dam, Calif.
ocatlon. Lat 36°24'51", long 119°00'42", in SEjSEj sec.26, T.17 S. , R.27 E left bank 0.6 mile downstream from Terminus Dam, and 2.2 miles northeast >
, on of
Lemoncove.
:x-ainage area. 561 sq mi.
' \ge-height record. Digital-recorder tape punched at 15-minute intervals. Datum of gage is 495.90 ft above mean sea level (levels by Corps of Engineers).
Pischarge record. Stage-discharge relation defined by current-meter measurements below 4,100 cfs.
!<axima,~December 1966: Discharge, 5,740 cfs 1445 hours Dec. 8 (gage height, 8.62 ft).
1961 to November 1966: Discharge, 5,080 cfs Jan. 31, 1963 (gage height, 8.28 ft) .
Remarks. Flow regulated by Lake Kaweah (see station 11-2109). Monthly runoff figures include 52,100 acre-ft stored in Lake Kaweah.
Mean discharge, in cubic feet per second, December
Day
1.... . 2..... 3.....1)..... 5..... 6.....7..... 8.....
Discharge
651 198 877
1,300 1,310 1,150 4,920 5,320
Monthly mean discharge Runoff, in inches, adj Runoff, in acre-feet,
Day
9.....10.....11.....12..... 13-....11)..... 15..... 16.....
, in cutdc feel
Discharge
3,590 3,120 3,200 3,870 4,0104,000 4,0104,020
Day
17..... 18..... 19..... 20. .... 21. .... 22..... 23..... 24. ....
Discharge
4,180 4,200 4,200 4,210 2,950 1,650 1,700 1,420
Day
25 ..... 26.....27.....28.....29.....30..... 31.....
adjusted. .........................................................
Discharge
1,410i,4oo 1,460 i,4io 1,370 1,1)00 1,420
2,578 7.04
210,600
Gage height, in feet, and discharge, in cut>ic feet per second, at indicated times, 1§66
Date
Dec. 3
k
5
Hour
21)00
040008001200160020002400
o4oo0800100012001400160018002000220021+00
Gage height
5.32
5-315.295.305.285.275.25
5.245.325.625.755.80k.924.884.925.005.11
Dis charge1,360
1,3601,3401,350i,34o1,3301,320
1,3101,3601,6001,7001,7501,1001,0801,1001,1501,220
Date
Dec. 6
7
Hour
02000400060010001200140016001800200022002400
020004000600100012001600
Gage height
2.701.681.291.191.151.083.056.397.357.687.69
7.708.068.268.308.318.32
Dis charge
263110
73656257
3392,3103,4904,0104,020
4,o4o4,60.0
5,0505,1205,i4o5,160
Date
Dec. 7
8
9
10
Hour
200024oo
o4oo08001200I4oo14451600200024oo
0400060010002400
12002400
Gage height8.318.31
8.318.328.318.598.628.578.568.56
8.557.0k7.117.11
7.107.10
Dis charge
5,1405,l4o
5,HtO5,1605,ll)05,6805,71)05,61)05,6205,620
5,6003,0703,1503,150
3,1203,120
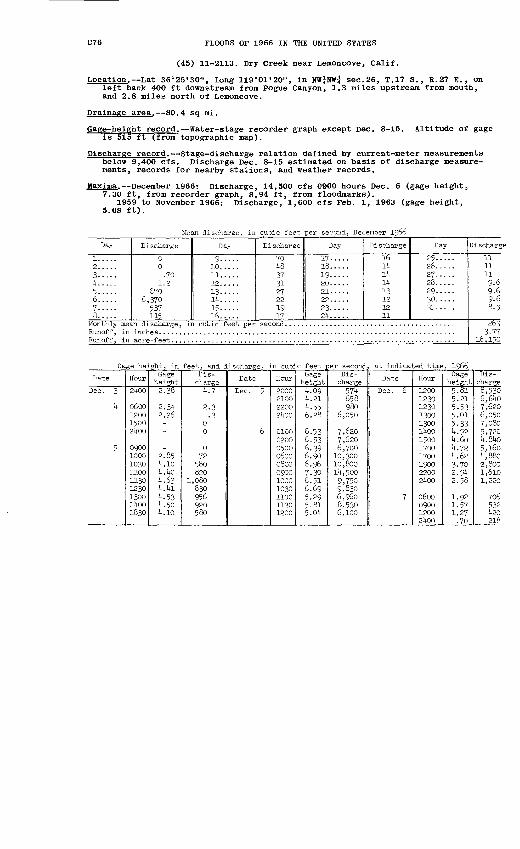
FLOODS Or 1966 IN THE UNITED STATES
(45) 11-2113. Dry Creek near Lemoncove, Calif.
Location. Lat 36°25'30", long 119°01'20", in NW^NWj sec. 26, T.17 S., R.27 E. , on left bank 400 ft downstream from Pogue Canyon, 1.3 miles upstream from mouth, and 2.8 miles north of Lemoncove.
Drainage area. 80.4 sq mi.
Gage-height record. Water-stage recorder graph except Dec. 8-15. Altitude of gage is 515 ft (from topographic map).
Discharge record. Stage-discharge relation defined by current-meter measurements below 9,400 cfs. Discharge Dec. 8-15 estimated on basis of discharge measure ments, records for nearby stations, and weather records.
Maxima. December 1966: Discharge, 14,500 cfs 0900 hours Dec. 6 (gage height, 7.30 ft, from recorder graph, 8.94 ft, from floodmarks).
1959 to November 1966: Discharge, 1,600 cfs Teh. 1, 1963 (gage height, 5.08 ft).
Mean discharge, in cubic feet per second, December 1966
Day
1.....2.....3.....4.....5.....6.....7.....8.....
Discharge
00
.701.2
6706,370
537115
Day
9.....10.....11. ....12.....13.....14.....15.....16.....
Discharge
7048373127221917
Day
17.....18. ....19.....20.....21.....22 .....23.....24.....
Discharge
1614141413121211
Day
25.....26. ....27.....28.....29.....30.....31.....
Monthly mean discharge, in cubic feet per second. .........................................
Runoff, in acre-feet. .....................................................................
Discharge
1111119.69.69.68.5
3-7716,150
Gage height, in feet, and discharge, in cubic feet per second, at indicated time, 1966
Date
Dec. 3
4
5
Hour
2400
0600120015002 !)-00
0900100010301100113012301300i4oo1830
Gage height2.38
2.342.26--
-2.85it. 104. 4o4.634.414.534.504.10
Dis charge
4.7
2.3.3
00
072580820
1,080830956920580
Date
Dec. 5
6
Hour
2000210022002400
01000200050006000800090010001030110011301200
Gage height4.094.214.556.28
6.536.536.396.906.967.306.516.695.295.815.04
Dis charge
574658980
6,050
7,6207,6206,70010,30010,80014,5009,7509,8306,9608,5306,100
Date
Dec. 6
7
Hour
120012301230130013001400150017001700190022002400
0600090012002400
Gage height5.815.215-535.015-334.924.604.724.623-702.942.58
1.921.571.27.70
Dis charge8,5306,6407,6206,0507,0805,7204,8405,l6o4,8802,8001,6101,220
706532420218
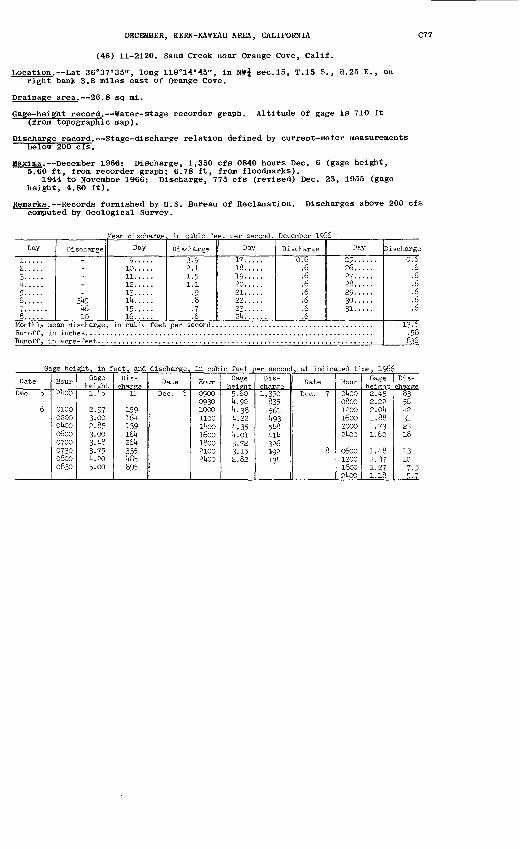
DECEMBER, KERN-KAWEAH AREA, CALIFORNIA C7
(46) 11-2120. Sand Creek near Orange Cove, Calif.
Location. Lat 36°37'35" J long 119°14'45", in NWj sec.15, T.15 S. , R.25 E., On right bank 3.8 miles east of Orange Cove.
Drainage area. 26.8 sq mi.
Gage-height record. Water-stage recorder graph. Altitude of gage is 710 ft (from topographic map).
Discharge record. Stage-discharge relation defined by current-meter measurements below 200 cfs.
Maxima. December 1966: Discharge , 1,350 cfs 0840 hours Dec. 6 (gage height, 5.60 ft, from recorder graph; 6.78 ft, from floodmarks).
1944 to November 1966: Discharge, 775 cfs (revised) Dec. 23, 1955 (gage height, 4.80 ft).
Remarks. Records furnished by U.S. Bureau of Reclamation. Discharges above 200 cfs computed by Geological Survey.
in
Day Discharge Day Discharge Day Discharge Day Discharge
31(5 1(6 10
3.9 2.1 1.5 1.1
2?....28....29....30....31....
0.6 .6 .6 .6 .6 .6 .6
Monthly Runoff, Runoff,
Gage height, in feet, and discharge, in cubic feet per second, at indicated time, 1966
Date
Dec. 5
6
Hour
2too
01CO0200oi»oo06000700073008000830
Gage height
1.^5
2.973.002.853.003. 1*83.75It. 205.00
Dis- charse
11
159I6k139161+26k3351(85895
Date
Dec. 6
Hour
0900093010001100ll»QO16001800210021(00
Gage height
5.60k.SO1(.38k.2S1(.35IK 013-723.152.82
Dis charge1,350
8355611(9351(8lull.32619213k
Date
Dec. 7
8
Hour
Ol+OO080012001600200021+00
06001200180021+00
Gage height
2.452.222.0k1.881.731.62
1.1(81.371.271.18
Dis charge
83561(2312318
13107-55.7
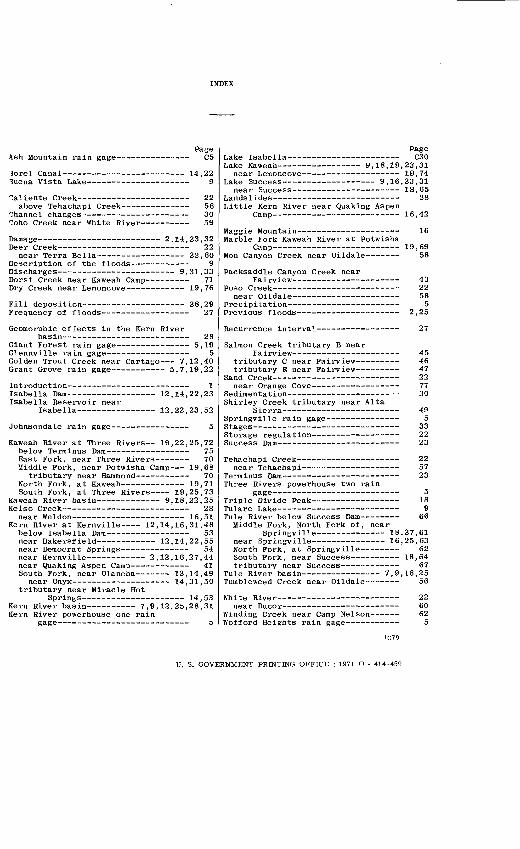
Ash Mountain rain gage-Page
C5
lorel Canal------?uena Vista Lake-
14,22
"aliente Creek - 22above Tehachapi Creek 56
Channel changes 30Coho Creek near White River - 59
Damage 2,14, 23, 32 Deer Creek 22
near Terra Bella 22,60 Description of the floods 9 Discharges 9,31,33 Dorst Creek near Kaweah Camp- 71 Dry Creek near Lemoncove 19,76
Fill deposition Frequency of floods-
28,2927
Geomorphic effects in the Kern Riverbasin 28
Giant Forest rain gage 5,19 Glennville rain gage 5 Golden Trout Creek near Cartago 7,12,40 Grant Grove rain gage 5,7,19,22
Introduction 1 Isabella Dam 12,14,22,23 Isabella Reservoir near
Isabella 12,22,23,52
Johnsondale rain gage-
Kaweah River at Three Rivers 19,22,25,72 below Terminus Dam- 75 East Fork, near Three Rivers 70 Middle Fork, near Potwisha Camp 19,68
tributary near Hammond 70 North Fork, at Kaweah 19,71 South Fork, at Three Rivers 19,25,73
Kaweah River basin 9,18,22,25Kelso Creek 28
near Weldon 16,51Kern River at Kernville 12,14,16,31,48
below Isabella Dam 53 near Bakersfield 12,14,22,55 near Democrat Springs 54 near Kernville 2,12,16,27,44 near Quaking Aspen Camp- 41 South Fork, near Olancha 12,14,49
near Onyx 14,31,50 tributary near Miracle Hot
Springs 14 , 53Kern River basin 7,9,12,25,28,31Kern River powerhouse one rain
gage 5
Lake Isabella _______Lake Kaweah 9,18,19
near Lemoncove ______Lake Success 9,16
near Success __________________Landslides _________Little Kern River near Quaking Aspen
Camp
Maggie Mountain - -- Marble Fork Kaweah River at Potwisha
Camp __ _Mon Canyon Creek near Oildale
Packsaddle Canyon Creek nearFairview _ _
Poso Creek near Oildale _____
Precipitation Previous floods ________
Recurrence interval-
PageC30
23,3119,74,23,3118,65
28
16,42
16
19,6958
4322585
2,25
27
Salmon Creek tributary B nearFairview 45
tributary C near Fairview 46tributary E near Fairview 47
Sand Creek 22near Orange Cove 77
Sedimentation 30Shirley Creek tributary near Alta
Sierra 49Springville rain gage 5Stages 33Storage regulation 22Success Dam - 23
Tehachapi Creek 22 near Tehachapi 57
Terminus Dam 23 Three Rivers powerhouse two rain
gage 5Triple Divide Peak 18Tulare Lake 9Tule River below Success Dam 66
Middle Fork, North Fork of, nearSpringville 18,27,61
near Springville 16,25,63North Fork, at Springville 62South Fork, near Success 18,64tributary near Success 67
Tule River basin 7,9,16,25Tumbleweed Creek near Oildale 56
White River 22near Ducor 60
Winding Creek near Camp Nelson 62Wofford Heights rain gage 5
U. S. GOVERNMENT PRINTING OFFICE : 1971 O - 414-459